University of California, Berkeley · University of California, Berkeley Temporary Academic Staff...
33
University of California, Berkeley Temporary Academic Staff Proof of Concept Project TAS Business Process Analysis Team Members Barbara Broque, School of Information Pamela Brown, Office of Planning and Analysis Susanna A. Castillo-Robson, Admissions and Enrollment Pam Egashira, Budget Office Greg Hamilton, Information Services and Technology Dennis Hengstler, Office of Planning and Analysis Claudia Ayala Lopez, Department of Physics Jill Martin, Business and Technology Solutions Cynthia Schrager, Office of Teaching and Learning Judi Sui, Graduate Division June 1, 2009
Transcript of University of California, Berkeley · University of California, Berkeley Temporary Academic Staff...
University of California, Berkeley
Temporary Academic Staff Proof of Concept Project
TAS Business Process Analysis Team Members
Barbara Broque, School of Information Pamela Brown, Office of Planning and Analysis
Susanna A. Castillo-Robson, Admissions and Enrollment Pam Egashira, Budget Office
Greg Hamilton, Information Services and Technology Dennis Hengstler, Office of Planning and Analysis
Claudia Ayala Lopez, Department of Physics Jill Martin, Business and Technology Solutions
Cynthia Schrager, Office of Teaching and Learning Judi Sui, Graduate Division
June 1, 2009

Preface
“One cannot think well, love well, sleep well, if one has not dined well.”
~Virginia Woolf
Once upon a time, the Land of Cal was ruled by wise and benevolent leaders. They wanted to make the
best decisions for their people, but they were always hungry. Every day, they went to the executive
dining room and ordered the most flavorful appetizers, entrees and desserts on the menu. Every night,
they dreamed of sumptuous feasts and then special ordered the elaborate dishes of their dreams. But even
though they had assembled the most talented team of chefs in the land, their stomachs still grumbled.
The chefs were tearing out their hair. They were used to well-stocked pantries and kitchens. But in the
Land of Cal, the vegetables and grains were stored on Oxford, the meats were housed on Hearst, and the
spices could only be found on Bancroft. All day long, instead of cooking delicious meals, they ran to and
from these outlying buildings, porting ingredients back and forth to their many cramped and ill-equipped
kitchens. Sometimes, when they arrived at the vegetable and grain pantry, the only person with the key
was nowhere to be found. Other times, at the meat pantry, the staff were too busy preparing their own
meals to provide just the right ingredient to finish a particular dish. And all too often, some relatively
common yet essential spice could not be located anywhere on campus at all.
Meanwhile, the leaders lingered on and on in the dining room, waiting for meals that arrived cold or
without a crucial ingredient or never arrived at all. Finally, one day, the leaders had had enough. They
charged a team of talented chefs to tell them how to fix the problem, and this is what they said…

0
~ 1 ~
University of California, Berkeley
Temporary Academic Staff Proof of Concept Project
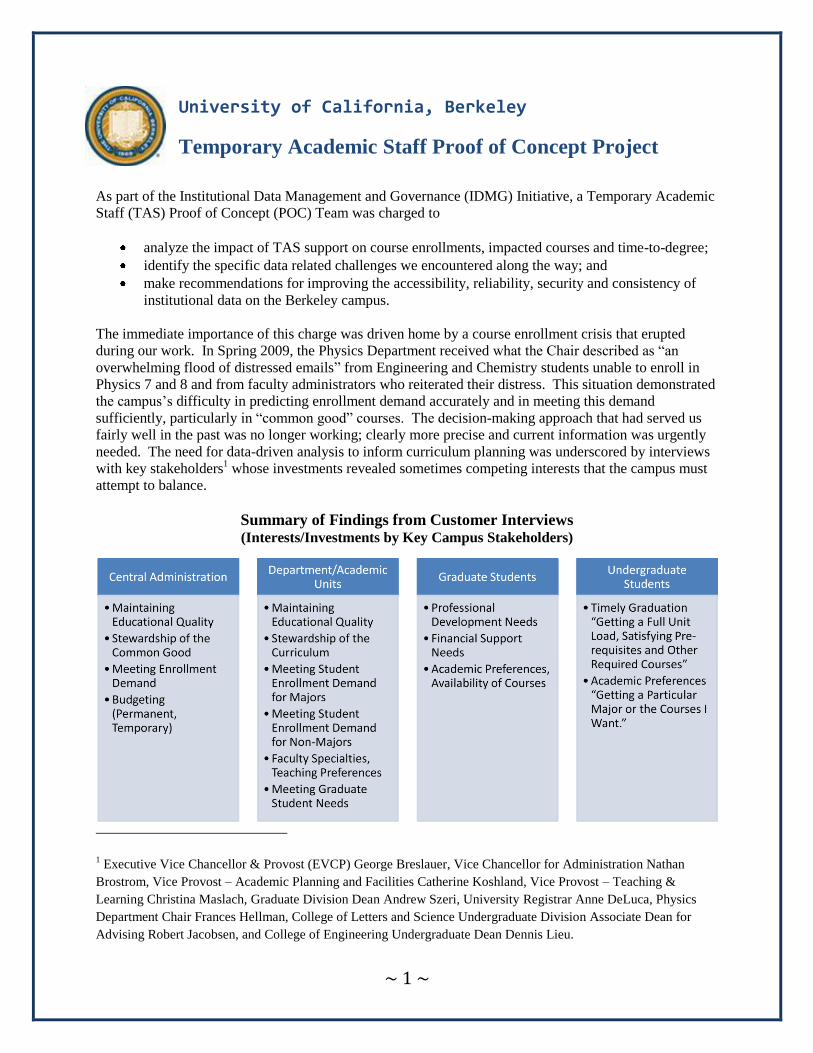
As part of the Institutional Data Management and Governance (IDMG) Initiative, a Temporary Academic
Staff (TAS) Proof of Concept (POC) Team was charged to
analyze the impact of TAS support on course enrollments, impacted courses and time-to-degree;
identify the specific data related challenges we encountered along the way; and
make recommendations for improving the accessibility, reliability, security and consistency of
institutional data on the Berkeley campus.
The immediate importance of this charge was driven home by a course enrollment crisis that erupted
during our work. In Spring 2009, the Physics Department received what the Chair described as ―an
overwhelming flood of distressed emails‖ from Engineering and Chemistry students unable to enroll in
Physics 7 and 8 and from faculty administrators who reiterated their distress. This situation demonstrated
the campus’s difficulty in predicting enrollment demand accurately and in meeting this demand
sufficiently, particularly in ―common good‖ courses. The decision-making approach that had served us
fairly well in the past was no longer working; clearly more precise and current information was urgently
needed. The need for data-driven analysis to inform curriculum planning was underscored by interviews
with key stakeholders1 whose investments revealed sometimes competing interests that the campus must
attempt to balance.
Summary of Findings from Customer Interviews (Interests/Investments by Key Campus Stakeholders)
1 Executive Vice Chancellor & Provost (EVCP) George Breslauer, Vice Chancellor for Administration Nathan
Brostrom, Vice Provost – Academic Planning and Facilities Catherine Koshland, Vice Provost – Teaching &
Learning Christina Maslach, Graduate Division Dean Andrew Szeri, University Registrar Anne DeLuca, Physics
Department Chair Frances Hellman, College of Letters and Science Undergraduate Division Associate Dean for
Advising Robert Jacobsen, and College of Engineering Undergraduate Dean Dennis Lieu.
~ 2 ~
This report documents the challenges encountered by the Office of Planning and Analysis (OPA) over the
course of producing an analysis of how TAS support affects course offerings (see Appendix I). Our
observations about these significant roadblocks resulted in a series of recommendations to campus leaders
documented below. These observations and recommendations have relevance for the TAS POC question,
as well as for the broader issue of improving the campus institutional data environment.
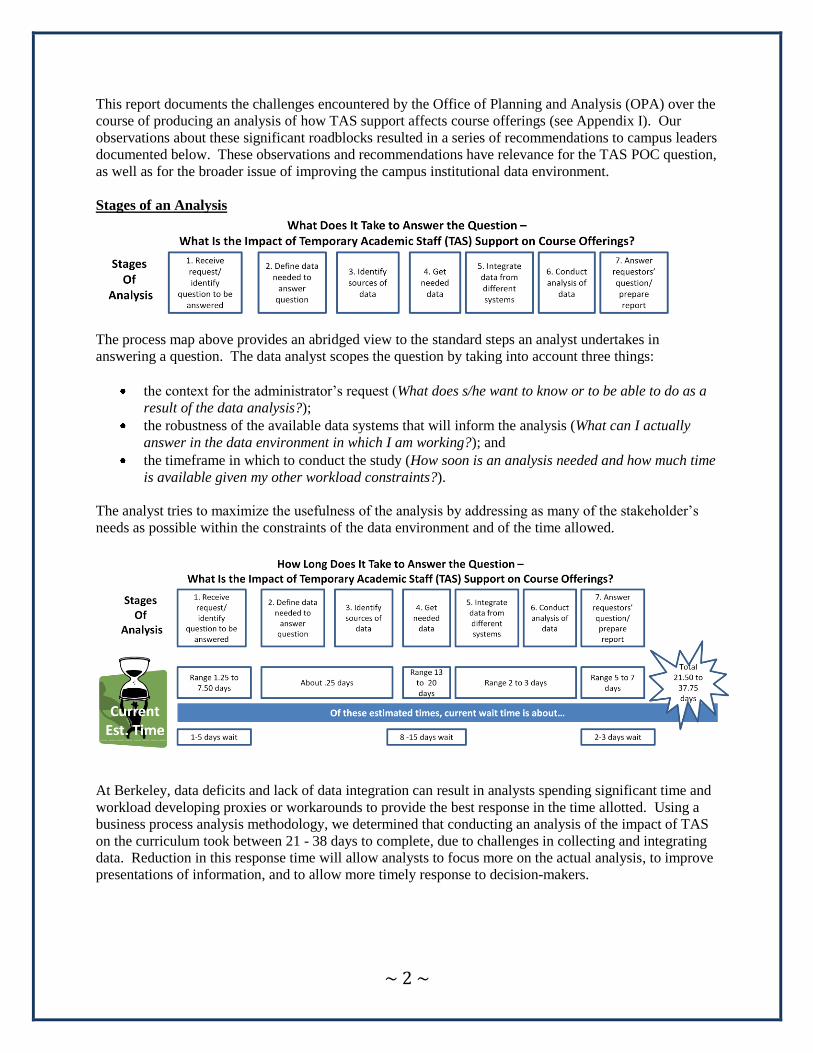
Stages of an Analysis
The process map above provides an abridged view to the standard steps an analyst undertakes in
answering a question. The data analyst scopes the question by taking into account three things:
the context for the administrator’s request (What does s/he want to know or to be able to do as a
result of the data analysis?);
the robustness of the available data systems that will inform the analysis (What can I actually
answer in the data environment in which I am working?); and
the timeframe in which to conduct the study (How soon is an analysis needed and how much time
is available given my other workload constraints?).
The analyst tries to maximize the usefulness of the analysis by addressing as many of the stakeholder’s
needs as possible within the constraints of the data environment and of the time allowed.
At Berkeley, data deficits and lack of data integration can result in analysts spending significant time and
workload developing proxies or workarounds to provide the best response in the time allotted. Using a
business process analysis methodology, we determined that conducting an analysis of the impact of TAS
on the curriculum took between 21 - 38 days to complete, due to challenges in collecting and integrating
data. Reduction in this response time will allow analysts to focus more on the actual analysis, to improve
presentations of information, and to allow more timely response to decision-makers.
~ 3 ~
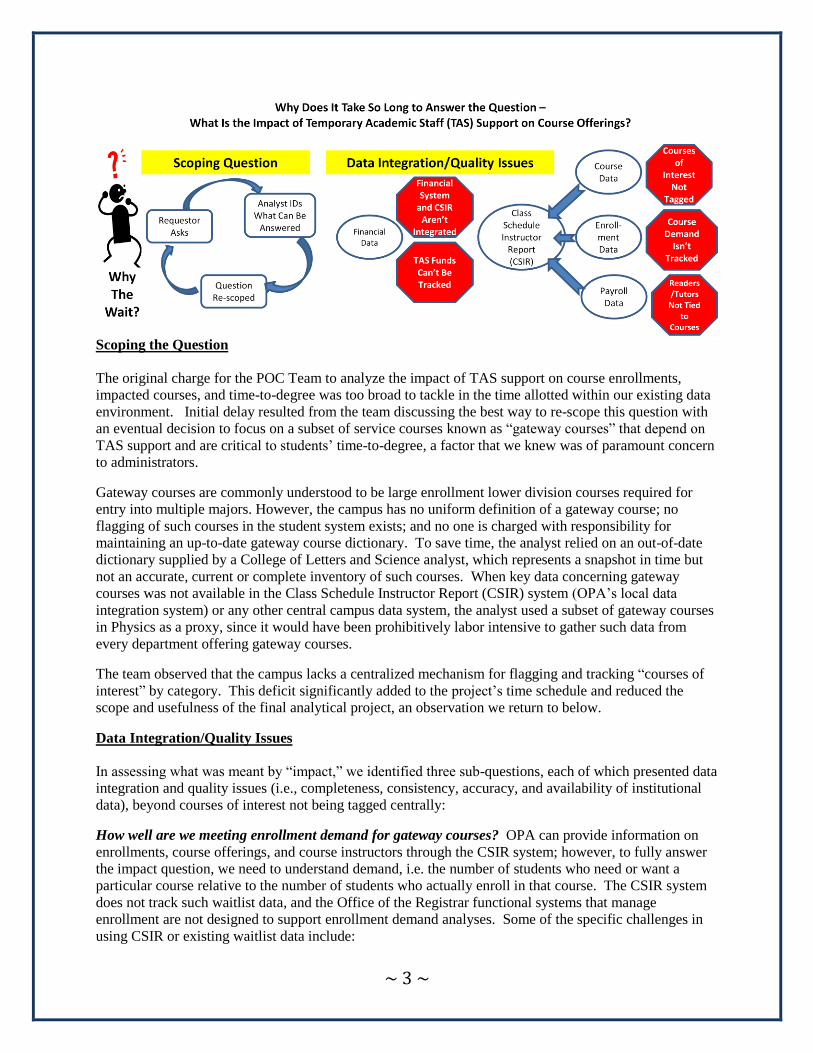
Scoping the Question
The original charge for the POC Team to analyze the impact of TAS support on course enrollments,
impacted courses, and time-to-degree was too broad to tackle in the time allotted within our existing data
environment. Initial delay resulted from the team discussing the best way to re-scope this question with
an eventual decision to focus on a subset of service courses known as ―gateway courses‖ that depend on
TAS support and are critical to students’ time-to-degree, a factor that we knew was of paramount concern
to administrators.
Gateway courses are commonly understood to be large enrollment lower division courses required for
entry into multiple majors. However, the campus has no uniform definition of a gateway course; no
flagging of such courses in the student system exists; and no one is charged with responsibility for
maintaining an up-to-date gateway course dictionary. To save time, the analyst relied on an out-of-date
dictionary supplied by a College of Letters and Science analyst, which represents a snapshot in time but
not an accurate, current or complete inventory of such courses. When key data concerning gateway
courses was not available in the Class Schedule Instructor Report (CSIR) system (OPA’s local data
integration system) or any other central campus data system, the analyst used a subset of gateway courses
in Physics as a proxy, since it would have been prohibitively labor intensive to gather such data from
every department offering gateway courses.
The team observed that the campus lacks a centralized mechanism for flagging and tracking ―courses of
interest‖ by category. This deficit significantly added to the project’s time schedule and reduced the
scope and usefulness of the final analytical project, an observation we return to below.
Data Integration/Quality Issues
In assessing what was meant by ―impact,‖ we identified three sub-questions, each of which presented data
integration and quality issues (i.e., completeness, consistency, accuracy, and availability of institutional
data), beyond courses of interest not being tagged centrally:
How well are we meeting enrollment demand for gateway courses? OPA can provide information on
enrollments, course offerings, and course instructors through the CSIR system; however, to fully answer
the impact question, we need to understand demand, i.e. the number of students who need or want a
particular course relative to the number of students who actually enroll in that course. The CSIR system
does not track such waitlist data, and the Office of the Registrar functional systems that manage
enrollment are not designed to support enrollment demand analyses. Some of the specific challenges in
using CSIR or existing waitlist data include:

~ 4 ~
Students frequently waitlist themselves in multiple sections of the same class and waitlist data is
reported as a total, not by individual student.
Departmental practices with regard to use of enrollment waitlists vary widely (some do not use
them at all, some manage them locally), making the use of waitlist data for analytical purposes
even more unreliable.
We do not have enrollment data for secondary sections (e.g. discussion sections or labs), only
primary courses.
No data are currently gathered on overall need, e.g., how many students have yet to complete
prerequisites (such as Physics 7 or 8) for either majors or minors or whether these students have
satisfied requirements during summer sessions or at community colleges.
Given these issues, we do not know to what extent waitlist data is or is not inflated. We also lack the
ability to determine how much of the unmet demand is due to space constraints (e.g., classrooms that
lack sufficient numbers of seats) and how much is due to an insufficient number of sections. In other
words, what part of the supply side is failing to meet enrollment demand—space or TAS support or both?
Who is delivering and/or supporting instruction in gateway courses? The CSIR system provides
information on who teaches courses. However, CSIR has several deficits that make it difficult to use to
answer this question and that limit its usefulness more broadly:
Due to challenges faced collecting data from academic departments and integrating data across
systems, CSIR data is not available until after the close of the semester making it difficult to do
just in time analysis on the current semester.
CSIR does not include data on readers and tutors, and obtaining such data requires a labor-
intensive process on the part of local departments. Even if we restrict our analysis to data from
one department that offers gateway courses (Physics), the manual task of identifying readers
supporting a particular course is still time-consuming and difficult to accomplish. Also, long-
term historical data may be impossible to reconstruct.
There is no dictionary of title codes specified as TAS, so OPA maintains a dictionary for its own
use to support ad hoc analyses and it is not available to others on campus.
In some cases, non-academic staff perform a crucial instructional support role. In gateway
courses with laboratory sections, for example, non-instructional titles are critical to setting up
labs. While these staff technically fall outside the scope of the question concerning TAS, they are
integral to the delivery of instruction in such courses and are part of the larger financial picture.
We have no easy way to collect information on the costs associated with this type support either.
The CSIR system is a local OPA data integration system developed to support OPA’s analytical
and reporting needs. It is not accessible to other units to support local analyses and is not scalable
for campus wide use.
What are the instructional costs and how are they funded? Ultimately, to understand the impact of TAS
funding on the cost of delivering instruction, we would need to know how much it costs to mount a
course; what fund sources (both permanent and temporary) are being marshaled to support those costs;
where those fund sources originate (e.g., EVCP, Dean, salary savings, etc); and if there is an unmet ―gap‖
in funding that needs to be filled. In essence, we need an activity-based budgeting approach to
instruction. Currently, however, the campus does not track TAS support to specific fund providers, and
there are no linkages between the financial system and the course enrollment systems. In the absence of
data and linkages between campus systems, it is impossible to know with a sufficient level of granularity
how academic salary dollars are being spent. Thus, for example, the EVCP cannot evaluate the impact of
his TAS allocations on gateway courses, and units cannot readily determine if they are getting best use of
their funds because they cannot associate fund sources with courses taught.
~ 5 ~
Some of the data gaps that make it difficult to answer this question include:
The financial and CSIR system are not integrated making it impossible to state the actual cost of
mounting a particular course.
The primary fund source used to support instruction is 19900 general funds. The campus lacks a
mechanism to differentiate 19900 funds derived from faculty salary savings, EVCP TAS
allocations, Deans’ allocations, carry forward, or other departmental support.
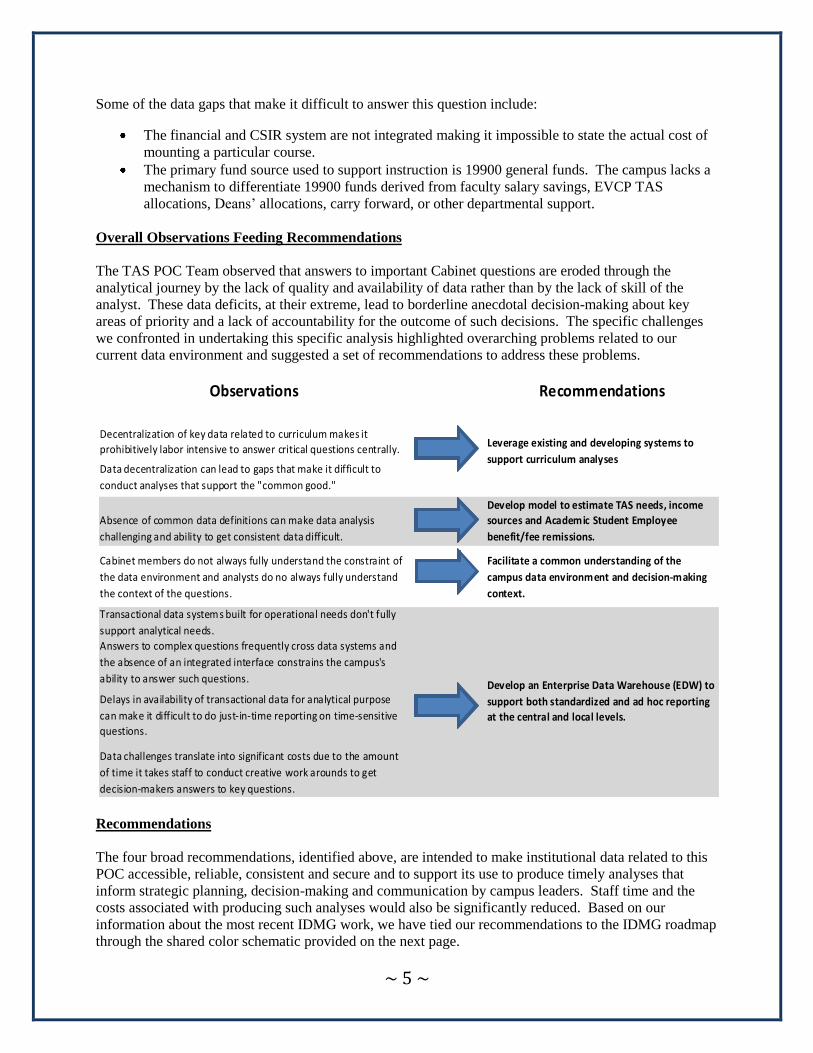
Overall Observations Feeding Recommendations
The TAS POC Team observed that answers to important Cabinet questions are eroded through the
analytical journey by the lack of quality and availability of data rather than by the lack of skill of the
analyst. These data deficits, at their extreme, lead to borderline anecdotal decision-making about key
areas of priority and a lack of accountability for the outcome of such decisions. The specific challenges
we confronted in undertaking this specific analysis highlighted overarching problems related to our
current data environment and suggested a set of recommendations to address these problems.
Recommendations
The four broad recommendations, identified above, are intended to make institutional data related to this
POC accessible, reliable, consistent and secure and to support its use to produce timely analyses that
inform strategic planning, decision-making and communication by campus leaders. Staff time and the
costs associated with producing such analyses would also be significantly reduced. Based on our
information about the most recent IDMG work, we have tied our recommendations to the IDMG roadmap
through the shared color schematic provided on the next page.
Observations Recommendations
Decentralization of key data related to curriculum makes it
prohibitively labor intensive to answer critical questions centrally.
Data decentralization can lead to gaps that make it difficult to
conduct analyses that support the "common good."
Absence of common data definitions can make data analysis
challenging and ability to get consistent data difficult.
Develop model to estimate TAS needs, income
sources and Academic Student Employee
benefit/fee remissions.
Cabinet members do not always fully understand the constraint of
the data environment and analysts do no always fully understand
the context of the questions.
Facilitate a common understanding of the
campus data environment and decision-making
context.
Transactional data systems built for operational needs don't fully
support analytical needs.
Answers to complex questions frequently cross data systems and
the absence of an integrated interface constrains the campus's
ability to answer such questions.
Delays in availability of transactional data for analytical purpose
can make it difficult to do just-in-time reporting on time-sensitive
questions.
Data challenges translate into significant costs due to the amount
of time it takes staff to conduct creative work arounds to get
decision-makers answers to key questions.
Leverage existing and developing systems to
support curriculum analyses
Develop an Enterprise Data Warehouse (EDW) to
support both standardized and ad hoc reporting
at the central and local levels.

~ 6 ~
Institutional Data Management and Governance (IDMG) Roadmap
Recommendation 1: Leverage existing and developing systems to support curriculum
analyses.
1.1 Utilize new Kuali Student Information System to identify, define, and track
courses that the academic leadership deems critical to the common good to
support curriculum analyses.
Campus leadership in the Administration and the Academic Senate should
jointly prioritize, identify and define courses that serve the ―common good.‖ These
courses could include gateway, reading and composition, foreign language, American
Cultures, service courses, or other types of courses.
Successful implementation would require a consistent definition for
these courses and a clear mechanism for tagging them and maintaining an up-to-date
dictionary in our data systems. Depending on the available resources, the campus may
wish to limit this activity to an initial set of common good courses, and if successful, to
expand to other types of courses that would improve our ability to track student learning
outcomes and to analyze the curriculum more broadly. (See Appendix II for examples of
course attributes to tag.)
1.2 Mandate 100% use of DARwin (i.e., Degree Audit Report system) to
allow analysts to evaluate shifts in enrollment patterns resulting from changes in admission
policies and/or curricular revisions in order to predict demand for particular courses.
EVCP Breslauer recently announced his goal of making DARwin the single campus degree audit
system by Spring 2011. The implementation of this goal will enable central analysts to better
estimate enrollment demand and departmental analysts to better plan staffing needs for courses.
Analysis
Collection
Decisions
Data
De
cis
ion
s &
Dir
ecti
on
s (
2) Data Decisions & Directions (1)
Data Storage, Sharing and Security (6)
Goal:
Data
accessibility,
reliability,
consistency &
security
Data Collection
(3)
Data Analysis
(4)
Data
Presentation
(5)
Storage
Storage
~ 7 ~
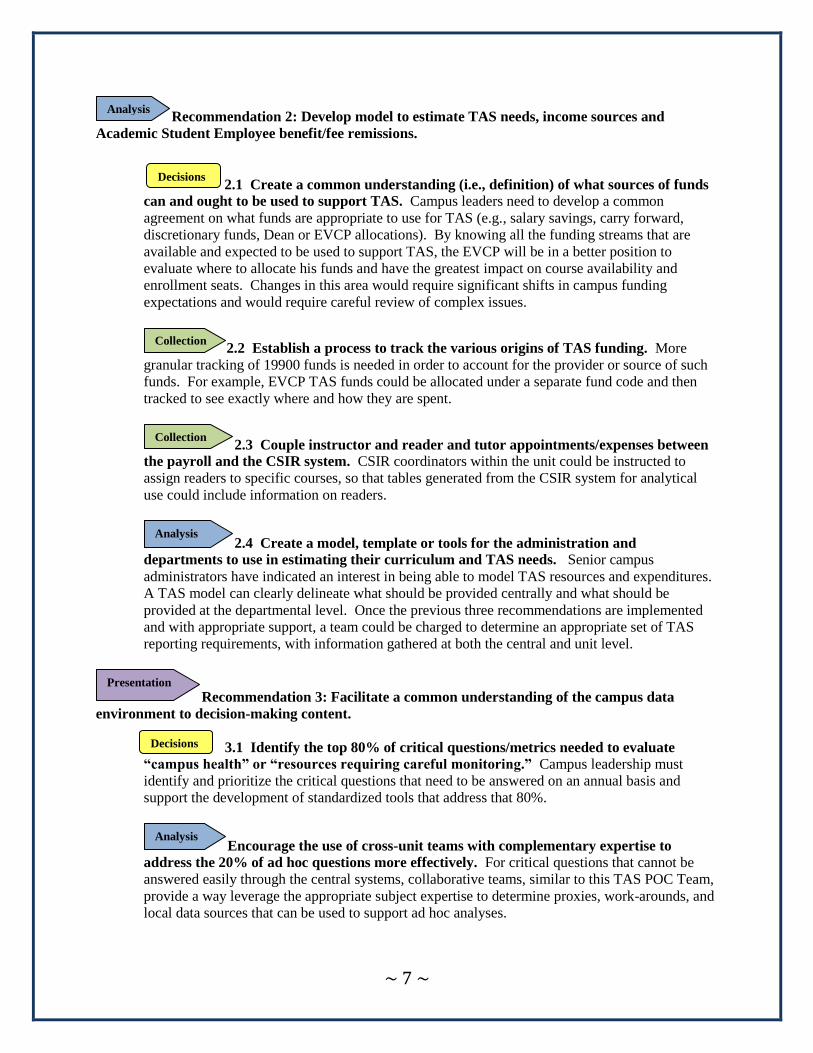
Decisions
Recommendation 2: Develop model to estimate TAS needs, income sources and
Academic Student Employee benefit/fee remissions.
2.1 Create a common understanding (i.e., definition) of what sources of funds
can and ought to be used to support TAS. Campus leaders need to develop a common
agreement on what funds are appropriate to use for TAS (e.g., salary savings, carry forward,
discretionary funds, Dean or EVCP allocations). By knowing all the funding streams that are
available and expected to be used to support TAS, the EVCP will be in a better position to
evaluate where to allocate his funds and have the greatest impact on course availability and
enrollment seats. Changes in this area would require significant shifts in campus funding
expectations and would require careful review of complex issues.
2.2 Establish a process to track the various origins of TAS funding. More
granular tracking of 19900 funds is needed in order to account for the provider or source of such
funds. For example, EVCP TAS funds could be allocated under a separate fund code and then
tracked to see exactly where and how they are spent.
2.3 Couple instructor and reader and tutor appointments/expenses between
the payroll and the CSIR system. CSIR coordinators within the unit could be instructed to
assign readers to specific courses, so that tables generated from the CSIR system for analytical
use could include information on readers.
2.4 Create a model, template or tools for the administration and
departments to use in estimating their curriculum and TAS needs. Senior campus
administrators have indicated an interest in being able to model TAS resources and expenditures.
A TAS model can clearly delineate what should be provided centrally and what should be
provided at the departmental level. Once the previous three recommendations are implemented
and with appropriate support, a team could be charged to determine an appropriate set of TAS
reporting requirements, with information gathered at both the central and unit level.
Recommendation 3: Facilitate a common understanding of the campus data
environment to decision-making content.
3.1 Identify the top 80% of critical questions/metrics needed to evaluate
“campus health” or “resources requiring careful monitoring.” Campus leadership must
identify and prioritize the critical questions that need to be answered on an annual basis and
support the development of standardized tools that address that 80%.
Encourage the use of cross-unit teams with complementary expertise to
address the 20% of ad hoc questions more effectively. For critical questions that cannot be
answered easily through the central systems, collaborative teams, similar to this TAS POC Team,
provide a way leverage the appropriate subject expertise to determine proxies, work-arounds, and
local data sources that can be used to support ad hoc analyses.
Analysis
Presentation
Analysis
Collection
Collection
Analysis
Decisions

~ 8 ~
3.3 Develop a common understanding of what is needed when submitting an
ad hoc request for information. Ad hoc requests should clarify (a) the question at hand, (b) the
context for asking it, (c) how the information will support the decision making process and (d) the
criticality of the question being asked to help evaluate the time/effort needed to respond to the
request.
Recommendation 4: Develop an Enterprise Data Warehouse (EDW) to support both
standardized and ad hoc reporting at the central and local levels.
4.1 Develop an EDW to produce standard reports that answer the critical 80% of common
questions/metrics and support analytical needs to conduct ad hoc analyses on the
remaining 20%. The EDW should be able to answer the critical questions for campus
leadership and provide sufficient detail to allow analyst to do necessary ad hoc analyses for
additional questions that may be generated from review of the metrics associated with these
top line questions. The EDW should support the analytical needs of local as well as central
campus units, while improving campus data security.
Our POC team also believe that while identifying the overall goal of each recommendation, it was
important to acknowledge each recommendation actually relied on successfully walking through multiple
stages of the IDMG roadmap as identified in the graphic below.
Storage
Collection
~ 9 ~
Success Factors
The successful implementation of these recommendations will depend on three key success factors:
leadership, funding and trust.
Leadership: Both academic and administrative leadership are critical to solving the challenges identified
above. Curriculum management and budgeting are of primary concern with regard to the academic
mission of the University. Successful planning requires the joint leadership and buy-in of the Academic
Senate, of Deans and Departments Chairs, and of the Executive Vice Chancellor and Provost. Decisions
such as the identification of ―common good‖ courses and the prioritization of funding for such courses
require shared leadership and a willingness to make tough decisions in a limited resource environment.
Such decisions will inevitably entail tradeoffs. Administrative support units can provide analyses and
make recommendations to inform such decisions, but the decisions themselves, with the inevitable
compromises that will be entailed, must come from campus leaders.
Funding: While development of an EDW has begun, insufficient funding has limited its progress at a
pace adequate to support campus needs. As a result, campus departments continue to waste significant
resources on maintaining silo data warehouses. The development of a robust EDW and standard reports
and models, as well as the programming requirements associated with existing data systems, will require
an infusion of dedicated resources. Most of these expenses would be up-front and one-time costs, along
with certain maintenance and upgrades required for improved technology solutions. The development of
the requirements and funding model for an EDW is beyond the scope of the TAS POC Team’s charge;
however, we urge the campus leadership to charge the appropriate group to undertake these efforts. We
further recommend that the EDW be implemented in carefully thought out phases. With a modest
infusion of centrally provided funds supplementing departmental project contributions that would
otherwise have gone to silo projects, we believe that significant progress can be made to establishing a
baseline EDW.
Trust: Our vision for the campus data environment entails a radical restructuring of business as usual. In
the course of our work, one team member proposed the metaphor of a kitchen (data warehouse), where
the cooks (data analysts) could visit well-stocked pantries (data resources), create tasty dishes (analyses),
and serve up satisfying meals to the campus leadership (data-driven recommendations to inform campus
decision-making). The successful implementation of such a vision depends on building the trust of the
talented staff across the campus to change the habitual ways of doing business. The first step in gaining
trust will be initiating the resource support necessary to begin the staged implementation of this vision.
The second step will emerge from the gradual shift from individuals working in silos to cross-unit teams
tackling common problems with shared data resources. The TAS POC project itself demonstrated what is
possible when a dedicated cross-unit team applies itself to a common challenge. We urge the campus
leadership to create more such opportunities and to provide the support necessary for their success.

0
~ i ~
Appendix I – Proof of Concept Study
University of California, Berkeley
WHAT IS THE IMPACT OF TEMPORARY ACADEMIC
STAFF (TAS) INSTRUCTORS ON COURSE OFFERINGS?
Overview
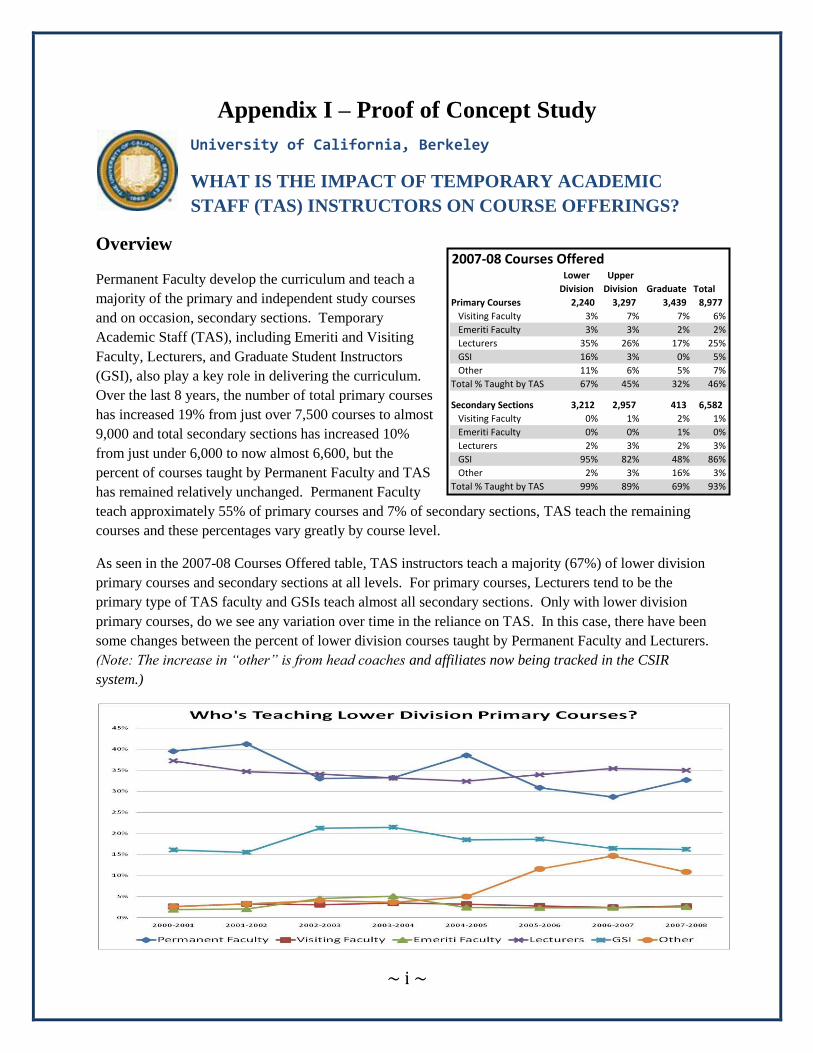
Permanent Faculty develop the curriculum and teach a
majority of the primary and independent study courses
and on occasion, secondary sections. Temporary
Academic Staff (TAS), including Emeriti and Visiting
Faculty, Lecturers, and Graduate Student Instructors
(GSI), also play a key role in delivering the curriculum.
Over the last 8 years, the number of total primary courses
has increased 19% from just over 7,500 courses to almost
9,000 and total secondary sections has increased 10%
from just under 6,000 to now almost 6,600, but the
percent of courses taught by Permanent Faculty and TAS
has remained relatively unchanged. Permanent Faculty
teach approximately 55% of primary courses and 7% of secondary sections, TAS teach the remaining
courses and these percentages vary greatly by course level.
As seen in the 2007-08 Courses Offered table, TAS instructors teach a majority (67%) of lower division
primary courses and secondary sections at all levels. For primary courses, Lecturers tend to be the
primary type of TAS faculty and GSIs teach almost all secondary sections. Only with lower division
primary courses, do we see any variation over time in the reliance on TAS. In this case, there have been
some changes between the percent of lower division courses taught by Permanent Faculty and Lecturers.
(Note: The increase in “other” is from head coaches and affiliates now being tracked in the CSIR
system.)
2007-08 Courses OfferedLower
Division
Upper
Division Graduate Total
Primary Courses 2,240 3,297 3,439 8,977
Visiting Faculty 3% 7% 7% 6%
Emeriti Faculty 3% 3% 2% 2%
Lecturers 35% 26% 17% 25%
GSI 16% 3% 0% 5%
Other 11% 6% 5% 7%
Total % Taught by TAS 67% 45% 32% 46%
Secondary Sections 3,212 2,957 413 6,582
Visiting Faculty 0% 1% 2% 1%
Emeriti Faculty 0% 0% 1% 0%
Lecturers 2% 3% 2% 3%
GSI 95% 82% 48% 86%
Other 2% 3% 16% 3%
Total % Taught by TAS 99% 89% 69% 93%
~ ii ~
In addition to course level, the reliance on TAS may vary depending on the type of courses. For example,
over 90% of foreign language and reading and composition courses rely on TAS. In addition, gateway
courses rely heavily on TAS, particularly at the secondary section level.
Since TAS support varies by course level and type, this analysis will focus a subset of service courses
offerings that are critical to students’ ability to get into the major of their choice and their timely progress
toward degree completion that depend on TAS support, namely gateway courses. As background,
gateway course are lower division courses that are pre-requisites to declaring a major or advancing to
upper division course work by at least two majors. For example, Physics offers five gateway courses
(Physics 7A, 7B, 7C, 8A and 8B) which are required by majors within Letters & Science, Engineering,
Chemistry and Natural Resources. (See Attachment I for currently available approximated dictionary of
gateway courses.)
To better understand the impact of TAS on gateway courses, this analysis will focus on the following
three questions:
1. How well are we meeting enrollment demand for gateway courses?
2. Who is delivering/supporting instruction in gateway courses?
3. What are the instructional costs of courses and how are they funded?
For each question, we begin with what is available at the campus level and then where necessary, focus
on Physics to illustrate additional detail at a unit level.
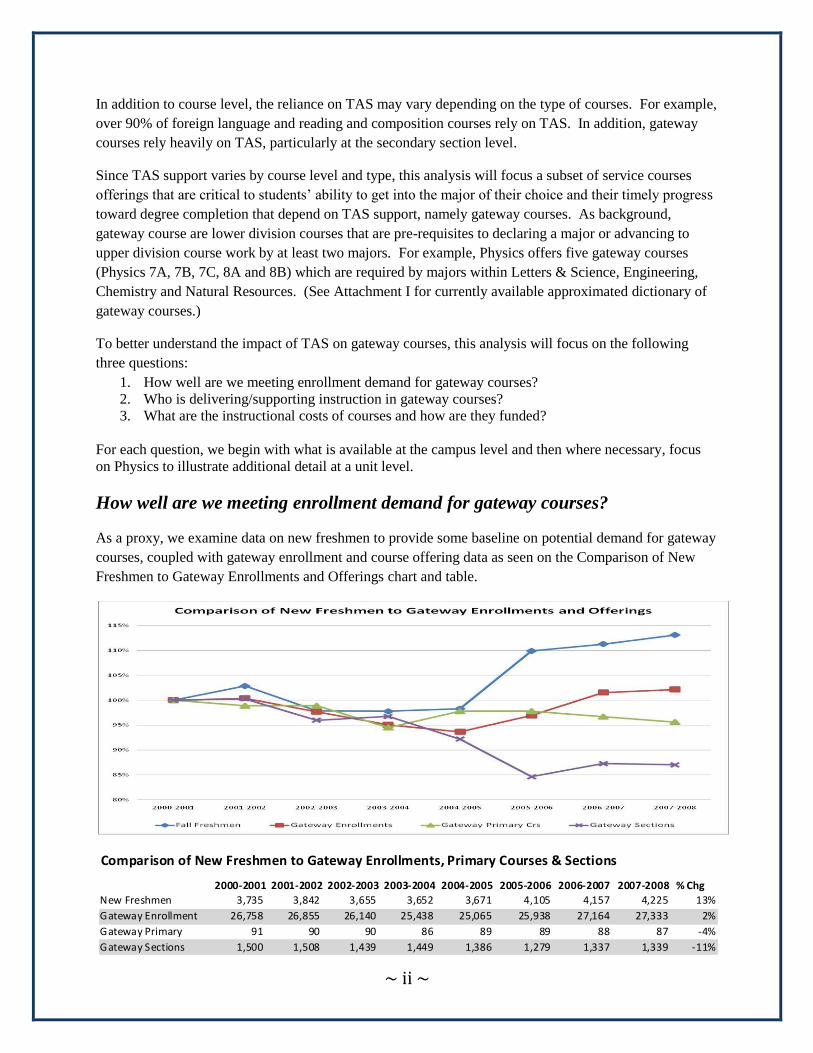
How well are we meeting enrollment demand for gateway courses?
As a proxy, we examine data on new freshmen to provide some baseline on potential demand for gateway
courses, coupled with gateway enrollment and course offering data as seen on the Comparison of New
Freshmen to Gateway Enrollments and Offerings chart and table.
Comparison of New Freshmen to Gateway Enrollments, Primary Courses & Sections
2000-2001 2001-2002 2002-2003 2003-2004 2004-2005 2005-2006 2006-2007 2007-2008 % Chg
New Freshmen 3,735 3,842 3,655 3,652 3,671 4,105 4,157 4,225 13%
Gateway Enrollment 26,758 26,855 26,140 25,438 25,065 25,938 27,164 27,333 2%
Gateway Primary 91 90 90 86 89 89 88 87 -4%
Gateway Sections 1,500 1,508 1,439 1,449 1,386 1,279 1,337 1,339 -11%
~ iii ~
As this data illustrates, while new freshmen and gateway course enrollments have both increased over this
8-year period, the percent increase in gateway enrollments (2%) has not met the increase in new freshmen
(13%). In addition, there has been a decline in the primary course offerings (-4%) and secondary sections
(-11%) for gateway courses. One might assume these trends are an indication that student demand may
not be met with current gateway course offerings; however, this information is not conclusive. For
example, some students may pass out of gateway courses by using AP courses, some new freshmen may
not need these gateway courses if they are intending to go into majors where these courses are not a
requirement, and some students may intend on taking courses during the summer or at another institution.
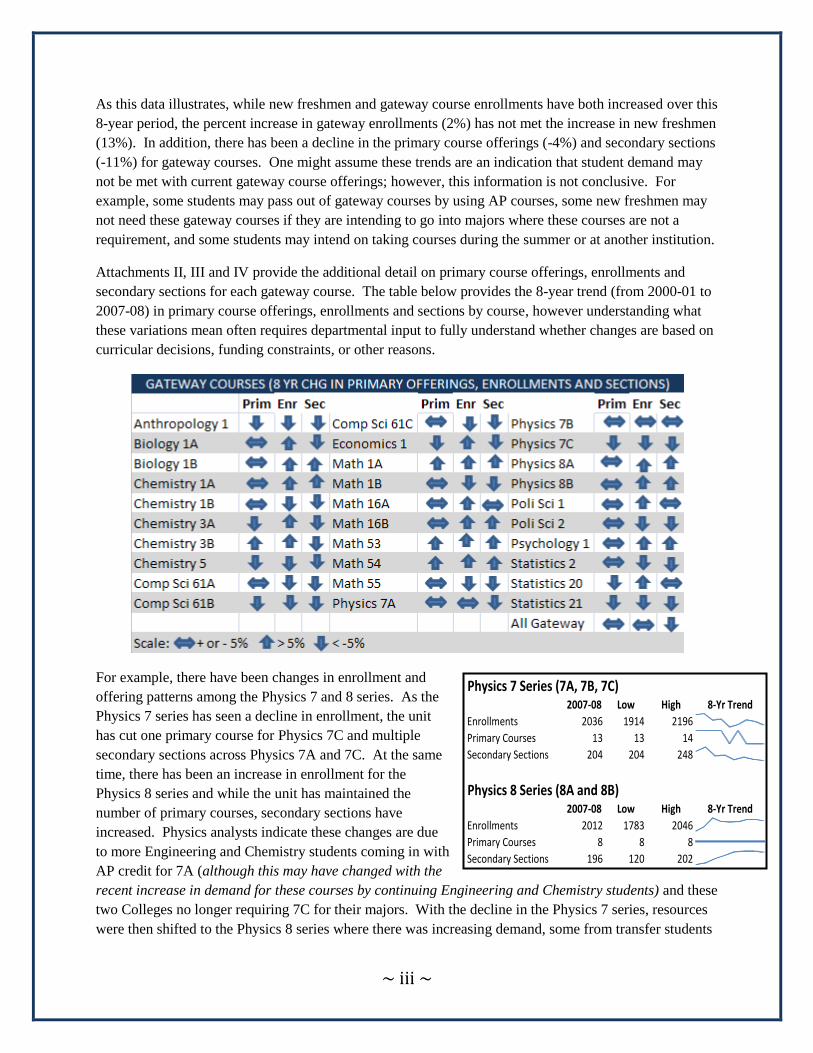
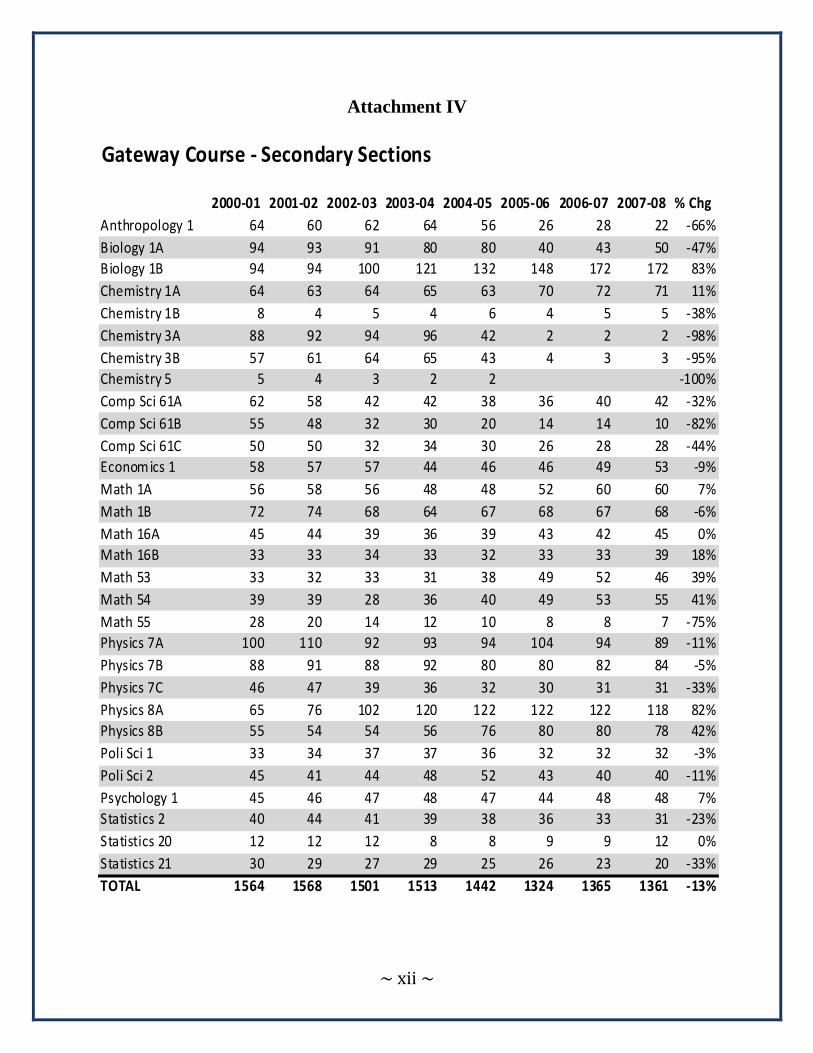
Attachments II, III and IV provide the additional detail on primary course offerings, enrollments and
secondary sections for each gateway course. The table below provides the 8-year trend (from 2000-01 to
2007-08) in primary course offerings, enrollments and sections by course, however understanding what
these variations mean often requires departmental input to fully understand whether changes are based on
curricular decisions, funding constraints, or other reasons.
For example, there have been changes in enrollment and
offering patterns among the Physics 7 and 8 series. As the
Physics 7 series has seen a decline in enrollment, the unit
has cut one primary course for Physics 7C and multiple
secondary sections across Physics 7A and 7C. At the same
time, there has been an increase in enrollment for the
Physics 8 series and while the unit has maintained the
number of primary courses, secondary sections have
increased. Physics analysts indicate these changes are due
to more Engineering and Chemistry students coming in with
AP credit for 7A (although this may have changed with the
recent increase in demand for these courses by continuing Engineering and Chemistry students) and these
two Colleges no longer requiring 7C for their majors. With the decline in the Physics 7 series, resources
were then shifted to the Physics 8 series where there was increasing demand, some from transfer students
Physics 7 Series (7A, 7B, 7C)2007-08 Low High 8-Yr Trend
Enrollments 2036 1914 2196
Primary Courses 13 13 14
Secondary Sections 204 204 248
Physics 8 Series (8A and 8B)2007-08 Low High 8-Yr Trend
Enrollments 2012 1783 2046
Primary Courses 8 8 8
Secondary Sections 196 120 202
~ iv ~
who might have satisfied the Physics 7 series but not the Physics 8 and some possibly from non-biology
students becoming interested in pre-med and taking these courses to provide that background.
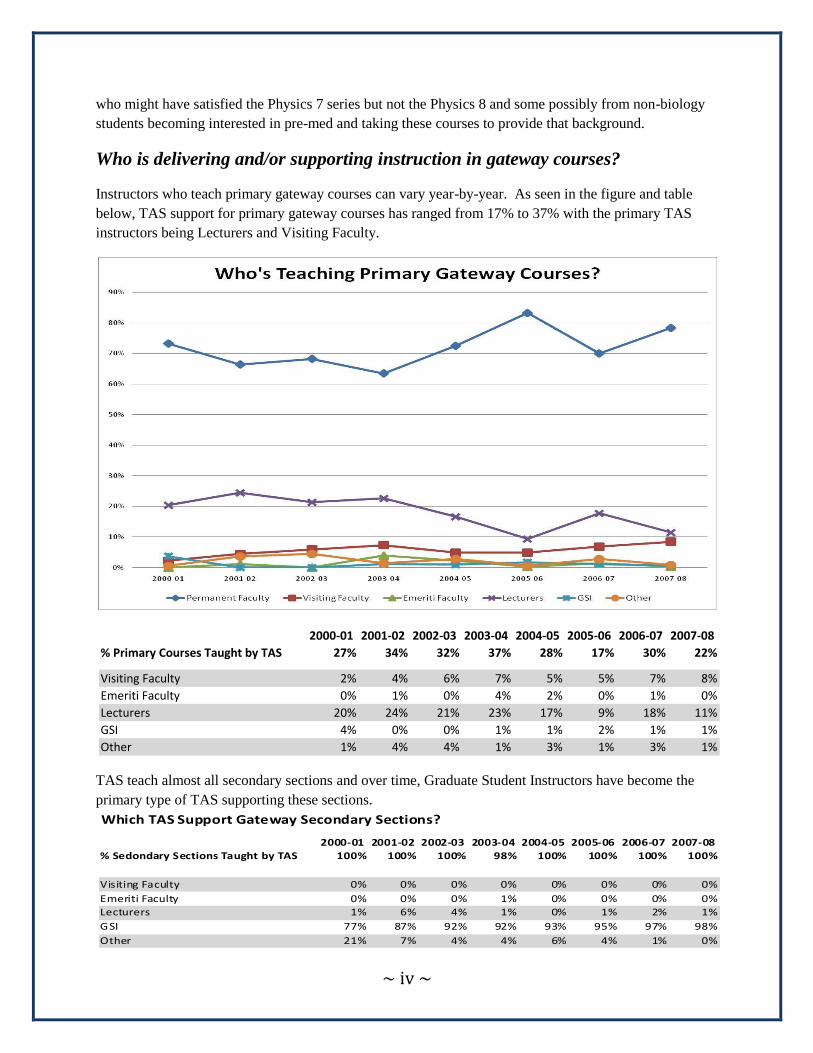
Who is delivering and/or supporting instruction in gateway courses?
Instructors who teach primary gateway courses can vary year-by-year. As seen in the figure and table
below, TAS support for primary gateway courses has ranged from 17% to 37% with the primary TAS
instructors being Lecturers and Visiting Faculty.
TAS teach almost all secondary sections and over time, Graduate Student Instructors have become the
primary type of TAS supporting these sections.
2000-01 2001-02 2002-03 2003-04 2004-05 2005-06 2006-07 2007-08
% Primary Courses Taught by TAS 27% 34% 32% 37% 28% 17% 30% 22%
Visiting Faculty 2% 4% 6% 7% 5% 5% 7% 8%
Emeriti Faculty 0% 1% 0% 4% 2% 0% 1% 0%
Lecturers 20% 24% 21% 23% 17% 9% 18% 11%
GSI 4% 0% 0% 1% 1% 2% 1% 1%
Other 1% 4% 4% 1% 3% 1% 3% 1%
Which TAS Support Gateway Secondary Sections?
2000-01 2001-02 2002-03 2003-04 2004-05 2005-06 2006-07 2007-08
% Sedondary Sections Taught by TAS 100% 100% 100% 98% 100% 100% 100% 100%
Visiting Faculty 0% 0% 0% 0% 0% 0% 0% 0%
Emeriti Faculty 0% 0% 0% 1% 0% 0% 0% 0%
Lecturers 1% 6% 4% 1% 0% 1% 2% 1%
GSI 77% 87% 92% 92% 93% 95% 97% 98%
Other 21% 7% 4% 4% 6% 4% 1% 0%
~ v ~
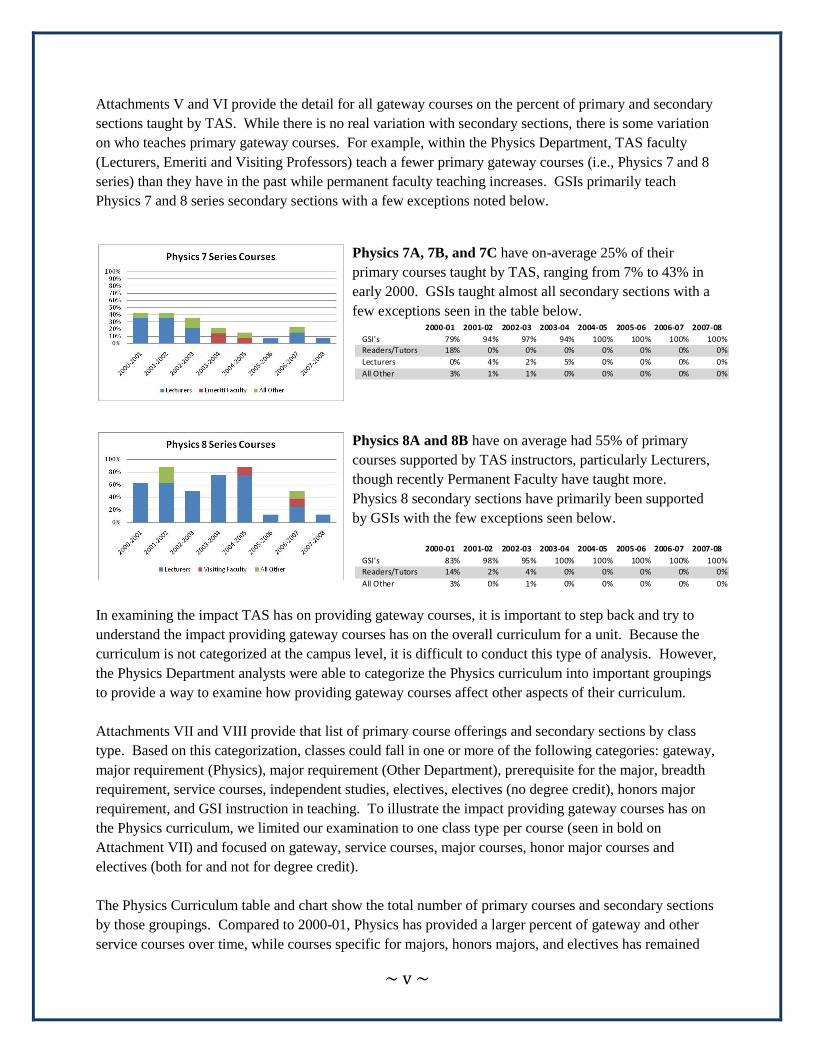
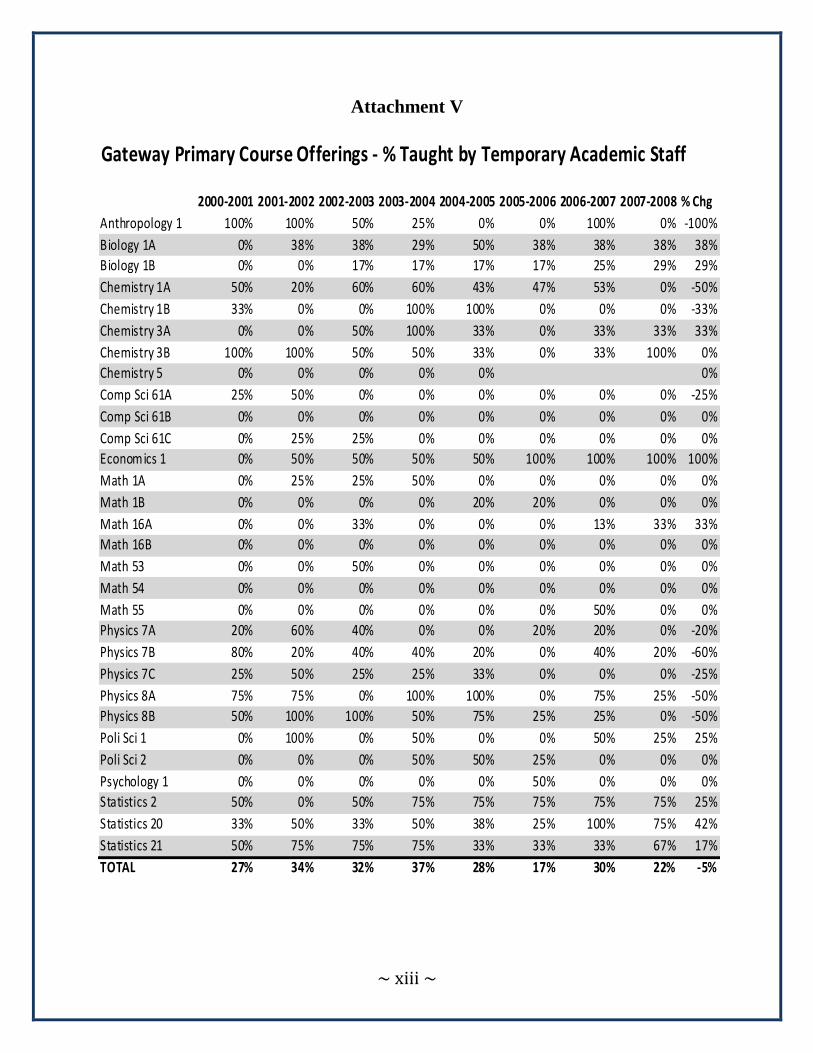
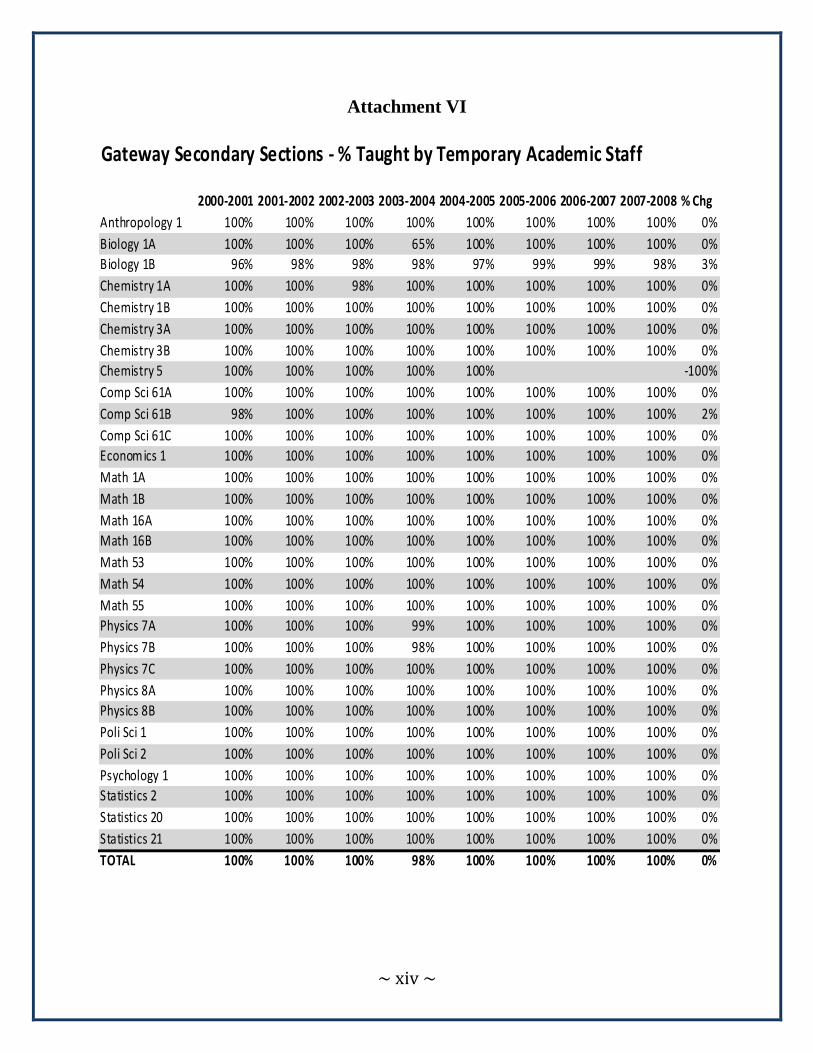
Attachments V and VI provide the detail for all gateway courses on the percent of primary and secondary
sections taught by TAS. While there is no real variation with secondary sections, there is some variation
on who teaches primary gateway courses. For example, within the Physics Department, TAS faculty
(Lecturers, Emeriti and Visiting Professors) teach a fewer primary gateway courses (i.e., Physics 7 and 8
series) than they have in the past while permanent faculty teaching increases. GSIs primarily teach
Physics 7 and 8 series secondary sections with a few exceptions noted below.
Physics 7A, 7B, and 7C have on-average 25% of their
primary courses taught by TAS, ranging from 7% to 43% in
early 2000. GSIs taught almost all secondary sections with a
few exceptions seen in the table below.
Physics 8A and 8B have on average had 55% of primary
courses supported by TAS instructors, particularly Lecturers,
though recently Permanent Faculty have taught more.
Physics 8 secondary sections have primarily been supported
by GSIs with the few exceptions seen below.
In examining the impact TAS has on providing gateway courses, it is important to step back and try to
understand the impact providing gateway courses has on the overall curriculum for a unit. Because the
curriculum is not categorized at the campus level, it is difficult to conduct this type of analysis. However,
the Physics Department analysts were able to categorize the Physics curriculum into important groupings
to provide a way to examine how providing gateway courses affect other aspects of their curriculum.
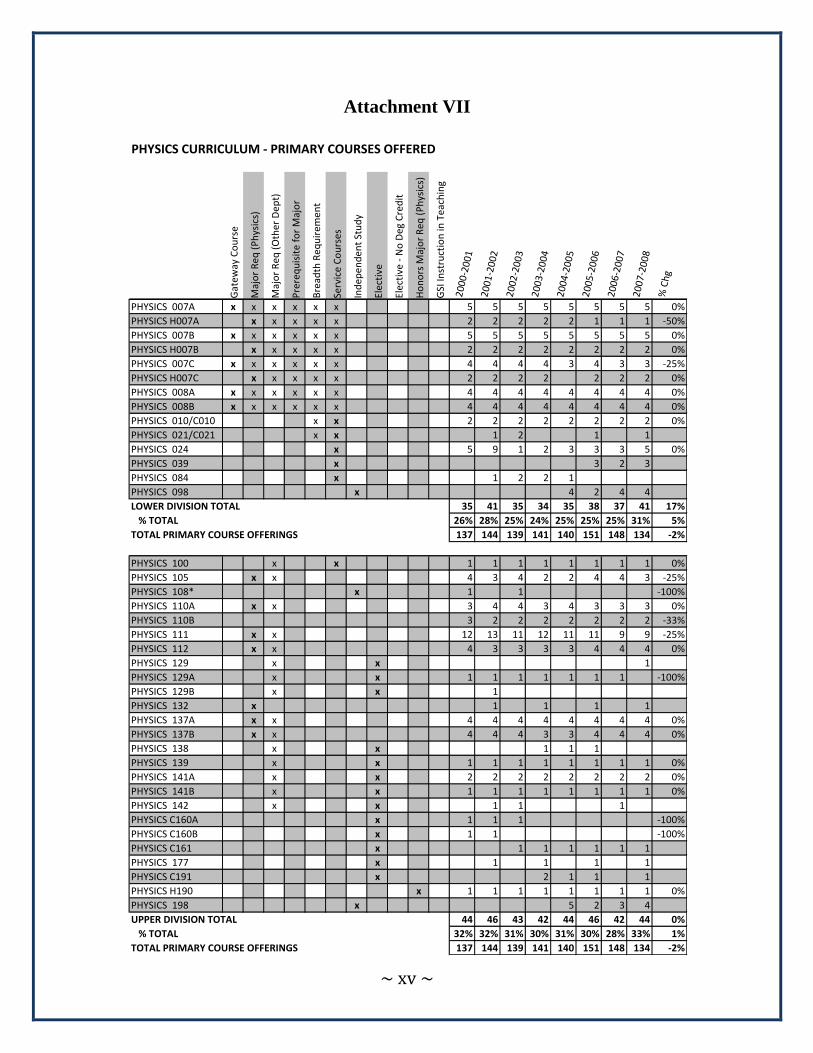
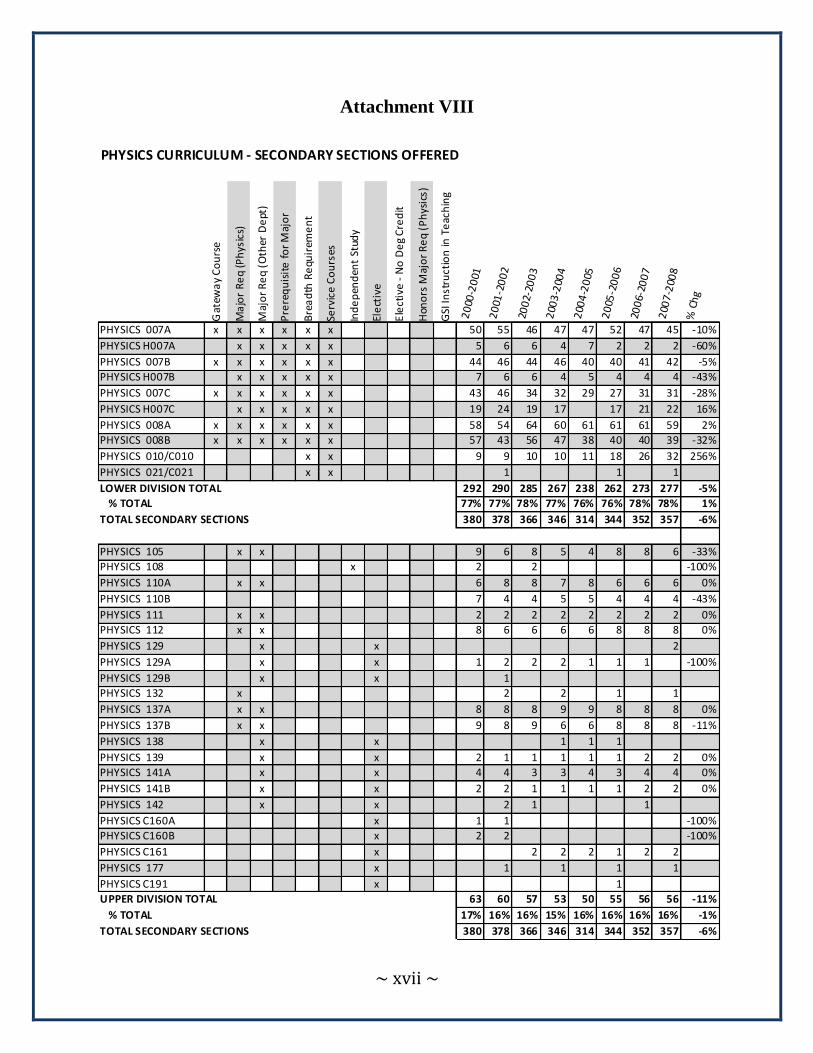
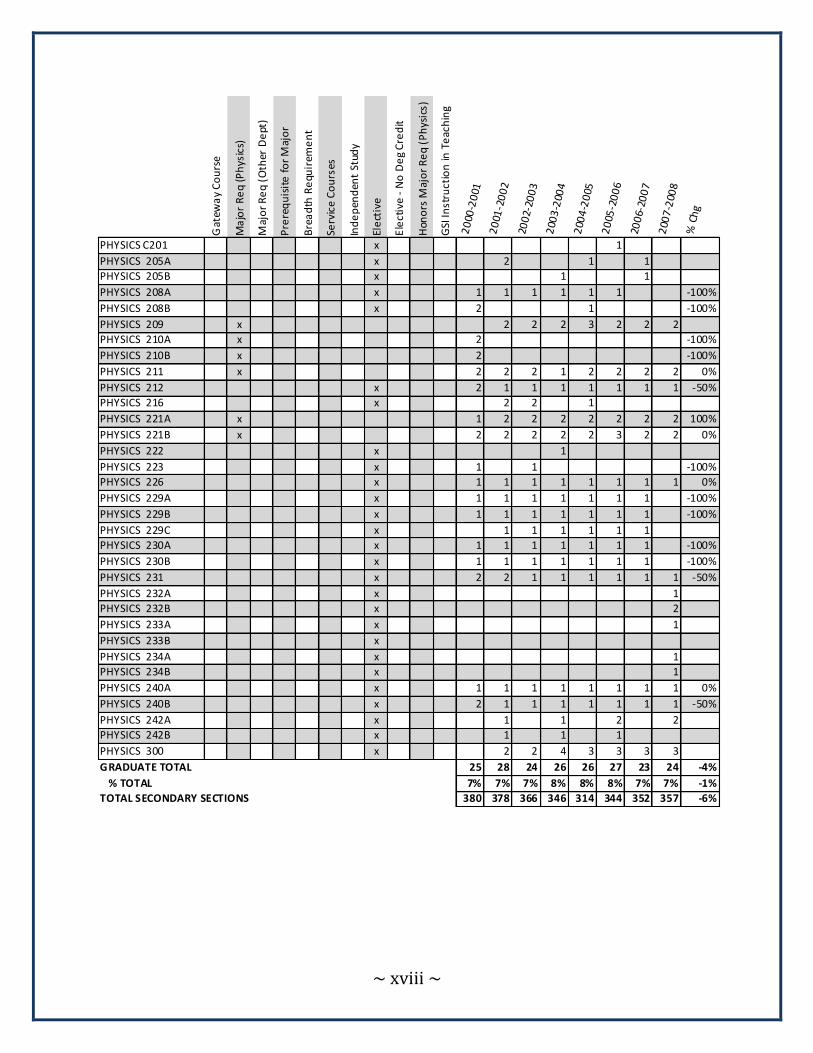
Attachments VII and VIII provide that list of primary course offerings and secondary sections by class
type. Based on this categorization, classes could fall in one or more of the following categories: gateway,
major requirement (Physics), major requirement (Other Department), prerequisite for the major, breadth
requirement, service courses, independent studies, electives, electives (no degree credit), honors major
requirement, and GSI instruction in teaching. To illustrate the impact providing gateway courses has on
the Physics curriculum, we limited our examination to one class type per course (seen in bold on
Attachment VII) and focused on gateway, service courses, major courses, honor major courses and
electives (both for and not for degree credit).
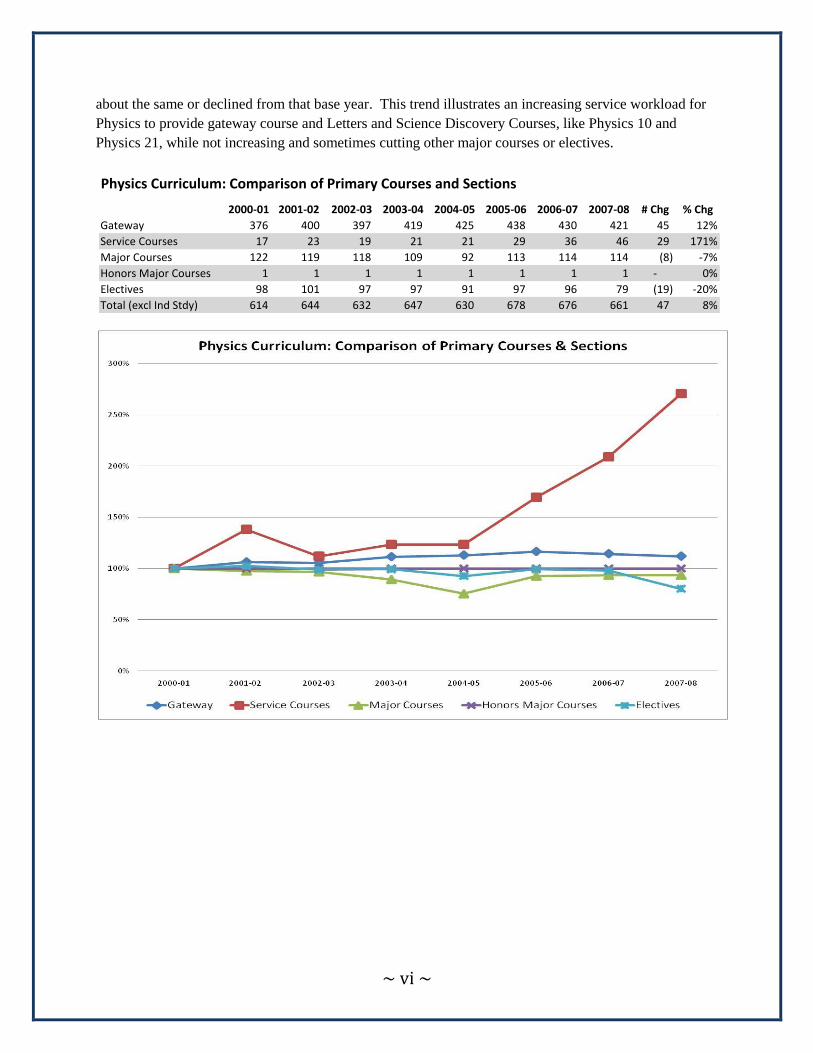
The Physics Curriculum table and chart show the total number of primary courses and secondary sections
by those groupings. Compared to 2000-01, Physics has provided a larger percent of gateway and other
service courses over time, while courses specific for majors, honors majors, and electives has remained
2000-01 2001-02 2002-03 2003-04 2004-05 2005-06 2006-07 2007-08
GSI's 79% 94% 97% 94% 100% 100% 100% 100%
Readers/Tutors 18% 0% 0% 0% 0% 0% 0% 0%
Lecturers 0% 4% 2% 5% 0% 0% 0% 0%
All Other 3% 1% 1% 0% 0% 0% 0% 0%
2000-01 2001-02 2002-03 2003-04 2004-05 2005-06 2006-07 2007-08
GSI's 83% 98% 95% 100% 100% 100% 100% 100%
Readers/Tutors 14% 2% 4% 0% 0% 0% 0% 0%
All Other 3% 0% 1% 0% 0% 0% 0% 0%
~ vi ~
about the same or declined from that base year. This trend illustrates an increasing service workload for
Physics to provide gateway course and Letters and Science Discovery Courses, like Physics 10 and
Physics 21, while not increasing and sometimes cutting other major courses or electives.
Physics Curriculum: Comparison of Primary Courses and Sections
2000-01 2001-02 2002-03 2003-04 2004-05 2005-06 2006-07 2007-08 # Chg % Chg
Gateway 376 400 397 419 425 438 430 421 45 12%
Service Courses 17 23 19 21 21 29 36 46 29 171%
Major Courses 122 119 118 109 92 113 114 114 (8) -7%
Honors Major Courses 1 1 1 1 1 1 1 1 - 0%
Electives 98 101 97 97 91 97 96 79 (19) -20%
Total (excl Ind Stdy) 614 644 632 647 630 678 676 661 47 8%
~ vii ~
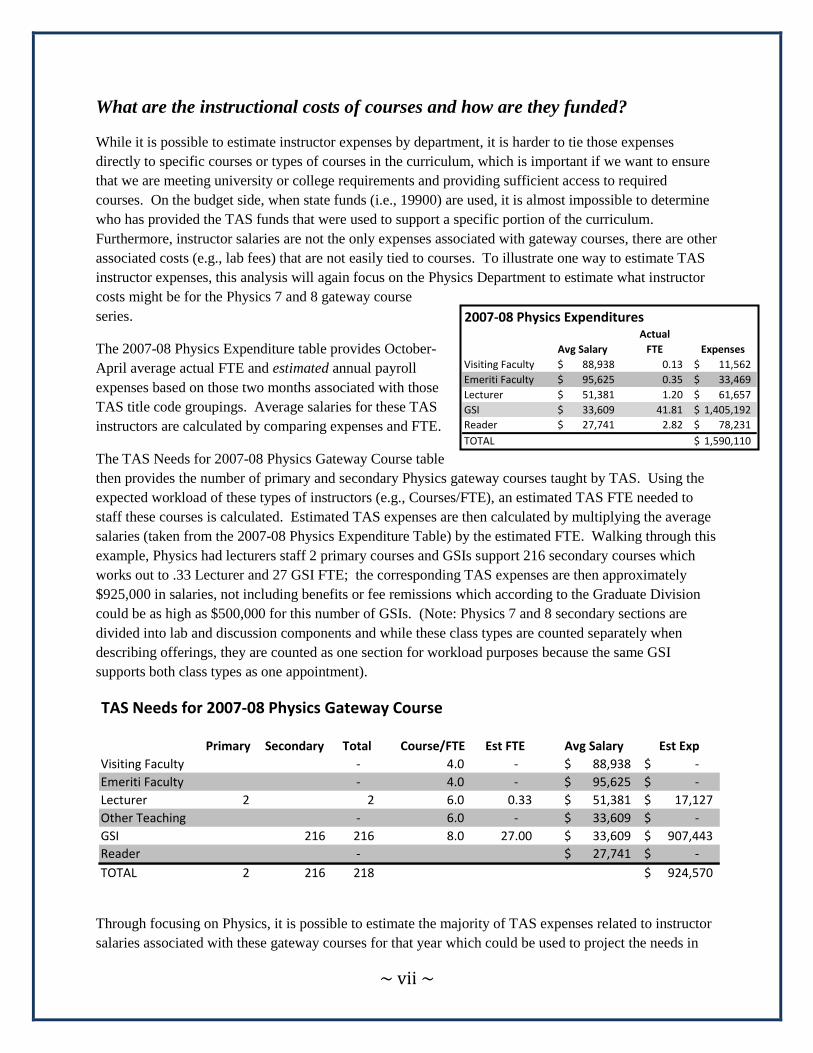
What are the instructional costs of courses and how are they funded?
While it is possible to estimate instructor expenses by department, it is harder to tie those expenses
directly to specific courses or types of courses in the curriculum, which is important if we want to ensure
that we are meeting university or college requirements and providing sufficient access to required
courses. On the budget side, when state funds (i.e., 19900) are used, it is almost impossible to determine
who has provided the TAS funds that were used to support a specific portion of the curriculum.
Furthermore, instructor salaries are not the only expenses associated with gateway courses, there are other
associated costs (e.g., lab fees) that are not easily tied to courses. To illustrate one way to estimate TAS
instructor expenses, this analysis will again focus on the Physics Department to estimate what instructor
costs might be for the Physics 7 and 8 gateway course
series.
The 2007-08 Physics Expenditure table provides October-
April average actual FTE and estimated annual payroll
expenses based on those two months associated with those
TAS title code groupings. Average salaries for these TAS
instructors are calculated by comparing expenses and FTE.
The TAS Needs for 2007-08 Physics Gateway Course table
then provides the number of primary and secondary Physics gateway courses taught by TAS. Using the
expected workload of these types of instructors (e.g., Courses/FTE), an estimated TAS FTE needed to
staff these courses is calculated. Estimated TAS expenses are then calculated by multiplying the average
salaries (taken from the 2007-08 Physics Expenditure Table) by the estimated FTE. Walking through this
example, Physics had lecturers staff 2 primary courses and GSIs support 216 secondary courses which
works out to .33 Lecturer and 27 GSI FTE; the corresponding TAS expenses are then approximately
$925,000 in salaries, not including benefits or fee remissions which according to the Graduate Division
could be as high as $500,000 for this number of GSIs. (Note: Physics 7 and 8 secondary sections are
divided into lab and discussion components and while these class types are counted separately when
describing offerings, they are counted as one section for workload purposes because the same GSI
supports both class types as one appointment).
Through focusing on Physics, it is possible to estimate the majority of TAS expenses related to instructor
salaries associated with these gateway courses for that year which could be used to project the needs in
TAS Needs for 2007-08 Physics Gateway Course
Primary Secondary Total Course/FTE Est FTE Avg Salary Est Exp
Visiting Faculty - 4.0 - 88,938$ -$
Emeriti Faculty - 4.0 - 95,625$ -$
Lecturer 2 2 6.0 0.33 51,381$ 17,127$
Other Teaching - 6.0 - 33,609$ -$
GSI 216 216 8.0 27.00 33,609$ 907,443$
Reader - 27,741$ -$
TOTAL 2 216 218 924,570$
2007-08 Physics Expenditures
Avg Salary FTE Expenses
Visiting Faculty 88,938$ 0.13 11,562$
Emeriti Faculty 95,625$ 0.35 33,469$
Lecturer 51,381$ 1.20 61,657$
GSI 33,609$ 41.81 1,405,192$
Reader 27,741$ 2.82 78,231$
TOTAL 1,590,110$
Actual
~ viii ~
the future by indicating what types of instructors might be needed to staff the estimated number of
courses. However, because the financial system is not integrated with the curriculum system, these
estimates are incomplete (e.g., no reader expenditures are tied to courses, lab expenses are unknown) and
it is impossible to know how these TAS expenses are funded. For example, while it appears that Physics
has some permanent funds (i.e., $199,000 in Non-Recurrent and $548,000 in GSIs), as well as permanent
faculty salary savings (around $900,000), those funds actually reside with the Deans in Letters & Science
where they are combined with funding from EVCP and others, and then returned to Physics as a pooled
allocation. With our current systems, we cannot indicate what portion of EVCP TAS allocations support
these gateway courses or specifically track where EVCP TAS allocations go to support the curriculum.
~ ix ~
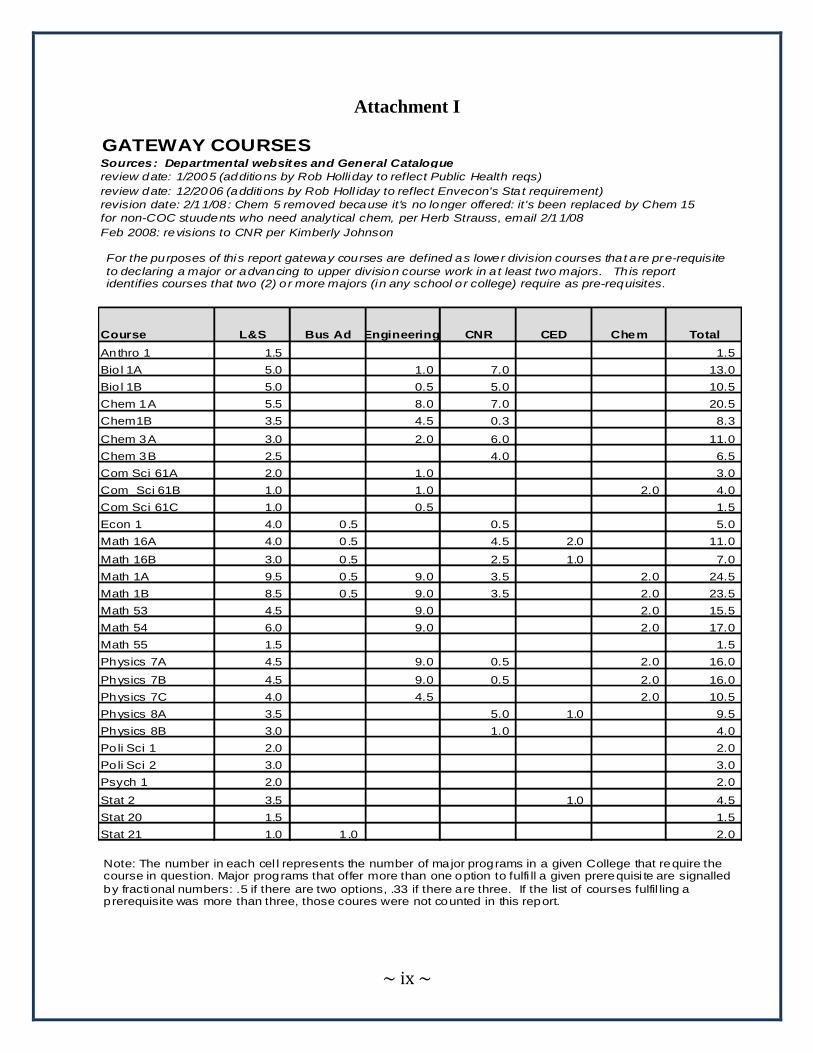
Attachment I
GATEWAY COURSESSources: Departmental websites and General Catalogue
review date: 1/2005 (additions by Rob Holliday to reflect Public Health reqs)
review date: 12/2006 (additions by Rob Holl iday to reflect Envecon's Stat requirement)
revision date: 2/11/08: Chem 5 removed because it's no longer offered: it's been replaced by Chem 15
for non-COC stuudents who need analytical chem, per Herb Strauss, email 2/11/08
Feb 2008: revisions to CNR per Kimberly Johnson
Course L&S Bus Ad Engineering CNR CED Chem Total
Anthro 1 1.5 1.5
Bio l 1A 5.0 1.0 7.0 13.0
Bio l 1B 5.0 0.5 5.0 10.5
Chem 1A 5.5 8.0 7.0 20.5
Chem1B 3.5 4.5 0.3 8.3
Chem 3A 3.0 2.0 6.0 11.0
Chem 3B 2.5 4.0 6.5
Com Sci 61A 2.0 1.0 3.0
Com Sci 61B 1.0 1.0 2.0 4.0
Com Sci 61C 1.0 0.5 1.5
Econ 1 4.0 0 .5 0.5 5.0
Math 16A 4.0 0 .5 4.5 2.0 11.0
Math 16B 3.0 0 .5 2.5 1.0 7.0
Math 1A 9.5 0 .5 9.0 3.5 2.0 24.5
Math 1B 8.5 0 .5 9.0 3.5 2.0 23.5
Math 53 4.5 9.0 2.0 15.5
Math 54 6.0 9.0 2.0 17.0
Math 55 1.5 1.5
Physics 7A 4.5 9.0 0.5 2.0 16.0
Physics 7B 4.5 9.0 0.5 2.0 16.0
Physics 7C 4.0 4.5 2.0 10.5
Physics 8A 3.5 5.0 1.0 9.5
Physics 8B 3.0 1.0 4.0
Po li Sci 1 2.0 2.0
Po li Sci 2 3.0 3.0
Psych 1 2.0 2.0
Stat 2 3.5 1.0 4.5
Stat 20 1.5 1.5
Stat 21 1.0 1 .0 2.0
Note: The number in each cel l represents the number of major programs in a given College that require the course in question. Major programs that offer more than one option to fulfi ll a given prerequisi te are signalled
by fractional numbers: .5 if there are two options, .33 if there are three. If the list of courses fulfil ling a prerequisite was more than three, those coures were not counted in this report.
For the purposes of this report gateway courses are defined as lower division courses that are pre-requisite
to declaring a major or advancing to upper division course work in a t least two majors. Th is report identifies courses that two (2) or more majors (in any school or college) require as pre-requisites.
~ x ~
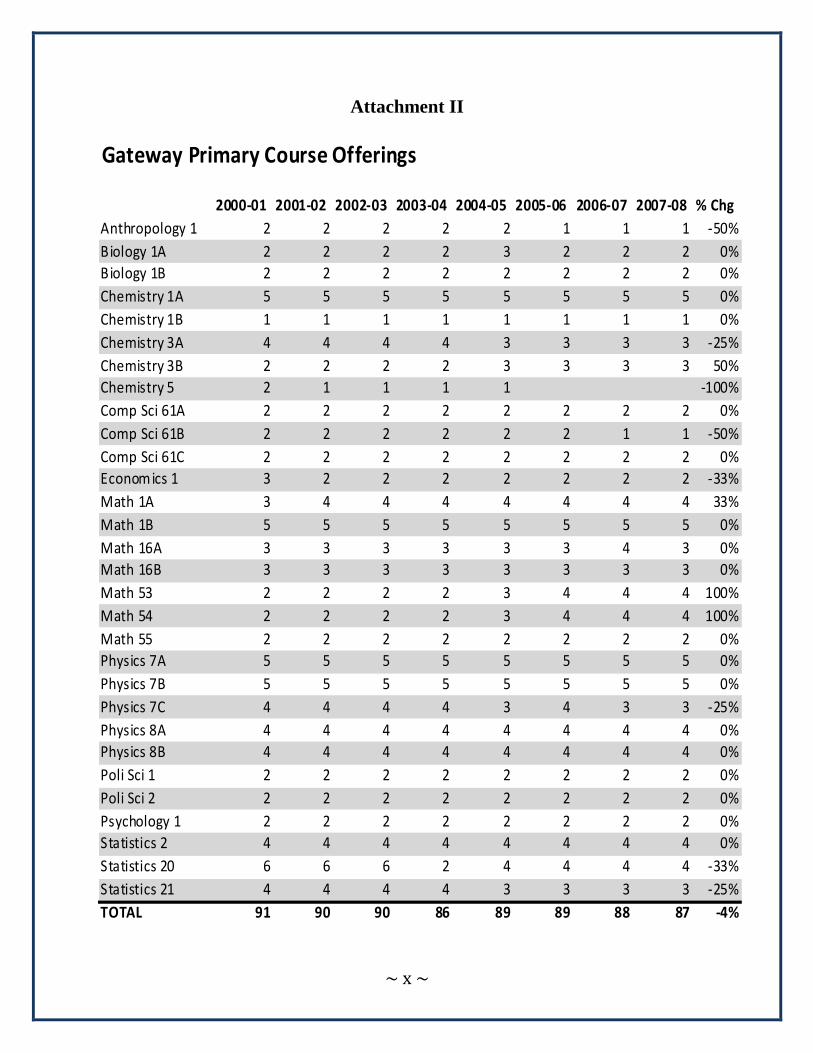
Attachment II
Gateway Primary Course Offerings
2000-01 2001-02 2002-03 2003-04 2004-05 2005-06 2006-07 2007-08 % Chg
Anthropology 1 2 2 2 2 2 1 1 1 -50%
Biology 1A 2 2 2 2 3 2 2 2 0%
Biology 1B 2 2 2 2 2 2 2 2 0%
Chemistry 1A 5 5 5 5 5 5 5 5 0%
Chemistry 1B 1 1 1 1 1 1 1 1 0%
Chemistry 3A 4 4 4 4 3 3 3 3 -25%
Chemistry 3B 2 2 2 2 3 3 3 3 50%
Chemistry 5 2 1 1 1 1 -100%
Comp Sci 61A 2 2 2 2 2 2 2 2 0%
Comp Sci 61B 2 2 2 2 2 2 1 1 -50%
Comp Sci 61C 2 2 2 2 2 2 2 2 0%
Economics 1 3 2 2 2 2 2 2 2 -33%
Math 1A 3 4 4 4 4 4 4 4 33%
Math 1B 5 5 5 5 5 5 5 5 0%
Math 16A 3 3 3 3 3 3 4 3 0%
Math 16B 3 3 3 3 3 3 3 3 0%
Math 53 2 2 2 2 3 4 4 4 100%
Math 54 2 2 2 2 3 4 4 4 100%
Math 55 2 2 2 2 2 2 2 2 0%
Physics 7A 5 5 5 5 5 5 5 5 0%
Physics 7B 5 5 5 5 5 5 5 5 0%
Physics 7C 4 4 4 4 3 4 3 3 -25%
Physics 8A 4 4 4 4 4 4 4 4 0%
Physics 8B 4 4 4 4 4 4 4 4 0%
Poli Sci 1 2 2 2 2 2 2 2 2 0%
Poli Sci 2 2 2 2 2 2 2 2 2 0%
Psychology 1 2 2 2 2 2 2 2 2 0%
Statistics 2 4 4 4 4 4 4 4 4 0%
Statistics 20 6 6 6 2 4 4 4 4 -33%
Statistics 21 4 4 4 4 3 3 3 3 -25%
TOTAL 91 90 90 86 89 89 88 87 -4%
~ xi ~
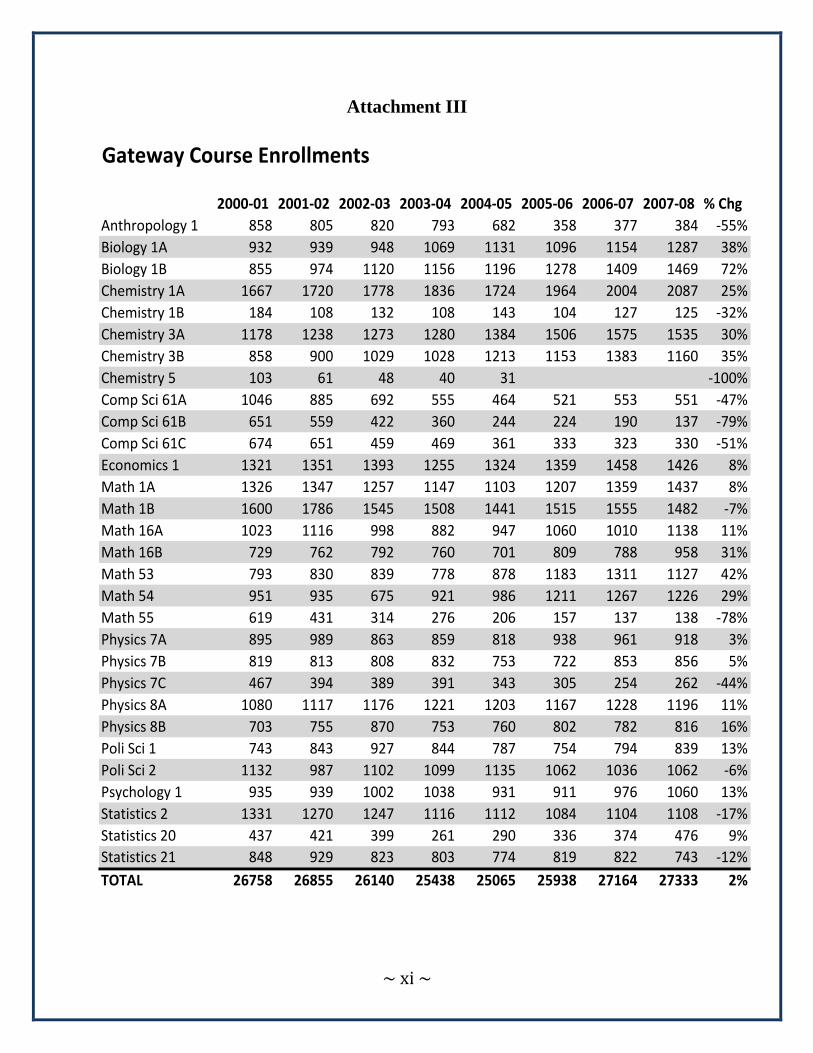
Attachment III
Gateway Course Enrollments
2000-01 2001-02 2002-03 2003-04 2004-05 2005-06 2006-07 2007-08 % Chg
Anthropology 1 858 805 820 793 682 358 377 384 -55%
Biology 1A 932 939 948 1069 1131 1096 1154 1287 38%
Biology 1B 855 974 1120 1156 1196 1278 1409 1469 72%
Chemistry 1A 1667 1720 1778 1836 1724 1964 2004 2087 25%
Chemistry 1B 184 108 132 108 143 104 127 125 -32%
Chemistry 3A 1178 1238 1273 1280 1384 1506 1575 1535 30%
Chemistry 3B 858 900 1029 1028 1213 1153 1383 1160 35%
Chemistry 5 103 61 48 40 31 -100%
Comp Sci 61A 1046 885 692 555 464 521 553 551 -47%
Comp Sci 61B 651 559 422 360 244 224 190 137 -79%
Comp Sci 61C 674 651 459 469 361 333 323 330 -51%
Economics 1 1321 1351 1393 1255 1324 1359 1458 1426 8%
Math 1A 1326 1347 1257 1147 1103 1207 1359 1437 8%
Math 1B 1600 1786 1545 1508 1441 1515 1555 1482 -7%
Math 16A 1023 1116 998 882 947 1060 1010 1138 11%
Math 16B 729 762 792 760 701 809 788 958 31%
Math 53 793 830 839 778 878 1183 1311 1127 42%
Math 54 951 935 675 921 986 1211 1267 1226 29%
Math 55 619 431 314 276 206 157 137 138 -78%
Physics 7A 895 989 863 859 818 938 961 918 3%
Physics 7B 819 813 808 832 753 722 853 856 5%
Physics 7C 467 394 389 391 343 305 254 262 -44%
Physics 8A 1080 1117 1176 1221 1203 1167 1228 1196 11%
Physics 8B 703 755 870 753 760 802 782 816 16%
Poli Sci 1 743 843 927 844 787 754 794 839 13%
Poli Sci 2 1132 987 1102 1099 1135 1062 1036 1062 -6%
Psychology 1 935 939 1002 1038 931 911 976 1060 13%
Statistics 2 1331 1270 1247 1116 1112 1084 1104 1108 -17%
Statistics 20 437 421 399 261 290 336 374 476 9%
Statistics 21 848 929 823 803 774 819 822 743 -12%
TOTAL 26758 26855 26140 25438 25065 25938 27164 27333 2%
~ xii ~
Attachment IV
Gateway Course - Secondary Sections
2000-01 2001-02 2002-03 2003-04 2004-05 2005-06 2006-07 2007-08 % Chg
Anthropology 1 64 60 62 64 56 26 28 22 -66%
Biology 1A 94 93 91 80 80 40 43 50 -47%
Biology 1B 94 94 100 121 132 148 172 172 83%
Chemistry 1A 64 63 64 65 63 70 72 71 11%
Chemistry 1B 8 4 5 4 6 4 5 5 -38%
Chemistry 3A 88 92 94 96 42 2 2 2 -98%
Chemistry 3B 57 61 64 65 43 4 3 3 -95%
Chemistry 5 5 4 3 2 2 -100%
Comp Sci 61A 62 58 42 42 38 36 40 42 -32%
Comp Sci 61B 55 48 32 30 20 14 14 10 -82%
Comp Sci 61C 50 50 32 34 30 26 28 28 -44%
Economics 1 58 57 57 44 46 46 49 53 -9%
Math 1A 56 58 56 48 48 52 60 60 7%
Math 1B 72 74 68 64 67 68 67 68 -6%
Math 16A 45 44 39 36 39 43 42 45 0%
Math 16B 33 33 34 33 32 33 33 39 18%
Math 53 33 32 33 31 38 49 52 46 39%
Math 54 39 39 28 36 40 49 53 55 41%
Math 55 28 20 14 12 10 8 8 7 -75%
Physics 7A 100 110 92 93 94 104 94 89 -11%
Physics 7B 88 91 88 92 80 80 82 84 -5%
Physics 7C 46 47 39 36 32 30 31 31 -33%
Physics 8A 65 76 102 120 122 122 122 118 82%
Physics 8B 55 54 54 56 76 80 80 78 42%
Poli Sci 1 33 34 37 37 36 32 32 32 -3%
Poli Sci 2 45 41 44 48 52 43 40 40 -11%
Psychology 1 45 46 47 48 47 44 48 48 7%
Statistics 2 40 44 41 39 38 36 33 31 -23%
Statistics 20 12 12 12 8 8 9 9 12 0%
Statistics 21 30 29 27 29 25 26 23 20 -33%
TOTAL 1564 1568 1501 1513 1442 1324 1365 1361 -13%
~ xiii ~
Attachment V
Gateway Primary Course Offerings - % Taught by Temporary Academic Staff
2000-2001 2001-2002 2002-2003 2003-2004 2004-2005 2005-2006 2006-2007 2007-2008 % Chg
Anthropology 1 100% 100% 50% 25% 0% 0% 100% 0% -100%
Biology 1A 0% 38% 38% 29% 50% 38% 38% 38% 38%
Biology 1B 0% 0% 17% 17% 17% 17% 25% 29% 29%
Chemistry 1A 50% 20% 60% 60% 43% 47% 53% 0% -50%
Chemistry 1B 33% 0% 0% 100% 100% 0% 0% 0% -33%
Chemistry 3A 0% 0% 50% 100% 33% 0% 33% 33% 33%
Chemistry 3B 100% 100% 50% 50% 33% 0% 33% 100% 0%
Chemistry 5 0% 0% 0% 0% 0% 0%
Comp Sci 61A 25% 50% 0% 0% 0% 0% 0% 0% -25%
Comp Sci 61B 0% 0% 0% 0% 0% 0% 0% 0% 0%
Comp Sci 61C 0% 25% 25% 0% 0% 0% 0% 0% 0%
Economics 1 0% 50% 50% 50% 50% 100% 100% 100% 100%
Math 1A 0% 25% 25% 50% 0% 0% 0% 0% 0%
Math 1B 0% 0% 0% 0% 20% 20% 0% 0% 0%
Math 16A 0% 0% 33% 0% 0% 0% 13% 33% 33%
Math 16B 0% 0% 0% 0% 0% 0% 0% 0% 0%
Math 53 0% 0% 50% 0% 0% 0% 0% 0% 0%
Math 54 0% 0% 0% 0% 0% 0% 0% 0% 0%
Math 55 0% 0% 0% 0% 0% 0% 50% 0% 0%
Physics 7A 20% 60% 40% 0% 0% 20% 20% 0% -20%
Physics 7B 80% 20% 40% 40% 20% 0% 40% 20% -60%
Physics 7C 25% 50% 25% 25% 33% 0% 0% 0% -25%
Physics 8A 75% 75% 0% 100% 100% 0% 75% 25% -50%
Physics 8B 50% 100% 100% 50% 75% 25% 25% 0% -50%
Poli Sci 1 0% 100% 0% 50% 0% 0% 50% 25% 25%
Poli Sci 2 0% 0% 0% 50% 50% 25% 0% 0% 0%
Psychology 1 0% 0% 0% 0% 0% 50% 0% 0% 0%
Statistics 2 50% 0% 50% 75% 75% 75% 75% 75% 25%
Statistics 20 33% 50% 33% 50% 38% 25% 100% 75% 42%
Statistics 21 50% 75% 75% 75% 33% 33% 33% 67% 17%
TOTAL 27% 34% 32% 37% 28% 17% 30% 22% -5%
~ xiv ~
Attachment VI
Gateway Secondary Sections - % Taught by Temporary Academic Staff
2000-2001 2001-2002 2002-2003 2003-2004 2004-2005 2005-2006 2006-2007 2007-2008 % Chg
Anthropology 1 100% 100% 100% 100% 100% 100% 100% 100% 0%
Biology 1A 100% 100% 100% 65% 100% 100% 100% 100% 0%
Biology 1B 96% 98% 98% 98% 97% 99% 99% 98% 3%
Chemistry 1A 100% 100% 98% 100% 100% 100% 100% 100% 0%
Chemistry 1B 100% 100% 100% 100% 100% 100% 100% 100% 0%
Chemistry 3A 100% 100% 100% 100% 100% 100% 100% 100% 0%
Chemistry 3B 100% 100% 100% 100% 100% 100% 100% 100% 0%
Chemistry 5 100% 100% 100% 100% 100% -100%
Comp Sci 61A 100% 100% 100% 100% 100% 100% 100% 100% 0%
Comp Sci 61B 98% 100% 100% 100% 100% 100% 100% 100% 2%
Comp Sci 61C 100% 100% 100% 100% 100% 100% 100% 100% 0%
Economics 1 100% 100% 100% 100% 100% 100% 100% 100% 0%
Math 1A 100% 100% 100% 100% 100% 100% 100% 100% 0%
Math 1B 100% 100% 100% 100% 100% 100% 100% 100% 0%
Math 16A 100% 100% 100% 100% 100% 100% 100% 100% 0%
Math 16B 100% 100% 100% 100% 100% 100% 100% 100% 0%
Math 53 100% 100% 100% 100% 100% 100% 100% 100% 0%
Math 54 100% 100% 100% 100% 100% 100% 100% 100% 0%
Math 55 100% 100% 100% 100% 100% 100% 100% 100% 0%
Physics 7A 100% 100% 100% 99% 100% 100% 100% 100% 0%
Physics 7B 100% 100% 100% 98% 100% 100% 100% 100% 0%
Physics 7C 100% 100% 100% 100% 100% 100% 100% 100% 0%
Physics 8A 100% 100% 100% 100% 100% 100% 100% 100% 0%
Physics 8B 100% 100% 100% 100% 100% 100% 100% 100% 0%
Poli Sci 1 100% 100% 100% 100% 100% 100% 100% 100% 0%
Poli Sci 2 100% 100% 100% 100% 100% 100% 100% 100% 0%
Psychology 1 100% 100% 100% 100% 100% 100% 100% 100% 0%
Statistics 2 100% 100% 100% 100% 100% 100% 100% 100% 0%
Statistics 20 100% 100% 100% 100% 100% 100% 100% 100% 0%
Statistics 21 100% 100% 100% 100% 100% 100% 100% 100% 0%
TOTAL 100% 100% 100% 98% 100% 100% 100% 100% 0%
~ xv ~
Attachment VII
PHYSICS CURRICULUM - PRIMARY COURSES OFFERED
Gat
eway
Co
urs
e
Maj
or
Re
q (
Ph
ysic
s)
Maj
or
Re
q (
Oth
er D
ept)
Pre
req
uis
ite
fo
r M
ajo
r
Bre
adth
Req
uir
emen
t
Serv
ice
Co
urs
es
Ind
epen
den
t St
ud
y
Elec
tive
Elec
tive
- N
o D
eg C
red
it
Ho
no
rs M
ajo
r R
eq
(P
hys
ics)
GSI
Inst
ruct
ion
in T
eac
hin
g
2000
-200
1
2001
-200
2
2002
-200
3
2003
-200
4
2004
-200
5
2005
-200
6
2006
-200
7
2007
-200
8
% C
hg
PHYSICS 007A x x x x x x 5 5 5 5 5 5 5 5 0%
PHYSICS H007A x x x x x 2 2 2 2 2 1 1 1 -50%
PHYSICS 007B x x x x x x 5 5 5 5 5 5 5 5 0%
PHYSICS H007B x x x x x 2 2 2 2 2 2 2 2 0%
PHYSICS 007C x x x x x x 4 4 4 4 3 4 3 3 -25%
PHYSICS H007C x x x x x 2 2 2 2 2 2 2 0%
PHYSICS 008A x x x x x x 4 4 4 4 4 4 4 4 0%
PHYSICS 008B x x x x x x 4 4 4 4 4 4 4 4 0%
PHYSICS 010/C010 x x 2 2 2 2 2 2 2 2 0%
PHYSICS 021/C021 x x 1 2 1 1
PHYSICS 024 x 5 9 1 2 3 3 3 5 0%
PHYSICS 039 x 3 2 3
PHYSICS 084 x 1 2 2 1
PHYSICS 098 x 4 2 4 4
LOWER DIVISION TOTAL 35 41 35 34 35 38 37 41 17%
% TOTAL 26% 28% 25% 24% 25% 25% 25% 31% 5%
TOTAL PRIMARY COURSE OFFERINGS 137 144 139 141 140 151 148 134 -2%
PHYSICS 100 x x 1 1 1 1 1 1 1 1 0%
PHYSICS 105 x x 4 3 4 2 2 4 4 3 -25%
PHYSICS 108* x 1 1 -100%
PHYSICS 110A x x 3 4 4 3 4 3 3 3 0%
PHYSICS 110B 3 2 2 2 2 2 2 2 -33%
PHYSICS 111 x x 12 13 11 12 11 11 9 9 -25%
PHYSICS 112 x x 4 3 3 3 3 4 4 4 0%
PHYSICS 129 x x 1
PHYSICS 129A x x 1 1 1 1 1 1 1 -100%
PHYSICS 129B x x 1
PHYSICS 132 x 1 1 1 1
PHYSICS 137A x x 4 4 4 4 4 4 4 4 0%
PHYSICS 137B x x 4 4 4 3 3 4 4 4 0%
PHYSICS 138 x x 1 1 1
PHYSICS 139 x x 1 1 1 1 1 1 1 1 0%
PHYSICS 141A x x 2 2 2 2 2 2 2 2 0%
PHYSICS 141B x x 1 1 1 1 1 1 1 1 0%
PHYSICS 142 x x 1 1 1
PHYSICS C160A x 1 1 1 -100%
PHYSICS C160B x 1 1 -100%
PHYSICS C161 x 1 1 1 1 1 1
PHYSICS 177 x 1 1 1 1
PHYSICS C191 x 2 1 1 1
PHYSICS H190 x 1 1 1 1 1 1 1 1 0%
PHYSICS 198 x 5 2 3 4
UPPER DIVISION TOTAL 44 46 43 42 44 46 42 44 0%
% TOTAL 32% 32% 31% 30% 31% 30% 28% 33% 1%
TOTAL PRIMARY COURSE OFFERINGS 137 144 139 141 140 151 148 134 -2%

~ xvi ~
Gat
eway
Cou
rse
Maj
or R
eq (P
hysi
cs)
Maj
or R
eq (O
ther
Dep
t)
Prer
equi
site
for M
ajor
Brea
dth
Requ
irem
ent
Serv
ice
Cour
ses
Inde
pend
ent S
tudy
Elec
tive
Elec
tive
- No
Deg
Cre
dit
Hon
ors
Maj
or R
eq (P
hysi
cs)
GSI
Inst
ruct
ion
in T
each
ing
2000
-200
1
2001
-200
2
2002
-200
3
2003
-200
4
2004
-200
5
2005
-200
6
2006
-200
7
2007
-200
8
% C
hg
PHYSICS C201 x 1 2 1
PHYSICS C203 x 1 1
PHYSICS 205A x 1 1 1
PHYSICS 205B x 1 1
PHYSICS 208A* x 1 1 1 1 1 1 -100%
PHYSICS 208B* x 1 1 -100%
PHYSICS 209 x 1 1 1 1 1 1 1
PHYSICS 210A* x 1 -100%
PHYSICS 210B* x 1 -100%
PHYSICS 211 x 1 1 1 1 1 1 1 1 0%
PHYSICS 212 x 1 1 1 1 1 1 1 1 0%
PHYSICS 216 x 1 1 1 1
PHYSICS 221A x 1 1 1 1 1 1 1 1 0%
PHYSICS 221B x 1 1 1 1 1 1 1 1 0%
PHYSICS 222* x 1
PHYSICS 223* x 1 1 1 -100%
PHYSICS 226 x 1 1 1 1 1 1 1 1 0%
PHYSICS C228 x 1 1 1 1 1
PHYSICS 229A x 1 1 1 1 1 1 1 -100%
PHYSICS 229B x 1 1 1 1 1 1 1 -100%
PHYSICS 229C x 1 1 1 1 1 1 1 -100%
PHYSICS 230A x 1 1 1 1 1 1 1 -100%
PHYSICS 230B x 2 1 1 1 1 1 1 -100%
PHYSICS 231 x 1 1 1 1 1 1 1 1 0%
PHYSICS 232A x 1
PHYSICS 232B x 1
PHYSICS 233A x 1
PHYSICS 233B x 1
PHYSICS 234A x 1
PHYSICS 234B x 1
PHYSICS 240A x 1 1 1 1 1 1 1 1 0%
PHYSICS 240B x 1 1 1 1 1 1 1 1 0%
PHYSICS 242A x 1 1 1 1
PHYSICS 242B x 1 1 1
PHYSICS 250 x 1 2 5 3 4 4 6 2 100%
PHYSICS 251 x 1 1 2 1 1 1 1
PHYSICS C252 x 1 -100%
PHYSICS C254 x 1 1 1
PHYSICS C285 x 1 1 2 1 1 1 2 100%
PHYSICS 290B x 2 2 2 2 2 2 2 2 0%
PHYSICS 290C/C290C x 2 4 4 4 3
PHYSICS 290D x 1 1 1 1
PHYSICS 290E x 2 2 2 2 2 2 2 2 0%
PHYSICS 290F x 2 2 3 2 1 2 2 2 0%
PHYSICS 290G x 2 2 2 2 2 2 2 -100%
PHYSICS 290H x 1
PHYSICS 290K x 2 2 2 2 2 2 2 2 0%
PHYSICS 290L x 1 -100%
PHYSICS 290N x 1 2
PHYSICS 290P x 2 2 2 2 2 2 2 2 0%
PHYSICS 290S x 14 12 13 12 7 11 13 6 -57%
PHYSICS 290T x 1
PHYSICS 290X x 2 2 2 2 4 4 4 -100%
PHYSICS 290Y x 2 2 2 2 2 2 2 -100%
PHYSICS 290Z x 4 6 6 6 6 5 4 4 0%
GRADUATE TOTAL 58 57 61 65 61 67 69 49 -16%
% TOTAL 42% 40% 44% 46% 44% 44% 47% 37% -14%
TOTAL PRIMARY COURSE OFFERINGS 137 144 139 141 140 151 148 134 -2%
* Course withdrawn.
~ xvii ~
Attachment VIII
PHYSICS CURRICULUM - SECONDARY SECTIONS OFFERED
Gat
ewa
y C
ou
rse
Ma
jor
Re
q (P
hys
ics)
Maj
or
Re
q (
Oth
er D
ept
)
Pre
req
uis
ite
fo
r M
ajo
r
Bre
ad
th R
equ
irem
en
t
Serv
ice
Co
urs
es
Ind
ep
end
ent
Stud
y
Ele
ctiv
e
Ele
ctiv
e -
No
De
g C
red
it
Hon
ors
Maj
or
Re
q (
Ph
ysic
s)
GSI
Inst
ruct
ion
in T
eac
hin
g
20
00-2
001
20
01-2
00
2
200
2-20
03
200
3-2
004
200
4-2
005
20
05-2
00
6
200
6-20
07
200
7-2
008
% C
hg
PHYSICS 007A x x x x x x 50 55 46 47 47 52 47 45 -10%
PHYSICS H007A x x x x x 5 6 6 4 7 2 2 2 -60%
PHYSICS 007B x x x x x x 44 46 44 46 40 40 41 42 -5%
PHYSICS H007B x x x x x 7 6 6 4 5 4 4 4 -43%
PHYSICS 007C x x x x x x 43 46 34 32 29 27 31 31 -28%
PHYSICS H007C x x x x x 19 24 19 17 17 21 22 16%
PHYSICS 008A x x x x x x 58 54 64 60 61 61 61 59 2%
PHYSICS 008B x x x x x x 57 43 56 47 38 40 40 39 -32%
PHYSICS 010/C010 x x 9 9 10 10 11 18 26 32 256%
PHYSICS 021/C021 x x 1 1 1
LOWER DIVISION TOTAL 292 290 285 267 238 262 273 277 -5%
% TOTAL 77% 77% 78% 77% 76% 76% 78% 78% 1%
TOTAL SECONDARY SECTIONS 380 378 366 346 314 344 352 357 -6%
PHYSICS 105 x x 9 6 8 5 4 8 8 6 -33%
PHYSICS 108 x 2 2 -100%
PHYSICS 110A x x 6 8 8 7 8 6 6 6 0%
PHYSICS 110B 7 4 4 5 5 4 4 4 -43%
PHYSICS 111 x x 2 2 2 2 2 2 2 2 0%
PHYSICS 112 x x 8 6 6 6 6 8 8 8 0%
PHYSICS 129 x x 2
PHYSICS 129A x x 1 2 2 2 1 1 1 -100%
PHYSICS 129B x x 1
PHYSICS 132 x 2 2 1 1
PHYSICS 137A x x 8 8 8 9 9 8 8 8 0%
PHYSICS 137B x x 9 8 9 6 6 8 8 8 -11%
PHYSICS 138 x x 1 1 1
PHYSICS 139 x x 2 1 1 1 1 1 2 2 0%
PHYSICS 141A x x 4 4 3 3 4 3 4 4 0%
PHYSICS 141B x x 2 2 1 1 1 1 2 2 0%
PHYSICS 142 x x 2 1 1
PHYSICS C160A x 1 1 -100%
PHYSICS C160B x 2 2 -100%
PHYSICS C161 x 2 2 2 1 2 2
PHYSICS 177 x 1 1 1 1
PHYSICS C191 x 1
UPPER DIVISION TOTAL 63 60 57 53 50 55 56 56 -11%
% TOTAL 17% 16% 16% 15% 16% 16% 16% 16% -1%
TOTAL SECONDARY SECTIONS 380 378 366 346 314 344 352 357 -6%
~ xviii ~
Gat
ewa
y C
ou
rse
Ma
jor
Re
q (P
hys
ics)
Maj
or
Re
q (
Oth
er D
ept
)
Pre
req
uis
ite
fo
r M
ajo
r
Bre
ad
th R
equ
irem
en
t
Serv
ice
Co
urs
es
Ind
ep
end
ent
Stud
y
Ele
ctiv
e
Ele
ctiv
e -
No
De
g C
red
it
Hon
ors
Maj
or
Re
q (
Ph
ysic
s)
GSI
Inst
ruct
ion
in T
eac
hin
g
20
00-2
001
20
01-2
00
2
200
2-20
03
200
3-2
004
200
4-2
005
20
05-2
00
6
200
6-20
07
200
7-2
008
% C
hg
PHYSICS C201 x 1
PHYSICS 205A x 2 1 1
PHYSICS 205B x 1 1
PHYSICS 208A x 1 1 1 1 1 1 -100%
PHYSICS 208B x 2 1 -100%
PHYSICS 209 x 2 2 2 3 2 2 2
PHYSICS 210A x 2 -100%
PHYSICS 210B x 2 -100%
PHYSICS 211 x 2 2 2 1 2 2 2 2 0%
PHYSICS 212 x 2 1 1 1 1 1 1 1 -50%
PHYSICS 216 x 2 2 1
PHYSICS 221A x 1 2 2 2 2 2 2 2 100%
PHYSICS 221B x 2 2 2 2 2 3 2 2 0%
PHYSICS 222 x 1
PHYSICS 223 x 1 1 -100%
PHYSICS 226 x 1 1 1 1 1 1 1 1 0%
PHYSICS 229A x 1 1 1 1 1 1 1 -100%
PHYSICS 229B x 1 1 1 1 1 1 1 -100%
PHYSICS 229C x 1 1 1 1 1 1
PHYSICS 230A x 1 1 1 1 1 1 1 -100%
PHYSICS 230B x 1 1 1 1 1 1 1 -100%
PHYSICS 231 x 2 2 1 1 1 1 1 1 -50%
PHYSICS 232A x 1
PHYSICS 232B x 2
PHYSICS 233A x 1
PHYSICS 233B x
PHYSICS 234A x 1
PHYSICS 234B x 1
PHYSICS 240A x 1 1 1 1 1 1 1 1 0%
PHYSICS 240B x 2 1 1 1 1 1 1 1 -50%
PHYSICS 242A x 1 1 2 2
PHYSICS 242B x 1 1 1
PHYSICS 300 x 2 2 4 3 3 3 3
GRADUATE TOTAL 25 28 24 26 26 27 23 24 -4%
% TOTAL 7% 7% 7% 8% 8% 8% 7% 7% -1%
TOTAL SECONDARY SECTIONS 380 378 366 346 314 344 352 357 -6%

~ xix ~
Appendix II – Kuali Student Information System – Initial
Listing of Course Attributes