UNIVERSIDAD COMPLUTENSE DE...
181
UNIVERSIDAD COMPLUTENSE DE MADRID FACULTAD DE CIENCIAS QUÍMICAS Departamento de Bioquímica y Biología Molecular I TESIS DOCTORAL Análisis biofísico y reconstitución en microesferas funcionalizadas de FtsZ, proteína esencial en la división Biophysical analysis and reconstitution of functionalized microbeads of FtsZ, and essential protein in bacterial cell division MEMORIA PARA OPTAR AL GRADO DE DOCTOR PRESENTADA POR Rubén Ahijado Guzmán Directores Germán Rivas Caballero Carlos Alfonso Botello Begoña Monterroso Marco Madrid, 2013 © Rubén Ahijado Guzmán, 2012
Transcript of UNIVERSIDAD COMPLUTENSE DE...

UNIVERSIDAD COMPLUTENSE DE MADRID
FACULTAD DE CIENCIAS QUÍMICAS
Departamento de Bioquímica y Biología Molecular I
TESIS DOCTORAL
Análisis biofísico y reconstitución en microesferas funcionalizadas de FtsZ, proteína esencial en la división
Biophysical analysis and reconstitution of functionalized microbeads of FtsZ, and
essential protein in bacterial cell division
MEMORIA PARA OPTAR AL GRADO DE DOCTOR
PRESENTADA POR
Rubén Ahijado Guzmán
Directores
Germán Rivas Caballero Carlos Alfonso Botello
Begoña Monterroso Marco
Madrid, 2013 © Rubén Ahijado Guzmán, 2012

Análisis Biofísico y Reconstitución en
Microesferas Funcionalizadas de FtsZ,
Proteína Esencial en la División
Rubén Ahijado Guzmán

1

2
Universidad Complutense de Madrid
Facultad de Ciencias Químicas
Departamento de Bioquímica y Biología Molecular I
Análisis Biofísico y Reconstitución en Microesferas Funcionalizadas de FtsZ,
Proteína Esencial en la División
Biophysical Analysis and Reconstitution on Functionalized Microbeads of FtsZ, an Essential protein
in Bacterial Cell Division
Trabajo presentado para optar al grado de Doctor
Rubén Ahijado Guzmán
Directores
Germán Rivas Caballero, Carlos Alfonso Botello y Begoña Monterroso Marco
Centro de Investigaciones Biológicas-Consejo Superior de Investigaciones Científicas
Madrid 2012

3

4
A mis Padres

5

6

7

8
INDICE GENERAL
1. Introducción
1.1. La Maquinaria de División Bacteriana en Escherichia coli 1
1.1.1. El proto-anillo de Escherichia coli 3
1.1.1.1. FtsZ de E. coli 4
1.1.1.2. ZipA de E. coli 6
1.2. Oligomerización y ensamblaje de FtsZ 7
1.3. Interacción entre elementos del proto-anillo: FtsZ y ZipA 11
1.4. Reconstitución en sistemas biomiméticos de membrana 12
2. Objetivos 25
3. Métodos 27
3.1. Dispersión de luz estática 27
3.2. Dispersión de luz dinámica 29
3.3. Velocidad de sedimentación 31
3.4. Equilibrio de sedimentación 33
3.5. Espectroscopía de correlación de fluorescencia 34
3.6. Espectroscopía Raman aumentada por superficie 35
4. Capítulos
4.1. CHAPTER 1: Mg2+-linked self-assembly of FtsZ in the presence of GTP or a GTP
analog involves the concerted formation of a narrow distribution of oligomeric
species 41
4.2. APENDIX 1 71

9
4.3. CHAPTER 2: Different Response of GTP- and GMPCPP-FtsZ Polymers to KCl
Concentration. 79
4.4. CHAPTER 3: Reconstitution, self-assembly and SERS-based detection of the
interactions between the essential division FtsZ protein and bacterial membrane
elements. 95
4.5. APENDIX 2 119
4.6. APENDIX 3 121
5. Discusión integradora 147
6. Aportaciones fundamentales 159
7. Conclusiones 164
8. Publicaciones durante la tesis 166

10

11

1
1.-INTRODUCCIÓN
1.1.-La maquinaria de división bacteriana en Escherichia coli
Escherichia coli es una bacteria gram negativa ampliamente distribuida en los
ecosistemas naturales. Esta característica, refleja su elevada capacidad para adaptar sus
funciones esenciales al medio en el que vive. Así, la bacteria, es capaz de adaptar el
proceso esencial de su división celular al entorno, con el fin de asegurar su supervivencia.
Durante el proceso de división, la bacteria crece hasta alcanzar un tamaño determinado.
Llegado a este punto, se produce la replicación del único cromosoma de Escherichia coli. A
continuación, durante el proceso de división, aparece una invaginación en el punto medio
de la bacteria generado por la maquinaria de división, la cual ejerce una fuerza
constrictora sobre la membrana. Este proceso, finaliza con la división de la bacteria, dando
lugar a dos células hijas.
El motor de la maquinaria de división bacteriana, es un complejo macromolecular
dinámico que forma un anillo situado en el punto medio de la bacteria. Este anillo de
división o divisoma, está formado por al menos 15 proteínas citoplasmáticas, de
membrana o periplasmáticas. En Escherichia coli, los componentes del divisoma son
reclutados de acuerdo a un orden lineal y estricto, lo que determina un proceso de
ensamblaje paso a paso en el siguiente orden: FtsZ > ZipA, FtsA > ZapA > FtsE, FtsX > FtsK
> FtsQ > FtsB, FtsL > FtsW > FtsI > FtsN > AmiC > EnvC. Como vemos en esta secuencia de
interacciones, FtsZ juega un papel esencial para la posterior localización del resto de
proteínas que intervienen en la división celular.
Durante el ensamblaje del anillo de división, podemos distinguir varias etapas como se
describe esquemáticamente en la Figura 1A. El autoensamblaje de la proteína
citoplasmática FtsZ para formar proto-filamentos. La formación del primer complejo
multiproteico o proto-anillo, formado por las proteínas FtsZ, ZipA y FtsA. Donde FtsA es
una proteína citoplasmática anfitrópica, ZipA es una proteína de membrana que ancla los
complejos de FtsZ a la membrana y FtsZ es una proteína citoplasmática. Por último, y

2
siguiendo un orden secuencial, se unen al proto-anillo el resto de proteínas citadas
anteriormente [1, 2].
Figura 1. El ensamblaje del proto-anillo se produce en la parte interior de la membrana
citoplasmática. (A) Al proto-anillo se van sumando de forma secuencial el resto de proteínas de la
maquinaria de división para dar lugar al divisoma o anillo de división. El anillo de división produce una
fuerza constrictora, que finaliza con la división total de la bacteria para dar lugar a dos bacterias hijas.
(B) En la etapa temprana, el proto-anillo (FtsZ (rojo), ZipA (verde) y FtsA (azul)) se ensambla en el
punto medio de la bacteria. Una vez formado el proto-anillo, se reclutan al sitio de división el resto de
proteínas esenciales que forman el divisoma.

3
1.1.1.-El proto-anillo de Escherichia coli
Durante la formación del proto-anillo, se produce la localización de FtsZ en el sitio
de división. La localización de FtsZ, depende de dos mecanismos de inhibición, el sistema
MinCDE y el sistema de oclusión del nucleoide (Noc) [3]. El modelo de oclusión del
nucleoide se refiere a un mecanismo inhibitorio, mediante el cual, se previene que la
división ocurra en las inmediaciones del nucleoide [4]. En E. coli el sistema MinCDE está
formado por tres proteínas, MinC, MinD y MinE. MinC es realmente el inhibidor de la
polimerización de FtsZ. MinD es una proteína de membrana con actividad GTPasa que
interacciona con MinC. Finalmente, MinE, se requiere para la oscilación polo a polo del
complejo MinCD, de manera que resulta una menor concentración de MinC en la región
central de la bacteria, permitiendo así, la polimerización de FtsZ en este lugar [5, 6].
Una vez que FtsZ se encuentra en el sitio de división, se produce el ensamblaje con
ZipA y FtsA, para formar el proto-anillo. El proto-anillo, es el primer complejo multi-
proteico formado durante el proceso de división, y su correcto ensamblaje es de esencial
importancia para la posterior formación del anillo maduro de división o divisoma. ZipA, se
encuentra anclada a la membrana y FtsA se encuentra asociada a ella ya que es una
proteína anfitrópica. El ensamblaje de ZipA y FtsA en el proto-anillo, es dependiente
únicamente de FtsZ [3]. Ambas proteínas, (ZipA y FtsA) estabilizan el proto-anillo mediante
su interacción con la región C-terminal de FtsZ, esto sugiere que ZipA y FtsA sirven como
anclaje dinámico de FtsZ a la membrana [7, 8, 9].
Como se ha descrito, y puede verse esquemáticamente en la Figura 1B, las
interacciones macromoleculares implicadas en la formación del proto-anillo suceden en el
entorno citoplasmático y de la membrana interna. Por este motivo, es esencial el estudio
biofísico de las interacciones macromoleculares involucradas tanto en disolución como en
sistemas modelo de membrana.

4
1.1.1.1.-FtsZ de E. coli
FtsZ es la proteína mayoritaria en el anillo de división, se encuentra soluble en el
citoplasma de procariotas y en algunos orgánulos celulares como cloroplastos o
mitocondrias. FtsZ, tiene gran homología estructural con la tubulina eucariota [10, 11]. Tiene
actividad GTPasa y su masa molecular es de 40.3 kDa [12, 13]. Está formada por dos
dominios alrededor de una hélice central. El dominio N-terminal, que interacciona con
otra subunidad de FtsZ, para formar un dominio de actividad GTPasa, y el dominio C-
terminal, de unión con ZipA y FtsA para formar el proto-anillo.
Figura 2. Modelo teórico de la estructura de la proteína FtsZ de E. coli cedido por el grupo de modelado
molecular del CBM-CSIC (Prof. Paulino Gómez Puertas). En la imagen se indican las principales regiones. En
azul oscuro, el dominio N-terminal, y en rojo, el dominio C-terminal de interacción con ZipA y FtsA.
FtsZ es la proteína encargada del inicio en el proceso de división, y es capaz de formar
proto-filamentos. El proto-filamento es una estructura dinámica que esta en continua
actividad mediante procesos de polimerización y despolimerización. FtsZ forma una red

5
filamentosa en el citoplasma bacteriano actuando de soporte estructural o citoesqueleto
[14]. Actúa como estructura de andamiaje sobre la cual se van anclando el resto de
componentes de la maquinaria de división. Cuando el proto-filamento de FtsZ
interacciona con ZipA y FtsA se forma el proto-anillo y por tanto se inicia la formación del
divisoma [15, 16].
FtsZ y agentes antibióticos. FtsZ, es una de las dianas terapéuticas más estudiadas en el
desarrollo de nuevos agentes antibacterianos activos contra bacterias resistentes a
antibióticos [17]. Existen inhibidores de la actividad de FtsZ que se han obtenido
centrándose en el conocimiento de las características de esta proteína, su función e
interacciones. Las zantrinas son inhibidores análogos de GTP [18]. El compuesto PC190723
actúa como inhibidor de FtsZ al interaccionar con una región de la proteína análoga al sitio
de unión del taxol en tubulina. La viriditoxina, un derivado natural dimérico del ácido
naftalénico, es un inhibidor de la polimerización y de la actividad GTPasa de FtsZ [19].
Algunos análogos bromados de nucleótido, Br-GTP, inhiben la actividad GTPasa de FtsZ
incluso en su forma polimérica [20]. La sanguinarina, un alcaloide antimicrobiano, además
de despolimerizar los filamentos tiene un efecto desestabilizador sobre el proto-anillo [21].
Sin embargo, a pesar de su demostrado efecto inhibidor, estos compuestos presentan una
actividad antibiótica muy débil o resultan potencialmente tóxicos para las células
eucariotas.
Aunque FtsZ es la proteína más estudiada de la maquinaria de división, existen
gran cantidad de cuestiones sin resolver, algunas de ellas son: ¿Es el anillo de división una
estructura continua? ¿Son los proto-filamentos de FtsZ, los encargados de ejercer la
fuerza de constricción? o ¿es solamente una estructura de andamiaje para el resto de la
maquinaria de división? ¿Tiene algún papel el gran polimorfismo de FtsZ en la dinámica de
los polímeros? ¿Cuál es la naturaleza de las interacciones laterales observadas? Además
de la gran cantidad de cuestiones abiertas, los resultados obtenidos a lo largo de la
literatura de sus propiedades a partir de medidas bioquímicas y biofísicas generan gran
cantidad de controversias, probablemente, al menos en parte, debidas, como estudiamos
y presentamos en esta tesis, a diferencias en las condiciones experimentales empleadas.

6
1.1.1.2.-ZipA de E. coli
ZipA de Escherichia coli es una proteína esencial en la división. La masa molecular
de ZipA es de 36.4 KDa, y su función es la de mantener anclado los filamentos de FtsZ a la
membrana. Además, ésta proteína no está conservada fuera de la familia de las γ-
proteobacterias [22]. Tiene una hélice N-terminal transmembrana asociada a la cara interna
de la membrana bacteriana. Un dominio P/Q desestructurado que es rico en prolina y
glutamina, que sirve de conexión entre el fragmento transmembrana y el dominio
globular C-terminal. El dominio globular C-terminal, se localiza en el citoplasma, y cuando
ZipA es reclutada al proto-anillo, lo hace mediante una interacción directa entre este
dominio y el dominio C-terminal de FtsZ siguiendo un mecanismo que no se conoce aún
de manera detallada [23, 24]. Además, como se describe en Martos et al. (2010) [25], la
heteroasociación de ZipA con FtsZ en disolución y en presencia de GDP es dependiente de
la concentración de Mg2+ (ver Apendice 2).
Figura 3. Modelo de la estructura de la proteína ZipA de E. coli tomado de la referencia 9, PDB 1fsx. En la
imagen se indican las principales regiones, el dominio N-terminal o fragmento transmembrana y dominio C-
terminal de interacción con FtsZ.
Para su estudio, tanto en disolución como en sistemas reconstituidos, la utilización de
mutantes solubles es de gran ayuda. Se han utilizado dos mutantes solubles de ZipA, s1 y
s2-ZipA [25]. En el caso de s1-ZipA la proteína carece del fragmento transmembrana N-
7
terminal desde el aminoácido 1 hasta el 25. En el caso del mutante s2-ZipA, además del
dominio transmembrana, se eliminó el dominio P/Q, desde el aminoácido 1 hasta el 188.
En ambos mutantes, los fragmentos eliminados, han sido sustituidos por un fragmento de
seis histidinas. Estos mutantes, nos permiten además, estudiar interacciones en sistemas
reconstituidos de membrana dopados con grupos Ni-NTA o en superficies de oro y/o
plata, a los que la cola de histidinas se une fuertemente.
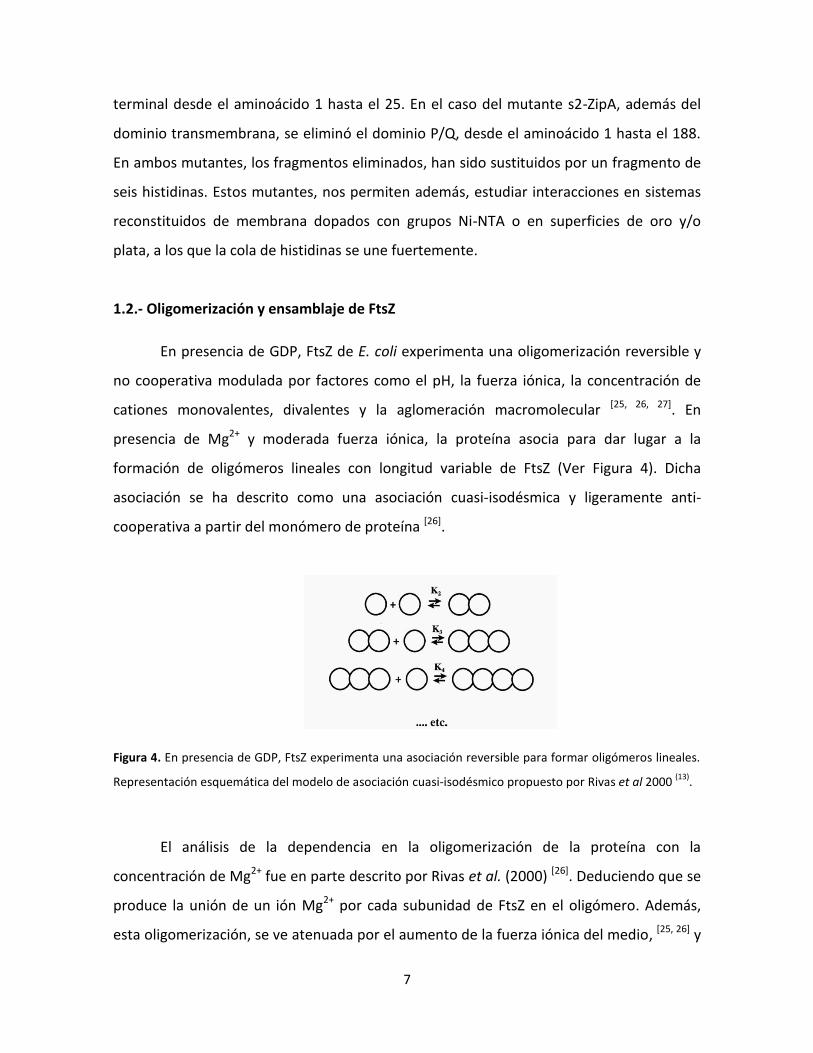
1.2.- Oligomerización y ensamblaje de FtsZ
En presencia de GDP, FtsZ de E. coli experimenta una oligomerización reversible y
no cooperativa modulada por factores como el pH, la fuerza iónica, la concentración de
cationes monovalentes, divalentes y la aglomeración macromolecular [25, 26, 27]. En
presencia de Mg2+ y moderada fuerza iónica, la proteína asocia para dar lugar a la
formación de oligómeros lineales con longitud variable de FtsZ (Ver Figura 4). Dicha
asociación se ha descrito como una asociación cuasi-isodésmica y ligeramente anti-
cooperativa a partir del monómero de proteína [26].
Figura 4. En presencia de GDP, FtsZ experimenta una asociación reversible para formar oligómeros lineales.
Representación esquemática del modelo de asociación cuasi-isodésmico propuesto por Rivas et al 2000 (13)
.
El análisis de la dependencia en la oligomerización de la proteína con la
concentración de Mg2+ fue en parte descrito por Rivas et al. (2000) [26]. Deduciendo que se
produce la unión de un ión Mg2+ por cada subunidad de FtsZ en el oligómero. Además,
esta oligomerización, se ve atenuada por el aumento de la fuerza iónica del medio, [25, 26] y
8
moderadamente acentuada por la aglomeración macromolecular debida a altas
concentraciones de macromoléculas que simulan el aglomerado citoplasma bacteriano
[28].
El estudio de la oligomerización dependiente de Mg2+ llevado a cabo anteriormente [26],
no cubrió en detalle el estudio a concentraciones submilimolares de Mg2+ y alta fuerza
iónica, donde predomina el equilibrio entre las formas monoméricas y diméricas. Además
de esto, en el estudio presentado en el Apendice 1 de esta tesis doctoral, se comparan
resultados obtenidos mediante ultracentrifugación analítica (velocidad de sedimentación)
con los obtenidos por dispersión de luz estática, estando ambos en buen acuerdo.
El ensamblaje de FtsZ en presencia de GTP, en principio, fue descrito como
cooperativo, y se determinó la concentración crítica de ensamblaje en distintas
condiciones experimentales [29-33]. El ensamblaje cooperativo, se produce en dos etapas,
en la primera se forma el núcleo de polimerización y en la segunda el polímero crece
mediante adición de nuevas subunidades. La formación del núcleo es energéticamente
costosa, pero una vez formado, la adición de nuevas subunidades es más favorable. Por
último, el ensamblaje exhibe una concentración crítica de polimerización, por encima de la
cual las subunidades de proteína se distribuyen en dos poblaciones distintas, especies
pequeñas y polímeros largos [34].
Otros autores, describieron el mecanismo de ensamblaje de FtsZ como no cooperativo o
isodésmico,[35] basándose en que FtsZ ensamblaba mayoritariamente en filamentos de
una sola cadena a pH 6.5 y a concentraciones muy bajas de FtsZ (por debajo de 2 μM) y en
que no existía una concentración crítica de ensamblaje. Los polímeros formados de
manera isodésmica, son polímeros de una sola cadena y ensamblan a través de la
formación de un enlace que es idéntico a cada paso del ensamblaje, por tanto, no hay una
fase de nucleación. Más recientemente, los mismos autores, describían el ensamblaje de
FtsZ como aparentemente cooperativo [29].
Posteriormente, fue propuesto un modelo de ensamblaje que implicaba un crecimiento
isodésmico del polímero seguido de una ciclación preferencial [36]. La ciclación, se produce
cuando la cadena polimérica tiene suficiente longitud (Ver Figura 5). Este último modelo,

9
tiene en cuenta la formación de especies de tamaño definido observadas por medidas de
velocidad de sedimentación y tiene en cuenta la formación de especies de geometría
circular observadas por microscopía electrónica y microscopía de fuerzas atómicas [36].
Figura 5. Representación esquemática del modelo de asociación isodésmica + ciclación. Implicaba un
crecimiento isodésmico del polímero seguido de una ciclación preferencial. La ciclación, se produce cuando
la cadena polimérica tiene suficiente longitud [36]
.
La polimerización de FtsZ para formar proto-filamentos, está acoplada a la
hidrólisis de GTP, coincidiendo la desaparición de los polímeros con el agotamiento del
GTP [38]. Los factores que influyen en la velocidad de hidrólisis de GTP, son los cationes K+ y
Mg2+, que afectan también a la estabilidad de los polímeros [32, 37 - 39]. FtsZ a pH neutro,
requiere la presencia conjunta de Mg2+ y K+ para el ensamblaje, pero la dependencia del

10
ensamblaje con la concentración de estos cationes, no ha sido estudiada en detalle
anteriormente hasta el trabajo presentado en esta tesis doctoral (Capítulos I y II).
De esta manera, en función de las condiciones experimentales, los polímeros de
FtsZ pueden adoptar gran variedad de estructuras, como son, filamentos sencillos, dobles,
cintas, círculos, etc [27, 37, 40 - 43]. En la figura 6 se muestran algunas de estas estructuras
mediante micrografías de microscopía electrónica de transmisión.
Figura 6. Plasticidad estructural de FtsZ. En función de las condiciones experimentales se pueden encontrar
formando: (1) filamentos sencillos, (2) filamentos dobles, (3) haces de filamentos o cintas, (4) círculos, (5)
toroides [27, 37, 40 - 43]
.
A modo de resumen, la Figura 7 muestra la gran cantidad de procesos de asociación y
ensamblaje en los que puede estar involucrada FtsZ. Además cada uno de éstos procesos
de ensamblaje-desensamblaje, puede estar modulado por efectos de agentes de
aglomeración molecular, concentración de diferentes cofactores y efectos de pH.

11
Figura 7. Esquema de la diversidad de procesos de ensamblaje y desensamblaje que puede sufrir FtsZ. Cada
una de las reacciones puede estar modulada por efectos de agentes de aglomeración molecular,
concentración de diferentes cofactores y efectos de pH.
1.3.-Interacción entre elementos del proto-anillo: FtsZ y ZipA
Como se ha descrito anteriormente, el primer complejo multiproteico que inicia el
proceso de división en Escherichia coli, es el proto-anillo. Esta compuesto por las proteínas
FtsZ, ZipA y FtsA, y ensamblado en a la membrana citoplasmática. La formación del proto-
anillo, es esencial para la formación del divisoma maduro, y por tanto, para hacer posible
el proceso de división [44, 45]. En el proto-anillo, los proto-filamentos de FtsZ, están
anclados a la membrana interna a través de su dominio C-terminal y el dominio C-terminal
de ZipA, además de FtsA. En condiciones normales, ZipA, es imprescindible para la
formación del proto-anillo, estabiliza los polímeros de FtsZ tanto in vitro como in vivo y es
capaz de inducir la formación de haces de polímeros de FtsZ [46 - 48]. La naturaleza de la
interacción entre FtsZ y ZipA se ha estudiado extensamente mediante técnicas genéticas y
estructurales, pero el mecanismo de la asociación todavía es desconocido [23, 24, 49 - 52].
Los únicos estudios cuantitativos sobre la afinidad de la formación de complejos
FtsZ-ZipA fueron proporcionados por dos trabajos. En el primero de ellos, estudiaban la
afinidad mediante la utilización de biosensores ópticos, por Mosyak et al (2000) [9]. En el
segundo trabajo, Martos et al. (2010) [25] (ver Apendice 2), llevaron a cabo el estudio
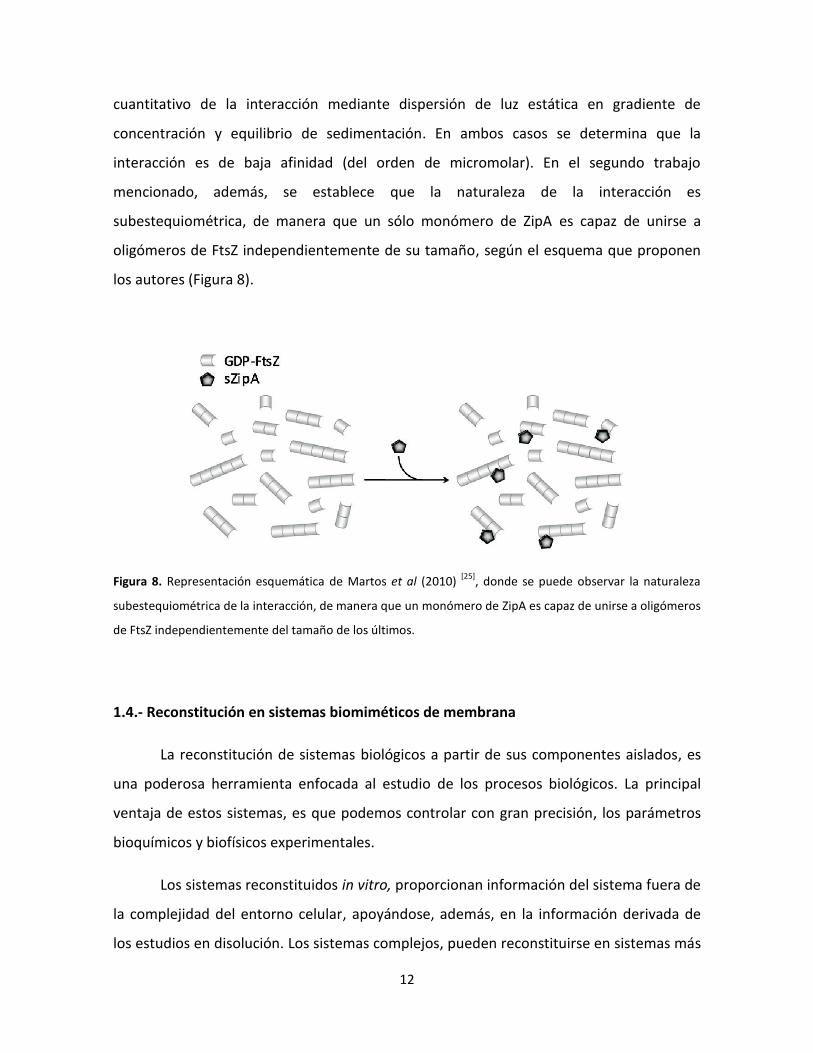
12
cuantitativo de la interacción mediante dispersión de luz estática en gradiente de
concentración y equilibrio de sedimentación. En ambos casos se determina que la
interacción es de baja afinidad (del orden de micromolar). En el segundo trabajo
mencionado, además, se establece que la naturaleza de la interacción es
subestequiométrica, de manera que un sólo monómero de ZipA es capaz de unirse a
oligómeros de FtsZ independientemente de su tamaño, según el esquema que proponen
los autores (Figura 8).
Figura 8. Representación esquemática de Martos et al (2010) [25]
, donde se puede observar la naturaleza
subestequiométrica de la interacción, de manera que un monómero de ZipA es capaz de unirse a oligómeros
de FtsZ independientemente del tamaño de los últimos.
1.4.- Reconstitución en sistemas biomiméticos de membrana
La reconstitución de sistemas biológicos a partir de sus componentes aislados, es
una poderosa herramienta enfocada al estudio de los procesos biológicos. La principal
ventaja de estos sistemas, es que podemos controlar con gran precisión, los parámetros
bioquímicos y biofísicos experimentales.
Los sistemas reconstituidos in vitro, proporcionan información del sistema fuera de
la complejidad del entorno celular, apoyándose, además, en la información derivada de
los estudios en disolución. Los sistemas complejos, pueden reconstituirse en sistemas más

13
sencillos, y por tanto, abordar el estudio en diferentes subsistemas. Están limitados
espacio-temporalmente, además, el número de variables se reduce significativamente
respecto al sistema in vivo, por eso, son tan útiles para el desarrollo de modelos simplistas
que describan el comportamiento del sistema [53].
El estudio de los sistemas reconstituidos en sistemas modelo de membrana es
esencial, ya que la membrana, constituye la frontera que permite, no sólo separar, sino
también, poner en comunicación diferentes compartimentos en el interior de la célula y a
la propia célula con el exterior. La membrana, es el medio donde tienen lugar las
reacciones de gran variedad de procesos biológicos esenciales. Además, la mayoría de
dianas en el desarrollo de nuevos fármacos, está relacionada con las interacciones entre
proteínas y sus receptores de membrana [54 - 56]. Según el modelo de Mosaico Fluido (45), la
totalidad de la membrana es fluida, las moléculas lipídicas se desplazan fácilmente dentro
de cada cara de la bicapa mientras que las proteínas, que suponen, en el caso de
Escherichia coli, cerca del 70% en peso de la membrana, se mueven también con facilidad
dentro de toda la bicapa [57, 58].
La composición fosfolipídica de las membranas citoplasmáticas de Escherichia coli
consta principalmente de fosfatidiletanolamina (PE) en aproximadamente un 67%,
fosfatidilglicerol (PG) entorno a un 23% y una pequeña porción cercana al 10% de
difosfatidilglicerol (DPG) o cardiolipina (CL) [59].
En nuestro laboratorio, hemos puesto a punto la reconstitución y ensamblaje de algunas
proteínas del divisoma en ambientes que mimetizan el entorno de la membrana. Los
principales sistemas reconstituidos que utilizamos en nuestro laboratorio, se representan
esquemáticamente en la figura 9 (Nanodiscos, microesferas, bicapas soportadas y
vesículas). En esta tesis, nos centraremos en la utilización de microesferas como soporte
para la reconstitución (ver Apéndice 2), además, como se describe en el capítulo III, nos
servirán de base para la fabricación de sustratos ultrasensibles en espectroscopía Raman
aumentada por superficie (SERS).
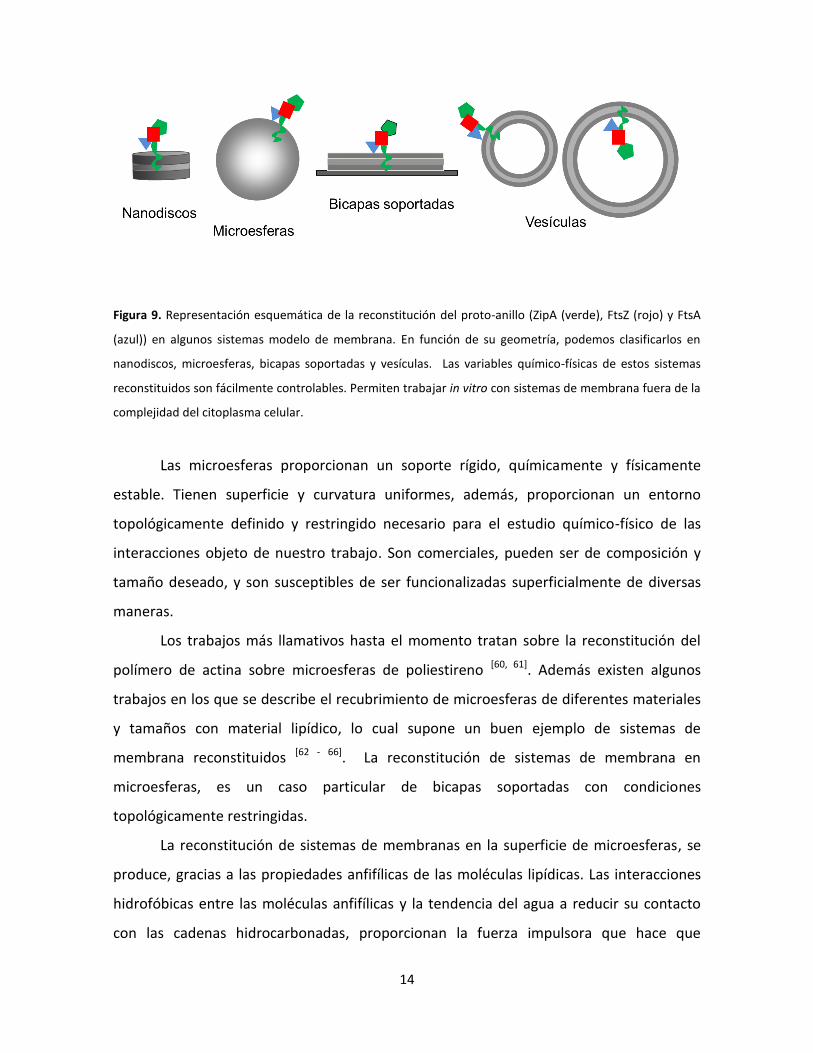
14
Figura 9. Representación esquemática de la reconstitución del proto-anillo (ZipA (verde), FtsZ (rojo) y FtsA
(azul)) en algunos sistemas modelo de membrana. En función de su geometría, podemos clasificarlos en
nanodiscos, microesferas, bicapas soportadas y vesículas. Las variables químico-físicas de estos sistemas
reconstituidos son fácilmente controlables. Permiten trabajar in vitro con sistemas de membrana fuera de la
complejidad del citoplasma celular.
Las microesferas proporcionan un soporte rígido, químicamente y físicamente
estable. Tienen superficie y curvatura uniformes, además, proporcionan un entorno
topológicamente definido y restringido necesario para el estudio químico-físico de las
interacciones objeto de nuestro trabajo. Son comerciales, pueden ser de composición y
tamaño deseado, y son susceptibles de ser funcionalizadas superficialmente de diversas
maneras.
Los trabajos más llamativos hasta el momento tratan sobre la reconstitución del
polímero de actina sobre microesferas de poliestireno [60, 61]. Además existen algunos
trabajos en los que se describe el recubrimiento de microesferas de diferentes materiales
y tamaños con material lipídico, lo cual supone un buen ejemplo de sistemas de
membrana reconstituidos [62 - 66]. La reconstitución de sistemas de membrana en
microesferas, es un caso particular de bicapas soportadas con condiciones
topológicamente restringidas.
La reconstitución de sistemas de membranas en la superficie de microesferas, se
produce, gracias a las propiedades anfifílicas de las moléculas lipídicas. Las interacciones
hidrofóbicas entre las moléculas anfifílicas y la tendencia del agua a reducir su contacto
con las cadenas hidrocarbonadas, proporcionan la fuerza impulsora que hace que
15
termodinámicamente sea posible la formación y el mantenimiento de estas estructuras, y
por tanto, la deposición homogénea de vesículas unilamelares pequeñas en la superficie
de las esferas. Las moléculas de fosfolípido se estructuran, en función de su lipofilicidad,
en forma de una bicapa dinámica, fluida y continua de espesor variable [67].
Por otro lado, las microesferas, juegan un papel muy importante como soporte
para el desarrollo de sensores y materiales compuestos con propiedades ópticas
avanzadas. La aplicación de estos materiales avanzados, es entre otras, la clave en el
desarrollo de sistemas miniaturizados de diagnóstico rápido, sistemas de detección
ultrasensibles, así como sistemas de screening de alto rendimiento en condiciones
ambientalmente y biológicamente relevantes [68, 69].
En el trabajo llevado a cabo en esta tesis doctoral, concretamente en el capítulo III,
combinamos por primera vez, la fabricación de materiales nanoestructurados con
propiedades avanzadas para la detección ultrasensible mediante espectroscopía SERS, con
la reconstitución del sistema de división bacteriana.
16
Referencias
1. Vicente M, Rico AI, Martínez-Arteaga R, Mingorance J. Septum enlightenment:
assembly of bacterial division proteins. J. Bacteriol.188.1.19–27.2006.
2. Goehring NW, Beckwith J. Diverse paths to midcell: assembly of the bacterial cell
division machinery. Current Biology, Vol. 15, R514–R526, 2005.
3. Sun Q, Margolin W. Influence of the nucleoid on placement of FtsZ and MinE rings
in Escherichia coli. J Bacteriol. 2001 Feb;183(4):1413-22.
4. Woldringh CL, Mulder E, Valkenburg JA, Wientjes FB, Zaritsky A, Nanninga N. Role
of the nucleoid in the toporegulation of division. Res Microbiol. 1990
Jan;141(1):39-49.
5. Meinhardt H, de Boer PA. Pattern formation in Escherichia coli: a model for the
pole-to-pole oscillations of Min proteins and the localization of the division site.
Proc Natl Acad Sci U S A. 2001 Dec 4;98(25):14202-7.
6. Hu Z, Mukherjee A, Pichoff S, Lutkenhaus J. The MinC component of the division
site selection system in Escherichia coli interacts with FtsZ to prevent
polymerization. Proc Natl Acad Sci U S A. 1999 Dec 21;96(26):14819-24.
7. Haney SA, Glasfeld E, Hale C, Keeney D, He Z, de Boer P. Genetic analysis of the
Escherichia coli FtsZ.ZipA interaction in the yeast two-hybrid system.
Characterization of FtsZ residues essential for the interactions with ZipA and with
FtsA. J. Biol. Chem. 276:11980–11987. 2001.
8. Ma X, Margolin W. Genetic and functional analyses of the conserved C-terminal
core domain of Escherichia coli FtsZ. J. Bacteriol. 181:7531–7544. 1999.

17
9. Mosyak L, Zhang Y, Glasfeld E, Haney S, Stahl M, Seehra J, Somers WS. The
bacterial cell-division protein ZipA and its interaction with an FtsZ fragment
revealed by X-ray crystallography. EMBO J. 19:3179–3191. 2000.
10. Erickson HP. FtsZ, a prokaryotic homolog of tubulin?. Cell 80(3): p. 367-370. 1995.
11. Löwe J, Amos LA. Crystal structure of the bacterial cell-division protein FtsZ. Nature
391(6663): p. 203-6. 1998.
12. Mukherjee A, Dai K, Lutkenhaus J. Escherichia coli cell division protein FtsZ is a
guanine nucleotide binding protein. Proc Natl Acad Sci U S A 90(3): p. 1053-7. 1993.
13. Romberg L, Levin PA. Assembly dynamics of the bacterial cell division protein FTSZ:
poised at the edge of stability. Annu Rev Microbiol, 2003. 57: p. 125-54.
14. Nogales E. When cytoskeletal worlds collide. Proc Natl Acad Sci USA, 2010 vol. 107
no. 46 19609-19610.
15. Mingorance J, Rivas G, Vélez M, Gómez-Puertas P, Vicente M. Strong FtsZ is with
the force: mechanisms to constrict bacteria. Trends in Microbiology 18 (2010) 348–
356.
16. Niu L, Yu J. Investigating intracellular dynamics of FtsZ cytoskeleton with
photoactivation single-molecule tracking. Biophys. J. 95, 2009–2016.
17. Awasthi D, Kumar K, Ojima I.Therapeutic potential of FtsZ inhibition: a patent
perspective. Expert Opin Ther Pat. 2011 21(5):657-79.
18. Margalit DN, Romberg L, Mets RB, Hebert AM, Mitchison TJ, Kirschner MW,
RayChaudhuri D. Targeting cell division: small-molecule inhibitors of FtsZ GTPase
perturb cytokinetic ring assembly and induce bacterial lethality. Proc Natl Acad Sci
U S A, 2004. 101(32): p. 11821-6.

18
19. Wang J, Galgoci A, Kodali S, Herath KB, Jayasuriya H, Dorso K, Vicente F, González
A, Cully D, Bramhill D, Singh S. Discovery of a small molecule that inhibits cell
division by blocking FtsZ, a novel therapeutic target of antibiotics. J Biol Chem,
2003. 278(45): p. 44424-8.
20. Läppchen T, Hartog AF, Pinas VA, Koomen GJ, den Blaauwen T. GTP analogue
inhibits polymerization and GTPase activity of the bacterial protein FtsZ without
affecting its eukaryotic homologue tubulin. Biochemistry, 2005. 44(21): p. 7879-84.
21. Beuria TK, Santra MK, Panda D. Sanguinarine blocks cytokinesis in bacteria by
inhibiting FtsZ assembly and bundling. Biochemistry, 2005. 44(50): p. 16584-93.
22. Margolin W. Themes and variations in prokaryotic cell division. FEMS Microbiol
Rev, 2000. 24(4): p.531-48.
23. Hale CA, de Boer PA. Direct binding of FtsZ to ZipA, an essential component of the
septal ring structure that mediates cell division in E. coli. Cell, 1997. 88(2): p. 175-
85.
24. Ohashi T, Hale CA, de Boer PA, Erickson HP. Structural evidence that the P/Q
domain of ZipA is an unstructured, flexible tether between the membrane and the
C-terminal FtsZ-binding domain. J. Bacteriol, 2002. 184(15): p. 4313-5.
25. Martos A, Alfonso C, López-Navajas P, Ahijado-Guzmán R, Mingorance J, Minton
AP, Rivas G. Characterization of self-association and heteroassociation of bacterial
cell division proteins FtsZ and ZipA in solution by composition gradient-static light
scattering. Biochemistry, 2010. 49(51): p.10780‒10787.
26. Rivas G, López A, Mingorance J, Ferrándiz MJ, Zorrilla S, Minton AP, Vicente M,
Andreu JM. Magnesium-induced linear self-association of the FtsZ bacterial cell
division protein monomer. The primary steps for FtsZ assembly. J Biol Chem, 2000.
275(16): p. 11740-9.
19
27. de Pereda JM, Leynadier D, Evangelio JA, Chacón P, Andreu JM. Tubulin secondary
structure analysis, limited proteolysis sites, and homology to FtsZ. Biochemistry.
1996 Nov 12;35(45):14203-15.
28. Rivas G, Fernández JA, Minton AP. Direct observation of the enhancement of
noncooperative protein self-assembly by macromolecular crowding: indefinite
linear self-association of bacterial cell division protein FtsZ. Proc Natl Acad Sci U S
A. 2001 13;98(6):3150-5.
29. Caplan MR, Erickson HP. Apparent cooperative assembly of the bacterial cell
division protein FtsZ demonstrated by isothermal titration calorimetry. J Biol Chem.
2003 18;278(16):13784-8.
30. Huecas S, Andreu JM. Energetics of the cooperative assembly of cell division
protein FtsZ and the nucleotide hydrolysis switch. J Biol Chem. 2003
14;278(46):46146-54.
31. Mukherjee A, Lutkenhaus J. Dynamic assembly of FtsZ regulated by GTP hydrolysis.
EMBO J. 1998 15;17(2):462-9.
32. Mukherjee A, Lutkenhaus J. Analysis of FtsZ assembly by light scattering and
determination of the role of divalent metal cations. J Bacteriol. 1999 181(3):823-
32.
33. White EL, Ross LJ, Reynolds RC, Seitz LE, Moore GD, Borhani DW. Slow
polymerization of Mycobacterium tuberculosis FtsZ. J Bacteriol. 2000
182(14):4028-34.
34. Oosawa, F., and S. Asakura. 1975. Thermodynamics of the polymerization of
Protein. Academic Press, London. 41-5 1.
35. Romberg L, Simon M, Erickson HP. Polymerization of Ftsz, a bacterial homolog of
tubulin. is assembly cooperative?. J Biol Chem. 2001 Apr 13;276(15):11743-53.
20
36. González JM, Vélez M, Jiménez M, Alfonso C, Schuck P, Mingorance J, Vicente M,
Minton AP, Rivas G. Cooperative behavior of Escherichia coli cell-division protein
FtsZ assembly involves the preferential cyclization of long single-stranded fibrils.
Proc Natl Acad Sci USA, 2005. 102(6): p. 1895-1900.
37. Yu XC, Margolin W. Ca2+-mediated GTP-dependent dynamic assembly of bacterial
cell division protein FtsZ into asters and polymer networks in vitro. EMBO J, 1997.
16(17): p. 5455-63.
38. Mukherjee A, Lutkenhaus J. Purification, assembly, and localization of FtsZ.
Methods Enzymol. 1998;298:296-305.
39. Mingorance J, Rueda S, Gómez-Puertas P, Valencia A, Vicente M. Escherichia coli
FtsZ polymers contain mostly GTP and have a high nucleotide turnover. Mol
Microbiol. 2001 Jul;41(1):83-91.
40. González JM, Jiménez M, Vélez M, Mingorance J, Andreu JM, Vicente M, Rivas G.
Essential cell division protein FtsZ assembles into one monomer-thick ribbons
under conditions resembling the crowded intracellular environment. J Biol Chem,
2003. 278(39): p. 37664-71.
41. Popp D, Iwasa M, Narita A, Erickson HP, Maéda Y. FtsZ condensates: an in vitro
electron microscopy study. Biopolymers, 2009. 91(5): p. 340-50.
42. Erickson HP, Taylor DW, Taylor KA, Bramhill D. Bacterial cell division protein FtsZ
assembles into protofilament sheets and minirings, structural homologs of tubulin
polymers. Proc Natl Acad Sci USA 1996. 93: p. 519-523.
43. González JM, Vélez M, Jiménez M, Alfonso C, Schuck P, Mingorance J, Vicente M,
Minton AP, Rivas G. Cooperative behavior of Escherichia coli cell-division protein
FtsZ assembly involves the preferential cyclization of long single-stranded fibrils.
Proc Natl Acad Sci USA, 2005. 102(6): p. 1895-1900.

21
44. Vicente M, Rico AI. The order of the ring: assembly of Escherichia coli cell division
components. Molecular microbiology 61, 5-8. 2006.
45. Adams DW, Errington J. Bacterial cell division: assembly, maintenance and
disassembly of the Z ring. Nature reviews 7, 642-653. 2009.
46. Hale CA, Rhee AC, de Boer PA. ZipA-induced bundling of FtsZ polymers mediated by
an interaction between C-terminal domains. J Bacteriology 182, 5153-5166, 2000.
47. RayChaudhuri D. ZipA is a MAP-Tau homolog and is essential for structural integrity
of the cytokinetic FtsZ ring during bacterial cell division. EMBO J, 1999 18, 2372-
2383.
48. Hale CA, de Boer PA. Recruitment of ZipA to the septal ring of Escherichia coli is
dependent on FtsZ and independent of FtsA. J. Bacteriol. 181:167–176. 1999.
49. Erickson HP. The FtsZ protofilament and attachment of ZipA--structural constraints
on the FtsZ power stroke. Current opinion in cell biology 2001, 13, 55-60.
50. Hale CA, de Boer PA. ZipA is required for recruitment of FtsK, FtsQ, FtsL, and FtsN
to the septal ring in Escherichia coli. J bacteriol 2002, 184, 2552-2556.
51. Moreira IS, Fernandes PA, Ramos MJ. Detailed microscopic study of the full
zipA:FtsZ interface. Proteins 63, 811-821. 2006.
52. Moy FJ, Glasfeld E, Mosyak L, Powers R. Solution structure of ZipA, a crucial
component of Escherichia coli cell division. Biochemistry 39, 9146-9156. 2000.
53. Liu AP, Fletcher DA. Biology under construction: in vitro reconstitution of cellular
function. Nat Rev Mol Cell Biol. 2009 10(9):644-50.
54. Yildirim MA, Goh KI, Cusick ME, Barabási AL, Vidal M. Drug-target network. Nat
Biotechnol. 2007 Oct;25(10):1119-26.
22
55. Drews J. Drug discovery: a historical perspective. Science. 2000 Mar
17;287(5460):1960-4.
56. Galush WJ, Shelby SA, Mulvihill MJ, Tao A, Yang P, Groves JT. A nanocube
plasmonic sensor for molecular binding on membrane surfaces. NANO LETTERS
2009 Vol. 9, No. 5 2077-2082.
57. Singer SJ, Nicolson GL. The fluid mosaic model of the structure of cell membranes.
Science. 1972 Feb 18;175(4023):720-31.
58. Devaux PF, Seigneuret M. Specificity of lipid-protein interactions as determined by
spectroscopic techniques. Biochim Biophys Acta, 1985. 822(1): p. 63-125.
59. Avanti Polar Lipids Inc. (http://avantilipids.com/)
60. Bugyi B, Didry D, Carlier MF. How tropomyosin regulates lamellipodial actin-based
motility: a combined biochemical and reconstituted motility approach. EMBO J.
2010 Jan 6;29(1):14-26. Epub 2009 Nov 5.
61. Akin O, Mullins RD.Capping protein increases the rate of actin-based motility by
promoting filament nucleation by the Arp2/3 complex. Cell, 2008. 133(5): p. 841-
51.
62. Linseisen FM, Hetzer M, Brumm T, Bayerl TM. Differences in the physical
properties of lipid monolayers and bilayers on a spherical solid support. Biophys. J.
72, 1997 1659-1667.
63. Ahmed S, Wunder SL. Effect of high surface curvature on the main phase transition
of supported phospholipid bilayers on SiO2 nanoparticles. Langmuir. 2009 Apr
9;25(6):3682-91.
64. Tsuda K, Furuta N, Inaba H, Kawai S, Hanada K, Yoshimori T, Amano A. Functional
analysis of alpha5beta1 integrin and lipid rafts in invasion of epithelial cells by

23
Porphyromonas gingivalis using fluorescent beads coated with bacterial membrane
vesicles. Cell Struct Funct. 2008;33(1):123-32.
65. Lim YT, Lee KY, Lee K, Chung BH. Immobilization of histidine-tagged proteins by
magnetic nanoparticles encapsulated with nitrilotriacetic acid (NTA)-phospholipids
micelle. Biochemical and Biophysical Research Communications 344 (2006) 926–
930.
66. Gopalakrishnan G, Rouiller I, Colman DR, Lennox RB. Supported bilayers formed
from different phospholipids on spherical silica substrates. Langmuir. 2009 May
19;25(10):5455-8.
67. Nollert P, Kiefer H, Jähnig F. Lipid vesicle adsorption versus formation of planar
bilayers on solid surfaces. Biophys. J. 1995, 69:1447-1455.
68. Tsoutsi D, Montenegro JM, Dommershausen F, Koert U, Liz-Marzán LM, Parak WJ,
Álvarez-Puebla RA. Quantitative surface-enhanced Raman scattering ultradetection
of atomic inorganic ions: the case of chloride. ACS Nano. 2011 Sep 27;5(9):7539-46.
69. Liu R, Lin S, Rallo R, Zhao Y, Damoiseaux R, Xia T, Lin S, Nel A, Cohen Y. Automated
phenotype recognition for zebrafish embryo based in vivo high throughput toxicity
screening of engineered nano-materials. PLoS One. 2012;7(4):e35014.

24

25
2.-OBJETIVOS Esta Tesis Doctoral se ha centrado en dos objetivos principales:
- Caracterización de los mecanismos de oligomerización y polimerización de FtsZ y
dependencia con sus cofactores.
- Desarrollo de métodos rápidos para la detección de la interacción FtsZ-ZipA en
sistemas reconstituidos de membrana.
Los resultados obtenidos se han estructurado en tres capítulos redactados en formato
manuscrito, y tres apéndices, seguidos de una discusión integradora y unas conclusiones
finales:
Capítulo 1. Análisis biofísico de la polimerización de FtsZ en las formas GTP y GMPCPP:
dependencia con la concentración de Mg2+. Determinación de la masa molecular de los
polímeros. Implicaciones en el mecanismo de ensamblaje.
Apéndice 1. Análisis biofísico de la oligomerización de FtsZ en la forma GDP: dependencia
con la concentración de Mg2+.
Capítulo 2. Análisis biofísico de la polimerización de FtsZ en las formas GTP y GMPCPP:
dependencia con la fuerza iónica.
Capítulo 3. Estudio de las interacciones entre FtsZ y otros elementos del proto-anillo de
división en sistemas de membrana soportados sobre microesferas funcionalizadas con
sensores plasmónicos: detección mediante espectroscopía Raman aumentada por
superficie (SERS).
Apéndice 2. Reconstitución de los elementos del proto-anillo en microesferas.
Apéndice 3. Caracterización de la interacción entre ZipA y FtsZ en su forma GDP mediante
dispersión de luz estática en gradiente de concentración.

26

27
3.-MÉTODOS En este apartado se pretende proporcionar una breve introducción de las técnicas
empleadas en este trabajo. Las condiciones concretas, el tipo de análisis de datos, así
como los modelos de ajuste utilizados en cada experimento se especifican en el apartado
de materiales y métodos de cada capítulo individual.
3.1.-Dispersión de luz estática
Mediante esta técnica es posible obtener la masa molecular promedio de especies
macromoleculares en disolución. La dispersión de luz estática, o dispersión Rayleigh, es la
luz dispersada por las moléculas en una disolución, con la misma longitud de onda que la
radiación incidente. La radiación electromagnética incidente es capaz de polarizar las
moléculas que componen la muestra, desplazando sus electrones e induciendo la
formación de un dipolo oscilante. Este dipolo oscilante inducido actúa como emisor de luz
dispersada que radia en todas direcciones del plano de detección (1).
Figura 5. Diagrama esquemático del sistema de luz dispersada (2).

28
La dispersión de luz es proporcional a la masa molecular de las especies que compongan la
muestra y a su concentración. Conociendo la concentración inicial y los ángulos a los
cuales se mide, se puede relacionar la intensidad de luz dispersada para cada ángulo de
medida con la masa molecular promedio de las especies en disolución. De esta manera se
obtienen los valores de exceso de dispersión Rayleigh debida a la proteína, R(θ,{w}),
j
tot
ij
j
ij
i
i
tot wsenCK
wR)2/(
),( 2
10
maxmax
[1]
donde {w} representa la concentración de las especies presentes en la disolución, i y j
indican la dependencia de la intensidad de luz dispersada con el ángulo y con la
concentración total de especie, wtot, Cij es la masa de las especies, K es la constante óptica,
definida por(3):
22
4
22
´4
nnA
o
dw
dnK
dw
dn
N
nK
[2]
donde, no, es el índice de refracción del tampón, λ es la longitud de onda de la luz
dispersada en condiciones de vacío (690nm) y NA es el número de Avogadro.
Se puede definir disolución ideal, con partículas isotrópicas, donde el exceso de luz
dispersada Rayleigh a ángulo 0o esta definido por Stacey (4) según:
nn
n n
wMdw
dnKwR
2
'}){,0(
[3]
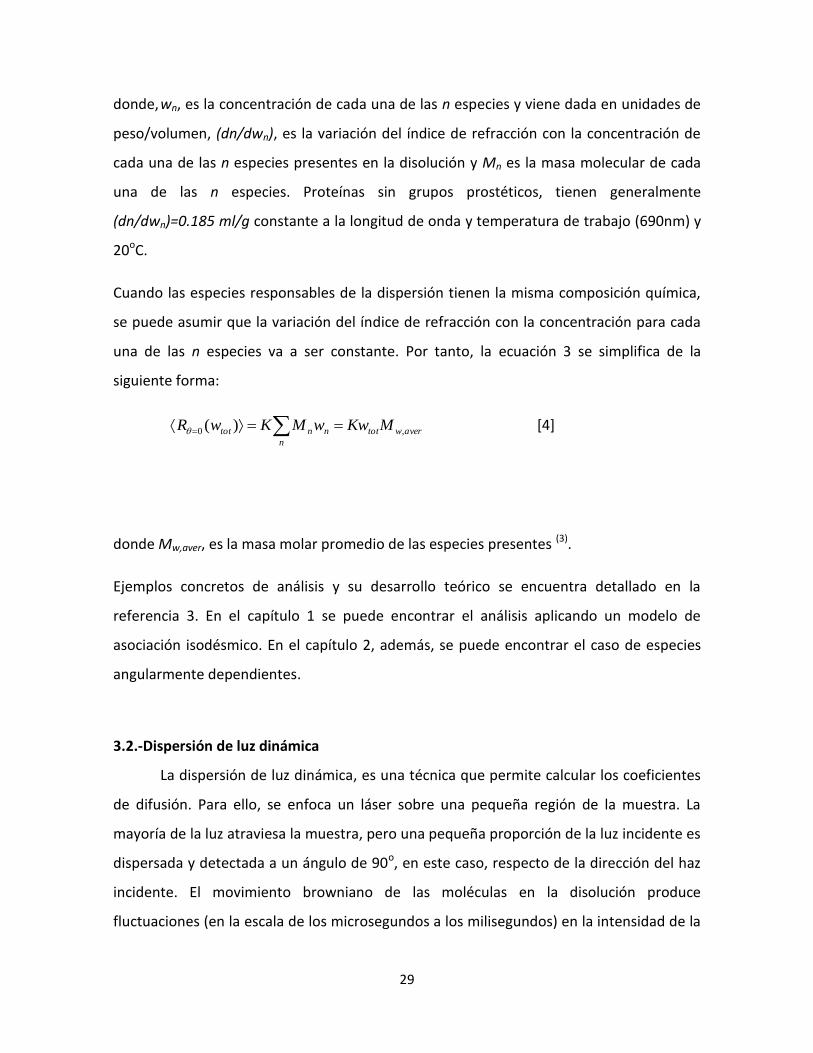
29
donde, wn, es la concentración de cada una de las n especies y viene dada en unidades de
peso/volumen, (dn/dwn), es la variación del índice de refracción con la concentración de
cada una de las n especies presentes en la disolución y Mn es la masa molecular de cada
una de las n especies. Proteínas sin grupos prostéticos, tienen generalmente
(dn/dwn)=0.185 ml/g constante a la longitud de onda y temperatura de trabajo (690nm) y
20oC.
Cuando las especies responsables de la dispersión tienen la misma composición química,
se puede asumir que la variación del índice de refracción con la concentración para cada
una de las n especies va a ser constante. Por tanto, la ecuación 3 se simplifica de la
siguiente forma:
averwtot
n
nntot MKwwMKwR ,0 )( [4]
donde Mw,aver, es la masa molar promedio de las especies presentes (3).
Ejemplos concretos de análisis y su desarrollo teórico se encuentra detallado en la
referencia 3. En el capítulo 1 se puede encontrar el análisis aplicando un modelo de
asociación isodésmico. En el capítulo 2, además, se puede encontrar el caso de especies
angularmente dependientes.
3.2.-Dispersión de luz dinámica
La dispersión de luz dinámica, es una técnica que permite calcular los coeficientes
de difusión. Para ello, se enfoca un láser sobre una pequeña región de la muestra. La
mayoría de la luz atraviesa la muestra, pero una pequeña proporción de la luz incidente es
dispersada y detectada a un ángulo de 90o, en este caso, respecto de la dirección del haz
incidente. El movimiento browniano de las moléculas en la disolución produce
fluctuaciones (en la escala de los microsegundos a los milisegundos) en la intensidad de la
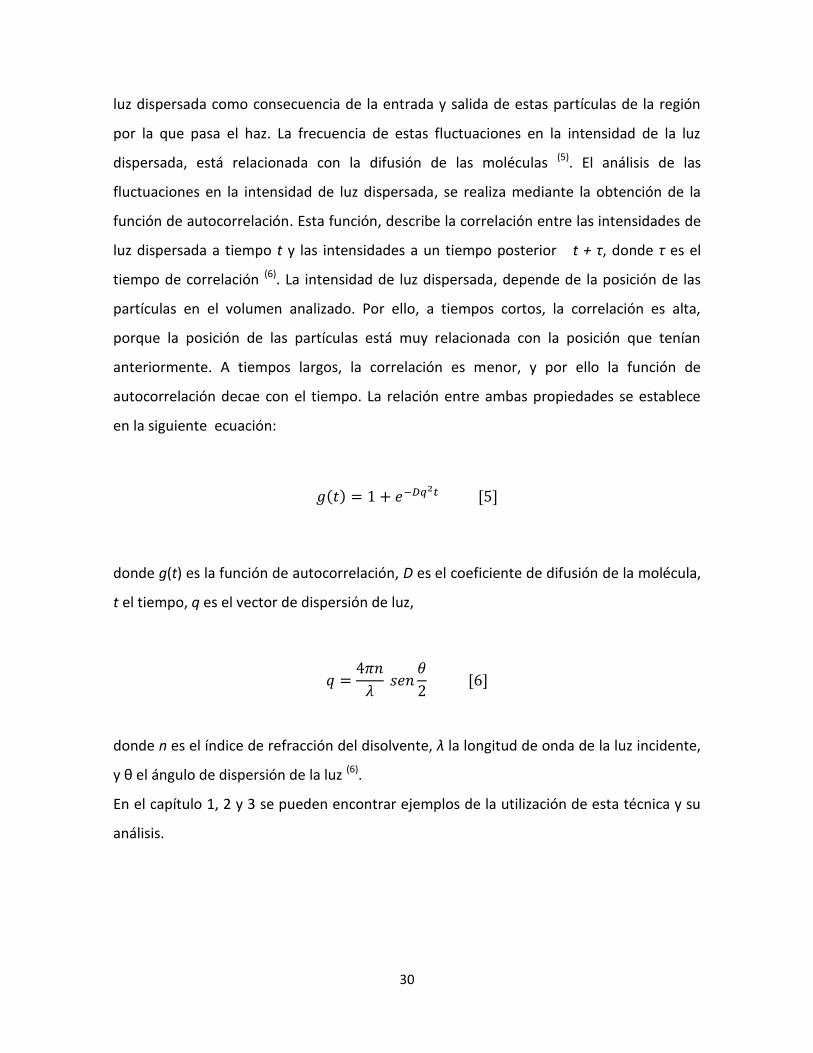
30
luz dispersada como consecuencia de la entrada y salida de estas partículas de la región
por la que pasa el haz. La frecuencia de estas fluctuaciones en la intensidad de la luz
dispersada, está relacionada con la difusión de las moléculas (5). El análisis de las
fluctuaciones en la intensidad de luz dispersada, se realiza mediante la obtención de la
función de autocorrelación. Esta función, describe la correlación entre las intensidades de
luz dispersada a tiempo t y las intensidades a un tiempo posterior t + τ, donde τ es el
tiempo de correlación (6). La intensidad de luz dispersada, depende de la posición de las
partículas en el volumen analizado. Por ello, a tiempos cortos, la correlación es alta,
porque la posición de las partículas está muy relacionada con la posición que tenían
anteriormente. A tiempos largos, la correlación es menor, y por ello la función de
autocorrelación decae con el tiempo. La relación entre ambas propiedades se establece
en la siguiente ecuación:
( )
donde g(t) es la función de autocorrelación, D es el coeficiente de difusión de la molécula,
t el tiempo, q es el vector de dispersión de luz,
donde n es el índice de refracción del disolvente, λ la longitud de onda de la luz incidente,
y θ el ángulo de dispersión de la luz (6).
En el capítulo 1, 2 y 3 se pueden encontrar ejemplos de la utilización de esta técnica y su
análisis.

31
3.3.-Velocidad de sedimentación
Mediante el uso de esta técnica, las especies presentes en la disolución se
fraccionan en función de su masa, forma y densidad. Por tanto podemos obtener un perfil
de las especies presentes y su concentración relativa. Durante un experimento de
velocidad de sedimentación las moléculas están sometidas a un elevado campo
centrífugo. Esto provoca que la fuerza centrífuga supere a la de difusión, produciéndose
un transporte neto de materia en el sistema. El flujo de sedimentación en disolución de
una especie molecular i que se encuentra girando con una velocidad angular ω viene
descrito por la ecuación de Lamm:
dr
dwDwsJ i
iiii 2 [7]
donde Ji es el flujo de la especie i en unidades de masa/(área ⋅ tiempo), wi es su
concentración (peso/volumen), ω es la velocidad angular del rotor (radianes/segundo), r
es la posición radial si y Di y son los coeficientes de sedimentación y difusión traslacional
de la especie molecular respectivamente, siendo ambos coeficientes propiedades de la
especie molecular en un determinado disolvente. El coeficiente de sedimentación viene
dado por:
isedA
i
isedA
ii
ifN
M
fN
Ms
,
*
,
0 )1(
[8]
donde, Mi , νi y fsed,i y son respectivamente, la masa molecular, el volumen específico
parcial y el coeficiente de fricción para la sedimentación de la especie i, ρo es la densidad

32
del disolvente y NA es el número de Avogadro. El producto Mi (1-νi ρo) se denomina masa
molecular de flotación, Mi *. A su vez, el coeficiente de difusión viene dado por:
idifA
ifN
RTD
,
[9]
donde R es la constante de los gases ideales, T es la temperatura absoluta y fdif,i el
coeficiente de fricción para la difusión.
Los coeficientes de fricción definidos son función del tamaño y de la forma de la
macromolécula, así como de su interacción con el disolvente y con otras moléculas de
soluto. En el límite de idealidad, estos dos coeficientes, f sed, i y f dif, i son iguales (6). Por
tanto, combinando las ecuaciones 8 y 9 se llega a la siguiente expresión, la ecuación de
Svedberg:
RT
M
D
s i
i
i
*
[10]
El análisis de los perfiles de sedimentación obtenidos a intervalos de tiempo regulares se
realiza mediante el ajuste directo de las soluciones a la ecuación de Lamm (ecuación [7])
con el programa SEDFIT (7, 8).
En los capítulos 1, 2 y 3 se muestran diversos ejemplos de análisis por velocidad de
sedimentación.

33
3.4.-Equilibrio de sedimentación
Mediante esta técnica podemos obtener información termodinámica acerca de la
masa molecular promedio, estequiometría y afinidad de unión de las proteínas
estudiadas, estableciéndose por tanto una complementareidad entre la información
aportada por los experimentos de equilibrio de sedimentación y los de CG-SLS.
Dada una disolución uniforme, que se somete a una fuerza centrífuga moderada se
establece un equilibrio entre el proceso de sedimentación de las macromoléculas hacia el
fondo de la celda, y el proceso de difusión que se opone al anterior. El equilibrio se
alcanza cuando, transcurrido un tiempo, los dos procesos se igualan y como resultado el
transporte neto se anula (Ji=0); llegado este punto, las macromoléculas estarán
distribuidas formando un gradiente de concentración creciente hacia el fondo de la celda
que no variará con el tiempo.
Para una situación de equilibrio Ji=0, combinando las ecuaciones 7 y 10 se obtiene la
ecuación:
Donde w es la concentración y r es el radio de la celda de medida. Si esta expresión es
integrada respecto a r2, obtendremos la ecuación de equilibrio para la sedimentación de
un soluto ideal.
( ) ( )(
(
))
Donde r0 indica la posición de referencia donde empieza el gradiente. El gradiente en el
equilibrio, se caracteriza fundamentalmente porque es invariante con el tiempo, es
independiente de las propiedades hidrodinámicas del soluto, y depende únicamente de la
masa molecular de flotación (Mi*). En los experimentos de equilibrio de sedimentación, el
tiempo necesario para alcanzar el equilibrio depende de la velocidad utilizada, del tamaño
34
de la macromolécula y de la longitud de la columna que es la distancia desde el menisco
hasta el fondo de la celda.
Con el ajuste de la ecuación 12 al gradiente obtenido en el equilibrio, mediante el
software Heteroanalisys, obtenemos la masa molecular aparente de flotación (9). El
volumen específico parcial de las proteínas se calcula como el promedio en peso de los
valores de volumen específico parcial de los aminoácidos de la proteína mediante el
programa SEDNTERP.
3.5.-Espectroscopía de correlación de Fluorescencia (FCS)
Mediante la técnica de espectroscopia de correlación de fluorescencia, se miden las
fluctuaciones temporales aleatorias de moléculas fluorescentes cuando atraviesan un
pequeño volumen de observación. De esta manera, podemos determinar parámetros
químico-físicos característicos de la proteína fluorescente para descifrar procesos de
dinámica molecular como la difusión o fluctuaciones conformacionales. Se utiliza un laser
pulsado (Ti:Zafiro) que se enfoca al limite de difracción. Moléculas fluorescentes
difundiéndo en el medio pueden pasar por el volumen iluminado. A través del proceso de
excitación de dos fotones, las moléculas que difunden dentro del volumen, generan un
fotón. Este fotón, es capturado por la misma óptica que enfoca al láser y es transmitido a
detectores a través de filtros ópticos. Finalmente, el fotón es detectado por un diodo de
avalancha.
Si se observa el volumen por un tiempo largo, del orden de segundos, a altas frecuencias
de adquisición (GHz), se pueden capturar miles de fotones. El vector de tiempos de la
llegada de los fotones se puede promediar para generar una señal analógica. Las
fluctuaciones con respecto al promedio de la intensidad de este nuevo vector, dependen
del tamaño de la iluminación y el coeficiente de difusión. Si las moléculas se desplazan en
el volumen de observación, la intensidad de fluorescencia a un tiempo t estará
correlacionada a un tiempo t + τ. De esta manera el método de correlación, analiza la
intensidad de fluorescencia media F(t) autocorrelacionando las fluctuaciones alrededor
del valor medio de fluorescencia <F(t)> en un periodo finito de tiempo. El análisis de la

35
función de autocorrelación puede proveer información acerca del coeficiente de difusión y
concentración absoluta.
La función de autocorrelación se define como:
( ) ⟨ ( ) ( )⟩
⟨ ( )⟩
⟨ ( ) ( )⟩
⟨ ( )⟩
Donde δF(t) = F(t) - <F(t)>. El promedio de intensidad esta dado por:
⟨ ( )⟩
∫ ( )
Donde T es el tiempo total de observación (10).
3.6.-Espectroscopía Raman aumentada por superficie (SERS)
La espectroscopia de dispersión Raman aumentada por superficie (surface-
enhanced Raman scatering, SERS) es una técnica espectroscópica que combina la
espectroscopia láser con las propiedades ópticas (plasmones localizados) características
de las nanoestructuras metálicas. Esta interacción láser-plasmón da como resultado un
enorme aumento de la señal Raman proveniente de sistemas moleculares situados en la
proximidad de dichas nanoestructuras. Este aumento puede llegar hasta 14 órdenes de
magnitud respecto a la señal obtenida mediante dispersión Raman convencional. El
espectro obtenido es esencialmente un espectro de vibración y, por tanto, contiene toda
la información estructural del sistema molecular estudiado (11, 12). Estas capacidades se
combinan para tener la posibilidad de elucidar no sólo la estructura, sino también, la
reactividad de los sistemas moleculares bajo estudio. Esta espectroscopia, es por tanto,

36
una técnica versátil que permite su aplicación analítica en campos tan diversos como la
ciencia de materiales, química analítica, biomedicina o ciencias medioambientales (13).
En la dispersión Raman (Raman scattering, RS) convencional, la intensidad de la dispersión
Stokes PRS(νS) es proporcional a la sección eficaz Raman σRfree, a la intensidad del láser de
excitación I(νL), y al número de moléculas N contenidas en el volumen irradiado:
( ) ( )
El efecto SERS se debe fundamentalmente a dos efectos, por una parte, un mecanismo
electromagnético (EM), según el cual, la señal aumenta debido al acoplamiento de la
molécula, con los campos electromagnéticos locales generados por las nanoestructuras
metálicas cuando son excitados con un haz de fotones. Este primer mecanismo es esencial
en SERS, y supone incrementos de intensidad de la señal de 5-7 órdenes de magnitud
respecto a RS. Por otro lado, la proximidad de la molécula a la nanoestructura, genera
transferencia de carga entre los orbitales HOMO-LUMO de la molécula y la banda de
conducción del metal. Este fenómeno se conoce como mecanismo químico o de
transferencia de carga (CT). El mecanismo químico no es esencial para obtener SERS, sin
embargo, los límites de detección necesarios para detectar una sola molécula, sólo se
alcanzan cuando ambos mecanismos actúan conjuntamente. Para que ocurra
transferencia de carga, es necesario un contacto intimo molécula-nanoestructura, por ese
motivo, la aparición del segundo mecanismo sólo se produce en la primera capa
quimisorbida o fisisorbida. De acuerdo con los dos mecanismos descritos, la ecuación 15
toma la siguiente forma:
( ) | ( )|
| ( )| ( )
37
donde, A(νL) y A(νS) definen los factores de aumento para el láser y para la RS,
respectivamente; σRads describe la sección eficaz aumentada del nuevo proceso Raman de
la molécula adsorbida y N’ es el número de moléculas que están involucradas en el
proceso SERS y puede ser menor que el número de moléculas N (14-17).
En muchos casos, los sustratos activos en SERS están formados por un grupo de
nanopartículas de oro y/o plata, tales como agregados de partículas o películas delgadas
que contienen islas metálicas. En estos agregados, los dipolos oscilantes (plasmones)
individuales de cada una de las partículas que los forman, se acoplan entre sí, generando
modos plasmónicos para el agregado en un intervalo amplio de frecuencias, que abarcan
desde la región del visible hasta el infrarrojo cercano (NIR). Hay que tener en cuenta, sin
embargo, que la excitación del campo no está distribuida uniformemente sobre el
conjunto del agregado, sino que tiende a estar localizada espacialmente en las
denominadas “zonas o puntos calientes” (hot spots). El tamaño de los hot spots suele ser
pequeño, del orden de unos pocos nanómetros y su localización depende fuertemente de
la geometría del agregado, de la longitud de onda de excitación y de la polarización de los
campos. Cuando la excitación óptica está localizada en hot spots pequeños, el aumento
electromagnético SERS es extremadamente elevado (16, 11, 18).

38
Referencias
1. Técnicas de caracterización de polímeros, Miguel Ángel Llorente Uceta, Arturo
Horta Zubiaga, Publicaciones UNED, ISBN: 8436226100 ISBN-13: 9788436226102
(1990)
2. http://www.wyatt.com/
3. Attri AK, Minton AP. New methods for measuring macromolecular interactions in
solution via static light scattering: basic methodology and application to
nonassociating and self-associating proteins. Analytical Biochemistry 337 (2005)
103–110.
4. K.A. Stacey, Light-Scattering in Physical Chemistry, Academic Press, New York,
1956.
5. Murphy RM. Static and dynamic light scattering of biological macromolecules:
what can we learn?. Curr Opin Biotechnol. 1997 Feb 1;8(1):25-30.
6. van Holde, K.E., Johnson, W.C. y Ho, P.S. (1998) Principles of Physical Biochemistry.
Prentice-Hall, Inc., Upper Saddle River, New Jersey.
7. Schuck P, Rossmanith P. Determination of the sedimentation coefficient
distribution by least-squares boundary modeling. Biopolymers. 2000 Oct
15;54(5):328-41.
8. Schuck P. Some statistical properties of differencing schemes for baseline
correction of sedimentation velocity data. Analytical Biochemistry 401 (2010) 280–
287
9. Cole JL. Analysis of heterogeneous interactions. Meth. Enzym. 384 212-232.(2004).
10. Elliot L. Elson, Douglas Magde. Fluorescence correlation spectroscopy. I.
Conceptual basis and theory. Biopolymers, 13, 1–27. 1974.
39
11. Katrin Kneipp, Yang Wang, Harald Kneipp, Lev T. Perelman, Irving Itzkan,
Ramachandra R. Dasari, and Michael S. Feld. Single Molecule Detection Using
Surface-Enhanced Raman Scattering (SERS). Physical Review Letters, (1997) 78,
1667.
12. Nie S, Emory SR. Probing Single Molecules and Single Nanoparticles by Surface-
Enhanced Raman Scattering. Science (1997) 275, 1102.
13. Katrin Kneipp1, Harald Kneipp, Irving Itzkan, Ramachandra R Dasari and Michael S
Feld. Surface-enhanced Raman scattering and biophysics. Journal of Physics
Condensed Matter, (2002) 14, R597.
14. Martin Moskovits. Surface-enhanced spectroscopy. Reviews of Modern Physics,
(1985) 57, 783.
15. R.F. Aroca, R.A. Alvarez-Puebla, N. Pieczonka, S. Sanchez-Cortez, J.V. Garcia-Ramos.
Surface-enhanced Raman scattering on colloidal nanostructures. Advances in
colloid and interface science, (2005) 116, 45.
16. K. Kneipp, H. Kneipp, P. Corio, S. D. M. Brown, K. Shafer, J. Motz, L. T. Perelman, E.
B. Hanlon, A. Marucci, G. Dresselhaus, and M. S. Dresselhaus. Surface-Enhanced
and Normal Stokes and Anti-Stokes Raman Spectroscopy of Single-Walled Carbon
Nanotubes. Physical Review Letters, (2000) 84, 3470.
17. E. Hesse and J. A. Creighton. Investigation by Surface-Enhanced Raman
Spectroscopy of the Effect of Oxygen and Hydrogen Plasmas on Adsorbate-Covered
Gold and Silver Island Films. Langmuir (1999) 15, 3545.
18. Kneipp, Katrin; Kneipp, Harald; Kartha, V. Bhaskaran; Manoharan, Ramasamy;
Deinum, Geurt; Itzkan, Irving; Dasari, Ramachandra R.; Feld, Michael S. Detection
and identification of a single DNA base molecule using surface-enhanced Raman
scattering (SERS). Physical Review E: Statistical Physics, Plasmas, Fluids, and
Related Interdisciplinary Topics, (1998) 57, R6281.

40

CHAPTER I
Mg2+-linked self-assembly of FtsZ in the presence of GTP or a GTP
analog involves the concerted formation of a narrow distribution of
oligomeric species

CHAPTER 1
42
The assembly of the bacterial cell division FtsZ protein in the presence of constantly
replenished GTP was studied as a function of Mg2+ concentration (at neutral pH and 0.5 M
potassium) under steady-state conditions by sedimentation velocity, concentration-gradient
light scattering, fluorescence correlation spectroscopy and dynamic light scattering.
Sedimentation velocity measurements confirmed previous results indicating cooperative
appearance of a narrow size distribution of oligomeric species with increasing protein
concentration. The concentration dependence of light scattering and diffusion coefficients
independently verified the cooperative appearance of a narrow size distribution of
oligomeric species, and in addition provided a measurement of the average size of these
species, which corresponds to 100 ± 20 FtsZ protomers at millimolar Mg2+ concentration.
Parallel experiments on solutions containing GMPCPP, a slowly hydrolysable analog of GTP,
in place of GTP, likewise indicated the concerted formation of a narrow size distribution of
stable oligomers with a larger average mass (corresponding to 160 ± 20 FtsZ monomers).
The closely similar behavior of FtsZ in the presence of both GTP and GMPCPP suggests that
the observations reflect equilibrium rather than non-equilibrium steady-state properties of
both solutions and exhibit parallel manifestations of a common association scheme.
CHAPTER 1
43
INTRODUCTION
FtsZ is an essential protein required for septation in most bacteria, in archaea and in some organelles.
It is an early septum component, forms a ring at midcell and it is thought to be responsible for
initiating and driving cell constriction (1-3). FtsZ shares structural, but not sequence, homology with
eukaryotic tubulin, as well as its GTPase activity and its capacity to polymerize. Unlike tubulin, FtsZ
requires binding of nucleotide and divalent cations for folding. These properties suggest the two
proteins have different modes of action (3). The self-association of FtsZ in the presence of GDP and its
polymerization in the presence of GTP have been studied extensively (3, 4). While the mechanism of
GDP-FtsZ oligomer formation is relatively well understood, that is not the case for the GTP-linked FtsZ
polymerization. In the presence of GTP, FtsZ polymerizes in an apparently cooperative manner to form
single stranded protofilaments that, depending upon solution and working conditions (buffer
composition, temperature, protein density, surface effects, excluded volume and electrostatic non-
specific effects of macromolecular additives, specific effects of other cell division proteins) can adopt a
variety of supramolecular structures: flexible single and multi-stranded fibers, circles, ribbons, bundles
and toroids (1, 3, 5-8). This polymorphism is due to the structural plasticity of FtsZ polymers: it would
take only a very small free energy perturbation to change the structural organization of the
intermolecular interface and bring about large changes in the geometry of the fibers (9).
Erickson and co-workers have established that FtsZ polymers are highly dynamic both in vivo (10) and in
vitro (11). In the former study, they bleached part of a fluorescent Z-ring in a bacterium that has been
engineered to produce fluorescent FtsZ, and observed that the fluorescence recovers in ca. 10-30
seconds (10). While this finding establishes a dynamic exchange of FtsZ between the Z-ring and the
cytoplasm, the implications for the kinetics or pseudo-equilibria governing fiber or Z-ring assembly are
not at all clear. The dynamic character of FtsZ polymers linked to the GTPase activity of the protein
constitutes an additional challenge to study FtsZ assembly in the presence of GTP, which requires
special procedures for the maintenance of polymer stability throughout the duration of a typical
biochemical and biophysical experiment (6). The variety of quantitative techniques that have been
applied to study FtsZ assembly is consequently low compared to the variety of techniques utilized to
study other protein assembly systems. Moreover, different research groups have studied assembly

CHAPTER 1
44
under differing solution conditions (pH, ionic strength, buffer composition). These facts may in part
explain disagreements that have arisen during the last years regarding the mechanism of FtsZ
polymerization in the presence of GTP (5, 9).
The dependence on protein concentration of the sedimentation coefficient distribution of FtsZ in the
presence of GTP and Mg2+ was measured by sedimentation velocity (9). In that study an enzymatic GTP
regenerating system (GTP-RS) was added to the solutions to avoid GTP depletion, and hence polymer
disassembly, during sufficient time to perform the sedimentation velocity measurements reported
under steady-state conditions. The data clearly showed a system consisting of a well separated slowly
sedimenting fraction and a rapid species. With increasing total protein concentration, the abundance
of the slowly sedimenting fraction was reduced while the amount of the fast species increased. The
rapid fraction corresponded to a finitely sized distribution of species with an s-value of around 13 S,
which did not grow indefinitely upon increasing protein concentration. This behavior resembled a
condensation reaction in which the condensed species was soluble and with a relatively narrow size
distribution.
The motivation of this work is to confirm and extend the previous experimental observations,
to obtain a model-free estimate of the oligomer size and the dependence of oligomer size upon Mg
concentration, to verify the existence of a phase transition-like cooperativity of oligomer formation on
the assembly pathway, and to test whether this concerted transition reflects or not a quasi-equilibrium
behavior, and does not derive from a precarious balance of competing hydrolytic and nucleotide
exchange reactions far from equilibrium. With these goals, we have carried out parallel studies of FtsZ
assembly using a combination of biophysical methodologies (sedimentation velocity, concentration
gradient static and dynamic light scattering, and fluorescence correlation spectroscopy) to more
clearly elucidate the nature of the self-assembly process under a well-defined set of experimental
conditions, close to physiological (neutral pH, 0.5 M potassium). These studies were done over a broad
range of Mg and protein concentrations under working conditions comparable to those utilized in
previous work (9). Experiments were first performed with FtsZ under steady-state conditions in the
presence of GTP and the GTP-RS. To assess the possible contribution of effects arising from GTP
hydrolysis and nucleotide exchange on the behavior of the system, parallel experiments were
CHAPTER 1
45
conducted in the presence of GMPCPP, a GTP analog which is hydrolyzed at a rate that is only 4% that
of FtsZ-catalyzed hydrolysis of GTP under the conditions of our experiments (14).
EXPERIMENTAL PROCEDURES
Materials. Guanine nucleotides were from Jena. Other analytical grade chemicals were from Sigma.
Even if not specifically mentioned, in all the GTP-induced assembly experiments the GTP was
regenerated using a GTP-regenerating system (1 unit/mL acetate kinase, 15 mM acetyl phosphate) as
previously described (6) to maintain FtsZ polymers at steady-state during the time scale of the
experiments.
FtsZ purification and labeling. E. coli FtsZ was purified by the Ca2+-induced precipitation method as
described (4) and stored at -80oC in the ionic exchange elution buffer. Immediately before use, FtsZ
was dialyzed in the working buffer (50 mM Tris-HCl, pH 7.5, 500 mM KCl) supplemented with the
specified concentrations of MgCl2. Protein labeling with Alexa 488 carboxylic acid succinimidyl ester
dye was performed in polymeric form as described in detail elsewhere (15, 16), rendering labeled FtsZ
that behaves as the unlabeled protein in terms of polymerization (6, 16). The Alexa 488 dye was
selected for being highly photo-stable, very bright and quite hydrophilic. The degree of labeling of
FtsZ, estimated from the molar absorption coefficients of the fluorophore and the protein, was 30-
50%.
Sedimentation velocity (SV). The experiments were carried out in a Beckman Optima XL-I
ultracentrifuge (Beckman-Coulter) equipped with interference optics that allows monitoring FtsZ
sedimentation at physiological (mM) GTP concentrations. FtsZ (0.5 – 1 g/L) was equilibrated in
working buffer (over a broad range of Mg2+ concentrations) and, just before the sedimentation
experiment, supplemented with millimolar GTP or GMPCPP. FtsZ samples were centrifuged at 30000
rpm and 25oC using an An50Ti eight-hole rotor and double-sector Epon-charcoal centerpieces.
Differential sedimentation coefficient distributions c(s) were calculated by least-squares boundary
modeling of the experimental data using SEDFIT (17).

CHAPTER 1
46
Static light scattering (CG-SLS)
Multi-angle light scattering. Measurements of angular dependence of scattering over a broad range
of FtsZ concentrations were carried out in a DAWN-EOS multi-angle light scattering photometer
equipped with a Calypso system (Wyatt Technology Corp, Santa Barbara) consisting of a software-
controlled multiple syringe pump used to create the concentration gradient and an Optilab rEX
differential refractometer configured to collect data in parallel from the incoming sample stream. All
components of the GTP-RS or GMPCPP were supplemented at each gradient step to maintain constant
concentration of these components throughout FtsZ gradient. Data were collected at 20oC with 1%
sensitivity of the detectors. The raw data acquired consist of the time-dependent scattering intensity
at fourteen scattering angles and the time-dependent differential refractive index. The Rayleigh ratio
was calculated from the raw scattering intensity, and the w/v concentration of protein, w, calculated
from the differential refractive index as described in (18, 19), except that an empirical constant of
proportionality between dRI and w was used to calculate the w/v concentration as a function of time.
The results are expressed as the concentration and angle-dependent Rayleigh ratio ,R w in units of
an optical constant
22 2
0
4
0
4opt
A
n dnK
N dw
[1]
where n0, NA and λ0 denote the solvent refractive index, Avogadro’s number and the vacuum
wavelength of incident light (690 nm), respectively, and is the specific refractive index
increment of the protein, taken as 0.185 cm3/g (19).
90o Static Light Scattering. Measurements of the dependence of scattering intensity at 90o upon FtsZ
concentration were performed in a modified mini-DAWN light scattering photometer (Wyatt
Technology Corp., Santa Barbara) using an automated dilution protocol as described (20). The
composition of the sample solution and the dilution buffer were the same to maintain constant
concentration of all the components present in the GTP and GMPCPP solutions throughout the process
of FtsZ dilution. Preliminary measurements of scattering intensity established that FtsZ species formed
in the presence of GTP plus GTP-RS or GMPCPP were stable over periods of time far exceeding the
dn dw
CHAPTER 1
47
duration of a dilution experiment. Concentration of protein at each dilution step was calculated from
the initial concentration and raw scattering intensity data was converted to the scaled Rayleigh ratio
R(w,90o)/Kopt as described in (20).
Dynamic light scattering assays (DLS). DLS experiments were carried out in a Protein Solutions
DynaPro MS/X instrument (Protein Solutions, Piscataway, NJ) at 25oC using a 90o light scattering
cuvette. Previous to measurements, samples were filtered twice with 0.1 µm Anotop 10 Plus filters
(Whatman) and subsequently centrifuged during 30 minutes at 100000 × g and 4oC. Data were
collected and exported as text files with Dynamics V6 Software, and analyzed using user-written scripts
and functions in MATLAB (Ver. 7.10, MathWorks, Natick, MA). Data correspond to a minimum of two
independent measurements each of which was the average of at least 7 replicates.
DLS data are reported in the form of an autocorrelation function describing the time-dependence of
the correlation between scattering intensity at any given time and the intensity at a subsequent
increment of time τ. For a single scattering species, the auto-correlation function is given by (21)
[2]
where
ACF0 and respectively denote the values of ACF in the short and long time limits, q denotes the
scattering vector at 90o, n0 and λ0 are the solvent refractive index and the wavelength of incident light,
and D is the translational diffusion coefficient of the scattering species. In the present work, the
scattering arises from an as-yet-undefined mixture of scattering species, and in this case the
autocorrelation function is more appropriately described by an empirical exponential function of the
kind used for analysis of the slowly sedimenting component of fibrinogen fibrin and protofibrils (22).
[3]
ACF( ) ACF
ACF
0 ACF
exp(2Dq2 )
q 4n
0
0
sin
4
ACF
ACF ACF
( ACF
0 ACF
)exp D
appq2
2

CHAPTER 1
48
where Dapp represents an apparent average diffusion coefficient, and β is a parameter that decreases
from unity with the width of the distribution of diffusion coefficients. For each set of experimental
conditions, equation [3] was fit to experimental autocorrelation functions via nonlinear least squares
to obtain the best-fit value of the apparent diffusion coefficient, which was then corrected to a
standard temperature and solvent viscosity (20º C, water) for comparison with the results obtained by
other techniques. Since Dapp is an average, it may vary with total protein concentration when the
protein is undergoing equilibrium self-association.
Fluorescence correlation spectroscopy (FCS) assays. FCS measurements were carried out under two-
photon excitation on a MicroTime 200 system (PicoQuant, Berlin, Germany) with the setup described
elsewhere (16). 5-10 autocorrelation curves were acquired for each sample during 1 minute each at
21oC and globally analyzed with the FFS Data processor software (Scientific Software Technologies
Center, Belarus) (23) using the following expression, in which it is assumed that the samples are excited
by a three dimensional Gaussian beam:
[4]
where G(0) is the amplitude of the autocorrelation function. S is a structure parameter (S = z0/r0 where
r0 and z0 are the lateral and axial dimensions of the effective detection volume), which varied from 3 to
6 as determined by calibration with fluorescein or rhodamine 110 solutions. Di is the translational
diffusion time of the fluorescent particle i (Di = r02/8Di, for two-photon excitation, where Di is the
translational diffusion coefficient). The r0 value was estimated from the calibration assuming D of 400
m2/s and 435 m2/s for fluorescein and rhodamine 110, respectively (24-26). fi is the fractional
contribution of species i to the autocorrelation function. A two species model was fit to the
autocorrelation curves for samples containing unpolymerized FtsZ-Alexa 488 (16), the faster one
indicating the presence of minor fractions (10-20%) of free dye in the samples and the other one
corresponding to the unassembled protein. The fast component was also found in the solutions
containing assembled FtsZ and its translational diffusion time was fixed to that measured for Alexa 488
i
21
Di
2
1
Dii S
11f)0(G1G

CHAPTER 1
49
in the same buffer (corresponding to a D 400 m2/s). Preparations of labeled protein containing
different amounts of free dye rendered translational diffusion coefficients equivalent within the error
for the polymer. To fit the autocorrelation traces obtained in the presence of GTP or GMPCPP, two
other components corresponding to the slowly diffusing polymeric species and to unassembled
protein were required (16). The translational diffusion time of the unpolymerized protein was fixed to
that obtained for FtsZ in the absence of GTP or GMPCPP (corresponding to a D 50 m2/s) and its
contribution varied depending on the total FtsZ concentration in the solution and on the buffer
conditions. Slight variations in the fraction of unassembled FtsZ (for a given buffer and protein
concentration) were observed depending on the preparation of labeled protein used, which, however,
did not have any effect on the translational diffusion coefficient retrieved for the polymeric species. D
values given here were normalized to standard conditions (20oC, water) and represent the average of
at least 3 independent measurements.
The concentration of FtsZ-Alexa 488 was typically 0.006 g/L (150 nM) and the final protein
concentration was achieved by adding unlabeled protein. No significant changes in the spectral
properties of the Alexa 488 dye were observed upon incorporation of the protein to the polymers (16),
and equivalent autocorrelation curves were obtained at different distances (from 10 to 30 µm) from
the cover-slip surface. Some measurements of the translational diffusion coefficient of assembled FtsZ
were also performed using fluorescein or tetramethylrhodamine labeled FtsZ with the same result as
reported here for the Alexa 488 labeled protein.
Estimate of molar mass of FtsZ polymers from hydrodynamic measurements. The apparent molar
mass of a single sedimenting solute species, M, may be calculated using measured values of the
sedimentation coefficient s and the diffusion coefficient D according to the Svedberg equation (27)
[5]
where T, R and ρ respectively denote the absolute temperature, the universal gas constant and the
density of the solution and the partial specific volume of the solute. It is stressed that since the
frictional coefficients for sedimentation and diffusion cancel in the derivation of equation [5], the
estimate of molar mass obtained via this relation is valid independent of the structure of the
M RT
(1 v)
s20,w
D20,w
v

CHAPTER 1
50
sedimenting/diffusing species. As described in the results section, at high magnesium concentration
both sedimentation and diffusion measurements indicate the presence of a narrow size distribution of
oligomeric species. We assume that the Svedberg relation holds approximately for such a distribution
(28), and utilize the average value of s obtained from analysis of sedimentation velocity and the average
of the D values obtained from analysis of dynamic light scattering and fluorescence correlation
spectroscopy.
RESULTS
Sedimentation velocity
Distributions of sedimentation coefficients, obtained from SEDFIT analysis of the sedimenting
boundaries, are plotted in Figure 1 for 1 g/L solutions prepared at different Mg2+ concentrations in the
presence of millimolar GTP supplemented with the GTP-regenerating system. At millimolar
magnesium, > 95% of the protein sedimented with an experimental s-value of around 13 S, while the
corresponding GDP-form of FtsZ sedimented as a mixture of monomers and dimers, with s-values
around 3 and 4 S, confirming our previous observations (9). The sedimentation coefficient distribution
of GTP-FtsZ polymers changed dramatically upon lowering the Mg2+ concentration. At cation
concentrations between 10-100 µM, the sedimentation data were well described by two main
sedimenting species with s-values around 2.5 and 6-7 S, respectively. The relative concentration of
these two species changed with Mg2+ (the 2.5 S species predominating at lower Mg2+), a characteristic
feature of Mg2+-linked self-association reactions (4). In the presence of EDTA, the protein sedimented
as a single peak with s-value of 2.5 S, compatible with a protein monomer whose shape deviates from
the expected behavior of a globular protein.

CHAPTER 1
51
Figure 1. Mg2+
dependence of FtsZ sedimentation velocity in the presence of 1 mM GTP + GTP-RS:
Sedimentation profiles of 1 g/L FtsZ equilibrated in working buffer at the magnesium concentrations specified
in the figure.
Figure 2. Sedimentation velocity analysis of FtsZ in the presence of 1 mM GMPCPP at variable Mg2+ concentration: Sedimentation profiles of 0.5
g/L FtsZ equilibrated in working buffer at the magnesium concentrations specified in the figure.
CHAPTER 1
52
The sedimentation velocity data obtained at a protein concentration of 0.5 g/L at various magnesium
concentrations (Figure 2) qualitatively resemble those obtained with GTP, indicating a highly concerted
formation of FtsZ polymers. At millimolar Mg2+, the distribution of sedimentation coefficients is
quantitatively described by a single sharp sedimenting boundary with an average s-value of 18-19 S,
significantly higher than that characterizing the sedimentation of FtsZ polymers in the presence of
GTP. This difference in s-value could in principle be attributed to differences in average mass and/or
conformation, but additional data to be described below will indicate that the difference may be
attributed exclusively to differences in average mass. The c(s) distributions at intermediate Mg2+
showed that below 70 M Mg2+ polymers induced by GMPCPP sedimented primarily as a mixture of
rapidly sedimenting (18-19 S) and slowly sedimenting (~3 S) species, with only minor contribution from
intermediate species. This difference in s-value could in principle be attributed to differences in
average mass and/or conformation, but additional data to be described below will indicate that the
difference may be attributed exclusively to differences in average mass. The c(s) distributions at
intermediate Mg2+ showed that below 70 μM Mg2+ polymers induced by GMPCPP sedimented
primarily as a mixture of rapidly sedimenting (18-19 S) and slowly sedimenting (~3 S) species, with only
minor contribution from intermediate species. The most remarkable difference with GTP-FtsZ
polymers regarding the effect of magnesium is that, in the presence of GMPCPP, the observed
sedimentation coefficient of rapidly sedimenting protein remained invariant through the whole Mg2+
concentration range assayed (i.e. at 20 µM and above). In the presence of EDTA, FtsZ sedimented as a
main single species with s-value around 2.5 S, similar to the value obtained under the same conditions
but in the presence of GTP instead of GMPCPP (see above). Hence the presence of EDTA, under our
conditions, precluded the formation of polymers irrespective of the nucleotide triggering
polymerization.
Concentration-dependent 90o static light scattering
In Figure 3A the relative intensity of 690-nm light scattered at 90º recorded in a typical experiment is
plotted as a function of time for a set of serial dilutions for FtsZ equilibrated in working buffer with 5
mM Mg2+ (black) or EDTA (grey) in the presence of 1 mM GTP supplemented with GTP-RS. The
CHAPTER 1
53
calculated concentration dependence of scattering intensity, expressed as the scaled Rayleigh ratio
(see experimental procedures) measured at different Mg2+ concentrations over a broad range of FtsZ
concentrations (0.1-1.5 g/L) is plotted in Figure 3B. The results of corresponding measurements of the
dependence of the 90o static light scattering of FtsZ upon the concentration of protein in the presence
of GMPCPP and various concentrations of Mg2+ are plotted in Figure 3C. The outstanding qualitative
feature of the measured dependence of scattering intensity upon concentration at fixed Mg2+ in both
nucleotides is a concerted transition between a region at low concentration with a low slope and a
second region at higher concentration with a substantially greater slope. These data may be used to
test the hypothesis that below a certain “critical concentration” comparable to a solubility, wsol, the
protein exists primarily as a single species or narrow distribution of low molecular weight scatterers,
Mw,low, and that all protein in excess of the critical concentration exists as a single species or narrow
distribution of high molecular weight scatterers, the mean size of which is approximately independent
of the amount of scatterer. As we assume that for a given concentration of Mg2+ the size of the large
scatterers is approximately independent of total concentration, we can define an apparent molar
mass, ,
apparent
w highM , equal to the product of the true molar mass times a constant attenuation factor equal
to the ratio of the intensity of scattering at 90o to that at 0o, which will be subsequently shown to be of
the order of one-third. We then propose that the concentration dependence may be approximately
described by the following two-state model:
, ,
,90o
apparent
low w low high w high
opt
R ww M w M
K [6]
where the proportion of low and high molecular weight scatterers is governed by a quasi-first order
phase transition. Thus, for wtot ≤ wsol, wlow = wtot, and whigh = 0, and for wtot > wsol, wlow = wsol and whigh
= wtot – wsol. Equation [6] was fit to the combined data for each nucleotide at each Mg2+
concentration. The best fit of this equation to each data set is plotted together with the data in
Figures 3B and 3C, and the best-fit parameter values are presented in Table 1.

CHAPTER 1
54
Figure 3. Mg2+ dependence of FtsZ composition gradient light scattering (90o, 690 nm). A. Light scattering of a FtsZ solution (initial concentration around 1
g/L) in working buffer in the presence of 1 mM GTP (black) or EDTA (grey), both supplemented with GTP-RS, plotted as a function of the elapsed time
through a dilution experiment. B and C. Concentration dependence of GTP-FtsZ and GMPCPP-FtsZ static light scattering at 90º, respectively. From top to
bottom, Mg2+ content was 5 mM, 300 μM, 100 μM and 20 μM (B) and 5 mM, 100 μM, 50 μM and 20 μM (C). Scattering profiles showing only a small
dependence of scattering upon concentration were obtained from solutions containing 2 mM EDTA. Curves represent best-fits of the solubility model to
each data set, calculated using equation [6] with best-fit parameter values given in Table 1. Vertical dashed lines depict the FtsZ concentrations at which
sedimentation velocity experiments in Figures 1 and 2 were conducted.
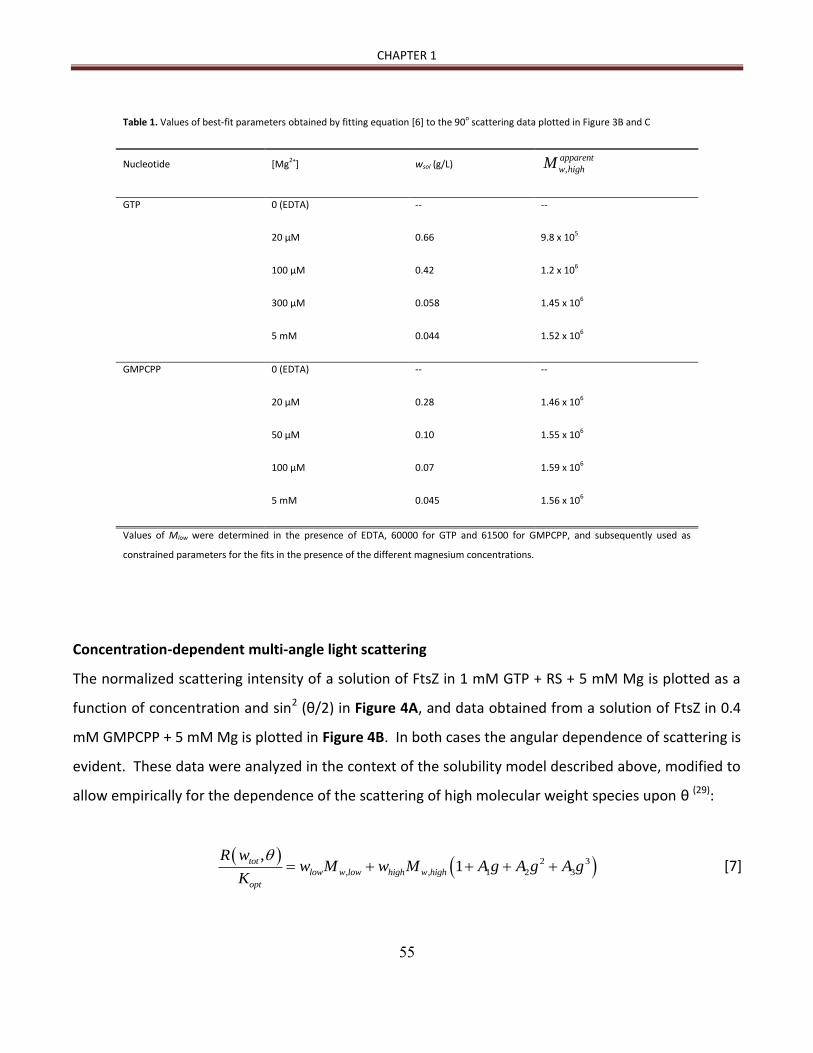
CHAPTER 1
55
Table 1. Values of best-fit parameters obtained by fitting equation [6] to the 90o scattering data plotted in Figure 3B and C
Nucleotide [Mg2+] wsol (g/L) ,
apparent
w highM
GTP 0 (EDTA) -- --
20 μM 0.66 9.8 x 10⁵
100 μM 0.42 1.2 x 10⁶
300 μM 0.058 1.45 x 10⁶
5 mM 0.044 1.52 x 10⁶
GMPCPP 0 (EDTA) -- --
20 μM 0.28 1.46 x 10⁶
50 μM 0.10 1.55 x 10⁶
100 μM 0.07 1.59 x 10⁶
5 mM 0.045 1.56 x 10⁶
Values of Mlow were determined in the presence of EDTA, 60000 for GTP and 61500 for GMPCPP, and subsequently used as
constrained parameters for the fits in the presence of the different magnesium concentrations.
Concentration-dependent multi-angle light scattering
The normalized scattering intensity of a solution of FtsZ in 1 mM GTP + RS + 5 mM Mg is plotted as a
function of concentration and sin2 (θ/2) in Figure 4A, and data obtained from a solution of FtsZ in 0.4
mM GMPCPP + 5 mM Mg is plotted in Figure 4B. In both cases the angular dependence of scattering is
evident. These data were analyzed in the context of the solubility model described above, modified to
allow empirically for the dependence of the scattering of high molecular weight species upon θ (29):
2 3
, , 1 2 3
,1tot
low w low high w high
opt
R ww M w M A g A g A g
K
[7]

CHAPTER 1
56
where g = sin2(θ/2). A surface calculated according to the best least-squares fit of equation [7] to the
combined data, using the best-fit parameter values given in the figure caption, is plotted together with
the data in Figures 4A and 4B.
According to the results obtained by fitting the solubility model to the data obtained from solutions
containing GMPCPP + 5 mM Mg, the “solubility” of low molecular weight scatterer is too low to be
distinguishable from zero with current experimental precision. The data are compatible with a value
of Mw,high between 5.7 and 7.0 x 10⁶, corresponding to a mean oligomer stoichiometry between 145
and 175 monomers.
According to the results obtained by fitting the solubility model to the data obtained from solutions
containing GTP + RS + 5 mM Mg, the “solubility” of low molecular weight scatterer is too low to be
distinguishable from zero with current experimental precision. The data are compatible with a value
of Mw,high between 4.2 and 4.8 x 10⁶, corresponding to a mean oligomer stoichiometry between 105
and 120 monomers.
Figure 4. Angular and concentration dependence of scattering of FtsZ polymers in 5 mM Mg and GTP + RS (A) or GMPCPP (B). Scattering intensity plotted
as a function of the w/v FtsZ concentration and sin2 (θ/2). Black mesh surface is the best fit of the solubility model to the experimental data (symbols),
calculated using equation [7] with the following best-fit parameter values. For GTP + RS, wsol = 0, Mw,high = 4.6 (± 0.4) x 106, A1 = -2.32, A2 = 2.67, and A3 = -
1.09. For GMPCPP, wsol = 0, Mw,high = 6.7 (± 0.7) x 106, A1 = -2.62, A2 = 3.0, and A3 = -1.21.

CHAPTER 1
57
Fluorescence correlation spectroscopy
Fluorescence autocorrelation functions obtained at constant protein concentration and various Mg
concentrations in the presence of GTP + RS are plotted in Figure 5A. Comparable data obtained in the
presence of GMPCPP are plotted in Figure 5B. In both panels the shift toward longer relaxation times
with increasing Mg is evident, and may be attributed to the increasing abundance of larger species
with smaller diffusion coefficients. The data were fitted to within experimental precision by equation
[4] with three fluorescent species: a rapidly diffusing free dye, a more slowly diffusing labeled
monomeric FtsZ, and a very slowly diffusing labeled polymeric FtsZ. In the presence of GTP + RS, the
autocorrelation function becomes essentially independent of Mg concentration at concentrations
exceeding ~ 0.4 mM (Figure 5A), and in the presence of GMPCPP, the autocorrelation function
becomes essentially independent of Mg concentration at concentrations exceeding ~ 0.1 mM (Figure
5B). These results accord semiquantitatively with the Mg dependence of polymer formation monitored
by sedimentation velocity (Figures 1 and 2) and 90o light scattering (Figures 3B and C). The best fit
value of the diffusion coefficient of polymer at 5 mM Mg was 4.1 ± 0.3 x 10⁻⁸ cm2/s in GTP + RS and 3.1
± 0.4 x 10⁻⁸ cm2/s in CMPCPP (Figure 5E).

CHAPTER 1
58
Figure 5. Dependence with MgCl2 concentration of translational diffusion properties of FtsZ polymers formed in GTP + GTP-RS or GMPCPP. A and B.
Normalized FCS autocorrelation curves of GTP-FtsZ and GMPCPP-FtsZ polymers, respectively. From faster to slower diffusion, MgCl2 content was 0, 50,
100, 250, 385 µM and 5 mM (A, GTP, the last two indistinguishable) and 0, 50, 250 µM and 5 mM (B, GMPCPP, the last two indistinguishable). Samples
without Mg2+ contain 1 mM EDTA and overlap with unassembled FtsZ-Alexa488 (no GTP or GMPCPP added). The fraction of unassembled FtsZ with GTP
was 15-20% (1 mM-385 µM), 32% (250 µM), 53% (100 µM) and 67% (50 µM MgCl2), and with GMPCPP 15-20% (5 mM-250 µM) and 29% (50 µM MgCl2).
Solid lines are the fits of the models indicated in the main text. Concentration of FtsZ-Alexa 488 was 0.006 g/L and unlabeled FtsZ was added up to 1 g/L. C
and D. Normalized DLS autocorrelation curves of GTP-FtsZ (1 g/L FtsZ) and GMPCPP-FtsZ (0.5 g/L FtsZ) polymers, respectively. From faster to slower
diffusion, MgCl2 content was 0, 300, 350 µM and 5 mM (C, GTP, those with Mg2+ similar within error) and 0, 200, 300 μM, 1.5 and 5 mM (D, GMPCPP, last
three similar within error). Samples without Mg2+ contain 1 mM EDTA. Solid lines are the fits to the model indicated in the main text. E. Dependence of the
normalized translational diffusion coefficient of GTP- (open) and GMPCPP-FtsZ polymers (solid) determined by DLS (triangles) and FCS (circles). Data are
the average of at least three independent experiments ± SD. Horizontal traces depict the average diffusion values calculated over the concentration
independent range, 4.2 x 10⁻⁸ (GTP) and 3.2 x 10⁻⁸ cm2/s (GMPCPP).
Fluorescence autocorrelation functions obtained for different protein concentrations in the presence
of 5 mM Mg and GTP + RS are plotted in Figure 6A, and comparable data obtained in the presence of
GMPCPP are plotted in Figure 6B. In both cases the autocorrelation functions become almost
independent of protein concentration at concentrations exceeding ~ 0.5 g/L, indicating that at these
concentrations almost all of the protein exists as high molecular weight species of constant size. The
limiting values of the diffusion coefficients of polymer in GTP + RS and in GMPCPP are the same as

CHAPTER 1
59
obtained from analysis of Mg dependence as described above (Fig 6E) to within the uncertainties
specified above. Interestingly, early detection of polymers in the presence of GTP occurred at
concentrations slightly above 0.05 g/L coinciding with the critical concentration of polymerization of
FtsZ under these conditions (6, 9, 16). In the presence of EDTA and GTP or GMPCPP, the fluorescence
autocorrelation curves overlap with those obtained for the unassembled protein.
Figure 6. Concentration dependence of translational diffusion of GTP and GMPCPP FtsZ polymers. A and B. Normalized FCS autocorrelation curves of FtsZ
polymers formed in the presence of 1 mM GTP or 0.4-1mM GMPCPP, respectively. From faster to slower diffusion, 0.006, 0.18, 0.5 and 1.5 g/L FtsZ (A,
GTP, last two overlap) and 0.006, 0.09, 0.5 and 1 g/L FtsZ (B, GMPCPP, last two superimposable). The fraction of unassembled FtsZ with GTP was 10%
(1.5-0.5 g/L) and 24% (0.18 g/L), and with GMPCPP 10% (0.5-1 g/L) and 40% (0.09 g/L). Concentration of FtsZ-Alexa 488 was 0.006 g/L and additional
unlabeled FtsZ was added up to the final concentration specified. C and D. Normalized DLS autocorrelation curves of FtsZ polymers formed in the presence
of 1 mM GTP or 0.4 mM GMPCPP, respectively. From faster to slower diffusion: 0.1, 0.3, 0.5, 0.6 and 1.0 g/L FtsZ. Profiles at 0.5 - 1.0 g/L overlap for GTP
and are similar, within error, for GMPCPP. E. Dependence with FtsZ concentration of the normalized apparent diffusion coefficient of GTP- (open) and
GMPCPP-FtsZ polymers (solid) determined by DLS (squares) and FCS (circles). Horizontal lines indicate the average diffusion value of the concentration
independent polymeric species, 4.2 x 10⁻⁸ (GTP) and 3.2 x 10⁻⁸ cm2/s (GMPCPP).
Dynamic light scattering and estimate of molar masses from hydrodynamic measurements
Autocorrelation functions obtained at a constant concentration of protein showed a significant shift to
longer times with increasing Mg concentration both in the presence of GTP + RS and GMPCPP (Figures

CHAPTER 1
60
5C and D). In accordance with FCS data, GTP-FtsZ polymers showed a significant increase of the
translational diffusion coefficient of assembled FtsZ with decreasing Mg2+ concentrations (Figure 5C),
while GMPCPP-FtsZ polymers existed as a defined species with a translational diffusivity that did not
depend on Mg2+ concentration above 20-50 µM (Figure 5D), also in good agreement with the
sedimentation velocity and static light scattering results (Figures 1-3). The translational mobility of
FtsZ polymers in GMPCPP, according to the D-values measured both by FCS and DLS, was
systematically slower than that previously measured for FtsZ in GTP under the same conditions (Figure
5), in agreement with a larger size for the 19 S species that FtsZ forms in the presence of GMPCPP at
high Mg2+. The data were fitted to within experimental precision by equation [3] rendering best fit
values of the diffusion coefficients of polymer in the high Mg concentration limit of 4.3 ± 0.4 x 10⁻⁸
cm2/s in GTP + RS and 3.4 ± 0.2 x 10⁻⁸ cm2/s in CMPCPP (Figure 5E).
DLS autocorrelation functions obtained at different FtsZ concentrations with 5 mM Mg and GTP + RS or
GMPCPP are plotted in Figure 6C and D, respectively. As observed by FCS, profiles become almost
independent of protein concentration above ~ 0.5 g/L FtsZ, verifying our previous findings that the
concentration dependence of the c(s) distribution of GTP-FtsZ was compatible with the concerted
formation of a narrow distribution of favored oligomers (13 S) whose apparent size does not increase
between 0.4 and 1.5 g/L FtsZ (9).
The apparent molar masses calculated from the diffusion values, average of FCS and DLS, and
sedimentation coefficients according to Equation [6] are 3.4 x 10⁶ g (~85 FtsZ molecules/oligomer) for
the GTP-FtsZ polymer and 6.0 x 10⁶ g (~150 FtsZ molecules/oligomer) for the GMPCPP-FtsZ polymer.
Although the diffusion coefficients from DLS data account for the diffusing properties of all species in
solution, it should be noted that the measured autocorrelation function will be mainly contributed by
the bigger species. Therefore, under conditions at which polymers are formed, translational diffusion
coefficients obtained by DLS should be directly comparable to those obtained by FCS for the slowly
diffusing polymeric FtsZ, since the contribution of unassembled species (given their low concentration
and much smaller size) is negligible. This might be also the case for the intermediate GTP-FtsZ species
formed at micromolar Mg2+ (~40 FtsZ subunits as calculated from D and s via the Svedberg equation).

CHAPTER 1
61
DISCUSSION
Comparison of the results obtained by measurement of sedimentation velocity and 90o light scattering
provides a consistent and unequivocal picture of the mechanism of FtsZ self-assembly in the presence
of GTP. The results shown in Figure 1 (GTP + RS) were obtained from solutions containing 1 g/L
protein, indicated by a dashed vertical line in Figure 3B. In the presence of EDTA the scattering signal
is consistent with an average molecular weight corresponding to a mixture of monomeric and dimeric
FtsZ, in qualitative agreement with sedimentation velocity results. In the presence of 100 μM Mg2+, the
scattering data indicate a mixture of approximately 40% low molecular weight species and 60% high
molecular weight species, again in good agreement with the distribution of sedimentation coefficients
shown in Figure 1. In the presence of 5 mM Mg2+ almost complete (>95%) conversion of protein to an
even higher molecular weight species occurs, once again in qualitative agreement with the distribution
of sedimentation coefficients shown in Figure 1. Taken together, the scattering data indicate that the
mean size of the high molecular weight species is approximately independent of protein
concentration, but gradually increases with increasing Mg2+ concentration, apparently attaining a
maximum size between 350 μM and 1 mM, again in qualitative agreement with the results shown in
Figure 1.
The results shown in Figure 2 (GMPCPP) were obtained from solutions containing 0.5 g/L protein,
indicated by a dashed vertical line in Figure 3C. In the absence of Mg2+, the scattering profile is
consistent with an average molecular weight between that of monomeric and dimeric FtsZ, consistent
with the results shown in Figure 2. In the presence of 20 μM Mg2+, the scattering profile is consistent
with the presence of comparable amounts of both low and high molecular weight species, in
qualitative accord with the distribution of sedimentation coefficients obtained from sedimentation
velocity experiments. At higher Mg2+ concentrations, the scattering profile suggests the presence of
predominantly high molecular weight scatterers, the mean size of which is insensitive to changes in
Mg2+ concentration. This last result, which differs from that found in the presence of GTP-RS, is once
again in qualitative accord with distribution of sedimentation coefficients obtained from the
sedimentation velocity experiments.

CHAPTER 1
62
Taken together, the sedimentation velocity data and 90o scattering data provide strong evidence for a
highly concerted transition, thermodynamically similar to a second-order phase transition, between a
paucidisperse size distribution of low molecular weight oligomers, and a paucidisperse size distribution
of high molecular weight oligomers. Both of these observations, together with the results of angle-
dependent static light scattering, dynamic light scattering, and fluorescence autocorrelation
spectroscopy, rule out mechanisms based solely upon incremental growth of oligomer via sequential
addition of monomers, and any scheme leading to unbounded polymer size. The control experiments
conducted in the presence of the slowly hydrolysable analog of GTP exhibit identical qualitative
behavior, indicating that the observed growth scheme is not attributable in essence to a non-
equilibrium steady-state reaction cycle involving GTP hydrolysis and GTP-GDP exchange, although
these factors are likely to modulate the observed behavior, as discussed below.
The mean size of polymer in 5 mM Mg was estimated to be 115 ± 8 in GTP + RS and 165 ± 15 in
GMPCPP on the basis of a two-state analysis of angle- and concentration-dependent light scattering.
The mean size of polymer was also independently estimated from approximate analyses of the results
of measurements of the sedimentation and diffusion coefficients by means of equation [5]. The values
obtained from this relation for the stoichiometry of polymers in GTP and GMPCPP are 85 ± 7 and 150 ±
10 respectively. The difference between the values obtained by the two different approaches may be
attributed at least in part to the fact that both analyses depend upon two-state approximations
applied in rather different contexts. This approximation is probably more realistic when applied to
FtsZ self-assembly in GMPCPP than in GTP.
Although the self-assembly of FtsZ in GTP qualitatively resembles that in GMPCPP, significant
quantitative differences are present. (a) The average size of polymer varies with Mg concentration in
GTP, whereas it does not in GMPCPP. (b) The cooperative transition between low and high molecular
weight distributions appears to be sharper and more similar to a first-order phase transition in the
presence of GMPCPP than in GTP. (c) The average size of polymer in the presence of high Mg is
significantly greater in GMPCPP than in GTP. It is clear that non-equilibrium steady-state effects
arising from GTP hydrolysis and GTP-GDP exchange cannot be responsible for the concerted nature of
the transition between low and high molecular weight species observed in the presence of both GTP +
CHAPTER 1
63
RS and GMPCPP, since the cooperativity of the transition is more pronounced in the presence of the
much more slowly hydrolysable GTP analog.
Fragmentation certainly can limit the size of fibrillar oligomers, but by itself cannot elicit a highly
concerted formation of a narrow distribution of favored polymers in a manner resembling a phase
transition, as we observe here. The results clearly indicate that there is no significant amount of
material existing as oligomers intermediate between a low molecular weight distribution consisting
mainly of monomers and dimers, and a narrow high molecular weight oligomeric species of
stoichiometry between 80 and 180 (depending upon the nucleotide used to promote FtsZ assembly).
The major consequence of fragmentation and annealing of fibrils would be to accelerate the approach
to equilibrium. The rapid exchange of FtsZ subunits when mixing donor-labeled and acceptor-labeled
FtsZ fibrils in the FRET experiments done by Erickson and co-workers (11) does not require the
disappearance of fibrils, merely transient breakage and closure along the length of a fibril. The
essential point is that without a mechanism for formation of a discrete oligomer or narrow molecular
weight distribution of oligomers in a highly cooperative fashion, nucleation + fragmentation alone will
not account for the data.
In summary, the combined results reported above support the following two major
conclusions:
1. The self-assembly of FtsZ under the conditions of this study proceeds by a concerted transition,
thermodynamically resembling a second order phase transition, between a paucidisperse distribution
of low molecular weight species, consisting primarily of monomer and dimer, and a paucidisperse
distribution of high molecular weight species (polymer), the size of which is independent of total
protein concentration, and, in the presence of GMPCPP, is independent of magnesium concentration. It
should be kept in mind that this mode of self-assembly may not necessarily apply under other
experimental conditions, as it is well known that the structure of non-covalent oligomers/polymers
formed by proteins in general, and FtsZ in particular, may vary considerably depending upon solution
conditions (see, for example, (5) and references therein).

CHAPTER 1
64
2. In the limit of high magnesium concentration, the average size of polymer is estimated to lie
between 80 and 120 FtsZ protomers in the presence of GTP + RS, and between 140 and 180 FtsZ
protomers in the presence of GMPCPP.
The purpose of the present report is not to advocate any particular molecular model for
oligomer formation, but to present a substantial body of experimental data obtained via several
biophysical methods that is self-consistent and, in our opinion, must be taken into account in any
future attempt to formulate a mechanistic scheme for FtsZ self-assembly.
We do not attribute physiological significance to the narrow size distribution of oligomeric
species, indicated by our data, since the system studied here is highly simplified and lacks the
companion proteins and surfaces required to assemble the septal ring in vivo. However, the
characterization of FtsZ solution behavior provides information that will ultimately be integrated into
more complex schemes describing systems containing the additional elements referred to above.
CHAPTER 1
65
References
1. Adams, D. W., and Errington, J. (2009) Bacterial cell division: assembly, maintenance and
disassembly of the Z ring, Nat Rev Microbiol 7, 642-653.
2. Margolin, W. (2000) Organelle division: Self-assembling GTPase caught in the middle, Curr Biol
10, R328-330.
3. Mingorance, J., Rivas, G., Vélez, M., Gómez-Puertas, P., and Vicente, M. (2010) Strong FtsZ is
with the force: mechanisms to constrict bacteria, Trends Microbiol 18, 348-356.
4. Rivas, G., López, A., Mingorance, J., Ferrándiz, M. J., Zorrilla, S., Minton, A. P., Vicente, M., and
Andreu, J. M. (2000) Magnesium-induced linear self-association of the FtsZ bacterial cell
division protein monomer. The primary steps for FtsZ assembly, J Biol Chem 275, 11740-11749.
5. Erickson, H. P., Anderson, D. E., and Osawa, M. (2010) FtsZ in bacterial cytokinesis: cytoskeleton
and force generator all in one, Microbiol Mol Biol Rev 74, 504-528.
6. González, J. M., Jiménez, M., Vélez, M., Mingorance, J., Andreu, J. M., Vicente, M., and Rivas, G.
(2003) Essential cell division protein FtsZ assembles into one monomer-thick ribbons under
conditions resembling the crowded intracellular environment, J Biol Chem 278, 37664-37671.
7. Mingorance, J., Tadros, M., Vicente, M., González, J. M., Rivas, G., and Vélez, M. (2005)
Visualization of single Escherichia coli FtsZ filament dynamics with atomic force microscopy, J
Biol Chem 280, 20909-20914.
8. Popp, D., Iwasa, M., Narita, A., Erickson, H. P., and Maeda, Y. (2009) FtsZ condensates: an in
vitro electron microscopy study, Biopolymers 91, 340-350.
9. González, J. M., Vélez, M., Jiménez, M., Alfonso, C., Schuck, P., Mingorance, J., Vicente, M.,
Minton, A. P., and Rivas, G. (2005) Cooperative behavior of Escherichia coli cell-division protein
FtsZ assembly involves the preferential cyclization of long single-stranded fibrils, Proc Natl Acad
Sci U S A 102, 1895-1900.

CHAPTER 1
66
10. Stricker, J., Maddox, P., Salmon, E. D., and Erickson, H. P. (2002) Rapid assembly dynamics of
the Escherichia coli FtsZ-ring demonstrated by fluorescence recovery after photobleaching,
Proc Natl Acad Sci U S A 99, 3171-3175.
11. Chen, Y., and Erickson, H. P. (2009) FtsZ filament dynamics at steady state: subunit exchange
with and without nucleotide hydrolysis, Biochemistry 48, 6664-6673.
12. Erickson, H. P. (2009) Modeling the physics of FtsZ assembly and force generation, Proc Natl
Acad Sci U S A 106, 9238-9243.
13. Huecas, S., Llorca, O., Boskovic, J., Martín-Benito, J., Valpuesta, J. M., and Andreu, J. M. (2008)
Energetics and geometry of FtsZ polymers: nucleated self-assembly of single protofilaments,
Biophys J 94, 1796-1806.
14. Salvarelli, E., Krupka, M., Rivas, G., Vicente, M., and Mingorance, J. (2011) Independence
between GTPase active sites in the Escherichia coli cell division protein FtsZ, FEBS Lett.
15. Jiménez, M., Martos, A., Vicente, M., and Rivas, G. (2011) Reconstitution and organization of
Escherichia coli proto-ring elements (FtsZ and FtsA) inside giant unilamellar vesicles obtained
from bacterial inner membranes, J Biol Chem 286, 11236-11241.
16. Reija, B., Monterroso, B., Jimenez, M., Vicente, M., Rivas, G., and Zorrilla, S. (2011)
Development of a homogeneous fluorescence anisotropy assay to monitor and measure FtsZ
assembly in solution, Anal Biochem 418, 89-96.
17. Schuck, P. (2000) Size-distribution analysis of macromolecules by sedimentation velocity
ultracentrifugation and lamm equation modeling, Biophys J 78, 1606-1619.
18. Attri, A. K., and Minton, A. P. (2005) Composition gradient static light scattering: a new
technique for rapid detection and quantitative characterization of reversible macromolecular
hetero-associations in solution, Anal Biochem 346, 132-138.

CHAPTER 1
67
19. Kameyama, K., and Minton, A. P. (2006) Rapid quantitative characterization of protein
interactions by composition gradient static light scattering, Biophys J 90, 2164-2169.
20. Fernández, C., and Minton, A. P. (2008) Automated measurement of the static light scattering
of macromolecular solutions over a broad range of concentrations, Anal Biochem 381, 254-257.
21. Schmitz, K. S. (1990) An introduction to dynamic light scattering by macromolecules (Chapter 2),
Academic Press, Boston.
22. Kita, R., Takahashi, A., Kaibara, M., and Kubota, K. (2002) Formation of fibrin gel in fibrinogen-
thrombin system: static and dynamic light scattering study, Biomacromolecules 3, 1013-1020.
23. Skakun, V. V., Hink, M. A., Digris, A. V., Engel, R., Novikov, E. G., Apanasovich, V. V., and Visser,
A. J. (2005) Global analysis of fluorescence fluctuation data, Eur Biophys J 34, 323-334.
24. Bacia, K., and Schwille, P. (2007) Practical guidelines for dual-color fluorescence cross-
correlation spectroscopy, Nat Protoc 2, 2842-2856.
25. Culbertson, C. T., Jacobson, S. C., and Michael Ramsey, J. (2002) Diffusion coefficient
measurements in microfluidic devices, Talanta 56, 365-373.
26. Gendron, P. O., Avaltroni, F., and Wilkinson, K. J. (2008) Diffusion coefficients of several
rhodamine derivatives as determined by pulsed field gradient-nuclear magnetic resonance and
fluorescence correlation spectroscopy, J Fluoresc 18, 1093-1101.
27. Svedberg, T., and Pedersen, K. O. (1940) The Ultracentrifuge. Oxford, Clarendon Press.
28. Reisler, E., Cheung, P., and Borochov, N. (1986) Macromolecular assemblies of myosin, Biophys
J 49, 335-342.
29. Zimm, B. H. (1948) The dependence of the scattering of light on angle and concentration in
linear polymer solutions, J Phys Colloid Chem 52, 260-267.
30. Tanford, C. (1961) Physical chemistry of macromolecules.

CHAPTER 1
68
SUPLEMENTARY MATERIAL
Figure S1. Normalized 90o light scattering as a function of time of FtsZ at 12 μM polymerized in the
presence of 1 mM GTP (red), 10 mM GTP (blue) and 1 mM GTP supplemented with GTP regenerating
system (black). We observe that polymers formed are stable in these conditions long enough time to
perform the assays.

CHAPTER 1
69
Figure S2. Normalized 90o light scattering of FtsZ at 12 μM polymerized in the presence of 0.4 mM of
GMPCPP as a function of time. We observe that polymers formed are stable in these conditions long
enough time to perform the assays.

CHAPTER 1
70
APENDIX 1
BIOPHISICAL CHARACTERIZATION OF FtsZ IN ITS GDP-BOUND
STATE (GDP-FtsZ). Regulation by Mg2+ concentration of the
protein association state.
The effect of submillimolar Mg2+ concentrations in the self-association of FtsZ in its GDP-
bound state (GDP-FtsZ) was analyzed using composition gradient static light scattering
(CG-SLS), dynamic light scattering (DLS) and sedimentation velocity and equilibrium.
Experiments were carried out at high ionic strength (500mM KCl) and buffer was
supplemented with different amounts of MgCl2 (from 10 µM to 5 mM) or 2mM EDTA.
FtsZ self-associated from monomer to dimer or small oligomers in a non-cooperative
fashion. Experimental data were quantitatively described by an equilibrium model which
takes into account significant contributions of monomer and dimer and some contribution
of other small oligomers.
EXPERIMENTAL PROCEDURES
All the assays described in this Apendix were done as described in experimental section of
Chapter I and supplemented with 0.1 mM of GDP. Static light scattering data were
processed as previously described by Attri and Minton [1, 2]. The composition dependence
of R/Kopt is modeled in the context of equilibrium scheme described in Apendix 3 [5], Model
1 (Isodesmic model for self-association of GDP-FtsZ), that specify the molar masses of all
significant scattering species, and the dependence of concentrations of i species, ci, upon
postulated equilibrium association constants and the total concentrations of protein.
APENDIX 1
72
RESULTS
Magnesium induces oligomerization of FtsZ. The effect of magnesium was studied in a
wide range of magnesium and FtsZ concentrations. The dependence of the dimerization
was carried out by sedimentation velocity and gradient-concentration-static light
scattering (GC-SLS) and dynamic light scattering (DLS).
The magnesium effect in physiologic high ionic strength conditions (500 mM KCl) was
studied in detail by GC-SLS in a wide range of FtsZ concentrations from around 1 mg/mL
(25 µM) to 0.04 mg/mL (1 µM) (see Figure 2, panel A) and by sedimentation velocity at
FtsZ concentrations of 37.5 and 10 μM. Distributions of sedimentation coefficients of FtsZ
solutions prepared at different Mg2+ concentrations in the presence of 0.1 mM GDP
(Figure 1), were obtained by analysis of the experimental sedimenting boundaries with
SEDFIT program [3]. When FtsZ concentration was 10 μM the predominant species
sedimented with an S-value of 2.5 at all studied magnesium conditions except in the
presence of millimolar concentration of magnesium, where was also present other specie
with an S-value around 3.7 (Figure 1, right panel). This two main species have a
sedimentation coefficient compatible with an FtsZ monomer and dimer according with
Gonzalez et al (2005) [4]. At high FtsZ concentration of 37.5 μM the protein evolves with a
similar behavior (Figure 1, left panel). In the presence of EDTA and in the absence of Mg2+,
the protein sedimented as a single specie with S-value around 2.5 S. At magnesium
concentrations between 10 and 100 µM, the sedimentation data were well described by a
main sedimenting species with S-value around 2.5 S and a very small amount of higher
order species (dimer, trimer…). In these range of concentrations of magnesium chloride
GC-SLS experiments show a displacement of the equilibrium to the formation of small
amount of dimeric species. Finally, at millimolar magnesium concentrations the protein
sediments as a two main species with an experimental s-values of 2.5 and around 3.5-3.9
S, this last species was compatible with the dimer.

APENDIX 1
73
Figure 1. Mg2+
dependence of FtsZ in the presence of 0.1 mM GDP. Sedimentation profiles of 37.5 (left) and
10 μM (right) FtsZ equilibrated in working buffer at the magnesium concentrations specified in the figure.
Similar result was obtained by GC-SLS experiments, plotted in Figure 2 (Panel A), where in
the total absence of Mg2+ and in presence of 2 mM EDTA, experimental data fitted well to
a single species in all range of protein concentrations with an average molecular mass of
43.0 ± 0.3 kDa. Beside this, we observe a small amount of higher order oligomers as
described before [5]. In this range of magnesium concentrations GC-SLS experiments are in
good agreement with the evolution of the system toward the formation of dimeric and a
small amount of larger species. Isodesmic model described in Apendix 3 or reference [5]
(Model 1) were fitted to static light scattering data (Figure 2) in order to obtain the best
parameters that describes the equilibrium process.

APENDIX 1
74
Figure 2. Mg2+
dependence of FtsZ. Composition gradient light scattering (90º, 690 nm) of a FtsZ solution
(initial concentration around 1 g/L) in working buffer in the presence of 0.1 mM GDP. From top to bottom,
Mg2+
content was 5 mM, 1 mM, 100 μM, 30 μM, 10 μM and absence of Magnesium (2mM EDTA). Solid
curves represent best-fits of the isodesmic model to each data set (Isodesmic model for self-association of
GDP-FtsZ described in Apendix 3). Calculated equilibrium constants are in Table 1.
Table 1: Mw, aver and Log Kiso obtained from GC-SLS data.
[Mg2+
]
(mM)
Mw, aver (kDa) Log Kiso CG-SLS
0 (EDTA) 43.0±0.1 -
0.01 46.3 ± 0.5 3.6 ± 0.1
0.05 51.9 ± 0.6 4.2 ± 0.1
0.1 56.4 ± 0.7 4.5 ± 0.1
1 66.5 ± 1.1 4.4 ± 0.1
5 95.7 ± 2.4 4.7 ± 0.1

APENDIX 1
75
The effect of protein concentration in the oligomerization of FtsZ. The dependence of
oligomerization with protein concentration was studied in a wide range. The effect of FtsZ
concentration in the dimerization has been analyzed by sedimentation velocity and GC-
SLS. In the presence of millimolar concentrations of magnesium (5 mM) and high ionic
strength (500 mM KCl) the experiments show a mixture of monomer and dimer. A set of
sedimentation velocity assays of FtsZ in a wide range of concentrations show two main
different species with sedimentation coefficients around 2.5 and 3.9 S respectively (see
Figure 3). The equilibrium is clearly shifted toward dimer formation with increasing the
concentration of FtsZ. The GC-SLS experiments verify this tendency (see Figure 2, pink
curve and Table 1).
Figure 3. Concentration dependence of FtsZ sedimentation velocity in the presence of 0.1 mM GDP and 5
mM Mg2+
. Sedimentation profiles in a wide range of FtsZ concentrations shown the shift to dimer
formation with increasing the concentration of protein.

APENDIX 1
76
DISCUSION
Previous work shows the stability of GDP-FtsZ in absence of Mg2+, and in the presence of
moderate or high ionic strength. Although it was well known that Mg2+ is involved in
oligomerization processes of GDP-FtsZ that is disadvantaged in high ionic strength, was
not determined before the dependence of oligomerization in high ionic strength of GDP-
FtsZ with the micromolar concentrations of Mg2+ [6, 7, 8].
In order to describe the first steps in the oligomerization of GDP-FtsZ and their
dependence on Mg2+ concentration, sedimentation velocity and gradient concentration
static light scattering scattering were employed. This study required the use of Mg2+
concentration in the range from nanomolar to millimolar.
The obtained results from employed techniques were in good agreement to confirm that
the oligomerization of GDP-FtsZ in high ionic conditions is very sensitive to the variation of
concentration of Mg2+. The analysis of the results show that there were two main species
at physiologic millimolar concentrations of Mg2+, monomer and dimer, but small amount
of higher order species were also present in good agreement with the isodesmic model
proposed before [5, 8]. At micromolar concentration of Mg2+ the main species was the
monomer but we also found the presence of dimer and a very small amount of other
larger species. In total absence of Mg2+, in the presence of EDTA, we found that monomer
was the only present species. In the other hand, we saw that the oligomerization of GDP-
FtsZ in the presence of millimolar concentrations of Mg2+ was also protein concentration
dependent. If we increase the concentration of protein the equilibrium was shifted to the
formation of dimer and larger species.
The static light scattering data were fitted to a previously described isodesmic self-
association model [5]. Comparing GDP-FtsZ with GTP-FtsZ, described in Chapter I, and their
dependence with the concentration of Mg2+, we found that in both cases in the range of
micromolar concentrations of Mg2+ the oligomerization and polymerization were
triggered. In the case of GTP-FtsZ the polymerization was much more sensitive to Mg2+
than in the case of GDP-FtsZ. In the absence of Mg2+, in both cases the protein is
essentially a monomer.

APENDIX 1
77
References
1. Attri, A. K., and Minton, A. P. (2005) Composition gradient static light scattering: a
new technique for rapid detection and quantitative characterization of reversible
macromolecular hetero-associations in solution, Analytical biochemistry 346, 132-
138.
2. Attri, A. K., and Minton, A. P. (2005) New methods for measuring macromolecular
interactions in solution via static light scattering: basic methodology and
application to nonassociating and self-associating proteins, Analytical biochemistry
337, 103-110.
3. Schuck P.Size-distribution analysis of macromolecules by sedimentation velocity
ultracentrifugation and lamm equation modeling. Biophys J. 2000 Mar;78(3):1606-
19.
4. González JM, Vélez M, Jiménez M, Alfonso C, Schuck P, Mingorance J, , Minton AP,
Rivas G . Cooperative behavior of Escherichia coli cell-division protein FtsZ
assembly involves the preferential cyclization of long single-stranded fibrils. Proc
Natl Acad Sci U S A. 2005 Feb 8;102(6):1895-900.
5. Martos A, Alfonso C, López-Navajas P, Ahijado-Guzmn R, Mingorance J, Minton AP,
Rivas G. Characterization of self-association and heteroassociation of bacterial cell
division proteins FtsZ and ZipA in solution by composition gradient-static light
scattering. Biochemistry. 2010 Dec 28;49(51):10780-7. Epub 2010 Dec 3.
6. Rivas, G., Fernandez, J. A., and Minton, A. P. (2001) Direct observation of the
enhancement of noncooperative protein self-assembly by macromolecular
crowding: indefinite linear self-association of bacterial cell division protein FtsZ,
Proceedings of the National Academy of Sciences of the United States of America
98, 3150-3155.

APENDIX 1
78
7. Rivas, G., Lopez, A., Mingorance, J., Ferrandiz, M. J., Zorrilla, S., Minton, A. P.,
Vicente, M., and Andreu, J. M. (2000) Magnesium-induced linear self-association of
the FtsZ bacterial cell division protein monomer. The primary steps for FtsZ
assembly, J Biol Chem 275, 11740-11749.
8. Minton AP. Alternative strategies for the characterization of associations in
muticomponent solutions via measurements of sedimentation equilibrium. Prog
Colloid Polymer Sci 1997;107:11-19.

CHAPTER II
Different Response of GTP- and GMPCPP-FtsZ Polymers to KCl
Concentration.

CHAPTER 2
80
FtsZ polymers are flexible structures with the ability to arrange adopting different
morphologies depending upon the experimental conditions, as observed by electron
microscopy. The aim of this work was to check the possible effect of salt content on those
polymers in solution, and confirm whether the apparent differences in size (number of
monomers forming the polymer) also observed by EM correlate with the measurements in
solution. Sedimentation velocity, light scattering and fluorescence correlation
spectroscopy were used to determine the effect of potassium chloride or acetate. KCl has
opposite effects on the strength of FtsZ assembly and on the size and diffusion of the
fibrils formed in the presence of GTP or GMPCPP. Lowering KCl concentrations rendered
polydisperse and larger GMPCPP-FtsZ polymers, while resulted in smaller GTP-FtsZ fibrils
consistently behaving as a narrow distribution of preferred species. Potassium acetate
has effects comparable to KCl on size distribution of GTP-FtsZ species in the presence of
Mg2+. However, in the absence of the cation (i.e. with EDTA) resulted in the formation of
large aggregates of FtsZ that, otherwise, remains mainly monomeric. Our results highlight
the modulation of the state of association of FtsZ polymers by solution conditions and
physiological ligands, which may be a reflection of the fine-tuning of Z ring formation.

CHAPTER 2
81
INTRODUCTION
FtsZ is probably the most ubiquitous prokaryotic division protein, being an essential
component of the bacterial cell division machinery. It is structurally similar to tubulin
although their sequences are different. Like tubulin, FtsZ is a GTPase able to form GTP-
dependent polymers whose assembly/disassembly, linked to GTP hydrolysis, is crucial for
the formation of the dynamic division ring [1]. E. coli FtsZ has been shown to polymerize in
dilute physiological buffers into one subunit thick protofilaments behaving as a narrow
distribution of preferred fibrils [2-5], thought to be the basic entity conforming the Z-ring.
The polymorphic nature of FtsZ polymers, enlightened by their capacity to group adopting
different levels of organization in vitro depending on the experimental conditions as
shown by AFM and EM [4, 6, 7], is a reflect of the sensitivity of FtsZ assembly to the
environment.
Besides the nucleotide requirement for FtsZ assembly, monovalent and divalent cations
seem to play a determinant role [8]. K+ binding is indispensable for polymerization of E. coli
FtsZ at physiological pH and, although assembly can also be triggered by other
monovalent cations, it is unlikely they play a physiological role given their low affinity for
FtsZ [8, 9]. The interaction of FtsZ with monovalent cations has been proposed to be
responsible for the dynamic behavior of the polymers, and it has been shown that K+
concentration affects both the GTPase activity and morphology of FtsZ polymers [8, 10, 11].
On the other hand, the role of Mg2+ in FtsZ assembly remains controversial. Thus, it has
been suggested that Mg2+ is not required for FtsZ assembly but for GTP hydrolysis, since
assembly has been found to occur in solutions containing EDTA [11, 12]. However, we have
found that removal of Mg2+ precludes FtsZ polymerization at neutral pH in the presence of
KCl and GTP or GMPCPP, a slowly hydrolysable GTP analog [5].
Here we present a comprehensive study of the effect of KCl concentration on the behavior
of FtsZ polymers induced by GTP or GMPCPP using a combination of biophysical
methodologies including sedimentation velocity (SV), fluorescence correlation
spectroscopy (FCS), dynamic light scattering (DLS) and concentration gradient light
scattering (CG-SLS). After a brief description of the materials and methods, the KCl

CHAPTER 2
82
dependence of the size and homogeneity of both kinds of FtsZ polymers is presented and
the differences are emphasized. Next, the effect of replacing KCl by potassium acetate
(KAc), particularly in EDTA containing solutions, on FtsZ assembly was addressed. The
manuscript concludes with a comparison of the behavior of the GMPCPP and GTP-FtsZ
polymers with respect to their modulation by KCl.
MATERIALS AND METHODS
FtsZ purification and labeling: FtsZ was purified and labeled with Alexa 488 as described
previously [13-15]. Experiments were performed in working buffer (50 mM Tris-HCl, pH 7.5)
supplemented with the specified concentration of KCl (or KAc) and Mg2+ or EDTA. GTP-
FtsZ polymers were stabilized by an enzymatic regenerating system added immediately
before starting measurements [16].
Sedimentation velocity: Experiments were conducted in a Beckman Optima XL-I
ultracentrifuge (Beckman-Coulter) with interference optics, following the experimental
procedure described before [5]. Differential sedimentation coefficient distributions c(s)
were obtained from SEDFIT analysis of the sedimenting boundaries [17].
Composition-gradient static light scattering (CG-SLS) - The dependence of 90o scattering
intensity with FtsZ concentration was monitored in a modified mini-DAWN light scattering
photometer (Wyatt Technology Corp., Santa Barbara) using an automated dilution
protocol as previously described [18, 5]. Protein concentration at each dilution step was
calculated from the initial concentration and raw scattering intensity data converted to
the scaled Rayleigh ratio R/Kopt [18] that, although in this case is not a direct function of the
composition of macromolecular solutes because of the angular dependence in the
scattering of FtsZ polymers [5], is here shown as representative for comparison of different
solution properties depending on the composition.
Fluorescence correlation spectroscopy: FCS measurements were carried out on a
MicroTime 200 instrument with two-photon excitation as previously described [15]. Data
traces were globally analyzed with the software FFS Data processor (SSTC, Belarus) [19]
considering a two species model (10-20% free dye and unassembled protein) for
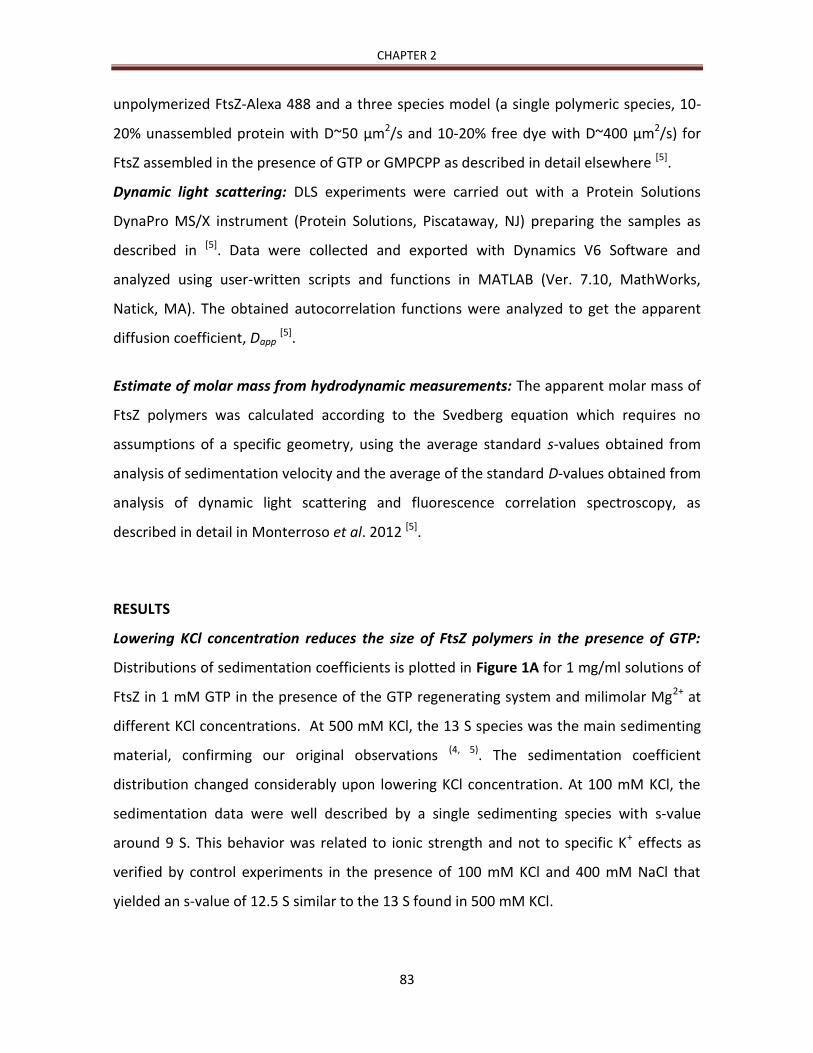
CHAPTER 2
83
unpolymerized FtsZ-Alexa 488 and a three species model (a single polymeric species, 10-
20% unassembled protein with D~50 μm2/s and 10-20% free dye with D~400 μm2/s) for
FtsZ assembled in the presence of GTP or GMPCPP as described in detail elsewhere [5].
Dynamic light scattering: DLS experiments were carried out with a Protein Solutions
DynaPro MS/X instrument (Protein Solutions, Piscataway, NJ) preparing the samples as
described in [5]. Data were collected and exported with Dynamics V6 Software and
analyzed using user-written scripts and functions in MATLAB (Ver. 7.10, MathWorks,
Natick, MA). The obtained autocorrelation functions were analyzed to get the apparent
diffusion coefficient, Dapp [5].
Estimate of molar mass from hydrodynamic measurements: The apparent molar mass of
FtsZ polymers was calculated according to the Svedberg equation which requires no
assumptions of a specific geometry, using the average standard s-values obtained from
analysis of sedimentation velocity and the average of the standard D-values obtained from
analysis of dynamic light scattering and fluorescence correlation spectroscopy, as
described in detail in Monterroso et al. 2012 [5].
RESULTS
Lowering KCl concentration reduces the size of FtsZ polymers in the presence of GTP:
Distributions of sedimentation coefficients is plotted in Figure 1A for 1 mg/ml solutions of
FtsZ in 1 mM GTP in the presence of the GTP regenerating system and milimolar Mg2+ at
different KCl concentrations. At 500 mM KCl, the 13 S species was the main sedimenting
material, confirming our original observations (4, 5). The sedimentation coefficient
distribution changed considerably upon lowering KCl concentration. At 100 mM KCl, the
sedimentation data were well described by a single sedimenting species with s-value
around 9 S. This behavior was related to ionic strength and not to specific K+ effects as
verified by control experiments in the presence of 100 mM KCl and 400 mM NaCl that
yielded an s-value of 12.5 S similar to the 13 S found in 500 mM KCl.

CHAPTER 2
84
Figure 1. Effect of KCl on FtsZ assembly: Sedimentation velocity and static light scattering analysis. Panels
A, B: Sedimentation coefficient distributions of FtsZ (1 mg/ml) in the presence of 1 mM GTP (A) or GMPCPP
(B) equilibrated in working buffer with the KCl concentrations specified in the graphs. Panel C:
Concentration dependence of FtsZ scattering at 90º in GTP and GMPCPP containing buffers at different KCl
concentrations. For GTP species (open), KCl was 500 (circles) and 100 mM (triangles), while for GMPCPP
species (solid), KCl was 500 (circles) and 100 mM (triangles).
These results were confirmed by CG-SLS experiments: the concentration dependence of
scattering intensity at 90o (expressed as normalized Rayleigh ratio R/Kopt, see methods and
reference 18) decreased as KCl is lowered (Figure 1C). In the absence of angular
dependence of scattering, R/Kopt is directly proportional to protein mass (20). These
findings were in good agreement with the translational diffusion coefficients for GTP-FtsZ
determined by FCS and DLS, which varied from 4 to 5 m2/s when KCl was lowered
from 500 and 100 mM KCl (Figure 2). The faster diffusion and slower sedimentation
observed for FtsZ in 100 mM KCl yielded an apparent mass (via Svedberg equation) for
these species which is equivalent to protofilaments of 30-40 monomers, in very good
agreement with electron microscopy determinations under the same experimental
conditions [2, 3, 21]. These values are 2-3 fold lower than the 100 ± 15 monomers estimated
for FtsZ protofilaments at 500 mM KCl [5]. Interestingly, taken together, the different
experimental techniques favor the presence of a narrow distribution of oligomeric FtsZ
species, whose apparent size is inversely proportional to KCl concentration.

CHAPTER 2
85
FtsZ polymers formed in the presence of GMPCPP become larger and more
heterogeneous upon lowering KCl concentration: The dependence on KCl of the
sedimentation coefficient distributions of FtsZ in the presence of GMPCPP (a slowly-
hydrolyzable GTP analog) and milimolar Mg2+ are plotted in Figure 1B. In 100 mM KCl, the
distribution of FtsZ was quantitatively described by main species with s-values larger than
30 S, significantly higher that the s-value (18 S) that characterized the sedimentation of
GMPCPP-FtsZ in 500 mM KCl of 18 S [5]. Therefore the effect of KCl on the sedimentation
behavior of GMPCPP-FtsZ was the opposite than the observed for the GTP system.
Figure 2. Effect of KCl on FtsZ assembly: Fluorescence correlation and dynamic light scattering analysis. A-
D: Normalized FCS autocorrelation curves of GTP-FtsZ (b) and GMPCPP-FtsZ polymers (a) in the presence of
500 (A), 300 (B), 200 (C) and 100 mM KCl (D). Fits of the models described in reference 5 appear as solid
lines. The fit of the GMPCPP-FtsZ profile at 200 mM KCl is shown (faint line) to indicate its low quality, while
that of the GMPCPP-FtsZ curve at 100 mM KCl was unacceptable and hence is not shown. Autocorrelation
curves of unassembled FtsZ-Alexa488 are plotted for comparison (c). E. Dependence of the normalized
translational diffusion coefficients of GTP-FtsZ (open) and GMPCPP-FtsZ (solid) as determined by FCS
(circles) and DLS (squares). Data obtained for GMPCPP-FtsZ polymers at 200 mM KCl is masked to indicate
low quality of the fit. Data are the average of at least three independent experiments ± SD.

CHAPTER 2
86
These findings were confirmed by measurements of the concentration dependence of
scattering intensity of GMPCPP-FtsZ at different KCl concentrations, being the scattering
signal at 100 mM KCl considerably larger than at 500 mM KCl (Figure 1C). In addition,
fluorescence and scattering measurements yielded D-values of 3 µm2/s at 500 mM KCl
and 2 µm2/s at 200 mM KCl (Figure 2). The faster sedimentation and slower diffusion
observed for GMPCPP-FtsZ polymers with lower KCl concentrations is compatible with an
increase in the average mass of the polymers, which is opposite to the observed for FtsZ in
GTP. Interestingly, the heterogeneity of the large sedimenting species of GMPCPP-FtsZ
found at low KCl were compatible with the poor quality of the fit to a single-species model
of the FCS at 100 mM KCl, also observed in the fitting of the DLS data. This contrasts with
the homogeneous appearance of the GTP-FtsZ species independently of KCl.
A cautionary note on the effect of EDTA on E. coli FtsZ assembly: A remarkable
observation was obtained when evaluating the assembly behavior of FtsZ in Mg2+ free
buffers (in the presence of EDTA) containing acetate instead of chloride as the main
monovalent anion. The scattering signal measured by CG-SLS was so high that saturated
the detector (not shown), meaning that an aggregation process was taking place. To verify
this result, we carried out sedimentation velocity analysis of these same samples (Figure
3A). At the highest salt concentration (500 mM KAc) and EDTA large part of the loading
material precipitated, while the remaining protein sedimented with s-values higher than
30 S. The sedimentation behavior was essentially the same at 300 mM, and the protein
sedimented slower (ca. 14S) at 100 mM KAc. The larger > 30S aggregates found at 500
mM KAc dissociated to a ca. 4S species by a tenfold drop in protein concentration (0.1 g/l,
inset in Figure 3A).
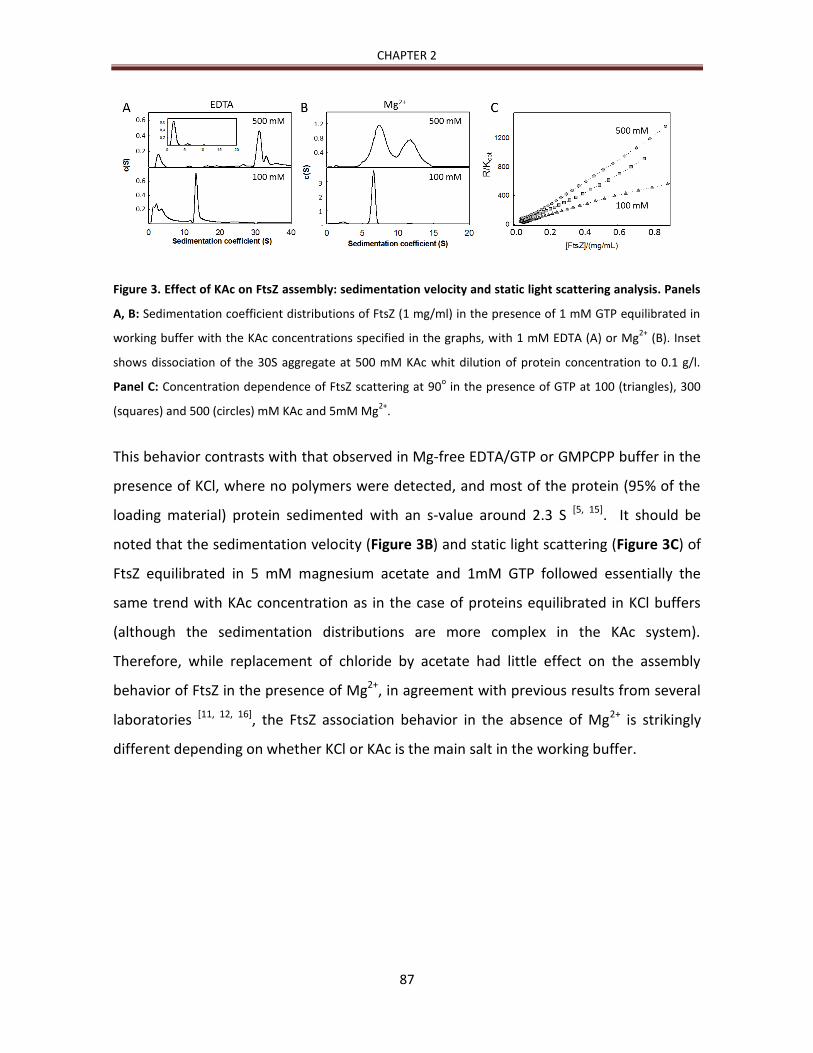
CHAPTER 2
87
Figure 3. Effect of KAc on FtsZ assembly: sedimentation velocity and static light scattering analysis. Panels
A, B: Sedimentation coefficient distributions of FtsZ (1 mg/ml) in the presence of 1 mM GTP equilibrated in
working buffer with the KAc concentrations specified in the graphs, with 1 mM EDTA (A) or Mg2+
(B). Inset
shows dissociation of the 30S aggregate at 500 mM KAc whit dilution of protein concentration to 0.1 g/l.
Panel C: Concentration dependence of FtsZ scattering at 90o in the presence of GTP at 100 (triangles), 300
(squares) and 500 (circles) mM KAc and 5mM Mg2+
.
This behavior contrasts with that observed in Mg-free EDTA/GTP or GMPCPP buffer in the
presence of KCl, where no polymers were detected, and most of the protein (95% of the
loading material) protein sedimented with an s-value around 2.3 S [5, 15]. It should be
noted that the sedimentation velocity (Figure 3B) and static light scattering (Figure 3C) of
FtsZ equilibrated in 5 mM magnesium acetate and 1mM GTP followed essentially the
same trend with KAc concentration as in the case of proteins equilibrated in KCl buffers
(although the sedimentation distributions are more complex in the KAc system).
Therefore, while replacement of chloride by acetate had little effect on the assembly
behavior of FtsZ in the presence of Mg2+, in agreement with previous results from several
laboratories [11, 12, 16], the FtsZ association behavior in the absence of Mg2+ is strikingly
different depending on whether KCl or KAc is the main salt in the working buffer.

CHAPTER 2
88
Table 1. Effect of KCl concentration on sedimentation and diffusion coefficients of FtsZ polymers obtained
with GTP and GMPCPP.
[KCl]
(mM)
s20,wa
(S)
D20,DLS
(μm2/s)
D20,FCS
(μm2/s)
MSb
(g) monomers/polymer
GTP
500 14.4 ± 0.1 4.3 ± 0.4 4.1 ± 0.3 3.4 x 10⁶ 85 ± 7
300 10.4 ± 0.1 4.4 ± 0.3 4.7 ± 0.3 1.9 x 10⁶ 48 ± 5
200 --- --- 5.0 ± 0.3 --- ---
100 9.0 ± 0.1 4.8 ± 0.4 5.1 ± 0.3 1.7 x 10⁶ 43 ± 4
GMPCPP
500 19.9 ± 0.1 3.4 ± 0.2 3.1 ± 0.4 6.0 x 10⁶ 150 ± 10
300 26.8 ± 0.1 2.7 ± 0.3 2.9 ± 0.4 1.0 x 10⁷ 240 ± 37
200 --- --- 2.4 ± 0.2 --- ---
100 > 38 --- --- --- ---
Measurements of 0.5 g/L FtsZ in working buffer with 5 mM MgCl2. a Major species when several are present.
bApparent molar mass calculated via the Svedberg equation from the sedimentation coefficient and the
average values of the diffusion coefficients obtained by DLS and FCS.
DISCUSSION
Using a variety of hydrodynamic and thermodynamic techniques we have measured the
effect of KCl on the size distribution and homogeneity of FtsZ species in the presence of
GTP, and in the presence of a slowly hydrolyzable analog, under steady-state conditions.
The combined results presented here point clearly that the apparent size of the narrow
distribution of polymeric species consistently observed at high KCl (4, 5) was found to
decrease upon lowering salt concentration from around 100 (500 mM) to 30-40
monomers (100 mM) per protofilament. This is opposite to the behavior of GDP-
containing FtsZ oligomers, in which lowering KCl enhances Mg2+-linked protein self-
association [13]. Although the possible functional consequences of these findings are not
yet known, they point that the formation of FtsZ oligomers (linked to GDP) and polymers
(GTP-driven) do not share the same assembly pathway.
The sizes for the polymers in 500 mM KCl reported here (Table 1) and by static light
scattering in a previous work [5] are in excellent agreement with those determined by AFM
[25], 103 ± 26 subunits for GTP-FtsZ polymers and 137 ± 32 subunits for GMPCPP-FtsZ
polymers. Our estimates of sizes from the solution measurements are then in remarkable
good agreement with reported data from EM or AFM under equivalent conditions.

CHAPTER 2
89
In the case of GTP-FtsZ polymers, the differences in size might be related with the
suggested tendency of FtsZ polymers to anneal that seems to be enhanced under
conditions of lower GTPase activity [11] as those at 500 mM KCl compared to the higher
GTPase activity reported for FtsZ polymers at 100 mM KCl [10]. The parallel study of FtsZ in
the presence of GMPCPP demonstrate that these FtsZ species responded very different to
KCl. The GMPCPP is able to inhibit the GTPase activity [22]. A possible explanation would be
that the even lower rate of nucleotide hydrolysis in GMPCPP-FtsZ polymers leads to the
formation of larger polymers which size also decreases upon lowering the salt
concentration, but that these shorter filaments suffer some kind of electrostatically driven
assembly rendering more polydisperse higher order species. With increasing ionic
strength, these attractive interactions are screened, and the size of polymer decrease. The
sensitivity of FtsZ polymers to the solution conditions seems to be determining not only
the structural arrangement of the polymers [4, 7] but their final size, as reflected by the
wide range of lengths reported in different EM studies. Thus, at 50-100 mM salt EM
depicts polymers of sizes around 50 subunits in KCl [24] and ranging between 20-40
subunits in KAc [2], similar to the 43 ± 4 with 100 mM KCl estimated in this work. Our
observation that the size of GTP-FtsZ polymers increases with increasing salt content,
whether with KCl or KAc, fully agrees with the work by Chen and Erickson [11] in KAc,
where they observed the same trend in the size of the polymers and determined that, in
the several assays tested, KCl and KAc gave identical results.
We have observed a remarkable effect on the behavior of GTP-FtsZ at neutral pH in
Mg-free buffers containing EDTA depending on the main monovalent anion: replacement
of chloride by acetate provokes the aggregation of FtsZ, that otherwise exists as a soluble
ca. 2.3 S species in Tris-KCl buffer. Very recently, Erickson and co-workers have used KAc
buffers to characterize FtsZ filament dynamics at steady state by means of fluorescence-
based assays with mutant FtsZ proteins [11]. In their experiments, authors have used EDTA
to block the GTPase activity, allegedly altering only polymer dynamics but not the degree
of protein assembly [11], i.e. stabilizing them without de-assembly upon GTP depletion. Our
experimental observations indicate that Erickson’s group statement that FtsZ is able to
CHAPTER 2
90
polymerize at neutral pH in Mg-free buffers in the presence of EDTA, has to be taken
cautiously, since the absence of polymerization in Tris-KCl buffer might not be an
exception.
The Z-ring is an essential element of bacterial division responsible for the invagination of
the cell membrane that, closely followed by the septation of the cell wall, produces the
separation of two daughter cells [1]. Z-ring formation and constriction is known to occur
under the control of a concerted downstream reaction modulated by the proteins of the
divisome, some of which interact directly with the ring [23]. It is therefore reasonable to
think that both the FtsZ pool in the cytoplasm and also the assembled structure are able
to react to subtle environmental changes, such as concentration of a certain ligand
(GTP/GDP ratio, cation content) or modulators in the membrane with which it interacts
(ZipA, FtsN and others), in order to act at a specific moment in the cell cycle. It has been
speculated about the polymorphic nature of the FtsZ polymers, able to form very distinct
structures depending on the experimental conditions in vitro [4, 7], proving its ability to
adapt to subtle changes in the surrounding. The results presented here clearly show the
plasticity of the Z-ring is reflecting, in turn, the plasticity of the FtsZ species, their main
individual constituent polymer, whose structural organization is very much modulated by
small physiological ligands and osmolytes. In addition, our results could help to clarify
several discrepancies reported on the literature of FtsZ.

CHAPTER 2
91
References
1. Mingorance J, Rivas G, Vélez M, Gómez-Puertas P, Vicente M. Strong FtsZ is with
the force: mechanisms to constrict bacteria. Trends Microbiol. 2010 Aug;18(8):348-
56. and references therein.
2. Chen Y, Erickson HP. Rapid in vitro assembly dynamics and subunit turnover of FtsZ
demonstrated by fluorescence resonance energy transfer. J Biol Chem. 2005 Jun
10;280(23):22549-54.
3. Romberg L, Simon M, Erickson HP. Polymerization of Ftsz, a bacterial homolog of
tubulin. is assembly cooperative? J Biol Chem. 2001 Apr 13;276(15):11743-53.
Epub 2001 Jan 4.
4. González JM, Vélez M, Jiménez M, Alfonso C, Schuck P, Mingorance J, Vicente M,
Minton AP, Rivas G. Cooperative behavior of Escherichia coli cell-division protein
FtsZ assembly involves the preferential cyclization of long single-stranded fibrils.
Proc Natl Acad Sci U S A. 2005 Feb 8;102(6):1895-900. Epub 2005 Jan 31.
5. Mg2+-linked self-assembly involves the concerted formation of a narrow
distribution of oligomeric species. Begoña Monterroso, Rubén Ahijado-Guzmán,
Belén Reija, Carlos Alfonso, Silvia Zorrilla, Allen P. Minton, and Germán Rivas.
Biochemistry In press.
6. Mingorance J, Tadros M, Vicente M, González JM, Rivas G, Vélez M.Visualization of
single Escherichia coli FtsZ filament dynamics with atomic force microscopy. J Biol
Chem. 2005 May 27;280(21):20909-14. Epub 2005 Mar 26.
7. Popp D, Iwasa M, Narita A, Erickson HP, Maéda Y. FtsZ condensates: an in vitro
electron microscopy study. Biopolymers. 2009 May;91(5):340-50.
8. Tadros M, González JM, Rivas G, Vicente M, Mingorance J. Activation of the
Escherichia coli cell division protein FtsZ by a low-affinity interaction with
monovalent cations. FEBS Lett. 2006 Sep 4;580(20):4941-6. Epub 2006 Aug 8.
http://www.ncbi.nlm.nih.gov/pubmed?term=J%20Biol%20Chem.%202005%20Jun%2010%3B280%2823%29%3A22549-54.
http://www.ncbi.nlm.nih.gov/pubmed?term=J%20Biol%20Chem.%202001%20Apr%2013%3B276%2815%29%3A11743-53.
http://www.ncbi.nlm.nih.gov/pubmed?term=J%20Biol%20Chem.%202005%20May%2027%3B280%2821%29%3A20909-14.

CHAPTER 2
92
9. Mingorance J, Rueda S, Gómez-Puertas P, Valencia A, Vicente M. Escherichia coli
FtsZ polymers contain mostly GTP and have a high nucleotide turnover. Mol
Microbiol. 2001 Jul;41(1):83-91.
10. Lu C, Erickson HP. Purification and assembly of FtsZ. Methods Enzymol.
1998;298:305-13.
11. Chen Y, Erickson HP. FtsZ filament dynamics at steady state: subunit exchange with
and without nucleotide hydrolysis. .- Biochemistry. 2009 Jul 21;48(28):6664-73.
12. Erickson HP, Anderson DE, Osawa M. FtsZ in bacterial cytokinesis: cytoskeleton and
force generator all in one. Microbiol Mol Biol Rev. 2010 Dec;74(4):504-28.
13. Rivas G, López A, Mingorance J, Ferrándiz MJ, Zorrilla S, Minton AP, Vicente M,
Andreu JM. Magnesium-induced linear self-association of the FtsZ bacterial cell
division protein monomer. The primary steps for FtsZ assembly. J Biol Chem. 2000
Apr 21;275(16):11740-9.
14. Jiménez M, Martos A, Vicente M, Rivas G. Reconstitution and organization of
Escherichia coli proto-ring elements (FtsZ and FtsA) inside giant unilamellar vesicles
obtained from bacterial inner membranes. J Biol Chem. 2011 Apr 1;286(13):11236-
41. Epub 2011 Jan 21.
15. Reija B, Monterroso B, Jiménez M, Vicente M, Rivas G, Zorrilla S. Development of a
homogeneous fluorescence anisotropy assay to monitor and measure FtsZ
assembly in solution. Anal Biochem. 2011 Nov 1;418(1):89-96. Epub 2011 Jul 13.
16. González JM, Jiménez M, Vélez M, Mingorance J, Andreu JM, Vicente M, Rivas G.
Essential cell division protein FtsZ assembles into one monomer-thick ribbons
under conditions resembling the crowded intracellular environment. J Biol Chem.
2003 Sep 26;278(39):37664-71. Epub 2003 Jun 14.

CHAPTER 2
93
17. Schuck P, Rossmanith P. Determination of the sedimentation coefficient
distribution by least-squares boundary modeling. Biopolymers. 2000 Oct
15;54(5):328-41.
18. Fernández C, Minton AP. Automated measurement of the static light scattering of
macromolecular solutions over a broad range of concentrations. Anal Biochem.
2008 Oct 15;381(2):254-7. Epub 2008 Jun 27.
19. Skakun VV, Hink MA, Digris AV, Engel R, Novikov EG, Apanasovich VV, Visser AJ.
Global analysis of fluorescence fluctuation data. Eur Biophys J. 2005 Jun;34(4):323-
34. Epub 2005 Feb 12.
20. K.A. Stacey, Light-Scattering in Physical Chemistry, Academic Press, New York,
1956.
21. Li Z, Trimble MJ, Brun YV, Jensen GJ. The structure of FtsZ filaments in vivo
suggests a force-generating role in cell division. EMBO J. 2007 Nov 14;26(22):4694-
708. Epub 2007 Oct 18.
22. Salvarelli E, Krupka M, Rivas G, Vicente M, Mingorance J. Independence between
GTPase active sites in the Escherichia coli cell division protein FtsZ. FEBS Lett. 2011
Dec 15;585(24):3880-3. Epub 2011 Nov 3.
23. Vicente M, Rico AI, Martínez-Arteaga R, Mingorance J. Septum enlightenment:
assembly of bacterial division proteins. J Bacteriol. 2006 Jan;188(1):19-27.
24. Huecas S, Llorca O, Boskovic J, Martín-Benito J, Valpuesta JM, Andreu JM.
Energetics and geometry of FtsZ polymers: nucleated self-assembly of single
protofilaments. Biophys J. 2008 Mar 1;94(5):1796-806. Epub 2007 Nov 16.
25. Mateos-Gil et al. 2012. In Press
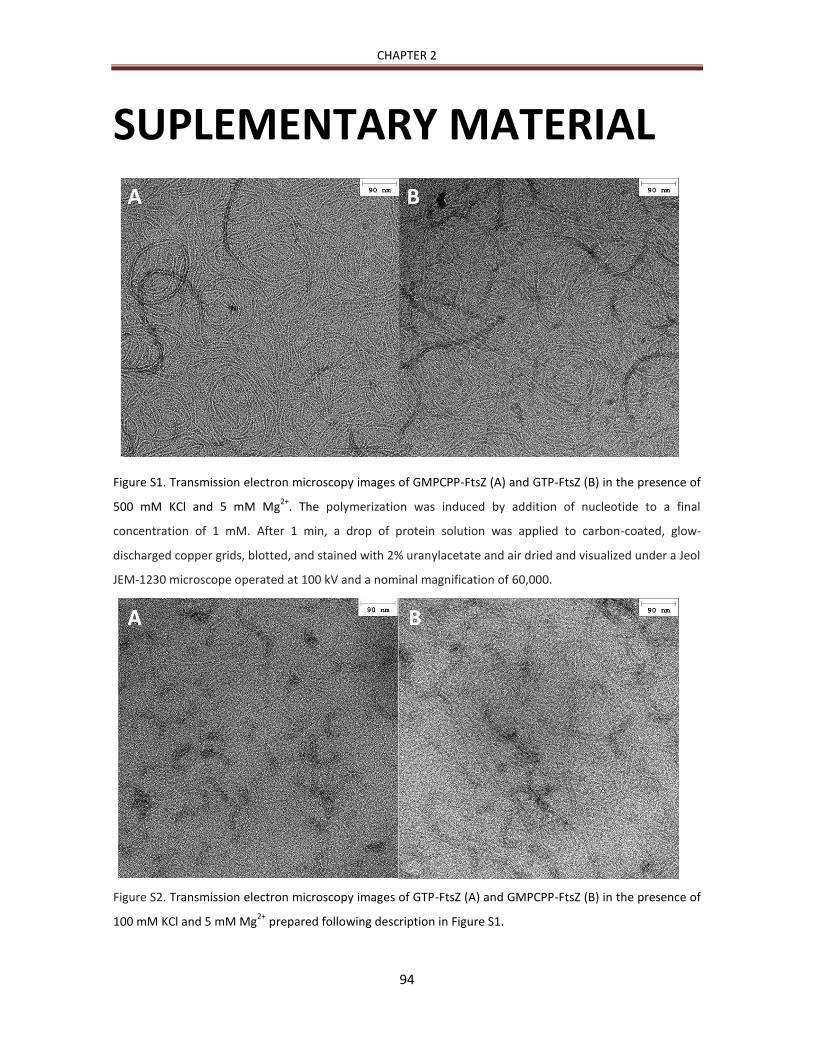
CHAPTER 2
94
SUPLEMENTARY MATERIAL
Figure S1. Transmission electron microscopy images of GMPCPP-FtsZ (A) and GTP-FtsZ (B) in the presence of
500 mM KCl and 5 mM Mg2+
. The polymerization was induced by addition of nucleotide to a final
concentration of 1 mM. After 1 min, a drop of protein solution was applied to carbon-coated, glow-
discharged copper grids, blotted, and stained with 2% uranylacetate and air dried and visualized under a Jeol
JEM-1230 microscope operated at 100 kV and a nominal magnification of 60,000.
Figure S2. Transmission electron microscopy images of GTP-FtsZ (A) and GMPCPP-FtsZ (B) in the presence of
100 mM KCl and 5 mM Mg2+
prepared following description in Figure S1.

CHAPTER III
RECONSTITUTION, SELF-ASSEMBLY AND SERS-BASED DETECTION
OF THE INTERACTIONS BETWEEN THE ESSENTIAL DIVISION FtsZ
PROTEIN AND BACTERIAL MEMBRANE ELEMENTS
CHAPTER 3
96
Surface-enhanced Raman scattering spectroscopy (SERS) sensing has been applied to
detect the interaction of the FtsZ protein from Escherichia coli with membrane-bound
elements of the division machinery on the surface of synthetic and natural membranes
supported on silver-coated polystyrene micron-sized beads. The engineered micro-beads
offer a stable support with a high density of SERS hotspots, allowing the sensing of
conformational changes associated to the binding of FtsZ to the membrane. This system
can be exploited to develop systematic assays to screen for substances that inhibit FtsZ
attachment to the membrane with potential antimicrobial activity.

CHAPTER 3
97
INTRODUCTION
The detection of interactions between soluble proteins and membrane receptors
at the membrane environment is very important to biological and pharmacological
research as many biochemical processes involve membranes and, therefore, a significant
amount of the successful drugs in the market target membrane-associated proteins. The
understanding of these processes is key for the development of new families of
therapeutic agents, especially those targeting protein-membrane receptor interactions.[1]
The bacterial division machinery is a good example of an essential dynamic
macromolecular assembly process that takes place at the membrane.
The first known event during the bacterial division process is the formation of the
proto-ring, where the soluble cytoplasmic protein FtsZ interacts with the membrane
protein ZipA [2] When FtsZ and ZipA interact, conformational changes occur in the C-
terminal domain of ZipA.[3] The understanding of the FtsZ-ZipA interaction within the
membrane is of special interest as it is essential for the bacterial cell division process[4]
and, consequently, an important target in the development of new families of antibiotics.
ZipA, a membrane protein, is a 328-amino acid protein that is composed of three
domains.[5] However, the binding activity toward FtsZ is localized in the C-terminal domain
(residues 189−328). Therefore mutagenesis of the ZipA gene, followed by overexpression
and purification were carried out by eliminating the part ranging from the N-terminal
domain to the P/Q domain of native ZipA (aminoacids 1-188), while preserving the
bioactivity[6] and also keeping the hexahistidine-tag, which is known to bind strongly to
silver, gold and Ni-NTA groups.[7] In the case of FtsZ, the wild type protein was expressed
and purified from E. coli.[8] Notably, FtsZ has GTPase activity[9] and, in vitro, forms a
variety of polymers in a GTP-dependent manner.[10] We designed several experiments of
increasing complexity to study by SERS the FtsZ-ZipA interaction that initiates the bacterial
division.
High throughput screening devices are strongly dependent on strategies to
miniaturize the sensors. Employing particles as nanoscopic reporters offers the possibility
to screen the biomolecular interactions on native membranes.[1] On this way,

CHAPTER 3
98
Nanoplasmonics has been developed sufficiently to provide suitable tools for studying the
mechanisms underlying the interaction between biomacromolecules. A key factor is the
engineering of a plasmonic surface with sufficient colloidal stability to reproduce the
natural conditions that involve the bioproblem. Surface-enhanced Raman scattering
(SERS) spectroscopy[11] is a ultrasensitive molecular spectroscopy technique for with
detection limits down to the single molecule have been demonstrated.[12] Additionally,
SERS is a vibrational spectroscopy, and thus it provides detailed information about the
structure, conformation, and environment of the given molecular target and, more
important, experiments can be carried out under biological conditions.[13] These features
make SERS especially suitable for the characterization of such protein or nucleic acid
interactions that induce conformational changes.[14] However, working with plasmonic
nanoparticles and proteins, is usually demanding due to either the size of the target
analyte as compared with that of the substrate or the need of using solvents or other
biological buffers with high ionic strength to avoid protein denaturalization. Thus, to
properly address this drawback a considerable effort is required toward the preparation of
highly stable while optically active materials, to be used as both supports and optical
enhancers. During the last years our group has pioneered the engineering of colloidally
stable, optically dense discrete particles comprising a polymeric or inorganic micro- or
submicron-particle homogeneously coated with the desired plasmonic nanostructure.[15]
Herein we take advantage of these fabrication protocols to engineer polystyrene
microparticles coated with gold and silver (PS@Au@Ag), which display high optical
activity, for the immobilization of lipid or bacterial inner membrane and the study of the
structural behavior of membrane proteins involved in the cell division process.
In this work, the interaction between FtsZ and ZipA was studied by detection of the
vibrational changes in the spectra of ZipA supported onto metallic enhancing
nanostructure platforms (PS@Au@Ag beads) promoted by the addition of FtsZ. The
characterization of this interaction was done at three different levels of complexity
regarding the way ZipA was stabilized onto the metallic nanostructure surface. First,
interaction of FtsZ with soluble recombinant mutant of ZipA attached through their

CHAPTER 3
99
hexahistidine tag to the nanostructures was characterized. Results were then compared to
those obtained for FtsZ-ZipA interaction with this ZipA mutant within a lipid bilayer
environment. Finally, the interaction of FtsZ with wild type ZipA, that is in the E. coli inner
membrane that includes other division components, was detected.
RESULTS
Engineered microparticles as SERS platform: PS@Au@Ag microparticles were prepared
by using slight modifications of the protocols described in previous reports.[15a, 16] A
scheme illustrating the different steps involved in the fabrication of the hybrid material,
together with their scanning electron microscopy (SEM) characterization, is shown in
Figure 1A. Briefly, the positively charged surface of the selected support, in this case
homogeneous polystyrene beads with 3 μm diameter, was sequentially coated with
polyelectrolytes of opposite charge, namely polystyrenesulfonate (PSS, negative),
poly(diallyldimethylammoniumchloride) (PDDA, positive), again PSS and finally,
poly(allylaminehydrochloride) (PAH, positive), so as to improve the homogeneity of the
coating. The outer PAH layer generates a highly positively charged surface (zeta potential
+35 mV) that is appropriate for the adsorption of negatively charged gold nanoparticles
(zeta potential -40 mV) (step 2). Upon extensive cleaning to ensure that all non-adsorbed
gold nanoparticles were removed, those which remained adsorbed were epitaxially
overgrown with silver by in situ reduction of Ag+, using salicylic acid in a glycine buffer (pH
9.5), at room temperature (step 3). It is interesting to note that gold seeds are preferred
over silver for subsequent silver growth, mainly due to their higher chemical stability.[17]
After systematic variation of the amount of added Ag+ between 0.6 and 2.4 μmol per mg
of polymer beads, an Ag+ concentration of 1.8 μmol per mg of beads was selected as
optimal, since lower concentrations did not result in suitable interparticle plasmon
coupling, while higher concentrations yielded interconnected particles with localized
surface plasmon resonance (LSPR) radiative damping.[18] As a final product, this
preparation process resulted in micron-sized hybrid plasmonic particles with a
homogeneous coating of interacting silver particles[19] of ca. 50 nm in size.

CHAPTER 3
100
Optical properties of the material were characterized by UV-Vis-NIR spectroscopy
on a dispersion of the silver coated beads showing a maximum centered at 660 nm (Figure
1B). The optical enhancing properties of the nanostructured microbeads were tested
through SERS measurements using Benzenethiol (BT) as a model molecular probe. The
SERS spectra of BT (Figure 1C) at different excitation wavelengths were dominated by the
vibrational modes of BT corresponding to the ring breathings (999 and 1073 cm-1,) and the
C-H in-plane bending (1023 cm-1).
Figure 1. (A) Scheme of the preparation of PS@Au@Ag beads and corresponding SEM characterization. Step
1: micron-sized polystyrene beads were wrapped with polyelectrolytes by sequential LbL self-assembly of
PSS, PDDA, PSS, and PAH. Step 2: 15 nm gold nanoparticles were adsorbed onto the functionalized surface
of the beads. Step 3: Silver was epitaxially growth on the adsorbed gold nanoparticle surfaces to obtain the
final nanocomposite material. (B) UV-Vis-NIR spectrum of the PS@Au@Ag beads in water. (C) SERS spectra
of benzenethiol on PS@Au@Ag measured upon excitation with 633, 785 and 830 nm laser lines.

CHAPTER 3
101
SERS-monitoring FtsZ-ZipA interactions: In a first approach the purified recombinant
mutant of ZipA (s2-ZipA, aminoacids 189−328) was directly attached to engineered
PS@Ag@Au beads through the hexahistidine-tag. It is worth noting that different amounts
of s2-ZipA (5 to 20 µM) were added to maximize the SERS signal, which was found to be
best for a concentration of 15 µM in dispersions containing 3.3 mg beads per mL. To
investigate the interactions of s2-ZipA with FtsZ, 25 μM of the latter was added to the
PS@Ag@Au-s2-ZipA sample, either in the GDP and GTP forms.
Figure 2. Conformations of s2-ZipA (A); s2-ZipA interacting with FtsZ (B); and overlapped conformations of
s2-ZipA (C), before (purple) and after (brown) interaction with FtsZ. Spiral: α-helix; arrow: β-sheet; and, line:
random coil. These structures can be accessed free of charge from the Protein Data Bank (access numbers:
1F7W and 1F46). [3, 20]
As an indication, Figure 3 shows the conformations of s2-ZipA,[20] s2-ZipA interacting with
FtsZ[3] and the overlapped conformations of s2-ZipA before and after interaction with FtsZ.
On the other hand, Figure 4A shows the SERS spectra for s2-ZipA attached to the beads,
with and without FtsZ, in the presence and the absence of GTP. The SERS spectrum of s2-
ZipA (Figure 3A) is dominated by bands that can be assigned to different amino acid
residues; for example 1600 cm-1 (Phe, Tyr), 1460 cm-1 (Ala, Ile, Val, Leu, Tyr), 1319 cm-1
(Ala, Lys, Ile, Val, Ser, Gly, Tyr), 1199 cm-1 (Phe, Tyr), 1031 cm-1 (Phe, Tyr), 1000 cm-1 (Phe),
938 cm-1 (Leu, Lys, Val), 848 cm-1 (Ile, Tyr), 785 cm-1 (Ala, Trp, Phe).[21] All these residues,
except Phe, are components of the α3-helix (Figures 2A and 3B), which is the closest
domain (1.2 nm) to the silver surface. The closest Phe residue is around 1.5 nm from the
surface (in the α2-helix), however the position of its aromatic ring facing down and almost
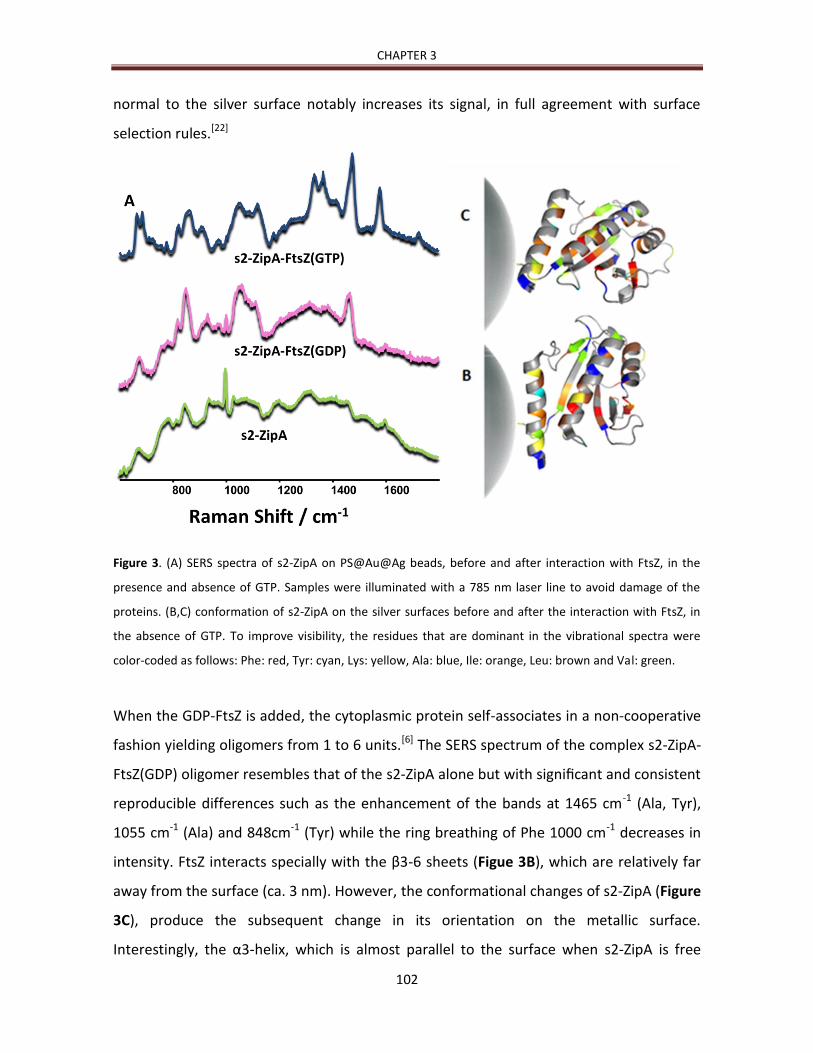
CHAPTER 3
102
normal to the silver surface notably increases its signal, in full agreement with surface
selection rules.[22]
Figure 3. (A) SERS spectra of s2-ZipA on PS@Au@Ag beads, before and after interaction with FtsZ, in the
presence and absence of GTP. Samples were illuminated with a 785 nm laser line to avoid damage of the
proteins. (B,C) conformation of s2-ZipA on the silver surfaces before and after the interaction with FtsZ, in
the absence of GTP. To improve visibility, the residues that are dominant in the vibrational spectra were
color-coded as follows: Phe: red, Tyr: cyan, Lys: yellow, Ala: blue, Ile: orange, Leu: brown and Val: green.
When the GDP-FtsZ is added, the cytoplasmic protein self-associates in a non-cooperative
fashion yielding oligomers from 1 to 6 units.[6] The SERS spectrum of the complex s2-ZipA-
FtsZ(GDP) oligomer resembles that of the s2-ZipA alone but with significant and consistent
reproducible differences such as the enhancement of the bands at 1465 cm-1 (Ala, Tyr),
1055 cm-1 (Ala) and 848cm-1 (Tyr) while the ring breathing of Phe 1000 cm-1 decreases in
intensity. FtsZ interacts specially with the β3-6 sheets (Figue 3B), which are relatively far
away from the surface (ca. 3 nm). However, the conformational changes of s2-ZipA (Figure
3C), produce the subsequent change in its orientation on the metallic surface.
Interestingly, the α3-helix, which is almost parallel to the surface when s2-ZipA is free
CHAPTER 3
103
(Figure 3B), gets farther away up to 1.8 nm on one side while approaching on the opposite
side upon complexation (Figure 3C). This variation leads to positioning the Ala residue
perfectly aligned with the silver surface at 0.7 nm, notably increasing its corresponding
SERS signal as described by the electromagnetic mechanism.[23] Additionally, the
condensed aromatic moiety of Tyr in α3 becomes perpendicular to the surface, contrary
to the aromatic ring of Phe, which loses its coupling to the surface vector as the α2-helix
opens its angle with respect to the surface. This leads to an increase of the Tyr signal and a
decrease of that due to Phe. These variations resemble those reported by monocrystal X-
ray diffraction.[3]
In the presence of GTP, FtsZ forms a polymer. Besides the changes appreciated
with the oligomeric FtsZ complex (Figure 3A), large enhancements of several bands at
1580 cm-1 (Tyr), 1366 and 1332 cm-1 (Trp, Val), 1115 cm-1 (Ala), 909 cm-1 (Ala) can be
observed indicating a closer distance of the α3-helix to the silver surfaces. Additionally,
new SERS bands appear at 1724 cm-1 (amide I), 1178 cm-1 (Tyr). Although due to the size
of the polymeric FtsZ, the interaction of some of their residues within the plasmonic
surface cannot be discarded, the difference of both vibrational spectra of s2-ZipA with
respect to different forms of FtsZ reveals a different structural conformation of s2-ZipA in
the presence of oligomers or polymers. This significant structural difference in s2-ZipA
protein is consistent with previous studies revealing a moderate affinity between ZipA and
GDP-FtsZ.[6] Observed structural differences might be thus related with the effect exerted
by ZipA that, by interactions with GTP-FtsZ polymers, renders polymer bundles that
would, induce a heavier structural change in the s2-ZipA spectra.[25]
Detection of the interaction of FtsZ with ZipA attached to the lipid membrane.
In order to confirm the successful immobilization of the membranes onto the
beads, fluorescence images were acquired using DiI C18 (Figure 4A), which selectively
attaches to the lipidic membranes, and anti-ZipA+ anti-rabbit-488 (Figure 4B), which
selectively recognises the s2-ZipA attached to the lipid membrane. Negative controls using
antibodies and fluorescence dies as performed successfully. The SERS spectrum of E. coli
polar lipids doped with DGS-NTA (Figure 4C) is dominated by the lipidic CH2 scissoring and
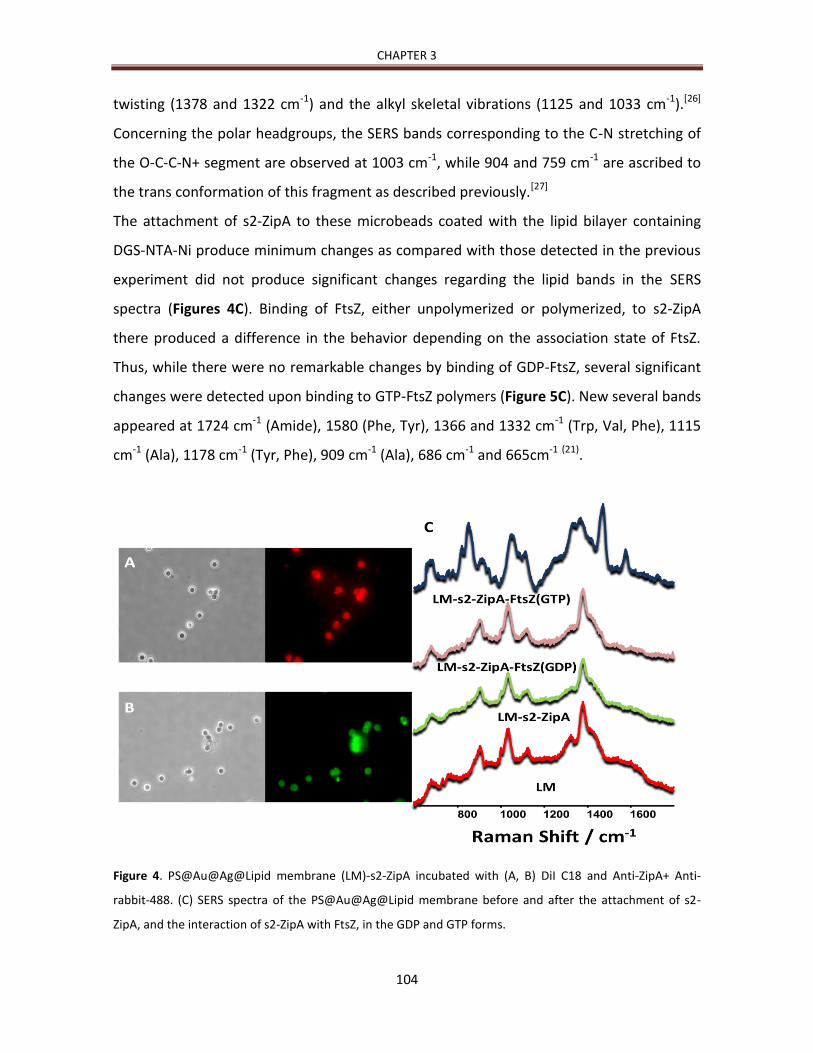
CHAPTER 3
104
twisting (1378 and 1322 cm-1) and the alkyl skeletal vibrations (1125 and 1033 cm-1).[26]
Concerning the polar headgroups, the SERS bands corresponding to the C-N stretching of
the O-C-C-N+ segment are observed at 1003 cm-1, while 904 and 759 cm-1 are ascribed to
the trans conformation of this fragment as described previously.[27]
The attachment of s2-ZipA to these microbeads coated with the lipid bilayer containing
DGS-NTA-Ni produce minimum changes as compared with those detected in the previous
experiment did not produce significant changes regarding the lipid bands in the SERS
spectra (Figures 4C). Binding of FtsZ, either unpolymerized or polymerized, to s2-ZipA
there produced a difference in the behavior depending on the association state of FtsZ.
Thus, while there were no remarkable changes by binding of GDP-FtsZ, several significant
changes were detected upon binding to GTP-FtsZ polymers (Figure 5C). New several bands
appeared at 1724 cm-1 (Amide), 1580 (Phe, Tyr), 1366 and 1332 cm-1 (Trp, Val, Phe), 1115
cm-1 (Ala), 1178 cm-1 (Tyr, Phe), 909 cm-1 (Ala), 686 cm-1 and 665cm-1 (21).
Figure 4. PS@Au@Ag@Lipid membrane (LM)-s2-ZipA incubated with (A, B) DiI C18 and Anti-ZipA+ Anti-
rabbit-488. (C) SERS spectra of the PS@Au@Ag@Lipid membrane before and after the attachment of s2-
ZipA, and the interaction of s2-ZipA with FtsZ, in the GDP and GTP forms.

CHAPTER 3
105
SERS detection of assembled FtsZ polymers on the E. coli inner membrane.
In subsequent experiments, bacterial membranes were deposited onto the
plasmonic beads. The inner membrane vesicles were isolated from wild-type E. coli (strain
JM600) exponential phase culture.[28] The inner and outer membranes were separated by
sucrose gradient centrifugation,[29] washed and diluted to reach 20 absorbance units at
280 nm, and stored frozen.[30] For the deposition, the membranes were added to the bead
dispersion and incubated at 37 oC. In this case, entire ZipA is a natural component of the
bacterial membrane. In order to confirm the successful immobilization of the membranes
onto the beads, fluorescence images were acquired using DiI C18 (Figure 5A), which
selectively attaches to the lipidic membranes, and anti-ZipA+ anti-rabbit-488 (Figure 5B),
which selectively recognises the ZipA membrane protein.
Figure 5. PS@Au@Ag@inner membrane (IM) incubated with (A, B) DiI C18; and, Anti-ZipA+ Anti-rabbit-488.
Negative control experiments were carried out, thus evidencing the absence of nonspecific adsorption of
the dyes and the successful immobilization of the membrane. (C) SERS spectra of the PS@Au@Ag@inner
membrane before and after the interaction with FtsZ, in the presence and absence of GTP.
CHAPTER 3
106
The PS@Au@Ag@inner membrane beads were characterized by SERS prior to the
interaction with the FtsZ protein (Figure 5C). The SERS spectrum, as in lipid membrane
case, is dominated by the lipidic CH2 scissoring and twisting (1378 and 1322 cm-1) and the
alkyl skeletal vibrations (1125 and 1033 cm-1).[26] Concerning the polar headgroups, the
SERS bands corresponding to the C-N stretching of the O-C-C-N+ segment are observed at
1003 cm-1, while 904 and 759 cm-1 are ascribed to the trans conformation of this fragment
as described previously.[27] Notably, several aminoacids can be recognized as well,
especially those of Phe (1000 cm-1) and Tyr (1319 cm-1), which is consistent with the high
SERS cross-sections of their aromatic groups, as compared with the essentially alkylic
nature of the membrane. As in the case of lipid membrane-coated beads, when the GDP-
FtsZ protein is added minimum changes can be inferred from the spectrum as compared
with those detected in the previous experiments without membranes. This is most likely
due to the fact that the lipidic membrane increases the distance between ZipA and the
plasmonic surface but also because the oligomeric FtsZ does not affect sufficiently the
membrane elements. When GTP is added, FtsZ forms a polymer that directly interacts
with different membrane elements. The SERS spectrum of this complex shows notable
differences as compared to that of the membrane. Basically, the spectrum presents
several new bands at 1589 cm-1 (Phe, Tyr), 1182 cm-1 (Tyr, Phe, C-C stretch) and 1080 cm-1
(C-C skeleton gauche structure). On the other hand, bands at 1380 cm-1 (CH2 scissoring
from lipid chains) and 906 cm-1 (C-C stretch and skeletal bend) decreases in intensity. The
presence of these aminoacid bands, together with the shifts in those of the lipidic
membrane, suggests that the polymeric FtsZ not only interacts with ZipA but also are
interacting with other membrane elements. Further, these results are compatible with
data from two-hybrid and other interaction assays indicating the existence of a complex
network of interactions between E.coli cell division proteins.[31]
DISCUSSION
The result of the reconstitution of proto-ring elements provides enough evidences
to confirm the role of membrane protein ZipA that is anchoring FtsZ filaments to the inner
membrane. It was observed in SEM images that the growth of FtsZ polymers attached

CHAPTER 3
107
from membrane through ZipA is forming three-dimensional network, even grow into
fibers that link different microbeads.
In addition, we present the fabrication of a highly efficient SERS substrate, shaped
as discrete microbeads instead of metal films or other conventional SERS supports, as the
basis for the study and detection of the interaction between biological macromolecules.
These nanostructured platforms, carrying a high dense collection of silver hotspots
homogeneously distributed on the surface, present several advantages that make them
especially suitable as portable sensors. Besides are very stable and observable under a
conventional optical microscope. The high sensitivity of SERS, allowing to work with very
small amounts of beads, and consequently lipids, membrane and proteins, decreasing in
turn the effective cost and lowering the detection limits as compared with conventional
colloidal suspensions [15, 17]. As seen in this work, they also provide the ability to detect
specific macromolecular assemblies, thus overcoming the need to use specific antibodies
or fluorescence dies.
The interaction between ZipA and FtsZ induces a modification in the structure of
the C-terminal domain of ZipA,[3] that produces changes in the frequencies and intensities
of the signals characterizing the spectra of the protein. Although by SERS those changes
are easily detectable because they reflect modifications in chains and aromatic residues
that are very sensitive to small changes in secondary and higher-order structures. Thus,
while the spectra of mutant s2-ZipA (attached to either plain or lipid coated PS@Au@Ag
beads) were modified in the presence of FtsZ polymers (GTP-FtsZ), the interaction with
oligomeric FtsZ (GDP-FtsZ) was detected only in the absence of lipids, indicating the
conformational changes produced in s2-ZipA by binding of FtsZ are different depending on
the association state of the later and/or the environment of the sensor. The fact that the
interaction with both species in the absence of lipids is actually detected rendering
different vibrational spectra suggests a different structural conformation of s2-ZipA on the
sensor surface in the presence of oligomers (GDP-FtsZ) and polymers (GTP-FtsZ). In the
case of GDP-FtsZ, was demonstrated that the interaction does not significantly affect the
interaction between GDP-FtsZ monomers [15]. On the other hand, in the case of GTP-FtsZ,

CHAPTER 3
108
were reported clear evidences about the bundle formation of GTP-FtsZ polymers by
interaction with ZipA [31]. Also, in the case of lipid coating, the bilayer might be dissipating
the SERS signal, making an interaction undetectable.
Regarding s1-ZipA mutant, none of the interactions tested produced a significant change
in the SERS spectra. The P/Q domain would provide, enough distance between the
interaction domain in s1-ZipA and the silver sensor, meaning the structural changes
induced in ZipA would have not been transmitted from that point to the sensor along the
linker chain.
As in the case of lipid coated beads, the interaction between the beads coated with
bacterial inner membrane and GDP-FtsZ oligomers is not detectable. In the case of the
interaction with the polymer (GTP-FtsZ), however, FtsZ is interacting not only with ZipA
but with other elements of the bacterial division machinery present in the membrane as
part of a downstream complex network of interactions [2, 31].
The considerable changes observed in the SERS spectra might, therefore, reflect
significant conformational changes arising from this cascade of events in the
macromolecular complexes present in the inner membrane and distinguishing them
clearly from the spectra of the lipid coated beads, lacking all membrane protein
components but ZipA.
The work presented here is intended to improve the development of direct detection
assays based in the generation of portable sensors combined with SERS spectroscopy for
fast and ultrasensitive detection of relevant macromolecular assemblies, as protein-
protein non-covalent interactions on the natural membrane environment. This system
provides the benefits of the very high sensitivity of SERS spectroscopy to detect small
conformational changes of macromolecules attached to a sensor surface at micro-molar
concentrations by weak non-covalent interactions. It is here presented its application to
the detection of the interactions between elements of the bacterial cell division
machinery, enlightening how these nanostructured sensors are of special interest for the
detection of potential antibiotic targets.
CHAPTER 3
109
CONCLUSIONS
In summary, the vibrational changes in SERS spectra of ZipA when is attached to
oligomeric or polymeric FtsZ forms reveal that FtsZ interacts with ZipA differently as a
function of the polymeric state of the former. The vibrational SERS spectra of ZipA reveal
important conformational differences in the hetero-association that are compatible with
the observed behavior in vitro and in vivo regarding stabilization and bundle formation of
FtsZ polymers by ZipA. In addition, considerable changes in the SERS spectra were
detected due to a cascade of interactions initiated by polymeric FtsZ that produce
significant conformational changes in the division machinery within the inner membrane
environment. This system provides the benefits of the very high sensitivity of SERS
spectroscopy to detect small conformational changes of macromolecules in micromolar
concentrations and can be readily used, for example, for the ultrafast testing and
evaluation of new antibiotics affecting the proteins modulating the bacterial division.
CHAPTER 3
110
References
1 a) J. Drews, Science 2000, 287, 1960-1964; b) W. J. Galush, S. A. Shelby, M. J.
Mulvihill, A. Tao, P. Yang, J. T. Groves, Nano Lett. 2009, 9, 2077-2082. c) Baciu CL,
Becker J, Janshoff A, Sönnichsen C. Nano Lett. 2008 ;8(6):1724-8.
2 M. Vicente, A. I. Rico, R. Martínez-Arteaga, J. Mingorance, J. Bacteriol. 2006, 188,
19-27.
3 L. Mosyak, Y. Zhang, E. Glasfeld, S. Haney, M. Stahl, J. Seehra, W. S. Somers, The
Protein Data Bank (PDB ID: 1F46) EMBO J 2000, 19, 3179-3191.
4 C. A. Hale, P. A. J. de Boer, J. Bacteriol. 1999, 181, 167-176.
5 C. A. Hale, P. A. J. de Boer, Cell 1997, 88, 175-185.
6 A. Martos, C. Alfonso, P. ope - ava as, . Ahi ado- u m n, . Mingorance, A. P.
Minton, G. Rivas, Biochem. 2010, 49, 10780-10787.
7 M.-C. Daniel, D. Astruc, Chemical Reviews 2004, 104, 293-346.
8 G. Rivas, A. Lopez, J. Mingorance, A. P. Minton, M. J. Ferrándiz, M. Vicente, S.
Zorrilla, J. M. Andreu, J. Biol. Chem. 2000, 275, 11740-11749.
9 H. P. Erickson, D. W. Taylor, K. A. Taylor, D. Bramhill, Proc. Nat. Acad. Sci. USA
1996, 93, 519-523.
10 a) J. M. González, M. Vélez, M. Jiménez, C. Alfonso, P. Schuck, J. Mingorance, M.
Vicente, A. P. Minton, G. Rivas, Proc. Nat. Acad. Sci. USA 2005, 102, 1895-1900; b)
A. Mukherjee, K. Dai, J. Lutkenhaus, Proc. Nat. Acad. Sci. USA 1993, 90, 1053-1057;
c) D. E. Anderson, F. J. Gueiros-Filho, H. P. Erickson, J. Bacteriol. 2004, 186, 5775-
5781; d) J. M. González, M. Jiménez, M. Vélez, J. Mingorance, J. M. Andreu, M.
Vicente, G. Rivas, J. Biol. Chem. 2003, 278, 37664-37671.

CHAPTER 3
111
11 a) K. A. Willets, R. P. Van Duyne, Ann. Rev. Phys. Chem. 2007, 58, 267-297; b) M.
Moskovits, J. Raman Spectrosc. 2005, 36, 485-496.
12 K. Kneipp, Y. Wang, H. Kneipp, L. T. Perelman, I. Itzkan, R. Dasari, M. S. Feld, Phys.
Rev. Lett. 1997, 78, 1667-1670.
13 R. A. Alvarez-Puebla, L. M. Liz-Marzan, Small 2010, 6, 604-610.
14 a) T. M. Cotton, J.-H. Kim, G. D. Chumanov, J. Raman Spectrosc. 1991, 22, 729-742;
b) M. Mahmoudi, I. Lynch, M. R. Ejtehadi, M. P. Monopoli, F. B. Bombelli, S.
Laurent, Chem. Rev. 2011, 111, 5610-5637; c) N. L. Rosi, C. A. Mirkin, Chem. Rev.
2005, 105, 1547-1562; d) M. Sanles-Sobrido, L. Rodriguez-Lorenzo, S. Lorenzo-
Abalde, A. Gonzalez-Fernandez, M. A. Correa-Duarte, R. A. Alvarez-Puebla, L. M.
Liz-Marzan, Nanoscale 2009, 1, 153-158; e) L. Fabris, M. Dante, G. Braun, S. J. Lee,
N. O. Reich, M. Moskovits, T. Q. Nguyen, G. C. Bazan, J. Am. Chem. Soc. 2007, 129,
6086-6087; f) R. A. Alvarez-Puebla, A. Agarwal, P. Manna, B. P. Khanal, P.
Aldeanueva-Potel, E. Carbo-Argibay, N. Pazos-Perez, L. Vigderman, E. R. Zubarev,
N. A. Kotov, L. M. Liz-Marzan, Proc. Nat. Acad. Sci. USA 2011, 108, 8157-8161.
15 a) D. Tsoutsi, J. M. Montenegro, F. Dommershausen, U. Koert, L. M. Liz-Marzan, W.
J. Perak, R. A. Alvarez-Puebla, ACS Nano 2011, 5, 7539-7546; b) M. Spuch-Calvar, L.
Rodriguez-Lorenzo, M. P. Morales, R. A. Alvarez-Puebla, L. M. Liz-Marzan, J. Phys.
Chem. C 2009, 113, 3373-3377; c) R. A. Alvarez-Puebla, L. M. Liz-Marzan, Chem.
Soc. Rev. 2012, 41, 43-51.
16 S. Abalde-Cela, J. M. Hermida-Ramon, P. Contreras-Carballada, L. De Cola, A.
Guerrero-Martinez, R. A. Alvarez-Puebla, L. M. Liz-Marzan, ChemPhysChem 2011,
12, 1529-1535.
17 B. Rodriguez-Gonzalez, A. Burrows, M. Watanabe, C. J. Kiely, L. M. Liz Marzan, J.
Mater. Chem. 2005, 15, 1755-1759.
18 V. L. Schlegel, T. M. Cotton, Anal. Chem. 1991, 63, 241-247.

CHAPTER 3
112
19 R. Alvarez-Puebla, L. M. Liz-Marzán, F. J. García De Abajo, J. Phys. Chem. Lett. 2010,
1, 2428-2434.
20 F. J. Moy, E. Glasfeld, L. Mosyak, R. Powers, The Protein Data Bank (PDB ID: 1F7W)
Biochemistry 2000, 39, 9146-9156.
21 a) R. Tuma, J. Raman Spectrosc. 2005, 36, 307-319; b) G. J. Thomas, Biopolymers
2002, 67, 214-225; c) S. A. Overman, G. J. Thomas, Biochemistry 1999, 38, 4018-
4027.
22 M. Moskovits, D. P. Dilella, K. J. Maynard, Langmuir 1988, 4, 67-76.
23 M. Moskovits, J. S. Suh, J. Phys. Chem. 1984, 88, 5526-5530.
24 T. Mohammadi, G. E. J. Ploeger, J. Verheul, A. D. Comvalius, A. Martos, C. Alfonso,
J. van Marle, G. n. Rivas, T. den Blaauwen, Biochemistry 2009, 48, 11056-11066.
25 C. A. Hale, A. C. Rhee, P. A. J. de Boer, J. Bacteriology 2000, 182, 5153-5166.
26 F. Lhert, F. Capelle, D. Blaudez, C. Heywang, J. M. Turlet, J. Phys. Chem. B 2000,
104, 11704-11707.
27 R. J. H. Clark, R. E. Hester, Advances in Infrared and Raman Spectroscopy, Wiley,
New York, 1984.
28 S. Rueda, M. Vicente, J. Mingorance, J. Bacteriology 2003, 185, 3344-3351.
29 M. J. Osborn, J. E. Gander, E. Parisi, J. Carson, J. Biol. Chem. 1972, 247, 3962-3972.
30 M. Jiménez, A. Martos, M. Vicente, G. Rivas, J. Biol. Chem. 2011, 286, 11236-11241.
31 a) M. Vicente, A. I. Rico, R. Martínez-Arteaga, J. Mingorance, J. Bacteriology 2006,
188, 19-27; b) G. Butland, J. M. Peregrin-Alvarez, J. Li, W. Yang, X. Yang, V.
Canadien, A. Starostine, D. Richards, B. Beattie, N. Krogan, M. Davey, J. Parkinson,
J. Greenblatt, A. Emili, Nature 2005, 433, 531-537.

CHAPTER 3
113
SUPLEMENTARY MATERIAL
EXPERIMENTAL SECTION
Materials:
-
diphosphate (GDP), guanosine 5´-triphosphate (GTP), benzenethiol (BT) and other
analytical grade chemicals were acquired from Sigma-Aldrich or Merck; 1,2-dioleoyl-sn-
glycero-3-[(N-(5-amino-1-carboxypentyl)iminodiacetic acid)succinyl] (DGS-NTA(Ni)) and E.
coli polar lipid extract were purchased from Avanti Polar Lipids. All proteins from this work
were extensively dialyzed against the working buffer, 50 mM Tris-HCl pH 7.5, 100 mM KCl,
5 mM MgCl2.
Polystyrene micro-beads functionalization and coating:
Polystyrene microbeads of 3 µm (0.5 ml of 100 mg mL-1 suspension) were first wrapped
with alternating polyelectrolyte monolayers using the layer-by-layer (LbL) electrostatic
self-assembly protocol.[1] Four alternative layers of polystyrenesulfonate (PSS, Mw =
1000000), poly(diallyldimethylammoniumchloride) (PDDA , Mw = 100000 - 200000), PSS
and, finally, poly(allylaminehydrochloride) (PAH, Mw = 56000) Polystyrene microbeads
(0.5 ml of 100 mg mL-1 suspension) were added to a 25 ml of 2 mg mL-1 PSS aqueous
solution supplemented with 0.5 M NaCl. After 30 min of sonication, and 2 hours of
agitation the PS microbeads were extensively washed with Milli-Q water and centrifuged
(5000 rpm, 15min). The same protocol (concentrations, elapsed times and washing
protocol) were carry out to next layers of PDDA, PSS and PAH polyelectrolytes. Gold seeds
of 15 nm were prepared by heating to the boil 50 ml of HAuCl4 0.5 mM and addition of 2.5
ml of sodium citrate solution 1% under mechanical stirring.
The adsorption of the gold seeds onto the functionalized PS beads was carried out
by adding 12 mL of as prepared seeds 0.5 mM to a 4 mL of PS beads (5 mg mL-1). After 15
min of sonication, the PS@Au beads were washed firstly 3 times by centrifugation (3000

CHAPTER 3
114
rpm x 15 min) and 3 times by decantation with Milli-Q water. Silver was epitaxially grown
on gold seeds as follows: 4 mL of PS@Au 5 mg mL-1 were mixed with a solution containing
33 mL of glycine 0.4 M at pH 9.5 and 2.4 mL of Ag2SO4 15 mM.[1] During sonication in cold
water, 3.3 mL of ascorbic acid 0.1 M were added. After 1 hour in sonication bath, the
solution was washed with Milli-Q water for 3 times by centrifugation (3000 rpm x 15min)
and 3 times by decantation.
Protein purification:
Escherichia coli wild type FtsZ was expressed and purified by the calcium-induced
precipitation method.[2] FtsZ was frozen and stored at -80oC in 20 μ aliquots. In this study
FtsZ was used in different bound states: GDP-FtsZ (non-polymerized or oligomeric protein)
and GTP-FtsZ (polymerized protein).
Mutagenesis of the ZipA gene, overexpression and purification of both soluble
mutants were constructed by elimination of certain regions within the N-terminal domain
of native ZipA, the hydrophobic (transmembrane) N-terminal domain in the case of s1-
ZipA (amino acids 1-25) and this one together with the P/Q domain in the case of s2-ZipA
(amino acids 1-188).[3] The proteins preserves the hexahistidine-tag.
Preparation of lipid MLVs:
The required amount of E. coli polar lipids and DGS-NTA(Ni) in chloroform/methanol were
mixed in a ratio 10:1, then dried under a Nitrogen stream and kept under vacuum for four
hours to remove traces of organic compounds. The dried film was resuspended in working
buffer by three cycles of 10 min vortexing with rest periods of 15 min in a 37oC water
bath, and finally was sonicated at 4oC for 5 min.
Isolation of E. coli inner membranes:
The inner membrane vesicles were isolated from wild-type E. coli (strain JM600)
exponential phase culture.[4] The inner and outer membrane were separated by sucrose

CHAPTER 3
115
gradient centrifugation,[5] washed and diluted to reach 20 absorbance units at 280 nm,
and stored fro en at −80 °C.[6]
Lipid-coated and Inner membrane-coated PS@Au@Ag beads: PS@Au@Ag beads were
washed three times with working buffer by centrifugation (3000 rpm x 15min), mixed with
the lipid or inner membrane solution, incubated with gentle shaking for 2 hours at 4oC and
sonicated (lipids for 5 min, membrane for 30 sec) in a water bath at 4oC. These lipid
coated PS@Au@Ag beads were washed three times (3000rpm x 15min), sonicated in a
cold water bath (lipids for 1 min, membrane for 30 sec) and washed three more times.
ZipA immobilization on the plain or lipid coated PS@Au@Ag beads and FtsZ interaction
with plain, lipid or membrane coated PS@Au@Ag beads: Plain or lipid coated
PS@Au@Ag beads were washed three times by centrifugation (3000 rpm x 15min) with 50
mM Tris-HCl pH 7.5, 100 mM KCl, 5 mM MgCl2. The recombinant mutant of ZipA was
equilibrated against the same buffer solution. Different amounts of protein solution were
mixed with the beads (3.3 mg mL-1) to a final concentration of protein between 5 to 20
µM, the solution was stored in soft shaker at 4ºC for 1h and washed three times (3000
rpm x 15 min) at 4oC. Finally we found 15 µM as optimal concentration of ZipA protein in
order to obtain the better SERS signal. The hexahistidine-tag from ZipA is attached to Ni-
NTA groups in the case of lipid coated beads and strongly attached to the nanostructured
silver in the case of plain PS@Au@Ag beads.[7]
A dispersion of plain, lipid or membrane coated PS@Au@Ag-ZipA beads as
described before was mixed with GDP-FtsZ protein and incubated in soft shaker at 4ºC for
30 min. GDP-FtsZ was previously equilibrated against the working buffer. The final
concentrations of beads are 3.3 mg mL-1 and FtsZ 25 µM. In the case of GTP-FtsZ, an
aliquot of the beads was mixed with GTP to a final concentration of 1 mM supplemented
with enzymatic GTP-regenerating system as previously described,[8] and incubated at
room temperature for 5 min. The GTP control of plain, lipid or membrane coated
PS@Au@Ag-ZipA beads was done without FtsZ.

CHAPTER 3
116
Characterization:
UV-Vis-NIR spectra were recorded using an Agilent 8453 diode array spectrophotometer.
Scanning electron microscopy images were obtained with a JEOL JSM6700F microscope
operating at an acceleration voltage between 2 and 20 kW and a secondary electron
detector mode was used for characterization. Fluorescence images were taken with a
Zeiss Axioplan Universal Microscope equipped with a Leica DFC 350 FX digital camera and
EC Plan-Neofluar objective.
Surface-enhanced Raman scattering spectroscopy:
Raman and SERS experiments were conducted in a micro-Renishaw InVia Reflex system.
The spectrograph uses high-resolution grating (1200 groves mm-1) with additional band-
pass filter optics, a confocal microscope, and a 2D-CCD camera. Excitation was carried out
at 785 nm (diode). Measurements were made in a confocal microscope in backscattering
geometry using a 100x objective with NA value of 0.9, providing a spatial resolution of 500
nm with accumulation times of 10 s. For SERS characterization of the PS@Au@Ag beads,
10 μ of a Ben enethiol (BT) solution (10−3 M) was added to 1 mL of the sample reaching a
final concentration of 10−5 M in BT. 10 μ of the mixture were then cast and air-dried onto
a clean glass slide. For SERS measurements 10 µL of the different samples of coated
PS@Au@Ag beads were deposited on a clean glass slide and air-dried. Each sample was
prepared at least twice at the same conditions and at least ten different beads were
measured for each sample to ensure reproducibility.
CHAPTER 3
117
References
1 a) K. A. Willets, R. P. Van Duyne, Ann. Rev. Phys. Chem. 2007, 58, 267-297; b) M.
Moskovits, J. Raman Spectrosc. 2005, 36, 485-496.
2 K. Kneipp, Y. Wang, H. Kneipp, L. T. Perelman, I. Itzkan, R. Dasari, M. S. Feld, Phys.
Rev. Lett. 1997, 78, 1667-1670.
3 R. A. Alvarez-Puebla, L. M. Liz-Marzan, Small 2010, 6, 604-610.
4 a) T. M. Cotton, J.-H. Kim, G. D. Chumanov, J. Raman Spectrosc. 1991, 22, 729-742;
b) M. Mahmoudi, I. Lynch, M. R. Ejtehadi, M. P. Monopoli, F. B. Bombelli, S.
Laurent, Chem. Rev. 2011, 111, 5610-5637; c) N. L. Rosi, C. A. Mirkin, Chem. Rev.
2005, 105, 1547-1562; d) M. Sanles-Sobrido, L. Rodriguez-Lorenzo, S. Lorenzo-
Abalde, A. Gonzalez-Fernandez, M. A. Correa-Duarte, R. A. Alvarez-Puebla, L. M.
Liz-Marzan, Nanoscale 2009, 1, 153-158; e) L. Fabris, M. Dante, G. Braun, S. J. Lee,
N. O. Reich, M. Moskovits, T. Q. Nguyen, G. C. Bazan, J. Am. Chem. Soc. 2007, 129,
6086-6087; f) R. A. Alvarez-Puebla, A. Agarwal, P. Manna, B. P. Khanal, P.
Aldeanueva-Potel, E. Carbo-Argibay, N. Pazos-Perez, L. Vigderman, E. R. Zubarev,
N. A. Kotov, L. M. Liz-Marzan, Proc. Nat. Acad. Sci. USA 2011, 108, 8157-8161.
5 a) D. Tsoutsi, J. M. Montenegro, F. Dommershausen, U. Koert, L. M. Liz-Marzan, W.
J. Perak, R. A. Alvarez-Puebla, ACS Nano 2011, 5, 7539-7546; b) M. Spuch-Calvar, L.
Rodriguez-Lorenzo, M. P. Morales, R. A. Alvarez-Puebla, L. M. Liz-Marzan, J. Phys.
Chem. C 2009, 113, 3373-3377; c) R. A. Alvarez-Puebla, L. M. Liz-Marzan, Chem.
Soc. Rev. 2012, 41, 43-51.
6 S. Abalde-Cela, J. M. Hermida-Ramon, P. Contreras-Carballada, L. De Cola, A.
Guerrero-Martinez, R. A. Alvarez-Puebla, L. M. Liz-Marzan, ChemPhysChem 2011,
12, 1529-1535.
7 B. Rodriguez-Gonzalez, A. Burrows, M. Watanabe, C. J. Kiely, L. M. Liz Marzan, J.
Mater. Chem. 2005, 15, 1755-1759.

CHAPTER 3
118
8 V. L. Schlegel, T. M. Cotton, Anal. Chem. 1991, 63, 241-247.

APENDIX 2
Reconstitution of proto-ring elements on microbeads
The reconstitution and assembly of several proto-ring elements on non-
functionalized micron sized beads were characterized by fluorescence microscopy and
scanning electron microscopy (SEM). In order to confirm the successful immobilization
of the lipids, membrane and proteins onto the beads, fluorescence images were
acquired using DiI-C18 (Figure 1A), which selectively attaches to the membranes, anti-
ZipA+ anti-rabbit-488 (Figure 1B), which selectively recognises the membrane protein
ZipA, and labelled FtsZ-Alexa Fluor 488 (Figure 1C). Figure 1 D and E show SEM images
at different magnifications of membrane coated beads with FtsZ polymers.
Figure 1. (A)Membrane coated microbeads were incubated with DiI-C18, (B) anti-ZipA+ anti-rabbit-488
and (C) a polymeric form of FtsZ-Alexa-Fluor 488 suplemented with Ficoll 70. Negative control
experiments were carried out, thus evidencing the absence of nonspecific adsorption of the dyes and
the successful immobilization of the membrane and ZipA. Figure 1 D and E show SEM images at different
magnifications of membrane coated beads with FtsZ polymers.
APENDIX 2
120
This result provides enough evidences to confirm the role of membrane protein ZipA
that is anchoring FtsZ filaments to the inner membrane. It was observed in SEM images
that the growth of FtsZ polymers attached from membrane through ZipA is forming
three-dimensional network, even grow into fibers that link different microbeads.
However, we test the case of the s1-ZipA mutant (described in experimental section)
and the interaction cannot be detected by SERS, probably because of the long length
of the P/Q domain (10-20 nm) separating the interaction region and enhancer silver
sensor. The coating and characterization details were described in the experimental
section (supplementary material) of Chapter 3, and SEM sample preparations is
described below.
PREPARATION OF BILOGICAL SEM SAMPLES: Fix sample in a buffer containing 2.5%
Gluteraldehyde for 3 hours in room temperature. Rinses in Milli-Q water 3 x 15 min.
Before proceed to following steps. Rinses twice in room temperature with:
30% EtOH 10 min
50% EtOH 10 min
70% EtOH 10 min or overnight
85% EtOH 20 min
95% EtOH 20 min
100% EtOH 20 min
100% EtOH 20 min or overnight
Critical point drying or freeze drying.
Spattering with Au or Ag.
Observation under Scanning electron microscope.

APENDIX 3 Biochemistry 2010, 49, 10780–10787
CHARACTERIZATION OF SELF- AND HETERO-ASSOCIATIONS OF
BACTERIAL CELL DIVISION PROTEINS FtsZ AND ZipA IN SOLUTION BY
COMPOSITION GRADIENT – STATIC LIGHT SCATTERING (CG-SLS)
We have characterized the self-association of FtsZ in its GDP-bound state (GDP-FtsZ) and the
hetero-association of FtsZ and a soluble recombinant ZipA (sZipA) lacking the N-terminal trans-
membrane domain by means of composition gradient static light scattering (CG-SLS) and by
measurement of sedimentation equilibrium. CG-SLS experiments at high ionic strength and in
the presence of 5 mM Mg2+ show that, while FtsZ self-associates in a non-cooperative fashion,
sZipA acts as a monomer. CG-SLS data obtained from mixtures of FtsZ (A) and sZipA (B) in the
presence of Mg2+ are quantitatively described by an equilibrium model which takes into
account significant scattering contributions from B, A1, A2, A3, A4, A5, A6, A1B, A2B, A3B and A4B.
However, in the absence of Mg2+ (with EDTA) the data are best accounted for by an equilibrium
model in which only B, A1, A2, A3, A1B and A2B contribute significantly to scattering. The best-fit
molecular weights of monomeric A and B are in good agreement with values calculated from
amino-acid composition and with values obtained from sedimentation equilibrium. The latter
technique also confirmed the interaction between sZipA and GDP-FtsZ. Moreover, the
association model that best describes the CG-LS data is in qualitative agreement with the
sedimentation data. From these results it follows that the binding of sZipA to GDP-FtsZ is of
moderate affinity and does not affect significantly the interactions between FtsZ monomers.
Under the working conditions used, only one sZipA binds to FtsZ oligomers of length 6 or less.
The observed behavior would be compatible with FtsZ fibrils being anchored in vivo to the
bacterial inner plasma membrane by substoichiometric binding of membrane-bound ZipA.

APENDIX 3
122
INTRODUCTION
The components of the bacterial cell division machinery assemble in a concerted
manner to form a dynamic ring at mid-cell towards the end of the cell cycle. The ring is formed
by at least fifteen division specific proteins, most of them integral membrane proteins. The first
multi-protein complex formed is the bacterial proto-ring that initiates division. In Escherichia
coli the proto-ring is a complex of three proteins (FtsZ, FtsA, and ZipA) assembling on the
cytoplasmic membrane which are required for the incorporation of the remaining proteins at
the mature ring (1)(2). The best characterized proto-ring protein is FtsZ, which shares structural,
but not sequence, homology with eukaryotic tubulin, as well as its GTPase activity and its
capacity to polymerize (3) (4). In its GDP-bound state the FtsZ monomer self-associates in a non-
cooperative manner to form oligomers, a reaction that is promoted by magnesium, low pH, and
excluded volume effects in highly crowded media and that it is attenuated upon increasing the
solution ionic strength (5-7). GTP triggers FtsZ assembly in vitro to form polymers whose
structural organization is highly polymorphic (single stranded protofilaments, circles, toroidal
structures, bundles, etc) depending upon the solution composition and experimental conditions
(5, 7, 8) (9, 10) (11-14) . The GTP-mediated assembly/disassembly cycle of FtsZ is thought to be
essential for the formation of the dynamic septal ring during cell division (2, 3, 15) (4).
FtsZ is anchored to the cytoplasmic membrane through the interaction of its carboxy-
terminal region with ZipA or FtsA. FtsA belongs to the actin family and contains a short
amphipatic helix that seems to mediate its association to the membrane (16). E. coli ZipA is a
36.4 kDa protein that contains an amino-terminal helix that is integrated into the membrane
and connected to a cytoplasmic FtsZ-interacting domain via a flexible linker (17-20) . FtsA and ZipA
are involved in the attachment of FtsZ to the membrane, but no localization of FtsZ occurs in
the simultaneous absence of both. In fact, under normal conditions ZipA is required and
essential for E. coli Z-ring formation (21). ZipA stabilizes GTP-FtsZ polymers in vitro and in vivo
that might be related with the effect of ZipA on the bundling of FtsZ polymers, in which the C-
terminal domain seems to be involved (19, 22) . The interaction between FtsZ and ZipA has been
studied by means of genetical and structural approaches (17-27) but the mechanism of

APENDIX 3
123
association between the two proteins is largely unknown. The only quantitative information on
ZipA-FtsZ complex formation was reported by Mosyak and co-workers (26). They used surface
plasmon resonance to measure the binding of a 17-aa region from the C-terminal domain of
FtsZ (in its GDP-bound state) to two soluble fragments of ZipA immobilized onto the sensor chip
and found the interactions in the complexes were weak (apparent dissociation constants > 20
μM); these interactions did not change when the two protein fragments were in solution, as
measured by isothermal titration calorimetry.
The aim of this work was the biophysical analysis of the association between ZipA and
GDP-FtsZ in solution to measure the binding parameters of ZipA-FtsZ complex formation. This
information is important to undertake the quantitative characterization of these multi-protein
complexes at different levels of organization (like reconstituted and natural membrane
systems). We first isolate and analyze the full length ZipA protein in the absence of detergent.
We found that detergent-free ZipA existed mainly as an 16S oligomer, much larger than the
expected s-value of the monomer (~ 3 S) and compatible with a 450-500 kDa globular oligomer
(ZipA decamer). Upon incubation with GDP-FtsZ, the oligomers of ZipA formed large aggregates,
observations also confirmed by electron and atomic force microscopy. These results hampered
the use of full length ZipA for a quantitative study of binding to FtsZ in solution. However, from
these preliminary studies we concluded that ZipA in solution retained the capacity of binding to
FtsZ, with moderate affinity (K > 105 M-1). We also found, by means of electron microscopy and
differential centrifugation assays, that full length ZipA in a low salt buffer (with 50 mM KCl, but
not with 500 mM) promoted FtsZ polymer bundling formation at sub-stoichiometric
concentration of ZipA, results that confirm previous studies done in lower pH buffers with 0.05
M KCl (19) . To overcome these technical difficulties associated with the tendency of ZipA to
aggregate, we have generated a soluble fragment of the protein which do not contain the
trans-membrane region (sZipA) and measured the binding of sZipA and GDP-FtsZ in solution by
means of recently developed composition-gradient static light scattering methods in
combination with sedimentation equilibrium measurements. The former technique is a new
powerful tool to rapidly and accurately measure protein self- and hetero-associations in

APENDIX 3
124
solution (28-32). In composition-gradient static light scattering (CG-SLS) experiments, light
scattering data are acquired from a solution whose composition is being continuously varied
with time in a controlled fashion. The resulting profiles of light scattering intensity as a function
of solution composition are then modeled in the context of schemes postulating different
combinations of self- and/or hetero-association equilibria, in order to determine the simplest
scheme capable of accounting for the data to within experimental precision. This approach has
allowed us to define the scheme of association between sZipA and FtsZ as well as the affinity
and stoichiometry of the different species present in the solution. Finally, the potential
implications of these results to understand the association of FtsZ with ZipA at the cytoplasmic
membrane are discussed.
EXPERIMENTAL PROCEDURES
Materials: All the assays described in this paper were done at 25ºC with the proteins
equilibrated in 50mM Tris-HCl, pH 7.4, 500mM KCl buffer, with either 5mM MgCl2 (Tris-500KCl-
Mg buffer) or 1mM EDTA (Tris-500KCl-EDTA buffer), in the presence of the nucleotide (GDP or
GTP) specified in the text. Guanine nucleotides, GDP and GTP, were purchased from Sigma-
Aldrich and Roche, respectively. Other analytical grade chemicals were from Merck or Sigma.
Proteins: E. coli FtsZ was purified by the Ca2+-induced precipitation method described
by Rivas et al. (7). In this study we have mainly used FtsZ in the GDP-bound state (non-
polymerized protein) and we will refer to it as GDP-FtsZ.
Mutagenesis of Gene zipA; over-expression and purification of sZipA: A soluble mutant
of ZipA was constructed by eliminating the hydrophobic N-terminal domain (aa 1-25) of the full
length protein. The deletion was obtained by inverse-PCR using plasmid pET-15ZIP as template
DNA and the primers 5’-CATATGGCTGCCGCGCG -3’ and 5’-ACCAGCCGTAAAGAACG -3’. The PCR
product was purified, digested with DpnI and ligated with T4 DNA-ligase. The presence of the
desired deletion and absence of other mutations was checked by DNA sequencing.
To overproduce sZipA, BL21/DE3 cells transformed with pET-15ZIP (22) were grown at
37ºC in LB supplemented with ampicillin (50 µg/ml) and chloramphenicol (50 µg/ml), to reach

APENDIX 3
125
an optical density of 0.4. Protein expression was induced with 1mM IPTG for 3 h. Cells were
harvested, centrifuged at 10 000g (4 ºC, 15min.) and resuspended in 0.02 culture volume of
buffer A (20mM Tris-HCl pH 8.0, 500mM NaCl, 5mM imidazole). After sonication, cell extracts
were centrifuged at 200000 g (4ºC, 30 min) to pellet membranes. sZipA was recovered from the
soluble fraction and loaded on a 5 ml Ni-NTA resin (Novagen) equilibrated in buffer A. The
protein was eluted sequentially with 50, 100, 200 and 500mM imidazole in buffer A. Most of
the sZipA protein eluted with 200 mM imidazole. The protein concentration was determined by
Bradford assay. The protein yield was typically 4-6 mg sZipA per liter of cell culture. sZipA
fractions were pooled and stored at -80ºC. The purity of sZipA was > 90% according to SDS-
PAGE.
Static light-scattering: Composition-gradient static light scattering experiments were
performed using the Calypso system (Wyatt Technology, Santa Barbara, CA) according to
procedures developed by Minton and co-workers (30-32). In brief, a programmable three
injector-syringe pump was used to introduce a solution of defined protein composition (that
changes with time) into parallel flow cells for concurrent measurement of Rayleigh light
scattering at multiple angles (using a DAWN-EOS multi-angle laser light scattering detector,
Wyatt Technology, Santa Barbara, CA) and solute composition (using a Optilab rEX refractive
index detector, Wyatt Technology, Santa Barbara, CA). A single composition gradient
experiment yields several thousand values of scattering intensity as a function of scattering
angle and solution composition. The specific refractive increments of FtsZ and sZipA were
measured using an Optilab rEX differential refractometer (Wyatt Technology, Santa Barbara)
and both found to be equal to 0.185 0.002 cm3/g at 25oC.
Experiments with a single protein were performed as described by Attri and Minton
(31). One of the pump channels (syringe + reservoir) was filled with a solution of either GDP-
FtsZ or sZipA and a second filled with a buffer solution. Stepwise gradients of increasing or
decreasing protein concentration were formed by increasing in incremental intervals the flow
rate of one of the syringes and simultaneously decreasing by the same amount the flow rate of
the other syringe. Experiments with mixtures of two proteins were performed as described by
APENDIX 3
126
Attri and Minton (30). A solution of sZipA (solution B) at w/v concentration wB,load was loaded
into one of the pump channels and a solution of GDP-FtsZ (solution A) at w/v concentration
wA,load was loaded into the second pump channel. Initially the flow cells were filled with pure
solution B, permitting determination of the scattering intensity at multiple angles and
absorbance of sZipA at the loading concentration. Composition gradients were created by
simultaneously increasing the flow rate of pump channel A and decreasing the flow rate of
pump channel B, so that the fraction of solution B in the solution mixture gradually decreases
from 1 to 0 while that of solution A gradually increases from 0 to 1. Absorbance data were
processed to yield the concentration of either one protein (in a single protein experiment) or
both proteins (in a two protein experiment), as described in (30, 31). The scattering data were
processed as previously described by Attri and Minton (30, 31) to yield the Rayleigh ratio R scaled
to an optical constant
[1]
where λ, , and denote the wavelength of incident light (690 nm), Avogadro’s number, and
the refractive index of the solution respectively. d /dw is the specific refractive increment of
both proteins, determined as described above, where w denotes the w/v concentration of
protein. In the present study, all solute species were small relative to the wavelength of light.
Therefore, the scaled Rayleigh ratio is independent of scattering angle, and depends only upon
the solute composition:
[2]
where Mi, wi, and ci respectively denote the molar mass, w/v concentration, and molar
concentration of the ith solute species. The fractional contribution of a given species to the
total scattering intensity is then given by
[3]
2 2
4
4 ñ ( ñ / )opt
A
d dwK
N
AN n%
n%
2
i i i i
i iopt
RM w c M
K
2
2
j j
j
i i
i
c Mf
c M

APENDIX 3
127
The composition dependence of R/Kopt is modeled in the context of equilibrium schemes
described below that specify the molar masses of all significant scattering species, and the
dependence of all ci upon one or more postulated equilibrium association constants and the
total concentrations of each or both proteins.
Models for equilibrium self- and hetero-association: Several equilibrium models were
constructed to calculate the molar concentration of each macromolecular species present as a
function of the total concentration of each macromolecular component and one or more
equilibrium association constants. The results of these models were then combined with
equation [2] to calculate the dependence of total scattering upon solution composition. Below
we describe the simplest models found to describe the data obtained in the present study to
within experimental uncertainty. In a solution containing only a single protein component (A),
the subscript i denotes a property of the oligomeric species Ai. In a solution containing two
protein components (A and B), the subscript ij denotes a property of the oligomeric species AiBj.
Model 1: Isodesmic model for self-association of GDP-FtsZ (component A). It is assumed
that monomeric A may bind to another monomer or any oligomer of A with equal affinity.
for all i [4]
[5]
where . Given values of wtot, M1, and KAA, eqn [5] may be solved for the values of q
and c1. It follows from eqn [2] that the normalized scattering is then given by
[6]
Model 2: Isodesmic self-association of GDP-FtsZ (component A), and hetero-association
of each oligomeric species of A with one or two molecules of sZipA (component B). It is assumed
that one or two molecules of B may bind to a monomer or any oligomer of A with an affinity
that is independent of the size of the oligomer. The second molecule of B binds to monomeric
1 1AA i iK c c c
1 21 11
1 1
(1 )
itottot i AA
i iAA AA
w qc ic i K c
M K K q
1AAq K c
2 2 2
2 21 11 1 3
1 1 (1 )
i
i AA
i iopt AA AA
M MR q qc iM i K c
K K K q
APENDIX 3
128
or oligomeric A with an equilibrium constant for association that differs from the equilibrium
constant for binding the first B by a factor .
for all i [7]
for all i [8]
for all i [9]
The conservation of mass equations may be written as
[10]
[11]
where and . Given values of and ,
equations [10] and [11] may be solved numerically for the equilibrium values of c10 and c01.
Then equations [7-9] may be used to calculate the equilibrium values of all cij. The
corresponding value of is calculated numerically by summing over all significantly
populated species in the following special case of equation [2]
[12]
When evaluating the infinite sum indicated above, terms in increasing i were successively
added until convergence was established.
All data processing and modeling calculations were performed using user-written scripts
and functions written in MATLAB (Mathworks, Natick MA) available from APM upon request.
Sedimentation equilibrium: Sedimentation equilibrium was done to determine the
state of association of the individual components (sZipA and GDP-FtsZ) and to measure the
association properties of sZipA-FtsZ complexes. The analytical ultracentrifugation analysis of
sZipA, GDP-FtsZ and the sZipA-FtsZ mixtures was performed using several protein
( 1)0
0 10
i
AA
i
cK
c c
1
0 01
iAB
i
cK
c c
2
1 01
iAB
i
cK
c c
*, * *2
, 2*
10
11
1
A tot
A tot
AA
w Ac B B
M K A
*, * *2
, 01 *
01
12
1
B tot
B tot
AA
w Ac c B B
M K A
*
10AAA K c *
01ABB K c, , 10 01, , , , ,A tot B tot AA ABw w M M K K
/ optR K
2
22
01 01 10 01
1 0
ij
i jopt
Rc M c iM jM
K
APENDIX 3
129
concentrations (in the range of 0.3 to 1 g/L) equilibrated in either Tris-500KCl-Mg or Tris-
500KCl-EDTA buffer containing 0.05 mM GDP. Sedimentation velocity runs were carried out at
42,000 rpm and 25°C in. Sedimentation profiles were registered every 5 minutes at the
appropriate wavelength (230 or 275 nm). Short-column (70-80μl) experiments were carried our
at 25ºC in an XL-A analytical ultracentrifuge (Beckman-Coulter Inc.) with UV-VIS optics
detection system, using an An60Ti rotor and 12mm double-sector centrepieces. The equilibrium
runs were done at two speeds (10,000 and 12,000 rpm) and the gradients were monitored at
two different wavelengths (230 and 275 nm). Following the equilibrium scans, the solutions
were centrifuged at high speed (40,000 rpm) to deplete the meniscus and obtain the
corresponding baseline offsets. The measured equilibrium concentration (signal) gradients of
sZipA and FtsZ alone were fit by the equation that characterizes the equilibrium gradient of an
ideally sedimenting solute (33) to get the whole-cell buoyant signal average molecular weights
of the individual proteins.
Analysis of sedimentation equilibrium data: For two components (A = FtsZ, and B =
sZipA), the absorbance average molecular weight is given by (34):
[13]
where MX is the molecular weight of monomeric X, αX is the extinction coefficient of X at the
wavelength of measurement, and cij is the molar concentration of AiBj. If the two components
have the same density increment (dρ/dwA) = (dρ/dwB) = (dρ/dw), then the experimentally
measured buoyant signal average molecular weight is just: M*abs,av = Mabs,av (dρ/dw). A MATLAB
function using equations [7-11] and [13] was written to calculate the buoyant absorbance
average molecular weight as a function of the total w/v concentrations of A and B.
It follows from eqns [2], [6] and [12] that any equilibrium model used to generate a
calculated dependence of R/Kopt upon protein concentration may be also used to generate a
calculated dependence of Mw upon protein concentration, which is the form of the
sedimentation equilibrium results presented in this work. Therefore, with minor modifications,
,
,
A A B B ij A B
i j
absav
A A B B ij
i j
iM jM c iM jM
MiM jM c
APENDIX 3
130
the same association schemes described above to model the composition dependence data of
light scattering can also be used to model the composition dependence data of sedimentation
equilibrium experiments.
RESULTS AND DISCUSSION
sZipA: The normalized scattering intensity of sZipA in the absence and presence of Mg2+
is plotted as a function of protein concentration in Figure 1. Both sets of data are fit
quantitatively by a model according to which sZipA behaves as a single species with Mw =
34,000 ± 1,000, in good agreement with the sequence molecular weight of the monomer
(35,829). The best fit of this model to each data set is plotted together with the data. It follows
that sZipA does not self-associate to a significant extent in either buffer over the measured
range of concentrations. We confirmed that sZipA was a monomer in solution by analytical
ultracentrifugation (Figure 2). The buoyant average molecular weight of sZipA, determined by
sedimentation equilibrium, was 9,500 ± 1,000 (Mw = 36,000 – calculated using 0.736 cm3/g as
the partial specific volume of sZipA) corresponding to protein monomer. The sedimentation
properties of sZipA did not change upon lowering KCl concentration to 0.05 M neither when
EDTA was added to the buffer (not shown).

APENDIX 3
131
Figure 1. Normalized scattering intensity plotted as a function of sZipA concentration in the absence (black
symbols) and presence (red symbols) of 5 mM Mg2+
. Blue line is the best fit of a single species model with Mw =
34,000 1,000.
Figure 2. Analytical ultracentrifugation analysis of sZipA. Sedimentation equilibrium absorbance gradient of 14 µM
sZipA at 12,000 rpm. The solid line is the best-fit distribution from the single-species with Mw = 36,000 ± 2,000,
that corresponds to a protein monomer.
GDP-FtsZ: The concentration-dependent scattering of FtsZ in (high salt) Tris-500KCl
buffer in the absence and presence of Mg2+ is plotted in Figure 3. Both sets of data are fit

APENDIX 3
132
quantitatively by the isodesmic self-association model described above. The best fit of this
model to each data set, calculated using the parameter values given in the figure caption, is
plotted together with the data. The fractional contribution of each significant species to the
total scattering, calculated according to eqn [3], is plotted as a function of total protein
concentration, and the corresponding mass fractional distributions are plotted in Figures S1
and S2, respectively. In the presence of Mg2+ the scattering data are well accounted for by an
equilibrium model which takes into account significant scattering contributions of several FtsZ
species, from monomers to hexamers. In the presence of EDTA, FtsZ self-association is
attenuated, as expected, and only monomers, dimers and trimers contributed to the scattering
signal.
In parallel we carried out low-speed sedimentation equilibrium analysis with the same
FtsZ preparations (loading concentrations ranging from 0.3 to 1.0 g/L, or 7.5 to 25µM) that
yielded signal buoyant average molecular weights from 15,200 to 21,800 (Mw from 57,000 to
82,000 – calculated using 0.738 cm3/g as the partial specific volume of FtsZ) (for the protein in 5
mM Mg2+) and from 11,200 to 14,600 (Mw from 42,000 to 55,000) (EDTA). The dependence of
the molecular weight of FtsZ with total protein concentration confirmed the results obtained in
previous studies from our laboratory (5) and, more important, is in good quantitative agreement
with the isodesmic model that accounts for the results obtained from composition gradient
light scattering (Figure 4).

APENDIX 3
133
Figure 3. Normalized scattering intensity plotted as a function of GDP-FtsZ concentration in the absence (black
symbols) and presence (red symbols) of 5 mM Mg2+. Plotted curves represent the best fits of model 1 with M1 =
40,000 (constrained) and log KAA = 4.3 (- Mg2+) or 4.8 (+ Mg2+).
Figure 4. Dependence of signal-average molecular weight of GDP-FtsZ upon protein concentration in the absence
(white circles) and presence (black circles) of 5 mM Mg2+ measured by sedimentation equilibrium. The plotted
curves represents the best fit of model 1 with M1 = 40,000 (constrained) and log KAA = 4.2 (- Mg2+) or 4.7 (+
Mg2+).
sZipA + GDP-FtsZ: We then conducted composition-gradient light scattering to detect
and quantify the association between GDP-FtsZ and sZipA. A 0.35 g/L solution of ZipA (B) was
automatically mixed in various proportions with a 0.5 g/L solution of FtsZ (A), to produce a
gradient of composition continuously varying from mole fraction 0 to mole fraction 1 of A. The
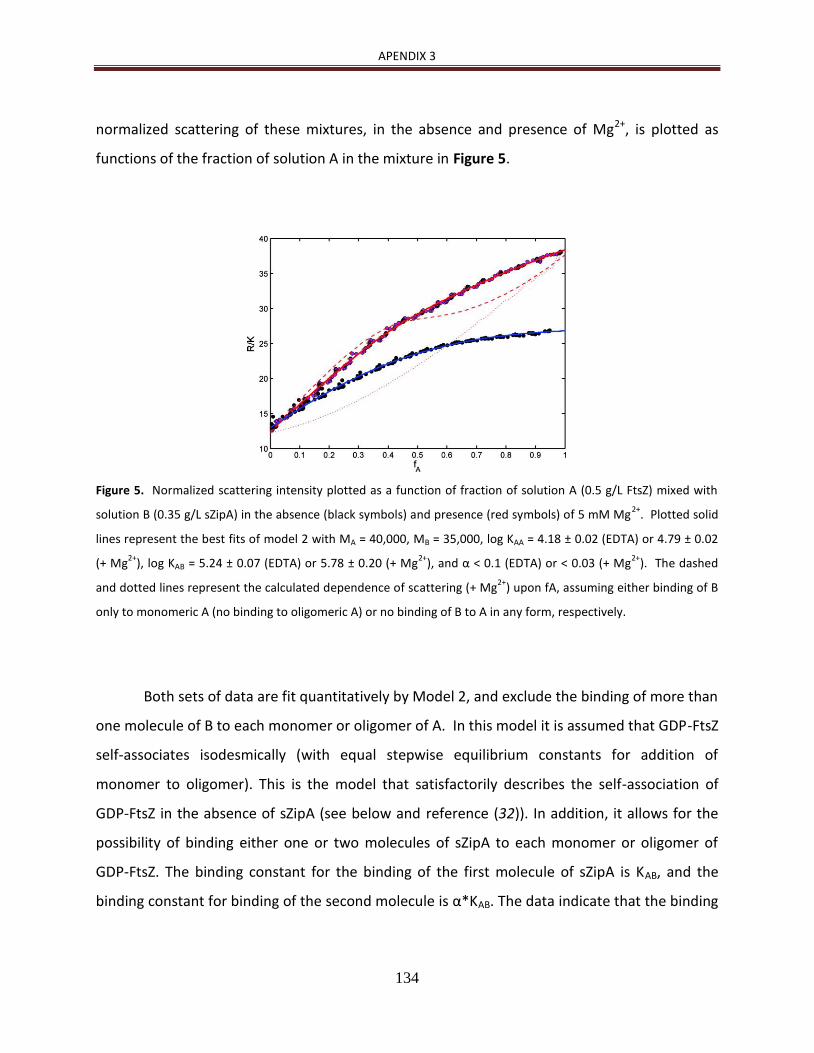
APENDIX 3
134
normalized scattering of these mixtures, in the absence and presence of Mg2+, is plotted as
functions of the fraction of solution A in the mixture in Figure 5.
Figure 5. Normalized scattering intensity plotted as a function of fraction of solution A (0.5 g/L FtsZ) mixed with
solution B (0.35 g/L sZipA) in the absence (black symbols) and presence (red symbols) of 5 mM Mg2+
. Plotted solid
lines represent the best fits of model 2 with MA = 40,000, MB = 35,000, log KAA = 4.18 ± 0.02 (EDTA) or 4.79 ± 0.02
(+ Mg2+
), log KAB = 5.24 ± 0.07 (EDTA) or 5.78 ± 0.20 (+ Mg2+
), and α < 0.1 (EDTA) or < 0.03 (+ Mg2+
). The dashed
and dotted lines represent the calculated dependence of scattering (+ Mg2+
) upon fA, assuming either binding of B
only to monomeric A (no binding to oligomeric A) or no binding of B to A in any form, respectively.
Both sets of data are fit quantitatively by Model 2, and exclude the binding of more than
one molecule of B to each monomer or oligomer of A. In this model it is assumed that GDP-FtsZ
self-associates isodesmically (with equal stepwise equilibrium constants for addition of
monomer to oligomer). This is the model that satisfactorily describes the self-association of
GDP-FtsZ in the absence of sZipA (see below and reference (32)). In addition, it allows for the
possibility of binding either one or two molecules of sZipA to each monomer or oligomer of
GDP-FtsZ. The binding constant for the binding of the first molecule of sZipA is KAB, and the
binding constant for binding of the second molecule is α*KAB. The data indicate that the binding

APENDIX 3
135
of one molecule of sZipA to an oligomer of FtsZ reduces the affinity for binding of a second
molecule of sZipA to the same oligomer by a factor greater than 10 (α < 0.03). The best fit of
this model to each data set, calculated using the parameter values given in the figure caption
(see also Table 1), is plotted in Figure 5 together with the data. The best-fit values of KAA
obtained from the analysis of the mixtures of FtsZ and sZipA are in very good agreement with
those previously obtained from the concentration dependence of the light scattering of GDP-
FtsZ in the absence of sZipA under comparable conditions. This lends confidence in the
robustness of our more general analysis of the two-component systems. The best-fit values of
log KAA and log KAB are well defined by the data assuming that the concentrations and molecular
weights of the two proteins have the assumed values. Even if the concentrations and molecular
weights were a little uncertain, the best-fit values of log KAA and log KAB were still well-defined,
however, with tolerances somewhat larger than those presented in the caption of Figure 5. To
illustrate how sensitive the results are to variation in model parameters, the CG-LS profile of
the mixture assuming either no binding of sZipA to FtsZ (dotted line) or binding of sZipA only to
monomeric A (dashed line) are also plotted in Figure 5.
The fractional contribution of each species to total scattering in the absence of Mg2+,
calculated according to eqn [3], and the corresponding mass fractional distributions are plotted
as a function of solution composition in Figures S3 and S4, respectively. The fractional
distribution plots in the presence of 5 mM Mg2+ are shown in Figures S5 and S6. From these
results we concluded that the scattering data obtained in the presence of Mg2+ are fit by an
equilibrium model which takes into account significant scattering contributions not only of the
species observable in the EDTA (B, A, A2 A3, AB and A2B), but also A4, A5, A6, A3B and A4B.

APENDIX 3
136
TABLE 1: Equilibrium association values for self- and hetero-associations of FtsZ and sZipA as
determined by composition-gradient static light scattering (CG-SLS) and sedimentation equilibrium
(SE)
Protein [Mg2+]
Log K AA Log K A-B
FtsZ (A) - 4.2 ± 0.1 (LS1)
4.3 (SE1
FtsZ (A) + ZipA (B) - 4.18 ± 0.02 (LS2)
3.8 (SE2)
5.24 ± 0.02 (LS2)
5.1 (SE2)
FtsZ (A) + 4.7 ± 0.1 (LS1)
4.8 (SE1)
FtsZ (A) + ZipA (B) + 4.79 ± 0.02 (LS2)
4.6 (SE2)
5.78 ± 0.02 (LS2)
5.4 (SE2)
Table legend:
-: experiment conducted in the presence of 1 mM EDTA
+: experiment conducted in the presence of 5 mM MgCl2
LS1: Best fit parameter values from the analysis of the CG-LS data using model 1 (eqns [4] – [6]), with MA = 40,000
SE1: Best fit parameter values from the analysis of the sedimentation equilibrium data using model 1 (eqns [4] – [5] + [13]), with MA = 40,000
We confirmed the interaction between sZipA and GDP-FtsZ by low-speed sedimentation
equilibrium. Figure 6 shows the equilibrium gradients of the mixture of sZipA (0.5 g/L; 14 µM)
and FtsZ (0.5 g/L; 12.5 µM) obtained in Tris-500KCl buffer with either 5 mM Mg2+ (panel A) or 1
mM EDTA (panel B) together with the calculated best fit gradients assuming a single species
model. The data are well described by species with single average buoyant Mw of 19,000 ± 800
(Mg2+) and 15,700 ± 1,000 (EDTA) values that in both cases are significantly higher than the
signal average buoyant Mw of the non-interacting mixtures (Mg2+: 14,200 ± 1,000; EDTA: 10,500
± 1,000), calculated from the buoyant Mw measured in parallel for isolated sZipA and FtsZ at the

APENDIX 3
137
same concentration, in the presence and in the absence of Mg2+. These results demonstrated
the presence of hetero-complexes in the two experimental conditions studied. The analysis of
the dependence of the average molecular weight as a function of the sZipA and FtsZ
concentrations in the mixtures, calculated using model 2 as described in the Materials and
Methods section, are in qualitative agreement with the results obtained from composition-
gradient light scattering (Figure 7). The model fits the data reasonably well, and both KAA and
KAB appear to increase in the presence of Mg2+ (Table 1). However, the values are lower of log
KAA and log KAB, with one exception (log KAB in EDTA), are lower than the values obtained from
the analysis of light scattering data.
Figure 6. Sedimentation equilibrium analysis of sZipA binding to GDP-FtsZ. Sedimentation equilibrium absorbance
profiles obtained at rotor speed 10,000 rpm and 20ºC for a sZipA-FtsZ mixture (0.5 g/L of each protein)
equilibrated in Tris-500KCl buffer containing either 5mM MgCl2 (panel A) or 1mM EDTA (panel B). Solid lines are
the best-fit equilibrium gradient for an ideally sedimenting species with signal average buoyant Mw of 19,000 ± 800
(Mg2+
) and 15,700 ± 1,000 (EDTA). The dashed lines are the predicted gradient of the non-interacting mixture at
the same protein concentration in the presence and in the absence of Mg2+
, respectively.

APENDIX 3
138
Figure 7. Analysis of the dependence of the signal average molecular weight of sZipA-FtsZ mixtures upon sZipA and
FtsZ concentration as measured by sedimentation equilibrium. Panel A: 5 mM Mg2+
. Panel B: 1 mM EDTA. The
grid lines represent the best fits of model 2 with MA = 40,000, MB = 35,000, log KAA = 3.8 (- Mg2+
) or 4.6 (+ Mg2+
),
and log KAB = 5.1 (- Mg2+
) or 5.4 (+ Mg2+
).
CONCLUDING REMARKS
Our composition-gradient static light scattering study of ZipA-FtsZ mixtures of known
composition has allowed us to determine that sZipA is monomeric, and that one molecule sZipA
can bind to a GDP-FtsZ monomer or oligomer (up to hexamers in our buffer conditions) with
moderate affinity (Figure 7). These results are compatible with results of parallel measurements
of composition-dependent sedimentation equilibrium. Moreover they are in good agreement
with earlier studies indicating that the C-terminal FtsZ-binding domain of ZipA binds with
micromolar affinity to a C-terminal fragment of FtsZ (26). The observed dependence of the
values of KAA and KAB upon Mg2+ concentration is probably of greater biological relevance than
the absolute values of these constants. Over the range of concentrations explored in our

APENDIX 3
139
experiments, the largest FtsZ oligomer present at significant abundance is the hexameric
species. Our data do not permit us to determine whether additional sZipA molecules can bind
to larger GDP-FtsZ oligomers but they establish that ZipA-FtsZ complex formation does not alter
the self-association equilibrium between FtsZ molecules.
This work provides an additional example of the capability of the recently developed CG-
SLS method to quantitatively characterize complex systems of self- and/or hetero-association
equilibria in solutions containing one or two macromolecular components. Our conclusions are
reinforced by parallel results obtained via measurements of sedimentation equilibrium. These
results suggest a possible mechanism for anchoring of FtsZ fibers to the E. coli inner membrane
via binding to membrane-localized ZipA.
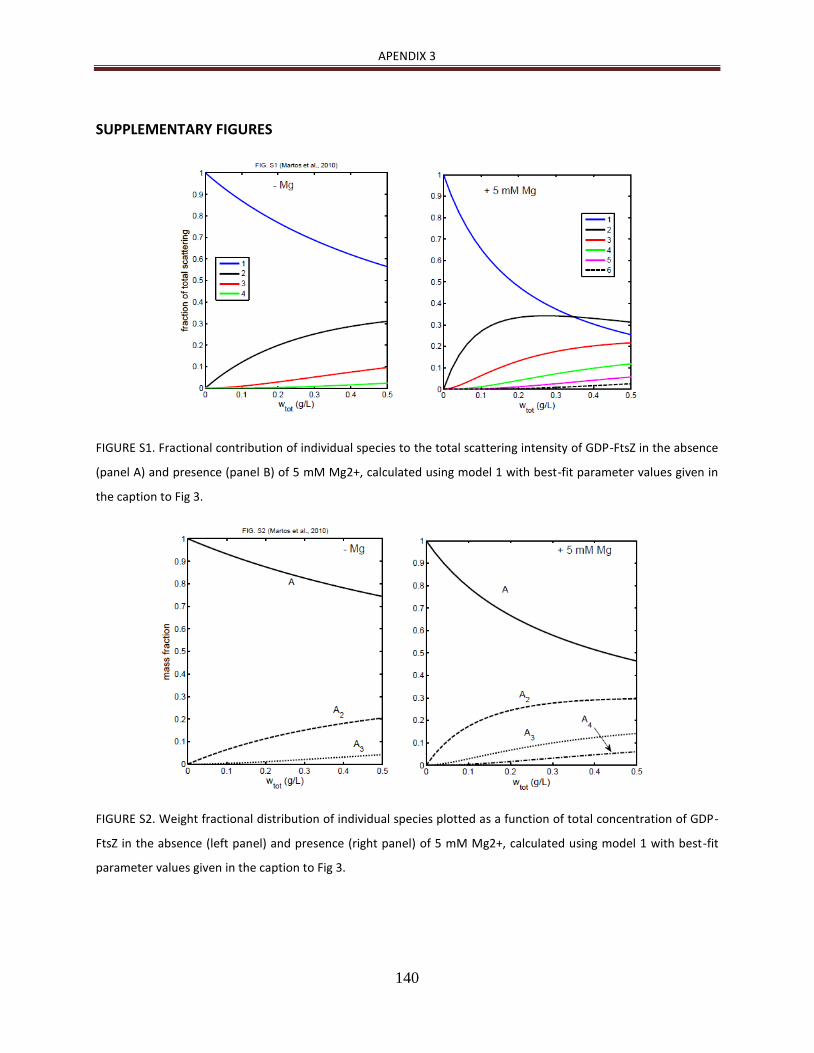
APENDIX 3
140
SUPPLEMENTARY FIGURES
FIGURE S1. Fractional contribution of individual species to the total scattering intensity of GDP-FtsZ in the absence
(panel A) and presence (panel B) of 5 mM Mg2+, calculated using model 1 with best-fit parameter values given in
the caption to Fig 3.
FIGURE S2. Weight fractional distribution of individual species plotted as a function of total concentration of GDP-
FtsZ in the absence (left panel) and presence (right panel) of 5 mM Mg2+, calculated using model 1 with best-fit
parameter values given in the caption to Fig 3.

APENDIX 3
141
FIGURE S3. Fractional contribution of individual species to the total scattering intensity of GDP-FtsZ – sZipA
mixtures in the absence of Mg2+, plotted as a function of solutio composition as described in the caption of Figure
4. Left and right hand panels show contributions of species lacking and containing B (sZipA) respectively, calculated
using best-fit parameter values given in the caption to Fig. 5.
FIGURE S4. Weight fractional distributions of individual species in GDP-FtsZ – sZipA mixture without Mg2+, plotted
as a function of solution composition as described in the caption of Figure 4. Left and right hand panels show
contributions of species lacking and containing B (sZipA) respectively, calculated using best-fit parameter values
given in the caption to Fig. 4.
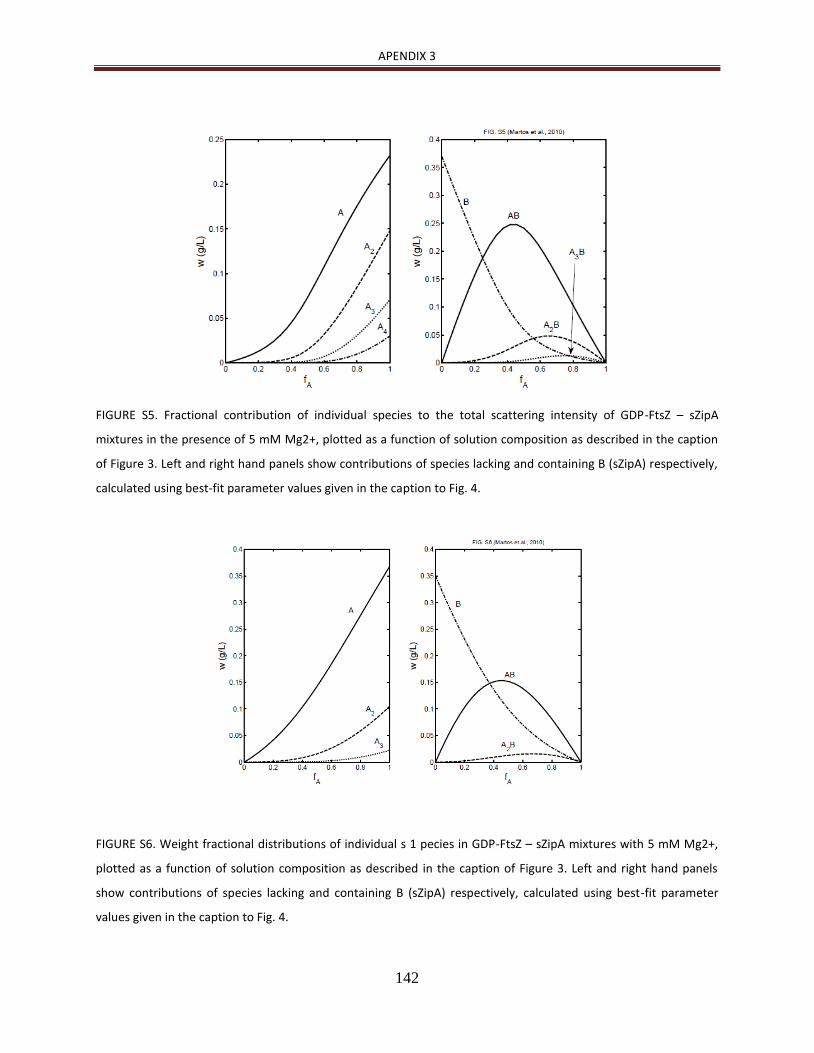
APENDIX 3
142
FIGURE S5. Fractional contribution of individual species to the total scattering intensity of GDP-FtsZ – sZipA
mixtures in the presence of 5 mM Mg2+, plotted as a function of solution composition as described in the caption
of Figure 3. Left and right hand panels show contributions of species lacking and containing B (sZipA) respectively,
calculated using best-fit parameter values given in the caption to Fig. 4.
FIGURE S6. Weight fractional distributions of individual s 1 pecies in GDP-FtsZ – sZipA mixtures with 5 mM Mg2+,
plotted as a function of solution composition as described in the caption of Figure 3. Left and right hand panels
show contributions of species lacking and containing B (sZipA) respectively, calculated using best-fit parameter
values given in the caption to Fig. 4.

APENDIX 3
143
References
1. Vicente, M., and Rico, A. I. (2006) The order of the ring: assembly of Escherichia coli cell division components, Molecular microbiology 61, 5-8.
2. Adams, D. W., and Errington, J. (2009) Bacterial cell division: assembly, maintenance and disassembly of the Z ring, Nature reviews 7, 642-653.
3. Mingorance, J., Rivas, G., Velez, M., Gomez-Puertas, P., and Vicente, M. (2010) Strong FtsZ is with the force: mechanisms to constrict bacteria, Trends in microbiology 18, 348-356.
4. Dajkovic, A., and Lutkenhaus, J. (2006) Z ring as executor of bacterial cell division, J Mol Microbiol Biotechnol 11, 140-151.
5. Gonzalez, J. M., Jimenez, M., Velez, M., Mingorance, J., Andreu, J. M., Vicente, M., and Rivas, G. (2003) Essential cell division protein FtsZ assembles into one monomer-thick ribbons under conditions resembling the crowded intracellular environment, The Journal of biological chemistry 278, 37664-37671.
6. Rivas, G., Fernandez, J. A., and Minton, A. P. (2001) Direct observation of the enhancement of noncooperative protein self-assembly by macromolecular crowding: indefinite linear self-association of bacterial cell division protein FtsZ, Proceedings of the National Academy of Sciences of the United States of America 98, 3150-3155.
7. Rivas, G., Lopez, A., Mingorance, J., Ferrandiz, M. J., Zorrilla, S., Minton, A. P., Vicente, M., and Andreu, J. M. (2000) Magnesium-induced linear self-association of the FtsZ bacterial cell division protein monomer. The primary steps for FtsZ assembly, J Biol Chem 275, 11740-11749.
8. Gonzalez, J. M., Velez, M., Jimenez, M., Alfonso, C., Schuck, P., Mingorance, J., Vicente, M., Minton, A. P., and Rivas, G. (2005) Cooperative behavior of Escherichia coli cell-division protein FtsZ assembly involves the preferential cyclization of long single-stranded fibrils, Proc Natl Acad Sci U S A 102, 1895-1900.
9. Huecas, S., and Andreu, J. M. (2003) Energetics of the cooperative assembly of cell division protein FtsZ and the nucleotide hydrolysis switch, The Journal of biological chemistry 278, 46146-46154.
10. Huecas, S., Llorca, O., Boskovic, J., Martin-Benito, J., Valpuesta, J. M., and Andreu, J. M. (2008) Energetics and geometry of FtsZ polymers: nucleated self-assembly of single protofilaments, Biophysical journal 94, 1796-1806.
11. Chen, Y., Bjornson, K., Redick, S. D., and Erickson, H. P. (2005) A rapid fluorescence assay for FtsZ assembly indicates cooperative assembly with a dimer nucleus, Biophysical journal 88, 505-514.
12. Chen, Y., and Erickson, H. P. (2008) In vitro assembly studies of FtsZ/tubulin-like proteins (TubZ) from Bacillus plasmids: evidence for a capping mechanism, The Journal of biological chemistry 283, 8102-8109.
13. Erickson, H. P., and Stoffler, D. (1996) Protofilaments and rings, two conformations of the tubulin family conserved from bacterial FtsZ to alpha/beta and gamma tubulin, The Journal of cell biology 135, 5-8.

APENDIX 3
144
14. Mingorance, J., Tadros, M., Vicente, M., Gonzalez, J. M., Rivas, G., and Velez, M. (2005) Visualization of single Escherichia coli FtsZ filament dynamics with atomic force microscopy, J Biol Chem 280, 20909-20914.
15. Margolin, W. (2005) FtsZ and the division of prokaryotic cells and organelles, Nat Rev Mol Cell Biol 6, 862-871.
16. Sanchez, M., Valencia, A., Ferrandiz, M. J., Sander, C., and Vicente, M. (1994) Correlation between the structure and biochemical activities of FtsA, an essential cell division protein of the actin family, The EMBO journal 13, 4919-4925.
17. Erickson, H. P. (2001) The FtsZ protofilament and attachment of ZipA--structural constraints on the FtsZ power stroke, Current opinion in cell biology 13, 55-60.
18. Hale, C. A., and de Boer, P. A. (1997) Direct binding of FtsZ to ZipA, an essential component of the septal ring structure that mediates cell division in E. coli, Cell 88, 175-185.
19. Hale, C. A., Rhee, A. C., and de Boer, P. A. (2000) ZipA-induced bundling of FtsZ polymers mediated by an interaction between C-terminal domains, Journal of bacteriology 182, 5153-5166.
20. Ohashi, T., Hale, C. A., de Boer, P. A., and Erickson, H. P. (2002) Structural evidence that the P/Q domain of ZipA is an unstructured, flexible tether between the membrane and the C-terminal FtsZ-binding domain, Journal of bacteriology 184, 4313-4315.
21. Hale, C. A., and de Boer, P. A. (1999) Recruitment of ZipA to the septal ring of Escherichia coli is dependent on FtsZ and independent of FtsA, Journal of bacteriology 181, 167-176.
22. RayChaudhuri, D. (1999) ZipA is a MAP-Tau homolog and is essential for structural integrity of the cytokinetic FtsZ ring during bacterial cell division, The EMBO journal 18, 2372-2383.
23. Hale, C. A., and de Boer, P. A. (2002) ZipA is required for recruitment of FtsK, FtsQ, FtsL, and FtsN to the septal ring in Escherichia coli, Journal of bacteriology 184, 2552-2556.
24. Haney, S. A., Glasfeld, E., Hale, C., Keeney, D., He, Z., and de Boer, P. (2001) Genetic analysis of the Escherichia coli FtsZ.ZipA interaction in the yeast two-hybrid system. Characterization of FtsZ residues essential for the interactions with ZipA and with FtsA, J Biol Chem 276, 11980-11987.
25. Moreira, I. S., Fernandes, P. A., and Ramos, M. J. (2006) Detailed microscopic study of the full zipA:FtsZ interface, Proteins 63, 811-821.
26. Mosyak, L., Zhang, Y., Glasfeld, E., Haney, S., Stahl, M., Seehra, J., and Somers, W. S. (2000) The bacterial cell-division protein ZipA and its interaction with an FtsZ fragment revealed by X-ray crystallography, EMBO J 19, 3179-3191.
27. Moy, F. J., Glasfeld, E., Mosyak, L., and Powers, R. (2000) Solution structure of ZipA, a crucial component of Escherichia coli cell division, Biochemistry 39, 9146-9156.
28. Attri, A. K., Fernandez, C., and Minton, A. P. (2010) pH-dependent self-association of zinc-free insulin characterized by concentration-gradient static light scattering, Biophysical chemistry 148, 28-33.
APENDIX 3
145
29. Attri, A. K., Fernandez, C., and Minton, A. P. (2010) Self-association of Zn-insulin at neutral pH: investigation by concentration gradient--static and dynamic light scattering, Biophysical chemistry 148, 23-27.
30. Attri, A. K., and Minton, A. P. (2005) Composition gradient static light scattering: a new technique for rapid detection and quantitative characterization of reversible macromolecular hetero-associations in solution, Analytical biochemistry 346, 132-138.
31. Attri, A. K., and Minton, A. P. (2005) New methods for measuring macromolecular interactions in solution via static light scattering: basic methodology and application to nonassociating and self-associating proteins, Analytical biochemistry 337, 103-110.
32. Kameyama, K., and Minton, A. P. (2006) Rapid quantitative characterization of protein interactions by composition gradient static light scattering, Biophysical journal 90, 2164-2169.
33. Cole, J. L., Lary, J. W., T, P. M., and Laue, T. M. (2008) Analytical ultracentrifugation: sedimentation velocity and sedimentation equilibrium, Methods in cell biology 84, 143-179.
34. Minton, A. P. (1997) Alternative strategies for the characterization of associations in multicomponent solutions via measurement of sedimentation equilibrium, Progr. Colloid Polym. Sci. 107, 11-19.

APENDIX 3
146

147
5.-DISCUSIÓN INTEGRADORA
FtsZ es la proteína mayoritaria de la maquinaria macromolecular que lleva a cabo
el proceso esencial de la división bacteriana. Además, FtsZ, es la primera proteína que se
localiza en el sitio de división. El primer complejo multiproteico en formarse es el proto-
anillo, su ensamblaje tiene lugar en el citoplasma bacteriano, en el entorno de la
membrana, a través de interacciones macromoleculares reversibles, que están moduladas
en una buena parte, por diferentes cofactores [1, 2]. Por tanto, la caracterización biofísica
de las interacciones implicadas en los primeros pasos de la formación del proto-anillo, y la
dependencia con sus cofactores, es de esencial interés en los campos de la biología,
medicina y la farmacología, ya que estas proteínas y sus interacciones suponen
potenciales dianas en el desarrollo de nuevos agentes antibacterianos [3].
Pequeños microgradientes en variables físico-químicas como fuerza iónica, pH,
agentes de aglomeración macromolecular, entre otras, son habituales entre los diferentes
microentornos del citoplasma bacteriano. En algunos casos, sutiles diferencias en estas
variables, son en gran medida, las responsables de modular las interacciones
interproteicas, y por tanto, de regular el ensamblaje y actividad de maquinarias
macromoleculares en sistemas biológicos. Los cationes Ca2+
y Mg2+, juegan un papel muy
importante como moduladores de los procesos funcionales biológicos. El Mg2+
es el catión
más abundante en el citoplasma bacteriano después del K+, y está implicado en
numerosas funciones celulares, como activador de algunas enzimas, formando complejos,
modificando sustratos y manteniendo estable la estructura de algunas proteínas y ácidos
nucleicos entre otras [4].
FtsZ, posee motivos estructurales potencialmente implicados en la unión de cationes
monovalentes y divalentes que podrían ser importantes en la regulación de la estructura y
función de la proteína [5]. Otros cationes como K+
o Na+, también están implicados en
procesos de gran relevancia, por ejemplo, modulando la actividad GTPasa de FtsZ y por
tanto la dinámica de los proto-filamentos [2]. Por estos motivos, se hace de esencial

148
importancia el estudio del efecto de estos cofactores sobre la oligomerización y el
ensamblaje de la proteína. Estas propiedades, hacen que el ensamblaje de FtsZ sea un
proceso tan dinámico y dificultan su estudio y caracterización, de manera que el uso de
algunos métodos bioquímicos y biofísicos para la caracterización cuantitativa del proceso
quedan restringidos. Para evitar en parte estas limitaciones, se utilizó en todos los ensayos
en los que se promueve la polimerización con GTP, un sistema enzimático de regeneración
del GTP [6]. Mediante el uso de este sistema de regeneración, se pudieron mantener
estables los polímeros durante un tiempo de al menos 80 minutos, suficiente para llevar a
cabo los experimentos que se describen en la caracterización del polímero de GTP-FtsZ
(ver apéndice 1). El uso de este sistema de regeneración del GTP es muy importante, ya
que simula la situación in vivo, donde los polímeros de FtsZ están bajo condiciones de una
elevada y constante relación de GTP/GDP [7].
La polimerización de FtsZ en presencia de GTP o GMPCPP y su dependencia con la
concentración de Mg2+ se analiza en el capitulo I. En trabajos anteriores, se observaba
cierta dependencia entre la actividad GTPasa y la concentración de Mg2+ [8, 9]. Nuestros
resultados, confirman los resultados previos y además, proporcionan un estudio
minucioso de la dependencia del grado de polimerización, tanto con la concentración de
Mg2+ a concentraciones submilimolares, como con la concentración de FtsZ. Mediante
este estudio, podemos confirmar la formación de especies poliméricas de tamaño
definido [10]. La distribución de tamaños de estas especies, se encuentra en un rango muy
estrecho y definido, con lo que hemos podido determinar por primera vez la masa
molecular promedio, y por tanto, el número promedio de subunidades de las que consta
el proto-filamento de FtsZ, pieza clave en la maquinaria de división bacteriana. Los
resultados obtenidos mediante varias técnicas, están en buen acuerdo y apuntan en la
misma dirección en cuanto a la formación de polímeros de tamaño definido. Este hecho,
por un lado, apoya resultados previos observados por criotomografía electrónica [11], que
sugieren, que el anillo-Z no es una estructura continua, si no que está formada por
agrupación de filamentos más cortos como se muestra en la figura 1 de la discusión.

149
Figura 1. Modelo propuesto por Erickson et al, [12]
basandose en resultados de criotomógrafía electronica ,
[11] de manera que el anillo de división estaría compuesto por multitud de proto-filamentos de longitud
definida superponiendose.
El hecho de tener un tamaño definido en los proto-filamentos, también esta en
buen acuerdo con el mecanismo propuesto anteriormente de polimerización, donde se
postula una etapa de ciclación [10] (ver figura 5 de la introducción). Además, se ha podido
observar, que la polimerización, no solamente es dependiente de la concentración de
Mg2+, si no que a concentraciones micromolares de Mg2+, es también dependiente de la
concentración de proteína.
La polimerización de FtsZ en presencia de GTP, puede describirse como una transición
concertada, termodinámicamente similar a una transición de fase de segundo orden entre
especies de bajo y elevado peso molecular. Sin embargo, en presencia de GMPCPP puede
describirse más apropiadamente como una transición de primer orden, desde especies
oligoméricas pequeñas hasta polímeros, a partir de un determinado valor de
concentración crítica de proteína, característica de un proceso cooperativo [13].
Centrándonos en el estudio y la caracterización biofísica de FtsZ en su forma GDP, y
la dependencia de la oligomerización a concentraciones submilimolares Mg2+ en todo el
rango fisiológico (Apéndice 1), obtenemos una clara dependencia de la oligomerización,
tanto con la concentración de Mg2+, como con la concentración de proteína. Estudios
previos realizados a media y baja fuerza iónica indicaban una asociación isodésmica para
formar oligómeros lineales de longitud indefinida y dependiente de la fuerza iónica,
concentraciones milimolares variables de Mg2+, y agentes de aglomeración

150
macromolecular [14 - 16]. En este estudio incorporado en el Apéndice 1, nos centramos
fundamentalmente en condiciones de alta fuerza iónica, donde la reacción dominante es
la dimerización de FtsZ. La importancia de este estudio radica en que la especie dimérica
es la unidad de actividad GTPasa. El análisis mediante las técnicas biofísicas empleadas,
indica que las especies predominantes en disolución son monómeros y dímeros en
equilibrio, aunque existe una pequeña proporción de especies de mayor orden. Además,
ha sido posible aplicar un modelo de ajuste a los datos de dispersión de luz estática. A
través de los resultados del ajuste, se han obtenido las constantes de equilibrio, además
de los coeficientes de sedimentación y de difusión de las especies presentes en este
equilibrio mediante otras técnicas.
Por otro lado, el rango de concentraciones del catión Mg2+ en las que suceden
tanto la oligomerización como el ensamblaje de FtsZ se encuentran próximas y dentro del
rango micromolar. De esta manera, la oligomerización y la polimerización de FtsZ deben
estar correlacionadas, y en los dos casos, se encuentra una fuerte dependencia con la
concentración de Mg2+. En ambos casos, la concentración de Mg2+ en la que las reacciones
de polimerización y oligomerización alcanzan el 50% se encuentra muy cercana al rango
milimolar, entre 1 y 5 x10⁻⁵ M, siendo la reacción de polimerización, aparentemente más
sensible a cambios en la concentración del catión.
La caracterización de FtsZ en las formas GTP y GMPCPP y su dependencia con la
fuerza iónica se aborda en el capitulo II. Algunos autores, habían estudiado el efecto del K+
y otros cationes sobre la actividad GTPasa bajo diferentes condiciones de pH, observando,
que el K+
estimula la actividad GTPasa de FtsZ [2, 6, 8, 17, 18]. Nosotros, además, aportamos un
estudio exhaustivo del ensamblaje de FtsZ, su dependencia con la composición salina y
fuerza iónica del medio. Asimismo, observamos un comportamiento inverso entre la
polimerización inducida en presencia de GTP y la polimerización por GMPCPP, un análogo
lentamente hidrolizable de GTP. De esta manera, en el caso de GTP-FtsZ, el grado de
polimerización decrece notablemente al disminuir la fuerza iónica del medio desde 500
mM a 100 mM. Por el contrario, en el caso de GMPCPP-FtsZ, el tamaño de los polímeros
formados, aumenta drásticamente al disminuir la concentración iónica.

151
En el caso de GTP-FtsZ, la polimerización es un proceso muy dinámico. La actividad
GTPasa está muy fuertemente ligada a la concentración de K+ y otros cationes
monovalentes [2, 6, 8, 18]. Según explica Erickson y colaboradores, [18, 19] la actividad GTPasa
de FtsZ es óptima a baja fuerza iónica (100 mM), viéndose ligeramente atenuada al
aumentar la fuerza iónica (500 mM). Este efecto, condiciona fuertemente la dinámica de
hidrólisis e intercambio de nucleótido, por tanto, el tamaño observado de los polímeros
en ambas condiciones de salinidad. De esta manera, el grado de polimerización de la
proteína en presencia de GTP, se encuentra aparentemente dominado por el efecto de la
fuerza iónica sobre la actividad GTPasa. A 100 mM de K+ los polímeros formados son más
dinámicos, por tanto, su tamaño promedio, será más pequeño que los formados a 500
mM.
En el caso de GMPCPP-FtsZ la actividad GTPasa está en gran parte inhibida, de
manera que a 37oC la proteína cuenta solamente con el 4% de su actividad [20], por tanto,
la dinámica de los polímeros formados está también fuertemente inhibida. Posiblemente,
al igual que sucede en el caso de GTP-FtsZ, a baja fuerza iónica (100 mM) la actividad
GTPasa sea algo mayor que en el caso de alta fuerza iónica (500 mM), por tanto, los
polímeros de GMPCPP-FtsZ a baja sal serán también de menor tamaño. A parte de este
efecto, debe haber otro tipo de interacciones que están atenuadas por el incremento de la
fuerza iónica y por tanto, aparentemente, con cierta componente electrostática entre las
diferentes cadenas de polímero proteico. De manera que al ir aumentando la fuerza
iónica, estas posibles interacciones atractivas polímero-polímero se ven cada vez más
apantalladas, por tanto, el tamaño de las especies formadas disminuye al aumentar la
fuerza iónica. Este efecto es comparable al que sufre la tubulina eucariota, que tiene una
actividad GTPasa unas 100 veces menor que FtsZ [21], y similar al caso de GDP-FtsZ [14], lo
cual nos sugiere, que los estados poco activos o dinámicos de FtsZ ven favorecido su
ensamblaje a baja fuerza iónica de una manera aparentemente dirigida por efectos
electrostáticos.
Mediante experimentos de microscopía electrónica de transmisión, (ver material
suplementario del capítulo 2) pudimos corroborar esta tendencia. De esta manera, a baja

152
fuerza iónica (100 mM), mientras los polímeros de GMPCPP se asocian formando redes de
polímeros de varios filamentos de espesor, los polímeros de GTP son sencillos y
aparentemente más cortos que en el caso de alta fuerza iónica.
Por otro lado, mediante la utilización del anión Acetato en vez de Cloruro, hemos
podido observar algunas leves diferencias en las especies poliméricas formadas en
presencia de Mg2+, pero la tendencia del grado de polimerización con la fuerza iónica, va
en el mismo camino que usando Cloruro. Sin embargo, utilizando Acetato en ausencia de
Mg2+ y presencia de EDTA, hemos podido observar mediante velocidad de sedimentación
y dispersión de luz, la precipitación de parte de la proteína, en condiciones, en las que
usando el anión Cloruro teníamos mayoritariamente monómero. Por tanto, la presencia
conjunta de Acetato y EDTA produce una agregación importante de la proteína, dato a
tener en cuenta, ya que en algunos trabajos previos de Erickson y colaboradores, [18]
utilizaban esta combinación en alguno de sus tampones.
Con objeto de obtener información sobre los primeros pasos del mecanismo por el
cuál tiene lugar la división bacteriana, el estudio de la interacción entre las proteínas FtsZ
y ZipA en un sistema reconstituido de membrana, constituye un tema de estudio esencial.
La reconstitución funcional de los elementos del proto-anillo en sistemas biomiméticos de
membrana, es una de las bases del estudio de la funcionalidad y especificidad de
interacciones en biología sintética aplicada a sistemas mínimos, así como una herramienta
para la detección y cuantificación de interacciones. En el apéndice 2 del capitulo III, hemos
reconstituido la membrana bacteriana, tanto la formada por fosfolípidos comerciales,
como la formada por membrana natural interna aislada directamente de la bacteria, en la
superficie de microesferas monodispersas. Mediante el desarrollo de este sistema, hemos
podido reconstituir y detectar con muy elevada sensibilidad las interacciones entre ZipA y
FtsZ en diferentes estados de asociación, en un entorno biomimético de membrana. Los
resultados de la reconstitución (apéndice 2), junto con el estudio en disolución (apéndice
3), proporcionan argumentos suficientes para confirmar el papel de ZipA como anclaje de
FtsZ a la membrana. ZipA, como hemos visto, es capaz de unir a la membrana tanto las
formas oligoméricas (GDP-FtsZ) como poliméricas (GTP-FtsZ). En este caso, se ha
153
observado cómo los polímeros de FtsZ crecen anclados a la membrana formando redes
tridimensionales, incluso crecen formando haces de filamentos que unen diferentes
microesferas (ver apéndice 2). Si cada subunidad de FtsZ del polímero, se uniera a la
membrana, no se formarían redes tridimensionales, y los polímeros formados, no se
separarían de la superficie de las esferas. Este hecho apoya los resultados obtenidos
previamente por dispersión de luz estática en gradiente de concentración y equilibrio de
sedimentación [15], que indican una unión subestequiométrica entre oligómeros de
diferente tamaño de FtsZ (desde monómero hasta hexámero) y una sola unidad de ZipA
(ver apéndice 3).
El desarrollo de sistemas de detección directa proteína-proteína en medios
biomiméticos de membrana es de elevada complejidad, ya que, normalmente, implica la
necesidad del marcaje con sondas fluorescentes o la inmunodetección con anticuerpos. La
fabricación de sustratos con elevada densidad de “SERS hot spots”, (ve sección de
métodos), en la superfie de microesferas es una de las piezas clave en el desarrollo de
sistemas de detección ultrasensible. Este tipo de sistemas supone un gran avance en el
desarrollo de sistemas miniaturizados de detección de interacciones y diagnóstico portátil
y rápido. Mediante la utilización de estos sensores plasmónicos, en el capítulo III, hemos
podido detectar los cambios conformacionales producidos en ZipA por interacción con
GDP-FtsZ y GTP-FtsZ. Mediante este ensayo, hemos podido determinar que estos cambios
conformacionales confirman, por un lado, la existencia de la interacción, además de
revelar, que la unión de FtsZ afecta estructuralmente a ZipA de manera diferente
dependientemente del estado de asociación de FtsZ. Además, hemos detectado la
interacción entre polímeros de FtsZ con ZipA en la propia membrana formada por
fosfolípidos de E. coli. Asimismo, hemos podido detectar la interacción de polímeros de
FtsZ con el resto de componentes de la maquinaria de división, además de ZipA, en la
propia membrana interna bacteriana, a través de cambios estructurales revelados por los
espectros vibracionales de SERS.
Este sistema de detección nos proporciona una gran sensibilidad para detectar cambios
conformacionales de la espectroscopía SERS, además, la ventaja de la miniaturización del

154
sistema de detección, nos permite utilizar mínimas cantidades de muestra. Por otro lado,
el ensayo desarrollado, permitirá evaluar la acción de nuevos potenciales agentes
antibióticos en el ensamblaje de la maquinaria de división bacteriana o en la interacción
FtsZ-ZipA.

155
Referencias
1. Vicente M, Rico AI, Martínez-Arteaga R, Mingorance J. Septum enlightenment:
assembly of bacterial division proteins. J Bacteriol. 2006;188(1):19-27. Review
2. Tadros M, González JM, Rivas G, Vicente M, Mingorance J. Activation of the
Escherichia coli cell division protein FtsZ by a low-affinity interaction with
monovalent cations. FEBS Lett. 2006 Sep 4;580(20):4941-6.
3. Awasthi D, Kumar K, Ojima I. Therapeutic potential of FtsZ inhibition: a patent
perspective. Expert Opin Ther Pat. 2011 May;21(5):657-79.
4. Romani A, Scarpa A. Regulation of cell magnesium. Arch Biochem Biophys. 1992
Oct;298(1):1-12. Review
5. Yu XC, Margolin W. Ca2+-mediated GTP-dependent dynamic assembly of bacterial
cell division protein FtsZ into asters and polymer networks in vitro. EMBO J. 1997
Sep 1;16(17):5455-63.
6. González JM, Jiménez M, Vélez M, Mingorance J, Andreu JM, Vicente M, Rivas G.
Essential cell division protein FtsZ assembles into one monomer-thick ribbons
under conditions resembling the crowded intracellular environment. J Biol Chem.
2003 Sep 26;278(39):37664-71.
7. Small E, Addinall SG. Dynamic FtsZ polymerization is sensitive to the GTP to GDP
ratio and can be maintained at steady state using a GTP-regeneration system.
Microbiology. 2003 Aug;149(Pt 8):2235-42.
8. Mingorance J, Rueda S, Gómez-Puertas P, Valencia A, Vicente M. Escherichia coli
FtsZ polymers contain mostly GTP and have a high nucleotide turnover. Mol
Microbiol. 2001 Jul;41(1):83-91.

156
9. Mukherjee A, Lutkenhaus J. Analysis of FtsZ assembly by light scattering and
determination of the role of divalent metal cations. J Bacteriol. 1999
Feb;181(3):823-32.
10. González JM, Vélez M, Jiménez M, Alfonso C, Schuck P, Mingorance J, Vicente M,
Minton AP, Rivas G. Cooperative behavior of Escherichia coli cell-division protein
FtsZ assembly involves the preferential cyclization of long single-stranded fibrils.
Proc Natl Acad Sci U S A. 2005 Feb 8;102(6):1895-900
11. Li Z, Trimble MJ, Brun YV, Jensen GJ. The structure of FtsZ filaments in vivo
suggests a force-generating role in cell division. EMBO J. 2007 Nov 14;26(22):4694-
708. Epub 2007 Oct 18.
12. Erickson HP, Anderson DE, Osawa M. FtsZ in bacterial cytokinesis: cytoskeleton and
force generator all in one. Microbiol Mol Biol Rev. 2010 Dec;74(4):504-28.
13. Hall D, Minton AP. Effects of inert volume-excluding macromolecules on protein
fiber formation. I. Equilibrium models. Biophys Chem. 2002 Jul 10;98(1-2):93-104.
14. Rivas G, López A, Mingorance J, Ferrándiz MJ, Zorrilla S, Minton AP, Vicente M,
Andreu JM. Magnesium-induced linear self-association of the FtsZ bacterial cell
division protein monomer. The primary steps for FtsZ assembly. J Biol Chem. 2000
Apr 21;275(16):11740-9.
15. Martos A, Alfonso C, López-Navajas P, Ahijado-Guzmán R, Mingorance J, Minton
AP, Rivas G. Characterization of self-association and heteroassociation of bacterial
cell division proteins FtsZ and ZipA in solution by composition gradient-static light
scattering. Biochemistry, 2010. 49(51): p.10780‒10787.
16. Rivas G, Fernández JA, Minton AP. Direct observation of the enhancement of
noncooperative protein self-assembly by macromolecular crowding: indefinite

157
linear self-association of bacterial cell division protein FtsZ. Proc Natl Acad Sci U S
A. 2001 13;98(6):3150-5.
17. Lu C, Erickson HP. Purification and assembly of FtsZ. Methods Enzymol.
1998;298:305-13.
18. Chen Y, Erickson HP. FtsZ filament dynamics at steady state: subunit exchange with
and without nucleotide hydrolysis. Biochemistry. 2009 Jul 21;48(28):6664-73.
19. Lu C, Stricker J, Erickson HP. FtsZ from Escherichia coli, Azotobacter vinelandii, and
Thermotoga maritima-quantitation, GTP hydrolysis, and assembly. Cell Motil Cytoskeleton.
1998;40(1):71-86.
20. Salvarelli E, Krupka M, Rivas G, Vicente M, Mingorance J. Independence between
GTPase active sites in the Escherichia coli cell division protein FtsZ. FEBS Lett. 2011
Dec 15;585(24):3880-3.
21. Olmsted JB, Borisy GG. Characterization of microtubule assembly in porcine brain
extracts by viscometry. Biochemistry. 1973 Oct 9;12(21):4282-9.

158
159
6.-APORTACIONES
FUNDAMENTALES
CAPÍTULO I: CARACTERIZACIÓN BIOFÍSICA DE FtsZ EN PRESENCIA DE GTP O UN
ANÁLOGO DE GTP: El ensamblaje de FtsZ activado por Mg2+ promueve la formación
concertada de especies poliméricas definidas.
En este capítulo hemos podido confirmar la formación de especies de tamaño definido,
obtener su masa molecular, además de proporcionar un estudio exhaustivo de la
dependencia del grado de polimerización, tanto con la concentración de Mg2+, como con
la concentración de FtsZ. Las técnicas empleadas en este estudio son: Dispersión de luz
estática en gradiente de concentración, velocidad de sedimentación, dispersión de luz
dinámica y espectroscopía de correlación de fluorescencia. Las aportaciones más
relevantes de este trabajo son:
- Hemos podido determinar por primera vez la masa molecular promedio y por
tanto el número promedio de subunidades de las que consta el proto-filamento de
FtsZ.
- La polimerización es dependiente de la concentración de Mg2+, y en
concentraciones micromolares de Mg2+, es dependiente de la concentración de
proteína.
- Parámetros termodinámicos e hidrodinámicos del ensamblaje de FtsZ en presencia
de GTP y GMPCPP, un análogo lentamente hidrolizable de GTP.

160
APÉNDICE 1: CARACTERIZACIÓN BIOFÍSICA DE FtsZ EN PRESENCIA DE GDP. Efecto del
Mg2+ como regulador del equilibrio de oligomerización.
En este apartado hemos caracterizado el equilibrio de oligomerización de FtsZ en su forma
GDP. Además, hemos hecho un estudio minucioso de la dependencia de este equilibrio
con la concentración de Mg2+ y de proteína. Las técnicas empleadas en este estudio son:
Dispersión de luz estática en gradiente de concentración, velocidad de sedimentación y
dispersión de luz dinámica. Este trabajo aporta:
- Parámetros termodinámicos e hidrodinámicos de la homoasociacion de FtsZ en su
forma GDP. El análisis de los resultados indica que las especies predominantes en
disolución son monómeros y dímeros en equilibrio.
CAPÍTULO II: EFECTO DE LA COMPOSICIÓN IÓNICA DEL TAMPÓN EN EL ENSAMBLAJE DE
FtsZ EN PRESENCIA DE GTP O UN ANÁLOGO DE GTP.
En este capítulo hemos podido determinar la dependencia del grado de polimerización
con la concentración de K+. Además, hemos proporcionado un estudio exhaustivo de la
dependencia del grado de polimerización, tanto con la composición salina del tampón,
como con la concentración de FtsZ. Las técnicas empleadas en este estudio son:
Dispersión de luz estática en gradiente de concentración, velocidad de sedimentación,
dispersión de luz dinámica y espectroscopía de correlación de fluorescencia. Las
aportaciones más relevantes de este trabajo son:
- El grado de polimerización de GTP-FtsZ decrece notablemente al disminuir la
fuerza iónica del medio desde 500 mM a 100 mM.
- En el caso de GMPCPP-FtsZ, el grado de polimerización aumenta progresivamente
al disminuir la concentración iónica.

161
- La utilización conjunta, por parte de algunos laboratorios, de disoluciones tampón
con Acetato y EDTA, lleva consigo la agregación de buena parte de la proteína.
- Hemos establecido una clara y evidente dependencia del grado de polimerización
con la composición iónica de la disolución tampón. Este estudio es clave en cuanto
al entendimiento de las discrepancias encontradas a lo largo de la literatura sobre
el ensamblaje de FtsZ en diferentes composiciones iónicas.
CAPÍTULO III: RECONSTITUCIÓN, AUTO-ENSAMBLAJE Y ESTUDIO MEDIANTE
ESPECTROSCOPÍA SERS DE LA INTERACCIÓN DE FtsZ Y OTROS ELEMENTOS DE LA
MEMBRANA BACTERIANA EN MICROESFERAS FUNCIONALIZADAS
En el capitulo III hemos recubierto microesferas con una alta densidad de nanosensores
plasmónicos con propiedades ópticas avanzadas que nos sirven, tanto para la
reconstitución, como soporte para espectroscopía SERS. Mediante el desarrollo de este
sistema hemos podido reconstituir y detectar con muy elevada sensibilidad las
interacciones entre ZipA y FtsZ en diferentes estados de oligo- o polimerización, además
de reconstituir los elementos del divisoma en un entorno biomimético de membrana. Las
aportaciones más relevantes de este trabajo son:
- Hemos funcionalizado la superficie de microesferas con nanosensores plasmónicos
de oro y plata con alta actividad en espectroscopía SERS. La puesta a punto de
estos sensores plamónicos es una pieza clave en el desarrollo de sistemas
miniaturizados de diagnóstico rápido así como de sistemas de screening de alto
rendimiento para la búsqueda de actividad de nuevo fármacos.
- Hemos estudiado los cambios conformacionales que sufre la proteína ZipA a través
de la interacción con las diferentes formas de FtsZ reconstituidas en la superficie
de sensores plasmónicos.
- Hemos detectado con gran sensibilidad la interacción del polímero de FtsZ con
componentes del divisoma en la propia membrana interna bacteriana, tanto
natural como sintética. Con este sistema podríamos detectar la interacción de
162
nuevos potenciales fármacos antibióticos que afectaran a la maquinaria de división
o a alguno de sus componentes.
APÉNDICE 2: RECONSTITUCIÓN DE LOS ELEMENTOS DEL PROTO-ANILLO EN
MICROESFERAS
En el apéndice 2 hemos reconstituido la membrana bacteriana, tanto la formada por
fosfolípidos comerciales, como la membrana natural interna, en la superficie de
microesferas monodispersas.
- Hemos puesto a punto un método mediante el que podemos depositar y recubrir
homogéneamente con membrana bacteriana la superficie de microesferas
monodispersas. Además hemos podido reconstituir la interacción FtsZ-ZipA en
estos sistemas modelo de membrana.
APÉNDICE 3: CARACTERIZACIÓN DE LA HETEROASOCIACIÓN ENTRE ZipA Y LAS FORMAS
GDP DE FtsZ MEDIANTE DISPERSIÓN DE LUZ ESTÁTICA EN GRADIENTE DE
CONCENTRACIÓN
En el Apéndice 3, hemos caracterizado cuantitativamente las interacciones entre FtsZ
(GDP) y la forma soluble de ZipA (carente del dominio transmembrana) mediante
dispersión de luz estática en gradiente de concentración (CG-SLS) y ultracentrifugación
analítica.
- Se han obtenido las constantes de asociación de la heteroasociacion de FtsZ en su
forma GDP con la proteína ZipA. El análisis de los resultados indica que la
naturaleza de la interacción es subestequiométrica, de manera que un sólo
monómero de ZipA es capaz de unirse a oligómeros de FtsZ independientemente
de su tamaño.

163
164
7.-CONCLUSIONES
I. El número promedio de subunidades de las que consta el proto-filamento de FtsZ
en la forma GTP es 100 ± 15 protómeros y en la forma GMPCPP es 160 ± 20
monómeros.
II. El grado de polimerización de GTP-FtsZ decrece notablemente al disminuir la
fuerza iónica del medio desde 500 mM a 100 mM. En el caso de GMPCPP-FtsZ, el
grado de polimerización aumenta progresivamente al disminuir la concentración
iónica.
III. Mediante la utilización de tampones que combinan Acetato y EDTA, parte de la
proteína sufre un proceso de agregación. Este tipo de tampones, como se ha
indicado anteriormente, es de uso habitual por algunos grupos de investigación
relevantes.
IV. La oligomerización de FtsZ en presencia de GDP es un proceso controlado por la
unión de Mg2+ y por la concentración de proteína. El análisis mediante técnicas
biofísicas indica que las especies predominantes en disolución son monómeros y
dímeros en equilibrio, aunque existe una pequeña proporción de especies
mayores.
V. El ensamblaje de FtsZ, al igual que la oligomerización, es dependiente de la
concentración de Mg2+ y en concentraciones micromolares de Mg2+ es
dependiente de la concentración de proteína.
VI. El método de recubrimiento puesto a punto permite la obtención de microesferas
recubiertas homogéneamente con membrana bacteriana y permite la
reconstitución de la interacción ZipA-FtsZ en un medio biomimético.
VII. Los cambios conformacionales que sufre la proteína ZipA mediante la interacción
con FtsZ dependen del estado de asociación de la última. Estos cambios

165
estructurales se estudiaron mediante espectroscopía SERS a través de la
reconstitución de los complejos FtsZ-ZipA en la superficie de sensores plasmónicos.
VIII. Ha sido posible la detección con gran sensibilidad de la interacción del polímero de
FtsZ con los componentes del divisoma en la propia membrana interna bacteriana
mediante espectroscopía SERS. Mediante la utilización de este sistema, podríamos
detectar la interacción de nuevos fármacos antibióticos que afectaran a la
maquinaria de división o a alguno de sus componentes.

166
8.-PUBLICACIONES DURANTE
LA TESIS
1.- Characterization of self-association and heteroassociation of bacterial cell division
proteins FtsZ and ZipA in solution by composition gradient-static light scattering.
Martos A, Alfonso C, López-Navajas P, Ahijado-Guzmán R, Mingorance J, Minton
AP, Rivas G. Biochemistry. 2010 Dec 28; 49(51):10780-7.
2.- Mg2+-linked self-assembly involves the concerted formation of a narrow
distribution of oligomeric species. Begoña Monterroso, Rubén Ahijado-Guzmán,
Belén Reija, Carlos Alfonso, Silvia Zorrilla, Allen P. Minton, and Germán Rivas.
Biochemistry In press.
3.- Control by KCl of the strength of FtsZ self-assembly is nucleotide dependent.
Rubén Ahijado-Guzmán, Carlos Alfonso, Belén Reija, Jesús Mingorance, Silvia
Zorrilla, Germán Rivas, and Begoña Monterroso. Submitted to PlosONE.
4.- SERS-based detection of the interactions between the essential division FtsZ
protein and bacterial membrane elements. Rubén Ahijado-Guzmán, Germán Rivas,
Ramón A. Álvarez-Puebla, Luis M. Liz-Marzán. Submitted to SMALL.
5.- BIOPHISICAL CHARACTERIZATION OF FtsZ IN ITS GDP-BOUND STATE (GDP-FtsZ).
Regulation by Mg2+ concentration of the protein association state. Rubén Ahijado-
Guzmán, Pilar López-Navajas, Peter Schuck, Begoña Monterroso, Carlos Alfonso
and Germán Rivas. Manuscript in preparation.

167