UNIVERSAL SCREENING FOR BEHAVIOR: PENNSYLVANIA’S COLLABORATION WITH RESEARCHERS AND DISTRICT LEVEL...
66
UNIVERSAL SCREENING FOR BEHAVIOR: PENNSYLVANIA’S COLLABORATION WITH RESEARCHERS AND DISTRICT LEVEL IMPLEMENTERS’ Tina Lawson PaTTAN Kathleen Lynne Lane University of Kansas Wendy P. Oakes Arizona State University
-
Upload
linette-shauna-hancock -
Category
Documents
-
view
215 -
download
1
Transcript of UNIVERSAL SCREENING FOR BEHAVIOR: PENNSYLVANIA’S COLLABORATION WITH RESEARCHERS AND DISTRICT LEVEL...
UNIVERSAL SCREENING FOR BEHAVIOR: PENNSYLVANIA’S
COLLABORATION WITH RESEARCHERS AND
DISTRICT LEVEL IMPLEMENTERS’
Tina Lawson PaTTANKathleen Lynne LaneUniversity of Kansas
Wendy P. OakesArizona State University
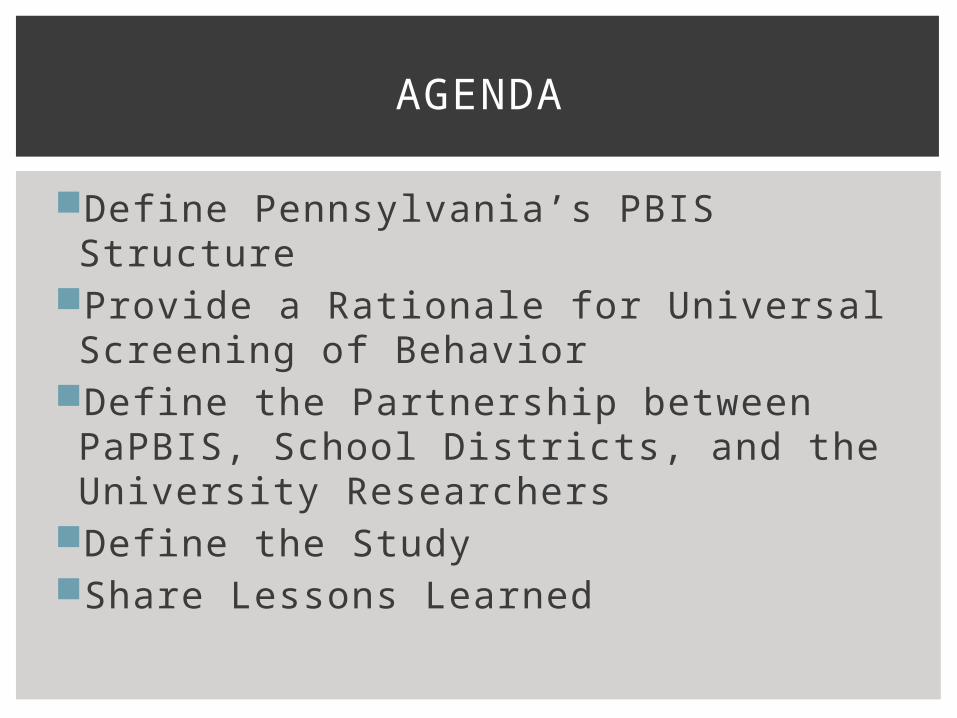
Define Pennsylvania’s PBIS StructureProvide a Rationale for Universal
Screening of BehaviorDefine the Partnership between PaPBIS,
School Districts, and the University Researchers
Define the Study Share Lessons Learned
AGENDA

PA PBIS…


PARTICIPATING SCHOOLS / LEAS
Inclusive of both cohorts, all 29 Intermediate Units (IUs) have staff participating in the PAPBS Network as facilitators,
consultants, etc.

PAPBS Network SWPBIS Sites – Cohort 1 (2007) & Cohort 2 (2009-present)


THE RATIONALE …

Lane & Oakes
PREVALENCE CONSIDERATIONS
ED … <1%
EBD … 12%

Lane & Oakes
STUDENT WITH EMOTIONAL AND BEHAVIORAL DISORDERS (EBD)
Internalizing Externalizing

Goal: Reduce HarmSpecialized Individual Systems for Students with High-Risk
Goal: Reverse Harm Specialized Group Systems for Students At-Risk
Goal: Prevent Harm School/Classroom-Wide Systems for All Students, Staff, & Settings
Academic Behavioral Social
PBIS Framework
Validated Social Skills Program
Comprehensive, Integrated, Three-Tiered Model of Prevention (Lane, Kalberg, & Menzies, 2009)

Systematic Screening
Measure Authors Ordering InformationEarly Screening Project Walker, Severson, & Feil
(1995)Available for purchase from Sopris West
Systematic Screening for Behavior Disorders (SSBD)
Walker & Severson (1992)
Available for purchase from Cambium Learning/ Sopris West
Student Risk Screening Scale (SRSS)
Drummond (1994) Free-Access
Strengths and Difficulties Questionnaire (SDQ)
Goodman (1991) Free-Access online at http://www.sdqinfo.com/
BASC-2 Behavior and Emotional Screening System (BASC-2 BESS)
Kamphaus & Reynolds (2007)
Available for purchase from Pearson/ PsychCorp
Social Skills Improvement System: Performance Screening Guide (SSiS – PSG)
Elliott & Gresham (2007) Available for purchase from Pearson/ PsychCorp

(SRSS; Drummond, 1994)
STUDENT RISK SCREENING SCALE

The SRSS is 7-item mass screener used to identify students who are at risk for antisocial behavior. This tool is appealing to schools because it takes minimal teacher time and is of no cost.
Teachers evaluate each student on the following items
- Steal - Low Academic Achievement- Lie, Cheat, Sneak - Negative Attitude- Behavior Problem - Aggressive Behavior- Peer Rejection
Each item is rated on a Likert-type scale of 0-3 Never 0 Occasionally 1 Sometimes 2 Frequently 3
Student Risk is divided into 3 categories- Low 0 – 3- Moderate 4 – 8- High 9 – 21
STUDENT RISK SCREENING SCALE
(SRSS; DRUMMOND, 1994)

STUDENT RISK SCREENING SCALE
(SRSS; DRUMMOND, 1994)

STUDENT RISK SCREENING SCALE-IETEACHER NAME
0 = Never
Steal
Lie, Cheat, Sneak
Behavior Problem
Peer Rejection
Low Academic Achievement
Negative Attitude
Aggressive Behavior
Emotionally Flat
Shy; Withdrawn
Sad; Depressed
Anxious
Obsessive-Compulsive Behavior
Lonely
Self-Inflicts Pain
1 = Occasionally
2 = Sometimes
3 = Frequently
Use the above scale to rate each item for each
student.
Student Name
(Lane, Oakes, Harris, Menzies, Cox, & Lambert, 2012)
Original SRSS-IE 1412 items retained for use at the elementary level14 items under development in middle and high schools

(SSiS- PSG; Elliott & Gresham, 2007)
SOCIAL SKILLS IMPROVEMENT SYSTEM – PERFORMANCE SCREENING GUIDE

SOCIAL SKILLS IMPROVEMENT SYSTEM – PERFORMANCE SCREENING GUIDE
(SSiS- PSG; ELLIOTT & GRESHAM, 2007)

4 items per studentPreschool Scale – 4-point Rubric Elementary Scale – 5-point Rubric
Behavioral areas assessed Prosocial Behavior Motivation to Learn Reading Skills (Early Reading Skills) Math Skills (Early Math Skills)
SSIS– PERFORMANCE SCREENING GUIDE
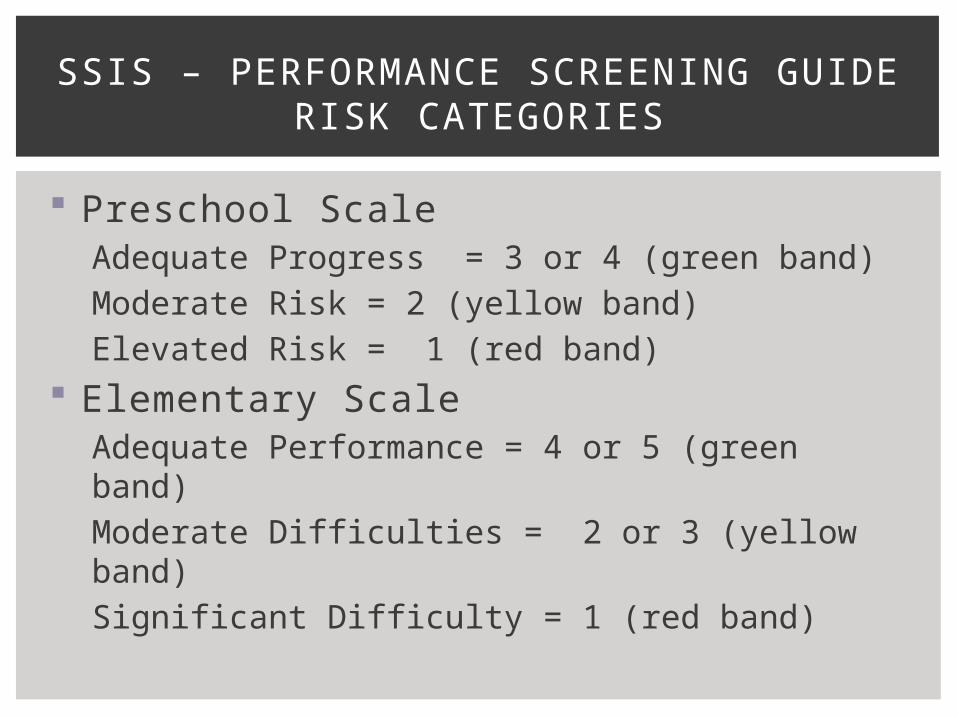
Preschool ScaleAdequate Progress = 3 or 4 (green band) Moderate Risk = 2 (yellow band)Elevated Risk = 1 (red band)
Elementary ScaleAdequate Performance = 4 or 5 (green band)Moderate Difficulties = 2 or 3 (yellow band) Significant Difficulty = 1 (red band)
SSIS – PERFORMANCE SCREENING GUIDERISK CATEGORIES
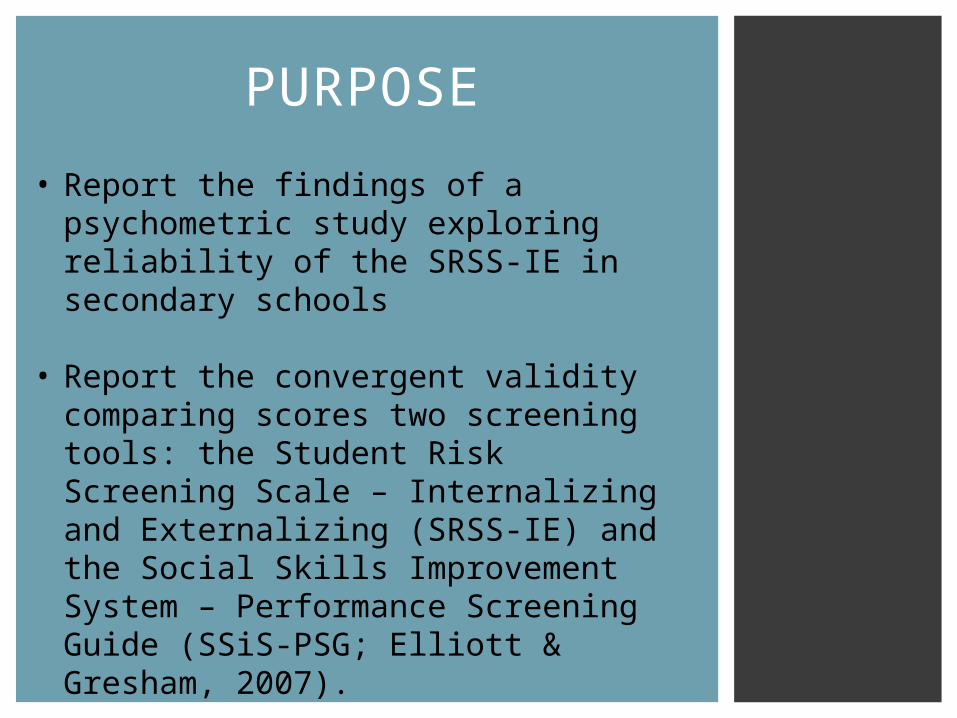
PURPOSE
• Report the findings of a psychometric study exploring reliability of the SRSS-IE in secondary schools
• Report the convergent validity comparing scores two screening tools: the Student Risk Screening Scale – Internalizing and Externalizing (SRSS-IE) and the Social Skills Improvement System – Performance Screening Guide (SSiS-PSG; Elliott & Gresham, 2007).

THE PARTNERSHIP JOURNEY …

Network SchoolsTier 1 with high fidelityAdvanced tier systems in place
Network Facilitators Eligible Districts were close to a major airport
Kathleen and Wendy were interested!!!
NATURAL NEXT STEP

THE STUDY …

METHODA Look in School
Secondary Schools

Variable/ Level Middle School High School Total
Student n = 974 n = 749 N = 1,723
Gender % (n)
Male 52.05 (507) 52.20 (391) 52.12 (898)
Female 47.95 (467) 47.80 (358) 47.88 (825)
Ethnicity % (n)
White 68.69 (669) 65.95 (494) 67.50 (1163)
Black 21.66 (211) 24.83 (186) 23.04 (397)
Hispanic 3.49 (34) 3.20 (24) 3.37 (58)
Asian 2.57 (25) 2.14 (16) 2.38 (41)
Native American 0.10 (1) 0.13 (1) 0.12 (2)
Other 0.10 (1) 0.00 (0) 0.06 (1)
Mixed races 3.39 (33) 3.74 (28) 3.54 (61)
Table 1Student and Teacher Characteristics
Note. Percentages are based on the number of participants who completed the item.

Variable/ Level Middle School High School Total
Grade level % (n)
Fifth 23.92 (233) 0.00 (0) 13.52 (233)
Sixth 27.41 (267) 0.00 (0) 15.50 (267)
Seventh 23.72 (231) 0.00 (0) 13.41 (231)
Eighth 24.95 (243) 0.00 (0) 14.10 (243)
Ninth 0.00 (0) 32.44 (243) 14.10 (243)
Tenth 0.00 (0) 31.11 (233) 13.52 (233)
Eleventh 0.00 (0) 16.02 (120) 6.96 (120)
Twelfth 0.00 (0) 20.43 (153) 8.88 (153)
Special Education % (n) 23.61 (230) 18.56 (139) 21.42 (369)
Emotional Disturbance 1.64 (16) 2.27 (17) 1.92 (33)
Table 1Student and Teacher Characteristics
Note. Percentages are based on the number of participants who completed the item.

Variable/ Level Middle School High School Total
Course Enrolled for Ratings
Physical education 0.00 (0) 7.48 (56) 3.25 (56)
Arts 0.00 (0) 4.14 (31) 1.80 (31)
Foreign language 0.00 (0) 7.48 (56) 3.25 (56)
English 40.25 (392) 22.96 (172) 32.73 (564)
Aide 0.00 (0) 0.80 (6) 0.35 (6)
Electives 0.51 (5) 5.87 (44) 2.84 (49)
Math 29.16 (284) 15.62 (117) 23.27 (401)
Science 15.09 (147) 15.75 (118) 15.38 (265)
Social Studies 14.99 (146) 19.89 (149) 17.12 (295)
Age M (SD) 12.15 (1.18) 16.00 (1.29) 13.82 (2.27)
Table 1 cont.Student and Teacher Characteristics
Note. Percentages are based on the number of participants who completed the item.

Table 1 cont.Student and Teacher Characteristics
Variable/ Level Middle School High School Total
Teacher n = 52 n = 58 N = 110
Gender % (n)
Male 30.77 (16) 49.12 (28) 40.37 (44)
Female 69.23 (36) 50.88 (29) 59.63 (65)
Ethnicity % (n)
White 94.23 (49) 94.75 (54) 94.50 (103)
Black 5.77 (3) 0.00 (0) 2.75 (3)
Hispanic 0.00 (0) 1.75 (1) 0.92 (1)
Other 0.00 (0) 3.51 (2) 1.83 (2)
Primary role % (n)
General education 80.77 (42) 92.98 (53) 87.16 (95)
Special education 19.23 (10) 7.02 (4) 12.84 (14)
Note. Percentages are based on the number of participants who completed the item.

Variable/ Level Middle School High School Total
Certified in the area currently teaching % (n)
95.92 (47) 98.25 (56) 97.17 (103)
Highest degree earned % (n)
High school diploma 0.00 (0) 1.75 (1) 0.92 (1)
Associate’s degree 1.92 (1) 1.75 (1) 1.83 (2)
Bachelor’s degree 28.85 (15) 26.32 (15) 27.52 (30)
Master’s degree 69.23 (36) 70.18 (40) 69.72 (76)
Completed course in classroom management % (n)
Yes 92.31 (48) 82.14 (46) 87.04 (94)
No 7.69 (4) 17.86 (10) 12.96 (14)
Table 1 cont.Student and Teacher Characteristics
Note. Percentages are based on the number of participants who completed the item.

Variable/ LevelMiddle School
High School Total
Professional development in academic screening % (n)
Yes 21.15 (11) 30.36 (17) 25.93 (28)
No 78.85 (41) 69.64 (39) 74.07 (80)
Professional development in behavior screening % (n)
Yes 30.77 (16) 32.14 (18) 31.48 (34)
No 69.23 (36) 67.86 (38) 68.52 (74)
Years teaching experience M (SD) 11.06 (8.93) 11.96 (8.29) 11.53 (8.57)
Years teaching experience current school M (SD)
9.38 (9.19) 11.18 (8.96) 10.33 (9.07)
Age M (SD) 33.86 (9.35) 37.79 (10.82) 35.93 (10.29)
Table 1 cont.Student and Teacher Characteristics
Note. Percentages are based on the number of participants who completed the item.
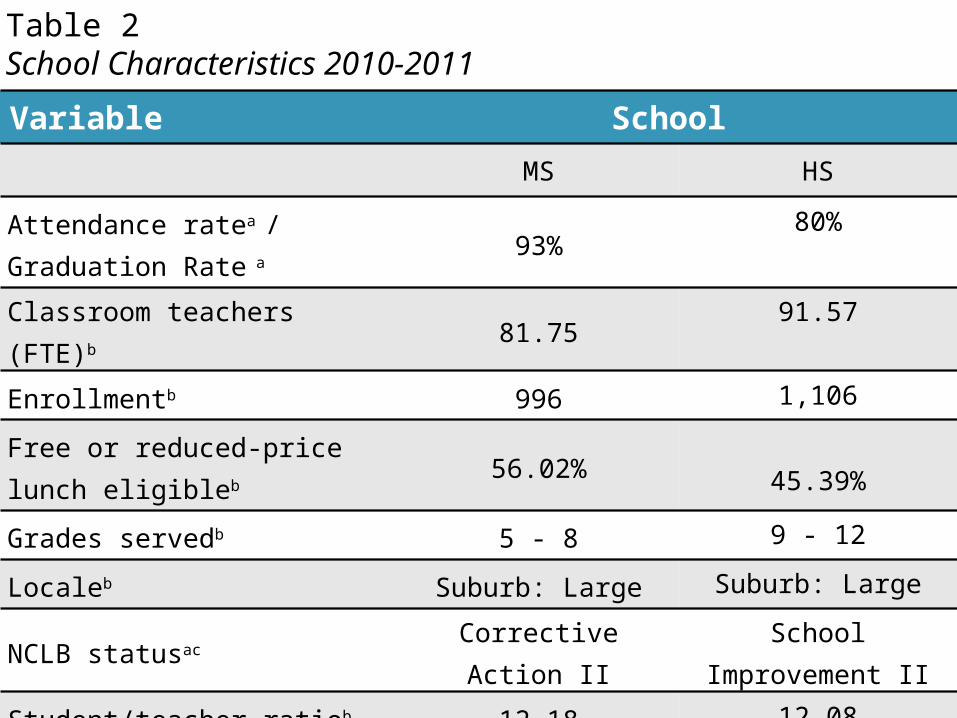
Variable School
MS HS
Attendance ratea / Graduation Rate a 93%80%
Classroom teachers (FTE)b 81.75 91.57
Enrollmentb 996 1,106
Free or reduced-price lunch eligibleb
56.02% 45.39%
Grades servedb 5 - 8 9 - 12
Localeb Suburb: Large Suburb: Large
NCLB statusac Corrective Action II School Improvement II
Student/teacher ratiob 12.18 12.08
Title 1 eligibleb Yes No
Table 2 School Characteristics 2010-2011

Consenting Meetings
Completed two measures for one class periodSRSS-IE (10-15 min)
SSIS-PSG (30 min)
Social Validity
Data entry and reliability by research assistants
PROCEDURESSTUDY 1: MIDDLE SCHOOL & HIGH
SCHOOL

METHODA Look in Elementary
Schools

Variable/ Level School A School B School C
Total
Student n=626 n=492 n=562 N=1,680
Gender % (n)
Male 52.88 (331) 49.39 (243) 52.49 (295) 51.73 (869)
Female 47.12 (295) 50.61 (249) 47.51 (267) 48.27 (811)
Ethnicity % (n)
White 79.07 (495) 54.27 (269) 76.87 (432) 71.07 (1194)
Black 9.42 (59) 30.28 (149) 5.16 (29) 14.11 (237)
Hispanic 3.67 (23) 5.69 (28) 5.87 (33) 5.00 (84)
Asian 5.75 (36) 3.05 (15) 9.07 (51) 6.07 (102)
Native American 0.16 (1) 0.00 (0) 0.00 (0) 0.06 (1)
Mixed races 1.92 (12) 6.71 (33) 3.02 (17) 3.69 (62)
Table 1Student and Teacher Characteristics

Variable/ Level School A School B School C
Total
Grade level% (n)
Kindergarten 25 13.10 (82) 13.21 (65) 14.77 (83) 13.69 (230)
First 26 14.54 (91) 17.28 (85) 12.10 (68) 14.52 (244)
Second 27 15.81 (99) 13.21 (65) 14.06 (79) 14.46 (243)
Third 28 12.14 (76) 17.07 (84) 14.77 (83) 14.46 (243)
Fourth 29 13.58 (85) 13.82 (68) 13.07 (77) 13.69 (230)
Fifth 15 17.73 (111) 11.99 (59) 16.73 (94) 15.71 (264)
Sixth 16 13.10 (82) 13.41 (66) 13.88 (78) 13.45 (226)
Special education services % (n)
9.11 (57) 8.74 (43) 6.23 (35) 8.04 (135)
Emotional Disturbance % (n)
0.00 (0) 2.44 (12) 0.00 (0) 0.71 (12)
Age M (SD) 8.19 (2.02) 7.97 (1.99) 8.15 (2.05) 8.11 (2.02)
Table 1Student and Teacher Characteristics
Variable/ Level School A School B School C
Total
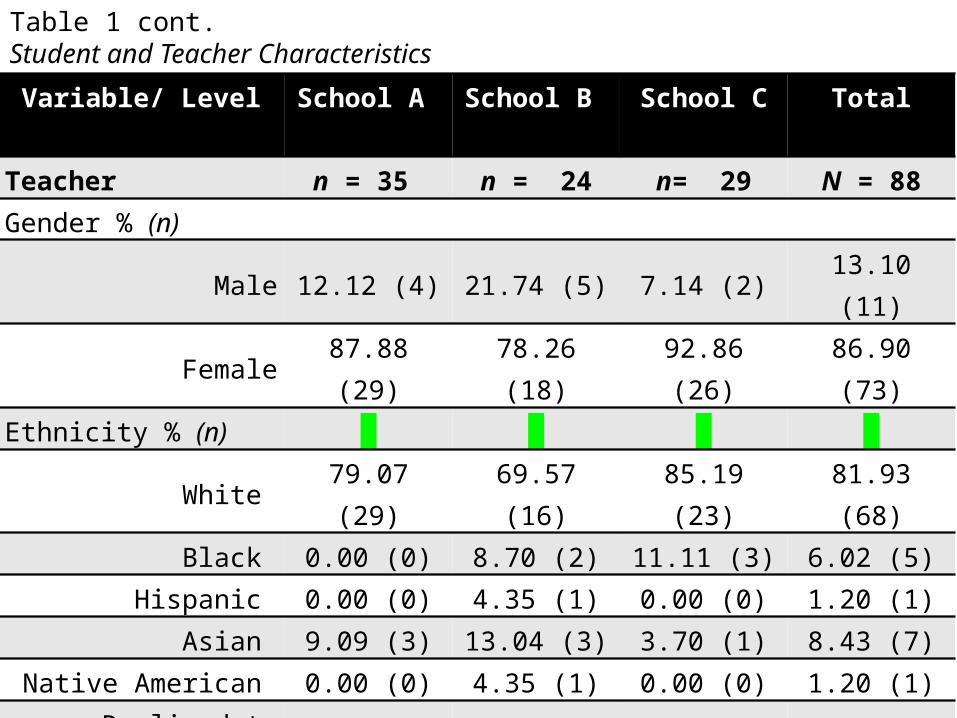
Teacher n = 35 n = 24 n= 29 N = 88
Gender % (n)
Male 12.12 (4) 21.74 (5) 7.14 (2) 13.10 (11)
Female 87.88 (29) 78.26 (18) 92.86 (26) 86.90 (73)
Ethnicity % (n)
White 79.07 (29) 69.57 (16) 85.19 (23) 81.93 (68)
Black 0.00 (0) 8.70 (2) 11.11 (3) 6.02 (5)
Hispanic 0.00 (0) 4.35 (1) 0.00 (0) 1.20 (1)
Asian 9.09 (3) 13.04 (3) 3.70 (1) 8.43 (7)
Native American 0.00 (0) 4.35 (1) 0.00 (0) 1.20 (1)
Declined to report 3.03 (1) 0.00 (0) 0.00 (0) 1.20 (1)
Primary role % (n)
General education 90.91 (30) 100.00 (23) 100.00 (28) 96.43 (81)
Special education 9.09 (3) 0.00 (0) 0.00 (0) 3.57 (3)
Table 1 cont. Student and Teacher Characteristics
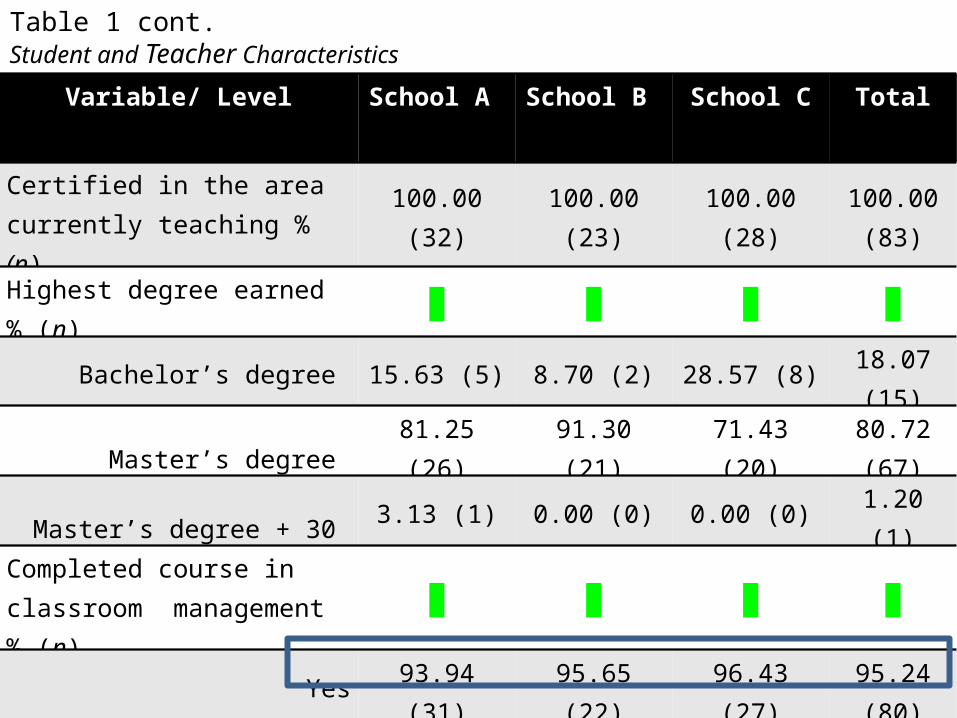
Table 1 cont. Student and Teacher Characteristics
Variable/ Level School A School B School C
Total
Certified in the area currently teaching % (n)
100.00 (32) 100.00 (23) 100.00 (28)100.00
(83)
Highest degree earned % (n)
Bachelor’s degree 15.63 (5) 8.70 (2) 28.57 (8) 18.07 (15)
Master’s degree 81.25 (26) 91.30 (21) 71.43 (20) 80.72 (67)
Master’s degree + 30 3.13 (1) 0.00 (0) 0.00 (0) 1.20 (1)
Completed course in classroom management % (n)
Yes 93.94 (31) 95.65 (22) 96.43 (27) 95.24 (80)
No 6.06 (2) 4.35 (1) 3.57 (1) 4.76 (4)
Professional development in academic screening % (n)
Yes 69.70 (23) 43.48 (10) 51.85 (14) 56.63 (47)
No 30.30 (10) 56.52 (13) 48.15 (13) 43.37 (36)

Variable/ Level School A School B School C
Total
Professional development in behavior screening % (n)
Yes 59.38 (19) 43.48 (10) 29.63 (8) 45.12 (37)
No 40.63 (13) 56.52 (13) 70.37 (19) 54.88 (45)
Years teaching experience M (SD)
14.67 (9.01) 11.13 (7.65) 14.00 (8.91) 13.48 (8.65)
Years teaching experience current school M (SD)
10.75 (7.68) 8.95 (77.51) 11.57 (8.57) 10.57 (7.96)
Age M (SD) 38.83 (12.19) 35.35 (10.43) 38.41 (10.65) 37.69 (11.16)
Note. Percentages are based on the number of participants who completed the item.
Table 1 cont. Student and Teacher Characteristics

Variable School
School An = 626
School Bn = 492
School Cn = 562
Attendance ratea 97% 96% 97%
Classroom teachers (FTE)b 43.55 35.40 37.25
Enrollmentb 621 447 540
Free or reduced-price lunch eligibleb
82 (13.20%) 106 (21.54%) 40 (7.41%)
Grades servedb K-6 K-6 K-6
Localeb Suburb: Large Suburb: Large Suburb: Large
NCLB statusac Made AYP Made AYP Made AYP
Student/teacher ratiob 14.26 12.60 14.50
Title 1 eligibleb No Yes No
Table 2 School Characteristics 2012-2013
RESULTSStudy 2: Elementary
Schools

Table 3Convergent Validity: SRSS-E7, SRSS-I5, and SRSS-IE12 with the SSiS-PSG
SSiS-PSG Scale M (SD) Correlation
Time
Fall M (SD)
Spring M (SD)
SRSS- E7
1.72 (2.74)
1.79 (3.03)
r
SRSS- I5
0.95 (1.81)
0.67 (1.71)
r
SRSS-IE12
2.67 (3.87)
2.46 (4.12)
r
Reading Skills Fall 3.77 (1.05) -0.60 -0.37 -0.60
Spring 4.01 (1.06) -0.54 -0.27 -0.51Math Skills
Fall 3.88 (1.00) -0.54 -0.37 -0.56Spring 4.06 (1.01) -0.53 -0.32 -0.52
Motivation to Learn Fall 3.92 (1.03) -0.66 -0.40 -0.66
Spring 4.20 (0.95) -0.63 -0.36 -0.61Prosocial Behavior
Fall 3.95 (0.96) -0.63 -0.42 -0.64
Spring 4.19 (0.92) -0.69 -0.41 -0.67

Table 4Test-Retest Stability: SRSS-IE and SSiS-PSG
Measure Subscale N Correlation P value
SRSS-IE
SRSS-E7 1646 0.71 < .0001
SRSS-I5 1646 0.56 < .0001
SRSS- I12 1646 0.67 < .0001
SSiS-PSG
Reading Skills 1626 0.67 < .0001
Math Skills 1626 0.64 < .0001
Motivation to Learn 1626 0.60 < .0001
Prosocial Behavior 1626 0.59 < .0001

Social Validity – ES Teacher in Fall
The greater differences appear to be related to:• SRSS-IE (a free-access screening tool) rated more favorably• Monetary resources (Cohen’s d = 1.40) as the primary concern• Easy to prepare (Cohen’s d = .73),
SSiS-PSG to be better able to • cover the critical elements of behavior that concern teachers (Item 5;
Cohen’s d = -.40), • offer teachers important information to support students (Item 6; Cohen’s d
= -.46), and • offer the school as a whole important information (Item 7; Cohen’s d =
-.46).
Total social validity scores suggest a low-magnitude favorable rating for the SRSS-IE as whole relative to the SSiS-PSG. However, time, ease, and cost were the key factors; not utility.

THE LESSONS LEARNED …

Administrative leadership both district and building level is critical
Convenience is KEY!Faculty appreciated the ability to share perspectives
through social validity surveyFaculty appreciated immediate feedback through
electronic formatParticipants needed frequent reminders of the
conceptual purpose of Universal ScreeningConsentFollow up with plans for sustainability
DISTRICT PERSPECTIVE

SUBSEQUENT INQUIRY …

SRSS-IE: SRSS-E7, SRSS-I5 Cut Scores
• Enter ‘practice’ data into that one sheet so that the total scores and conditional formatting are tested.
• Items 1-7 (The SRSS externalizing scale)0 – 3 low risk
4 – 8 moderate risk (yellow)
9 – 21 high risk (red)
• Items 8-12 (The SRSS-IE internalizing items)*preliminary cut scores for elementary only
0 – 1 low risk
2 – 3 moderate (yellow)
4 – 15 high (red)
Lane, K. L., Oakes, W. P., Swogger, E. D., Schatschneider, C., Menzies, H., M., & Sanchez, J. (in press). Student risk screening scale for internalizing and externalizing behaviors: Preliminary cut scores to support data-informed decision making. Behavioral Disorders
•
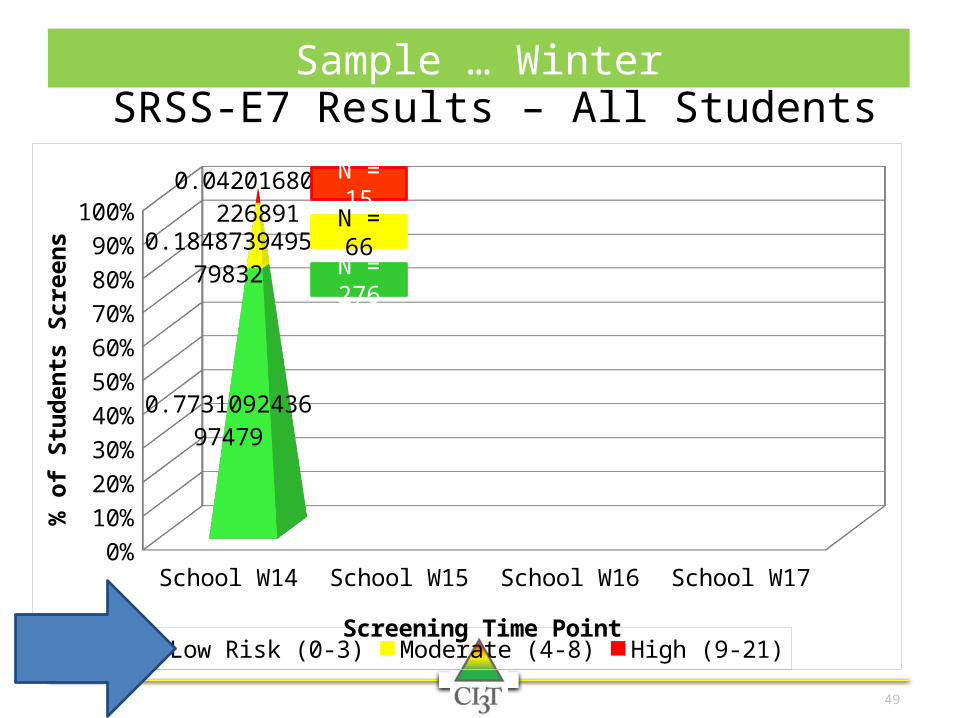
SRSS-E7 Results – All Students
School W14 School W15 School W16 School W170%
10%20%30%40%50%60%70%80%90%
100%
0.773109243697479
0.184873949579832
0.0420168067226891
Low Risk (0-3) Moderate (4-8) High (9-21)
Screening Time Point
% o
f Stu
dent
s Sc
reen
s
N = 15
N = 66
N = 276
Sample … Winter
49

SRSS-I5 Results – All StudentsSample … Winter
School W14 School W15 School W16 School W170%
10%20%30%40%50%60%70%80%90%
100%
0.789915966386555
0.134453781512605
0.0756302521008403
Low Risk (0-1) Moderate (2-3) High (4-15)
Screening Time Point
% o
f Stu
dent
s Sc
reen
s
N = 27
N = 48
N = 282
50

Pennsylvania Now…
• Established PA Process• Finalized PA materials• Trained all facilitators • Awarded 6 mini grants • Lessons Learned

DATA-BASED DECISIONS LEAD TO INTERVENTIONS…

Multi-tiered System of SupportBasic Classroom Management
Effective Instruction
Assess, Design, Implement, andEvaluate
Basic Classroom ManagementEffective Instruction
Low Intensity Strategies
Behavior Contracts Self-Monitoring
- -Functional Assessment-Based
Interventions
Schoolwide Positive Behavior Support
Low Intensity Strategies
Higher Intensity Strategies
Assessment

Essential Components of Classroom Management
• Classroom Climate• Physical Room Arrangement• Routines and Procedures• Managing Paper Work

Instructional Considerations
• How motivating is my classroom?– Control – Challenge – Curiosity – Contextualization
• Am I using a variety of instructional strategies?
• How am I differentiating instruction?

Multi-tiered System of SupportBasic Classroom Management
Effective Instruction
Assess, Design, Implement, andEvaluate
Basic Classroom ManagementEffective Instruction
Low Intensity Strategies
Behavior Contracts Self-Monitoring
- -Functional Assessment-Based
Interventions
Schoolwide Positive Behavior Support
Low Intensity Strategies
Higher Intensity Strategies
Assessment

Low-Intensity Strategies
• Active Supervision• Proximity• Pacing• Appropriate use of Praise• Opportunities to Respond• Instructive Feedback• Incorporating Choice
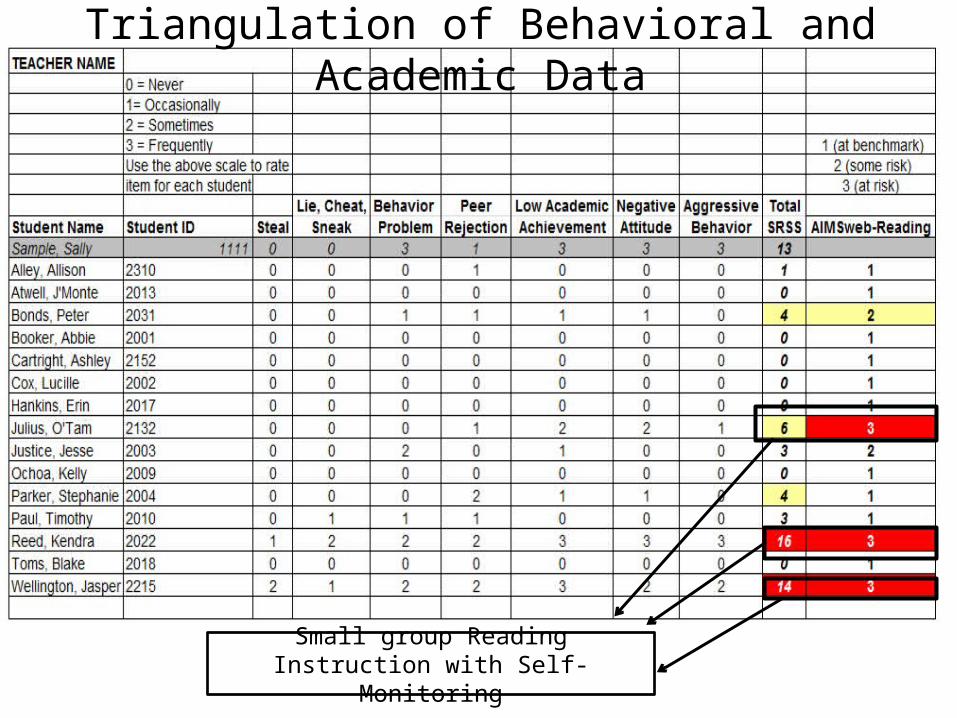
Small group Reading Instruction with Self-Monitoring
Triangulation of Behavioral and Academic Data

Sample Secondary Intervention GridSupport Description Schoolwide Data:
Entry CriteriaData to Monitor Progress:
Exit Criteria
Small group Reading instruction with Self-Monitoring
Small group reading instruction (30 min, 3 days per week). Students monitored their participation in the reading instructional tasks. Students used checklists of reading lesson components each day to complete and compare to teachers’ rating.K – 1.
Students who:Behavior:Fall SRSSat moderate (4 -8) or high (9 – 21) risk Academic:Fall AIMSweb LNF at the strategic or intensive level
AIMSweb reading PSF and NWF progress monitoring probes (weekly).
Daily self-monitoring checklists
Meet AIMSweb reading benchmark at next screening time point.Low Risk on SRSS at next screening time point.

Project ASSIST: Study Skills/ Conflict Resolution Class
Triangulation of Behavioral and Academic Data

Sample Secondary Intervention GridSupport Description Schoolwide Data:
Entry CriteriaData to Monitor
Progress:Exit Criteria
Study Skills
Content:Study skills curriculum of skills and strategies used to gain and demonstrate knowledge.Goals:Gain knowledge from a text, class discussions, and teacher-led instruction.Demonstrate knowledge on formal and informal assessments (test, quizzes, homework, presentations, and projects)Topics Include:Note-taking strategiesUse of graphic organizersOrganizationGoal settingTest taking strategiesWriting process (planning/ drafting/ editing)
Scheduling:50 min class (30 min instruction; 20 min applied practice)56 Lessons
Academic: (1) Grade Point Average (GPA) ≤ 2.7;OR(2) 1 or more Course Failures in a quarter (D or F/E) AND(3) Not participating in Read 180 reading intervention AND Behavior:(1) Student Risk Screening Scale (SRSS; Drummond, 1994) score in the Moderate (4 – 8) or High (9 – 21) Risk; OR(2) 1 or more office discipline referral (ODR) within a four month time period
Schoolwide Data:GPACourse Grades (9-weeks)SRSSODRs Proximal Measures:(1) Criterion Referenced Assessment – Acquiring Knowledge, Demonstrating Knowledge, and Conflict Resolution (Lane, 2003)(2) Knowledge of Study Skills (KSS)(3) Knowledge of Conflict Resolution Skills (KCRS)Distal Measures:(1) Study Habits Inventory (SHI; Jones & Slate, 1990)(2) ConflictTalk (Kimsey & Fuller, 2003)
Academic: (for the quarter)(1) Grade Point Average (GPA) > 2.7; OR(2) No Course Failures (D or F/E) AND Behavior:(1) SRSS screening low risk (0 – 3)OR(2) No ODRs within the quarter Students would participate in this class for one semester. If exit criteria are not meet further interventions would be considered for the following semester.
(Table 4.7; Lane, Menzies, Oakes, & Kalberg, 2012)

Multi-tiered System of SupportBasic Classroom Management
Effective Instruction
Assess, Design, Implement, andEvaluate
Basic Classroom ManagementEffective Instruction
Low Intensity Strategies
Behavior Contracts Self-Monitoring
- -Functional Assessment-Based
Interventions
Schoolwide Positive Behavior Support
Low Intensity Strategies
Higher Intensity Strategies
Assessment

Sample Secondary Intervention Grid
Support
Description Schoolwide Data: Entry
Criteria
Data to Monitor Progress
Exit Criteria
Behavior Contract
A written agreement between two parties used to specify the contingent relationship between the completion of a behavior and access to or delivery of a specific reward. Contract may involve administrator, teacher, parent, and student.
Behavior: SRSS - mod to high riskAcademic: 2 or more missing assignments with in a grading period
Work completion, or other behavior addressed in contract
Successful Completion of behavior contract
Self-monitoring
Students will monitor and record their academic production (completion/ accuracy) and on-task behavior each day.
Students who score in the abnormal range for H and CP on the SDQ; course failure or at risk on CBM
Work completion and accuracy in the academic area of concern; passing grades
Passing grade on the report card in the academic area of concern
Sample Secondary Intervention Grid

Multi-tiered System of Support
Assess, Design, Implement, andEvaluate
Basic Classroom ManagementEffective Instruction
Low Intensity Strategies
Behavior Contracts Self-Monitoring
- -Functional Assessment-Based
Interventions
Schoolwide Positive Behavior Support
Low Intensity Strategies
Higher Intensity Strategies
Assessment

Sample Tertiary Intervention GridSupport Description School-wide Data:
Entry CriteriaData to Monitor
Progress Exit Criteria
Functional Assessment-Based Intervention
Individualized interventions developed by the behavior specialist and PBS team
Students who:Behaviorscored in the high risk category on the Student Risk Screening Scale (SRSS), or scored in the clinical range on one following Strengths and Difficulties (SDQ) subscales: Emotional Symptoms, Conduct Problems, Hyperactivity, or Prosocial Behavior, earned more than 5 office discipline referrals (ODR) for major events during a grading period or Academicidentified at highest risk for school failure: recommended for retention; or scored far below basic on state-wide or district-wide assessments
Data will be collected on both the (a) target (problem) behavior and (b) replacement (desirable) behavior identified by the team on an on-going basis.
Weekly teacher report on academic status
ODR data collected weekly
The function-based intervention will be faded once a functional relation is demonstrated using a validated single case methodology design (e.g., withdrawal design) and the behavioral objectives specified in the plan are met.

MTSS: CI3T II Professional Learning 66
Thank you!