
UNITED STATES SECURITIES AND EXCHANGE · PDF fileC:\Documents and Settings\KMCDADE\Local...
26
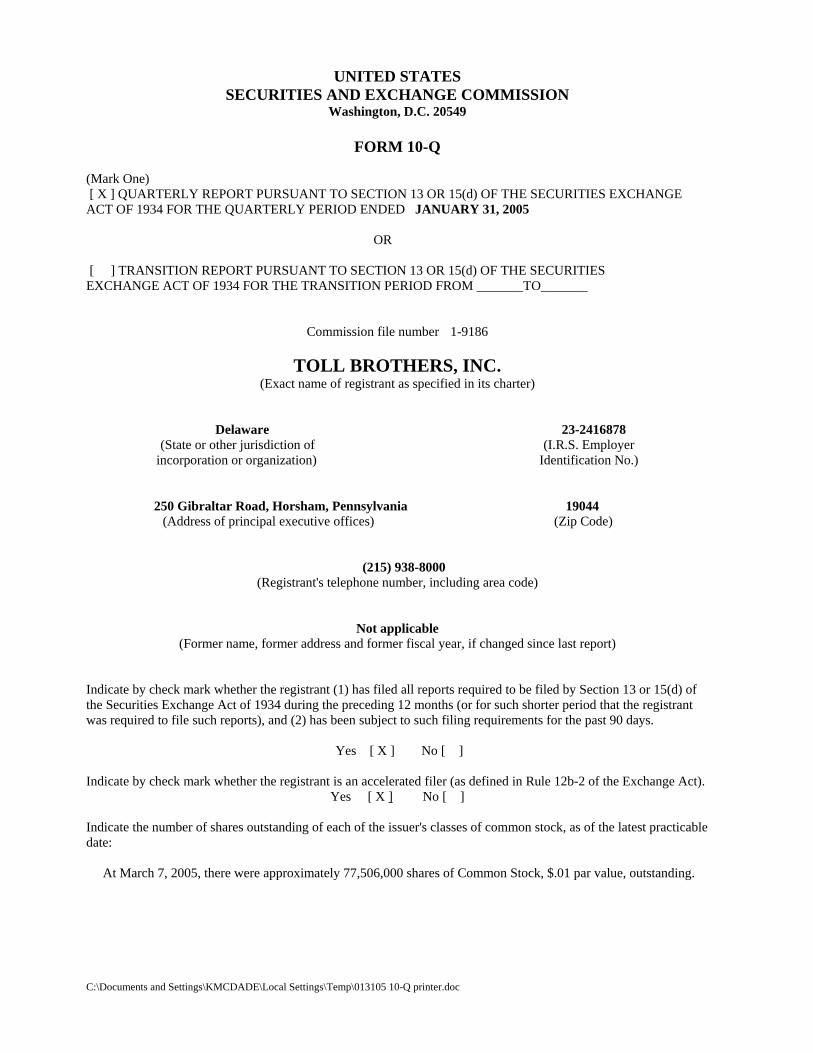
C:\Documents and Settings\KMCDADE\Local Settings\Temp\013105 10-Q printer.doc UNITED STATES SECURITIES AND EXCHANGE COMMISSION Washington, D.C. 20549 FORM 10-Q (Mark One) [ X ] QUARTERLY REPORT PURSUANT TO SECTION 13 OR 15(d) OF THE SECURITIES EXCHANGE ACT OF 1934 FOR THE QUARTERLY PERIOD ENDED JANUARY 31, 2005 OR [ ] TRANSITION REPORT PURSUANT TO SECTION 13 OR 15(d) OF THE SECURITIES EXCHANGE ACT OF 1934 FOR THE TRANSITION PERIOD FROM _______TO_______ Commission file number 1-9186 TOLL BROTHERS, INC. (Exact name of registrant as specified in its charter) Delaware 23-2416878 (State or other jurisdiction of (I.R.S. Employer incorporation or organization) Identification No.) 250 Gibraltar Road, Horsham, Pennsylvania 19044 (Address of principal executive offices) (Zip Code) (215) 938-8000 (Registrant's telephone number, including area code) Not applicable (Former name, former address and former fiscal year, if changed since last report) Indicate by check mark whether the registrant (1) has filed all reports required to be filed by Section 13 or 15(d) of the Securities Exchange Act of 1934 during the preceding 12 months (or for such shorter period that the registrant was required to file such reports), and (2) has been subject to such filing requirements for the past 90 days. Yes [ X ] No [ ] Indicate by check mark whether the registrant is an accelerated filer (as defined in Rule 12b-2 of the Exchange Act). Yes [ X ] No [ ] Indicate the number of shares outstanding of each of the issuer's classes of common stock, as of the latest practicable date: At March 7, 2005, there were approximately 77,506,000 shares of Common Stock, $.01 par value, outstanding.
Transcript of UNITED STATES SECURITIES AND EXCHANGE · PDF fileC:\Documents and Settings\KMCDADE\Local...
C:\Documents and Settings\KMCDADE\Local Settings\Temp\013105 10-Q printer.doc
UNITED STATES SECURITIES AND EXCHANGE COMMISSION
Washington, D.C. 20549
FORM 10-Q (Mark One) [ X ] QUARTERLY REPORT PURSUANT TO SECTION 13 OR 15(d) OF THE SECURITIES EXCHANGE ACT OF 1934 FOR THE QUARTERLY PERIOD ENDED JANUARY 31, 2005
OR [ ] TRANSITION REPORT PURSUANT TO SECTION 13 OR 15(d) OF THE SECURITIES EXCHANGE ACT OF 1934 FOR THE TRANSITION PERIOD FROM _______TO_______
Commission file number 1-9186
TOLL BROTHERS, INC. (Exact name of registrant as specified in its charter)
Delaware 23-2416878 (State or other jurisdiction of (I.R.S. Employer
incorporation or organization) Identification No.)
250 Gibraltar Road, Horsham, Pennsylvania 19044 (Address of principal executive offices) (Zip Code)
(215) 938-8000 (Registrant's telephone number, including area code)
Not applicable (Former name, former address and former fiscal year, if changed since last report)
Indicate by check mark whether the registrant (1) has filed all reports required to be filed by Section 13 or 15(d) of the Securities Exchange Act of 1934 during the preceding 12 months (or for such shorter period that the registrant was required to file such reports), and (2) has been subject to such filing requirements for the past 90 days. Yes [ X ] No [ ] Indicate by check mark whether the registrant is an accelerated filer (as defined in Rule 12b-2 of the Exchange Act).
Yes [ X ] No [ ] Indicate the number of shares outstanding of each of the issuer's classes of common stock, as of the latest practicable date: At March 7, 2005, there were approximately 77,506,000 shares of Common Stock, $.01 par value, outstanding.
C:\Documents and Settings\KMCDADE\Local Settings\Temp\013105 10-Q printer.doc 3/14/2005 9:38 AM
TOLL BROTHERS, INC. AND SUBSIDIARIES TABLE OF CONTENTS
Page No. Statement on Forward-Looking Information 1 PART I. Financial Information ITEM 1. Financial Statements Condensed Consolidated Balance Sheets at January 31, 2005 (Unaudited)
and October 31, 2004 2
Condensed Consolidated Statements of Income (Unaudited) For the Three Months Ended January 31, 2005 and 2004 3
Condensed Consolidated Statements of Cash Flows (Unaudited) For the Three Months Ended January 31, 2005 and 2004 4 Notes to Condensed Consolidated Financial Statements (Unaudited) 5
ITEM 2. Management's Discussion and Analysis of Financial Condition and Results of Operations 16
ITEM 3. Quantitative and Qualitative Disclosures About Market Risk 22
ITEM 4. Controls and Procedures 23
PART II. Other Information Item 1. Legal Proceedings 23
Item 2. Unregistered Sales of Equity Securities and Use of Proceeds 23
Item 3. Defaults upon Senior Securities 24
Item 4. Submission of Matters to a Vote of Security Holders 24
Item 5. Other Information 24
Item 6. Exhibits 24 SIGNATURES 24
C:\Documents and Settings\KMCDADE\Local Settings\Temp\013105 10-Q printer.doc
STATEMENT ON FORWARD-LOOKING INFORMATION Certain information included herein and in our other reports, SEC filings, statements and presentations is forward-looking within the meaning of the Private Securities Litigation Reform Act of 1995, including, but not limited to, statements concerning our anticipated operating results, financial resources, changes in revenues, changes in profitability, anticipated income to be realized from our investments in unconsolidated entities, interest expense, growth and expansion, ability to acquire land, ability to sell homes and properties, ability to deliver homes from backlog, ability to gain approvals and to open new communities, ability to secure materials and subcontractors, average delivered prices of homes, ability to maintain the liquidity and capital necessary to expand and take advantage of future opportunities and stock market valuations. In some cases you can identify those so called forward-looking statements by words such as "may," “will,” "should," "expect," "plan," "anticipate," "believe," "estimate," "predict," "potential," "project," "intend," "can," "could," "might," or "continue" or the negative of those words or other comparable words. Such forward-looking information involves important risks and uncertainties that could significantly affect actual results and cause them to differ materially from expectations expressed herein and in our other reports, SEC filings, statements and presentations. These risks and uncertainties include local, regional and national economic and political conditions, the consequences of any future terrorist attacks such as those that occurred on September 11, 2001, the effects of governmental regulation, the competitive environment in which we operate, fluctuations in interest rates, changes in home prices, the availability and cost of land for future growth, the availability of capital, fluctuations in capital and securities markets, the availability and cost of labor and materials, and weather conditions. Additional information concerning potential factors that we believe could cause our actual results to differ materially from expected and historical results is included under the caption "Factors That May Affect Our Future Results" in Item 1 of our Annual Report on Form 10-K for the fiscal year ended October 31, 2004. If one or more of the assumptions underlying our forward-looking statements proves incorrect, then our actual results, performance or achievements could differ materially from those expressed in, or implied by the forward-looking statements contained in this report. Therefore, we caution you not to place undue reliance on our forward-looking statements. This statement is provided as permitted by the Private Securities Litigation Reform Act of 1995. When this report uses the words "we," "us," and "our," they refer to Toll Brothers, Inc. and its subsidiaries, unless the context otherwise requires. Reference herein to “fiscal 2006,” “fiscal 2005,” and “fiscal 2004,” refer to our fiscal year ending October 31, 2006 and October 31, 2005 and our fiscal year ended October 31, 2004.
1
2
PART I. FINANCIAL INFORMATION
ITEM 1. FINANCIAL STATEMENTS
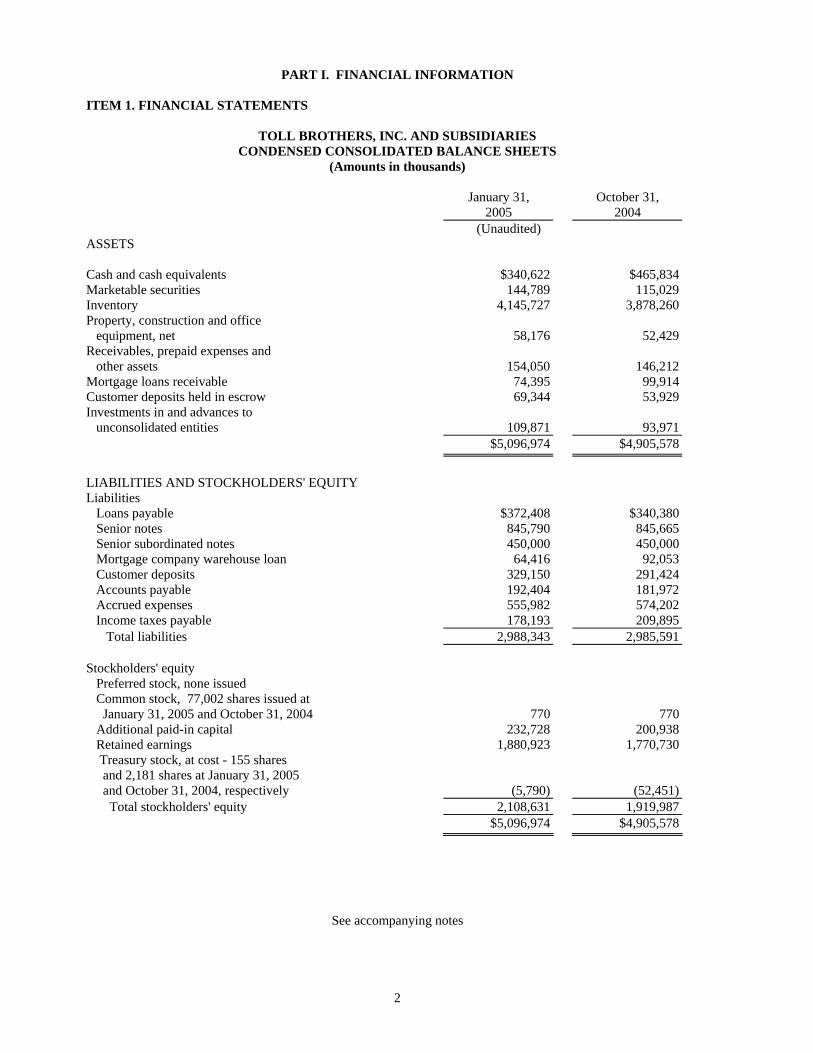
TOLL BROTHERS, INC. AND SUBSIDIARIES CONDENSED CONSOLIDATED BALANCE SHEETS
(Amounts in thousands) January 31, October 31, 2005 2004 (Unaudited) ASSETS Cash and cash equivalents $340,622 $465,834 Marketable securities 144,789 115,029Inventory 4,145,727 3,878,260 Property, construction and office equipment, net 58,176 52,429 Receivables, prepaid expenses and other assets 154,050 146,212 Mortgage loans receivable 74,395 99,914 Customer deposits held in escrow 69,344 53,929 Investments in and advances to unconsolidated entities 109,871 93,971 $5,096,974 $4,905,578 LIABILITIES AND STOCKHOLDERS' EQUITY Liabilities Loans payable $372,408 $340,380 Senior notes 845,790 845,665 Senior subordinated notes 450,000 450,000 Mortgage company warehouse loan 64,416 92,053 Customer deposits 329,150 291,424 Accounts payable 192,404 181,972 Accrued expenses 555,982 574,202 Income taxes payable 178,193 209,895 Total liabilities 2,988,343 2,985,591 Stockholders' equity Preferred stock, none issued Common stock, 77,002 shares issued at January 31, 2005 and October 31, 2004 770 770 Additional paid-in capital 232,728 200,938 Retained earnings 1,880,923 1,770,730 Treasury stock, at cost - 155 shares and 2,181 shares at January 31, 2005 and October 31, 2004, respectively (5,790) (52,451) Total stockholders' equity 2,108,631 1,919,987 $5,096,974 $4,905,578
See accompanying notes
3
TOLL BROTHERS, INC. AND SUBSIDIARIES
CONDENSED CONSOLIDATED STATEMENTS OF INCOME (Amounts in thousands, except per share data)
(Unaudited) Three months ended January 31, 2005 2004 Revenues: Home sales $989,097 $589,577 Land sales 1,225 5,987 Equity earnings in unconsolidated entities 1,935 665 Interest and other 6,883 1,683 999,140 597,912 Costs and expenses: Home sales 685,493 422,428 Land sales 779 5,303 Selling, general and administrative 107,065 76,653 Interest 21,812 14,558 815,149 518,942 Income before income taxes 183,991 78,970 Income taxes 73,798 28,886 Net income $110,193 $50,084
Earnings per share: Basic $1.45 $0.68
Diluted $1.33 $0.62
Weighted average number of shares: Basic 75,826 73,839 Diluted 83,042 80,819
See accompanying notes
4
TOLL BROTHERS, INC. AND SUBSIDIARIES
CONDENSED CONSOLIDATED STATEMENTS OF CASH FLOWS (Amounts in thousands)
(Unaudited) Three Months ended January 31, 2005 2004 Cash flow from operating activities: Net income $110,193 $50,084 Adjustments to reconcile net income to net cash used in operating activities: Depreciation and amortization 4,251 3,563 Amortization of initial benefit obligation 950 Equity earnings in unconsolidated entities (1,935) (665) Deferred tax provision 15,366 1,436 Provision for inventory write-offs 2,343 897 Changes in operating assets and liabilities Increase in inventory (222,058) (191,038) Origination of mortgage loans (181,558) (114,319) Sale of mortgage loans 207,077 127,143 Increase in receivables, prepaid expenses and other assets (7,626) (6,702) Increase in customer deposits 22,311 17,966 Increase (decrease) in accounts payable and accrued expenses 20,708 (4,337) Decrease in current income taxes payable (14,568) (11,526) Net cash used in operating activities (44,546) (127,498) Cash flow from investing activities: Purchase of property and equipment, net (9,137) (3,829) Purchase of marketable securities (1,039,017) (459,249 Sale of marketable securities 1,009,257 518,950 Investments in and advances to unconsolidated entities (16,214) (27,616) Distributions from unconsolidated entities 2,250 2,450 Net cash used in investing activities (52,861) 30,706 Cash flow from financing activities: Proceeds from loans payable 246,167 172,259 Principal payments of loans payable (289,528) (192,639) Proceeds from stock based benefit plans 15,776 6,095 Purchase of treasury stock (220) (8,850) Net cash used in financing activities (27,805) (23,135) Net decrease in cash and cash equivalents (125,212) (119,927) Cash and cash equivalents, beginning of period 465,834 234,506 Cash and cash equivalents, end of period $340,622 $114,579
See accompanying notes
5
TOLL BROTHERS, INC. AND SUBSIDIARIES NOTES TO CONDENSED CONSOLIDATED FINANCIAL STATEMENTS
(Unaudited) 1. Basis of Presentation The accompanying unaudited condensed consolidated financial statements have been prepared in accordance with the rules and regulations of the Securities and Exchange Commission (“SEC”) for interim financial information. The October 31, 2004 balance sheet amounts and disclosures included herein have been derived from our October 31, 2004 audited financial statements. Since the accompanying condensed consolidated financial statements do not include all the information and footnotes required by U.S. generally accepted accounting principles for complete financial statements, we suggest that they be read in conjunction with the financial statements and notes thereto included in our October 31, 2004 Annual Report on Form 10-K. In the opinion of management, the accompanying unaudited condensed consolidated financial statements include all adjustments, which are of a normal recurring nature, necessary to present fairly our financial position as of January 31, 2005, the results of our operations for the three months ended January 31, 2005 and 2004 and our cash flows for the three months ended January 31, 2005 and 2004. The results of operations for such interim periods are not necessarily indicative of the results to be expected for the full year. On December 16, 2004, the Financial Accounting Standards Board ("FASB") issued Statement of Financial Accounting Standards (“SFAS”) No. 123 (revised 2004), “Share-Based Payment” (“SFAS 123R”), effective for periods beginning after June 15, 2005. SFAS 123R requires that all stock-based compensation be treated as a cost that is reflected in the financial statements. Under the provisions of SFAS 123R, the Company has the choice of adopting the fair-value-based method of expensing of stock options using (a) the “modified prospective method” whereby the Company recognizes the expense only for periods beginning after June 15, 2005, or (b) the “modified retrospective method” whereby the Company recognizes the expense for all years and interim periods since the effective date of SFAS 123 or for only those interim periods of the year of initial adoption of SFAS 123R. The Company has not yet determined which method it will adopt. The Company is required to adopt the new standard for its fiscal period beginning August 1, 2005. See Note 8, “Stock Based Benefit Plans”, for pro forma information regarding the Company’s expensing of stock options for the three-month periods ended January 31, 2005 and 2004. Auction rate securities in the amount of $115.0 million have been reclassified from cash and cash equivalents to marketable securities in the October 31, 2004 balance sheet to conform with the fiscal 2005 financial statement presentation. 2. Inventory Inventory consisted of the following (amounts in thousands): January 31, October 31, 2005 2004 Land and land development costs $1,171,148 $1,242,417 Construction in progress 2,488,498 2,178,112 Sample homes and sales offices 210,319 208,416 Land deposits and costs of future development 263,338 237,353 Other 12,424 11,962 $4,145,727 $3,878,260
Construction in progress includes the cost of homes under construction, land and land development costs and the carrying costs of lots that have been substantially improved.
6
The Company capitalizes certain interest costs to inventory during the development and construction period. Capitalized interest is charged to interest expense when the related inventory is delivered. Interest incurred, capitalized and expensed for the three-month periods ended January 31, 2005 and 2004 is summarized as follows (amounts in thousands): 2005 2004 Interest capitalized, beginning of period $173,442 $154,314 Interest incurred 29,150 28,240 Interest expensed (21,812) (14,558) Write-off to cost and expenses (107) (168) Interest capitalized, end of period $180,673 $167,828
3. Investments in and Advances to Unconsolidated Entities The Company has investments in and advances to several joint ventures with unrelated parties to develop land. Some of these joint ventures develop land for the sole use of the venture partners, including the Company, and others develop land for sale to the venture partners and to unrelated builders. The Company recognizes its share of earnings from the sale of home sites to other builders. The Company does not recognize earnings from home sites it purchases from the joint ventures, but instead reduces its cost basis in these home sites by its share of the earnings on the home sites. At January 31, 2005, the Company had approximately $58.3 million invested in or advanced to these joint ventures and was committed to contributing additional capital in an aggregate amount of approximately $20.6 million if the joint ventures require it. At January 31, 2005, one of the joint ventures had obtained third-party financing of $535 million of which the Company had guaranteed its pro-rata share of approximately $53.6 million. In February 2005, one of the joint ventures was the successful bidder on a large tract of land in Las Vegas, Nevada. The Company estimates that its proportionate share of the land purchase cost and general site improvements will be approximately $109.1 million of which approximately $15.6 million was included in the $58.3 million of investments in and advances to unconsolidated entities at January 31, 2005. In January 2004, the Company entered into a joint venture in which it has a 50% interest with an unrelated party to develop Maxwell Place, an approximately 830-home luxury condominium community on the Hoboken, New Jersey waterfront. At January 31, 2005, the Company had investments in and advances to the joint venture of $29.2 million and was committed to making up to $1.0 million of additional investments in and advances to it. The Company and its joint venture partner each have guaranteed $7.5 million of principal amount of one of the loans obtained by this joint venture. The Company expects that the joint venture will obtain third-party financing for the construction of this project and that the Company and other joint venture partner will be required to guarantee a portion of the loan. In October 2004, the Company entered into a joint venture in which it has a 50% interest with an unrelated party to convert a 525-unit apartment complex, The Hudson Tea Buildings, located in Hoboken, New Jersey, into luxury condominium units. At January 31, 2005, the Company had investments in and advances to the joint venture of $7.5 million, and was committed to making up to $1.5 million of additional investments in and advances to it. The Company has a minority interest in a joint venture with unrelated parties that has developed and is currently marketing The Sky Club, a 326-unit, 17-story, two-tower structure, located in Hoboken, New Jersey. At January 31, 2005, the Company’s investment in this joint venture was $8.0 million. The Company does not have any commitment to contribute additional capital to this joint venture. To take advantage of commercial real estate opportunities, the Company formed Toll Brothers Realty Trust Group (the "Trust") in 1998. The Trust is effectively owned one-third by the Company, one-third by Robert I. Toll, Bruce E. Toll (and members of his family), Zvi Barzilay (and members of his family), Joel H. Rassman and other members of the Company’s senior management, and one-third by the Pennsylvania State Employees Retirement System (collectively, the "Shareholders"). In addition, the Shareholders entered into subscription agreements whereby each group has agreed to invest additional capital in an amount not to exceed $9.3 million if required by the Trust. The subscription agreements expire in August 2005. At January 31, 2005, the Company had an investment of $6.0 million in the Trust. This investment is accounted for on the equity method. The Company provides development, finance and management services to the Trust and received fees under the terms of various agreements in the amount of $.4 million in each of the three-month periods ended January 31, 2005 and 2004. The Company believes that the transactions between itself and the Trust were on terms no less favorable than it would have agreed to with unrelated parties.
7
4. Accrued Expenses Accrued expenses at January 31, 2005 and October 31, 2004 consisted of the following (amounts in thousands):
January 31, October 31, 2005 2004 Land, land development and construction costs $227,039 $229,045 Compensation and employee benefit costs 69,598 89,865 Warranty costs 43,479 42,133 Other 215,866 213,159 $555,982 $574,202 5. Warranty Costs The Company accrues for the expected warranty costs at the time each home is closed and title and possession have been transferred to the home buyer. Costs are accrued based upon historical experience. Changes in the warranty accrual for the three-month periods ended January 31, 2005 and 2004 are as follows (amounts in thousands): 2005 2004 Balance, beginning of period $42,133 $33,752 Additions 6,682 3,885 Charges incurred (5,336) (3,610) Balance, end of period $43,479 $34,027 6. Employee Retirement Plan In October 2004, the Company established an unfunded defined benefit retirement plan (the “Retirement Plan”) effective as of September 1, 2004. For the three-month period ended January 31, 2005, the Company recognized the following costs related to this plan (amounts in thousands): Service cost $ 78 Interest cost 194 Amortization of initial benefit obligation 950 $1,222 The Company used a 5.69% discount rate in its calculation of the present value of its projected benefit obligation. 7. Income Taxes The Company's estimated combined federal and state income tax rate before providing for the effect of permanent book-tax differences ("Base Rate") was 38.5% in 2005 and 37.0% in 2004. The increase in the Base Rate was due to an increase in the Company’s estimated effective state income tax rate. The increase in the estimated effective state income tax rate was due to a combination of an expected shift in income to states with higher tax rates and changes in state income tax regulations. The effective tax rates for the three-month periods ended January 31, 2005 and 2004 were 40.1% and 36.6%, respectively. For the three-month period ended January 31, 2005, the primary difference between the Company's Base Rate and effective tax rate was the effect of an adjustment due to the recomputation of the Company’s net deferred tax liability of approximately $3.7 million resulting from the change in the Company’s Base Rate from 37.0% at October 31, 2004 to 38.5% at January 31, 2005 offset, in part, by tax-free income. For the three-month period ended January 31, 2004, the primary difference between the Company's Base Rate and effective tax rate was the effect of tax-free income.
8
8. Stock Based Benefit Plans SFAS No. 123, "Accounting for Stock-Based Compensation," as amended by SFAS No. 148 (“SFAS 123”), requires the disclosure of the estimated value of employee option grants and their impact on net income. SFAS 123 (revised 2004) “Share-Based Payment” (“SFAS 123R”), requires the estimated value of employee option grants to be recorded as an expense. SFAS 123 requires the use of option pricing models that are designed to estimate the value of options that, unlike employee stock options, can be traded at any time and are transferable. In addition to restrictions on trading, employee stock options may include other restrictions such as vesting periods and periods of time when they cannot be exercised. Further, such models require the input of highly subjective assumptions, including the expected volatility of the stock price. Therefore, in management's opinion, the existing models do not provide a reliable single measure of the value of employee stock options. For fiscal 2004, the fair value of options granted was estimated using the Black-Scholes option pricing model. In order to better value option grants as required by SFAS 123R, the Company has developed a lattice model which it believes better reflects the establishment of the fair value of option grants. The Company has used the lattice model for the fiscal 2005 valuation. The weighted-average assumptions used for stock option grants in the three-month periods ended January 31, 2005 and 2004 were approximately as follows: 2005 2004 Risk-free interest rate 3.64% 3.73%Expected life (years) 5.70 6.99 Volatility 31.31% 42.97%Dividends none none Net income and net income per share as reported in these condensed consolidated financial statements and on a pro forma basis, as if the fair-value-based method described in SFAS 123R and SFAS 123 had been adopted, for the three-month periods ended January 31, 2005 and 2004 were as follows (amounts in thousands, except per share amounts): 2005 2004 Net income As reported $110,193 $50,084 Pro forma $106,021 $46,390 Basic net income per share As reported $1.45 $0.68 Pro forma $1.40 $0.63 Diluted net income per share As reported $1.33 $0.62 Pro forma $1.28 $0.57 Weighted-average grant date fair value per share of options granted $23.34 $19.47 9. Earnings per Share Information Information pertaining to the calculation of earnings per share for the three-month periods ended January 31, 2005 and 2004 are as follows (amounts in thousands): 2005 2004 Basic weighted average shares 75,826 73,839 Common stock equivalents 7,216 6,980 Diluted weighted average shares 83,042 80,819
9
10. Stock Repurchase Program In March 2003, the Company's Board of Directors authorized the repurchase of up to 10 million shares of its Common Stock, par value $.01, from time to time, in open market transactions or otherwise, for the purpose of providing shares for its various employee benefit plans. At January 31, 2005, the number of shares that the Company was authorized to repurchase was approximately 9.3 million shares. 11. Commitments and Contingencies At January 31, 2005, the Company had agreements to purchase land for future development with an aggregate purchase price of approximately $2.54 billion, including approximately $157.4 million of land from unconsolidated entities which the Company has investments in, advances to and loan guarantees on behalf of (See Note 3. “Investments in and Advances to Unconsolidated Entities” for more information regarding these entities). The Company has paid or deposited $159.4 million on these purchase agreements. Purchase of the properties is generally contingent upon satisfaction of certain requirements by us and the sellers. At January 31, 2005, we had outstanding surety bonds amounting to approximately $653.2 million related primarily to our obligations to various governmental entities to construct improvements in our various communities. We estimate that approximately $241.0 million of work remains to be performed on these improvements. We have an additional $86.2 million of surety bonds outstanding which guarantee other of our obligations. We do not believe that any outstanding bonds will be drawn upon. At January 31, 2005, we had agreements of sale outstanding to deliver 7,292 homes with an aggregate sales value of approximately $4.89 billion. At January 31, 2005, we were committed to provide approximately $521.7 million of mortgage loans to our home buyers and to others. All loans with committed interest rates are covered by take-out commitments from third-party lenders, which minimizes our interest rate risk. We also arrange a variety of mortgage programs that are offered to our home buyers through outside mortgage lenders. We have a $1.18 billion unsecured revolving credit facility with 29 banks that extends to July 15, 2009. At January 31, 2005, interest was payable on borrowings under the facility at 0.625%, subject to adjustment based upon our debt rating and leverage ratios, above the Eurodollar rate or at other specified variable rates as selected by us from time to time. At January 31, 2005, we had no outstanding borrowings against the facility and approximately $169.3 million of letters of credit outstanding under it. Under the terms of the revolving credit agreement, we are not permitted to allow our maximum leverage ratio, as defined in the agreement, to exceed 2.00 to 1.00 and, at January 31, 2005, we were required to maintain a minimum tangible net worth, as defined in the agreement, of approximately $1.36 billion. At January 31, 2005, our leverage ratio was approximately .63 to 1.00 and our tangible net worth was approximately $2.07 billion. Based upon the minimum tangible net worth requirement of the revolving credit facility, our ability to pay dividends and repurchase our common stock was limited to approximately $713.4 million at January 31, 2005. We have an unsecured term loan of $222.5 million from 11 banks at a weighted-average interest rate of 7.18% repayable in July 2005. Under the terms of the term loan agreement, we are not permitted to allow our maximum leverage ratio, as defined in the agreement, to exceed 2.25 to 1.00 and, at January 31, 2005, we were required to maintain a minimum tangible net worth, as defined in the agreement, of approximately $1.04 billion. At January 31, 2005, our leverage ratio was approximately .65 to 1.00 and our tangible net worth was approximately $2.08 billion. Based upon the minimum tangible net worth requirement of the term loan, our ability to pay dividends and repurchase our common stock was limited to approximately $1.04 billion at January 31, 2005. We are involved in various claims and litigation arising in the ordinary course of business. We believe that the disposition of these matters will not have a material effect on our business or on our financial condition.
10
12. Supplemental Disclosure to Statements of Cash Flows The following are supplemental disclosures to the statements of cash flows for the three months ended January 31, 2005 and 2004 (amounts in thousands): 2005 2004 Cash flow information: Interest paid, net of amount capitalized $16,092 $14,556
Income taxes paid $73,000 $38,984
Non-cash activity: Cost of inventory acquired through seller financing $47,752 $5,816
Income tax benefit related to exercise of employee stock options $32,500 $4,952
Stock bonus awards $30,396 $20,288
11
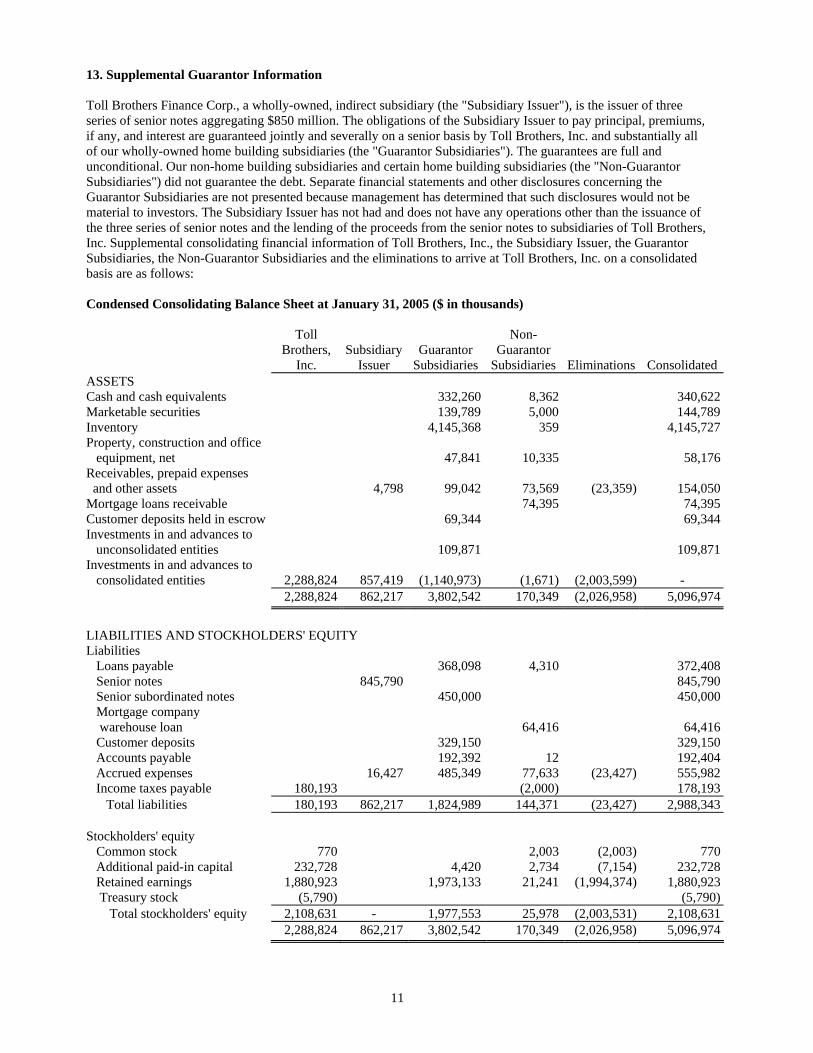
13. Supplemental Guarantor Information Toll Brothers Finance Corp., a wholly-owned, indirect subsidiary (the "Subsidiary Issuer"), is the issuer of three series of senior notes aggregating $850 million. The obligations of the Subsidiary Issuer to pay principal, premiums, if any, and interest are guaranteed jointly and severally on a senior basis by Toll Brothers, Inc. and substantially all of our wholly-owned home building subsidiaries (the "Guarantor Subsidiaries"). The guarantees are full and unconditional. Our non-home building subsidiaries and certain home building subsidiaries (the "Non-Guarantor Subsidiaries") did not guarantee the debt. Separate financial statements and other disclosures concerning the Guarantor Subsidiaries are not presented because management has determined that such disclosures would not be material to investors. The Subsidiary Issuer has not had and does not have any operations other than the issuance of the three series of senior notes and the lending of the proceeds from the senior notes to subsidiaries of Toll Brothers, Inc. Supplemental consolidating financial information of Toll Brothers, Inc., the Subsidiary Issuer, the Guarantor Subsidiaries, the Non-Guarantor Subsidiaries and the eliminations to arrive at Toll Brothers, Inc. on a consolidated basis are as follows: Condensed Consolidating Balance Sheet at January 31, 2005 ($ in thousands) Toll Non- Brothers, Subsidiary Guarantor Guarantor Inc. Issuer Subsidiaries Subsidiaries Eliminations Consolidated ASSETS Cash and cash equivalents 332,260 8,362 340,622 Marketable securities 139,789 5,000 144,789Inventory 4,145,368 359 4,145,727 Property, construction and office equipment, net 47,841 10,335 58,176 Receivables, prepaid expenses and other assets 4,798 99,042 73,569 (23,359) 154,050 Mortgage loans receivable 74,395 74,395 Customer deposits held in escrow 69,344 69,344 Investments in and advances to unconsolidated entities 109,871 109,871 Investments in and advances to consolidated entities 2,288,824 857,419 (1,140,973) (1,671) (2,003,599) - 2,288,824 862,217 3,802,542 170,349 (2,026,958) 5,096,974 LIABILITIES AND STOCKHOLDERS' EQUITY Liabilities Loans payable 368,098 4,310 372,408 Senior notes 845,790 845,790 Senior subordinated notes 450,000 450,000 Mortgage company warehouse loan 64,416 64,416 Customer deposits 329,150 329,150 Accounts payable 192,392 12 192,404 Accrued expenses 16,427 485,349 77,633 (23,427) 555,982 Income taxes payable 180,193 (2,000) 178,193 Total liabilities 180,193 862,217 1,824,989 144,371 (23,427) 2,988,343 Stockholders' equity Common stock 770 2,003 (2,003) 770 Additional paid-in capital 232,728 4,420 2,734 (7,154) 232,728 Retained earnings 1,880,923 1,973,133 21,241 (1,994,374) 1,880,923 Treasury stock (5,790) (5,790) Total stockholders' equity 2,108,631 - 1,977,553 25,978 (2,003,531) 2,108,631 2,288,824 862,217 3,802,542 170,349 (2,026,958) 5,096,974
12
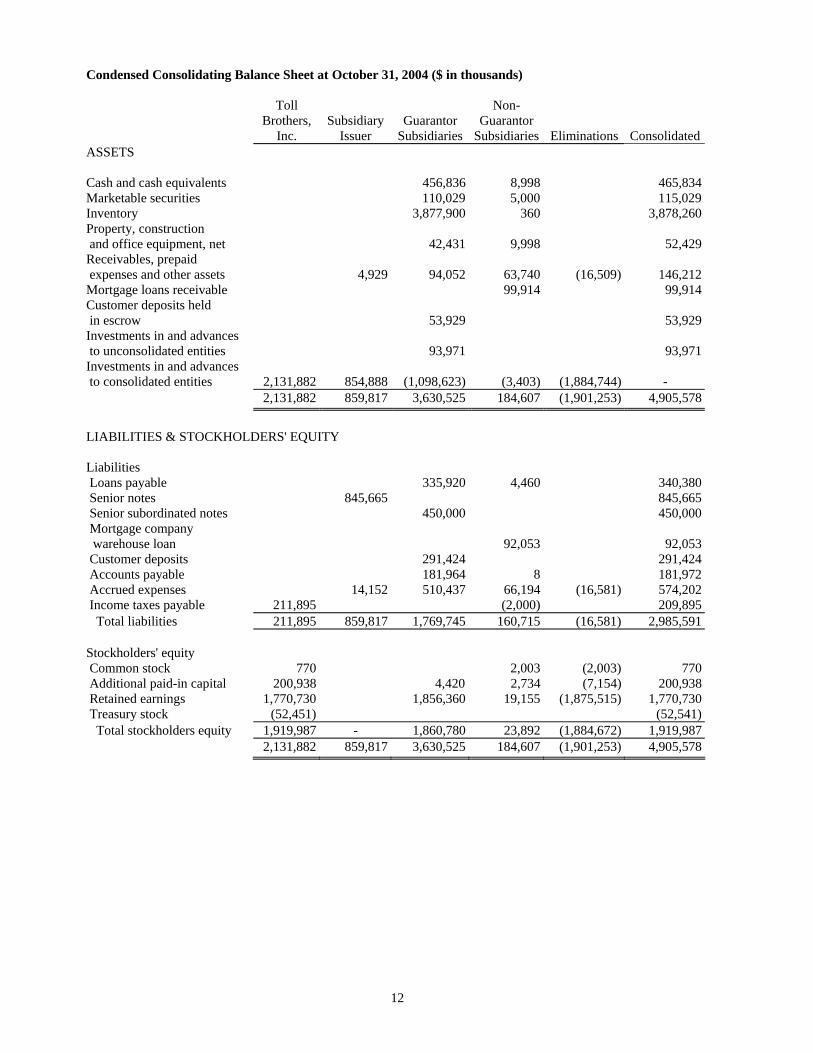
Condensed Consolidating Balance Sheet at October 31, 2004 ($ in thousands) Toll Non- Brothers, Subsidiary Guarantor Guarantor Inc. Issuer Subsidiaries Subsidiaries Eliminations ConsolidatedASSETS Cash and cash equivalents 456,836 8,998 465,834 Marketable securities 110,029 5,000 115,029Inventory 3,877,900 360 3,878,260 Property, construction and office equipment, net 42,431 9,998 52,429 Receivables, prepaid expenses and other assets 4,929 94,052 63,740 (16,509) 146,212 Mortgage loans receivable 99,914 99,914 Customer deposits held in escrow 53,929 53,929 Investments in and advances to unconsolidated entities 93,971 93,971 Investments in and advances to consolidated entities 2,131,882 854,888 (1,098,623) (3,403) (1,884,744) - 2,131,882 859,817 3,630,525 184,607 (1,901,253) 4,905,578 LIABILITIES & STOCKHOLDERS' EQUITY Liabilities Loans payable 335,920 4,460 340,380 Senior notes 845,665 845,665 Senior subordinated notes 450,000 450,000 Mortgage company warehouse loan 92,053 92,053 Customer deposits 291,424 291,424 Accounts payable 181,964 8 181,972 Accrued expenses 14,152 510,437 66,194 (16,581) 574,202 Income taxes payable 211,895 (2,000) 209,895 Total liabilities 211,895 859,817 1,769,745 160,715 (16,581) 2,985,591 Stockholders' equity Common stock 770 2,003 (2,003) 770 Additional paid-in capital 200,938 4,420 2,734 (7,154) 200,938 Retained earnings 1,770,730 1,856,360 19,155 (1,875,515) 1,770,730 Treasury stock (52,451) (52,541) Total stockholders equity 1,919,987 - 1,860,780 23,892 (1,884,672) 1,919,987 2,131,882 859,817 3,630,525 184,607 (1,901,253) 4,905,578
13
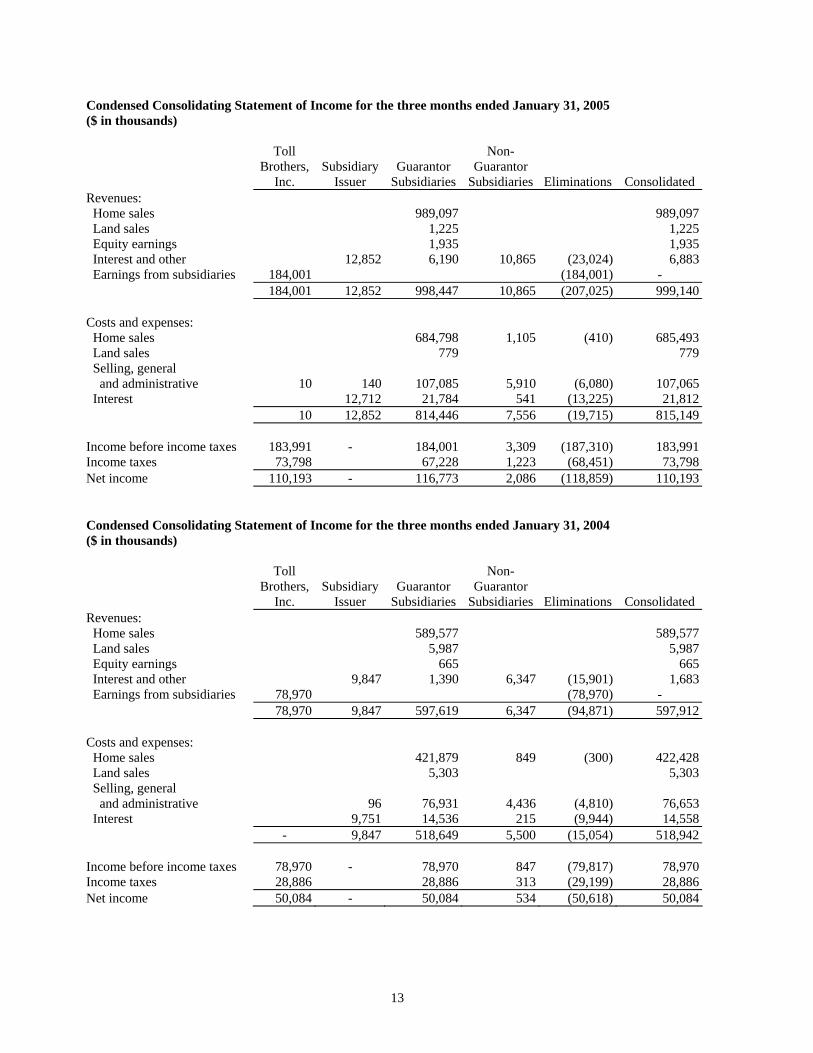
Condensed Consolidating Statement of Income for the three months ended January 31, 2005 ($ in thousands) Toll Non- Brothers, Subsidiary Guarantor Guarantor Inc. Issuer Subsidiaries Subsidiaries Eliminations Consolidated Revenues: Home sales 989,097 989,097 Land sales 1,225 1,225 Equity earnings 1,935 1,935 Interest and other 12,852 6,190 10,865 (23,024) 6,883 Earnings from subsidiaries 184,001 (184,001) - 184,001 12,852 998,447 10,865 (207,025) 999,140 Costs and expenses: Home sales 684,798 1,105 (410) 685,493 Land sales 779 779 Selling, general and administrative 10 140 107,085 5,910 (6,080) 107,065 Interest 12,712 21,784 541 (13,225) 21,812 10 12,852 814,446 7,556 (19,715) 815,149 Income before income taxes 183,991 - 184,001 3,309 (187,310) 183,991 Income taxes 73,798 67,228 1,223 (68,451) 73,798 Net income 110,193 - 116,773 2,086 (118,859) 110,193 Condensed Consolidating Statement of Income for the three months ended January 31, 2004 ($ in thousands) Toll Non- Brothers, Subsidiary Guarantor Guarantor Inc. Issuer Subsidiaries Subsidiaries Eliminations Consolidated Revenues: Home sales 589,577 589,577 Land sales 5,987 5,987 Equity earnings 665 665 Interest and other 9,847 1,390 6,347 (15,901) 1,683 Earnings from subsidiaries 78,970 (78,970) - 78,970 9,847 597,619 6,347 (94,871) 597,912 Costs and expenses: Home sales 421,879 849 (300) 422,428 Land sales 5,303 5,303 Selling, general and administrative 96 76,931 4,436 (4,810) 76,653 Interest 9,751 14,536 215 (9,944) 14,558 - 9,847 518,649 5,500 (15,054) 518,942 Income before income taxes 78,970 - 78,970 847 (79,817) 78,970 Income taxes 28,886 28,886 313 (29,199) 28,886 Net income 50,084 - 50,084 534 (50,618) 50,084
14
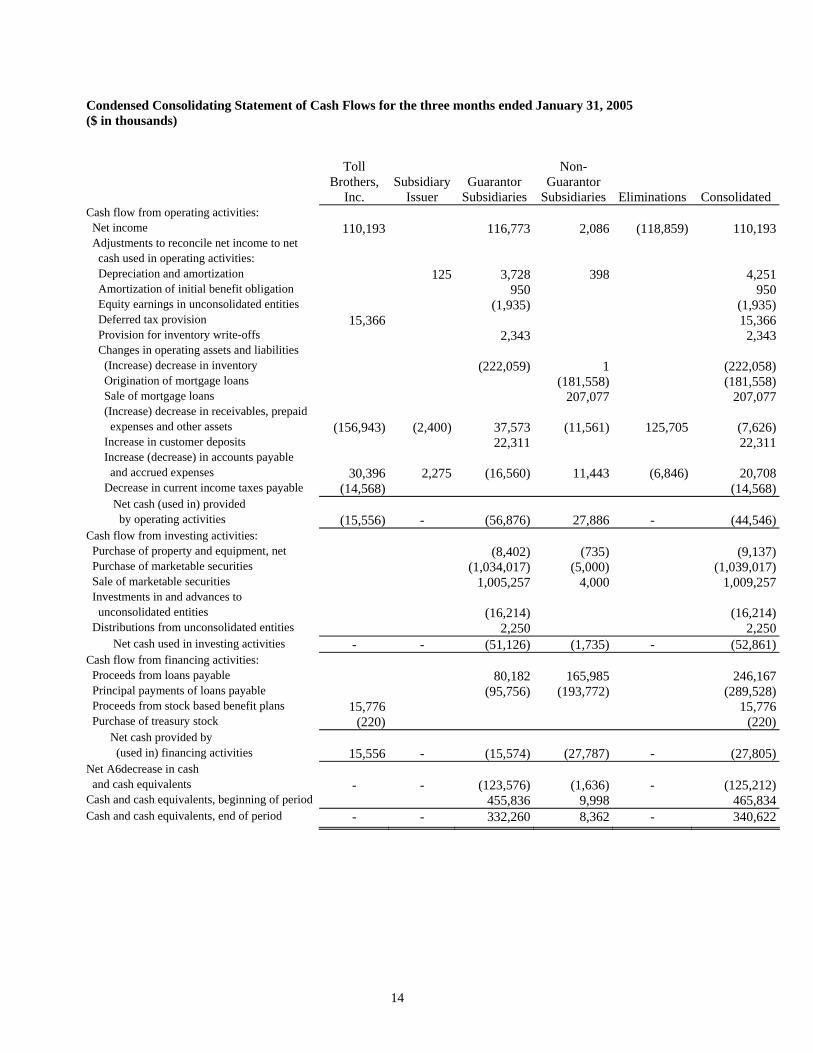
Condensed Consolidating Statement of Cash Flows for the three months ended January 31, 2005 ($ in thousands) Toll Non- Brothers, Subsidiary Guarantor Guarantor Inc. Issuer Subsidiaries Subsidiaries Eliminations Consolidated Cash flow from operating activities: Net income 110,193 116,773 2,086 (118,859) 110,193 Adjustments to reconcile net income to net cash used in operating activities: Depreciation and amortization 125 3,728 398 4,251 Amortization of initial benefit obligation 950 950 Equity earnings in unconsolidated entities (1,935) (1,935) Deferred tax provision 15,366 15,366 Provision for inventory write-offs 2,343 2,343 Changes in operating assets and liabilities (Increase) decrease in inventory (222,059) 1 (222,058) Origination of mortgage loans (181,558) (181,558) Sale of mortgage loans 207,077 207,077 (Increase) decrease in receivables, prepaid expenses and other assets (156,943) (2,400) 37,573 (11,561) 125,705 (7,626) Increase in customer deposits 22,311 22,311 Increase (decrease) in accounts payable and accrued expenses 30,396 2,275 (16,560) 11,443 (6,846) 20,708 Decrease in current income taxes payable (14,568) (14,568) Net cash (used in) provided by operating activities (15,556) - (56,876) 27,886 - (44,546)Cash flow from investing activities: Purchase of property and equipment, net (8,402) (735) (9,137) Purchase of marketable securities (1,034,017) (5,000) (1,039,017) Sale of marketable securities 1,005,257 4,000 1,009,257 Investments in and advances to unconsolidated entities (16,214) (16,214) Distributions from unconsolidated entities 2,250 2,250 Net cash used in investing activities - - (51,126) (1,735) - (52,861)Cash flow from financing activities: Proceeds from loans payable 80,182 165,985 246,167 Principal payments of loans payable (95,756) (193,772) (289,528) Proceeds from stock based benefit plans 15,776 15,776 Purchase of treasury stock (220) (220) Net cash provided by (used in) financing activities 15,556 - (15,574) (27,787) - (27,805)Net A6decrease in cash and cash equivalents - - (123,576) (1,636) - (125,212)Cash and cash equivalents, beginning of period 455,836 9,998 465,834 Cash and cash equivalents, end of period - - 332,260 8,362 - 340,622
15
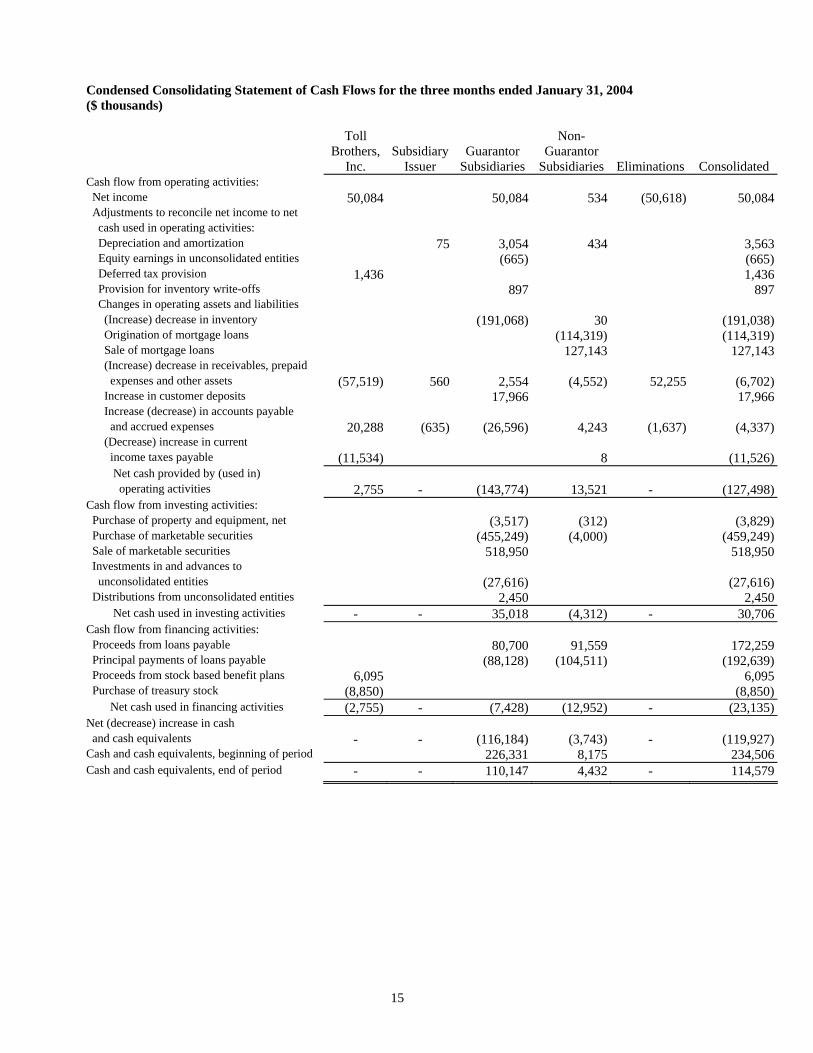
Condensed Consolidating Statement of Cash Flows for the three months ended January 31, 2004 ($ thousands) Toll Non- Brothers, Subsidiary Guarantor Guarantor Inc. Issuer Subsidiaries Subsidiaries Eliminations Consolidated Cash flow from operating activities: Net income 50,084 50,084 534 (50,618) 50,084 Adjustments to reconcile net income to net cash used in operating activities: Depreciation and amortization 75 3,054 434 3,563 Equity earnings in unconsolidated entities (665) (665) Deferred tax provision 1,436 1,436 Provision for inventory write-offs 897 897 Changes in operating assets and liabilities (Increase) decrease in inventory (191,068) 30 (191,038) Origination of mortgage loans (114,319) (114,319) Sale of mortgage loans 127,143 127,143 (Increase) decrease in receivables, prepaid expenses and other assets (57,519) 560 2,554 (4,552) 52,255 (6,702) Increase in customer deposits 17,966 17,966 Increase (decrease) in accounts payable and accrued expenses 20,288 (635) (26,596) 4,243 (1,637) (4,337) (Decrease) increase in current income taxes payable (11,534) 8 (11,526) Net cash provided by (used in) operating activities 2,755 - (143,774) 13,521 - (127,498)Cash flow from investing activities: Purchase of property and equipment, net (3,517) (312) (3,829) Purchase of marketable securities (455,249) (4,000) (459,249) Sale of marketable securities 518,950 518,950 Investments in and advances to unconsolidated entities (27,616) (27,616) Distributions from unconsolidated entities 2,450 2,450 Net cash used in investing activities - - 35,018 (4,312) - 30,706 Cash flow from financing activities: Proceeds from loans payable 80,700 91,559 172,259 Principal payments of loans payable (88,128) (104,511) (192,639) Proceeds from stock based benefit plans 6,095 6,095 Purchase of treasury stock (8,850) (8,850) Net cash used in financing activities (2,755) - (7,428) (12,952) - (23,135)Net (decrease) increase in cash and cash equivalents - - (116,184) (3,743) - (119,927)Cash and cash equivalents, beginning of period 226,331 8,175 234,506 Cash and cash equivalents, end of period - - 110,147 4,432 - 114,579
16
ITEM 2. MANAGEMENT'S DISCUSSION AND ANALYSIS OF FINANCIAL CONDITION AND RESULTS OF OPERATIONS OVERVIEW Our first quarter of fiscal 2005 was another record quarter for us. Revenues and net income for the three months ended January 31, 2005 increased 67% and 120%, respectively, as compared to the comparable quarter of fiscal 2004. In addition, our backlog, homes under contract but not yet delivered, at January 31, 2005 of $4.89 billion (7,292 homes) was up 66% over our backlog at January 31, 2004. We believe backlog is a useful predictor of future results because for each home included in backlog, we have a binding signed agreement of sale with a non-refundable cash deposit averaging approximately 7% of the purchase price from our buyer, and over the next nine to twelve months we expect to deliver the home in backlog and recognize the revenues and related income. Based upon this strong quarter and our backlog, we are raising our guidance for fiscal 2005. We now expect that the total number of homes closed for fiscal 2005 will be between 8,050 and 8,400 homes with an average delivered price of $640,000 and $645,000 and that net income will grow approximately 60% in fiscal 2005 as compared to fiscal 2004. We also believe that, due to the continuing strong demand for our homes, a recovering economy, our diversified offerings in the luxury move-up, active-adult, and empty-nester urban and suburban niches, and our growing portfolio of well-positioned communities in upscale markets, fiscal 2006 will be another record year. Geographic and product diversification, access to lower-cost capital, a versatile and abundant home mortgage market and improving demographics are promoting strong and steady demand for those builders who can control land and persevere through the increasingly difficult regulatory approval process. This evolution in our industry favors the large, publicly traded home building companies with the capital and expertise to control home sites and gain market share. We currently own or control more than 63,000 home sites in 47 markets we consider to be affluent, a substantial number of which sites already have the approvals necessary for development. We believe that as the approval process becomes more difficult, and as the political pressure from no-growth proponents increases, our expertise in taking land through the approval process and our already approved land positions should allow us to continue to grow for a number of years to come. Because of the length of time that it takes to obtain the necessary approvals on a property, complete the land improvements on it, and deliver a home after a home buyer signs an agreement of sale, we are subject to many risks. We attempt to reduce our risks by: controlling land for future development through options whenever possible, thus allowing us to obtain the necessary governmental approvals before acquiring title to the land; generally commencing construction of a home after executing an agreement of sale with a buyer; and using subcontractors to perform home construction and land development work on a fixed-price basis. Our revenues have grown on average over 20% per year in the last decade. We have funded this growth through the reinvestment of profits, bank borrowings and capital market transactions. At January 31, 2005, we had $485.4 million of cash, cash equivalents and marketable securities and approximately $1.01 billion available under our bank revolving credit facility which extends to July 15, 2009. In addition, during the second quarter of 2004, we issued $300 million of 4.95% Senior Notes due 2014. We used a portion of the proceeds from these notes to redeem $170 million of our 8 1/8% Senior Subordinated Notes due 2009. With these resources, our strong cash flow from operations before inventory growth, and our history of success in accessing the public debt markets, we believe we have the resources available to continue to grow in fiscal 2005 and beyond. CRITICAL ACCOUNTING POLICIES We believe the following critical accounting policies reflect the more significant judgments and estimates used in the preparation of our consolidated financial statements. Inventory Inventory is stated at the lower of cost or fair value in accordance with SFAS No. 144, "Accounting for the Impairment or Disposal of Long-Lived Assets." In addition to direct acquisition, land development and home construction costs, costs include interest, real estate taxes and direct overhead costs related to development and construction, which are capitalized to inventories during the period beginning with the commencement of development and ending with the completion of construction. It takes approximately four to five years to fully develop, sell and deliver all the homes in one of our typical communities. Longer or shorter time periods are possible depending on the number of home sites in a community.
17
Our master planned communities, consisting of several smaller communities, may take up to 10 years or more to complete. Because our inventory is considered a long-lived asset under U.S. generally accepted accounting principles, we are required to review the carrying value of each of our communities and write down the value of those communities for which we believe the values are not recoverable. When the profitability of a current community deteriorates, the sales pace declines significantly or some other factor indicates a possible impairment in the recoverability of the asset, we evaluate the property in accordance with the guidelines of SFAS No. 144. If this evaluation indicates that an impairment loss should be recognized, we charge cost of sales for the estimated impairment loss in the period determined. In addition, we review all land held for future communities or future sections of current communities, whether owned or under contract, to determine whether or not we expect to proceed with the development of the land as planned. Based upon this review, we decide: (a) as to land that is under a purchase contract but not owned, whether the contract will likely be terminated or renegotiated and (b) as to land we own, whether the land will likely be developed as contemplated or in an alternative manner, or should be sold. We then further determine which costs that have been capitalized to the property are recoverable and which costs should be written off. We incurred $2.3 million in write-offs of costs related to current and future communities in the three-month period ended January 31, 2005 as compared to $1.0 million in the comparable period of fiscal 2004. Income Recognition Revenue and cost of sales are recorded at the time each home or home site is delivered and title and possession are transferred to the buyer. Land, land development and related costs, both incurred and estimated to be incurred in the future, are amortized to the cost of homes closed based upon the total number of homes to be constructed in each community. Any changes to the estimated costs subsequent to the commencement of delivery of homes are allocated to the remaining undelivered homes in the community. Home construction and related costs are charged to the cost of homes closed under the specific identification method. The estimated land, common area development and related costs of master planned communities, including the cost of golf courses, net of their estimated residual value, are allocated to individual communities within a master planned community on a relative sales value basis. Any change in the estimated cost is allocated to the remaining lots in each of the communities of the master planned community. Use of Estimates In the ordinary course of doing business, we must make estimates and judgments that affect decisions on how we operate and the reported amounts of assets, liabilities, revenues and expenses. These estimates include, but are not limited to, those related to the recognition of income and expenses, impairment of assets, estimates of future improvement and amenity costs, capitalization of costs to inventory, provisions for litigation, insurance and warranty costs, and income taxes. We base our estimates on historical experience and on various other assumptions that are believed to be reasonable under the circumstances. On an ongoing basis, we evaluate and adjust our estimates based on the information currently available. Actual results may differ from these estimates and assumptions or conditions. OFF-BALANCE SHEET ARRANGEMENTS We have investments in and advances to several joint ventures and to Toll Brothers Realty Trust Group (the “Trust”). At January 31, 2005, we had investments in and advances to these unconsolidated entities of $109.9 million, were committed to invest or advance an additional $32.4 million to these entities if needed and had guaranteed approximately $61.1 million of these entities’ indebtedness. See Note 3 to the Condensed Consolidated Financial Statements, “Investments in and Advances to Unconsolidated Entities” for more information regarding these entities. Our total commitment to these entities is not material to our financial condition. Investments in 20%-to-50% owned entities are accounted for using the equity method. Investments in less than 20%-owned entities are accounted for on the cost method.
18
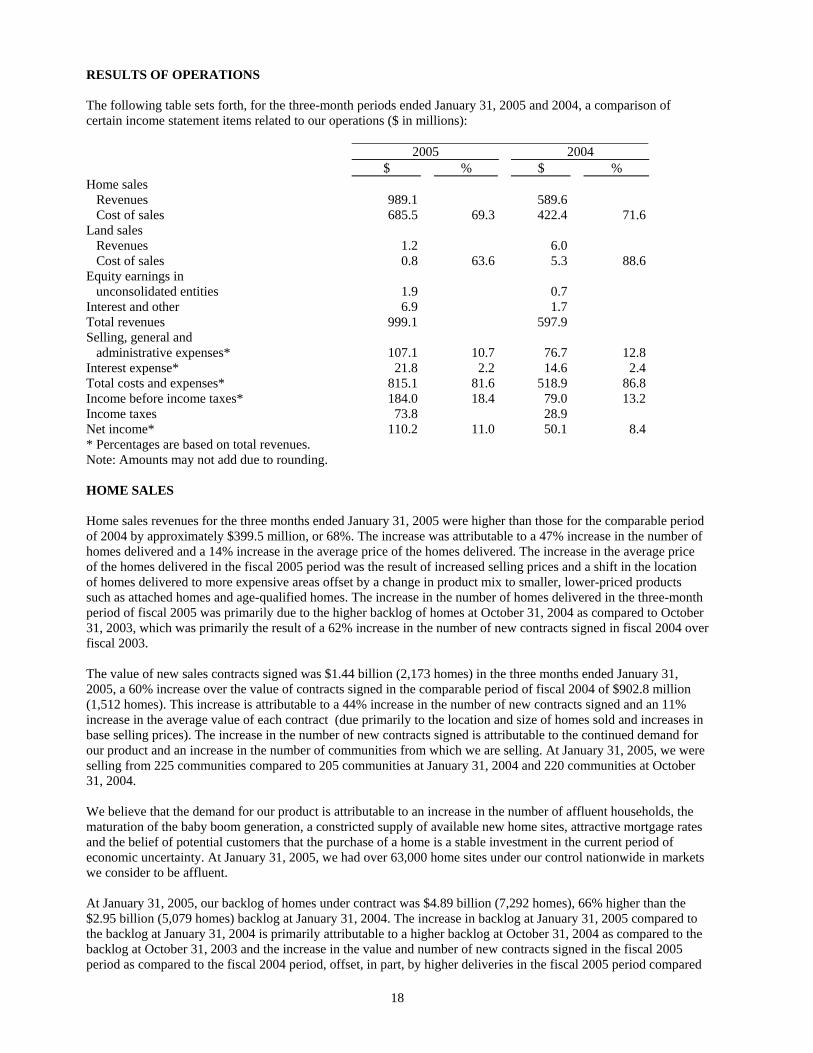
RESULTS OF OPERATIONS The following table sets forth, for the three-month periods ended January 31, 2005 and 2004, a comparison of certain income statement items related to our operations ($ in millions): 2005 2004 $ % $ % Home sales Revenues 989.1 589.6 Cost of sales 685.5 69.3 422.4 71.6 Land sales Revenues 1.2 6.0 Cost of sales 0.8 63.6 5.3 88.6 Equity earnings in unconsolidated entities 1.9 0.7 Interest and other 6.9 1.7 Total revenues 999.1 597.9 Selling, general and administrative expenses* 107.1 10.7 76.7 12.8 Interest expense* 21.8 2.2 14.6 2.4 Total costs and expenses* 815.1 81.6 518.9 86.8 Income before income taxes* 184.0 18.4 79.0 13.2 Income taxes 73.8 28.9 Net income* 110.2 11.0 50.1 8.4 * Percentages are based on total revenues. Note: Amounts may not add due to rounding. HOME SALES Home sales revenues for the three months ended January 31, 2005 were higher than those for the comparable period of 2004 by approximately $399.5 million, or 68%. The increase was attributable to a 47% increase in the number of homes delivered and a 14% increase in the average price of the homes delivered. The increase in the average price of the homes delivered in the fiscal 2005 period was the result of increased selling prices and a shift in the location of homes delivered to more expensive areas offset by a change in product mix to smaller, lower-priced products such as attached homes and age-qualified homes. The increase in the number of homes delivered in the three-month period of fiscal 2005 was primarily due to the higher backlog of homes at October 31, 2004 as compared to October 31, 2003, which was primarily the result of a 62% increase in the number of new contracts signed in fiscal 2004 over fiscal 2003. The value of new sales contracts signed was $1.44 billion (2,173 homes) in the three months ended January 31, 2005, a 60% increase over the value of contracts signed in the comparable period of fiscal 2004 of $902.8 million (1,512 homes). This increase is attributable to a 44% increase in the number of new contracts signed and an 11% increase in the average value of each contract (due primarily to the location and size of homes sold and increases in base selling prices). The increase in the number of new contracts signed is attributable to the continued demand for our product and an increase in the number of communities from which we are selling. At January 31, 2005, we were selling from 225 communities compared to 205 communities at January 31, 2004 and 220 communities at October 31, 2004. We believe that the demand for our product is attributable to an increase in the number of affluent households, the maturation of the baby boom generation, a constricted supply of available new home sites, attractive mortgage rates and the belief of potential customers that the purchase of a home is a stable investment in the current period of economic uncertainty. At January 31, 2005, we had over 63,000 home sites under our control nationwide in markets we consider to be affluent. At January 31, 2005, our backlog of homes under contract was $4.89 billion (7,292 homes), 66% higher than the $2.95 billion (5,079 homes) backlog at January 31, 2004. The increase in backlog at January 31, 2005 compared to the backlog at January 31, 2004 is primarily attributable to a higher backlog at October 31, 2004 as compared to the backlog at October 31, 2003 and the increase in the value and number of new contracts signed in the fiscal 2005 period as compared to the fiscal 2004 period, offset, in part, by higher deliveries in the fiscal 2005 period compared
19
to the fiscal 2004 period. Based on the size of our current backlog, the continued demand for our product, the increased number of selling communities from which we are operating and the additional communities we expect to open in the coming months, we believe that we will deliver between 8,050 and 8,400 homes in fiscal 2005 and that the average delivered price of those homes will be between $640,000 and $645,000. Home costs as a percentage of home sales revenue decreased 235 basis points (2.35%) in the three-month period ended January 31, 2005 as compared to the comparable period of fiscal 2004. The decrease was largely the result of selling prices increasing at a greater rate than costs and the efficiencies realized from the increased number of homes delivered. For the full 2005 fiscal year, we expect that home costs as a percentage of home sales revenues will decrease between 275 and 315 basis points as compared to the full 2004 fiscal year due to selling prices continuing to increase at a greater rate than costs and efficiencies realized from the increase in the number of homes to be delivered in fiscal 2005 as compared to fiscal 2004. LAND SALES We are developing several communities in which we sell a portion of the land to other builders. The amount of land sales will vary from quarter to quarter depending upon the scheduled timing of the delivery of the land parcels. Land sales were $1.2 million for the three months ended January 31, 2005 as compared to $6.0 million for the comparable period of fiscal 2004. For the full 2005 fiscal year, land sales are expected to be approximately $21.0 million compared to $22.5 million in fiscal 2004. Cost of land sales is expected to be approximately 65% of land sales revenues in fiscal 2005 as compared to approximately 70% in fiscal 2004. EQUITY EARNINGS IN UNCONSOLIDATED ENTITIES We are a participant in several joint ventures and in the Trust. We recognize our proportionate share of the earnings from these entities. (See Note 3 to the Condensed Consolidated Financial Statements, "Investments in and Advances to Unconsolidated Entities” for more information regarding our investments in and commitments to these entities.) Earnings from these entities will vary significantly from quarter to quarter depending on the level of activity of each entity during the period. For the three months ended January 31, 2005, we recognized $1.9 million of earnings from unconsolidated entities as compared to $.7 million in the comparable period of fiscal 2004. For the full 2005 fiscal year, we expect to realize approximately $12.0 million of earnings from our investments in the joint ventures and the Trust compared to $15.7 million in fiscal 2004. INTEREST AND OTHER INCOME For the three months ended January 31, 2005, interest and other income was $6.9 million, an increase of $5.2 million from the $1.7 million recognized in the comparable period of fiscal 2004. This increase was primarily the result of higher interest income, higher management and construction fee income and higher income realized from our ancillary businesses in the fiscal 2005 period. For the full 2005 fiscal year, we expect interest and other income to be approximately $28.0 million compared to $15.4 million in fiscal 2004. SELLING, GENERAL AND ADMINISTRATIVE EXPENSES ("SG&A") SG&A spending increased by $30.4 million, or 40%, in the three-month period ended January 31, 2005 as compared to the comparable period of fiscal 2004. This increased spending was principally due to the costs incurred to support the 68% increase in home sales revenues, the costs associated with the increase in the number of selling communities that we had during the three-month period of fiscal 2005 as compared to the comparable period of fiscal 2004 and the continued costs incurred in the search for new land to replace the home sites that were sold during the period and to expand our land position to enable us to grow in the future. For the full 2005 fiscal year, we expect that SG&A as a percentage of revenues will decrease slightly compared to the full 2004 fiscal year. INTEREST EXPENSE We determine interest expense on a specific lot-by-lot basis for our homebuilding operations and on a parcel-by-parcel basis for land sales. As a percentage of total revenues, interest expense varies depending on many factors, including the period of time that we owned the land, the length of time that the homes delivered during the period were under construction, and the interest rates and the amount of debt carried by us in proportion to the amount of our inventory during those
20
periods. Interest expense as a percentage of revenues was slightly lower in the three-month period ended January 31, 2005 as compared to the comparable period of fiscal 2004. For the full 2005 fiscal year, we expect interest expense as a percentage of total revenues to be approximately 2.3% as compared to 2.4% in fiscal 2004. INCOME BEFORE INCOME TAXES For the three-month period ended January 31, 2005, income before taxes was $184.0 million, an increase of 133% over the $79.0 million earned in the comparable period of fiscal 2004. INCOME TAXES Income taxes were provided at an effective rate of 40.1% and 36.6% for the three-month periods ended January 31, 2005 and 2004, respectively. The difference in rates in the three-month period of fiscal 2005 as compared to the comparable period of fiscal 2004 was due primarily to a change in the estimated Base Rate to 38.5% from 37.0% in fiscal 2005 and the impact of recomputing our net deferred tax liability using the new Base Rate. The change in the Base Rate was due to the combination of changes in tax legislation and regulations and an expected shift in income to states with higher tax rates in fiscal 2005. CAPITAL RESOURCES AND LIQUIDITY We fund our operations principally from cash flow from operating activities, unsecured bank borrowings and the public debt and equity markets. In general, cash flow from operating activities assumes that as each home is delivered we will purchase a home site to replace it. Because we own several years’ supply of home sites, we do not need to buy home sites immediately to replace the ones delivered. Accordingly, we believe that cash flow from operating activities before inventory additions is currently a better gauge of liquidity. Cash flow from operating activities, before inventory additions, has improved as operating results have improved. One of the main factors that determine cash flow from operating activities, before inventory additions, is the level of revenues from the delivery of homes and land sales. We anticipate that cash flow from operating activities, before inventory additions, will continue to be strong in fiscal 2005 due to the expected increase in home deliveries in fiscal 2005, as compared to fiscal 2004. We expect that our inventory will continue to increase and we are currently negotiating and searching for additional opportunities to obtain control of land for future communities. At January 31, 2005, we had commitments to acquire land of approximately $2.54 billion, of which approximately $159.4 million had been paid or deposited (See Note 11 to the Condensed Consolidated Financial Statements, “Commitments and Contingencies” for more information concerning these commitments). We have used our cash flow from operating activities, before inventory additions, bank borrowings and the proceeds of public debt and equity offerings to: acquire additional land for new communities; fund additional expenditures for land development; fund construction costs needed to meet the requirements of our increased backlog and the increasing number of communities in which we are offering homes for sale; repurchase our stock; and repay debt. We generally do not begin construction of a home until we have a signed contract with the home buyer. Because of the significant amount of time between the time a home buyer enters into a contract to purchase a home and the time that the home is built and delivered, we believe we can estimate, with reasonable accuracy, the number of homes we will deliver in the next 9 to 12 months. Should our business decline significantly, our inventory would decrease as we complete and deliver the homes under construction but do not commence construction of as many new homes, resulting in a temporary increase in our cash flow from operations. In addition, under such circumstances, we might delay or curtail our acquisition of additional land, which would further reduce our inventory levels and cash needs. We believe that we will be able to continue to fund our expected growth and meet our contractual obligations through a combination of existing cash resources, cash flow from operating activities, our existing sources of credit and the public debt markets. INFLATION The long-term impact of inflation on us is manifested in increased costs for land, land development, construction and overhead, as well as in increased sales prices of our homes. We generally contract for land significantly before development and sales efforts begin. Accordingly, to the extent land acquisition costs are fixed, increases or decreases in the sales prices of homes may affect our profits. Because the sales price of each of our homes is fixed at
21
the time a buyer enters into a contract to acquire a home, and because we generally contract to sell our homes before we begin construction, any inflation of costs in excess of those anticipated may result in lower gross margins. We generally attempt to minimize that effect by entering into fixed-price contracts with our subcontractors and material suppliers for specified periods of time, which generally do not exceed one year. In general, housing demand is adversely affected by increases in interest rates and housing costs. Interest rates, the length of time that land remains in inventory and the proportion of inventory that is financed affect our interest costs. If we are unable to raise sales prices enough to compensate for higher costs, or if mortgage interest rates increase significantly, affecting prospective buyers' ability to adequately finance home purchases, our revenues, gross margins and net income would be adversely affected. Increases in sales prices, whether the result of inflation or demand, may affect the ability of prospective buyers to afford new homes.
HOUSING DATA ($ in millions)
Closings Three months ended January 31, 2005 2004 2005 2004 Region Units Units $ $ Northeast (CT,MA,NH,NJ,NY,RI) 229 183 123.3 104.6 Mid-Atlantic (DE,MD,PA,VA) 663 405 386.9 201.4 Midwest (IL,MI,OH) 95 72 57.0 40.9 Southeast (FL,NC,SC,TN) 155 121 84.4 53.7 Southwest (AZ,CO,NV,TX) 248 149 155.8 81.8 West (CA) 200 155 181.7 107.2 Total consolidated entities 1,590 1,085 989.1 589.6 Total unconsolidated entities 63 5 26.4 1.5 1,653 1,090 1,015.5 591.1
New Contracts Three months ended January 31, 2005 2004 2005 2004 Region Units Units $ $ Northeast (CT,MA,NH,NJ,NY,RI) 319 222 200.6 137.9 Mid-Atlantic (DE,MD,PA,VA) 767 527 471.4 283.8 Midwest (IL,MI,OH) 112 120 78.0 71.7 Southeast (FL,NC,SC,TN) 381 174 205.4 85.4 Southwest (AZ,CO,NV,TX) 366 233 254.3 143.5 West (CA) 228 236 233.4 180.5 Total consolidated entities 2,173 1,512 1,443.1 902.8 Total unconsolidated entities 36 5 15.6 1.6 2,209 1,517 1,458.7 904.4
22
Backlog January 31, 2005 2004 2005 2004 Region Units Units $ $ Northeast (CT,MA,NH,NJ,NY,RI) 1,118 971 676.8 552.7 Mid-Atlantic (DE,MD,PA,VA) 2,349 1,796 1,456.8 919.5 Midwest (IL,MI,OH) 463 342 305.4 194.0 Southeast (FL,NC,SC,TN) 952 464 584.5 250.1 Southwest (AZ,CO,NV,TX) 1,469 793 948.2 458.5 West (CA) 941 713 916.2 570.3 Total consolidated entities 7,292 5,079 4,887.9 2,945.1 Total unconsolidated entities 147 15 65.0 4.8 7,439 5,094 4,952.9 2,949.9
ITEM 3. QUANTITATIVE AND QUALITATIVE DISCLOSURES ABOUT MARKET RISK We are exposed to market risk primarily due to fluctuations in interest rates. We utilize both fixed-rate and variable-rate debt. For fixed-rate debt, changes in interest rates generally affect the fair market value of the debt instrument, but not our earnings or cash flow. Conversely, for variable-rate debt, changes in interest rates generally do not impact the fair market value of the debt instrument, but do affect our earnings and cash flow. We do not have the obligation to prepay fixed-rate debt prior to maturity, and, as a result, interest rate risk and changes in fair market value should not have a significant impact on our fixed-rate debt until we are required or elect to refinance it. The table below sets forth, at January 31, 2005, our debt obligations, principal cash flows by scheduled maturity, weighted-average interest rates and estimated fair value (amounts in thousands): Fixed-Rate Debt Variable-Rate Debt(1)(2) Weighted Weighted Fiscal Year of Average Average Expected Maturity Amount Interest Rate Amount Interest Rate 2005 $277,123 6.53% $64,416 3.68%2006 33,088 5.63% 150 1.88%2007 48,506 6.98% 150 1.88%2008 5,403 6.02% 150 1.88%2009 103,178 7.95% 150 1.88%Thereafter 1,200,800 6.60% 3,710 1.88%Discount (4,210) Total $1,663,888 6.66% $68,726 3.57%Fair value at January 31, 2005 $1,749,656 $68,726 (1) At January 31, 2005, we had a $1.18 billion unsecured revolving credit facility with 29 banks which extends to
July 2009. At January 31, 2005, we had no borrowings and approximately $169.3 million of letters of credit outstanding under the facility. At January 31, 2005, interest was payable on borrowings under this facility at .625% (subject to adjustment based upon our debt rating and leverage ratios) above the Eurodollar rate or at other specified variable rates as selected by us from time to time.
(2) One of our subsidiaries has a $125 million line of credit with three banks to fund mortgage originations. The
line is due within 90 days of demand by the banks and bears interest at the banks’ overnight rate plus an agreed upon margin. At January 31, 2005, the subsidiary had $64.4 million outstanding under the line at an average interest rate of 3.68%. Borrowing under this line is included in the 2005 fiscal year maturities.
Based upon the amount of variable rate debt outstanding at January 31, 2005 and holding the variable rate debt balance constant, each one percentage point increase in interest rates would increase our interest costs by approximately $.7 million per year.
23
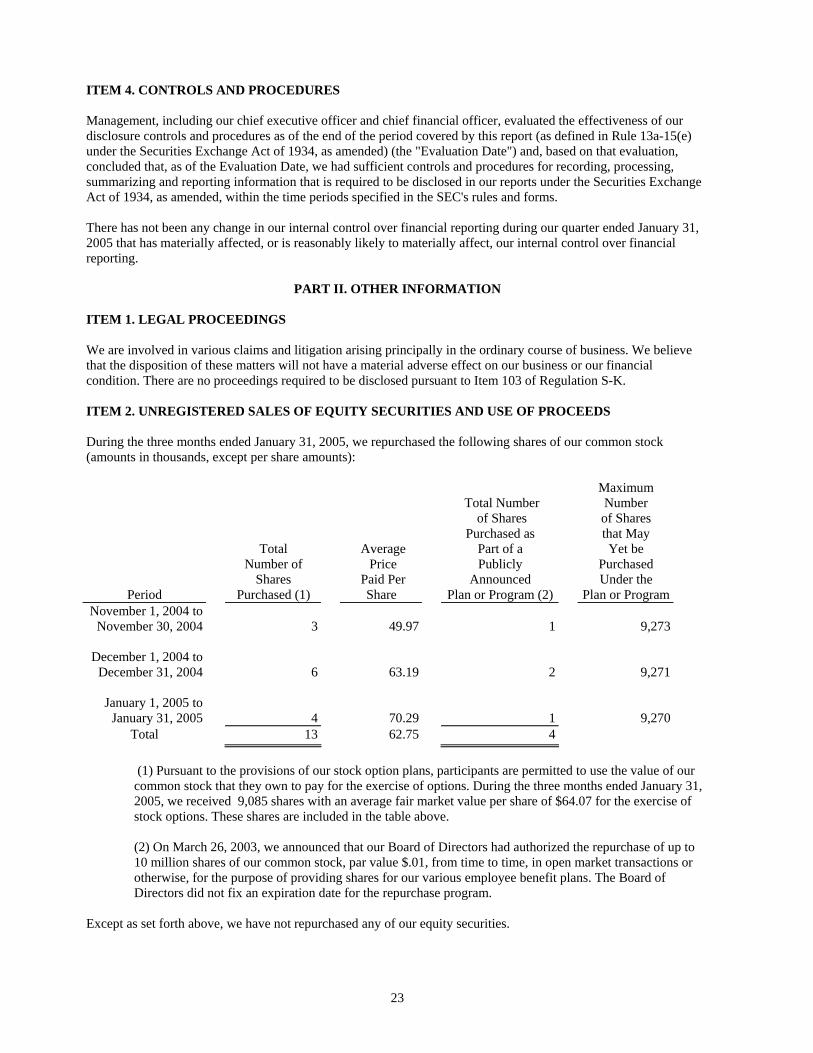
ITEM 4. CONTROLS AND PROCEDURES Management, including our chief executive officer and chief financial officer, evaluated the effectiveness of our disclosure controls and procedures as of the end of the period covered by this report (as defined in Rule 13a-15(e) under the Securities Exchange Act of 1934, as amended) (the "Evaluation Date") and, based on that evaluation, concluded that, as of the Evaluation Date, we had sufficient controls and procedures for recording, processing, summarizing and reporting information that is required to be disclosed in our reports under the Securities Exchange Act of 1934, as amended, within the time periods specified in the SEC's rules and forms. There has not been any change in our internal control over financial reporting during our quarter ended January 31, 2005 that has materially affected, or is reasonably likely to materially affect, our internal control over financial reporting.
PART II. OTHER INFORMATION ITEM 1. LEGAL PROCEEDINGS We are involved in various claims and litigation arising principally in the ordinary course of business. We believe that the disposition of these matters will not have a material adverse effect on our business or our financial condition. There are no proceedings required to be disclosed pursuant to Item 103 of Regulation S-K. ITEM 2. UNREGISTERED SALES OF EQUITY SECURITIES AND USE OF PROCEEDS During the three months ended January 31, 2005, we repurchased the following shares of our common stock (amounts in thousands, except per share amounts):
Maximum Total Number Number of Shares of Shares Purchased as that May Total Average Part of a Yet be Number of Price Publicly Purchased Shares Paid Per Announced Under the
Period Purchased (1) Share Plan or Program (2) Plan or ProgramNovember 1, 2004 to November 30, 2004 3 49.97 1 9,273
December 1, 2004 to December 31, 2004 6 63.19 2 9,271
January 1, 2005 to January 31, 2005 4 70.29 1 9,270
Total 13 62.75 4
(1) Pursuant to the provisions of our stock option plans, participants are permitted to use the value of our common stock that they own to pay for the exercise of options. During the three months ended January 31, 2005, we received 9,085 shares with an average fair market value per share of $64.07 for the exercise of stock options. These shares are included in the table above.
(2) On March 26, 2003, we announced that our Board of Directors had authorized the repurchase of up to 10 million shares of our common stock, par value $.01, from time to time, in open market transactions or otherwise, for the purpose of providing shares for our various employee benefit plans. The Board of Directors did not fix an expiration date for the repurchase program.
Except as set forth above, we have not repurchased any of our equity securities.
24
ITEM 3. DEFAULTS UPON SENIOR SECURITIES
None ITEM 4. SUBMISSION OF MATTERS TO A VOTE OF SECURITY HOLDERS
None
ITEM 5. OTHER INFORMATION
None ITEM 6. EXHIBITS
10.1 Toll Brothers, Inc. Stock Incentive Plan(1998) Form of Stock Award is hereby incorporated by reference to Exhibit 10.1 of the Registrant’s Form 8-K filed with the Securities and Exchange Commission on December 17, 2004. 31.1* Certification of Robert I. Toll pursuant to Section 302 of the Sarbanes-Oxley Act of 2002.
31.2* Certification of Joel H. Rassman pursuant to Section 302 of the Sarbanes-Oxley Act of 2002.
32.1* Certification of Robert I. Toll pursuant to Section 906 of the Sarbanes-Oxley Act of 2002.
32.2* Certification of Joel H. Rassman pursuant to Section 906 of the Sarbanes-Oxley Act of 2002.
*Filed electronically herewith.
SIGNATURES Pursuant to the requirements of the Securities Exchange Act of 1934, the registrant has duly caused this report to be signed on its behalf by the undersigned thereunto duly authorized.
TOLL BROTHERS, INC. (Registrant)
Date: March 14, 2005 By: _ Joel H. Rassman____________ Joel H. Rassman Executive Vice President, Treasurer and Chief Financial Officer (Principal Financial Officer) Date: March 14, 2005 By: Joseph R. Sicree __________ Joseph R. Sicree Vice President - Chief Accounting Officer (Principal Accounting Officer)


