Unit 3: Scientific analysis and reporting
28
Oxford Cambridge and RSA Level 3 Cambridge Technical in Laboratory Skills 05848/05849/05874 Unit 3: Scientific analysis and reporting Wednesday 17 January 2018 – Afternoon Time allowed: 2 hour You must have: • a ruler You may use: • a scientific or graphical calculator First Name Last Name Centre Number Candidate Number Date of Birth D D M M Y Y Y Y INSTRUCTIONS • Use black ink. • Complete the boxes above with your name, centre number, candidate number and date of birth. • Answer all the questions. • Write your answer to each question in the space provided. • If additional answer space is required, you should use the lined page(s) at the end of this booklet. The question number(s) must be clearly shown. • The Periodic Table is printed on the back page. INFORMATION • The total mark for this paper is 100. • The marks for each question are shown in brackets [ ]. • This document consists of 28 pages. © OCR 2018 [Y/507/6150] C342/1801/4 OCR is an exempt Charity Turn over FOR EXAMINER USE ONLY Question No Mark 1 /20 2 /14 3 /18 4 /10 5 /13 6 /15 7 /10 Total /100
Transcript of Unit 3: Scientific analysis and reporting

Oxford Cambridge and RSA
Level 3 Cambridge Technical in Laboratory Skills05848/05849/05874
Unit 3: Scientific analysis and reportingWednesday 17 January 2018 – AfternoonTime allowed: 2 hour
You must have:• a ruler
You may use:• a scientific or graphical calculator
First Name Last Name
CentreNumber
CandidateNumber
Date of Birth D D M M Y Y Y Y
INSTRUCTIONS• Use black ink. • Complete the boxes above with your name, centre number, candidate number and date of birth.• Answer all the questions.• Write your answer to each question in the space provided. • If additional answer space is required, you should use the lined page(s) at the end of this booklet.
The question number(s) must be clearly shown.• The Periodic Table is printed on the back page.
INFORMATION• The total mark for this paper is 100.• The marks for each question are shown in brackets [ ].• This document consists of 28 pages.
© OCR 2018 [Y/507/6150]
C342/1801/4 OCR is an exempt Charity Turn over
FOR EXAMINER USE ONLY
Question No Mark
1 /202 /143 /184 /105 /136 /157 /10
Total /100

2
© OCR 2018
Answer all the questions.
1 A patient has a hearing test.
She listens to sounds with different frequencies.
She presses a button when the sound is at the loudness level she can hear.
The results of her tests in May 2013 and May 2016 are shown in Table 1.1.
Test date
Sound frequency (Hz)
250 500 1000 2000 3000 4000 6000 8000May 2013 Loudness level (dB) 25 35 40 50 55 60 70 70
May 2016 Loudness level (dB) 35 45 55 60 55 70 75 80
Table 1.1
(a) Draw a graph of both sets of data and draw lines of best fit.
[4]

© OCR 2018 Turn over
3
(b) (i) Identify the ranges for the:
frequency measurement
......................................................................................................................................
loudness level measurements
......................................................................................................................................[2]
(ii) Identify the interval of the loudness level (dB) measurements.
..................................................................................................................................[1]
(c) Describe two trends shown in the data in Table 1.1.
1 ............................................................................................................................................
2 ...........................................................................................................................................[2]
(d) An audiologist conducts the hearing test on the patient.
He suspects there is an outlier in the 2016 data in Table 1.1.
(i) Identify the outlier in the 2016 data.
..................................................................................................................................[1]
(ii) Having identified the outlier, suggest what the audiologist should do next.
..................................................................................................................................[1]
(iii) Name the type of error that is most likely to have produced the outlier and suggest a possible cause.
......................................................................................................................................
..................................................................................................................................[2]
(iv) Use the graph you have drawn to suggest a more likely value for the outlier.
..................................................................................................................................[1]

4
© OCR 2018
Table 1.1 is repeated below.
Test date
Sound frequency (Hz)250 500 1000 2000 3000 4000 6000 8000
May 2013 Loudness level (dB) 25 35 40 50 55 60 70 70
May 2016 Loudness level (dB) 35 45 55 60 55 70 75 80
Table 1.1
(e) Analyse the data shown in Table 1.1 and justify a conclusion about the quality of the patient’s hearing.
..............................................................................................................................................
..............................................................................................................................................
..............................................................................................................................................
..............................................................................................................................................
..............................................................................................................................................
..........................................................................................................................................[3]
(f) The decibel scale is not linear. An increase of 10dB produces a sound that is 10 times louder.
Calculate how much louder a sound is at 80db compared with 30db.
Give your answer in standard form.
Show your working.
..................................................[3]

© OCR 2018 Turn over
5
2 The features of flowers can be represented by different symbols.
Some of the symbols are shown in Table 2.1.
Flower feature Symbol
Actinomorphic petal arrangement
Zygomorphic petal arrangement %Male
Female
Hermaphrodite
Number of sepals (the calyx) K
Number of petals (the corolla) C
Number of male parts in the androecium A
Number of female parts in the gynoecium
GG inferior ovary
G superior ovary
Table 2.1
(a) A group of symbols can be used to describe a type of flower.
The group of symbols is called the floral formula.
One type of flower in the Asteraceae family is described by the formula:
% Kpappus C(5) A0
(i) State the number of petals present in this flower.
.................................................[1]
(ii) Suggest why the number representing the androecium in this flower is zero.
......................................................................................................................................
..................................................................................................................................[1]

6
© OCR 2018
(b) Symbols can be used to represent the arrangement of petals within the flower.
Flowers are either actinomorphic or zygomorphic %.
Fig. 2.1 shows the appearance of the two petal arrangements for family Asteraceae.
%
Fig. 2.1
The two flowers are different.
Describe two differences in petal arrangement, in terms of symmetry.
1 ............................................................................................................................................
..............................................................................................................................................
2 ............................................................................................................................................
..............................................................................................................................................[2]

© OCR 2018 Turn over
7
(c) Bidens cernua is shown in Fig. 2.2.
This plant is also a member of the Asteraceae family.
Fig. 2.2
(i) State the naming system used to identify Bidens cernua.
...................................................................................................................................[1]
(ii) The term Bidens comes from the Latin bis ("two") and dens ("tooth").
The term cernua means nodding or hanging.
Use the structures seen in Fig. 2.2 to suggest why this plant was given the botanical name Bidens cernua.
Bidens
.......................................................................................................................................
cernua
.......................................................................................................................................[2]
(iii) State the type of data shown in Fig. 2.2 and suggest one advantage of showing the image of the plant as an illustration.
Type of data
.......................................................................................................................................
Advantage
.......................................................................................................................................
.......................................................................................................................................[2]

8
© OCR 2018
(d) Keys can be used for the identification of living organisms.
Table 2.2 shows the characteristics of the flowers of some plant families.
Plant family
Characteristics of flowers
Number of sepals and petals
Number of stamens
(male parts)
Caryophyllaceae 5 5 or 10
Crassulaceae 5 5 to 10
Cruciferae 4 6
Guttiferae 5 Numerous, in 3 or 5 bunches
Liliaceae 3 6
Onagraceae 4 8
Table 2.2
Fig. 2.3 shows a key used to identify the different plant species in Table 2.2.
Use the data in Table 2.2 to complete the blank spaces in Fig. 2.3.
Some of the key has already been completed.
Number of sepals and petals
Number of stamens Number of stamens Number of stamens
Liliaceae Onagraceae Crassulaceae
Numerous, in 3 or 5bunches
Fig. 2.3
[3]

© OCR 2018 Turn over
9
(e) Fig. 2.4 shows a single flower of a different plant, Sedum ternatum.
Fig. 2.4
Explain why the key shown in Fig. 2.3 cannot be used to fully identify the specific family that Sedum ternatum (Fig. 2.4) belongs to.
......................................................................................................................................
......................................................................................................................................
..................................................................................................................................[2]
PetalSepal
Stamen(male part)

10
© OCR 2018
3 The radius of the Moon at its equator is 1738.14 km.
(a) (i) Use the formula below to calculate the volume of the Moon.
Volume of a sphere =
Give your answer in standard form to two significant figures.
Show your working and give the units.
volume of the Moon = ……………………… units ……………. [3]
(ii) The radius of the Moon at its poles is 2.17 km less than the radius at its equator.
Calculate the ratio of the polar radius to the equatorial radius.
Give your answer as a percentage.
Show your working.
percentage = ………………………... % [3]
34 r3r

© OCR 2018 Turn over
11
(iii) The average density of the Moon is 3.34 g/cm3
Use the formula below to calculate the mass m, in kg, of the Moon, where V is the volume calculated in a(i).
Show your working.
m = ……………………………. kg [3]
mV
ρ =

12
© OCR 2018
(b) The Moon has a constant orbital period of 27.32 days.
The Moon’s distance r from Earth varies during its orbit.
Fig. 3.1 shows the variation in this distance (r) during the first four months of 2014.
Jan Feb Mar Apr May Jun
410 000
390 000
370 000
350 000
month
distance(km)
Fig. 3.1
(i) Describe the feature of the graph of Fig. 3.1 that shows that the orbital period of the Moon is constant.
......................................................................................................................................
..................................................................................................................................[1]
(ii) The distance from the Earth to the Moon decreases during May and June.
Extend and draw the line on Fig. 3.1 to predict how the Earth-Moon distance varies during May and June.
[2]

© OCR 2018 Turn over
13
(iii) A webpage claims the following statement:
The speed of the Moon around the Earth is 1000 m/s.
Is this statement correct?
Justify your answer with a calculation.
You may use the information in Fig. 3.1 and the formulae:
• Circumference of a circle = 2 r
• Speed = distance ÷ time
Show your working.
......................................................................................................................................
......................................................................................................................................
......................................................................................................................................
......................................................................................................................................
......................................................................................................................................
......................................................................................................................................
......................................................................................................................................
......................................................................................................................................
......................................................................................................................................
......................................................................................................................................
......................................................................................................................................
..................................................................................................................................[6]
r

14
© OCR 2018
4 Sosana is using an ammeter in the science laboratory.
She notices that the needle does not point exactly at zero (Fig. 4.1) even when not connected in a circuit.
Fig. 4.1
(a) (i) Describe what Sosana must do to avoid instrument error and measurement error.
Instrument error
......................................................................................................................................
......................................................................................................................................
Measurement error
......................................................................................................................................
......................................................................................................................................[2]

© OCR 2018 Turn over
15
(ii) The manufacturer of the ammeter (Fig. 4.1) claims that the meter is accurate to ±2% of the full scale reading.
The full scale reading is 12A, as shown in Fig. 4.1.
Calculate the uncertainty in the ammeter reading.
Show your working.
uncertainty = ± ………….... A [2]
16
© OCR 2018
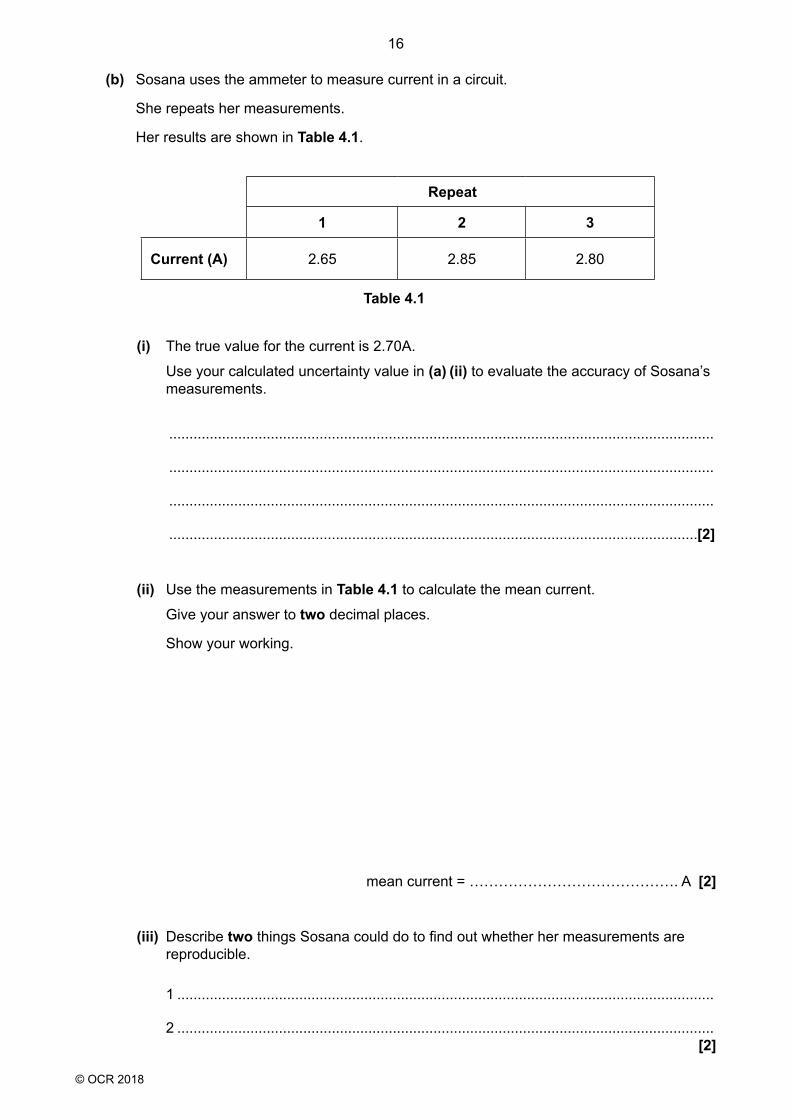
(b) Sosana uses the ammeter to measure current in a circuit.
She repeats her measurements.
Her results are shown in Table 4.1.
Repeat
1 2 3
Current (A) 2.65 2.85 2.80
Table 4.1
(i) The true value for the current is 2.70A.
Use your calculated uncertainty value in (a) (ii) to evaluate the accuracy of Sosana’s measurements.
......................................................................................................................................
......................................................................................................................................
......................................................................................................................................
..................................................................................................................................[2]
(ii) Use the measurements in Table 4.1 to calculate the mean current.
Give your answer to two decimal places.
Show your working.
mean current = ……………………………………. A [2]
(iii) Describe two things Sosana could do to find out whether her measurements are reproducible.
1 ....................................................................................................................................
2 ....................................................................................................................................[2]

© OCR 2018 Turn over
17
BLANK PAGE
PLEASE DO NOT WRITE ON THIS PAGE
Turn over for the next question

18
© OCR 2018
5 Gusti is a scientist working within a research team.
The team are investigating gamma radiation.
The effects of gamma radiation on the mortality (death) of mice is shown in Fig. 5.1.
• Mice were placed into three groups and received different daily exposures to gamma radiation.
• The percentage of survivors was plotted against time as shown in the graph below.
100
90
80
70
60
50
40
30
20
10
0150 300 450 600 750 900 1050
survivors(%)
time after start (days)
Fig. 5.1
Key for the three groups of mice
high daily dose of gamma radiation
control group – no exposure
low daily dose of gamma radiation

© OCR 2018 Turn over
19
(a) At 750 days after the start of exposure to gamma radiation, 60% of the mice receiving a low daily dose were still alive.
Calculate the gradient of the low dose graph at this point and give the units.
Show your working.
gradient = ……………… units = ……………… [4]
(b) (i) Use Fig 5.1 to draw conclusions about the effect of gamma radiation on the mortality of mice.
Justify your conclusions.
......................................................................................................................................
......................................................................................................................................
......................................................................................................................................
......................................................................................................................................
......................................................................................................................................
......................................................................................................................................
......................................................................................................................................
..................................................................................................................................[4]
(ii) Study the evidence provided in Fig. 5.1.
Identify the evidence needed to make your conclusions more secure.
......................................................................................................................................
......................................................................................................................................
......................................................................................................................................
......................................................................................................................................
......................................................................................................................................
..................................................................................................................................[3]

20
© OCR 2018
(c) Gusti plans to compare the results obtained from his investigation with secondary data sources.
Suggest one advantage and one disadvantage of using secondary data sources.
Advantage ............................................................................................................................
..............................................................................................................................................
Disadvantage ........................................................................................................................
..............................................................................................................................................[2]

© OCR 2018 Turn over
21
6 Samit works in a hospital microbiology laboratory.
He uses different growth media to identify microorganisms in samples sent for analysis.
(a) Samit uses selective, differential and enriched growth media to help to identify microorganisms.
Explain how each medium helps in the identification of bacteria.
(i) Selective media
......................................................................................................................................
......................................................................................................................................
......................................................................................................................................
..................................................................................................................................[3]
(ii) Differential media
......................................................................................................................................
......................................................................................................................................
......................................................................................................................................
..................................................................................................................................[3]
(iii) Enriched media
......................................................................................................................................
......................................................................................................................................
......................................................................................................................................
..................................................................................................................................[2]

22
© OCR 2018
(b) Samit uses Mannitol-Salt-Agar (MSA) to investigate the presence of the bacteria, Staphylococcus species.
Some of the constituents of this medium are shown in Table 6.1.
Constituent Information
Mannitol a sugar-alcohol fermented by some microorganisms to produce acidic products
Sodium chloride (7.5%) this concentration of salt is too high for the growth of most bacteria
Neutral red acid-base indicatorred at pH 7.4 and aboveyellow below pH 6.8
Table 6.1
(i) Which type of medium is MSA?
Put a tick () in the boxes next to the two correct answers.
differential
enriched
liquid
nutrient
selective
[1]

© OCR 2018 Turn over
23
(ii) Different species of Staphylococcus grow in a different way on MSA.
The growth of three species of Staphylococcus on MSA is shown in Table 6.2.
Key for growth + = less dense ++ = more dense
Species GrowthTolerant of high sodium chloride concentrations
Ability to ferment mannitol
Colony colour
Staphylococcus aureus + golden-yellow
Staphylococcus epidermidis ++ X white
Staphylococcus saprophyticus + white
Table 6.2
Samit receives samples of nose swabs collected from two patients.
Table 6.3 shows the results after inoculating and incubating MSA plates with samples from the nose swabs.
Source of nose swab sample Appearance of MSA plate
Patient 1 A few small yellow colonies with yellow zones around them
Patient 2 Many small white colonies on pink agar
Table 6.3
Consider the data provided in Tables 6.1, 6.2 and 6.3.
Identify the bacterium collected from each of the patients. Give evidence to support your conclusion.
Patient 1
Bacterium present ............................................
Evidence
......................................................................................................................................
......................................................................................................................................
..................................................................................................................................[3]
Patient 2
Bacterium present .............................................
Evidence
......................................................................................................................................
......................................................................................................................................
..................................................................................................................................[3]

24
© OCR 2018
7 Charlie is a science student. She was provided with samples from a mock crime scene:
• ink extracted from a hand-written note found at the scene
• ink extracted from the pen of suspect A and suspect B.
She used thin-layer chromatography (TLC) to separate the constituents of the three ink samples to identify the source of the crime scene ink.
Charlie scanned the TLC plates and circled the spots (Fig. 7.1) in her logbook.
Ink extracted from the hand-written note
Ink from the pen of suspect A Ink from the pen of suspect B
Fig. 7.1

© OCR 2018 Turn over
25
(a) Charlie wrote the following observations in her logbook.
The ink on the note was obviously a match to the ink from the pen of suspect B. The spots were in the same position.
I calculated the Rf values for each spot and compared them between the 3 samples.
This confirmed that the crime scene pen came from suspect B.
(i) Charlie asked some other students in her science group to review her results and conclusions.
Give the name of this type of review.
………………..……….…………………………………………………………………….[1]
(ii) The students suggested that Charlie should improve the validity of her conclusion.
Suggest two ways of improving the validity of Charlie’s conclusion.
1 ...…………………………………...…………………………………………………………
2 ....................................................................................................................................[2]
(iii) Charlie used scanned images and calculations in her logbook.
State three other ways of presenting data for scientific analysis.
1………………………...………………………………………………………………………
2………………………………...………………………………………………………………
3…………………………………………………...……………………………………………[3]
Rf value =distance moved by spot
distance moved by solvent
26
© OCR 2018
(b) Forensic scientists must record their findings in a ‘Forensic Scientist Report’.
This type of report may be referred to by the police and the judge and jury in a court of law.
The results of chromatographic analysis are often included in the Forensic Scientist Report.
When forensic scientists include findings of chromatographic analysis in their reports, suggest:
• What the report should include.
• The style it should be written in.
..............................................................................................................................................
..............................................................................................................................................
..............................................................................................................................................
..............................................................................................................................................
..........................................................................................................................................[4]
END OF QUESTION PAPER

© OCR 2018
27
ADDITIONAL ANSWER SPACE
If additional answer space is required, you should use the following lined page(s). The question number(s) must be clearly shown in the margin(s) – for example 1(a) or 2(b).
...........................................................................................................................................................
...........................................................................................................................................................
...........................................................................................................................................................
...........................................................................................................................................................
...........................................................................................................................................................
...........................................................................................................................................................
...........................................................................................................................................................
...........................................................................................................................................................
...........................................................................................................................................................
...........................................................................................................................................................
...........................................................................................................................................................
...........................................................................................................................................................
...........................................................................................................................................................
...........................................................................................................................................................
...........................................................................................................................................................
...........................................................................................................................................................
...........................................................................................................................................................
...........................................................................................................................................................
...........................................................................................................................................................
...........................................................................................................................................................
...........................................................................................................................................................
...........................................................................................................................................................
...........................................................................................................................................................
...........................................................................................................................................................
...........................................................................................................................................................
...........................................................................................................................................................
...........................................................................................................................................................

Oxford Cambridge and RSA
Copyright Information:OCR is committed to seeking permission to reproduce all third-party content that it uses in its assessment materials. OCR has attempted to identify and contact all copyright holders whose work is used in this paper. To avoid the issue of disclosure of answer-related information to candidates, all copyright acknowledgements are reproduced in the OCR Copyright Acknowledgements Booklet. This is produced for each series of examinations and is freely available to download from our public website (www.ocr.org.uk) after the live examination series.If OCR has unwittingly failed to correctly acknowledge or clear any third-party content in this assessment material OCR will be happy to correct its mistake at the earliest possible opportunity.For queries or further information please contact the Copyright Team, First Floor, 9 Hills Road, Cambridge CB2 1GE.OCR is part of the Cambridge Assessment Group. Cambridge Assessment is the brand name of University of Cambridge Local Examinations Syndicate (UCLES), which is itself a department of the University of Cambridge.
© OCR 2018
C342/1801