Unit 1 Scientific Method, Theories, & Graphing Data.
58
Unit 1 Scientific Method, Theories, & Graphing Data
-
Upload
colin-marsh -
Category
Documents
-
view
245 -
download
1
Transcript of Unit 1 Scientific Method, Theories, & Graphing Data.
Unit 1
Scientific Method,Theories, &
Graphing Data
1.1. List and describe the steps of the Scientific Method.List and describe the steps of the Scientific Method.
2.2. Explain why we need the Scientific Method.Explain why we need the Scientific Method.
3.3. Explain how and why theories change.Explain how and why theories change.
4.4. Analyze the parts of a scientific investigation. (SPI 3221.Inq.2)Analyze the parts of a scientific investigation. (SPI 3221.Inq.2)
5.5. Interpret graphs that depict real-world phenomena. Interpret graphs that depict real-world phenomena.
(SPI 3221.Math.3)(SPI 3221.Math.3)
6. 6. Determine why a conclusion is free of bias. (SPI 3221.Inq.6)Determine why a conclusion is free of bias. (SPI 3221.Inq.6)
7.7. Evaluate the accuracy and precision of data. (SPI 3221.Inq.4)Evaluate the accuracy and precision of data. (SPI 3221.Inq.4)
ObjectivesObjectives

Scientific Method
What do you know?!?!

In the beginning…
• Aristotle (384 BCE-322 BCE or
BC)• ancient Greek
philosopher
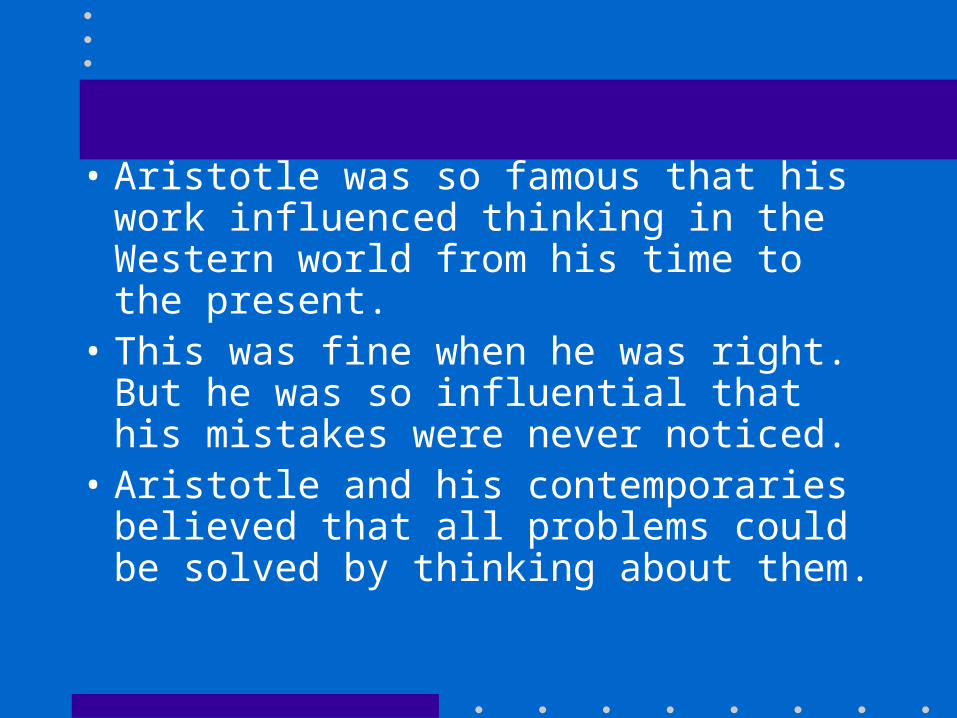
• Aristotle was so famous that his work influenced thinking in the Western world from his time to the present.
• This was fine when he was right. But he was so influential that his mistakes were never noticed.
• Aristotle and his contemporaries believed that all problems could be solved by thinking about them.
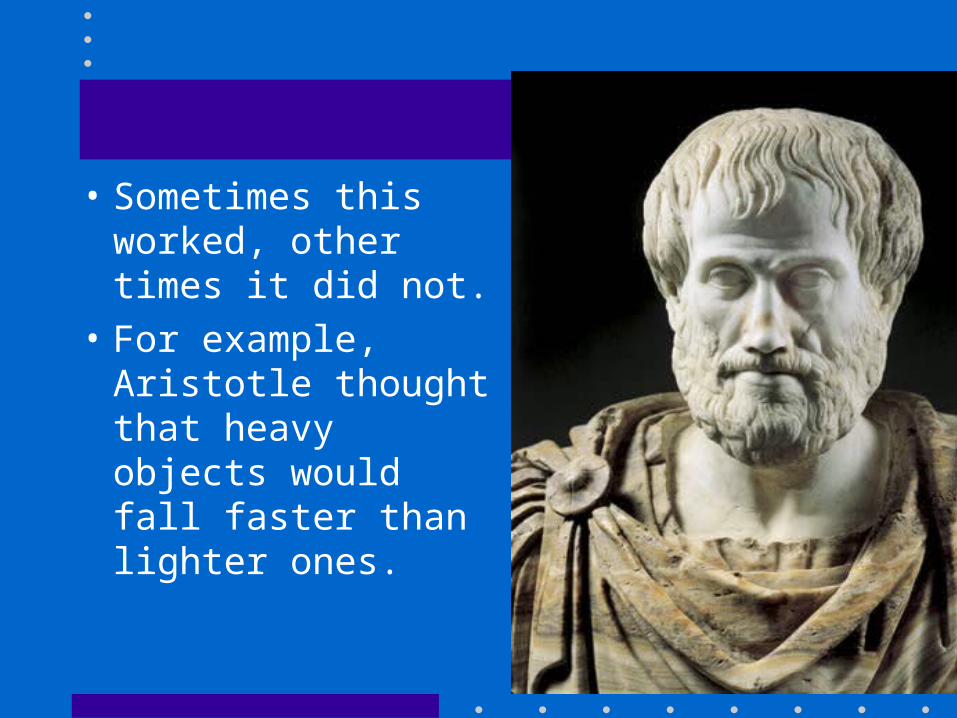
• Sometimes this worked, other times it did not.
• For example, Aristotle thought that heavy objects would fall faster than lighter ones.
• Now that does seem reasonable at first. And this is how “science” was done in ancient times.
• But what did Aristotle not do?• He never tested his ideas!• The world would have to wait
almost 2000 years for that to happen.
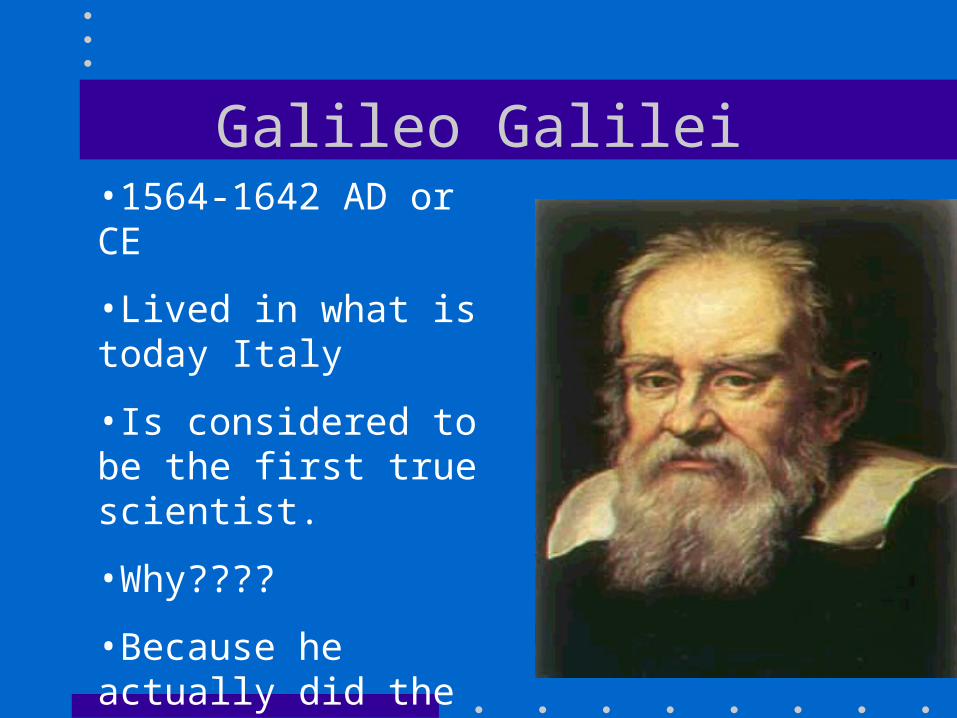
Galileo Galilei•1564-1642 AD or CE
•Lived in what is today Italy
•Is considered to be the first true scientist.
•Why????
•Because he actually did the experiment.
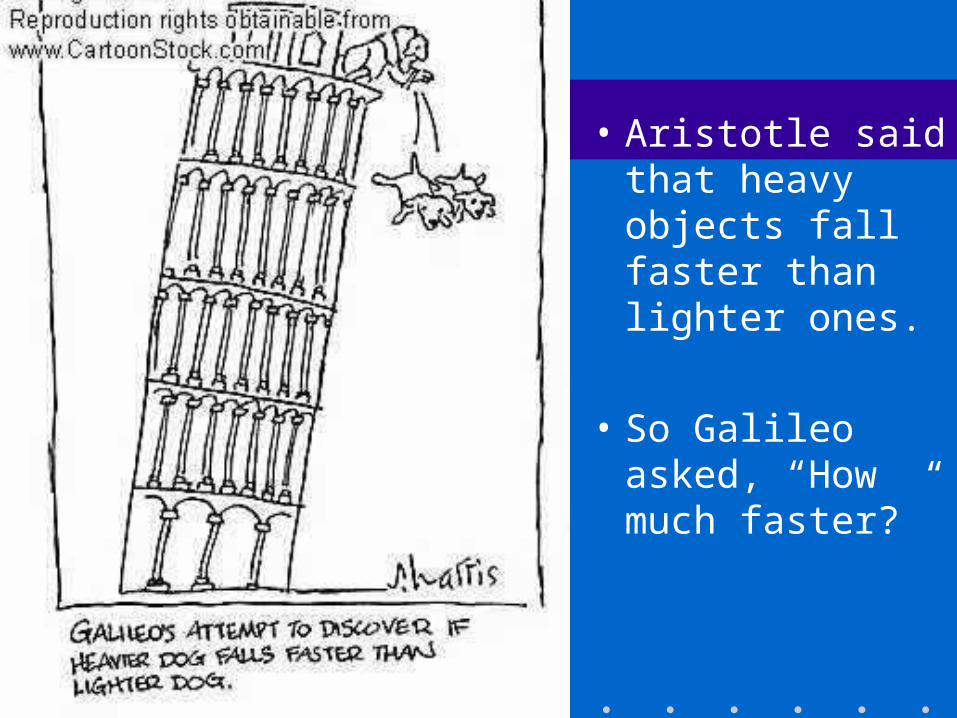
• Aristotle said that heavy objects fall faster than lighter ones.
• So Galileo asked, “How much faster?”

• So he sent students up to the top of a building and had them drop a heavy ball and a lighter one off at the same time. He had other students waiting below to measure the difference in time between the two hitting the ground.
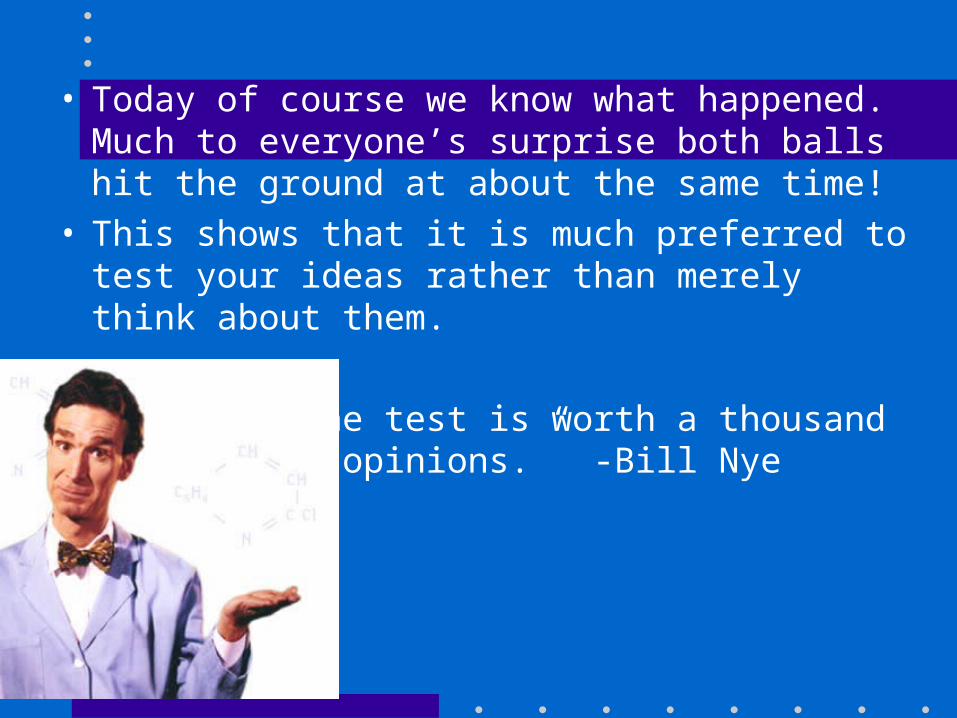
• Today of course we know what happened. Much to everyone’s surprise both balls hit the ground at about the same time!
• This shows that it is much preferred to test your ideas rather than merely think about them.
“One test is worth a thousand expert opinions.” -Bill Nye
Key Idea
• When conducting an experiment, change one factor and keep everything else exactly the same.
• The one thing you change is called the variable.
• All the things you keep the same are called controls.
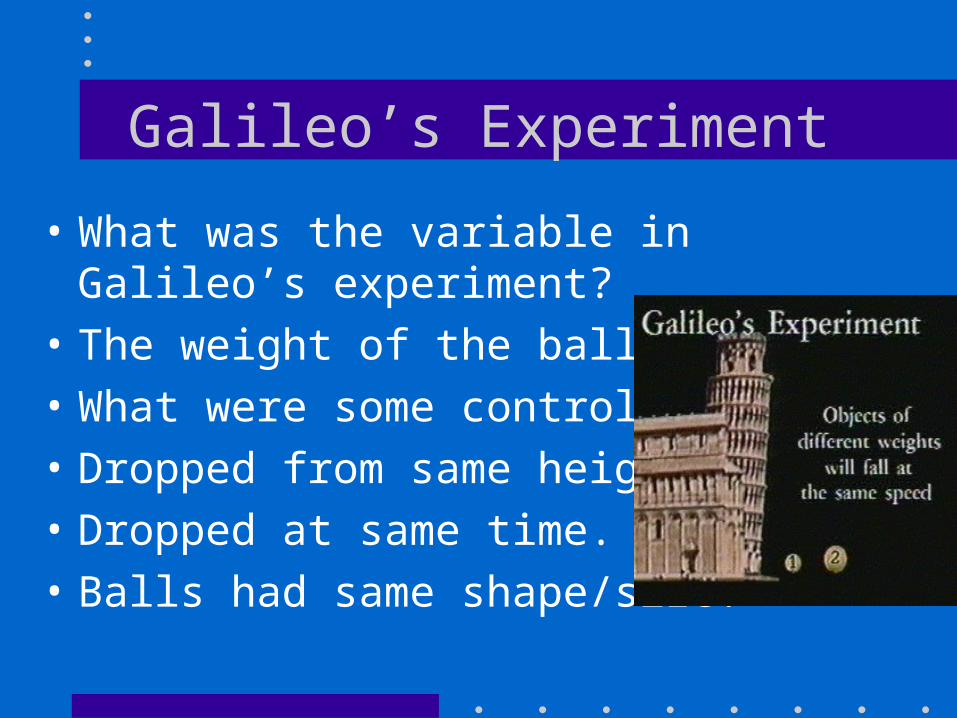
Galileo’s Experiment
• What was the variable in Galileo’s experiment?
• The weight of the balls.• What were some controls?• Dropped from same height.• Dropped at same time.• Balls had same shape/size.
Review 1Review 11.1. AristotleAristotle – smart guy, but didn’t test his
hypotheses
2.2. GalileoGalileo – smarter guy b/c he DID test his hypotheses
3.3. VariablesVariables – change
4.4. Controls Controls – stay the same
Activity 1Activity 11. In teams of 2, determine the controls and
variables of each experiment. Remember, some aspects are obvious while you will have to assume or dig deeper into other aspects. Good Luck!!!
*Keep this page, as we will be
doing more activities on it.*
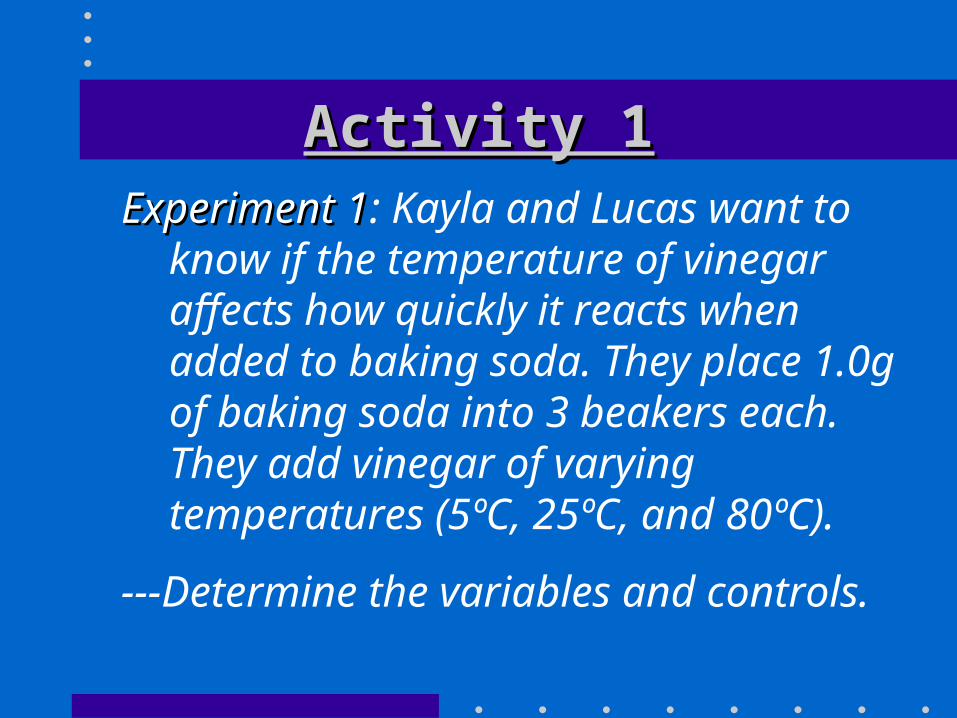
Activity 1Activity 1Experiment 1Experiment 1: Kayla and Lucas want to know
if the temperature of vinegar affects how quickly it reacts when added to baking soda. They place 1.0g of baking soda into 3 beakers each. They add vinegar of varying temperatures (5ºC, 25ºC, and 80ºC).
---Determine the variables and controls.
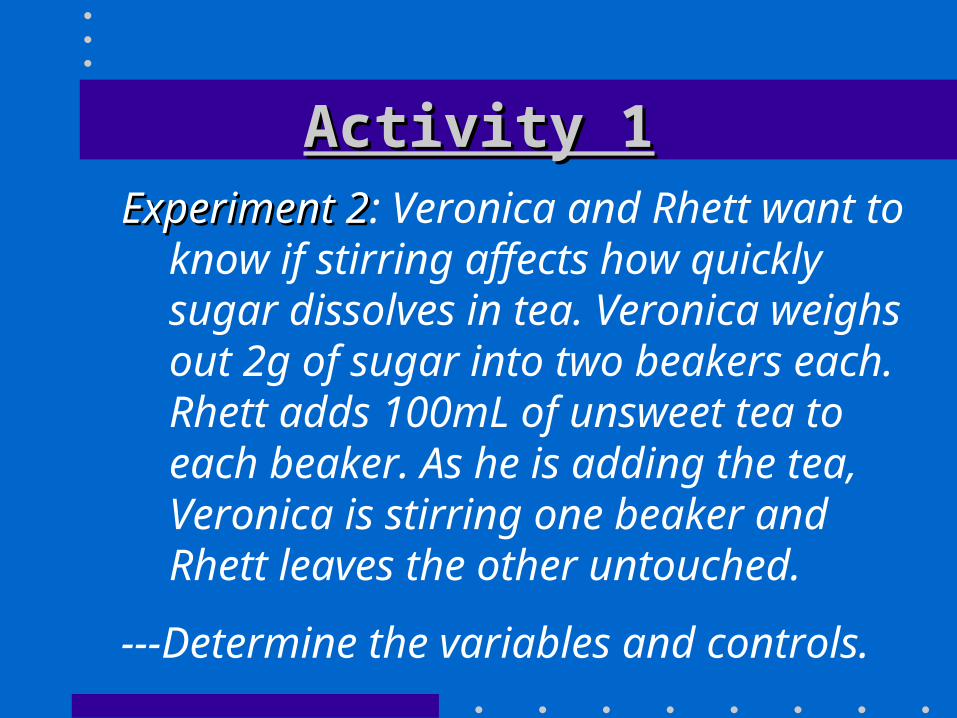
Activity 1Activity 1Experiment 2Experiment 2: Veronica and Rhett want to
know if stirring affects how quickly sugar dissolves in tea. Veronica weighs out 2g of sugar into two beakers each. Rhett adds 100mL of unsweet tea to each beaker. As he is adding the tea, Veronica is stirring one beaker and Rhett leaves the other untouched.
---Determine the variables and controls.
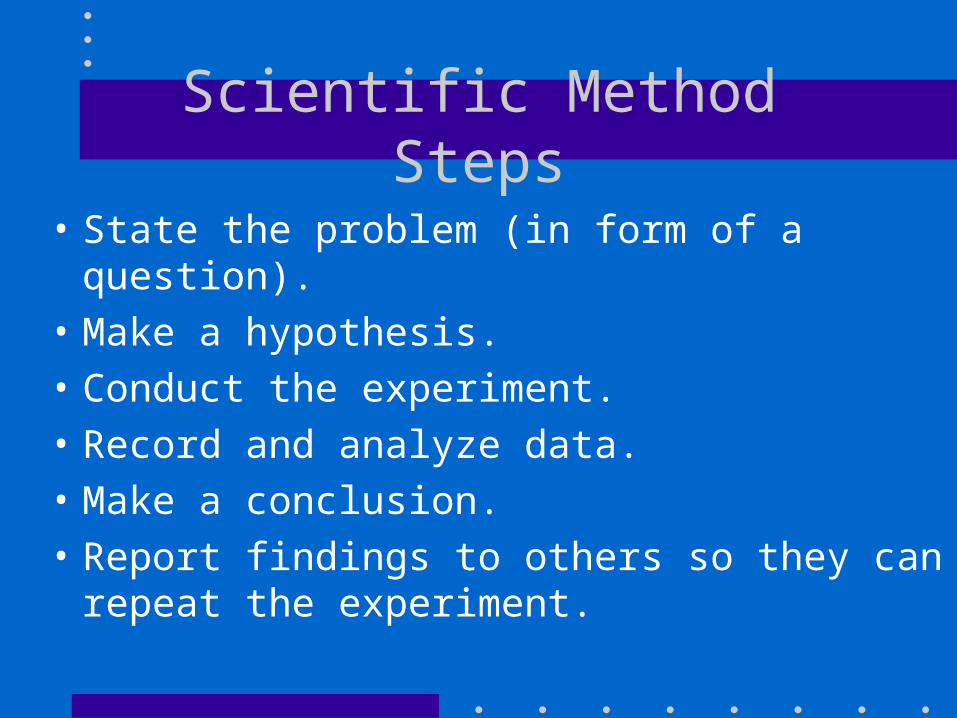
Scientific Method Steps
• State the problem (in form of a question).• Make a hypothesis.• Conduct the experiment.• Record and analyze data.• Make a conclusion.• Report findings to others so they can
repeat the experiment.

Hypothesis
• An educated guess• a prediction• Use “If”, “then” format• We predict that ifif we drop a ball
from a higher height, thenthen it will bounce higher.

Observations
• Observations: We use our senses to gather information about the world around us. There are two types of observations.– Qualitative – “quality”– Quantitative – “quantity”

Qualitative• Usually made with our senses. • Color, shape, feel, taste, sound.• Olivia is wearing a blue sweater.• The lab tabletop is smooth.
You describe this picture qualitatively…
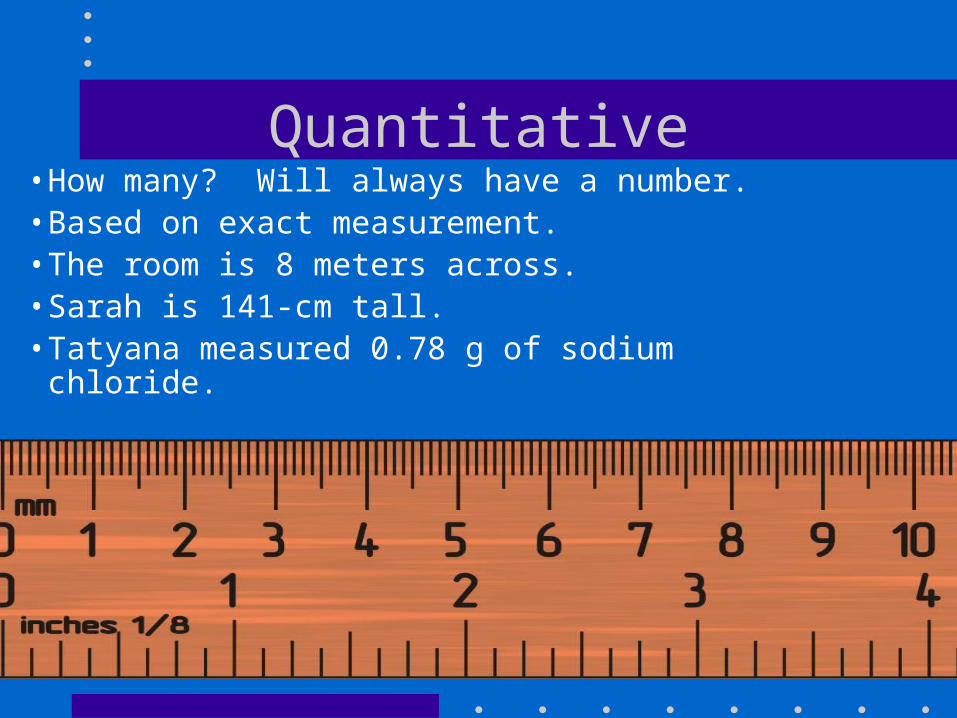
Quantitative•How many? Will always have a number.•Based on exact measurement.•The room is 8 meters across.•Sarah is 141-cm tall.•Tatyana measured 0.78 g of sodium chloride.
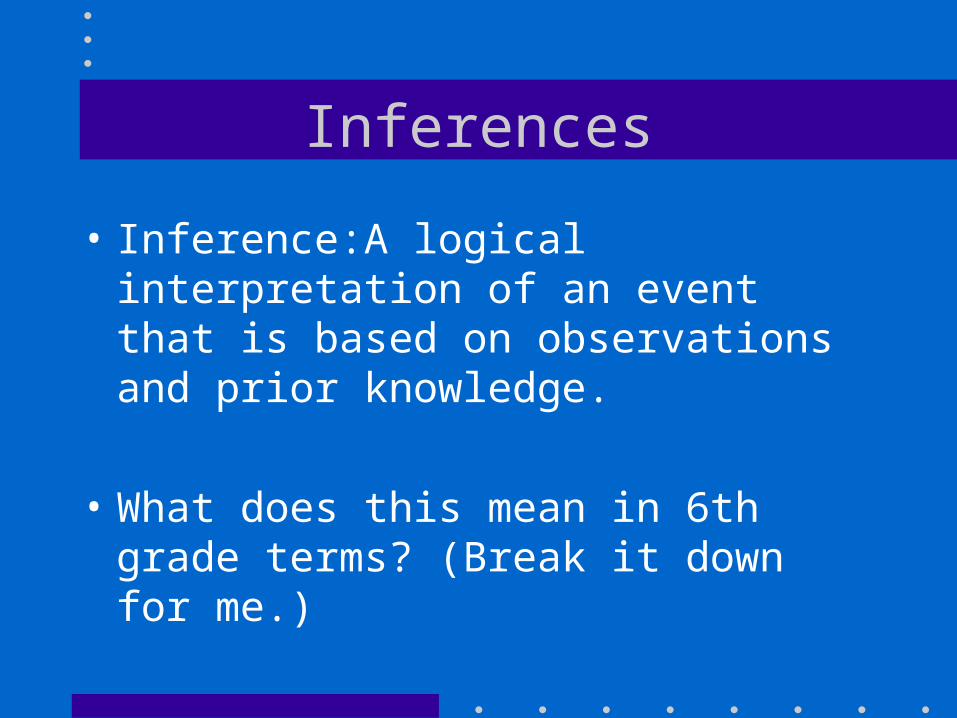
Inferences
• Inference:A logical interpretation of an event that is based on observations and prior knowledge.
• What does this mean in 6th grade terms? (Break it down for me.)

Making Inferences• You are at the counter in the office to
sign in late, and you see a student leave Mr. Nolan’s office crying and upset. We could make an inference as to why the student is upset……………– Could be in trouble (ISS, OSS, Coots!)– Family problems at home (sick,
accident)– Student not feeling well– Student has poor grades (failing,
retention)
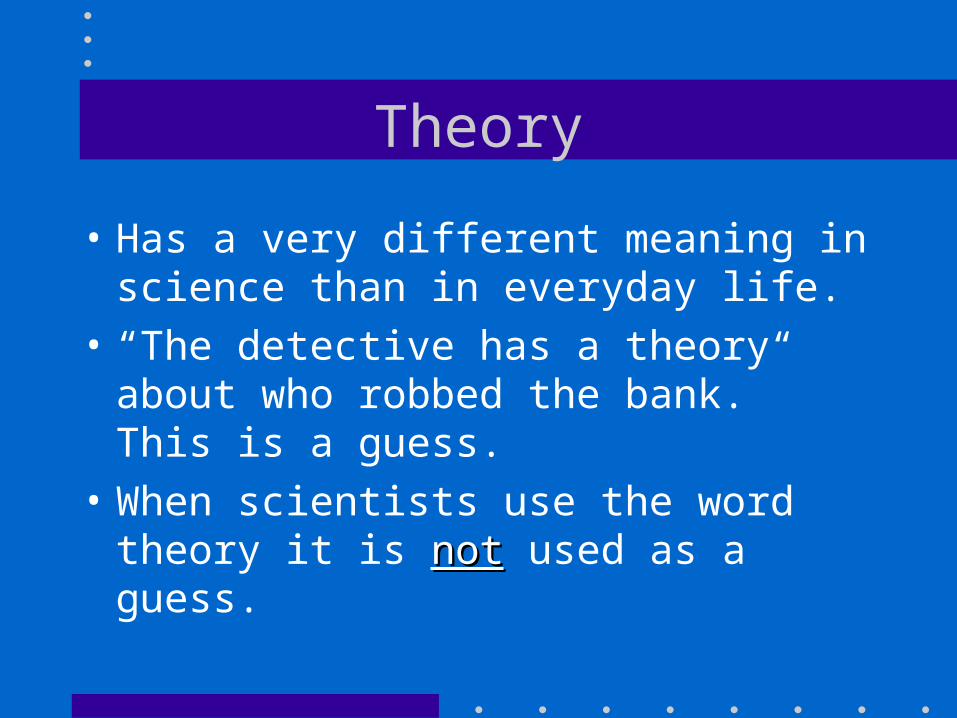
Theory
• Has a very different meaning in science than in everyday life.
• “The detective has a theory about who robbed the bank.” This is a guess.
• When scientists use the word theory it is notnot used as a guess.
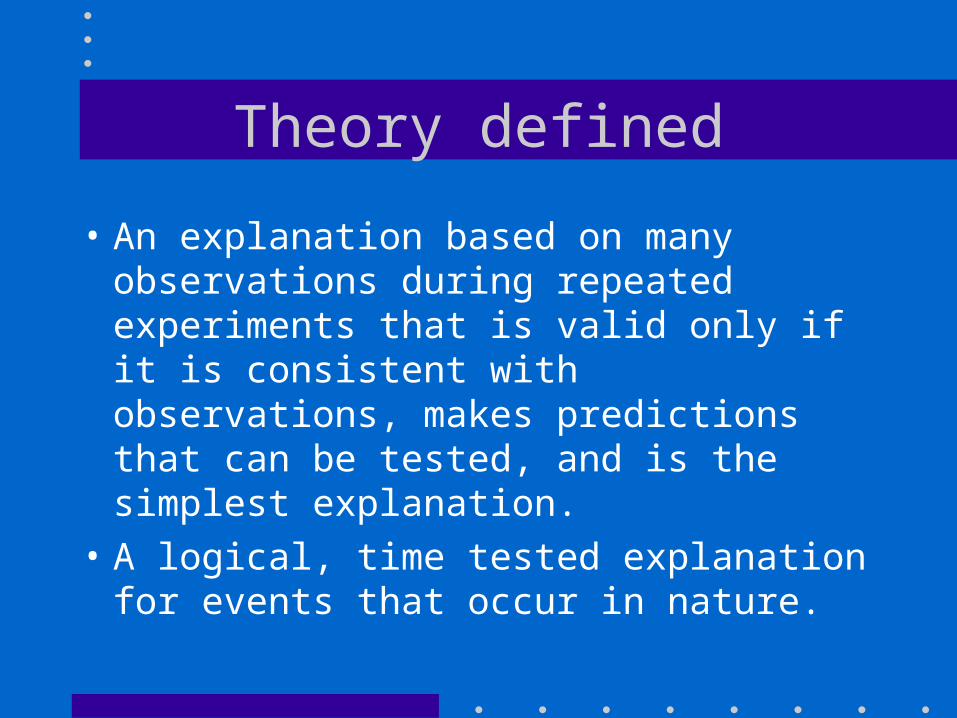
Theory defined
• An explanation based on many observations during repeated experiments that is valid only if it is consistent with observations, makes predictions that can be tested, and is the simplest explanation.
• A logical, time tested explanation for events that occur in nature.
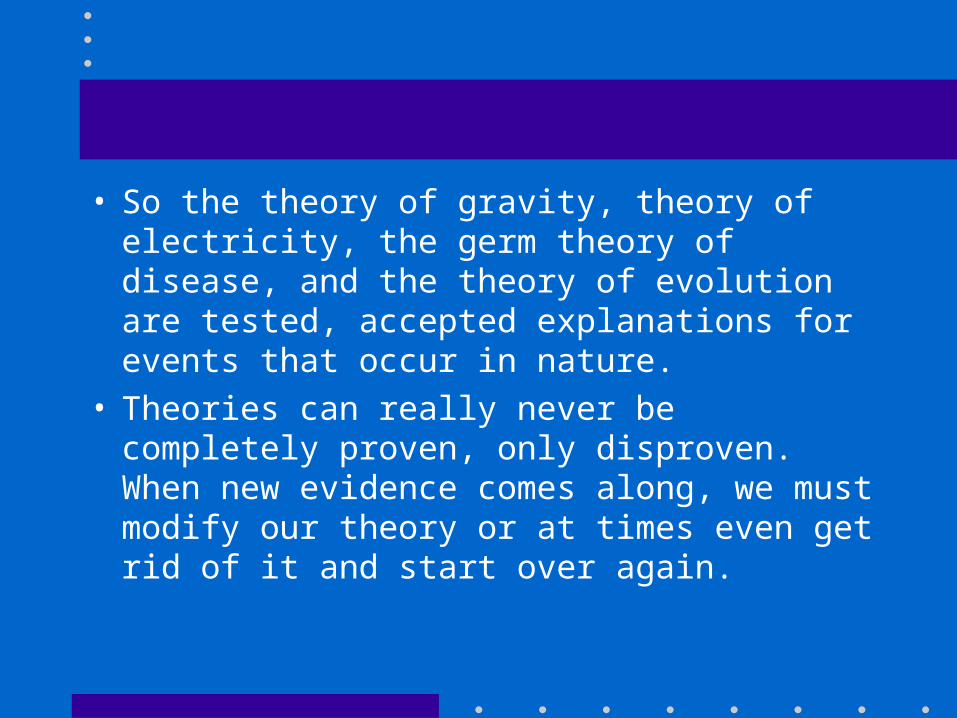
• So the theory of gravity, theory of electricity, the germ theory of disease, and the theory of evolution are tested, accepted explanations for events that occur in nature.
• Theories can really never be completely proven, only disproven. When new evidence comes along, we must modify our theory or at times even get rid of it and start over again.
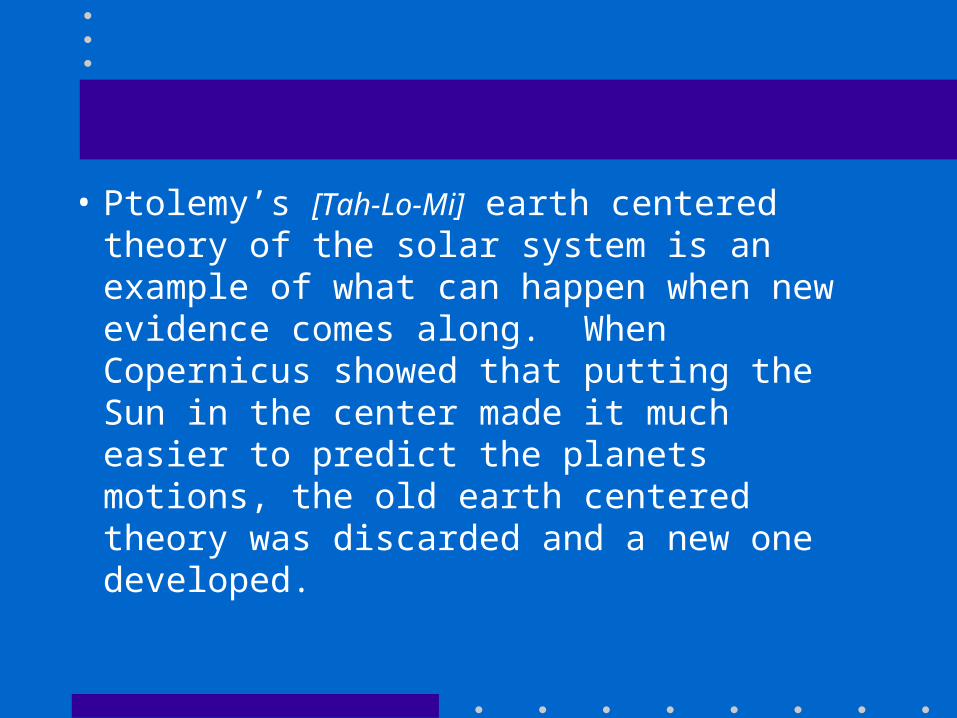
• Ptolemy’s [Tah-Lo-Mi] earth centered theory of the solar system is an example of what can happen when new evidence comes along. When Copernicus showed that putting the Sun in the center made it much easier to predict the planets motions, the old earth centered theory was discarded and a new one developed.
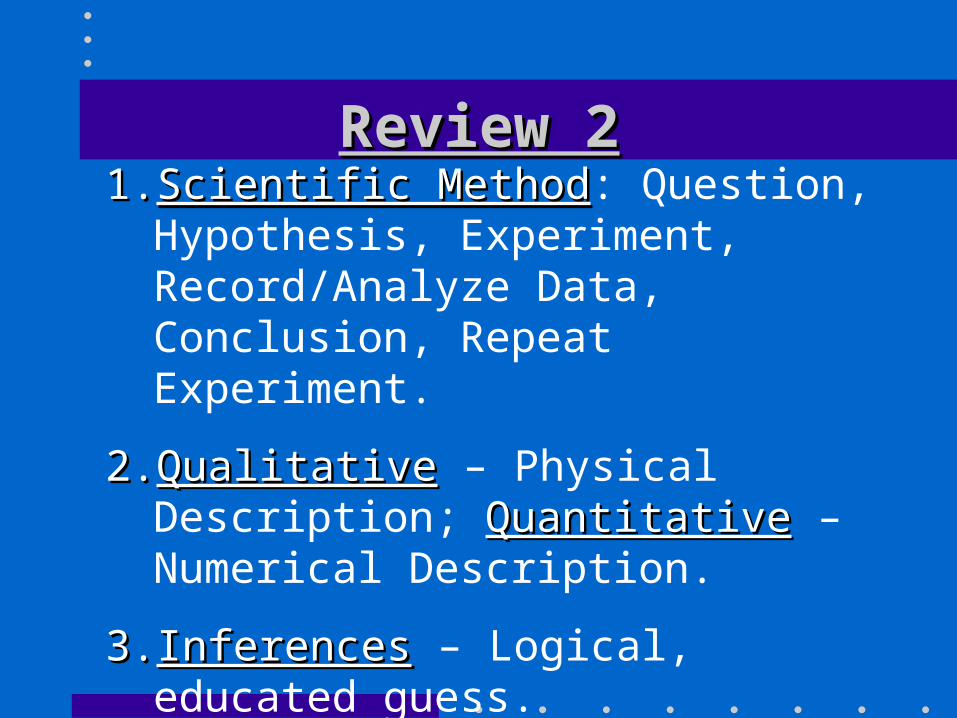
Review 2Review 21.1. Scientific MethodScientific Method: Question, Hypothesis,
Experiment, Record/Analyze Data, Conclusion, Repeat Experiment.
2.2. QualitativeQualitative – Physical Description; QuantitativeQuantitative – Numerical Description.
3.3. InferencesInferences – Logical, educated guess.
4.4. TheoryTheory – Simple explanation based on several observation and repeated experiments. Can be disproved.

Activity 2Activity 21. In the same teams of 2, read the experiment and
describe it in terms of the Scientific Method.
*** REMEMBER TO INCLUDE THE FOLLOWING ***
1) Question 2) Hypothesis (if-then) 3) Steps of the Experiment 4) Record Data in table/graph5) Analyze the Data
6) Form a Conclusion (based on your hypothesis7) Explain how you would change or modify the experiment if you repeat it.

Activity 2Activity 2ExperimentExperiment: Brandon and Megan planted 4 pea plants
in soils with varying pH (4, 6, 8,10). They thought the plant would grow best with pH=8. Everything besides pH of the soils remained the same throughout the experiment. The plant with pH=4 did not grow, pH=6 grew 6cm, pH=8 grew 1cm, and pH=10 did not grow.
1) Question 2) Hypothesis (if-then) 3) Steps of the Experiment 4) Record Data in table/graph5) Analyze the Data (full sentences)
6) Form a Conclusion (based on their hypothesis7) Modifications: Explain how you would change or modify the experiment if you repeat it.
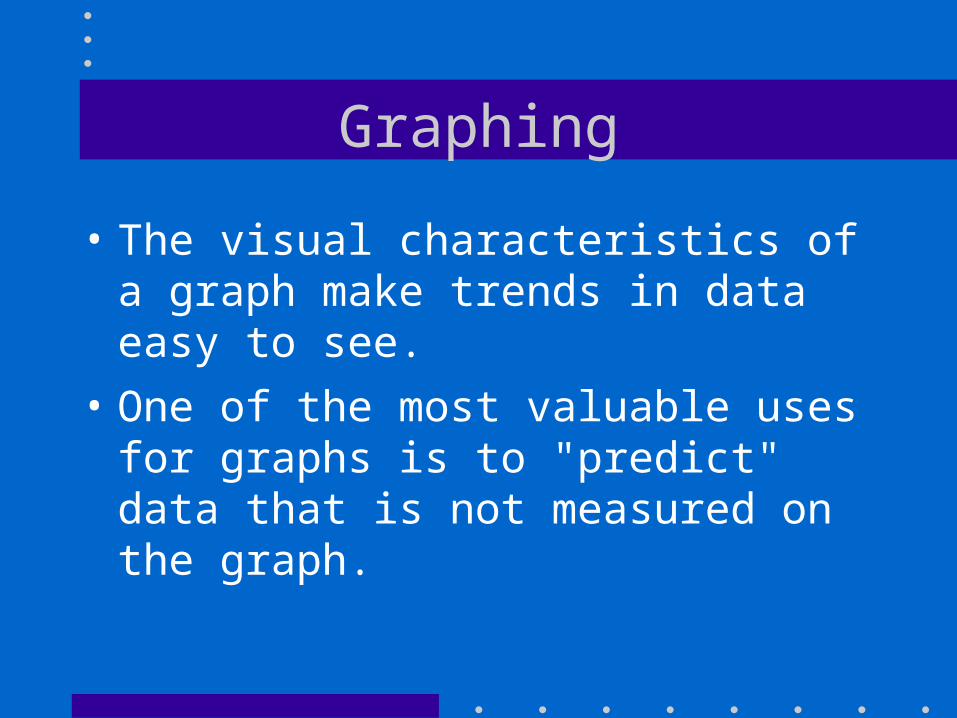
Graphing
• The visual characteristics of a graph make trends in data easy to see.
• One of the most valuable uses for graphs is to "predict" data that is not measured on the graph.
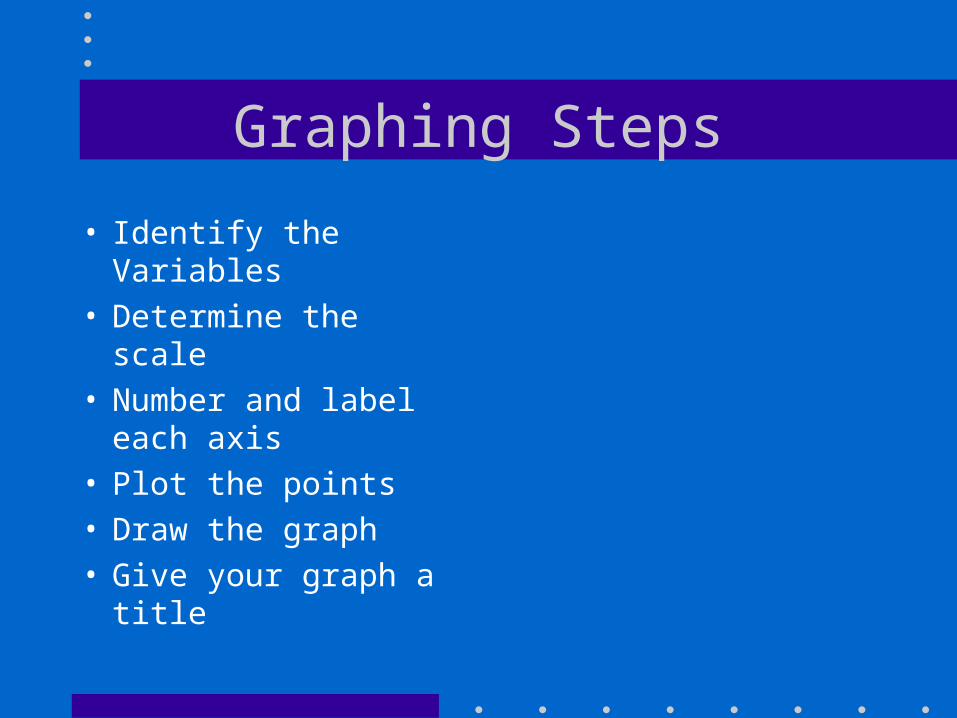
Graphing Steps
• Identify the Variables• Determine the scale• Number and label
each axis• Plot the points• Draw the graph• Give your graph a title
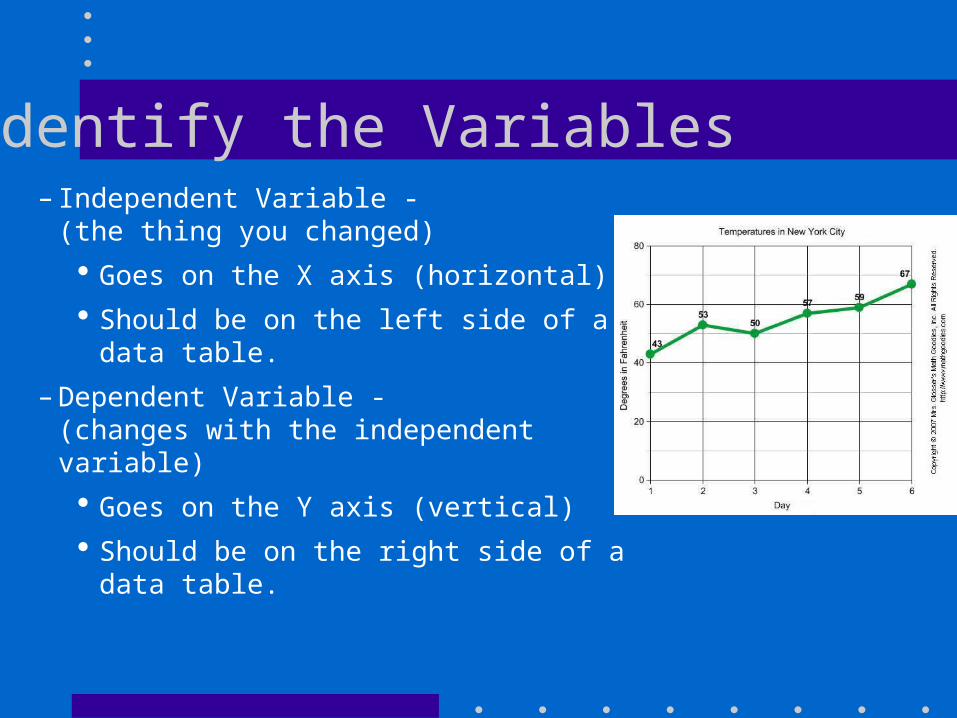
Identify the Variables– Independent Variable -
(the thing you changed) Goes on the X axis (horizontal) Should be on the left side of a data
table.
– Dependent Variable - (changes with the independent variable)
Goes on the Y axis (vertical) Should be on the right side of a data
table.

Day (x) Temp (y)
1 43
2 53
3 50
4 57
5 59
6 67
“Temperature (Y-axis) changes because of the Day (X-axis).”

Scale
– Determine a scale,(the numerical value for each square),that best fits the range of each variable.
– Spread the graph to use MOST of the available space.

Label Axes
• You need to tell everyone reading your graph what the graph means.
• Be sure to include units.

Plotting
• Plot each data value on the graph with a dot. You can put the data number by the dot, if it does not clutter your graph.

Day (x) Temp (y)
1 43
2 53
3 50
4 57
5 59
6 67
Scale?
Axes Labeled?
Plotted Points?

Drawing– Draw a curve
or a line that best fits the data points.
– Most graphs of experimental data are not drawn as "connect-the-dots".

Title• Your title should clearly tell what the graph is about
and be AS SPECIFIC AS POSSIBLE – ASAP!
Example:
“The Effects of Acid Rain on Blue-Green Algae During Spring and Fall Precipitation Cycles in Midwestern Colorado”
• If your graph has more than one set of data, provide a "key" to identify the different lines

Interpolation
• Interpolate: predicting data between two measured points on the graph. (Can be any point between data points…does not have to be the “midpoint”.)
• Think - Interstate …traveling between states.

Extrapolation
• Extrapolate: extending the graph, along the same slope, above or below measured data.
• Use a dotted line.
Think –
“Adding extra stuff”

What is Bias?What Is Bias?One kind of bias is a strong
opinion about something. You can be biased in favor of something or biased against it. In either case, you may have some facts to support your position, but a bias is based more on feelings and opinions than on facts. In some cases, bias results from a person’s past experiences.
Examples:
1. The pollution in our river is caused by the big factory upstream. The people who own the factory are only interested in making money. They don’t care about the environment at all. I heard about them from my friend Barry, and he knows what he’s talking about.
2. Every morning, my grandfather’s rooster crows when it is still dark. About five minutes later, the sun comes up. I don’t know how it works, but my grandfather’s rooster is responsible for the sunrise!

What is Bias?What Is Bias?One kind of bias is a strong
opinion about something. You can be biased in favor of something or biased against it. In either case, you may have some facts to support your position, but a bias is based more on feelings and opinions than on facts. In some cases, bias results from a person’s past experiences.
More Examples:
3. On the Internet, I learned about a place where aliens have secretly landed a spaceship on Earth. They’re going to take over the world, and when they do, they’ll put all of the redheaded people like me in charge. You’d better be nice to me!
4. Our new science textbook will be terrific! I have used other textbooks by the same company, and they are always well-written and accurate. One of the teachers at our school says this is the best textbook she’s ever used.

Accurate & Precise Data• Accuracy: how close a
measurement is to the correct answer.
• Precision: how close each measurement is to one another.

Accurate & Precise Data
• What do you think?

Accurate & Precise Data
• What do you think?

Review 3Review 31.1. GraphingGraphing: Identify variables, scale, number/label axes,
plot points, draw line, title.
2.2. Independent VariableIndependent Variable – you change, on x-axis. Dependent VariableDependent Variable – changes because of the independent, on y-axis.
3.3. InterpolateInterpolate – adding points to the middle. ExtrapolateExtrapolate – extending points past the end.
4.4. Bias Bias – prejudice, unfair conclusion.
5.5. AccurateAccurate – correct. PrecisionPrecision – how close to each other

Activity 3 Activity 3 Each person will complete this on his/her own piece of paper, but
you may work in the same teams of 2.
You will be given data from an experiment.You will be given data from an experiment.
Your FIRST task is to determine what the Independent Variable is and what the Dependent Variable is. Explain why you chose them.
Your SECOND task is to design a graph, plot the points, and label all parts of the graph using the data given to you.
Your THIRD task is to interpolate and extrapolate 2 points each on your graph. Be sure to show which points are from the data table and which are inter/extrapolated.

Activity 3 Activity 3
Reminder:Reminder:
1 – Dependent Variable, Independent Variable. Why?1 – Dependent Variable, Independent Variable. Why?
2 – Graph, Plot Points, Label.2 – Graph, Plot Points, Label.
3 – Interpolate 2 points, Extrapolate 2 points3 – Interpolate 2 points, Extrapolate 2 points
ExperimentExperiment: :
Kierra and Logan want to know how salt affects the freezing point of water/ice. They think since salt is used to melt icy roads, the salt must lower the freezing point of the water. They test their hypothesis by taking the temperature of an ice-water solution compared to an ice-water-salt solution over 2.5 minutes. Here are their results:
TimeTime No No SaltSalt
With With SaltSalt
30s30s 6ºC 0ºC
60s60s 5ºC -5ºC
90s90s 4ºC -10ºC
120s120s 3ºC -15ºC
150s150s 2ºC -20ºC

Activity 3 Activity 3
Reminder:Reminder:
1 – Dependent Variable, Independent Variable. Why?1 – Dependent Variable, Independent Variable. Why?
2 – Graph, Plot Points, Label.2 – Graph, Plot Points, Label.
3 – Interpolate 2 points, Extrapolate 2 points3 – Interpolate 2 points, Extrapolate 2 points
Dependent Variable:Dependent Variable: TemperatureTemperature
Independent Variable:Independent Variable: Time – or – Salt Time – or – Salt
WHY?!?!WHY?!?!
TimeTime No No SaltSalt
With With SaltSalt
30s30s 6ºC 0ºC
60s60s 5ºC -5ºC
90s90s 4ºC -10ºC
120s120s 3ºC -15ºC
150s150s 2ºC -20ºC

Activity 3 Activity 3
Reminder:Reminder:
1 – Dependent Variable, Independent Variable. Why?1 – Dependent Variable, Independent Variable. Why?
2 – Graph, Plot Points, Label.2 – Graph, Plot Points, Label.
3 – Interpolate 2 points, Extrapolate 2 points3 – Interpolate 2 points, Extrapolate 2 points
TimeTime No No SaltSalt
With With SaltSalt
30s30s 6ºC 0ºC
60s60s 5ºC -5ºC
90s90s 4ºC -10ºC
120s120s 3ºC -15ºC
150s150s 2ºC -20ºC
The Effects of Freezing Point on H2O when Salt is Introduced
-25-20-15-10-505
10
0 50 100 150 200
Time (sec)
Tem
per
atu
re
(deg
rees
Cel
siu
s)
NO SaltWITH Salt

Activity 3 Activity 3
The Effects of Freezing Point on H2O when Salt is Introduced
-25-20-15-10
-505
10
0 50 100 150 200
Time (sec)
Tem
per
atu
re
(deg
rees
Cel
siu
s)
NO SaltWITH Salt

Activity 3 Activity 3
Reminder:Reminder:
1 – Dependent Variable, Independent Variable. Why?1 – Dependent Variable, Independent Variable. Why?
2 – Graph, Plot Points, Label.2 – Graph, Plot Points, Label.
3 – Interpolate 2 points, Extrapolate 2 points3 – Interpolate 2 points, Extrapolate 2 points
Now Interpolate and ExtrapolateNow Interpolate and Extrapolate1.1. Draw a line of “Best Fit” for each set.Draw a line of “Best Fit” for each set.2.2. Interpolate:Interpolate:
- Pick two points on each line, - Pick two points on each line, label.label.
3. 3. Extrapolate:Extrapolate:- Continue your lines out - Continue your lines out
farther.farther.- Pick two points past 150 - Pick two points past 150
seconds seconds on that line.on that line.
TimeTime No No SaltSalt
With With SaltSalt
30s30s 6ºC 0ºC
60s60s 5ºC -5ºC
90s90s 4ºC -10ºC
120s120s 3ºC -15ºC
150s150s 2ºC -20ºC

Activity 3 Activity 3 The Effects of Freezing Point on H2O
when Salt is Introduced
-40
-30
-20
-10
0
10
0 50 100 150 200 250
Time (sec)
Tem
pera
ture
(d
egre
es C
elsi
us)

1.1. List and describe the steps of the Scientific Method.List and describe the steps of the Scientific Method.
2.2. Explain why we need the Scientific Method.Explain why we need the Scientific Method.
3.3. Explain how and why theories change.Explain how and why theories change.
4.4. Analyze the parts of a scientific investigation. (SPI 3221.Inq.2)Analyze the parts of a scientific investigation. (SPI 3221.Inq.2)
5.5. Interpret graphs that depict real-world phenomena. Interpret graphs that depict real-world phenomena.
(SPI 3221.Math.3)(SPI 3221.Math.3)
6. 6. Determine why a conclusion is free of bias. (SPI 3221.Inq.6)Determine why a conclusion is free of bias. (SPI 3221.Inq.6)
7.7. Evaluate the accuracy and precision of data. (SPI 3221.Inq.4)Evaluate the accuracy and precision of data. (SPI 3221.Inq.4)
Review of ObjectivesReview of Objectives

1.1. List and describe the steps of the Scientific Method.List and describe the steps of the Scientific Method.
2.2. Explain why we need the Scientific Method.Explain why we need the Scientific Method.
3.3. Explain how and why theories change.Explain how and why theories change.
4.4. Interpret and/or construct a graph that depicts real-world Interpret and/or construct a graph that depicts real-world phenomena. phenomena.
5.5. Describe an object qualitatively and quantitatively.Describe an object qualitatively and quantitatively.
6.6. Determine independent and dependent variables.Determine independent and dependent variables.
6.6. Determine why a conclusion is biased or free of bias. Determine why a conclusion is biased or free of bias.
7.7. Evaluate the accuracy and precision of data.Evaluate the accuracy and precision of data.
8.8. Be able to interpolate/extrapolate data.Be able to interpolate/extrapolate data.
What Can I Expect on the Test?What Can I Expect on the Test?


![[Ioannis Votsis] the Epistemological Status of Scientific Theories](https://static.fdocuments.net/doc/165x107/55cf944f550346f57ba120ee/ioannis-votsis-the-epistemological-status-of-scientific-theories.jpg)