Uniaxial tension-compression fatigue behavior and fiber ...
44
Instructions for use Title Uniaxial tension-compression fatigue behavior and fiber bridging degradation of strain hardening fiber reinforced cementitious composites Author(s) Matsumoto, Takashi; Wangsiripaisal, Kavalin; Hayashikawa, Toshiro; He, Xingwen Citation International Journal of Fatigue, 32(11), 1812-1822 https://doi.org/10.1016/j.ijfatigue.2010.04.012 Issue Date 2010-11 Doc URL http://hdl.handle.net/2115/45420 Type article (author version) File Information IJF32-11_1812-1822.pdf Hokkaido University Collection of Scholarly and Academic Papers : HUSCAP
Transcript of Uniaxial tension-compression fatigue behavior and fiber ...

Instructions for use
Title Uniaxial tension-compression fatigue behavior and fiber bridging degradation of strain hardening fiber reinforcedcementitious composites
Author(s) Matsumoto, Takashi; Wangsiripaisal, Kavalin; Hayashikawa, Toshiro; He, Xingwen
Citation International Journal of Fatigue, 32(11), 1812-1822https://doi.org/10.1016/j.ijfatigue.2010.04.012
Issue Date 2010-11
Doc URL http://hdl.handle.net/2115/45420
Type article (author version)
File Information IJF32-11_1812-1822.pdf
Hokkaido University Collection of Scholarly and Academic Papers : HUSCAP

1
Uniaxial tension-compression fatigue behavior and fiber bridging degradation of stain hardening fiber
reinforced cementitious composites
Takashi Matsumotoa*, Kavalin Wangsiripaisalb, Toshiro Hayashikawaa, Xingwen Hea
a Division of Built Environment, Graduate School of Engineering, Hokkaido University, Sapporo,
060-8628, Japan
b Department of Civil Engineering, Graduate School of Engineering, University of Tokyo, Tokyo,
113-8656, Japan
* Corresponding author. Division of Built Environment, Graduate School of Engineering, Hokkaido
University, Sapporo, 060-8628, Japan Tel: +81-11-706-6171 Fax: +81-11-706-6172 Email:
Abstract
This study aims to clarify experimentally the uniaxial tension-compression fatigue behavior and fiber
bridging stress degradation of strain hardening fiber reinforced cementitious composites. During fatigue
cyclic loading, tensile bridging stress corresponding to the preset maximum tensile strain was recorded
with the number of cycles in order to observe the degradation of the tensile bridging stress. Major
bridging stress degradation was observed before reaching 1,000 cycles, and microscopic observation of
the failure surface confirmed severe fiber damages. Fitting curves of bridging stress degradation are

2
proposed with the idea of Weibull distribution. The preliminary results of the current study with a
limited number of specimens are compared with those of a uniaxial tensile fatigue study, and the
differences of bridging stress degradations are discussed.
Keywords: Fiber reinforced material; Strain hardening; Fiber bridging; Strain controlled fatigue;
Compressive loading
3
1. Introduction
Fiber reinforced cementitious composites (FRCC) are increasingly applied to structural applications
such as tunnel lining, pavement, overlay, bridge deck overlay, railroad sleepers, and factory floor slab
(Horii et al. [1], Rizkalla and Mufti [2], Shirazi et al. [3], Strand et al. [4], Krstulovic-Opara et al. [5],
Balaguru [6]). These applications utilize high strength, ductility, and crack resistance of FRCCs in
tension, for the purpose of increasing the safety and durability of structures. It is well known that these
beneficial properties are due to bridging fibers that transfer stresses across a crack. Since there are
various kinds of fibers and choices of fiber dimensions in order to obtain suitable properties of an FRCC,
it is important to understand a fiber bridging constitutive law which is the relation between fiber bridging
stress and crack opening displacement (Li [7]).
In addition to conventional FRCCs, strain hardening fiber reinforced cementitious composites
(SHFRCC) have been investigated recently (Kunieda and Rokugo [8]). This new class of material was
developed with the micromechanical understanding of fiber bridging (Li and Leung [9]), and it acquires
the following remarkable properties (Li [10], Li [11]). SHFRCC exhibits superior tensile properties to
conventional FRCC. SHFRCC shows strain hardening behavior under tension, and its tensile strain can
reach as high as 6 %. This high tensile strain capacity is due to the formation of distributed multiple fine
cracks. Moreover, the width of multiple fine cracks remains below 100 µm during the strain hardening

4
process, and this small crack width is beneficial for the increased durability of structures. These unique
properties are made possible with relatively moderate amount of fibers: usually 2 vol. % of fibers. A
typical composition includes cement, water, and sand with the ratio of 1:0.45: 0.5-1.2 (Li et al. [12]).
Compared to conventional FRCCs, SHFRCC is a ductile and durable cementitious composite, and its
properties are unique and superior.
With these superior properties, SHFRCC has been applied to various structures to date (Kunieda and
Rokugo [8]). Examples include coupling beams of a reinforced concrete building for earthquake
resistance and surface repair of a bridge and a retaining wall made of reinforced concrete against alkali
silica reaction or carbonation. The former example utilizes the ductility of SHFRCC, while the latter
utilizes the multiple fine cracks.
In addition to these applications, SHFRCC is finding applications to fatigue intensive structures. For
example, it is reported that SHFRCC was applied to link slab of a bridge and also to patch repair of
concrete pavement (Kim et al. [13], Li [14]). These applications are intended against traffic load, and
the fatigue properties of SHFRCC are intended to be utilized. In order to secure the fatigue performance
of SHFRCC structures, it is necessary to confirm that the superior properties of SHFRCC are not negated
even under or after fatigue loads.
However, there are not many studies about the fatigue properties of SHFRCC. The fatigue properties
of SHFRCC have been investigated so far under flexure and tension by a limited number of studies.

5
Flexural fatigue properties of SHFRCC have been investigated intensively by Suthiwarapirak et al. [15],
Matsumoto et al. [16], and Suthiwarapirak et al. [17]. These studies conducted four point flexural
fatigue tests on two types of SHFRCC in comparison with two types of polymer cement mortar and one
type of steel fiber reinforced cement. The results showed that both SHFRCCs exhibited a unique fatigue
stress-life relationship that is represented by a bilinear function on a semi-logarithmic scale, and that these
materials exhibited higher fatigue strength in the comparison. Also, it was confirmed that the failure
mechanisms of these SHFRCCs involved the development of multiple cracks that was followed by a
localized crack at final fracture, although the development level of multiple cracks was dependent on
fatigue stress level.
Tensile fatigue has been investigated by Matsumoto et al. [18] with the focus on bridging stress
degradation. In the study, uniaxial tensile fatigue experiment was conducted under constant strain
amplitude, unlike ordinary fatigue experiments under constant stress amplitude, and the degrading
bridging stress was measured with the number of cycles. The resulting relation, hereinafter called
bridging stress degradation, showed gradual decrease initially up to 1,000 cycles, sudden drop from 1,000
to 10,000 cycles, and ceasing around 10,000 cycles. It was also found that bridging stress degradation
was due to the loss of fibers triggered by fiber fatigue rupture.
Based on the fatigue characteristics under flexure and tension, an analytical study also has been
conducted by Suthiwarapirak and Matsumoto [19] with the concept of fiber bridging degradation. This

6
is a study that further developed the previous studies by Li and Matsumoto [20]and Matsumoto and
Li[21]. The study employed finite element method to analyze the fatigue behavior of SHFRCC, and
successfully reproduced fatigue crack propagation and subsequent fracture. Theoretically reproduced
S-N diagrams and deformation behaviors showed a good agreement, supporting the validity of
aforementioned studies.
All above fatigue studies were conducted either for flexure or tension. Those studies show that the
tested SHFRCCs exhibit superior performances to FRCC, and that bridging stress degradation explains
the fatigue behavior of SHFRCC. If cracks in structures are cyclically loaded under tension range, these
studies support the usage of SHFRCC for fatigue intensive structures.
However, this may not be the case sometimes. In some structures, cracks can be cyclically loaded
under tension and compression range. Tension-compression fatigue can be possible in members where
fully reversed fatigue loads are present, and, in such a loading condition, more severe damages of
SHFRCC can be expected. To date, this has not been investigated quantitatively.
Therefore, this study aims to clarify the behavior and degradation of SHFRCCs under uniaxial
tension-compression fatigue loading. The experiment is conducted under constant strain amplitude that
induces crack open, closure, and compression. The degrading bridging stress is measured with the
number of cycles. The resulting bridging stress degradation of tension-compression fatigue will be
compared with that of tensile fatigue, and the mechanisms of bridging stress degradation will be
7
discussed.
2. Tension-compression fatigue experiment
2.1 Materials and specimens
Static and fatigue specimens of SHFRCC that is reinforced with polyvinyl alcohol (PVA) fibers were
fabricated. The properties of PVA fibers are shown in Table 1. In the experiment, two mixes were used,
and their mix proportion is shown in Table 2. While Mix A included normal fine aggregates, Mix B
replaced fine aggregates partially with light weight aggregates. The light weight aggregates are made of
ceramic, and they have a balloon shape, i.e. empty inside. The purpose of Mix B is to reduce its matrix
fracture toughness so that composite ductility can be enhanced. The compressive strength was
measured: 46.5 MPa for Mix A and 38.0 MPa for Mix B.
Specimen dimensions are shown in Fig. 1. The specimen dimensions are designed in order to control
the initiation of cracks in a specific area and to eliminate the overall failure of a specimen at or near the
grip. Namely, the cross sectional area is gradually reduced from 100 mm square at both ends to 100 mm
by 60 mm at the center, and it is constant over the central 100 mm length. Within this constant cross
sectional zone, multiple cracks are intended to initiate and grow. At both ends, the cross sectional area is
also constant in order to have bonding to loading grips. The total length of a specimen is 400 mm.

8
Fig. 1. Shape and dimensions of specimens.
The tested SHFRCC was made from a premix package, and the specimens were fabricated by a
spraying method. First, all materials were prepared according to the mix proportions of Table 2.
Second, admixtures were mixed with water, and premix of cement and PVA fibers were mixed in a mixer
with the water including admixtures. Third, fresh SHFRCC was pumped into a spray gun, and it was
sprayed into formworks. Finally, the surface of fresh specimens was leveled with a trowel. After the
fabrication, all the specimens were demolded one day after, and they were cured under the constant
temperature of 20 degrees Celsius. The age of specimens at either static or fatigue test was at least 28
100 mm 100 mm
30 mm
120 mm
100 mm
120 mm
30 mm
60 mm 400 mm
9
days. In total, 13 specimens were prepared: 9 for Mix A and 4 for Mix B.
2.2 Experimental setup
Before the experimental setup, specimens were painted with a white color spray paint so that cracks
could be identified and observed easily. Then, epoxy adhesive was used for bonding the ends of a
specimen to upper and lower loading grip. The loading grip has four side plates with height of 50 mm in
order to have enough stress-transferred area. Moreover, the plates are designed to have grooves so that
mechanical bond works as well. Two to three hours were needed to gain enough bond strength between
the grips and the specimen.
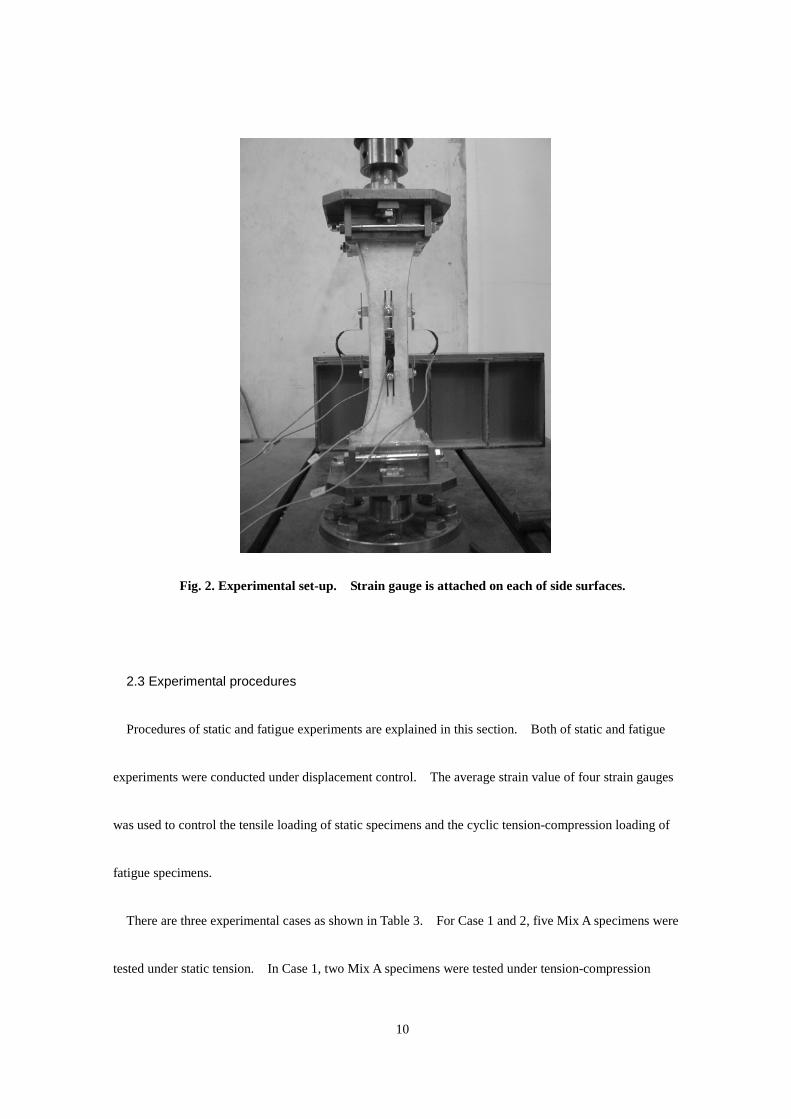
For data acquisition, four strain gauges were carefully attached with accurate alignment on the four
side surfaces (Fig. 2). These gauges have 100 mm of gauge length, therefore they have enough length to
cover the central constant cross sectional zone. These gauges were attached in order to measure the
tensile and compressive strain over the central zone and to control the static and fatigue loading
sequences under displacement control. In addition to the four strain gauges, load and stroke
displacement were also obtained from the 200 kN capacity feed back controlled loading machine.
10
Fig. 2. Experimental set-up. Strain gauge is attached on each of side surfaces.
2.3 Experimental procedures
Procedures of static and fatigue experiments are explained in this section. Both of static and fatigue
experiments were conducted under displacement control. The average strain value of four strain gauges
was used to control the tensile loading of static specimens and the cyclic tension-compression loading of
fatigue specimens.
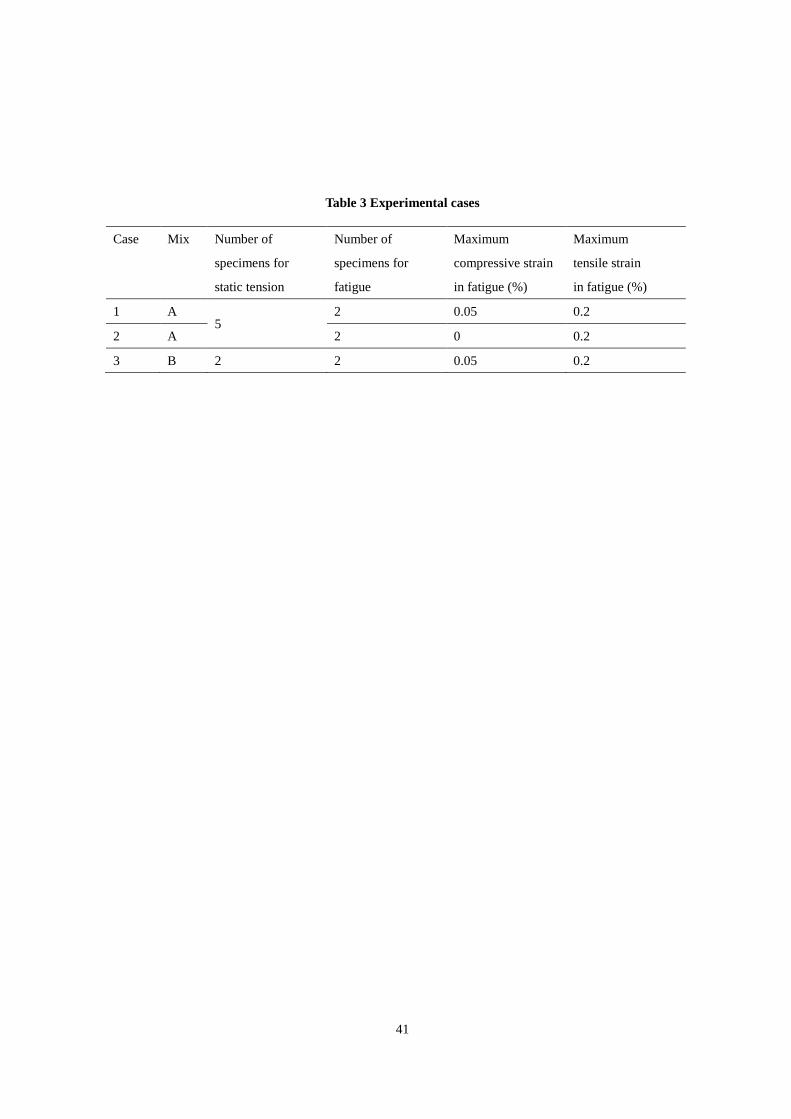
There are three experimental cases as shown in Table 3. For Case 1 and 2, five Mix A specimens were
tested under static tension. In Case 1, two Mix A specimens were tested under tension-compression
11
fatigue with maximum compressive strain 0.05 % and maximum tensile strain 0.2 %, while, in Case 2,
two Mix A specimens with maximum compressive strain 0 % and maximum tensile strain 0.2 %. In
Case 3, two Mix B specimens were tested under static tension, and two Mix B specimens under
tension-compression fatigue with maximum compressive strain 0.05 % and maximum tensile strain 0.2 %.
The reason why these strain values were chosen for fatigue will be explained later.
First, static tensile loading test was conducted. Loading was applied under displacement control at the
rate of 0.005mm/sec. Load and the average of four gauges were recorded. Next, based on the static
tensile loading test, the maximum tensile strain during fatigue loading was set to be 0.2 %. Also, two
levels of maximum compressive strain during fatigue loading were selected: 0 % for Case 2 and 0.05 %
for Case 1 and 3.
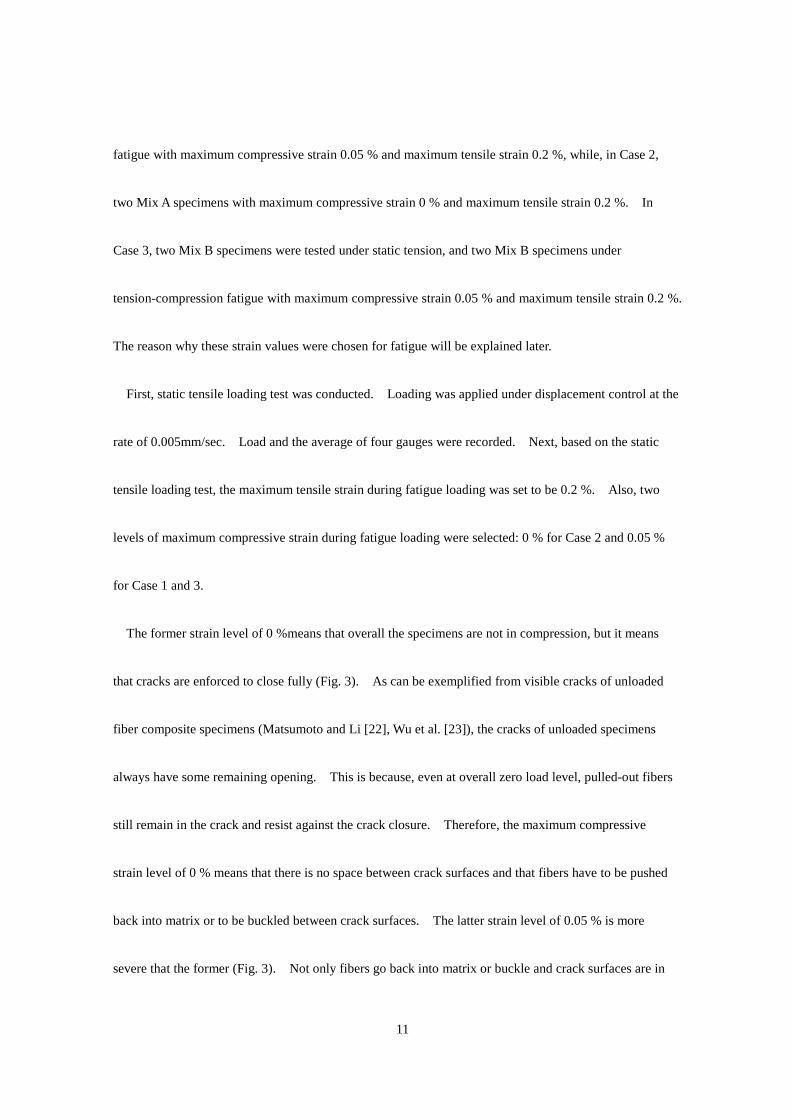
The former strain level of 0 %means that overall the specimens are not in compression, but it means
that cracks are enforced to close fully (Fig. 3). As can be exemplified from visible cracks of unloaded
fiber composite specimens (Matsumoto and Li [22], Wu et al. [23]), the cracks of unloaded specimens
always have some remaining opening. This is because, even at overall zero load level, pulled-out fibers
still remain in the crack and resist against the crack closure. Therefore, the maximum compressive
strain level of 0 % means that there is no space between crack surfaces and that fibers have to be pushed
back into matrix or to be buckled between crack surfaces. The latter strain level of 0.05 % is more
severe that the former (Fig. 3). Not only fibers go back into matrix or buckle and crack surfaces are in

12
contact, but also fibers are compressed and crack surfaces are worn out.
The reason why these compressive strain levels were chosen is that, in some structural applications
under traffic or temperature loading, cyclic fatigue loading into compression is possible to be present,
although the usage of bridging fibers in compression is not advantageous.
Tension-compression fatigue loading was applied as follows (see also Fig. 3). First, a specimen was
loaded in tension under displacement control at the rate of 0.005 mm/sec. After reaching the maximum
tensile strain level, the specimen was unloaded, and further loaded into the maximum compressive strain
level at the same rate of displacement control. From this point on, cyclic fatigue loading was applied at
the frequency of 1 Hz under the constant displacement amplitude between the corresponding maximum
tensile and compressive strain. Load and the average of four gauges were recorded. The cyclic loading
was applied with a sinusoidal wave, and it was stopped when the load decrease ceased or the number of
cycles reached 2,000 cycles.
13
Fig. 3. Tension-compression loading sequence and crack behaviors.
3. Experimental results
3.1 Static tensile test results
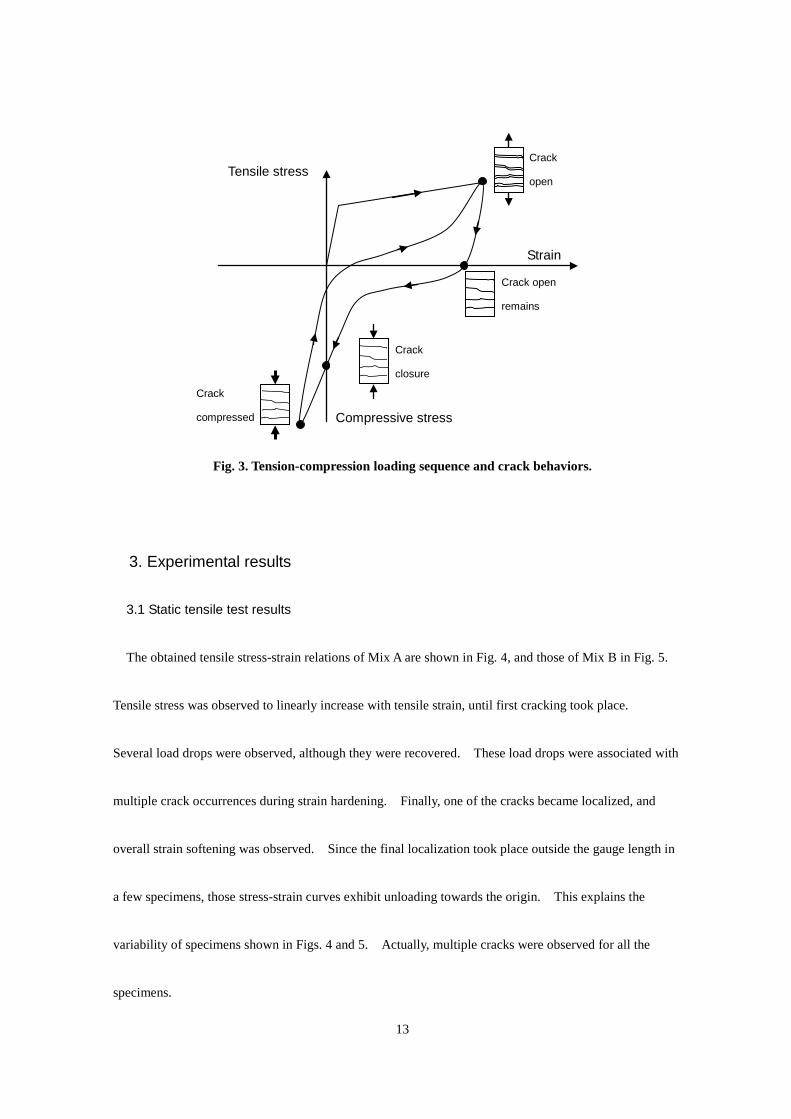
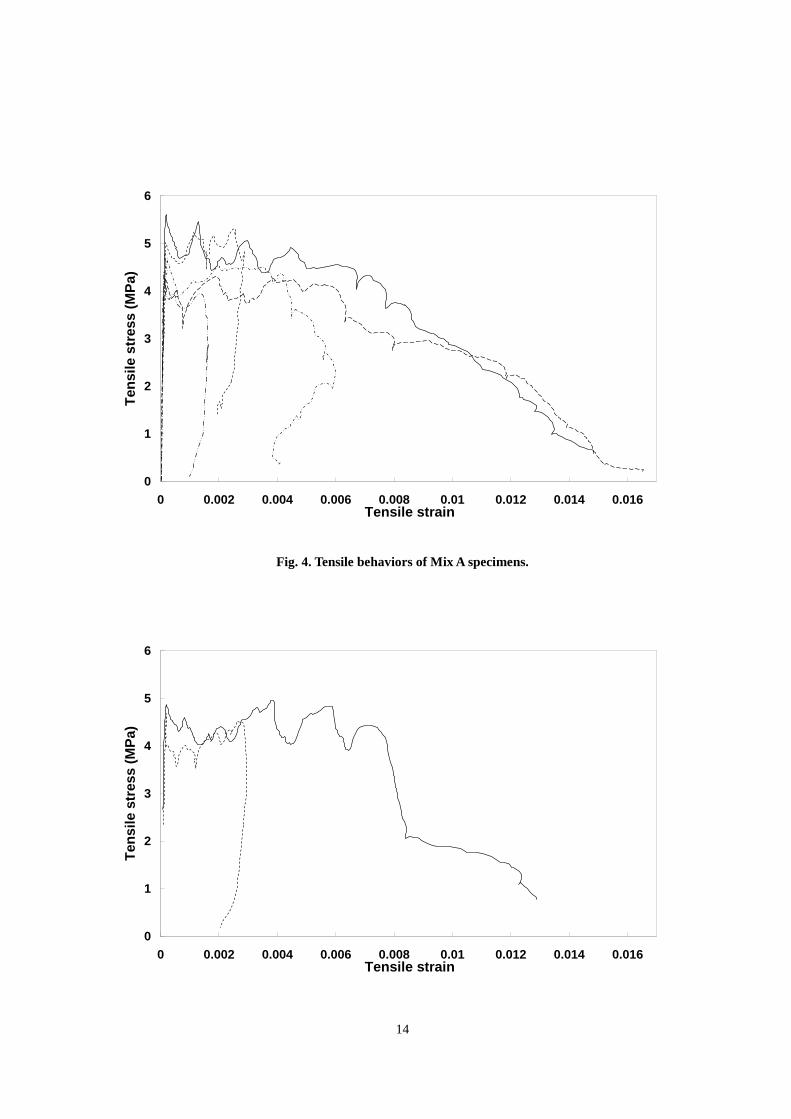
The obtained tensile stress-strain relations of Mix A are shown in Fig. 4, and those of Mix B in Fig. 5.
Tensile stress was observed to linearly increase with tensile strain, until first cracking took place.
Several load drops were observed, although they were recovered. These load drops were associated with
multiple crack occurrences during strain hardening. Finally, one of the cracks became localized, and
overall strain softening was observed. Since the final localization took place outside the gauge length in
a few specimens, those stress-strain curves exhibit unloading towards the origin. This explains the
variability of specimens shown in Figs. 4 and 5. Actually, multiple cracks were observed for all the
specimens.
Tensile stress
Compressive stress
Strain
Crack
closure
Crack
compressed
Crack open
remains
Crack
open
14
0
1
2
3
4
5
6
0 0.002 0.004 0.006 0.008 0.01 0.012 0.014 0.016Tensile strain
Tens
ile s
tres
s (M
Pa)
Fig. 4. Tensile behaviors of Mix A specimens.
0
1
2
3
4
5
6
0 0.002 0.004 0.006 0.008 0.01 0.012 0.014 0.016Tensile strain
Tens
ile s
tres
s (M
Pa)
15
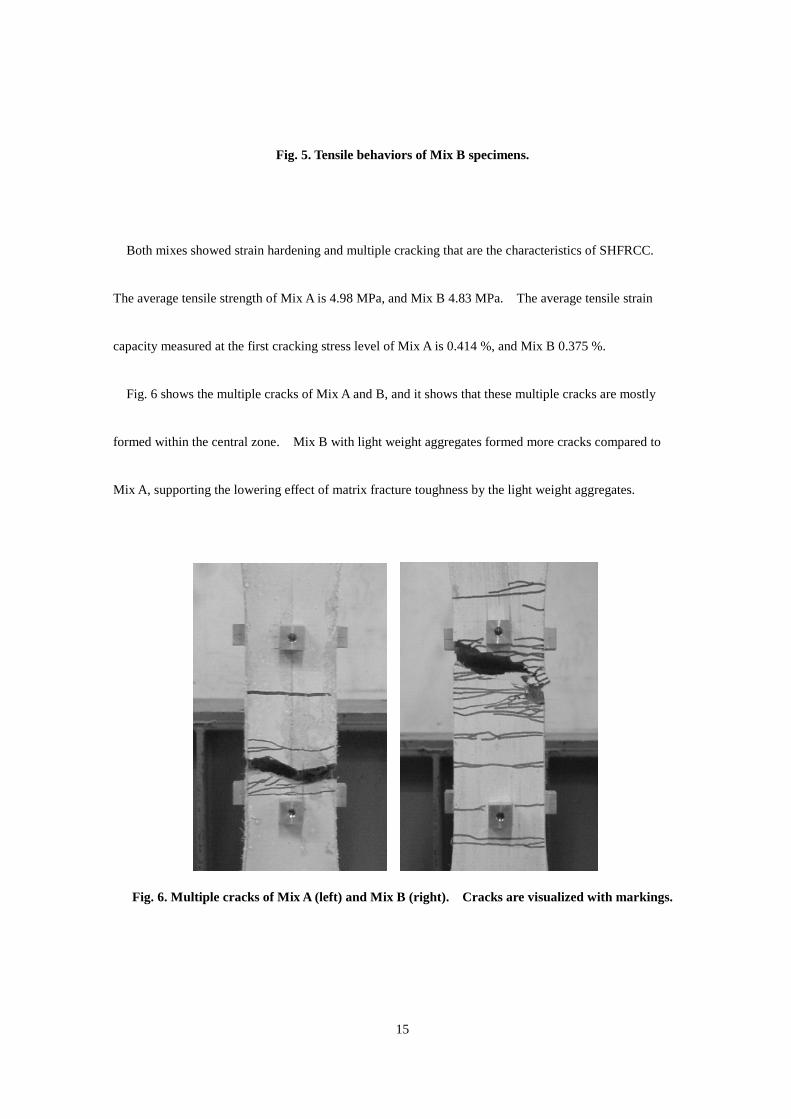
Fig. 5. Tensile behaviors of Mix B specimens.
Both mixes showed strain hardening and multiple cracking that are the characteristics of SHFRCC.
The average tensile strength of Mix A is 4.98 MPa, and Mix B 4.83 MPa. The average tensile strain
capacity measured at the first cracking stress level of Mix A is 0.414 %, and Mix B 0.375 %.
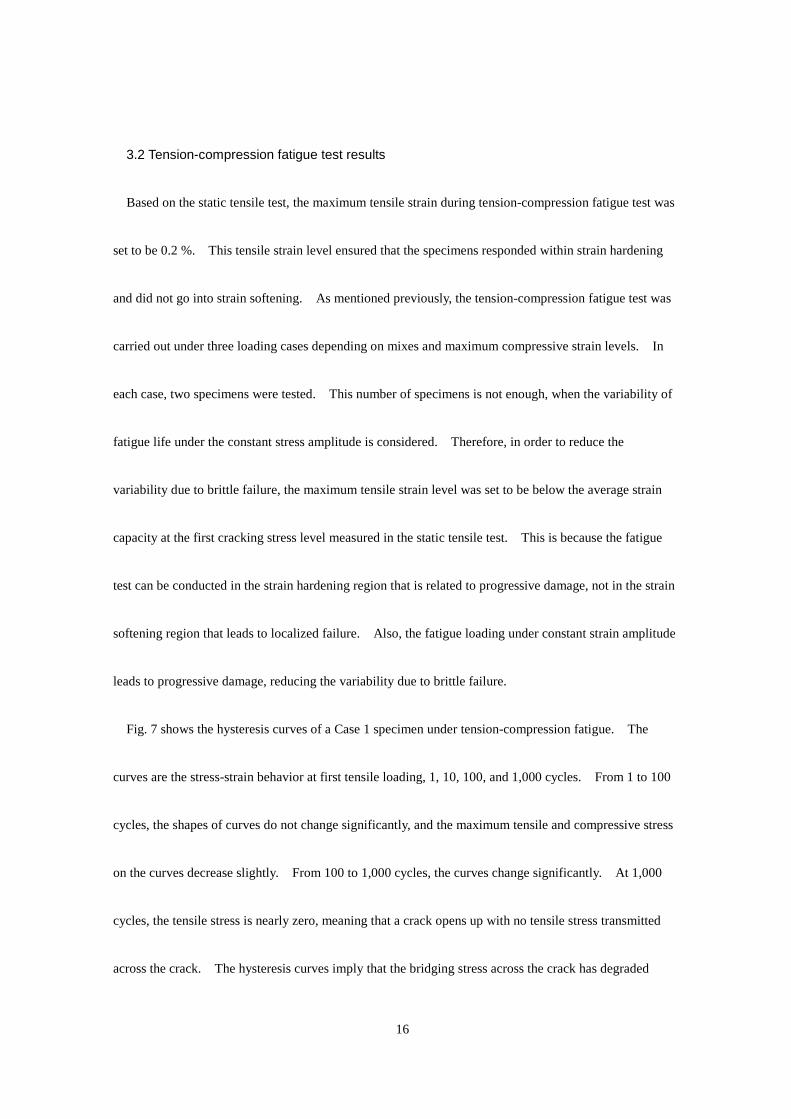
Fig. 6 shows the multiple cracks of Mix A and B, and it shows that these multiple cracks are mostly
formed within the central zone. Mix B with light weight aggregates formed more cracks compared to
Mix A, supporting the lowering effect of matrix fracture toughness by the light weight aggregates.
Fig. 6. Multiple cracks of Mix A (left) and Mix B (right). Cracks are visualized with markings.
16
3.2 Tension-compression fatigue test results
Based on the static tensile test, the maximum tensile strain during tension-compression fatigue test was
set to be 0.2 %. This tensile strain level ensured that the specimens responded within strain hardening
and did not go into strain softening. As mentioned previously, the tension-compression fatigue test was
carried out under three loading cases depending on mixes and maximum compressive strain levels. In
each case, two specimens were tested. This number of specimens is not enough, when the variability of
fatigue life under the constant stress amplitude is considered. Therefore, in order to reduce the
variability due to brittle failure, the maximum tensile strain level was set to be below the average strain
capacity at the first cracking stress level measured in the static tensile test. This is because the fatigue
test can be conducted in the strain hardening region that is related to progressive damage, not in the strain
softening region that leads to localized failure. Also, the fatigue loading under constant strain amplitude
leads to progressive damage, reducing the variability due to brittle failure.
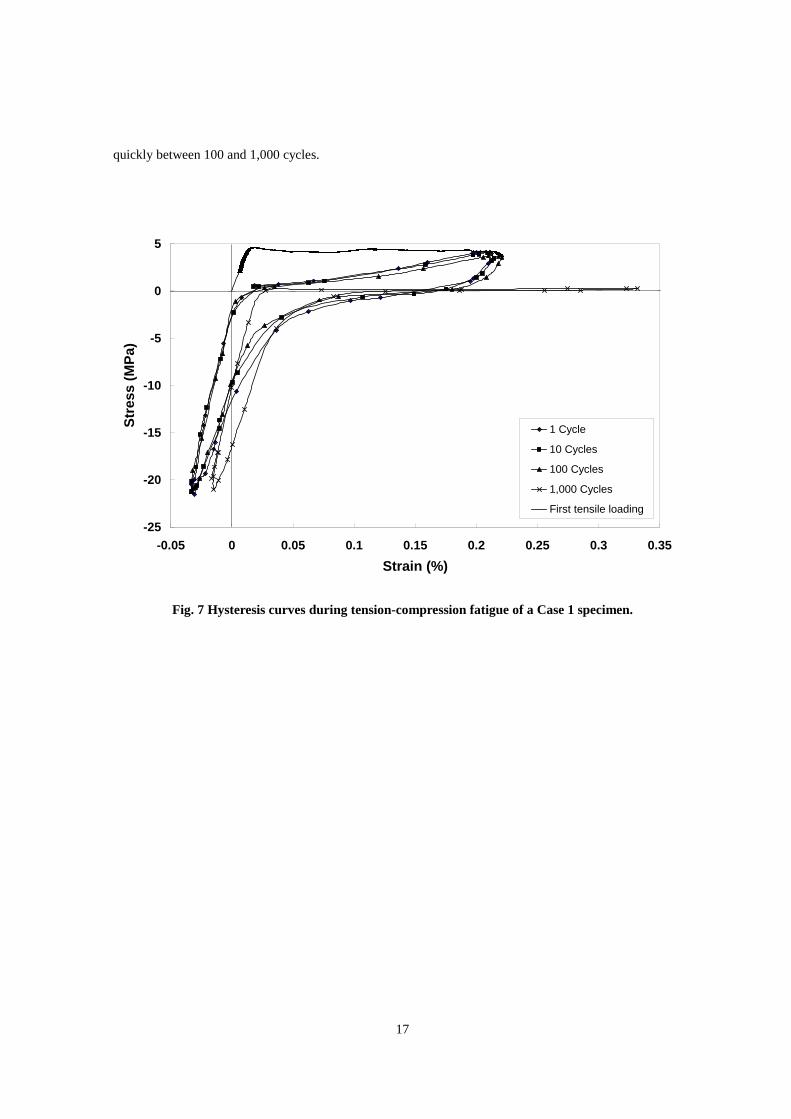
Fig. 7 shows the hysteresis curves of a Case 1 specimen under tension-compression fatigue. The
curves are the stress-strain behavior at first tensile loading, 1, 10, 100, and 1,000 cycles. From 1 to 100
cycles, the shapes of curves do not change significantly, and the maximum tensile and compressive stress
on the curves decrease slightly. From 100 to 1,000 cycles, the curves change significantly. At 1,000
cycles, the tensile stress is nearly zero, meaning that a crack opens up with no tensile stress transmitted
across the crack. The hysteresis curves imply that the bridging stress across the crack has degraded
17
quickly between 100 and 1,000 cycles.
-25
-20
-15
-10
-5
0
5
-0.05 0 0.05 0.1 0.15 0.2 0.25 0.3 0.35Strain (%)
Stre
ss (M
Pa)
1 Cycle
10 Cycles
100 Cycles
1,000 Cycles
First tensile loading
Fig. 7 Hysteresis curves during tension-compression fatigue of a Case 1 specimen.

18
0
0.2
0.4
0.6
0.8
1
1 10 100 1000 10000
Number of Cycles (cycles)
σ N/ σ
1
Case 1 Case 2 Case 3
Fig. 8 Bridging stress degradation curves during tension-compression fatigue.
In order to observe the bridging stress degradation, the tensile stress corresponding to the preset
maximum tensile strain was recorded with the number of cycles. In Fig. 8, the ratio of the tensile stress
at the current number of cycles, σN, to that at 1 cycle, σ1, is plotted with the number of cycles for all the
specimens. Fig. 8 shows that there are three stages in the bridging stress degradation curves. First,
from 1 to 100 cycles, bridging stress gradually decreases roughly to 90 %. Second, from 100 to 1,000
cycles, the bridging stress sharply decreases roughly to 10 %. Some specimens suffer from severe
damage, and those specimens exhibit a decrease nearly to 0 %. Finally, after the sharp decrease, the
bridging stress decreases gradually again. The tests were terminated, if the final decrease is negligible
and the number of cycles is above 1,000 cycles.

19
The differences among the experimental cases can be seen at the onset of the second stage and during
the second stage.
For Case 1 and 2 of Mix A, Case 1 enters the second stage slightly later than Case 2, but Case 1 decays
quickly with sharper gradients. This behavior was partially contrary to expectations. It was expected
that Case 1 started to decay earlier and decayed quickly, since Case 1 was subjected to more severe
loading conditions as explained in section 2.3. At this moment, the reason why Case 1 started to decay
later than Case 2 is not clear.
Case 3 of Mix B started to decay earlier than Case1, but later than Case 2. Also, Case 3 decays less
quickly than Case 1, but more than Case 2. When compared to Case 1 under the same loading
conditions, Case 3 exhibited more multiple cracks. The increased number of multiple cracks may
contribute to the distribution of damages, and the gradient of the second decline stage in Case 3 might be
achieved. The reason why Case 3 started to decay earlier than Case 1 is not clear at this moment.
Although there are not enough specimens to discuss the differences among the three cases, all the three
cases show that the major bridging stress degradation takes place before 1,000 cycles and that the
bridging stress degrades nearly to 10 %. It can be said that the bridging stress degradation under
tension-compression fatigue is significantly severe, and that its degradation life on the order of 103 cycles
is quite short compared to engineering design life on the order of 106 cycles.
20
3.3 Failure surface observation after tension-compression fatigue tests
Failure surfaces of all the specimens were observed visually and with a digital microscope in order to
understand the physical phenomena of fiber bridging stress degradation.
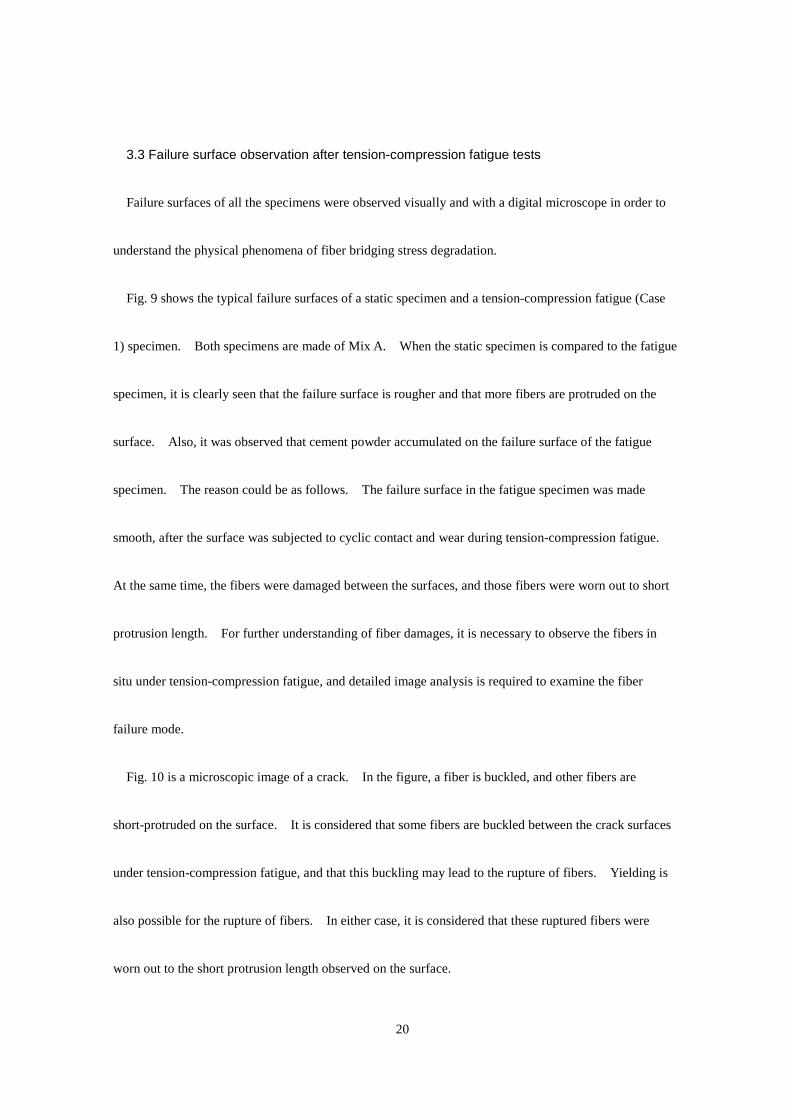
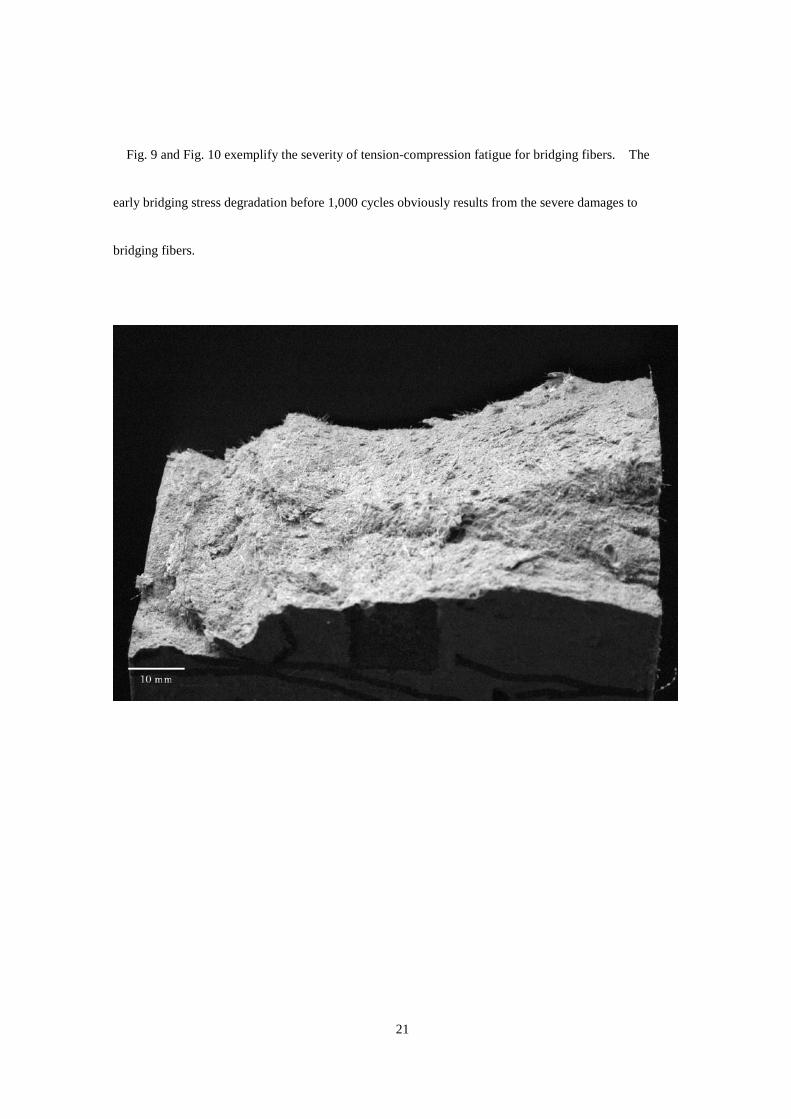
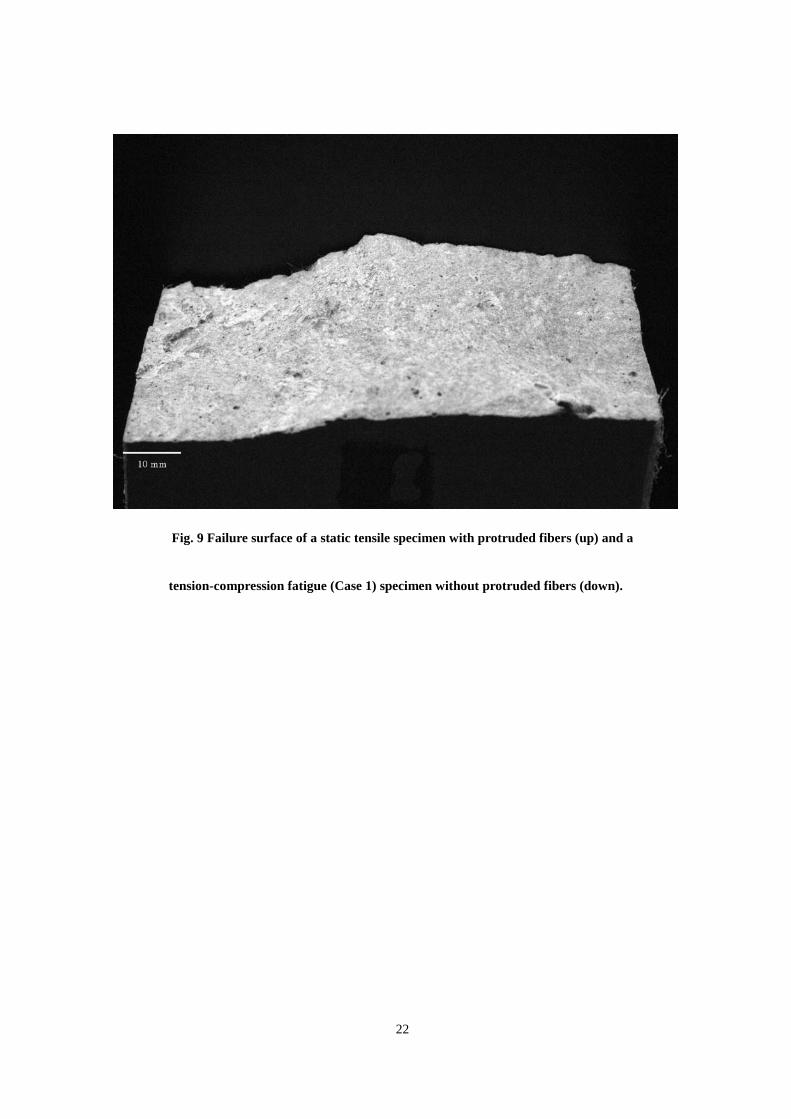
Fig. 9 shows the typical failure surfaces of a static specimen and a tension-compression fatigue (Case
1) specimen. Both specimens are made of Mix A. When the static specimen is compared to the fatigue
specimen, it is clearly seen that the failure surface is rougher and that more fibers are protruded on the
surface. Also, it was observed that cement powder accumulated on the failure surface of the fatigue
specimen. The reason could be as follows. The failure surface in the fatigue specimen was made
smooth, after the surface was subjected to cyclic contact and wear during tension-compression fatigue.
At the same time, the fibers were damaged between the surfaces, and those fibers were worn out to short
protrusion length. For further understanding of fiber damages, it is necessary to observe the fibers in
situ under tension-compression fatigue, and detailed image analysis is required to examine the fiber
failure mode.
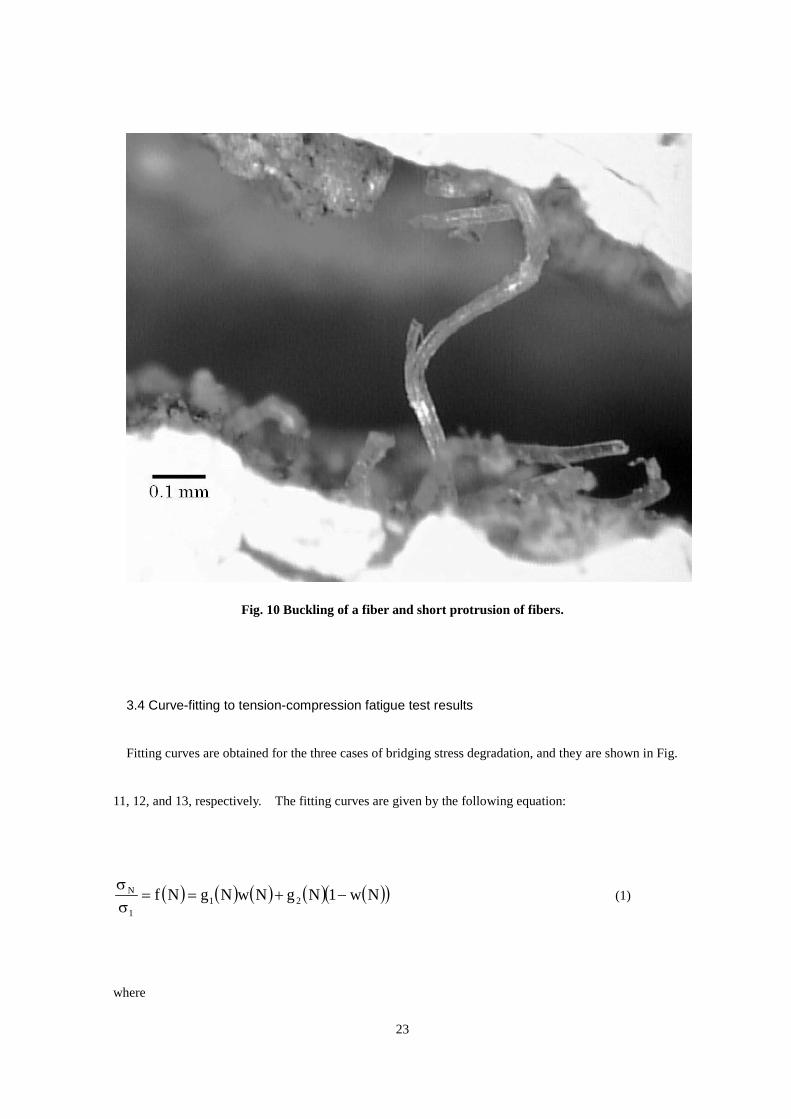
Fig. 10 is a microscopic image of a crack. In the figure, a fiber is buckled, and other fibers are
short-protruded on the surface. It is considered that some fibers are buckled between the crack surfaces
under tension-compression fatigue, and that this buckling may lead to the rupture of fibers. Yielding is
also possible for the rupture of fibers. In either case, it is considered that these ruptured fibers were
worn out to the short protrusion length observed on the surface.
21
Fig. 9 and Fig. 10 exemplify the severity of tension-compression fatigue for bridging fibers. The
early bridging stress degradation before 1,000 cycles obviously results from the severe damages to
bridging fibers.
22
Fig. 9 Failure surface of a static tensile specimen with protruded fibers (up) and a
tension-compression fatigue (Case 1) specimen without protruded fibers (down).
23
Fig. 10 Buckling of a fiber and short protrusion of fibers.
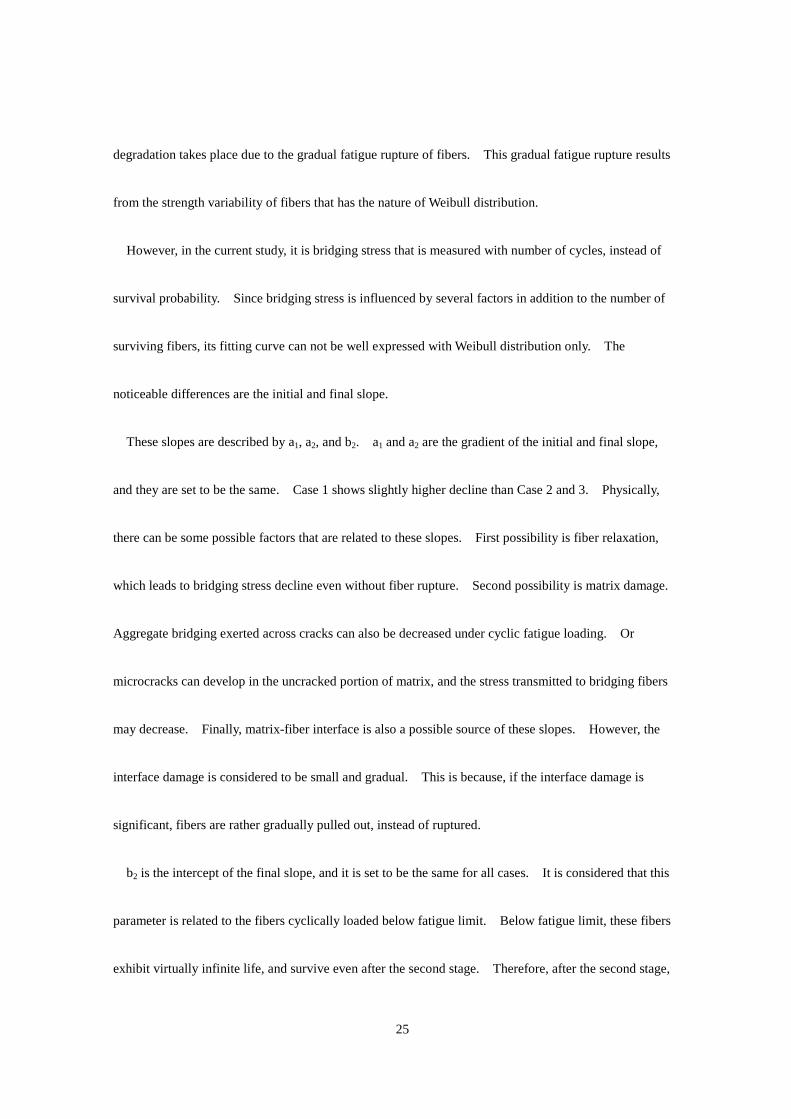
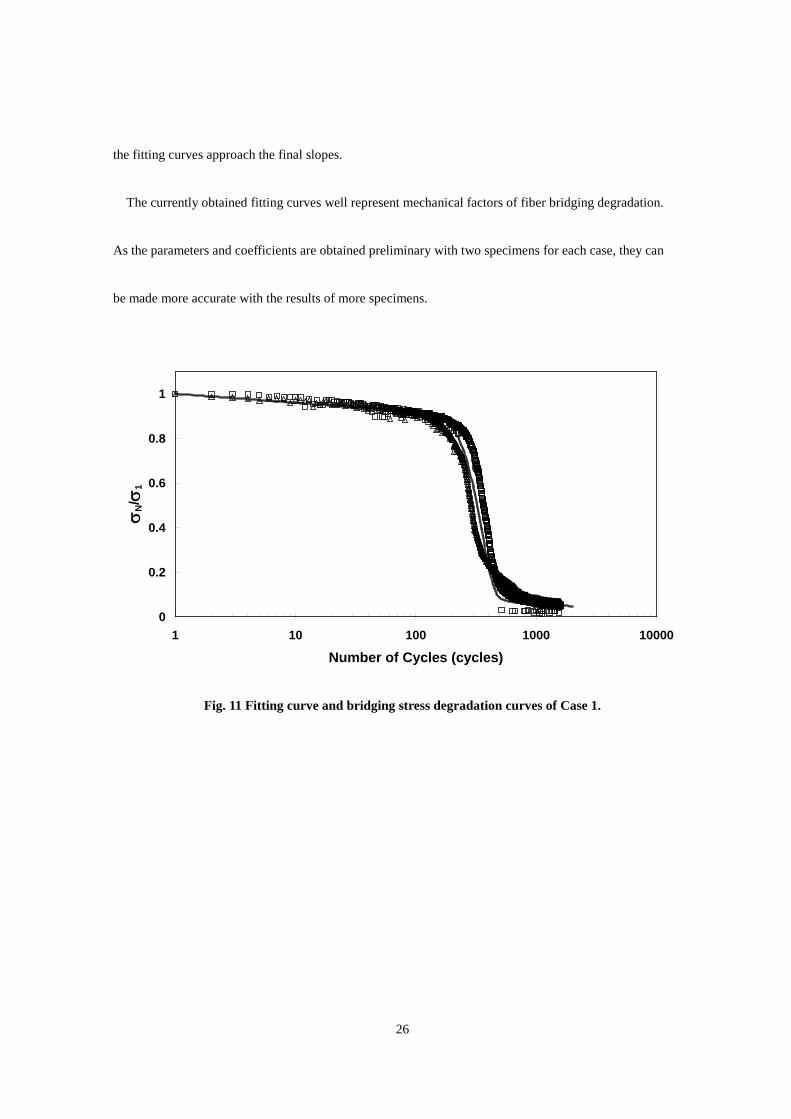
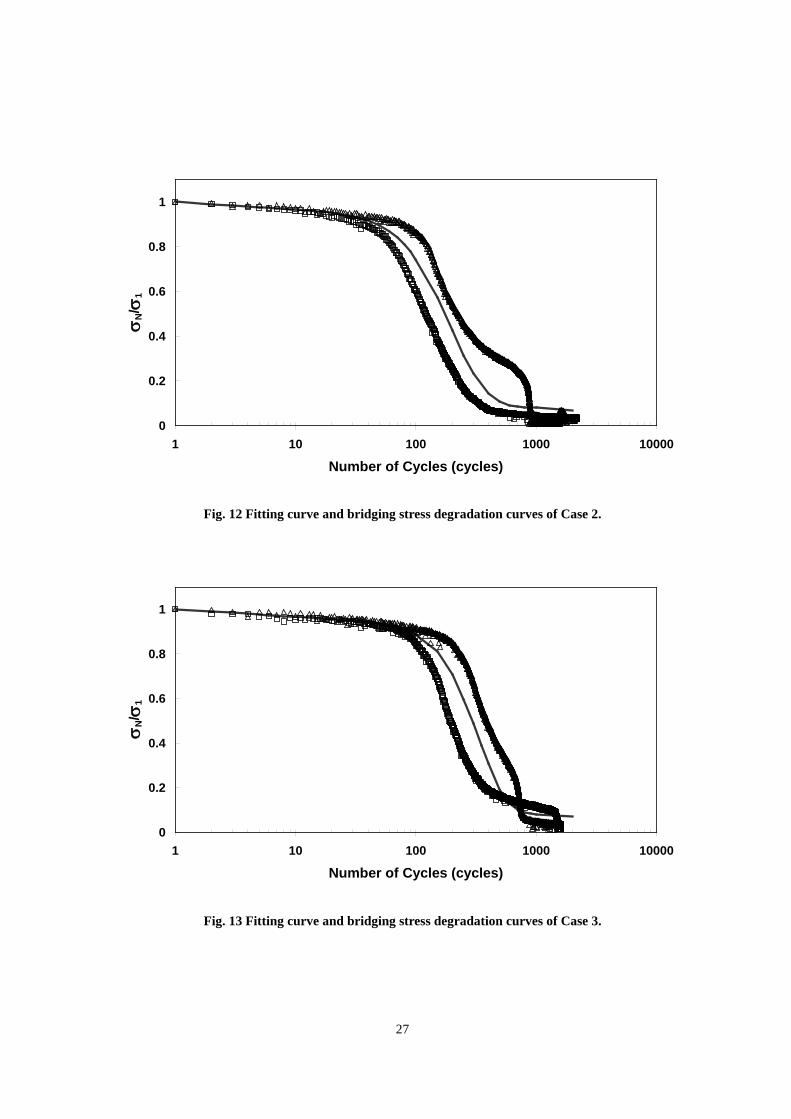
3.4 Curve-fitting to tension-compression fatigue test results
Fitting curves are obtained for the three cases of bridging stress degradation, and they are shown in Fig.
11, 12, and 13, respectively. The fitting curves are given by the following equation:
( ) ( ) ( ) ( ) ( )( )Nw1NgNwNgNf 211
N −+==σσ
(1)
where

24
( )
−=
m
oNlogNlogexpNw , (2)
( ) Nloga1Ng 11 −= , and (3)
( ) NlogabNg 222 −= . (4)
w(N) is a Weibull distribution function where m is a shape parameter and log No is a scale parameter.
g1(N) is a function that determines the initial slope of the curve, while g2(N) is a function that determines
the final slope of the curve. The coefficients, a1, a2, and b2, are to be determined in fitting, together with
the two Weibull parameters.
Table 4 shows the parameters of the fitting curves. The shape parameter, m, of Case 1 is 25, while
those of Case 2 and 3 are lower: 9 and 12, respectively. The shape parameter describes the gradient of
the second decline stage of a bridging degradation curve. The larger the shape parameter is, the steeper
the gradient becomes. Hence, with a large shape parameter like Case 1, the second decline stage can be
narrowed down or well-defined. On the other hand, with a small shape parameter like Case 2 and 3, it
has some range in two orders of magnitude. Regarding the scale parameter, log No, it is noted that,
when N is equal to No, w(N) becomes 1/e = 0.37, according to Weibull distribution. Namely, No points
the number of cycles for the second decline stage.
The current curve-fitting relies mainly on Weibull distribution, but not only on it. The bridging stress
25
degradation takes place due to the gradual fatigue rupture of fibers. This gradual fatigue rupture results
from the strength variability of fibers that has the nature of Weibull distribution.
However, in the current study, it is bridging stress that is measured with number of cycles, instead of
survival probability. Since bridging stress is influenced by several factors in addition to the number of
surviving fibers, its fitting curve can not be well expressed with Weibull distribution only. The
noticeable differences are the initial and final slope.
These slopes are described by a1, a2, and b2. a1 and a2 are the gradient of the initial and final slope,
and they are set to be the same. Case 1 shows slightly higher decline than Case 2 and 3. Physically,
there can be some possible factors that are related to these slopes. First possibility is fiber relaxation,
which leads to bridging stress decline even without fiber rupture. Second possibility is matrix damage.
Aggregate bridging exerted across cracks can also be decreased under cyclic fatigue loading. Or
microcracks can develop in the uncracked portion of matrix, and the stress transmitted to bridging fibers
may decrease. Finally, matrix-fiber interface is also a possible source of these slopes. However, the
interface damage is considered to be small and gradual. This is because, if the interface damage is
significant, fibers are rather gradually pulled out, instead of ruptured.
b2 is the intercept of the final slope, and it is set to be the same for all cases. It is considered that this
parameter is related to the fibers cyclically loaded below fatigue limit. Below fatigue limit, these fibers
exhibit virtually infinite life, and survive even after the second stage. Therefore, after the second stage,
26
the fitting curves approach the final slopes.
The currently obtained fitting curves well represent mechanical factors of fiber bridging degradation.
As the parameters and coefficients are obtained preliminary with two specimens for each case, they can
be made more accurate with the results of more specimens.
0
0.2
0.4
0.6
0.8
1
1 10 100 1000 10000
Number of Cycles (cycles)
σ N/ σ
1
Fig. 11 Fitting curve and bridging stress degradation curves of Case 1.
27
0
0.2
0.4
0.6
0.8
1
1 10 100 1000 10000
Number of Cycles (cycles)
σ N/ σ
1
Fig. 12 Fitting curve and bridging stress degradation curves of Case 2.
0
0.2
0.4
0.6
0.8
1
1 10 100 1000 10000
Number of Cycles (cycles)
σ N/ σ
1
Fig. 13 Fitting curve and bridging stress degradation curves of Case 3.
28
4. Discussions
The current bridging stress degradation curves of tension-compression fatigue can be compared with
those of tensile fatigue in Matsumoto et al [18]. The specimens tested under tensile fatigue were
fabricated with a similar mix proportion. The tensile fatigue means that the specimens were cyclically
loaded between maximum strain and minimum strain, where the maximum strain levels were 0.1, 0.15, or
0.2 %, while the minimum strain level was defined as the level where the load returns to zero. Unlike
the current tension-compression fatigue, cracks still remain open even at the minimum strain level (see
Fig. 3). The loading frequency was 4 Hz, and the loading pattern was sinusoidal.
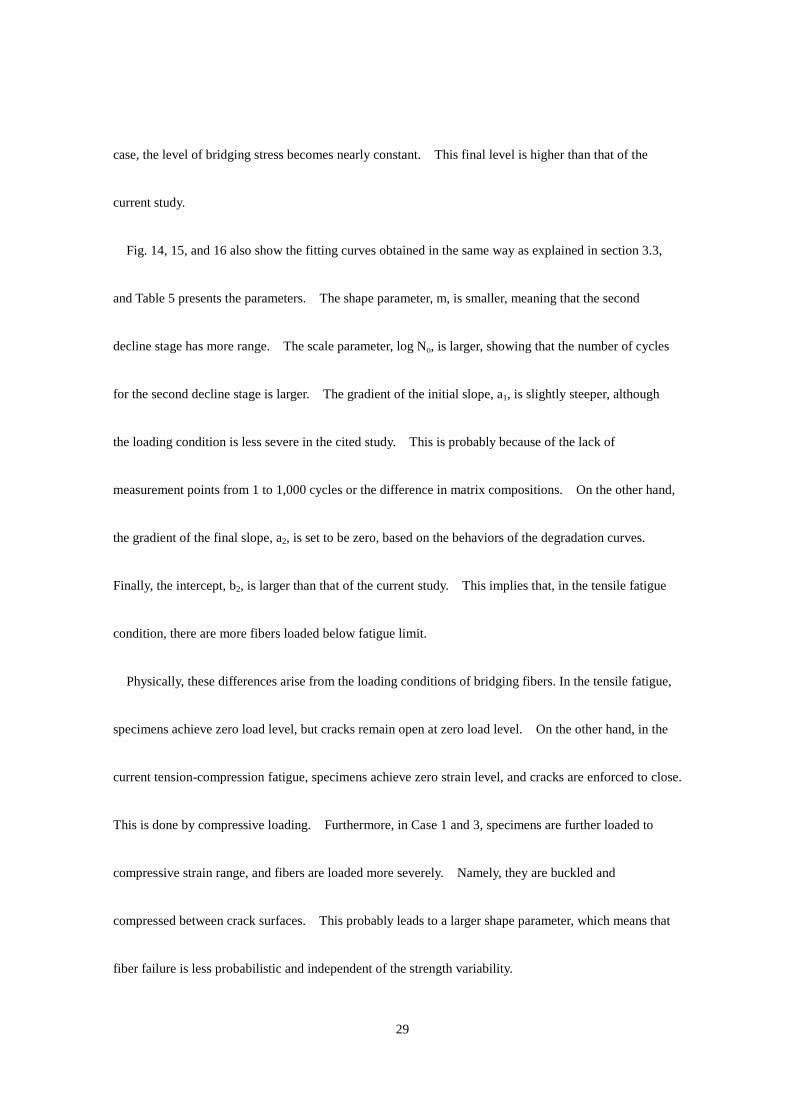
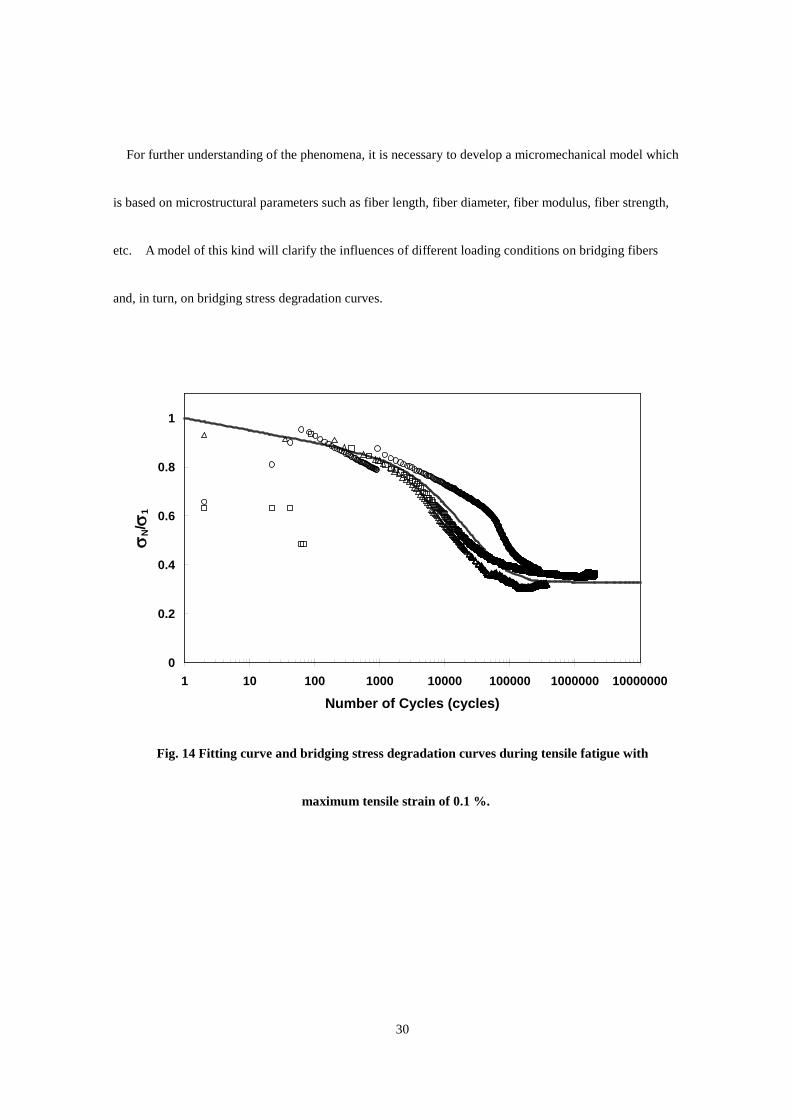
Fig. 14, 15, and 16 show the resulting bridging stress degradation curves under tensile fatigue for the
maximum strain level of 0.1, 0.15, and 0.2 %, respectively. The curves have similar behaviors to those
presented in the current study. In the same manner, the curves can be divided into three stages.
Although the curves are similar qualitatively, they are quantitatively different. First, the initial
gradual decrease continues to the level of 70~80 %, and this stage lasts for about a few thousands of
cycles. The gradient of initial slope is rather steep compared to that of the current study. Second, the
sharp decline takes place from the level of 70~80 % to 20~30 %. In the cited study, the amount of
decrease is smaller, and the gradient of decrease is milder. The major difference is seen in the number of
cycles. While the current study shows the order of 102 cycles, this cited study reports the order of 104
cycles. Finally, it is observed that the degradation slows down below the level of 20~30 %. In one
29
case, the level of bridging stress becomes nearly constant. This final level is higher than that of the
current study.
Fig. 14, 15, and 16 also show the fitting curves obtained in the same way as explained in section 3.3,
and Table 5 presents the parameters. The shape parameter, m, is smaller, meaning that the second
decline stage has more range. The scale parameter, log No, is larger, showing that the number of cycles
for the second decline stage is larger. The gradient of the initial slope, a1, is slightly steeper, although
the loading condition is less severe in the cited study. This is probably because of the lack of
measurement points from 1 to 1,000 cycles or the difference in matrix compositions. On the other hand,
the gradient of the final slope, a2, is set to be zero, based on the behaviors of the degradation curves.
Finally, the intercept, b2, is larger than that of the current study. This implies that, in the tensile fatigue
condition, there are more fibers loaded below fatigue limit.
Physically, these differences arise from the loading conditions of bridging fibers. In the tensile fatigue,
specimens achieve zero load level, but cracks remain open at zero load level. On the other hand, in the
current tension-compression fatigue, specimens achieve zero strain level, and cracks are enforced to close.
This is done by compressive loading. Furthermore, in Case 1 and 3, specimens are further loaded to
compressive strain range, and fibers are loaded more severely. Namely, they are buckled and
compressed between crack surfaces. This probably leads to a larger shape parameter, which means that
fiber failure is less probabilistic and independent of the strength variability.
30
For further understanding of the phenomena, it is necessary to develop a micromechanical model which
is based on microstructural parameters such as fiber length, fiber diameter, fiber modulus, fiber strength,
etc. A model of this kind will clarify the influences of different loading conditions on bridging fibers
and, in turn, on bridging stress degradation curves.
0
0.2
0.4
0.6
0.8
1
1 10 100 1000 10000 100000 1000000 10000000
Number of Cycles (cycles)
σ N/ σ
1
Fig. 14 Fitting curve and bridging stress degradation curves during tensile fatigue with
maximum tensile strain of 0.1 %.
31
0
0.2
0.4
0.6
0.8
1
1 10 100 1000 10000 100000 1000000 10000000
Number of Cycles (cycles)
σ N/ σ
1
Fig. 15 Fitting curve and bridging stress degradation curves during tensile fatigue with
maximum tensile strain of 0.15 %.
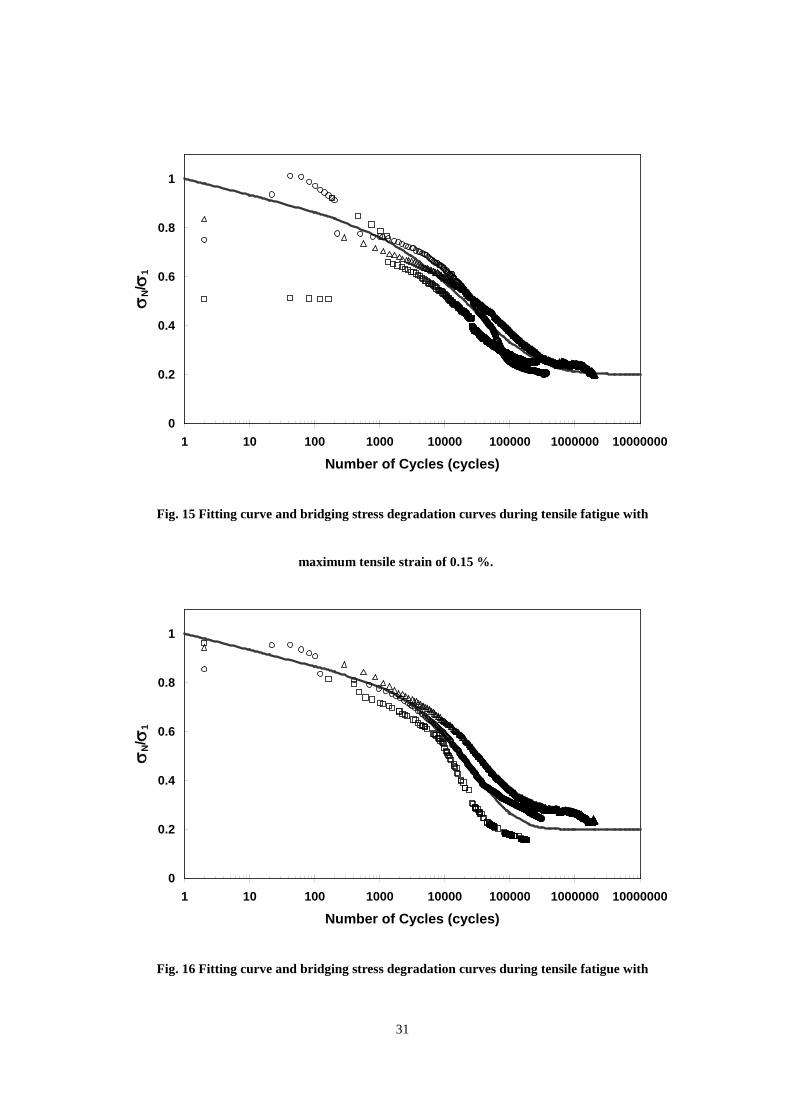
0
0.2
0.4
0.6
0.8
1
1 10 100 1000 10000 100000 1000000 10000000
Number of Cycles (cycles)
σ N/ σ
1
Fig. 16 Fitting curve and bridging stress degradation curves during tensile fatigue with
32
maximum tensile strain of 0.2 %.
5. Conclusions
This paper presented an experimental study of uniaxial tension-compression fatigue behavior and fiber
bridging degradation of strain hardening fiber reinforced cementitious composites (SHFRCC).
SHFRCC specimens were cyclically loaded under constant strain amplitude, where the tensile strain
during cyclic loading was 0.2 %, and the compressive strain was either 0 or 0.05 %. The hysteresis
curves on the stress-strain plot were recorded, and the tensile stress corresponding to the tensile strain of
0.2 % was recorded with the number of cycles in order to observe the cycle-dependent degradation of
fiber bridging stress.
It is found that bridging stress degradation happens in three stages. First, from 1 to 100 cycles,
bridging stress decreases roughly to 90 %. Second, from 100 to 1,000 cycles, the bridging stress sharply
decreases to about 10 %. Finally, after the sharp decrease, the bridging stress returns to gradual decrease.
Although there are not enough specimens to discuss the differences among the three experimental cases,
it is shown that the major bridging stress degradation takes place before 1,000 cycles, and that the
bridging stress degrades to nearly 10 %. Visual observation identified that bridging fibers were severely
damaged, and, after fatigue, no fibers were found to be protruded on the crack surface. This severe
damage explains the significantly early and fast degradation of bridging stress.

33
Fitting curves are proposed based mainly on Weibull distribution. Weibull distribution describes the
gradual fatigue rupture of fibers resulting from the strength variability. Additional terms to describe the
gradual decrease of bridging stress in the initial and final stage are combined together with Weibull
distribution. It has been shown that the proposed fitting curves well represent mechanical factors of
fiber bridging degradation. As the parameters and coefficients are obtained preliminary with a limited
number of specimens for each case, they can be made more accurate with the results of more specimens.
The current study is compared with a previous study which carried out uniaxial tensile fatigue of
SHFRCC. Bridging stress degradation curves and their fitting curves are compared. It is found that the
curves look similar, but that the degradation is significantly later and slower than that of the current study.
This is probably because less number of fibers are buckled and none of them are pressed where the cracks
still remain open even at the minimum strain level. Therefore, the fibers are less damaged.
For further understanding of the phenomena, it is necessary to conduct a series of experiments with
sufficient number of specimens under various loading conditions and to perform the same analyses.
Also, it is necessary to develop a micromechanical model which is based on microstructural parameters.
A model of this kind will clarify the influence of different loading conditions on bridging fibers and, in
turn, on bridging stress degradation curves.
34
References
[1] Horii H, Nanakorn P, Kabele P. Application of fracture mechanics to design of SFRC tunnel linings and
development of strain-hardening cementitious composites. FRAMCOS-2: Proceedings of the Second
International Conference on Fracture Mechanics of Concrete and Concrete Structures, Wittmann FH, editor.
1995, pp. 1345-1360.
[2] Rizkalla SH, Mufti AA. Recent innovation for concrete highway bridges. Proceedings of ASCE 4th Materials
Engineering Conference, Chong KP, editor. 1996, pp. 1063-1071.
[3] Shirazi HH, Rasoulian M, King B. Design and construction of a bonded fiber concrete overlay of CRCP.
Proceedings of ASCE 4th Materials Engineering Conference, Chong KP, editor. 1996, pp. 1647-1658.
[4] Strand D, MacDonald CN, Ramakrishnan V, Rajpathak VN. Construction applications of polyolefin fiber
reinforced concrete. Proceedings of ASCE 4th Materials Engineering Conference, Chong KP, editor. 1996, pp.
103-112.
[5] Krstulovic-Opara N, Haghayeghi AR, Haidar M, Krauss PD. Use of conventional and high-performance
steel-fiber reinforced concrete for bridge deck overlays. ACI Materials Journal, 1995;92(6): 669-677.
[6] Balaguru PN, Shah SP. Fiber-reinforced cement composites. McGraw-Hill; 1992.
[7] Li VC. Postcrack scaling relations for fiber reinforced cementitious composites. Journal of Materials in Civil
Engineering, 1992;4(1):41-57.
[8] Kunieda M, Rokugo K. Recent progress on HPFRCC in Japan -Required performance and applications-.
35
Journal of Advanced Concrete Technology, 2006;4(1):19-33.
[9] Li VC, Leung CKY. Steady state and multiple cracking of short random fiber composites. Journal of
Engineering Mechanics, 1992;188(11):2246-2264.
[10] Li VC. From micromechanics to structural engineering -The design of cementitous composites for civil
engineering applications. Journal of Structural Mechanics and Earthquake Engineering, Japan Society of Civil
Engineers, 1993;No. 471/I-24:1-12.
[11] Li VC. On Engineered Cementitious Composites (ECC) -A review of the material and its applications. Journal
of Advanced Concrete Technology, 2003;1(3):215-230.
[12] Li VC, Wang S, Wu C. Tensile strain-hardening behavior of polyvinyl alcohol engineered cementitious
composite (PVA-ECC). ACI Materials Journal, 2001;98(6): 483-492.
[13] Kim YY, Fischer G, Li VC. Performance of bridge deck link slabs designed with ductile ECC. ACI Structural
Journal, 2004;101(6):792-801.
[14] Li VC. Integrated structures and materials design. Materials and Structures, 2007;40(4):387-396.
[15] Suthiwarapirak P, Matsumoto T, Kanda T. Flexural fatigue failure characteristics of an engineered cementitious
composite and polymer cement mortars. Journal of Materials, Concrete Structures and Pavements, Japan
Society of Civil Engineers, 2002;No. 718/V-57:121-134.
[16] Matsumoto T, Suthiwarapirak P, Kanda T. Mechanisms of multiple cracking and fracture of DFRCCs under
fatigue flexure. Journal of Advanced Concrete Technology, Japan Concrete Institute, 2003;1(3):299-306.

36
[17] Suthiwarapirak P, Matsumoto T, Kanda T. Multiple cracking and fiber bridging characteristics of engineered
cementitious composites under fatigue flexure. Journal of Materials in Civil Engineering, 2004;16(5):433-443.
[18] Matsumoto T, Chon P, Suthiwarapirak P. Effect of fiber fatigue rupture on bridging stress degradation of fiber
reinforced cementitious composites. FRAMCOS-5: Proceedings of the Fifth International Conference on
Fracture Mechanics of Concrete and Concrete Structures, Vol. 2. Li VC, Leung CKY, Willam KJ, Billington
SL, editors. 2004, pp. 653-660.
[19] Suthiwarapirak P, Matsumoto T. Fiber bridging degradation based fatigue analysis of ECC under flexure.
Journal of Applied Mechanics, Japan Society of Civil Engineers, 2003;6:1179-1188.
[20] Li VC, Matsumoto T. Fatigue crack growth analysis of fiber reinforced concrete with effect of interfacial bond
degradation. Journal of Cement and Concrete Composites, 1998;20(5):339-351.
[21] Matsumoto T, Li VC. Fatigue life analysis of fiber reinforced concrete with a fracture mechanics based model.
Journal of Cement and Concrete Composites, 1999;21(4):249-261.
[22] Matsumoto T, Li VC. Uniaxial cyclic behavior of discontinuous fiber reinforced composites. Proceedings of
ASCE 4th Materials Engineering Conference, Chong KP, editors. 1996, pp. 426-435.
[23] Wu HC, Matsumoto T, Li VC. Buckling of bridging fibres in composites. Journal of Materials Science Letters,
1994;13:1800-1803.
37
Figure captions
Fig. 1. Shape and dimensions of specimens.
Fig. 2. Experimental set-up. Strain gauge is attached on each of side surfaces.
Fig. 3. Tension-compression loading sequence and crack behaviors.
Fig. 4. Tensile behaviors of Mix A specimens.
Fig. 5. Tensile behaviors of Mix B specimens.
Fig. 6. Multiple cracks of Mix A (left) and Mix B (right). Cracks are visualized with markings.
Fig. 7 Hysteresis curves during tension-compression fatigue of a Case 1 specimen.
Fig. 8 Bridging stress degradation curves during tension-compression fatigue.
Fig. 11 Fitting curve and bridging stress degradation curves of Case 1.
Fig. 12 Fitting curve and bridging stress degradation curves of Case 2.
Fig. 13 Fitting curve and bridging stress degradation curves of Case 3.
Fig. 9 Failure surface of a static tensile specimen with protruded fibers (up) and a tension-compression
fatigue (Case 1) specimen without protruded fibers (down).
Fig. 10 Buckling of a fiber and short protrusion of fibers.
Fig. 14 Fitting curve and bridging stress degradation curves during tensile fatigue with maximum
tensile strain of 0.1 %.
Fig. 15 Fitting curve and bridging stress degradation curves during tensile fatigue with maximum

38
tensile strain of 0.15 %.
Fig. 16 Fitting curve and bridging stress degradation curves during tensile fatigue with maximum
tensile strain of 0.2 %.

39
Tables
Table 1 Properties of PVA fibers
Type Diameter (mm) Length (mm) Volume fraction (%)
PVA 0.04 12 2

40
Table 2 Mix proportion
Water to binder ratio Fine aggregate to binder
ratio
Unit quantity of water
(kg/m3)
0.32 0.41 360
41
Table 3 Experimental cases
Case Mix Number of
specimens for
static tension
Number of
specimens for
fatigue
Maximum
compressive strain
in fatigue (%)
Maximum
tensile strain
in fatigue (%)
1 A 5
2 0.05 0.2
2 A 2 0 0.2
3 B 2 2 0.05 0.2

42
Table 4 Parameters of the fitting curves.
Case m No (cycles) a1 a2 b2
1 25 355 1/25 1/25 0.18
2 9 209 1/30 1/30 0.18
3 12 347 1/30 1/30 0.18

43
Table 5 Parameters of the fitting curves.
Case m No (cycles) a1 a2 b2
0.1 % 8 39811 1/15 0 0.2
0.15 % 5.7 63096 1/15 0 0.2
0.2 % 8 31623 1/20 0 0.33