Unequal Risks on the Flexible Labor Market, The Case of ... · Unequal Risks on the Flexible Labor...
30
Unequal Risks on the Flexible Labor Market, The Case of the Netherlands Govert E. Bijwaard * Econometric Institute Erasmus University Rotterdam Tinbergen Institute and IZA, Bonn Justus Veenman † Department of Economics Erasmus University Rotterdam * Bijwaard’s research is financially supported by the Netherlands Organisation for Scientific Research (NWO) nr. 451-04-011. We thank Klarita Sadiraj and Jan van Ours for valuable comments. We also benefited from the comments of participants at the 2007 EALE conference. Econometric Institute, Erasmus University Rotterdam, P.O. Box 1738, 3000 DR Rotterdam, The Netherlands; Phone: (+31) 10 40 81424; Fax: (+31) 10 40 89162; E-mail: [email protected]. † Veenman’s research is financially supported by the Netherlands Organisation for Scientific Research (NWO), nr. 26198904. Department of Economics, Erasmus University Rotterdam, The Netherlands, Phone: (+31) 10 40 82777, Fax (+31) 10 40 89040, e-mail: [email protected].
Transcript of Unequal Risks on the Flexible Labor Market, The Case of ... · Unequal Risks on the Flexible Labor...

Unequal Risks on the Flexible Labor Market,
The Case of the Netherlands
Govert E. Bijwaard∗
Econometric Institute
Erasmus University Rotterdam
Tinbergen Institute
and IZA, Bonn
Justus Veenman†
Department of Economics
Erasmus University Rotterdam
∗Bijwaard’s research is financially supported by the Netherlands Organisation for Scientific Research (NWO)
nr. 451-04-011. We thank Klarita Sadiraj and Jan van Ours for valuable comments. We also benefited from the
comments of participants at the 2007 EALE conference. Econometric Institute, Erasmus University Rotterdam,
P.O. Box 1738, 3000 DR Rotterdam, The Netherlands; Phone: (+31) 10 40 81424; Fax: (+31) 10 40 89162;
E-mail: [email protected].†Veenman’s research is financially supported by the Netherlands Organisation for Scientific Research (NWO),
nr. 26198904. Department of Economics, Erasmus University Rotterdam, The Netherlands, Phone: (+31) 10 40
82777, Fax (+31) 10 40 89040, e-mail: [email protected].

Unequal Risks on a Flexible Labor Market,
The Case of the Netherlands
Abstract
In accordance with the needs and preferences of both employers and employees, labor
markets in Western countries became increasingly flexible. However, for workers such
flexibility bears the risk of long-term exclusion. This paper deals with unequal exclusion-
ary risks on contemporary labor markets, particularly for those who are inactive and have
unfavorable endowments. The data used to reveal the risks are based on stock sampling.
We estimate hazard rate models that account for both the stock-sampling and the possible
maximum duration for the transitions from unemployment, household care and disability
to employment. In our analyses we try to control for differences in human capital char-
acteristics, using a decomposition method. The main result is that unequal risks exist,
but to a different degree for the various groups and with variations per transition type.
Transition skills seem to have some but not much effect on job chances, while labor market
experience turns out to protect from long-term exclusion.
JEL classification: C41, J64, J7.
Key words: Flexible labor market; duration; Oaxaca-Blinder decomposition.

1 Introduction
Ever since the seminal work of Atkinson (1984a,b) economists study labor market flexibilization.
Originally, the employers’ perspective dominated, as flexibilization was regarded as a necessary
adaptation of the use of workers to increasingly turbulent consuming markets and fast-changing
technologies. Research then focused on the effects on workers in different market segments.
More recently, attention has also been paid to workers’ needs and preferences. Certain types of
flexibilization are now looked upon as chosen by employees who want to bring their working
career in line with the requirements of their private life. Labor market flexibilization therefore
seems to be advantageous for both employers and employees. It thus comes as no surprise that
flexibilization is an ongoing process in today’s Western labor markets. For some, flexibilization
is even the core characteristic of such markets.
Among them is the German economist Schmid (1998, 2002) who typifies modern labor mar-
kets as ‘transitional’ markets. He found that employees experience a growing number of tran-
sitions during their working career as a result of increasing worker flexibility. Such transitions
concern the domain of paid labor itself, e.g. transitions from one job to another, as well as tran-
sitions between work and other activities, such as family care, education, and unemployment.
Since work became more variable and insecure, ‘life-long tenures’ are becoming a characteristic
of the past. The standard biography (education-work-inactivity for males and education-work-
marriage/care-inactivity for females) increasingly vanishes. It has gradually been replaced by
a biography of choice, the more so since many transitions occur voluntarily from the workers’
point of view. However, the situation of individual ‘free choice’ has a drawback. The new bi-
ography, which has been described as a ‘do-it-yourself biography’, in some instances turns out
to be a ‘breakdown biography’ (Beck 1992, Giddens 1991). Current labor markets are there-
fore considered risky for many workers. The main risk being that interruptions of the working
career that are meant to be temporary, become unintentionally permanent. For such cases
Schmid uses the term ‘exclusionary risks’. They occur particularly in transitions from work to
unemployment, prolonged illness and household care.
Traditionally, workers with restricted human capital run the highest risk of prolonged non-
1

working periods. However, as transitional labor markets are characterized by ‘institutional
arrangements’ (Schmid, 1998) that are meant to facilitate returning to paid labor, workers’
transition skills have become increasingly important (Buitendam, 2001). The term refers to
knowing the rules and regulations of the modern labor market, and to correctly applying these
rules and regulations in their own situation. We may assume that individuals vary in the degree
of transition skills just as they differ in human capital. This holds true even when protective
institutional arrangements are available, as individuals also vary in ‘institutional self-activity’
(Dewey 1990) which means that people differ in the ability to understand and use provisions
provided by public services.
Such arrangements became increasingly important because of the aforementioned risks on
contemporary labor markets. Governments apply policy measures to further the return to work
for those who experience a break in their working career. Activating labor market policies,
supported by public and private arrangements stimulating labor market transitions, advance
the efficient operation of the labor market as well as diminish the risks of long-term exclusion
from paid labor. The Netherlands offers a good example in this respect (Schmid, 1998, 2002).
The Dutch labor market can be characterized as transitional. It shows a high proportion of part-
time work in newly created jobs. Furthermore, a large number of policy measures is directed
at the placement of long-term unemployed with a vulnerable labor market position, while the
government uses a ‘flexicurity’-approach to optimize flexibility and work security (Wilthagen
1998).
Given the Dutch labor market situation, it is particularly interesting to choose the Nether-
lands as a case to investigate whether those out of work are able to find a job again and if
so, at what pace. We therefore study the unemployed, the disabled to work and those who
are in domestic care, and analyze their job chances. We are particularly interested whether
groups with unfavorable characteristics still have larger exclusionary risks. We will control for
human capital-characteristics to establish the importance of transitional skills. In this respect,
the finding of Distelbrink and Pels (2002) is important. They established that immigrants in
the Netherlands experience far more problems in relation to self-activity. The researchers found
2
this to be a consequence of their upbringing which is more directed at compliance and respect
than at autonomic thinking and acting. They furthermore explain these self-activity problems
by the lower educational levels of immigrants. We thus expect immigrants to have less ‘transi-
tional skills’ in addition to impediments in their human capital, such as lower education and
limited labor market experience (Veenman 1998). We will therefore focus on a comparison of
the exclusionary risks of immigrants and Dutch natives.
Trying to gain insight into the risks of exclusionary transitions, we focus on those who are
unemployed or inactive now, to ascertain their chances of finding a job (again). As stated, we are
interested in three transition types, namely from unemployment to work, from domestic care to
work, and from prolonged illness (disability to work, to be more precise) to work.1 The latter is
of special interest for the Netherlands, where about 960,000 people received an allowance since
they were officially registered as disabled to work in 2004 (Statistic Netherlands).2 We will
systematically compare the transition chances of immigrants and Dutch natives in these areas.
To this end we estimate proportional hazard models for each group and for each transition from
inactivity to work separately.
To explain the differences in exclusionary risks we calculate a decomposition of the differ-
ences in expected duration, implied by the hazard models, for each immigrant group and the
native expected duration. This is a non-linear version of the well-known decomposition method-
ology of Oaxaca (1973) and Blinder (1973). Our methodology is an extension of the approach
of Fairlie (2005) developed for the decomposition of logit and probit models. With this exten-
sion, being another contribution of this paper, we hope to gain insight into the importance of
transition skills. In Section 2 we discuss our method and the data used. The empirical analyses
and their results are presented in Section 3, where each of the three aforementioned transitions
are elaborated on subsequently. Section 4 contains our conclusions and a short discussion of
1The transition from education to work could have been added, but since we lack data on the duration of
inactivity of those who left education, we are not able to estimate their hazard rates.2Recently several measures were taken to diminish the number of those who are disable to work. The positive
results show from the decline to about 880,000 people in 2005. To put this number in perspective, we add that
the employed labor force in the Netherlands then counted about 6,9 million people.
3
the main findings.
2 Data and method
With the exception of the year 1967, the Netherlands is a country of net immigration since the
1960s. From that time and until the 1990s, four immigrant groups dominated immigration. The
majority, about 70 percent of the immigrants and their descendants, came from Turkey and
Morocco (the Mediterraneans), and from Suriname and the Dutch Antilles (the Caribbeans). We
will therefore focus on these four groups, also because they are the best documented immigrant
groups in the Netherlands. Our data are from the nationwide survey ‘Social Position and Use
of Public Utilities by Migrants’, more specifically from the survey’s editions for the years 1998
and 2002.3 The survey’s main purposes are to gain insight into (the development of) the socio-
economic position of the four largest immigrant groups in the Netherlands (Turks, Moroccans,
Surinamese and Antilleans), in the variety in socio-economic position among these groups, as
well as in differences in position compared to the native Dutch.4 Because of the high degree of
spatial concentration of immigrants in the larger cities, the survey is based on random sampling
within the 13 largest Dutch cities. This procedure results in nationwide representativeness for
the four immigrant groups.5
In each household, the head of household was asked to answer general questions on the
composition of the household and (if relevant) on its migration history. All members of the
household older than 11 years were asked to answer the other questions. Both the first generation
of actual immigrants and the second generation (of descendants) are represented in the survey.
Table 1 shows the number of respondents per group.
3 The 1998 survey was carried out by the Institute for Sociological and Economic Research (ISEO) from
Erasmus University Rotterdam in cooperation with the Social and Cultural Planning Office of the Netherlands
(SCP). In 2002, ISEO cooperated with the SCP and, on specific items, with researchers from the Netherlands
Organisation for Scientific Research (NWO)-Program Netherlands Kinship Panel Study (NKPS).4To be considered as a member of one of the immigrant groups, the person, or at least one of his parents,
should come from the country concerned.5More detailed information on the survey can be found in Groeneveld and Weijers-Martens (2003).
4

Table 1: Number of people in SPVA by ethnic origin and economic position.
Turks Moroccans Surinamese Antilleans Natives Total
Economic position*
Unemployed searching for job 589 500 364 263 128 1844
Domestic care 1328 1164 439 308 402 3641
Disability benefits 552 440 303 116 165 1576
* People aged 18 to 65 years. Source: SPVA (ISEO/SCP)
2.1 Duration analysis
The data used contain retrospective information on the length of the elapsed duration in the
labor market situation at the time of the interview. These data on the duration in a particular
state are based on stock sampling, because they are obtained by sampling from the stock
in that state using a single interview.6 Since for some individuals labor market transitions
occur at a very low rate, these individuals may stay in their current state until they reach
the retirement age of 65. In the Netherlands, as in most European countries, unemployment
benefits and disability benefits cease after retirement. In fact, everybody leaves the (potential)
labor force when reaching the retirement age. This implies that every state has an upper bound
of its duration until retirement. We will account for both the stock-sampling and the possible
maximum duration.
In duration analysis the hazard rate or intensity is usually modelled. A common way to
accommodate the presence of observed characteristics is to specify a proportional intensity
model,
λ(t|x) = λ0(t; α)eβ′xi(t), (1)
where λ0(t; α) represents the baseline hazard, that is, the duration dependence of the intensity
common to all individuals. The covariates affect the intensity proportionally, and the time-
varying variables are external variables that change independently of the employment state,
6In fact some individuals are interviewed twice, both in 1998 and in 2002, in the SPVA. However, this occurs
only for a very limited number of individuals. We therefore ignore the panel structure of the data.
5
such as the age of a disabled individual that changes independently of the employment state.
If the duration of individual i has an upper bound of ti, the time till retirement, the hazard of
leaving unemployment at ti is ∞. This implies that the probability to reach ti for individual i
is S(ti|xi) = exp(
−∫ ti
0λ0(s; α)eβ′xi(s) ds
)
.
If we sample from a stock of individuals at time 0 (in calendar time) in a particular state,
e.g. from the stock of people on disability benefits, and observe the elapsed time e in that
state, then the distribution of the observations of the elapsed time is a conditional distribution,
see among others Heckman and Singer (1984). The condition is the presence of a particular
individual in the stock. Let r(−e|xi) denote the entry rate, the probability to enter the state
during [e, e + de) in the past given observed characteristics x and assume, as Nickell (1979)
does, that the entry of people with characteristics x is a constant fraction of the total entry,
r(−e|x) = r1(−e)r2(x). Then the density of the elapsed duration for individual i, adapted for
the upper bound in the duration, is
h(e|ti, xi) =r1(−e)e−Λ(e|xi)
∫ ti
0r1(−τ)e−Λ(τ |xi) dτ
(2)
where Λ(e|xi) =∫ e
0λ0(s; α) exp
(
β ′xi(s))
ds, the integrated hazard.
In practice it is hard to find a closed form solution to the integrals in the density. For
example, the commonly applied proportional hazard model with Weibull baseline hazard leads
to intractable integrals. Although these integrals may be approximated, the Weibull baseline
is also very restrictive. A very flexible and tractable assumption is to use a piecewise constant
baseline hazard. If the entry rate is also constant on intervals we have a closed form expression
for the density of the elapsed duration, from which we can easily derive a maximum likelihood
estimator for the parameters of the model.
A well known issue in duration models is that neglecting unobserved heterogeneity in pro-
portional hazards models leads to spurious negative duration dependence. In principle it is
possible to allow for possible unobserved heterogeneity in our model through a multiplicative
random error term in the hazard, λ(t|x, v) = vλ0(t; α)eβ′xi(t). Murphy (1996) shows how to
include Gamma-distributed unobserved heterogeneity into the stock-sampled proportional haz-
ards model. The adjustment to a possible upper bound on the duration is rather straightforward,
6

as is the use of a discrete unobserved heterogeneity distribution. We attempted to fit models
with a gamma or with a discrete unobserved heterogeneity distribution. However, none of these
models have led to an indication of unobserved heterogeneity or a change in the parameters
and, therefore, we do not present the details of the models with unobserved heterogeneity.
2.2 Decomposition of the difference in expected duration
Since we want to find out whether transition skills affect the differences in expected durations,
we use a decomposition method. The standard wage decomposition methodology of Oaxaca
(1973) and Blinder (1973) has been widely used to examine discrimination in the labor market.
The technique decomposes the average difference in wages between two demographic groups
into differences in observable characteristics (differences that the variables in the regression
model can explain, mainly endowments), and differences in coefficient estimates (the structure
of the model that cannot be explained).
Suppose we distinguish two groups g = 1, 2 and observe for each group i = 1, . . . , Ng
individuals. Consider the following linear regression model, which is estimated separately for
each group
Yig = Xigβg + ǫig (3)
For such a linear model, the standard Oaxaca-Blinder decomposition of the average value of
the dependent variable is
Y1 − Y2 = (X1 − X2)β1 + X2(β1 − β2) (4)
where Yg = N−1g
∑Ng
i=1 Yig and Xg = N−1g
∑Ng
i=1 Xig. The first term on the right-hand side of
(4) represents the difference in the outcome variable between the groups due to differences in
observable characteristics and the second term represents the differential due to differences in
coefficient estimates. The second term also captures the portion of the differential due to group
differences in unobserved characteristics.
However, in most models for duration outcomes the expectation is a non-linear function
of the coefficients β and ancillary parameters α reflecting the shape of the baseline hazard.
7

Additionally, duration data are usually censored and OLS estimation leads to biased estimation
of the parameter vector and hence to misleading results of the decomposition. We follow Fairlie
(2005) for the decomposition of the non-linear difference in expected duration. Let E(Xi, β, α)
denote the expected duration for the individual with characteristics Xi given the coefficient
vector β and the baseline hazard parameter vector α. Then the decomposition of the non-linear
difference in expected duration Y1 − Y2 can be written as
D1 =
[
N1∑
i=1
E(Xi1, β1, α1)
N1−
N2∑
i=1
E(Xi2, β1, α1)
N2
]
+
[
N2∑
i=1
E(Xi2, β1, α1)
N2
−
N2∑
i=1
E(Xi2, β1, α2)
N2
]
(5)
+
[
N2∑
i=1
E(Xi2, β1, α2)
N2−
N2∑
i=1
E(Xi2, β2, α2)
N2
]
The first term in brackets on the right-hand side reflects the contribution of the observed
characteristics, the second term in brackets reflects the contribution of the baseline hazard
and the last term in brackets reflects the contribution of the coefficients to the difference in
expected duration. Note that the decomposition also depends on the shape parameter(s), α.
Consequently, there are three other equivalent possible decompositions of the difference in
expected duration between the two groups on which αg is used in the counterfactual parts of
the decomposition equation (see Appendix A).
The alternative methods of calculating the decomposition provide different estimates, which
is the familiar index problem with the Oaxaca-Blinder decomposition. Ham et al. (1998) suggest
to average over the alternative decompositions to estimate the contribution of the coefficient
estimates and of the coefficients. They did not consider the difference in the baseline hazard.
Thus including the ancillary parameters, we propose to measure the contribution of the differ-
ences in the duration between the groups due to differences in observable characteristics in a
similar way (see Appendix A).
Note that the three components add to the difference in mean. However, this holds only
for uncensored data. For censored data (and also for stock-sampled data) the average observed
duration is not equal to the true underlying expected duration. Therefore, we decompose the
8

expected durations implied by the proportional hazards model in section 2.1, instead of the
observed mean durations. By doing this, we are able to find out whether there is room for the
explanatory variable transition skills in addition to the observed characteristics in the model.
Many articles only report the size of each of the components of the difference in the mean
between the two groups. Without knowing the significance of these components, this is of little
value. However, for our nonlinear decomposition method (and because it is an average of four
alternative decompositions) it is very hard to calculate the exact variance. We therefore rely
on a bootstrap method to calculate the approximate variances of each of the components.
3 Differences in exclusionary risks
In this section we attempt to establish whether the contemporary flexible labor market in the
Netherlands implies higher risks of ‘exclusionary’ transitions for immigrants than for Dutch
natives, and if so, why. As stated before, we will subsequently focus on three transition types:
from unemployment, domestic care and prolonged illness (disability to work) to paid work.
3.1 From unemployment to work
The unemployment rate among immigrant groups ‘officially’ registered by the Employment
Office is four to five times higher than among Dutch natives, with the most disadvantageous
figures for the Mediterraneans.7 These differences in employment rate are reflected in data on
the unemployment duration. Looking at the ‘registered’ unemployment again, we find that the
Turks have, on average, the longest duration, followed by (in this order) Antilleans, Moroccans
7The ‘registered’ unemployment figures are: Dutch natives 2%, Surinamese: 7%, Antilleans 8%, Moroccans
9% and Turks 10%. (source: SPVA-2002 and survey Labor Force 2002)
9
and Surinamese.8
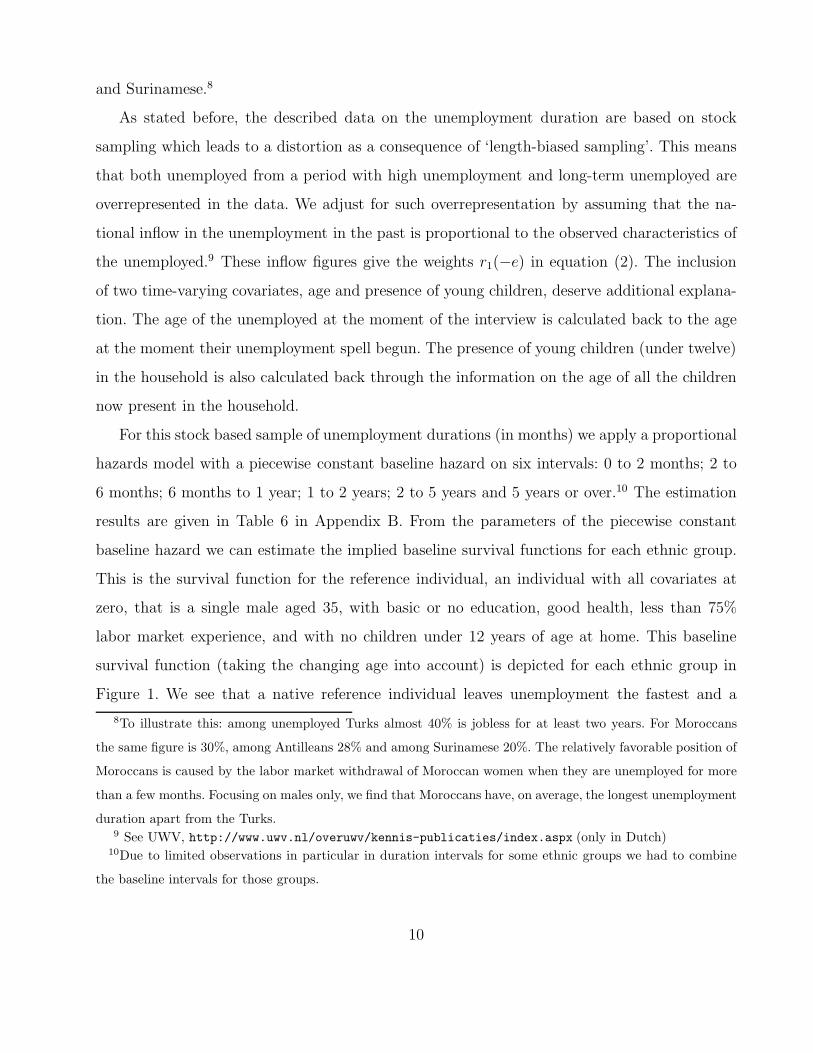
As stated before, the described data on the unemployment duration are based on stock
sampling which leads to a distortion as a consequence of ‘length-biased sampling’. This means
that both unemployed from a period with high unemployment and long-term unemployed are
overrepresented in the data. We adjust for such overrepresentation by assuming that the na-
tional inflow in the unemployment in the past is proportional to the observed characteristics of
the unemployed.9 These inflow figures give the weights r1(−e) in equation (2). The inclusion
of two time-varying covariates, age and presence of young children, deserve additional explana-
tion. The age of the unemployed at the moment of the interview is calculated back to the age
at the moment their unemployment spell begun. The presence of young children (under twelve)
in the household is also calculated back through the information on the age of all the children
now present in the household.
For this stock based sample of unemployment durations (in months) we apply a proportional
hazards model with a piecewise constant baseline hazard on six intervals: 0 to 2 months; 2 to
6 months; 6 months to 1 year; 1 to 2 years; 2 to 5 years and 5 years or over.10 The estimation
results are given in Table 6 in Appendix B. From the parameters of the piecewise constant
baseline hazard we can estimate the implied baseline survival functions for each ethnic group.
This is the survival function for the reference individual, an individual with all covariates at
zero, that is a single male aged 35, with basic or no education, good health, less than 75%
labor market experience, and with no children under 12 years of age at home. This baseline
survival function (taking the changing age into account) is depicted for each ethnic group in
Figure 1. We see that a native reference individual leaves unemployment the fastest and a
8To illustrate this: among unemployed Turks almost 40% is jobless for at least two years. For Moroccans
the same figure is 30%, among Antilleans 28% and among Surinamese 20%. The relatively favorable position of
Moroccans is caused by the labor market withdrawal of Moroccan women when they are unemployed for more
than a few months. Focusing on males only, we find that Moroccans have, on average, the longest unemployment
duration apart from the Turks.9 See UWV, http://www.uwv.nl/overuwv/kennis-publicaties/index.aspx (only in Dutch)
10Due to limited observations in particular in duration intervals for some ethnic groups we had to combine
the baseline intervals for those groups.
10

Turkish reference individual the slowest.
[Place Figure 1 here]
The impact of observed characteristics on the outflow into employment differs substantially
among the ethnic groups. We see from Table 6 (in Appendix B) that the relative labor market
experience, that is the percentage of time spent working since graduating, is the most important
variable. The more labor market experience the faster the unemployed return to work. This
effect is the highest for Antilleans. Antillean women have a lower reemployment rate. Highly
educated Turks, Moroccans and Dutch natives have a faster return to employment. For Turks
and Moroccans individuals, health problems lead to lower reemployment rate. The presence
of young children reduces the reemployment rate (only significant for Turks, Moroccans and
Surinamese).
To measure the possible effect of the unobserved transition skills on the exclusionary risks,
we applied the decomposition method explained in section 2.2. For each immigrant group we
calculate the expected unemployment duration implied by parameter estimates and compare
it with the expected duration of Dutch natives. The decomposition allows us to calculate the
portion of the difference that arises from differences in coefficients, the portion of the difference
that arises from differences in the baseline hazard (different survival rates for the reference
individual) and the portion of the difference that arises from differences in explanatory variables.
The results in Table 2 show that Turks and Moroccans have by far the longest expected
unemployment duration (around three years) and Dutch natives by far the shortest (about 5
months). The difference in the expected unemployment duration is mainly attributable to the
fact that the variables in our model turn out to be unfavorable for the job chances of Turks and
Moroccans. The difference in coefficients does not lead to a significant difference in the expected
unemployment duration, neither does the difference in the baseline duration dependence. Al-
though for Turks and Moroccans the reference unemployed individual (a single male, aged 35,
with basic or no education, good health, less than 75% labor market experience, and without
children) has a higher expected unemployment duration than the native reference individual,
this difference is not significant. These findings imply that the observed human capital charac-
11
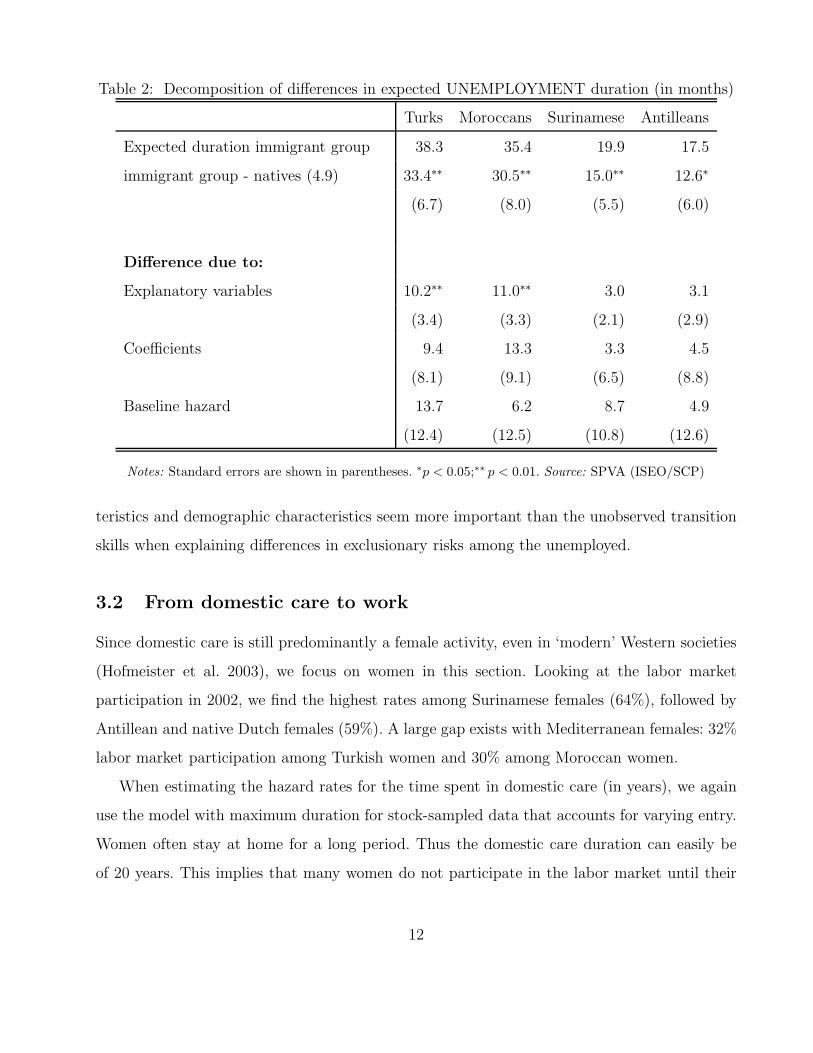
Table 2: Decomposition of differences in expected UNEMPLOYMENT duration (in months)
Turks Moroccans Surinamese Antilleans
Expected duration immigrant group 38.3 35.4 19.9 17.5
immigrant group - natives (4.9) 33.4∗∗ 30.5∗∗ 15.0∗∗ 12.6∗
(6.7) (8.0) (5.5) (6.0)
Difference due to:
Explanatory variables 10.2∗∗ 11.0∗∗ 3.0 3.1
(3.4) (3.3) (2.1) (2.9)
Coefficients 9.4 13.3 3.3 4.5
(8.1) (9.1) (6.5) (8.8)
Baseline hazard 13.7 6.2 8.7 4.9
(12.4) (12.5) (10.8) (12.6)
Notes: Standard errors are shown in parentheses. ∗p < 0.05;∗∗ p < 0.01. Source: SPVA (ISEO/SCP)
teristics and demographic characteristics seem more important than the unobserved transition
skills when explaining differences in exclusionary risks among the unemployed.
3.2 From domestic care to work
Since domestic care is still predominantly a female activity, even in ‘modern’ Western societies
(Hofmeister et al. 2003), we focus on women in this section. Looking at the labor market
participation in 2002, we find the highest rates among Surinamese females (64%), followed by
Antillean and native Dutch females (59%). A large gap exists with Mediterranean females: 32%
labor market participation among Turkish women and 30% among Moroccan women.
When estimating the hazard rates for the time spent in domestic care (in years), we again
use the model with maximum duration for stock-sampled data that accounts for varying entry.
Women often stay at home for a long period. Thus the domestic care duration can easily be
of 20 years. This implies that many women do not participate in the labor market until their
12

retirement age. The upper bound on the duration therefore has an important impact on the
estimation results. The participation rate of women in the Netherlands increased only recently.
In the late 70s less than 20% of the women were participating in the labor market. This implies
an overrepresentation of women who began their domestic care in the 70s or earlier. We adjust
for this overrepresentation by assuming that the national inflow in domestic care in the past is
proportional to the number of non-participating women 20 years of age.11 We also assume that
this inflow is proportional to the observed characteristics of the women.
We estimate a proportional hazards model with a piecewise constant baseline hazard on
four intervals: 0 till 10 years; 10 till 15 years; 15 till 20 years and 20 years and beyond.12 The
estimation results are given in Table 7 in Appendix B. Again, the parameters estimates differ
among the ethnic groups. We estimate the implied survival rate for the reference female, that
is a single female, aged 40, with basic or no education, less than 75% labor market experience,
with no children under 12 years of age living at home. This baseline survival function (taking
the changing age into account) is depicted for each ethnic group in Figure 2. A Dutch native
(reference) female in domestic care has the slowest outflow into employment, while an Antillean
female has the fastest.
[Place Figure 2 here]
The impact of observed characteristics on the reemployment rate out of domestic care
differs substantially among the ethnic groups. Table 7 shows that the relative labor market
experience is again the most important variable. If a woman worked more than 75% of her
potential productive years (labor market experience > 75%), she leaves domestic care and
starts working again much faster. This effect is the highest for native women. Education is also
an important factor in explaining the re-entry of women into the labor market. The higher
the education level, the faster a woman leaves domestic care for work. This effect is very
pronounced for Moroccan and native women. However, among Antilleans the education level
does not have a significant effect on the reemployment rate of women in domestic care. Marital
11See the public statistics site of Statistics Netherlands, http://statline.cbs.nl/ for the numbers.12See note 10.
13

status is important for Turkish, Moroccan and Surinamese women. Within all three groups,
married/cohabiting women leave domestic care faster. The presence of young children reduces
the rate of leaving domestic care, especially for native and Moroccan women. To find out to
what extent transition skills may affect the expected duration of domestic care, we apply the
decomposition method explained in section 2.2.
Table 3: Decomposition of differences in expected HOUSEHOLD CARE duration (in years)
Turks Moroccans Surinamese Antilleans
Expected duration immigrant group 27.0 34.6 22.8 21.9
immigrant group - natives (18.9) 8.1∗∗ 15.7∗∗ 3.9 3.0
(2.9) (4.8) (3.7) (4.1)
Difference due to:
Explanatory variables 13.7∗∗ 17.8∗∗ 8.8∗∗ 9.0∗∗
(2.0) (4.3) (1.7) (2.5)
Coefficients 13.8∗∗ 7.1 11.8∗∗ 14.0∗∗
(3.7) (6.9) (4.6) (3.1)
Baseline hazard −19.5∗∗ −9.3 −16.6∗∗ −20.0∗∗
(4.9) (8.2) (6.5) (4.7)
Notes: Standard errors are shown in parentheses. ∗p < 0.05;∗∗ p < 0.01. Source: SPVA (ISEO/SCP)
The results in Table 3 show that Moroccan women have the longest expected domestic care
duration (35 years) and native women the shortest (19 years). The difference in the expected
domestic care duration for Moroccan women is attributable to the fact that the variables in
our model are unfavorable for their job chances. These variables are also disadvantageous for
Turkish women, and to a lesser extent, for Surinamese and Antillean women. Among Turkish,
Surinamese and Antillean women the coefficients also have a significant impact on the differences
in domestic care duration. This may be due to unobserved variables, among which transition
skills. It is, however, also possible that the coefficients reflect different effects of the observed
characteristics on the transition probability or a distinct difference in labor market position.
14

Our data are not decisive in this respect. We may only state that there could be room for
an explanation from transition skills. The baseline hazard for women from all four immigrant
groups is above the baseline hazard for native women, which is probably due to the fact that
native lower educated Dutch women, who completely stop working after giving birth to a child,
are a very specific category with rather traditional norms in relation to gender roles.
3.3 From prolonged illness to work
The last transition type to be discussed here is between prolonged illness and paid work.
Disability to work is a clear social and economic problem in the Netherlands. That is why we
focus on this form of prolonged illness. The SPVA-2002 contains data on self-reported disability
to work and on receiving a disability allowance. Combining these two variables, we find highly
varying proportions of disabled persons per ethnic group, as shown in Table 4.
Table 4: Percentage disabled persons in the total population (15-65 years) and in the labor
force by ethnic group
Turks Moroccans Surinamese Antilleans Dutch
M F M F M F M F M F
Total Population 11 8 11 4 5 7 4 4 9 8
Labor force 17 25 17 12 7 11 5 6 12 14
Source: SPVA (ISEO/SCP)
Looking at the total population (15-65 years of age), we find the proportion of disabled
persons to be the highest among Mediterranean males, followed by native Dutch males. The
proportion of disabled persons among Caribbean males is much lower. Among females, the
Turks and the Dutch natives show the highest proportion of disabled persons, followed by the
Surinamese. The proportion is low among Moroccan and Antillean women. The proportion of
disabled persons in the labor force (those working for at least 12 hours per week or actively
looking for work for at least 12 hours per week) is the highest among Turkish females (25%). This
is the result of a combination of relatively many disabled persons and a relatively small labor
15
force. Mediterranean males also show a high proportion of disabled persons in the labor force
(17%), followed at some distance by the native Dutch males (12%). A much lower proportion
is found among the Antilleans, males and females alike.
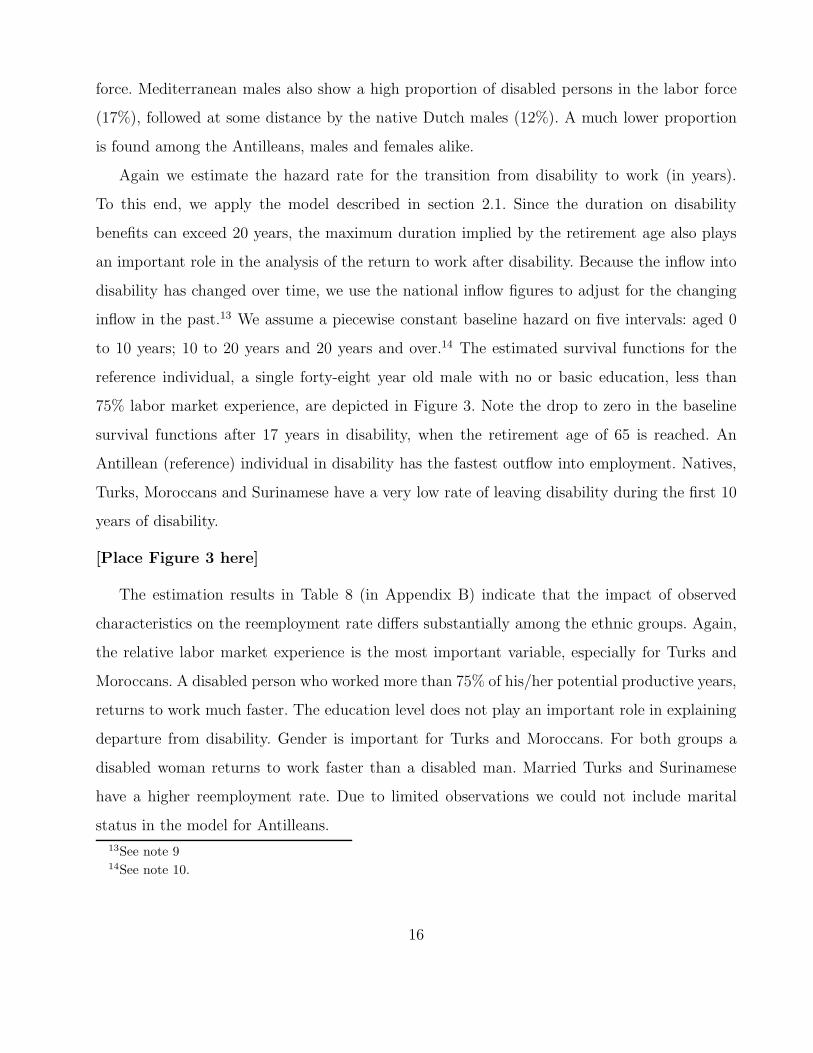
Again we estimate the hazard rate for the transition from disability to work (in years).
To this end, we apply the model described in section 2.1. Since the duration on disability
benefits can exceed 20 years, the maximum duration implied by the retirement age also plays
an important role in the analysis of the return to work after disability. Because the inflow into
disability has changed over time, we use the national inflow figures to adjust for the changing
inflow in the past.13 We assume a piecewise constant baseline hazard on five intervals: aged 0
to 10 years; 10 to 20 years and 20 years and over.14 The estimated survival functions for the
reference individual, a single forty-eight year old male with no or basic education, less than
75% labor market experience, are depicted in Figure 3. Note the drop to zero in the baseline
survival functions after 17 years in disability, when the retirement age of 65 is reached. An
Antillean (reference) individual in disability has the fastest outflow into employment. Natives,
Turks, Moroccans and Surinamese have a very low rate of leaving disability during the first 10
years of disability.
[Place Figure 3 here]
The estimation results in Table 8 (in Appendix B) indicate that the impact of observed
characteristics on the reemployment rate differs substantially among the ethnic groups. Again,
the relative labor market experience is the most important variable, especially for Turks and
Moroccans. A disabled person who worked more than 75% of his/her potential productive years,
returns to work much faster. The education level does not play an important role in explaining
departure from disability. Gender is important for Turks and Moroccans. For both groups a
disabled woman returns to work faster than a disabled man. Married Turks and Surinamese
have a higher reemployment rate. Due to limited observations we could not include marital
status in the model for Antilleans.
13See note 914See note 10.
16

Table 5: Decomposition of differences in expected DISABILITY duration (in years)
Turks Moroccans Surinamese Antilleans
Expected duration immigrant group 14.5 16.7 14.1 8.7
immigrant group - natives (16.0) -1.5 0.7 -1.9 -7.4
(3.7) (3.7) (3.8) (4.2)
Difference due to:
Explanatory variables 3.5∗∗ 3.5∗∗ 2.2∗ 1.1
(1.1) (1.6) (0.9) (0.8)
Coefficients 2.9 4.4 3.8 4.6
(3.8) (4.1) (3.2) (3.1)
Baseline hazard -7.9 -7.2 -7.8 −13.0∗
(6.0) (5.9) (5.5) (5.7)
Notes: Standard errors are shown in parentheses. ∗p < 0.05;∗∗ p < 0.01. Source: SPVA (ISEO/SCP)
We apply the decomposition method to reveal the possible effect of transition skills on the
expected disability duration. The results in Table 5 show that Moroccans have the longest ex-
pected disability duration (17 years) and Antilleans the shortest (9 years). This is a surprisingly
short period when compared to the expected disability duration of Dutch natives (16 years).
For Turks, Moroccans and Surinamese the high expected disability durations are attributable
to unfavorable observed characteristics, which leaves hardly any room for an explanation from
transition skills. Just as for the duration in domestic care of women, the baseline hazard for
immigrants is above the baseline hazard for Dutch natives. This difference is, however, only
significant for Antilleans who show a very favorable baseline hazard. This may indicate that
the disabled from this group have the transition skills necessary to return to paid labor.
17

4 Summary and conclusions
Contemporary labor markets are characterized by such a high degree of flexibility that a new
type of labor market is emerging. This market features a large number of transitions during
the working career. The so-called transitional labor market offers new chances to both em-
ployers and employees, but at the same time increases the risk of long-term exclusion for the
latter. The Netherlands offers a good example of a transitional labor market with institutional
arrangements to mitigate the risk of exclusionary transitions.
We investigated whether the contemporary flexible labor market in the Netherlands implies
higher risks of such transitions for groups which, for human capital reasons, are already vul-
nerable in the labor market. We added the criterion of restricted transition skills to select the
groups under study. This led us to compare immigrants to Dutch natives. We subsequently
focused on the transitions from (a) unemployment, (b) domestic care, and (c) prolonged illness
to work. We applied a duration analysis to estimate the chance of a transition from inactivity
to work for each group.
For the duration analysis we used proportional hazards models with maximum duration for
stock-sampled data that account for varying entry. We assumed a piecewise constant baseline
hazard on different intervals (calculated in months for unemployment and in years for both do-
mestic care and prolonged illness). Looking at the baseline survival function, we find that in the
case of unemployment the native Dutch reference individual leaves unemployment the fastest,
while Turks leave unemployment the slowest. The analysis of the transition from domestic care
to work, which is restricted to women, establishes that among the reference women Antilleans
clearly have the fastest outflow, while the Dutch natives have the slowest outflow. We explained
this somewhat remarkable outcome from the traditional attitude among the specific category
of lower educated native women who completely stop working after giving birth to a child. In
the case of disability to work, the transition to the labor market is the fastest for the Antillean
reference individual. More generally, Antilleans diverge remarkably from all other groups that
show very low outflows, especially in the first ten years of disability.
Our analyses thus show that unequal exclusionary risks exist, but to a different degree for the
18

various groups and with variations per transition type. Turks and Moroccans have the longest
expected unemployment duration. Among the Moroccans and the Turks, women also have
the longest expected home care duration. Moroccans furthermore have the longest disability
duration. While the expected unemployment duration among Antilleans is longer than among
Dutch natives, their expected disability duration is the shortest. Surinamese and Antilleans
have similar expected durations for unemployment and domestic care (among women), which
are both longer than the respective expected durations for Dutch natives.
To find out whether transition skills really affect the transition chances, we used decom-
position analyses on the expected durations estimated by the proportional hazards model. In
the case of unemployment, we first established that the impact of the observed characteristics
on the outflow differs among the various groups. We then showed that the higher exclusionary
risks for the Turks and Moroccans are mainly attributable to their unfavorable observed char-
acteristics. These characteristics concern both endowments and demographic features, such as
marital status, gender and age. Particularly for the Turks, the baseline duration dependence is
also unfavorable, which might indicate that transition skills are relevant. But the differences in
baseline hazards are not significant in the unemployment analysis.
In the case of domestic care, we again found fairly large differences in the impact of the
observed characteristics on the exclusionary risks of the immigrant groups. The decomposition
of the expected home care durations shows that the observed characteristics are particularly
unfavorable for Moroccan and Turkish women. Besides, for Moroccan women the coefficients
have no significant meaning at all. However, they do have significant meaning for women from
the other immigrant groups. This may imply several things: that the observed characteristics
have different effects for these women, that these women have a rather distinct labor market
position, or that (other) unobserved factors, such as transition skills, play a role in the explana-
tion of their outflow chances. Our data are not conclusive in this respect. For the explanation of
the disadvantageous baseline hazard of native Dutch women who completely stopped working
after giving birth to a child, we refer to what we just wrote about the traditional norms of this
specific category.
19

In the case of disability to work, the impact of the observed characteristics differs as well
among the various groups. The Antilleans, characterized by a fast outflow, show an advanta-
geous baseline hazard which may indicate that they have the relevant transition skills. The
low outflow of Turks, Moroccans and Surinamese seems to be primarily related to the observed
characteristics. The coefficients do not add significantly to the explanation, although recent
research shows that miscommunication between immigrant clients on the one hand, and civil
servants from the agency responsible for the disability benefits on the other hand, helps to
explain the disadvantaged outflow chances of the first (Veenman 2006).
The short discussion of the results from the decomposition analyses shows that transition
skills are not dominant in the explanation of exclusionary risks. Human capital characteristics
and demographic features turn out to be far more important. Moreover, an important finding
is that the relative labor market experience, i.e. the percentage of time spent working after
education, was the only variable with significant meaning in our duration analyses. The longer
the period of labor market participation, the faster the expected return to work for those who
are presently unemployed, taking care of children or who are disabled. If the duration of labor
market experience is of such importance, it means that rapid back-to-work transitions are a
strong remedy against exclusionary transitions. This somewhat circular reasoning underlines
the importance of institutional arrangements such as ‘activating’ labor market policies. Without
such arrangements, the modern flexible labor market may present an even bigger challenge to
groups that are already vulnerable for human capital reasons.
Generally speaking, our analyses show that duration analyses combined with decomposition
analyses reveal a lot about exclusionary risks. They are however not conclusive with respect to
the explanatory variables. That is why we plead for more labor market research, preferably panel
research. This is probably a far more superior method in trying to achieve a real comprehension
of exclusionary labor market processes.
References
Atkinson, J. (1984a). Flexibility, uncertainty, and manpower management. IMS Report No.89, Institute of Management Studies, Brighton.
20

Atkinson, J. (1984b). Manpower strategies for flexible organisations. Personnel Manage-ment August, 28–31.
Beck, U. (1992). Risk Society, Towards a New Modernity. London: Sage.
Blinder, A. S. (1973). Wage discrimination: Reduced form and structural estimates. Journalof Human Resources 8, 436–455.
Buitendam, A. (2001). Een open architectuur voor arbeid en organisatie. Assen: Van Gorcum.
Dewey, J. (1990). The school and society and the child and the curriculum. Chicago: TheUniversity of Chicago Press.
Distelbrink, M. and T. Pels (2002). Normatieve orientaties en binding (’Normative orienta-tions and bonding’). In J. Veenman (Ed.), De toekomst in meervoud, pp. 115–145. Assen:Van Gorcum.
Fairlie, R. W. (2005). An extension of the Blinder-Oaxaca decomposition technique to logitand probit models. Journal of Economic and Social Measurement 30, 305–316.
Giddens, A. (1991). Modernity and self-identity, Self and society in the late modern-age.Cambridge (UK): Polity Press.
Groeneveld, S. M. and Y. M. R. Weijers-Martens (2003). Minderheden in beeld, De SPVA-02(’A portrait of ethnic minoirities, The SPVA-2002’). Rotterdam: Institute for Sociologicaland Economic Research.
Ham, J. C., J. Svejnar, and K. Terrel (1998). Unemployment and the socail safety net dur-ing transitions to a market economy: Evidence from the Czech and Slovak Republics.American Economic Review 88, 1117–1142.
Heckman, J. J. and B. Singer (1984). Econometric duration analysis. Journal of Economet-rics 24, 63–132.
Hofmeister, H., M. Mills, and H. P. Blossfeld (2003). Globalization, uncertainty, and women’smid-career life courses, A theoretical framework. Globalife Working paper 45, Faculty ofSocial and Economic Science, Bamberg.
Murphy, A. (1996). A piecewise–constant hazard-rate model for the duration of unemploy-ment in single-interview samples of the stock of unemployed. Economics Letters 51, 177–183.
Nickell, S. (1979). Estimating the probability of leaving unemployment. Econometrica 47,1249–1266.
Oaxaca, R. L. (1973). Male–female wage differentials in urban labor markets. InternationalEconomic Review 14, 693–709.
Schmid, G. (1998). Transitional labour markets, A new European employment strategy. Dis-cussion paper FS I 98-206, Wissenschaftszentrum Berlin fur Sozialforschung, Berlin.
Schmid, G. (2000). Foreword. In J. O’Reilly, I. Cebrian, and M. Lallement (Eds.), Working-time Changes: Social Integration through Transitional Labour Markets, pp. xix–xxi. Chel-tenham, UK: Edward Elgar.
21

Schmid, G. (2002). Employment systems in transition: Explaining performance differentialsof post-industrial economies. In G. Schmid and B. Glazier (Eds.), The Dynamics of FullEmployment, Social Integration through Transitional Labour Markets, pp. 23–48. Chel-tenham, UK: Edward Elgar.
Veenman, J. (1998). Buitenspel, Over langdurige werkloosheid onder etnische minderheden(’Off-side, Long-term unemployed ethnic minorities’). Assen: Van Gorcum.
Veenman, J. (Ed.) (2006). Nieuwe ongelijkheden op de transitionele arbeidsmarkt (’New in-equalities on the transitional labour market’), Amsterdam. Aksant.
Wilthagen, T. (1998). Flexicurity, A new paradigm for labour market policy reform? Discus-sion paper FS I 98-202, Wissenschaftszentrum Berlin fur Sozialforschung, Berlin.
A Decomposition
For the decomposition in (5) there are three other equivalent possible decompositions of thedifference in expected duration between the two groups on which αg is used in the counterfactualparts of the decomposition equation
D2 = D(
X1, 1, 1, X2, 1, 1)
+ D(
X2, 2, 1, X2, 2, 2)
+ D(
X2, 1, 1, X2, 2, 1)
D3 = D(
X1, 2, 2, X2, 2, 2)
+ D(
X1, 1, 1, X1, 1, 2)
+ D(
X1, 1, 2, X1, 2, 2)
D4 = D(
X1, 2, 2, X2, 2, 2)
+ D(
X1, 2, 1, X1, 2, 2)
+ D(
X1, 1, 1, X1, 2, 1)
where
D(
Xm, b1, a1, Xn, b2, a2)
=Nm∑
i=1
E(Xim, βb1 , αa1)
Nm
−Nn∑
i=1
E(Xin, βb2, αa2)
Nn
The alternative methods of calculating the decomposition provide different estimates, which isthe familiar index problem with the Oaxaca-Blinder decomposition. Ham et al. (1998) suggestto average over the alternative decompositions to estimate the contribution of the coefficient es-timates and of the coefficients. They did not consider the difference in the baseline hazard. Thusincluding the ancillary parameters, we propose to measure the contribution of the difference inthe duration between the groups due to differences in observable characteristics by
D(X) =1
2
2∑
k=1
D(
X1, k, k, X2, k, k)
(6)
The contribution of the coefficient estimates to the differential is measured by
D(β) =1
4
2∑
g=1
[
D(
Xg, 1, 2, Xg, 2, 2)
+ D(
Xg, 1, 1, Xg, 2, 1)
]
(7)
22

The contribution of the baseline hazard to the differential is measured by
D(α) =1
4
2∑
g=1
[
D(
Xg, 2, 1, Xg, 2, 2)
+ D(
Xg, 1, 1, Xg, 1, 2)
]
(8)
Note that D(X) + D(β) + D(α) = D(
X1, 1, 1, X2, 2, 2)
= Y1 − Y2, as should be.
B Estimation results
23

Table 6: Parameter estimates of hazard model with maximum duration for time in UNEM-PLOYMENT (in months)
Turks Moroccans Surinamese Antilleans Natives
Regression coefficients
Female 0.019 0.178 −0.046 −0.305∗ −0.082(0.089) (0.112) (0.081) (0.122) (0.114)
Married/Cohabiting 0.075 −0.098 0.189 0.017 0.015(0.089) (0.098) (0.105) (0.173) (0.115)
Low Secondary educ. 0.254 0.376∗ 0.207 0.051 0.065(0.134) (0.177) (0.109) (0.165) (0.189)
High Secondary educ. 0.458∗∗ 0.377∗ 0.068 −0.107 0.272(0.159) (0.184) (0.108) (0.163) (0.168)
High education 0.458∗∗ 0.377∗ 0.068 −0.107 0.551∗∗
(0.159) (0.184) (0.108) (0.163) (0.191)bad health −0.387∗∗ −0.319∗ −0.211 −0.077 0.133
(0.121) (0.125) (0.143) (0.195) (0.139)Relative labor market experi-ence (> 75%)
0.593∗∗ 0.580∗∗ 0.404∗∗ 0.961∗∗ 0.158
(0.135) (0.158) (0.118) (0.209) (0.116)agea −0.097 −0.015 −0.032 0.029 −0.041
(0.061) (0.076) (0.048) (0.069) (0.076)age-squared −0.115∗ −0.220∗∗ −0.005 −0.001 0.017
(0.051) (0.061) (0.041) (0.053) (0.057)Children (< 12) −0.527∗∗ −0.470∗∗ −0.419∗∗ 0.022 −0.024
(0.125) (0.123) (0.127) (0.152) (0.146)
duration dependenceb
α1 (0 to 2 months) −2.881 −2.186 −2.940 −2.181 −0.417(0.680) (0.490) (0.733) (0.395) (0.339)
α2 (2 to 6 months) −2.881 −2.186 −2.940 −2.181 −1.826(0.680) (0.490) (0.733) (0.395) (0.558)
α3 (6 month to 1 year) −3.041 −2.321 −2.429 −2.642 −3.838(0.266) (0.432) (0.172) (0.266) (0.848)
α4 (1 to 2 years) −3.041 −3.490 −2.429 −2.642 −3.838(0.266) (0.172) (0.172) (0.266) (0.848)
α5 (2 to 5 years) −3.412 −3.490 −3.696 −3.686 −3.502(0.187) (0.172) (0.281) (0.382) (0.306)
α6 (> 5 years ) -3.784 -3.649 -3.976 -3.631 -4.647(0.119) (0.125) 0.142) (0.173) (0.232)
Log-likelihood -2736.0 -2297.4 -1557.6 -963.2 -602.4N 516 432 316 200 126
a Age is the (time-varying) age at each year of unemployment, starting from the year the individualentered unemployment, centered at the mean age of 35 years.b The duration dependence is piecewise constant with parameter eαi , for i = 1, . . . 6. Some intervalsare combined. Turks: 1 and 2, 3 and 4; Moroccans: 1 and 2, 4 and 5; Surinamese: 1, 2 and 3; An-tilleans: 1 and 2, 3 and 4; Natives: 3, 4 and 5. Notes: Standard errors are shown in parentheses.∗p < 0.05;
∗∗
p < 0.01 (only for regression coefficients). Source: SPVA (ISEO/SCP)
24
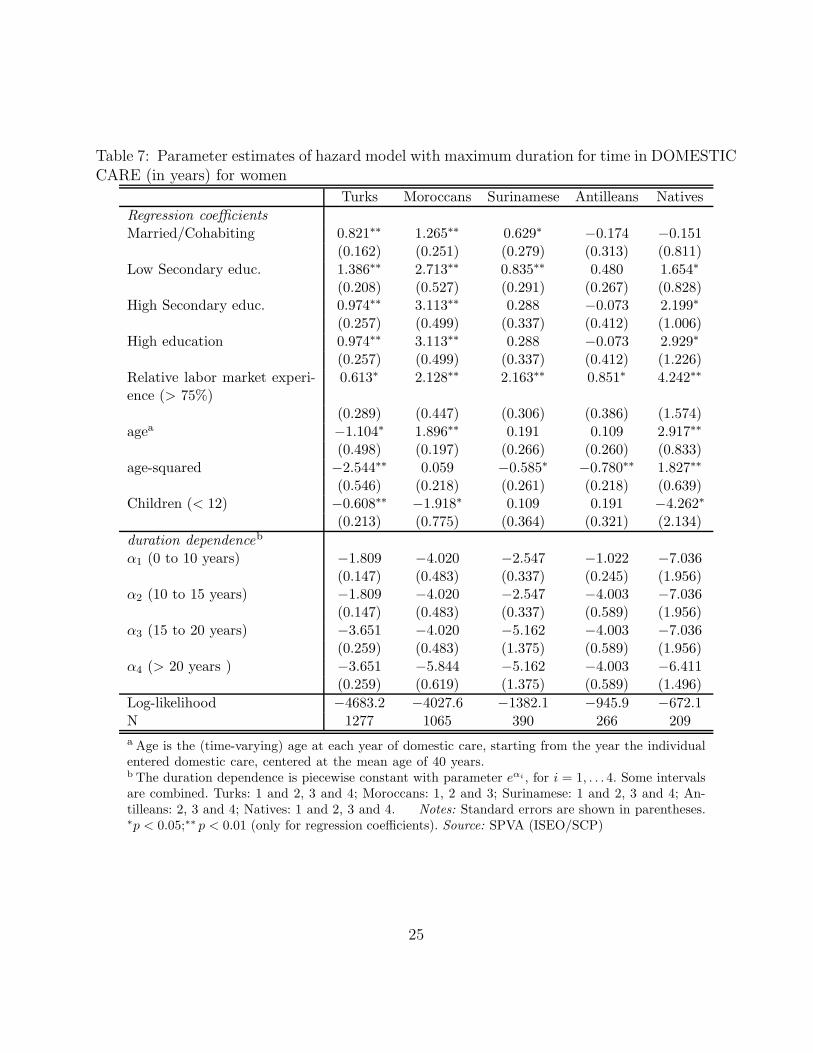
Table 7: Parameter estimates of hazard model with maximum duration for time in DOMESTICCARE (in years) for women
Turks Moroccans Surinamese Antilleans Natives
Regression coefficients
Married/Cohabiting 0.821∗∗ 1.265∗∗ 0.629∗ −0.174 −0.151(0.162) (0.251) (0.279) (0.313) (0.811)
Low Secondary educ. 1.386∗∗ 2.713∗∗ 0.835∗∗ 0.480 1.654∗
(0.208) (0.527) (0.291) (0.267) (0.828)High Secondary educ. 0.974∗∗ 3.113∗∗ 0.288 −0.073 2.199∗
(0.257) (0.499) (0.337) (0.412) (1.006)High education 0.974∗∗ 3.113∗∗ 0.288 −0.073 2.929∗
(0.257) (0.499) (0.337) (0.412) (1.226)Relative labor market experi-ence (> 75%)
0.613∗ 2.128∗∗ 2.163∗∗ 0.851∗ 4.242∗∗
(0.289) (0.447) (0.306) (0.386) (1.574)agea −1.104∗ 1.896∗∗ 0.191 0.109 2.917∗∗
(0.498) (0.197) (0.266) (0.260) (0.833)age-squared −2.544∗∗ 0.059 −0.585∗ −0.780∗∗ 1.827∗∗
(0.546) (0.218) (0.261) (0.218) (0.639)Children (< 12) −0.608∗∗ −1.918∗ 0.109 0.191 −4.262∗
(0.213) (0.775) (0.364) (0.321) (2.134)
duration dependenceb
α1 (0 to 10 years) −1.809 −4.020 −2.547 −1.022 −7.036(0.147) (0.483) (0.337) (0.245) (1.956)
α2 (10 to 15 years) −1.809 −4.020 −2.547 −4.003 −7.036(0.147) (0.483) (0.337) (0.589) (1.956)
α3 (15 to 20 years) −3.651 −4.020 −5.162 −4.003 −7.036(0.259) (0.483) (1.375) (0.589) (1.956)
α4 (> 20 years ) −3.651 −5.844 −5.162 −4.003 −6.411(0.259) (0.619) (1.375) (0.589) (1.496)
Log-likelihood −4683.2 −4027.6 −1382.1 −945.9 −672.1N 1277 1065 390 266 209
a Age is the (time-varying) age at each year of domestic care, starting from the year the individualentered domestic care, centered at the mean age of 40 years.b The duration dependence is piecewise constant with parameter eαi , for i = 1, . . . 4. Some intervalsare combined. Turks: 1 and 2, 3 and 4; Moroccans: 1, 2 and 3; Surinamese: 1 and 2, 3 and 4; An-tilleans: 2, 3 and 4; Natives: 1 and 2, 3 and 4. Notes: Standard errors are shown in parentheses.∗p < 0.05;∗∗ p < 0.01 (only for regression coefficients). Source: SPVA (ISEO/SCP)
25
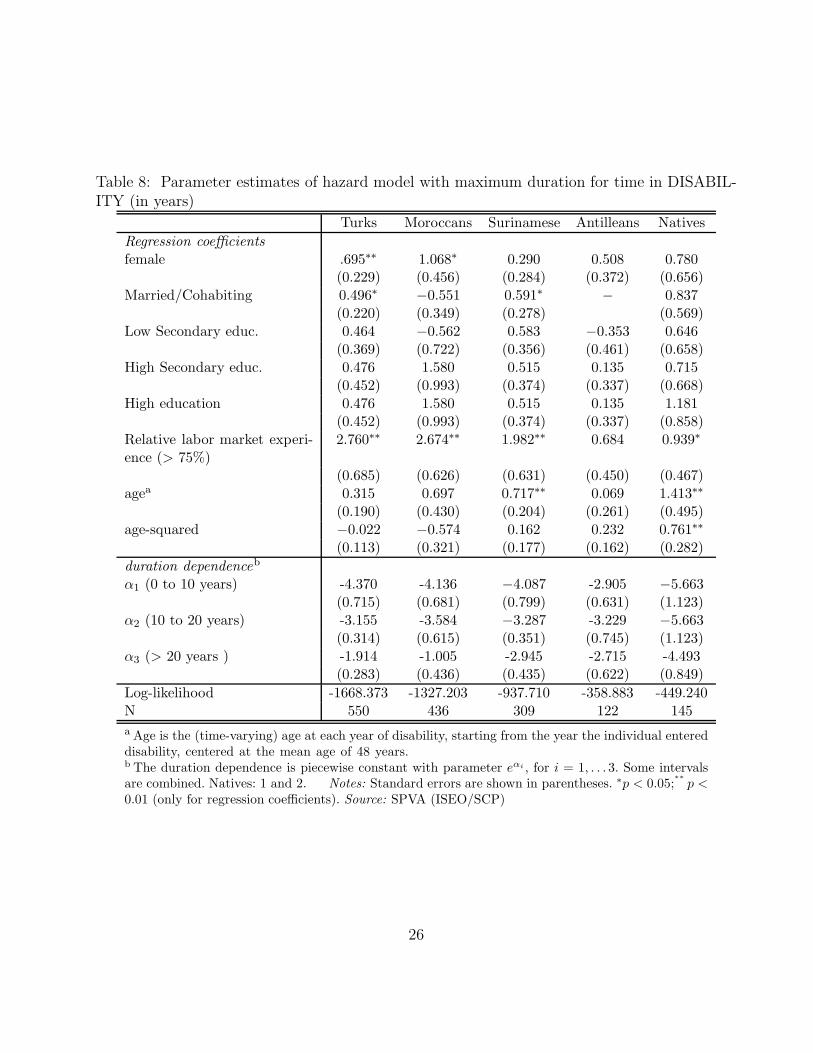
Table 8: Parameter estimates of hazard model with maximum duration for time in DISABIL-ITY (in years)
Turks Moroccans Surinamese Antilleans Natives
Regression coefficients
female .695∗∗ 1.068∗ 0.290 0.508 0.780(0.229) (0.456) (0.284) (0.372) (0.656)
Married/Cohabiting 0.496∗ −0.551 0.591∗ − 0.837(0.220) (0.349) (0.278) (0.569)
Low Secondary educ. 0.464 −0.562 0.583 −0.353 0.646(0.369) (0.722) (0.356) (0.461) (0.658)
High Secondary educ. 0.476 1.580 0.515 0.135 0.715(0.452) (0.993) (0.374) (0.337) (0.668)
High education 0.476 1.580 0.515 0.135 1.181(0.452) (0.993) (0.374) (0.337) (0.858)
Relative labor market experi-ence (> 75%)
2.760∗∗ 2.674∗∗ 1.982∗∗ 0.684 0.939∗
(0.685) (0.626) (0.631) (0.450) (0.467)agea 0.315 0.697 0.717∗∗ 0.069 1.413∗∗
(0.190) (0.430) (0.204) (0.261) (0.495)age-squared −0.022 −0.574 0.162 0.232 0.761∗∗
(0.113) (0.321) (0.177) (0.162) (0.282)
duration dependenceb
α1 (0 to 10 years) -4.370 -4.136 −4.087 -2.905 −5.663(0.715) (0.681) (0.799) (0.631) (1.123)
α2 (10 to 20 years) -3.155 -3.584 −3.287 -3.229 −5.663(0.314) (0.615) (0.351) (0.745) (1.123)
α3 (> 20 years ) -1.914 -1.005 -2.945 -2.715 -4.493(0.283) (0.436) (0.435) (0.622) (0.849)
Log-likelihood -1668.373 -1327.203 -937.710 -358.883 -449.240N 550 436 309 122 145
a Age is the (time-varying) age at each year of disability, starting from the year the individual entereddisability, centered at the mean age of 48 years.b The duration dependence is piecewise constant with parameter eαi , for i = 1, . . . 3. Some intervalsare combined. Natives: 1 and 2. Notes: Standard errors are shown in parentheses. ∗p < 0.05;
∗∗
p <
0.01 (only for regression coefficients). Source: SPVA (ISEO/SCP)
26

C Figures
0
0.1
0.2
0.3
0.4
0.5
0.6
0.7
0.8
0.9
1
0 6 12 18 24 30 36 42 48 54 60 66 72 78 84 90 96 102 108 114 120
months since start unemployment
Turks
Moroccans
Surinamese
Antilleans
Natives
Figure 1: Estimated survival rate in UNEMPLOYMENT for a reference individual.A reference individual is a single male with basic or no education, good health, no labor marketexperience, no children and aged 35.
27

0
0.1
0.2
0.3
0.4
0.5
0.6
0.7
0.8
0.9
1
0 1 2 3 4 5 6 7 8 9 10 11 12 13 14 15 16 17 18 19 20 21 22 23 24 25
years since start household care
Turks
Moroccans
Surinamese
Antilleans
Natives
Figure 2: Estimated survival rate in DOMESTIC CARE for a reference female.A reference female is a single female with basic or no education, no labor market experience, nochildren and aged 40.
0
0.1
0.2
0.3
0.4
0.5
0.6
0.7
0.8
0.9
1
0 1 2 3 4 5 6 7 8 9 10 11 12 13 14 15 16 17 18 19 20
years since start disability benefits
Turks
Moroccans
Surinamese
Antilleans
Natives
Figure 3: Estimated survival rate in DISABILITY for a reference individual.A reference individual is a single male with no high education, no labor market experience, no children
and aged 48.
28