Understanding Pilot Response to Flight Safety Events Using ...

Understanding the Visitor Experience
Results from a Pilot Visitor Satisfaction Survey
March 2011

The Context

Market Value
£17.3
£39.3
£14.4
Tourism Spend in England 2009 (£bn)
Domestic Overnight
Domestic Day Trips
Inbound
Source: UKTS 2009, IPS 2009, ELDVS 2005
10
15
20
25
30
35
40
45
50
55
Ap
r-06
Jun
-06
Au
g-0
6
Oct-
06
Dec-0
6
Fe
b-0
7
Ap
r-07
Jun
-07
Au
g-0
7
Oct-
07
Dec-0
7
Fe
b-0
8
Ap
r-08
Jun
-08
Au
g-0
8
Oct-
08
Dec-0
8
Fe
b-0
9
Ap
r-09
Jun
-09
Au
g-0
9
Oct-
09
Dec-0
9
Fe
b-1
0
Ap
r-10
Jun
-10
Au
g-1
0
Oct-
10
Tri
ps (
millio
ns)
Rolling 12-month period ending….
UK Domestic Tourism – Holiday Trips 2006 - 2010
Domestic Holiday Trends
Source: UKTS 2006-2010
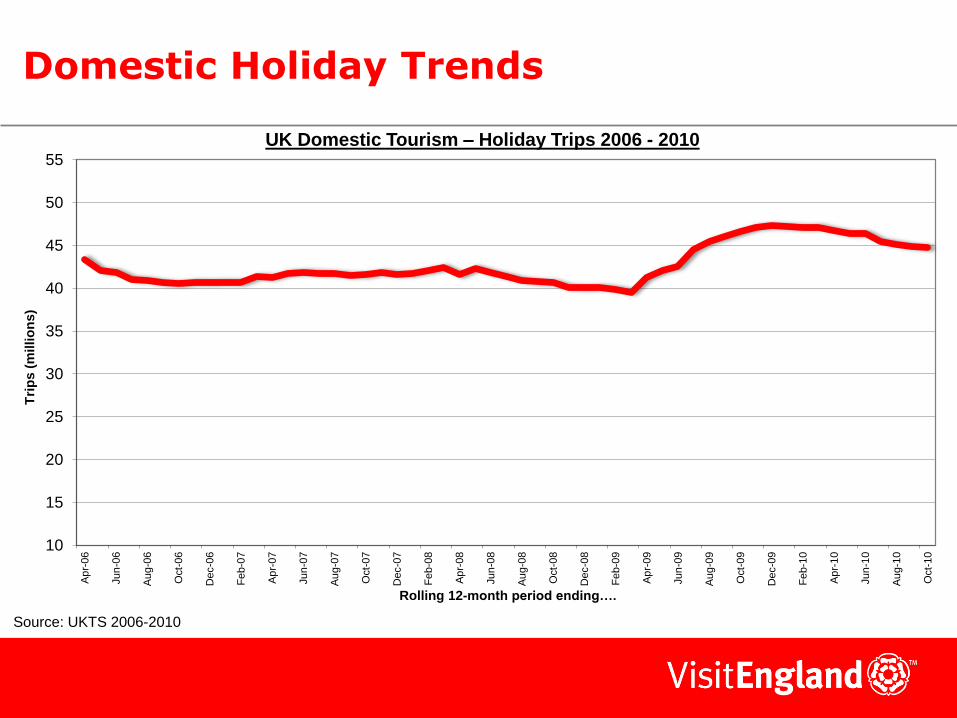
The Strategic Framework for Tourism The Role of Visitor Satisfaction
• To increase England’s share of global visitor markets
• To offer compelling destinations of distinction
“Create an England satisfaction survey which provides a national benchmark and greater consistency of data at regional, destination and local levels”
• To champion a successful, thriving tourism industry
• To facilitate greater engagement between the visitor and the experience
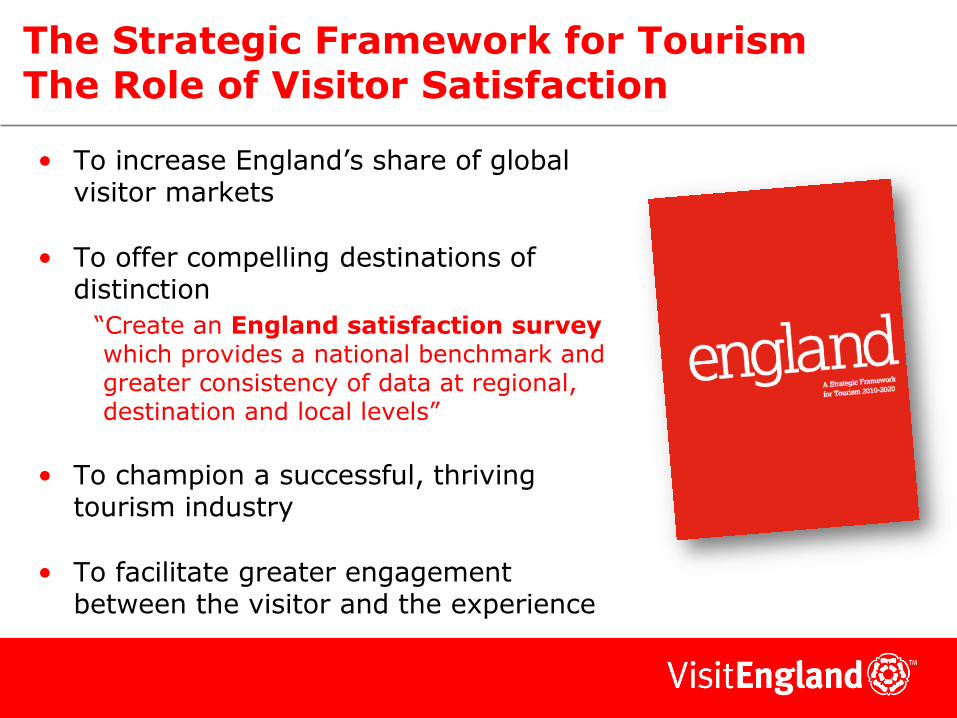
Our Approach
• Questions are included on the VE Brand & Communications Tracker
– Continuous online interviewing among those in the market for holidays (taken at least one holiday of 1+ nights in the past 12 months anywhere in the world, intend to do so in the next 12 months, non-rejectors of England)
• 5-minute satisfaction module, asked of all P12M England leisure break takers (79% of total sample)
– Over 3000 respondents have provided satisfaction data since the start of the survey
• Questions asked about most recently visited destination from a list of c.60 options (not about “England”)
– Trip Profile: break length, accommodation type, destination type, activities undertaken
– 4 Visitor Experience (TRI*M) Questions
– Evaluation of destination across 15 key attributes
• Satisfaction measured using TNS TRI*M method (widely used across many sectors)

How satisfied are domestic visitors?

How Satisfied Are Our Visitors?
Overall
Performance
Likelihood to
Recommend
Likelihood to
Revisit
Competitive
Advantage
TRI*M
Index:
92
90
50
70
30 Likelihood to
Recommend
85%
excellent/
very good
86%
definitely/
probably
76%
definitely/
probably
61% much/
slightly
better

80
75
70 Overall Oct - Nov - Dec - Jan - Feb - Mar - Apr - May - Jun - Jul - Aug - Sep - Oct - Nov - Dec -
High
Visitor
Experience
Low
Visitor
Experience
100
95
90
85
105
Slight improvement in scores over time – though there may be a seasonal effect
92 92
Dec Jan Feb Mar Apr May Jun Jul Aug Sep Oct Nov Dec Jan Feb
94 93 92 92 92
91 92 92 93
94 94 96 95 95
Who are our Most Satisfied Visitors?

80
75
70 England 18-34 35-54 55+ Kids in h‘h No kids in h‘h ABC1 C2DE
High
Visitor
Experience
Low
Visitor
Experience
100
95
90
85
105
Highest scores among older visitors, families, and lower social grade (but differences are narrow)
92
94 94
92 91 92
95
92
Age Children Social Class

80
England 1-3 night 4-7 night 8+ night Countryside Seaside City Touring
High
Visitor
Experience
Low
Visitor
Experience
100
95
90
85
105
98
102
97 95
89
92 92
89
Holiday Type Location
short break mid-length hol longer holiday
110
Longer breaks / countryside destinations deliver the best-rated experience
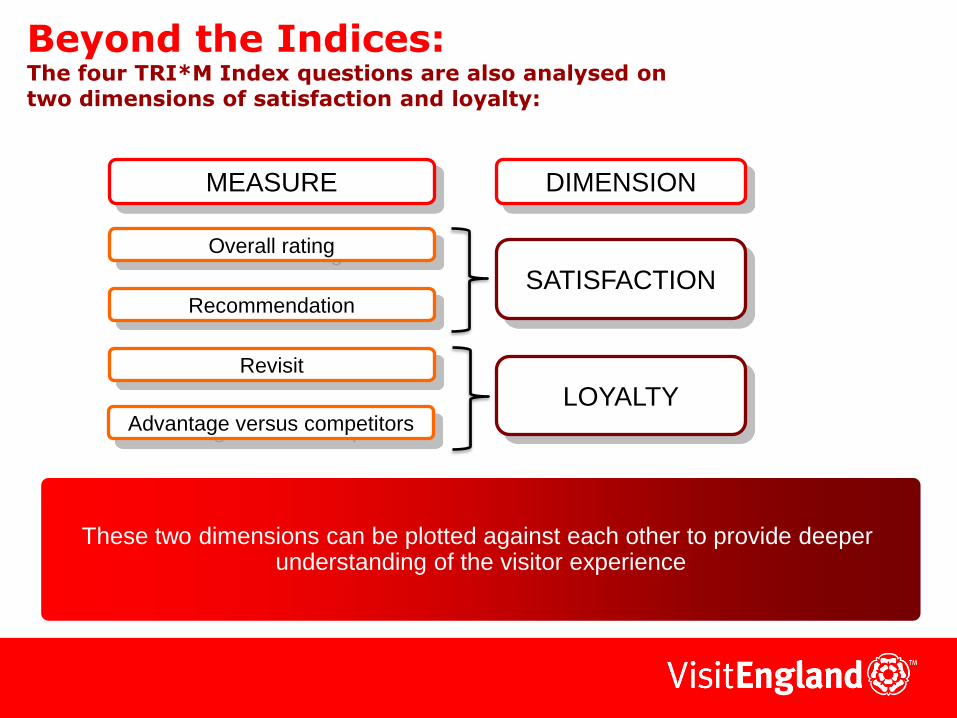
MEASURE
Overall rating
Recommendation
Revisit
Advantage versus competitors
DIMENSION
LOYALTY
SATISFACTION
Beyond the Indices: The four TRI*M Index questions are also analysed on two dimensions of satisfaction and loyalty:
These two dimensions can be plotted against each other to provide deeper understanding of the visitor experience

Visitor Experience Map – Holiday type and Location
Low
High
S A
T I
S F
A C
T I O
N
L O Y A L T Y
8+ night holiday
4-7 night holiday
Seaside
Countryside
Touring
Short break
City break
Understanding more of what the TRI*M score means can help us predict behaviours
It was great, I’ve sent the cottage details to
my friends…
The kids love it, and we’ll be back next
year

80
75
England ALL HOTELS B&B / Caravan Camping Rented house Holiday Guesthouse /flat camp/village
High
Visitor
Experience
Low
Visitor
Experience
100
95
90
85
105
89
94 96
101 100
92 91
Non-serviced (self-catering) accommodation options outperform traditional options

80
75
England 1* 2* 3* 4* 5* 1* 2* 3* 4* 5*
HOTELS B&Bs/Guesthouses
High
Visitor
Experience
Low
Visitor
Experience
100
95
90
85
105
92
n/a
80
89 90
95
82
97
102
n/a n/a
There is a clear correlation between star rating and visitor experience

Low
High S
A T
I S
F A
C T
I O
N
L O Y A L T Y
All Hotels
Camping
Rented house/flat
All B&B/Guesthouse
2* hotel
Caravan
Holiday camp/village
5* hotel 3* hotel
4* hotel
2* B&B
4* B&B
3* B&B
Camping atracts the highest loyalty levels – but self-catering delivers greater satisfaction

80
75
England Outdoor Exploring Visited a Went to Visited a Explored a Went on a Went to a leisure the countryside museum or the beach garden small town guided zoo/aquarium pursuits art gallery / seaside tour /sea life centre
High
Visitor
Experience
Low
Visitor
Experience
100
95
90
85
105
99 98 98 98
97 97
92
97
101
Taking part in activities leads to a more positive experience

80
75
England Watched a Visited a Went Attended Explored a Visited a Visited sporting castle/stately shopping cinema/concert large town theme park family / event home/historic site /theatre/musical /city /fun fair friends
High
Visitor
Experience
Low
Visitor
Experience
100
95
90
85
105
96 96 95 95
94
83
92
96
...true for all activities except visiting friends and family!

80
75
England 1 Activity 2-3 Actiivities 4-5 Activities More than 5 undertaken undetaken undertaken undertaken
High
Visitor
Experience
Low
Visitor
Experience
100
95
90
85
105
92
98
102
92
80
5 Don‘t know responses. No respondents had
undertaken 0 activities
Our most active visitors are our most satisfied visitors

Variations in Visitor Satisfaction Across England

105
Peak District
108
Cornwall
107
Lake District
106
Yorkshire Dales
105
North Yorkshire
96
York
98
Yorkshire Coast
97
Other Devon
100
Northumberland
101 Isle of Wight
94
Brighton
91
Suffolk
94
Norfolk
93
Gloucs & the Cotswolds
89
Hampshire
95
London
94 Bristol & Bath
89 Bournemouth & Weymouth
89 Somerset
85
Manchester
86 Torquay
86 Cheshire
85
Other Dorset
81 Kent
81 Lancashire
Coast
76 Birmingham
The visitor experience varies widely by destination – even within those offering a similar break type

Low
High
S A
T I
S F
A C
T I O
N
L O Y A L T Y
Peak
District
Cornwall
Manchester
Other Devon
London
Lake District
Suffolk
Yorkshire
Dales
Northumberland Gloucs/Cotswolds
Brighton
York
Isle of Wight
Bournemouth
Yorkshire
Coast
Norfolk
Torquay Other Dorset
Somerset
Kent
Bristol
& Bath
Lancashire Coast
Birmingham
Cheshire
Hants
N Yorks
Visitor Experience Map – Destination
Greater understanding can be gained by analysing satsifaction and loyalty ratings separately
Dimensions of Satisfaction

47%
46%
46%
45%
44%
43%
43%
42%
40%
39%
38%
34%
33%
29%
27%
47%
47%
37%
46%
41%
49%
47%
47%
46%
50%
45%
50%
45%
58%
49%
Good quality accommodation
Interesting cities & towns to visit
Unspoilt countryside
A place where I feel safe and secure
Interesting villages to visit
Good quality food and dining
Welcoming and friendly people
Good range of local food & produce
Opportunities to see famous buildings and monuments
A clean and tidy environment
Opportunities to visit museums & galleries
Good value for money
Easily accessible public transport
High levels of customer service
Availability of festivals, music, sporting and cultural events
Agree Strongly Agree Slightly
Key Dimensions of Visitor Satisfaction
High satisfaction with accommodation – but value, transport and customer service remain as areas to address

% Strongly Agree with statement
England City Seaside Countryside
Good quality accommodation 47% 45% 46% 53%
A place where I feel safe and secure 45% 30% 51% 56%
Good quality food and dining 43% 42% 43% 47%
Welcoming and friendly people 43% 32% 47% 51%
Good range of local food & produce 42% 33% 44% 50%
A clean and tidy environment 39% 25% 44% 50%
Opportunities to visit museums & galleries 38% 56% 28% 32%
Good value for money 34% 25% 41% 37%
Easily accessible public transport 33% 46% 34% 22%
High levels of customer service 29% 23% 32% 33%
Availability of festivals, music, sporting & cultural events
27% 40% 23% 20%
National averages will allow us to track trends – but we need to dig deeper to really understand the visitor experience
Key Dimensions of Visitor Satisfaction – by Destination Type

Brighton London York
TRI*M SCORE 94 95 96
Good quality accommodation 83 100 111
A place where I feel safe and secure 84 28 96
Good quality food and dining 97 109 98
Welcoming and friendly people 89 32 135
Good range of local food & produce 103 68 83
A clean and tidy environment 65 29 118
Opportunities to visit museums & galleries 77 203 176
Good value for money 83 37 112
Easily accessible public transport 131 205 145
High levels of customer service 118 59 103
Availability of festivals, music, sporting &cultural events
127 214 85
Destination Indices vs National Average (% Strongly Agree)
Ultimately, we aim to benchmark all key destinations to understand relative strengths and weaknesses - a comparison of 3 destinations with similar overall scores shows very different priorities for improvement
Key Findings About Satisfaction in England
– Satisfaction seems to be improving – though we need to understand the impact of seasonality
– Older groups, C2DE’s and families are a little more satisfied than others
– Longer breaks, countryside destinations, self-catering options and lots of activities make for the most positive experience
– The destinations delivering the most positive experience are Cornwall, the Lake District, North Yorkshire / the Yorkshire Dales and the Peak District
– This study helps us understand the relative strengths and weaknesses of different destinations – and also the role they can play in driving future growth

Plans for the Future…
• Understanding which attributes matter most to people – adding a “how important is this attribute” question to our questionnaire
• Reviewing the attribute list to allow us to measure success in achieving strategic framework objectives
• Reviewing the destination list against the emerging tourism landscape
• Understanding Day Visit Satisfaction - TRI*M Module will be added to National Day Visitor
Survey, reporting early 2012

Understanding the Visitor Experience
Results from a Pilot Visitor Satisfaction Survey