
Understanding the Relationship Between Globalization and Survival of Philippine … ·...
36
Chapter 7 Understanding the Relationship Between Globalization and Survival of Philippine SMEs Rafaelita M. Aldaba Philippine Institute for Development Studies May 2016 This chapter should be cited as Aldaba, R. (2014), ‘Understanding the Relationship Between Globalization and Survival of Philippine SMEs, Hahn, C.H. and D. Narjoko (eds.), ‘Globalization and Performance of Small and Large Firms. ERIA Research Project Report 2013-3, pp.VII-1-VII-35, Available at: ww.eria.org/RPR_FY2013_No.3_Chapter_7.pdf
Transcript of Understanding the Relationship Between Globalization and Survival of Philippine … ·...

Chapter 7
Understanding the Relationship Between Globalization and
Survival of Philippine SMEs
Rafaelita M. Aldaba
Philippine Institute for Development Studies
May 2016
This chapter should be cited as
Aldaba, R. (2014), ‘Understanding the Relationship Between Globalization and Survival
of Philippine SMEs, Hahn, C.H. and D. Narjoko (eds.), ‘Globalization and Performance
of Small and Large Firms. ERIA Research Project Report 2013-3, pp.VII-1-VII-35,
Available at: ww.eria.org/RPR_FY2013_No.3_Chapter_7.pdf

VII-1
CHAPTER 7
Understanding the Relationship Between Globalization and
Survival of Philippine SMEs
RAFAELITA M. ALDABA
Philippine Institute for Development Studies
This paper examines whether firms of heterogeneous size are affected differently
by globalization. Are there differences in the survival of SMEs and large enterprises
the higher their exposure to imports and lower tariffs? To do this, both tariffs and
effective protection rates are used as globalization proxy variables and added to the
factors that affect firm shutdowns consisting of firm characteristics such as age, size,
productivity, capital intensity, ownership, export, and R&D. Government subsidy
and price cost margins at the industry level are also included. To capture firm
heterogeneity, firm size was interacted with tariffs and effective protection rates as
well as with firm characteristics such as productivity, ownership and export. Using
data on the Philippine manufacturing industry from 1996 to 2006, the results confirm
previous research finding that firm size, age, and productivity are important
determinants of firm exit. Controlling for these attributes, the results show that tariffs
are negatively correlated with firm exit and the probability of exit is higher in small
firms that face tariff reduction. Firm exit is greater for small enterprises
characterized by low productivity, non-exporter and without foreign equity. Firms
that have high level of productivity, engaged in export activities and have foreign
equity are better able to survive.
Keywords: globalization, survival, SMEs, Philippine manufacturing
JEL Classification: F60, F10, L10

VII-2
1. Introduction
There is wide recognition that small and medium enterprises (SMEs) play a
critical role in the economic growth and industrial development of developing
countries worldwide. SMEs are seen as key to boost the economy and strengthen the
industrial structure, given their substantial contribution both in terms of number of
enterprises and workers. As such, the government has implemented a wide range of
policies and programs to promote SME growth and development. Implicit in these
policies is the assumption that once SMEs grow and develop, they will continue to
contribute to the economy. Firm survival is significant in terms of achieving the
long-term growth and employment goals of the country. Giovannetti et al (2011)
pointed out that the survival of young firms is fundamental for increased
entrepreneurship and a consequent increase in jobs and sustained economic growth.
As Ausdretsch (2004) emphasized, SMEs are an important source of innovation,
growth and competitiveness.
In the light of rising competition arising from the globalization trend and
increasing economic integration; there are concerns that SMEs would be negatively
affected by the intense competition arising from trade liberalization. The more recent
empirical literature on trade and productivity shows that in the presence of firm
heterogeneity, trade liberalization allows more productive firms to expand while less
efficient firms either exit or shrink. Melitz (2003) shows that trade can contribute to
the Darwinian evolution of industries by forcing the least efficient firms to contract
or exit while promoting the growth of the more efficient ones. In studies examining
the determinants of survival, firm size and age are highlighted as critical factors with
older enterprises having a higher survival rate than new ones (Carroll and Hannan
2000; Nelson and Winter 1982 as cited in Cao 2012).
In studies assessing the impact of trade liberalization on firm survival, the main
finding suggests that tariff reduction or elimination together with higher import
competition will increase exit. In the US, Bernard and Jensen (2002) showed that
import penetration sharply increases the probability of plant death. Bernard, Jensen
and Schott (2003) also indicated that lower trade costs increase the probability of
plant death, especially for lower productivity, non-exporting plants. In another study,
VII-3
Bernard, Jensen and Schott (2006) found that plant survival and growth are
disproportionately lower in industries with higher exposure to imports from low
wage countries.
Couke and Sleuwaegen (2008) indicated that in developed countries, increasing
competition from imports from low-wage countries is associated with higher firm
level exit, with less productive and more labor-intensive firms being relatively more
affected. Looking at the impact the Canada-US Free Trade Agreement (FTA) tariff
cuts on Canadian manufacturing firms; Gu, Sawchuk and Whewell (2003) showed
that FTA tariff cuts increased the exit rate of Canadian manufacturing firms and the
FTA-induced increase in the exit rate was bigger for small firms than for large firms.
In the Philippines, while studies analysing the competitiveness and performance
of Philippine SMEs abound, there are very few studies focusing on firm survival and
its determinants mainly due to the paucity of micro level data. Using a probit model,
Aldaba (2011) examined the determinants of firm exit for Philippine manufacturing
enterprises. The results show that individual firm characteristics matter with lower
probability of exit associated with highly productive, larger, older, foreign-affiliated
and export-oriented firms. This analysis may have masked some of the underlying
relationships affecting the survival of SMEs and large manufacturing enterprises. It
is important to understand whether there are significant differences in the
determinants of survival of SMEs and large enterprises in order to correctly design
adjustment policies and programs to increase the survival probability of SMEs. In a
highly globalized environment, firms must adapt their strategies to heightened
competition in order to survive and benefit from the opportunities offered by
globalization (Coucke at al 2010).
This paper aims to understand whether there are differences in the survival of
firms the higher their exposure to imports and lower tariffs. Are firms of
heterogeneous size affected differently by globalization? Are there differences
between factors affecting the survival of SMEs and large enterprises? The paper will
be divided into six sections. After the introduction, section II will discuss the policies
affecting SMEs along with an analysis of their recent performance and contribution
to the economy. Section III will briefly review the literature on the determinants of
SME survival particularly on how SMEs are affected by globalization. Section IV

VII-4
will present the data, variables, and method of estimation applied in the analysis.
Section V will analyse the results and on this basis, the final section will formulate
the policy implications and recommendations of the paper.
2. SME Policies, Performance and Challenges
Since the 1980s, the Philippines has made considerable progress in opening-up
the economy not only by removing tariff and non-tariff barriers but also by
deregulating prices, entry and other administrative rules and liberalizing foreign
investment restrictions. As a result, the current regime is substantially more open,
particularly in the manufacturing industry.
From the early 1980s till the 1990s, the Philippines liberalized its trade policy by
reducing tariff rates and removing import quantitative restrictions. Philippine
average tariffs are already low with manufacturing at 6.8% and agriculture at 11.2%.
About 55% of total tariff lines are clustered around the 0-3% tariff levels and about
29% are found in the 5-10%. In recent years, the uncertainty in the successful
conclusion of the World Trade Organization (WTO)’s multilateral trade negotiations
has led to a new wave of regionalism through the surge in free trade agreements
(FTAs). The Philippines has participated in these initiatives by signing seven free
trade agreements covering Japan-Philippines, Korea-ASEAN, China-ASEAN,
AFTA, Japan-ASEAN, ASEAN-India and ASEAN-Australia and New Zealand. The
government policy on FTAs is to maintain active engagement in several multilateral
and bilateral trade and investment agreements. Philippine participation in these
agreements is seen to pave the way for the country’s deeper trade and investment
integration in the global economy.
No unilateral trade reforms took place in recent years as the country’s trade
policy has been driven mostly by its FTA commitments, particularly the AFTA.
Under the ASEAN Trade in Goods Agreement (ATIGA which came into force in
2010), the Philippines has reduced all tariffs to 0-10% except for the highly sensitive
agriculture products such as rice. The China-ASEAN FTA (CAFTA) was also
implemented on January 1, 2010 simultaneous with the ATIGA. Under CAFTA,

VII-5
tariffs are expected to be eliminated on 90% of products ranging from textiles to
rubber, vegetable oil, and steel between China and the ASEAN 6 (Brunei, Indonesia,
Malaysia, Philippines, Thailand, and Singapore). Import duties will be removed on
6682 Chinese products. Average tariffs are reduced to 0.6% (from 9.8% in ASEAN
and 12.8% in China).
In terms of foreign direct investment policy, the Philippines changed
considerably from a restrictive and complicated regulatory system towards a more
open one. Given the need to expand exports and the potential economic contribution
of FDI through the transfer of knowledge and experience, the Philippines adopted
more open and flexible policies toward FDI. This was carried out simultaneously
with the country’s market-oriented reforms in the 1990s. In June 1991, the country
accelerated the FDI liberalization process through the legislation of Republic Act
7042 or the Foreign Investment Act (FIA).
From the seventies to the present, the overall SME policies and programs have
evolved with their focus shifting from inward-looking towards a more external-
oriented approach. In the 1990s, government policy on SMEs concentrated on
improving market access, export expansion, and increasing competitiveness. In 1991,
the Magna Carta for Small Enterprises was passed to consolidate all government
programs for the promotion and development of SMEs into a unified framework. The
Magna Carta also mandated all lending institutions to set aside 8% of their total loan
portfolio to SMEs. Access to finance has remained one of most critical factors
affecting the competitiveness of MSMES. Many are unable to qualify for bank loans
because they lack the necessary track record and collateral. Moreover, most do not
have the financial expertise to manage a healthy cash flow. The lack of credit
information has deterred banks from lending to MSMEs.
The 2011-2016 MSME Development Plan focuses on addressing the critical
constraints to the growth and development of the MSME sector. Measures will be
implemented to create an enabling business environment, improve access to finance,
expand market access, and strengthen MSME productivity and competitiveness as
well as to deepen linkages with large enterprises and value chain networks. The Plan
targets a 40% contribution of the MSME sector to total value added and creation of
two million jobs by 2016.

VII-6
In 2011, micro enterprises dominated the economy accounting for 91% of the
total while small enterprises accounted for only 9% (Table 1).1 Middle enterprises a
very small proportion of the total. Since 2003, the total number of enterprises has
fallen from 839,114 to 783,165 in 2006. In 2011, this went up to 820,255 but still
lower than the total number of enterprises in 2003. In terms of employment
contribution, micro enterprises accounted for a share of 28% in 2011 while small
enterprises registered a share of 26%. Medium enterprises posted a share of 7%
while large enterprises contributed 39% during the same year.
Within manufacturing, micro enterprises accounted for 89% of total
establishments while small enterprises recorded a share of 9% in 2011 (Table 2).
Medium and large enterprises registered a share of 0.8% and 0.9%, respectively. In
terms of employment share, large firms contributed the highest with a share of 53%
of the total. Small and medium enterprises contributed 20% and 9% respectively
while micro enterprises posted a share of 18%. Medium enterprises constitute a small
share not only of the SME sector but also of the overall manufacturing and total
Philippine industry structure, such that the country’s industrial structure has
remained “hollow”.
Table 1: Total Number of Enterprises and Employees in the Philippines
Number of Enterprises
Year Micro % Small % Medium % Large % Total
1995 449.950 91 39.848 8 2.712 1 2.447 0,5 495.057
2000 747.740 91 67.166 8 3.070 0,4 2.984 0,4 821.060
2003 762.573 91 69.175 8 3.521 0,4 3.745 0,4 839.114
2006 720.191 92 57.439 7 2.839 0,4 2.596 0,3 783.165
2010 709.899 91 61.979 8 2.786 0,4 3.023 0,4 777.687
2011 743.250 91 70.222 9 3.287 0,4 3.496 0,4 820.255
1 Micro enterprises have from 1-9 employees. Small enterprises are defined as having 10-99
employees; medium as having 100-199 employees; and large as having over 200 employees (The
National Statistics Office and Small and Medium Enterprise Development Council Resolution
No. 1, Series 2003).

VII-7
Number of Employees
Year Micro % Small % Medium % Large % Total
1995 1.345.175 31 945.401 22 366.890 8 1.664.076 39 4.321.603
2000 2.165.100 37 1.522.227 26 416.686 7 1.798.173 30 5.902.256
2003 2.214.278 34 1.556.206 24 485.891 8 2.218.419 34 6.474.860
2006 1.667.824 33 1.279.018 26 381.013 8 1.657.028 33 4.984.950
2010 1.729.100 30 1.417.672 25 386.163 7 2.136.362 38 5.669.297
2011 1.778.353 28 1.642.492 26 451.561 7 2.473.336 39 6.345.742
Source: National Statistics Office.
Table 2: Manufacturing Total Number of Enterprises and Employees
Number of Enterprises
Year Micro % Small % Medium % Large % Total
1995 86.900 89 8.928 9 1.027 1 982 1 97.837
2000 108.998 87 14.121 11 1.110 0,9 1.238 1 125.467
2003 107.398 89 11.910 10 853 0,7 1.024 0,8 121.184
2006 105.083 90 10.274 9 1.004 0,9 985 0,8 117.346
2010 101.072 90 9.471 8 823 0,7 938 0,8 112.304
2011 100.837 89 10.029 9 899 0,8 1.024 0,9 112.789
Number of Employees
Year Micro % Small % Medium % Large % Total
1995 271699 22 227949 18 137384 11 615874 49 1252906
2000 354025 22 354328 22 150734 9 730127 46 1589214
2003 360576 25 285027 19 118896 8 698173 48 1462672
2006 259664 19 252931 18 132332 10 727984 53 1372911
2010 259.204 20 244.156 19 114.274 9 685.410 53 1.303.044
2011 253.945 18 270.123 20 124.524 9 724.775 53 1.373.367
Source: National Statistics Office.
While the Philippines has put in place a number of policies and programs
designed specifically to boost SME productivity and competitiveness in the country,
the performance of SMEs in the last decade has not been vigorous enough to boost
the Philippine manufacturing industry. Although some notable improvements in
terms of number of enterprises, value added, and employment contribution have been
posted, the overall economic performance of SMEs in the last decade has been
subdued. Thus, they have not substantially generated sufficient value added and

VII-8
employment to increase competition, improve industrial structure and increase the
country’s overall manufacturing growth. The weak performance of SMEs has been
largely attributed to the large number of barriers particularly access to finance, access
to technology, and skills as well as the presence of information gaps and difficulties
with product quality and marketing.
As such, the deepening of high technology industries in terms of the creation of
backward linkages has remained weak. Though the country’s exports of high
technology products have grown rapidly, the value added of these exports is very low
due to the limited links of large domestic and foreign companies to the domestic
economy. Given rapid changes in the international trade and the growing complexity
of global production system, making small and medium manufacturers
internationally competitive have posed a significant challenge to Filipino SMEs.
3. Brief Literature Review
In studying the life cycle of an enterprise, there are three major hypotheses that
have emerged in the literature: “liability of newness”, “liability of adolescence”, and
“liability of senescence” (Carroll and Hannan 2000; Nelson and Winter 1982 as cited
in Cao 2012). The first shows that newer and younger enterprises have a higher rate
of death risk than older ones as newer enterprises gradually adapt to the environment,
form processes and establish relationships as they grow. The second, the hypothesis
of “liability of adolescence”, shows that with age, SMEs’ death risk follows an
inverted U-shape pattern rather than a linear decline over time. Its death risk
increases over time until it is able to adapt to the environment when its death risk
starts to fall. The hypothesis of “liability of senescence” indicates that older
enterprises face an increasing death risk as they find it difficult to adapt to the
changing and competitive market environment because they are more rigid than
younger enterprises (Baum 1989; Hanna 1998 as cited in Cao 2012). Hence, when an
enterprise reaches a certain age, its death risk will once again increase.
In determining the way in which companies are affected by globalization, the
literature shows that firm heterogeneity seems to matter decisively. Bernard et al

VII-9
(2006) and Couke and Sleuwaegen (2008) indicated that in developed countries,
increasing competition from imports from low-wage countries is associated with
higher firm level exit, with less productive and more labor-intensive firms being
relatively more affected. As trade integration deepens, the market selects those firms
that are more fit to international competition while their “unfit” counterparts are
forced to exit.
Colantone, I., Coucke, and Sleuwaegen (2010) analysed, both theoretically and
empirically, the relative competitive position of small and large firms within the
same industry in the context of increasing import competition. The authors cited two
factors that have traditionally been identified as sources of comparative advantage
for small firms relative to their large firm competitors. First, small firms are normally
characterized by high marginal cost flexibility. While they tend to produce at higher
marginal costs of production at a given point in time, they are also likely to incur
lower adjustment costs as demand fluctuates (Brock and Evans 1989, Acs and
Audretsch 1990). Second, small firms usually display a strong “niche-filling”
attitude. They tend to specialize in specific market-niches as a strategy to make-up
for their lack of economies of scale and remain viable (Poter 1980, Dean et al 1998).
The findings of Colantone, I., Coucke, and Sleuwaegen (2010) showed that
within the framework of an oligopolistic rivalry model characterized by Cournot
competition between domestic and foreign producers, firms of heterogeneous size
may be affected differently by diverse sources of import competition. Due to their
marginal cost flexibility and ability to specialize in specific market-niche products,
small firms may enjoy a relatively favorable competitive position versus their larger
counterparts in the face of import penetration from low-wage countries. Following
heightened import competition from China and other low wage countries, large
domestic firms incur a stronger decrease in survival probabilities than small firms.
This is also confirmed by their empirical analysis that looks at firm exit for 12
manufacturing sectors in 8 European countries from 1997 to 2002. Their results
showed that firms of different size are affected differently by diverse sources of
import competition.
Empirical studies also suggest that lower trading cost through tariff reduction or
elimination and higher import competition will increase exit. In assessing the role of

VII-10
import competition from low wage countries on the survival of US plants, Bernard
and Jensen (2002) showed that import penetration sharply increases the probability
of plant death. Their results confirmed findings from previous research that plant
size, age and productivity are important determinants of plant survival. The
probability of plant shutdown is significantly decreasing in plant size, age, and
productivity. Exporting plants are far less likely to shut down than non-exporters.
Both capital and skill-intensive plants are also less likely to die and death rates are
greater for plants with low capital-labor ratios and those with relatively low skilled
workers.
Using disaggregated US import data and trade cost, Bernard, Jensen and Schott
(2003) examined the impact of changes in tariff and transport costs on industries and
plants. Their results highlighted the following: first, lower trade costs increase the
probability of plant death, especially for lower productivity, non-exporting plants;
second, surviving high productivity, non-exporters are more likely to enter the export
market and expand their sales; and third, existing exporters see their exports grow
more quickly as trade costs fall. The results showed that the interaction of trade cost
and productivity is negative and statistically significant, the probability of death is
lower for high productivity plants in the face of falling trade costs. With respect to
other plant characteristics, the study indicated that larger, older, and more capital
intensive firms are more likely to survive as are plants that pay higher wages or
produce multiple products.
In another study, Bernard, Jensen and Schott (2006) examined the role of
international trade in the reallocation of US manufacturing within and across
industries from 1977 to 1997. Their results indicated that across industries, plant
survival and growth are disproportionately lower in industries with higher exposure
to imports from low wage countries. Within industries, the higher the exposure to
low-wage countries, the bigger is the relative performance difference between
capital-intensive plants and labor-intensive plants in terms of survival and growth.
Looking at the impact the Canada-US FTA tariff cuts on Canadian
manufacturing firms; Gu, Sawchuk and Whewell (2003) showed that tariff
reductions affected productivity growth through its effect on firm turnover. They
found that the FTA tariff cuts increased the exit rate of Canadian manufacturing

VII-11
firms. The FTA-induced increase in the exit rate was bigger for small firms than for
large firms which is consistent with the view that the FTA tariff cuts forced the least
productive firms to exit. The authors concluded that productivity grows through a
mechanism or restructuring process of market selection where low productivity firms
exit and are replaced by higher productivity entrants while higher productivity
incumbents gain market share.
Using Canadian firm level data, Baggs (2005) also examined the impact of the
Canada-US FTA by investigating simultaneously the effect of falling Canadian
tariffs and American tariff changes on Canadian firms. The results showed that both
firm and industry level characteristics are important determinants of survival and
while Canadian tariff reductions reduced the probability of survival, US tariff
reductions exhibited the opposite effect. Falling Canadian tariffs decrease the
probability of survival since declining domestic protection increase threats. Falling
US tariffs increase the probability of survival among Canadian firms since opening
foreign markets increase opportunities.
Alvarez and Vergara (2006) analysed the relationship between survival,
employment growth and firm size in Chile, an economy that has reduced its trade
barriers in the last three decades. Their results showed that compared to firms of the
same size in less globalized industries, SMEs are more likely to survive in industries
more exposed to external competition. In terms of employment, SMEs are more able
to grow in more globalized industries. The other results showed that more
productive and older firms are more likely to survive. In terms of factor intensities,
skilled labor does not affect survival probability but more capital intensive plants are
less likely to shutdown. Compared to large plants, small and medium plants are about
16 and 8 percent less likely to survive. Smaller plants are more likely to exit even
controlling for other plant and industry characteristics.
The literature also shows that other factors such as firm level innovations and
technological activity are important determinants of firm survival. Ausdretch and
Mahmood (1995) showed that small firms that have a relatively higher innovation
rate have higher survival rate than large firms. Studies also analysed the relationship
between external finance and growth. Hytinen et al (2005) found that firm growth is
highly dependent on external finance. Baldwin (1995) indicated that the length of

VII-12
survival is a function of industry characteristics such as efficiency, concentration,
ownership and asset structure. Audretsch (1991) showed that the presence of
substantial scale economies and a high capital-labor ratio tends to lower the
likelihood of survival. Ausdretsch (1995) further showed that firms that are more
capital-intensive often grow faster. Dunne and Hughes (1994) and Mata and Portugal
(1994) also both showed a lower likelihood of survival in industries with a high
degree of scale economies. In developing countries, Thorsten et al (2002) found that
firm growth is determined by legal institutions, corruption and financing and small
firms are affected the most. Liedholm and Mead (1998, 1999) examined the data of
eight African countries and confirmed that firm age and firm size are important
factors in assessing the enterprise life cycle.
In China, Liu and Pang (2003) found that based on China’s listed SMEs, firm
survival tends to increase with firm size and firm performance and operation stability
helps firms become more competitive and more likely to survive and grow. State-
ownership was found to increase the probability of large firm survival but not
growth. R&D activities were found to influence firm survival but not growth.
In the UK, Holmes, Hunt and Stone (2010) examined the survival of newly
established manufacturing firms in north-east England using data on 781 firms and
applying log-logistic hazard models separately for (i) micro and (ii) small and
medium enterprises. Their results showed that increases in initial plant size are seen
to have a positive impact on the survival of SMEs. However, increases in plant size
were found to impact negatively on micro-enterprise durations. Ownership of the
enterprise was not identified as a significant variable. The results also showed that
both micro-enterprises and SMEs exhibited clear evidence of initial positive duration
dependence, followed by a negative duration dependence with enterprises displaying
increased probabilities of death for the first eight to nine years. Macroeconomic
variables such as unemployment, interest and exchange rates were also included in
the analysis and the main findings indicated that higher rates of unemployment were
not associated with survival chances. For microenterprises, low interest rates at
establishment enhance firm survival, while beyond the first year of operation,
increases in the real interest and exchange rates impact negatively on survival
probabilities.

VII-13
Facanha, Resende, and Cardoso (2012) investigated the survival of newly
created SMEs in Brazilian manufacturing for the period 1996-2005 using a time-
varying version of the proportional hazard rate model that controls for unobserved
heterogeneity. The main results indicated that firm size, industry size, and industry
growth have a positive influence on survival while industrial concentration and entry
rate exert a negative influence.
Based on two subsamples of SMEs and applying probit regressions, Nunes and
Serrasqueiro (2012) examined whether the survival determinants of young SMEs are
different from those of old SMEs. Their results showed that the survival determinants
of young SMEs are considerably different from old SMEs with determinants related
to scale effects, financial condition and macroeconomic situation explaining their
survival. For old SMEs, technological intensity is of greater relative significance.
4. Description of Data and Methodology
4.1 Data
The dataset consists of firm level information from the Annual Survey of
Establishments and Census of Establishments of the conducted by the National
Statistics Office (NSO). The dataset contains the following variables: sales revenues,
employment, compensation, physical capital, exports (only for certain years) and
production costs. The firms are identified by unique establishment numbers that
allowed the creation of a panel dataset. The dataset covered the period 1996 to 2006,
with three missing years in between: 1999, 2001, and 2004. 1996, 1997, 1998, 2002,
2003, and 2005 are surveys years 2000 and 2006 are census years. The dataset
includes only firms with at least two observations and excludes all firms with only
one observation during the eight-year period 1996-2006. Firms with missing, zero or
negative values for any of the variables listed above were dropped as well as those
firms with duplicates. These were mostly firms with less than 10 workers. The total
number observations is 20,815.
Entry and exit are traced based on the establishment unique numbers. However,
there is no information whether exits are due to mergers and acquisitions. Entry and

VII-14
exit may be due to true entry and exit but may also be due to firms being included in
the sample or not. Entry is defined as the year when the firm started its operations.
This is based on information provided by the firm. Firm exit is indicated when the
firm no longer appears in the dataset. Entry and exit also occurs when a firm’s 2-digit
PSIC code changes. The firms are classified based on the following definitions:
New Entrant: firm that enters a given industry sector in a given year t
Exitor: firm is present in a given year t but will not be present in subsequent
year t+1
Survivor: firm is neither a new entrant nor exitor, it is present in a given year
t as well as in subsequent year t+1
Table 3 presents the number of firms in the dataset along with calculated annual
entry, exit, and survival rates in the manufacturing industry. The exit rate dropped
from 36% in 1997 to about 17% in 2000. This went up to 22% in 2002 and to 24% in
2006. Entry rates are low relative to exit rates declining from 33% in 1996 to about
8% in 1998 and 6% in 2006. The average turnover rate was 24% during the years
under review.
Table 3: Summary of Number of Firm Entrants, Exitors, and Survivors
Year Total Entrants Exitors Survivors
Turnover
Rate As % of total
(N) (X) (S) (in %) N X S
1996 2.576 858
33,3
1997 2.599 9 927 1.663 36 0,4 35,7 64
1998 2.263 177 180 1.906 16 7,8 8 84,2
2000 2.043 28 344 1.671 18 1,4 16,8 81,8
2002 2.072 6 455 1.611 22 0,3 22 77,8
2003 2.031 32 359 1.640 19 1,6 17,7 80,8
2005 3.365 20 505 2.840 16 0,6 15 84,4
2006 3,866* 221 942 2.703 30 5,7 24,4 68,9
Total 20.815 1.351 3.712 14.034 24 6,5 17,8 67,4
*Note: Firm exit and survival in 2006 were based on whether the firm operated in 2008 as
reflected in the 2008 Survey of Business Establishments.
Table 4 shows that exitors are, in general, relatively younger, smaller in terms of
employment size, less productive and less capital-intensive than survivors. They
seem to be more oriented towards the domestic market with their share of exports to

VII-15
output lower than survivors. Entrants are larger than exitors in terms number of
workers. They are also more capital intensive, more productive and are more export-
oriented than exitors. Their tariffs are higher than exitors and survivors.
Table 4: Firm Characteristics of Exitors, New Entrants, and Survivors (Mean
Values)
Exitors Entrants Survivors
Export share 0,1258033 0,2374911 0,2117632
TFP 0,9775679 1,000022 1,009972
Tariff 12,23409 17,40083 12,15751
Age 12,26192 2,907476 15,78112
Size: workers 189,2605 267,1088 297,1154
Capital-intensity 129591,1 146782,1 181049,3
It is evident from Table 5 that in terms of firm characteristics, SMEs have lower
productivity and are younger, have less workers, more domestic-oriented, have lower
capital/worker and lower price cost margin than large enterprises. Mean exit as
measured by number of firms that exited as proportion of the total is higher for SMEs
at 0.21 compared to 0.12 for large enterprises.
Table 5: Summary Statistics
All Enterprises Small and Medium Large
Variable Obs Mean Std.
Dev. Obs Mean
Std.
Dev. Obs Mean Std. Dev.
TFP 20815 1,004 0,113 13938 0,97 0,104 6877 1,069 0,099
Tariff 20815 12,511 8,99 13938 12,24 8,931 6877 13,07 9,09
Age 20806 14,318 16,2 13938 13,997 15,36 6870 14,97 17,78
Size 20815 275,934 648,353 13938 66,75 49,73 6877 699,895 999,49
Export 13341 0,199 0,378 9036 0,15 0,335 4305 0,31 0,4359867
KL 20815 169648,5 830337 13938 141190,5 804137,9 6877 227326 878286
PCM 20813 0,188 0,12 13938 0,182 0,116 6875 0,2 0,127
Exit 20815 0,178333 0,382802 13938 0,207921 0,405834 6877 0,118366 0,32064
4.2 Methodology
To examine whether firms of different size are affected differently by
globalization, a probit model is estimated where the dependent variable is set to one

VII-16
if the firm exited and zero if it survives the next year. Globalization will be indicated
by trade liberalization using tariffs and effective protection rates as proxy variables.
As earlier discussed, there is already a large body of literature examining the
determinants of firm survival. In many of these studies, the importance of firm
characteristics such as age, size, wage, and R&D as well as industry features such as
capital intensity, productivity, industry growth and concentration have been
highlighted (see Ferragina et al 2010).
The baseline model specified below will be estimated separately for SMEs and
large enterprises. The criterion used for defining SMEs is the total number of
employees. In the Philippines, SMEs are defined as enterprises with 10 to 199
workers while large enterprises are those employing 200 or more workers. The
baseline model is given by:
Pr(𝑒𝑥𝑖𝑡𝑖𝑡 = 1)
= 𝐹 (𝑇𝑅𝐴𝐷𝐸𝑗𝑡, 𝑇𝐹𝑃𝑖𝑡, 𝑂𝑊𝑁𝐸𝑅𝑆𝐻𝐼𝑃𝑖𝑡, 𝐴𝐺𝐸𝑖𝑡, 𝑆𝐼𝑍𝐸𝑖𝑡 , 𝐸𝑋𝑃𝑂𝑅𝑇𝑖𝑡, 𝐾𝐿𝑖𝑡,
𝑃𝐶𝑀𝑗𝑡, 𝑅&𝐷𝑖𝑡, 𝑆𝑢𝑏𝑠𝑖𝑑𝑦𝑖𝑡, 𝐷𝑢𝑚𝑚𝑦 𝑉𝑎𝑟𝑖𝑎𝑏𝑙𝑒𝑠)
(1)
where i indexes firms, j industry, and t year. The explanatory variables include firm-
level controls such as productivity (TFP), foreign ownership (OWNERSHIP), age
(AGE), number of workers (SIZE), export (EXPORT), capital intensity (KL), price
cost margin (PCM), R&D and subsidy indicators along with industry and year
dummies.
To capture firm heterogeneity, firm size was interacted with tariffs
(SIZE*Tariff) and effective protection rates (SIZE*EPR) as well as with firm
characteristics such as ownership (SIZE*OWNERSHIP) and export (SIZE*EXPORT).
TRADE is the trade policy variable proxied by tariff rates and effective
protection rates (EPRs) in sector j. Effective protection rates take into account both
the tariff on the firm’s output and the tariffs on the inputs that the firm uses. EPRs
are important because tariffs vary considerably along the production stage generally
exhibiting an escalating structure with inputs having lower protection while final
goods receive higher protection. It is assumed that liberalization tends to suggest a
negative effect on the exit rate and a positive effect on firm survival. This implies

VII-17
that a lower (higher) tariff or EPR increases (decreases) the probability of exit and
reduces (increases) the firm’s survival likelihood.
TFP is the firm’s total factor productivity defined as the residual of a Cobb-
Douglas production function and estimated using the methodology of Levinsohn and
Petrin (2003). In estimating the production function, data on value added (output less
cost of materials and energy) and two factors of production, labor and capital, were
used. Fuel and electricity data were employed as proxy for productivity shocks.2 A
production function was estimated for 11 industry-sectors. The estimates of firm i’s
TFP is obtained by subtracting firm i’s predicted y from its actual y at time t. To
make the estimated TFP comparable across industry-sectors, a productivity index is
created. Firms with higher productivity are expected to have higher survival rates.
OWNERSHIP is an indicator of firm ownership, it is equal to 1 if the firm has
10% or more foreign equity. Higher foreign equity participation decreases the
probability of exit and has a positive effect on survival.
AGE is the difference between year t and the year the firm started its operations.
It is expected that the probability of exit declines with the age of the firm. As earlier
discussed, there are three major hypotheses in the literature. The hypothesis of
“liability of newness” shows that newer and younger enterprises have a higher rate of
death risk than older ones because newer enterprises must gradually adapt to the
environment and establish themselves over time. The hypothesis of “liability of
adolescence” shows that with age, SMEs’ death risk follows an inverted U-shape
pattern rather than a linear decline over time. In the enterprise’s life cycle, its death
risk increases over time and until it is able to adapt to the environment when its death
risk starts to fall. The hypothesis of “liability of senescence” indicates that older
enterprises face an increasing death risk as they find it difficult to adapt to the
changing and competitive market environment because they are more rigid than
younger enterprises. When an enterprise reaches a certain age, its death risk will once
again increase.
2 To address the simultaneity problem in input choice when estimating the production function by
ordinary least squares (OLS), a semi-parametric estimator with an instrument to control for
unobserved productivity shocks is applied. For this instrument, Olley and Pakes (1996) use
investment while Levinsohn and Petrin (2002) suggest the use of intermediate inputs.

VII-18
SIZE is measured by total number of workers. In most studies, firm size is reported to
have an important role in explaining survival particularly in relation to scale
efficiency. Larger firms are more likely to have levels of output close to the
minimum efficient scale (MES), ceteris paribus, and thus smaller firms have an
inherent size advantage (P. Holmes, et al 2010). Most studies suggest a positive
relationship between plant size and survival (Audretsch and Mahmood, 1995;
McCloughan and Stone, 1998; Disney et al, 2003; Perez et al 2004; Persson, 2004).
EXPORT is a ratio of the firm’s total exports to total output. A negative
coefficient is expected indicating that a higher export ratio reduces the probability of
exit.
KL is capital intensity measured as the ratio of the book value of assets to total
workers. It is expected that with high capital intensity, the probability of exit
declines.
PCM is price cost margin, which following Aghion et al (2002), is used as an
indicator of product market competition. The PCM is an indicator of the level of
competition or degree of monopoly power of firms in industries. Note that while high
PCM implies market power, it could also indicate high firm efficiency particularly if
these high mark-ups or margins are the result of internal efficiency improving
measures or represent gains from product innovation or techniques that a firm
employs.
The PCM is measured as [Total Revenue-Compensation-Total Cost-Financial
Cost of Capital]/Total Revenue where Total Cost is the sum of raw materials, fuel,
electricity, depreciation and other costs while the Financial Cost of Capital=[Index of
Investment Goods*Real Interest Rate]*Book Value of Assets.
The degree of competition measured by concentration ratio is expected to have
an impact on firm survival with the general argument that increased concentration in
the industry will make the environment more difficult for new entrants, leading to
greater risk of failure (P. Holmes et al 2010). However, the results in the empirical
literature are quite mixed, while Balwin and Rafiquzzaman (1995) and McCloughan
and Stone (1998) find a significant relationship between concentration and firm
duration, Wagner (1994) finds no such relationship for German manufacturing. P.
Holmes et al (2010) obtained the same finding as Wagner (1994).

VII-19
R&D is a research and development expenditure dummy variable reported by the
firm and which is used as proxy for innovation. R&D expenditures refer to amount
spent on any systematic and creative work undertaken to increase the stock
knowledge and the use of the knowledge to devise new applications (NSO, 2000
Census of Philippine Business and Industry).
Subsidy is a dummy variable representing that the firm is a recipient of fiscal
assistance or support from the government. Subsidies are defined as special grants in
the form of financial assistance or tax exemption or tax privilege received from the
government to aid and develop an industry. These include tax credit, tax and duty
exemptions, price support, interest rate subsidy and price discount (NSO, 2000
Census of Philippine Business and Industry).
The summary statistics of the covariates are presented in Table 5. The same
dataset will also be used to provide a detailed examination of the duration of survival
of SMEs and large enterprises and whether there are considerable differences
between factors affecting the survival of SMEs and those affecting large enterprises.
The duration of the life of a firm is important in examining the factors affecting firm
survival. One major problem encountered in analysing duration data is censored data
(most commonly encountered form is right censoring) which refers to firms that are
still alive or surviving at the time when the data was last collected. Ordinary
regression models cannot correctly incorporate information from both censored and
uncensored data in estimating parameters.
To overcome the problems caused by censored data, survival models are applied.
Using a hazard rate approach, survival models consider not only whether a firm will
stop operating but also the length of time the firm has operated. The hazard rate
model of the duration of the life of a firm provides a statistical representation of the
relation between the survival time of a firm and certain explanatory variables or
covariates. This involves modelling the conditional probability that a firm will stop
operating over a specified period of time. The hazard rate can be thought of as the
rate at which firms die after duration t, given that they survive at least until time t
(Holmes et al 2010).

VII-20
A survival analysis technique will be tested using a Cox Proportional Hazards
model to be estimated as follows:
ℎ(𝑡) = ℎ0(𝑡)𝑒(𝛽𝑖𝑋𝑖)
..........(2)
where h(t) is the rate at which firms exit at time t given that they have survived in t-1
and h0 is the baseline hazard function (the parametric form of which is not specified)
when all of the covariates are set to zero. The covariates or explanatory variables Xi
measure the impact of policy as well as firm and sector characteristics on firm
survival. Interaction terms (SIZE*TRADE, SIZE*OWNERSHIP, SIZE*EXPORT)
are also introduced in the model.
Each independent variable coefficient, βi (i=1,2…n), estimates the change in the
hazard rate of a one-unit change in the given independent variable, holding all other
variables in the model constant. The hazard ratio can be expressed as eβi
, indicating
the effect of a one-unit change in the independent variable on the hazard function h(t)
or the exit probability. A hazard ratio of 1.0 that suggests a one unit change in the
independent variable has no effect on the likelihood of exit holding all other
variables constant. A hazard ratio of less (more) than 1.0 suggests a lower (higher)
likelihood of exit.
5. Empirical Results
5.1. Probit Model
Tables 6a and 6b present the results for the Probit model estimation for all
enterprises and SMEs and large enterprises, respectively. Using tariffs as trade proxy
variable and without interaction terms, Table 6a Model 1 shows that firm size is
negatively correlated with the probability of exit indicating that smaller firms are
more likely to exit. The results also show that firms that are more productive, older,
with foreign ownership, and engaged in export activities are less likely to exit.
Capital intensity, though it has a negative coefficient, is not statistically significant.
The coefficient on PCM is negative but is not statistically significant and while the
coefficient on R&D is negative, it is not significant. Firm subsidy is negatively

VII-21
correlated with the probability of exit and is highly significant. Meanwhile, the
coefficient on tariff is negative and highly significant indicating that lower tariffs are
associated with higher probability of firm exit.
Table 6a: Firm Exit, Probit Regressions: All Enterprises
Tariff Effective Protection Rate
Variables Model 1 Model 2 Model 3 Model 4
TFP -1.047244***
(.1425722)
-1.081724***
(.1529636)
-1.004758***
(0.1419652)
-1.054157***
(0.1520611)
Trade -.0091453***
(.0020584)
-0.006943***
(0.0021641)
0.0000178
(0.0007349)
0.0005352
(0.0009306)
Age -.0052233***
(.000887)5
-0.0049492***
(0.0008919)
-0.0050008***
(0.0008828)
-0.0047668***
(0.0008868)
Export -.3598736***
(.0466114)
-.3763548***
(0.0517314)
-0.3581515***
(0.046579)
-0.4021739***
(0.0512962)
Ownership -.1595802***
(.0382081)
-.1646349***
(0.0428813)
-0.152594***
(0.0381538)
-0.1647362***
(0.0429594)
Size -.0000957***
(.0000316)
-0.001418***
(0.0003756)
-0.0000975***
(0.0000317)
-0.0017592***
(0.0003501)
PCM -.1197328
(.1251199)
-0.1452372
(0.1251877)
-0.1200158
(0.125423)
-0.1490802
(0.1254149)
KL -1.83e-08
(2.31e-08)
-2.42e-08
(2.43e-08)
-1.30e-08
(2.15e-08)
-1,69E-08
(0.0000000224)
Subsidy -.1198715***
(.0378025)
-0.1130349***
(0.0378696)
-0.1934975***
(0.0341531)
-0.185377***
(0.0342471)
R&D -.0997363
(.0635185)
-0.1082948*
(0.0638537)
-0.0949012
(0.0634787)
-0.0949576
(0.063696)
Size*trade
-0.0000114***
(4.02e-06)
-0,000000827
(0.00000101)
Size*Ownership
0.0001023
(0.000070)1
0.0001323*
(0.0000699)
Size*Export
0.000096
(0.0000705)
0.0002086***
(0.0000628)
Size*TFP
0.0011636***
(0.0003223)
0.0013002***
(0.0003109)
Year Y Y Y Y
Industry Y Y Y Y
Obs 11964 11964 11964 11964
Log likelihood -5110,3628 -5086,7056 -5120,4061 -5100,0844
Notes: Size is measured by number of workers. ***significant at 1%, ** significant at 5% and *
significant at 10%. Numbers in parentheses are error terms while coefficients represent
marginal effects (dy/dx).

VII-22
Model 2 presents the results with the introduction of interaction variables. The
coefficient on the interaction between size and tariff shows a highly significant
negative coefficient indicating that not only do tariff reductions increase the
probability of firm exit but this negative effect of tariff is even larger for small firms.
Size was also interacted with ownership and export but the coefficients are not
statistically significant. The final interaction term is productivity and the results show
a highly significant positive coefficient indicating that lower probability of exit is
associated with highly productive small firms.
The results obtained for the other control variables are the same as those
obtained earlier. Productivity, age, export, foreign ownership, and subsidy are
important determinants of firm exit. In particular, exit is lower for firms that are
older, with high productivity level, with high export shares, have foreign equity, and
receive government subsidy. The results also show a significant negative coefficient
on R&D indicating that lower probability of exit is associated with firms that have
R&D activities.
Models 3 and 4 use effective protection rate as trade policy variable. In both
models, however, the coefficient on EPR is positive but not significant. For the
control variables, the same basic results are obtained with older, larger, more
productive, exporting firms, and firms that receive government subsidy being less
likely to exit. For the interaction terms, the results show that lower probability of exit
is associated with small firms that export, have foreign equity, and have high
productivity level. This indicates that while small firm size is correlated with higher
probability of exit, this can be mitigated for firms with higher exports, have foreign
equity, and higher level of productivity.
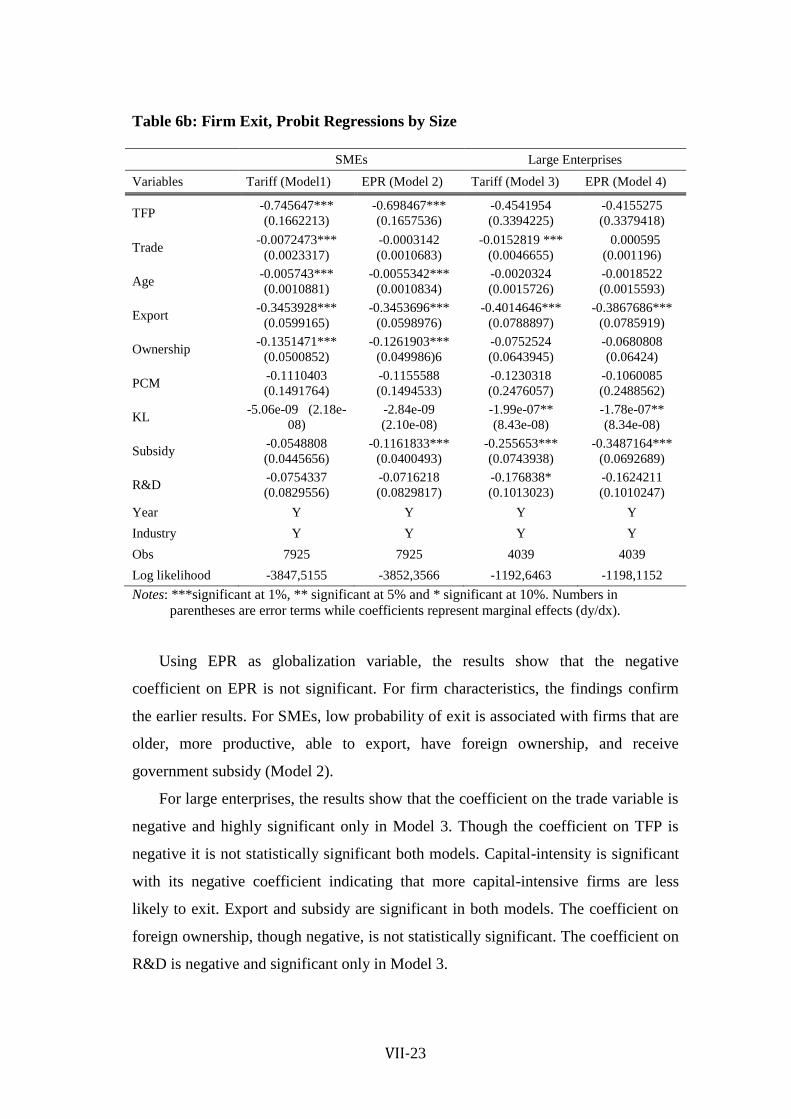
Table 6B presents the probit results explaining the probability of exit for SMEs
and large enterprises. For SMEs using tariff as trade policy variable, the results
indicate the same general findings with larger, older, and more productive firms
being less likely to exit. Firms with foreign ownership as well as those that are
export-oriented are also less likely to exit. The coefficient on tariff is negative and
highly significant indicating that firms facing reduced tariffs on their products are
more likely to exit. PCM, capital intensity, subsidy, and R&D are not significant
(Model 1).
VII-23
Table 6b: Firm Exit, Probit Regressions by Size
SMEs Large Enterprises
Variables Tariff (Model1) EPR (Model 2) Tariff (Model 3) EPR (Model 4)
TFP -0.745647***
(0.1662213)
-0.698467***
(0.1657536)
-0.4541954
(0.3394225)
-0.4155275
(0.3379418)
Trade -0.0072473***
(0.0023317)
-0.0003142
(0.0010683)
-0.0152819 ***
(0.0046655)
0.000595
(0.001196)
Age -0.005743***
(0.0010881)
-0.0055342***
(0.0010834)
-0.0020324
(0.0015726)
-0.0018522
(0.0015593)
Export -0.3453928***
(0.0599165)
-0.3453696***
(0.0598976)
-0.4014646***
(0.0788897)
-0.3867686***
(0.0785919)
Ownership -0.1351471***
(0.0500852)
-0.1261903***
(0.049986)6
-0.0752524
(0.0643945)
-0.0680808
(0.06424)
PCM -0.1110403
(0.1491764)
-0.1155588
(0.1494533)
-0.1230318
(0.2476057)
-0.1060085
(0.2488562)
KL -5.06e-09 (2.18e-
08)
-2.84e-09
(2.10e-08)
-1.99e-07**
(8.43e-08)
-1.78e-07**
(8.34e-08)
Subsidy -0.0548808
(0.0445656)
-0.1161833***
(0.0400493)
-0.255653***
(0.0743938)
-0.3487164***
(0.0692689)
R&D -0.0754337
(0.0829556)
-0.0716218
(0.0829817)
-0.176838*
(0.1013023)
-0.1624211
(0.1010247)
Year Y Y Y Y
Industry Y Y Y Y
Obs 7925 7925 4039 4039
Log likelihood -3847,5155 -3852,3566 -1192,6463 -1198,1152
Notes: ***significant at 1%, ** significant at 5% and * significant at 10%. Numbers in
parentheses are error terms while coefficients represent marginal effects (dy/dx).
Using EPR as globalization variable, the results show that the negative
coefficient on EPR is not significant. For firm characteristics, the findings confirm
the earlier results. For SMEs, low probability of exit is associated with firms that are
older, more productive, able to export, have foreign ownership, and receive
government subsidy (Model 2).
For large enterprises, the results show that the coefficient on the trade variable is
negative and highly significant only in Model 3. Though the coefficient on TFP is
negative it is not statistically significant both models. Capital-intensity is significant
with its negative coefficient indicating that more capital-intensive firms are less
likely to exit. Export and subsidy are significant in both models. The coefficient on
foreign ownership, though negative, is not statistically significant. The coefficient on
R&D is negative and significant only in Model 3.

VII-24
Using tariff as globalization variable, the results show that for both SMEs and
large enterprises, the coefficient on tariff is negative indicating that firms facing
reduced tariffs on their products are more likely to exit. The results highlight the
importance of improving productivity, allowing foreign ownership, and engaging in
export activities to increase the probability of SME survival. For large enterprises,
R&D, capital intensity and export-orientation are significant determinants of
survival.
5.1. Non-parametric Analysis
When no covariates exist or when covariates are qualitative in nature, non-
parametric methods like Kaplan and Meier can be applied to estimate the probability
of survival past a certain time. Figures 1a and 1b show the Kaplan and Meier
estimates of firm survivor function or the probability of survival until time t. The left
graph Figure 1A shows that survival of manufacturing firms in the Philippines
declines immediately from the first year leaving the survival probability around 86%
(see Table 7). At the end of the eleventh year, only 42% of the sample firms are still
surviving.
Figure: 1a

VII-25
Figure: 1b
The right graph Figure 1b compares the survival probabilities of SMEs and large
enterprises. After the first year, the survival probabilities of both decline with large
enterprises having higher probabilities of survival. A log-rank test for equality was
conducted to compare the survival experience of the two groups of firms. The result
showed a significant difference between the two survivor functions (p-value is
0.0003 and the null hypothesis of equality is rejected).
Table 7: Survivor Function
Time ALL SMEs Large Enterprises
2 0,855 0,8393 0,903
3 0,8269 0,8134 0,8682
5 0,7735 0,7595 0,8163
7 0,7023 0,6985 0,7128
8 0,6467 0,6444 0,6522
10 0,5693 0,5668 0,5758
11 0,4213 0,4075 0,4672
5.1 Semi-parametric Analysis: Cox Proportional Hazards Model
Tables 8 and 9 show the results estimated for two groups: all enterprises (Tables
8a and 8b) and SMEs and large enterprises (Tables 9a and 9b). Tables 8a and 9a
present the results containing the Cox regression coefficients while Tables 8b and 9b

VII-26
contain the hazard ratios estimates calculated from the coefficients (exponentiated
coefficients).3 A hazard ratio greater than one is interpreted as decreasing firm
survival, ceteris paribus, or if it is less than one it is increasing firm survival, all other
things held constant.
The results in Table 8a, which cover all enterprises, show that larger, older, and
more productive firms are less likely to exit. Firms that export, have foreign
ownership as well as those that engage in R&D activities are also less likely to exit.
These results are generally consistent with the earlier findings based on the probit
regressions earlier presented. For capital intensity and PCM, the coefficients are not
significant in both models using tariff and EPR as trade variables.
For tariff, the results show that firms in liberalized industries are less likely to
exit. This is not consistent with the earlier Probit regression result which showed that
the probability of exit is negatively associated with tariff reduction. For subsidy, the
results are also not consistent with the earlier results. For the interaction terms, the
results are the same as those obtained using Probit regression. Table 8b shows that
tariffs, EPRs, and subsidy reduce firm survival while TFP, Age, Export, Ownership,
R&D, and Size increase firm survival.
3 This shows a difference only in how results are reported but not in the results themselves.

VII-27
Table 8a: Cox Regression Coefficients: All Enterprises
Tariff Effective Protection Rate
Variables Model 1 Model 2 Model 3 Model 4
TFP -1.282465***
(0.2326023)
-1.268221***
(0.24927)
-1.305329***
(0.2324436)
-1.320246***
(0.2482345)
Trade 0.0118659***
(0.0033614)
0.0146819***
(0.0035288)
0.0034157**
(0.0014337)
0.0045196***
(0.0015842)
Age -0.0124783***
(0.0018497)
-0.0122047***
(0.0018583)
-0.0127375***
(0.0018511)
-0.012554***
(0.0018606)
Export -0.1708526**
(0.0862863)
-0.2091858**
(0.0940029)
-0.1780997**
(0.0862421)
-0.2395161***
(0.0943428)
Ownership -0.2982231***
(0.0657143)
-0.2842318***
(0.075896)
-0.2981939***
(0.065726)
-0.3018069***
(0.0760727)
Size -0.0002116***
(0.0000715)
-0.0020188***
(0.000742)
-0.0002116***
(0.0000714)
-0.0025278***
(0.0006623)
PCM -0.0990906
(0.2025448)
-0.1096344
(0.2024222)
-0.081342
(0.2017234)
-0.1042922
(0.2011097)
KL -6,61E-09 -1.68e-08
(4.07e-08)
-1,09E-08 -1.91e-08
(4.14e-08) (0.0000000382) (0.0000000395)
Subsidy 0.9053235***
(0.1038228)
0.9080318***
(0.1034824)
0.9330335***
(0.103237)
0.9392586**
(0.1028273)
R&D -0.2175792**
(0.111292)
-0.2286217**
(0.1120463)
-0.2159311**
(0.1112454)
-0.2231774*
(0.1119451)
Size*trade
-.00002**
-3.36e-06*
(1.97e-06) (0.00000883)
Size*Ownership
0.0000932
(0.0001575)
0.0001627
(0.0001584)
Size*Export
0.000159
(0.0001397)
0.0003113**
(0.0001314)
Size*TFP
0.0016375**
(0.0006317)
0 .00185***
(0.0005961)
Year Y Y Y Y
Industry Y Y Y Y
Obs 11753 11753 11753 11753
Log likelihood -15546,413 -15529,819 -15549,679 -15535,037
Test of
proportional-
hazards
assumption
chi2 74.92 chi2 66.56 chi2 74.67 chi2 67.84
Prob>chi2 Prob>chi2 Prob>chi2 Prob>chi2
0 0 0 0
Notes: ***significant at 1%, ** significant at 5% and * significant at 10%. Numbers in
parentheses are error terms.

VII-28
Table 8b: Cox Hazards Function Estimation Results: All Enterprises
Tariff Effective Protection Rate
Variables Model 1 Model 2 Model 3 Model 4
TFP 0.2773527***
(0.0645129)
0.2813318***
(0.0701276)
0.2710834***
(0.0630116)
0.2670696***
(0.0662959)
Trade 1.011937***
(0.0034015)
1.01479***
(0.003581)
1.003422**
(0 .0014386)
1.00453***
(0.0015914)
Age 0.9875992***
(0.0018268)
.9878695*** .001835
8
.9873432***
(0.0018277)
.9875245***
(0.0018374)
Export .8429458** .072734
6
0.8112445**
(0.0762593)
0.836859**
(0.0721725)
0.7870086***
(0.0742486)
Ownership 0.7421357***
(0.0487689)
0.7525921***
(0.0571187)
0.7421574***
(0.0487791)
0.7394808***
(0.0562543)
Size 0.9997884***
(0.0000715)
0.9979832***
(0.0007405)
0.9997884***
(0.0000714)
0.9974754***
(0.0006606)
PCM 0.9056606
(0.1834369)
0.8961617
(0.181403)
0,9218783 0.900962
(0.1811922) (0.1859644)
KL
1 1 1 1
(0.0000000382) (0.0000000407) (0.0000000395
)
(0.0000000414
)
Subsidy 2.472732***
(0.2567259)
2.479438***
(0.2565782)
2.542209***
(0.2624501)
2.558084***
(0.263041)
R&D 0.8044639**
(0.0895304)
0.7956295**
(0.0891473)
0.8057908**
(0.0896406)
0.7999729**
(0.089553)
Size*trade
0.99998**
0.9999966*
(0.00000883) (0.00000197)
Size*Ownershi
p
1.000093
(0.0001575)
1.000163
(0.0001584)
Size*Export
1.000159
(0.0001397)
1.000311**
(0.0001314)
Size*TFP 1.001639***
(0.0006328)
1.001852***
(0.0005972)
Notes: Size Dummy is equal to 1 if firm is SME and 0 otherwise. ***significant at 1%, **
significant at 5% and * significant at 10%. Numbers in parentheses are error terms.
One of the main assumptions of the Cox proportional hazard model is
proportionality4. Using the Schoenfeld residuals or phtest in Stata, the proportionality
of the model as a whole is tested (null hypothesis is the proportional hazards or PH
assumption holds for all variables). If the tests are not significant (p-value over 0.05),
then we cannot reject proportionality and we assume we do not have a violation of
4 A key assumption of the Cox model is that the hazard rates for two observations are
proportional to one another and that proportionality is maintained over time. The relative hazard
for any two observations I and j must obey the following relationship: ℎ𝑜(𝑡)𝑒𝑋𝑖𝛽
ℎ𝑜(𝑡)𝑒𝑋𝑗𝛽 =
𝑒𝑋𝑖𝛽
𝑒𝑋𝑗𝛽

VII-29
the proportional assumption.5
The results show that in all four models, the
proportionality assumption is violated. Note that given the violation of the
proportional hazard assumption, great care must be exercised in interpreting the
results. Violation of the proportional hazard assumption would tend to overestimate
the effect of variables whose hazard ratios are increasing over time and
underestimate the effect of variables whose hazard ratios are decreasing.
Table 9a examines the survival of SMEs and large enterprises. In Models (1) and
(2) using tariffs, the results show that older and more productive firms are less likely
to exit. Firms that export and have foreign equity are also less likely to exit.
However, for subsidy and tariffs, the results are not the same as those obtained using
Probit regression. The Cox regression results show that firms receiving government
subsidy are more likely to exit while tariff is positively associated with the
probability of exit. Table 9b shows that for SMEs, tariffs and subsidy increase firm
survival while TFP, Age, Export, and Ownership decrease firm survival. Note,
however, that in both models based on tariffs and EPR, the proportionality
assumption is violated.
For large enterprises, the results show that capital-intensive firms and those
engaged in R&D and export activities are less likely to exit. The results also indicate
that while productivity, age and size have the correct signs, they are not significant.
Tariffs, subsidy, and PCM are also not significant. Based on the hypothesis of
“liability of senescence”, elder enterprises that cannot better adapt to the changing
and competitive environment because they are more rigid than the younger
enterprises are again faced with death risk increases. This may explain the
importance of capital-intensity, foreign partnership, and R&D activities to the
survival of large enterprises to help them in adjusting to the changing and highly
competitive market environment.
5 http://www.ats.ucla.edu/STAT/stata/seminars/stata_survival/default.htm

VII-30
Table 9A: Cox Regression Coefficients by Size
SMEs Large Enterprises
Variables Tariff (Model 1) EPR (Model 2) Tariff (Model
3)
EPR (Model
4)
TFP -1.067301***
(0.2572119)
-1.096158***
(0.257092)
-0.2461041
(0.6336783)
-0.2371803
(0.6336249)
Trade 0.0126339***
(0.0036184)
0.0037748**
(0.0017184)
0.0032592
(0.0090646)
0.0032434
(0.0027427)
Age -0.0133611***
(0.0021591)
-0.0136428***
(0.0021617)
-0.0048546
(0.0034741)
-0.0049709
(0.0034703)
Export -0.1847539*
(0.1048389)
-0.1895398*
(0.1047557)
-0.2833838*
(0.1623095)
-0.2872382*
0.1619031
Ownership -
.2479716*** .0815659
-
.2551554*** .0814813
-0.1803728
(0.1197515)
-0.1730197
(0.1200182)
PCM 0.0956431 (0.231748) 0.1135925
(0.2302657)
-0.4267731
(0.4561601)
-0.4192014
(0.4572815)
KL 2.01e-08 (3.36e-08) 1.76e-08 (3.50e-08)
-
0.000000319*
(0.000000169)
-
0.000000321*
(0.000000169)
Subsidy 1.255046***
(0.1234556)
1.287554***
(0.122512)
0.0503866
(0.1968305)
0.0549929
(0.1968498)
R&D -0.1749905
(0.1373236)
-0.1795886
(0.1372452)
-0.3679606*
(0.1923418)
-0.3627136*
(0.1924064)
Year Y Y Y Y
Industry Y Y Y Y
Obs 7785 7785 3968 3968
Log
likelihood -12065,056 -12068,687 -2463,3978 -2462,702
Test of
proportional-
hazards
assumption
chi2 58.14 chi2 59.24 chi2 20.37 chi2 17.79
Prob>chi2 Prob>chi2 Prob>chi2 Prob>chi2
0 0 0,4982 0,6621
Notes: ***significant at 1%, ** significant at 5% and * significant at 10%. Numbers in
parentheses are error terms.

VII-31
Table 9b: Cox Hazards Function Estimation Results by Size
SMEs Large Enterprises
Variables Tariff (Model 1) EPR (Model 2) Tariff (Model 3) EPR
(Model 4)
TFP 0.3439355***
(0.0884643)
0.3341525***
(0.0859079)
0.7818408
(0.4954356)
0.7888491
(0.4998344
)
Trade 1.012714***
(0.0036644)
1.003782** .001724
9
1.003265 .009094
2
1.003249
(0.0027517
)
Age 0.9867278*** .002130
5
0.9864498***
(0.0021324)
0.9951572
(0.0034572)
0.9950415
(0.0034531
)
Export 0.8313088*
(0.0871535)
0.8273398*
(0.0866685)
0.7532307*
(0.1222565)
0.750333*
(0.1214813
)
Ownershi
p
0.7803821***
(0.0636525)
0.7747961***
(0.0631314)
0.8349589
(0.0999876)
0.8411211
(0.1009498
)
PCM 1.100366 (0.2550076) 1.120295
(0.2579656)
0.6526116
(0.2976954)
0.6575718
(0.3006954
)
KL 1 1 0.9999997*
(1.69e-07)
0.9999997*
(1.69e-07) (0.0000000336) (0.000000035)
Subsidy 3.507999***
(0.4330823)
3.623913***
(0.4439728)
1.051678
(0.2070022)
1.056533
(0.2079783
)
R&D 0.839465 (0.1152783) 0.8356139
(0.114684)
0.6921444*
(0.1331283)
0.6957857*
(0.1338736
)
Notes: ***significant at 1%, ** significant at 5% and * significant at 10%. Numbers in
parentheses are error terms.
Table 9b shows that for large enterprises, the results show that Export, capital
intensity (though the hazard ratio is very close to 1), and R&D increase firm survival.
The hazard ratios of Trade and Subsidy are greater than one, but are not statistically
significant. The proportionality of the model as a whole was tested. For both Models
3 and 4, the proportionality assumption is not violated (given the p-values of 0.4982
and 0.6621, respectively)6 indicating that proportionality cannot be rejected.
6 P-value less than 0.05 indicate violation of proportional hazards assumption.

VII-32
6. Conclustions and Policy Implications
The paper aims to examine the relationship between globalization and the
survival of SMEs using both tariffs and effective protection rates as globalization
proxy variables. These are added to the factors that affect firm exit consisting of firm
characteristics such as age, size, productivity, capital intensity, ownership, export,
and R&D. Government subsidy and price cost margins at the industry level are also
included. To capture firm heterogeneity, firm size was interacted with tariffs and
effective protection rates as well as with firm characteristics such as productivity,
ownership and export.
Data on the Philippine manufacturing industry covering eight years from 1996 to
2006 are used in the empirical analysis. Two estimation methods are employed:
Probit and Cox proportional hazard models. However, given the violation of the
proportionality assumption, the results of the Cox regression must be interpreted with
care. The Probit results confirm previous research finding that firm size, age, and
productivity are important determinants of firm exit. Controlling for these attributes,
the results show that tariffs are negatively correlated with firm exit and in the face of
tariff reduction, the probability of exit is higher for small firms. Firm exit is greater
for small enterprises characterized by low productivity, non-exporter and without
foreign equity. Firms that have high level of productivity, engage in export activities
and have foreign equity are better able to survive. These suggest that firm
characteristics such as high productivity level, exports, and ownership structure can
mitigate the effects of declining tariffs.
For the other control variables, the results show that firm subsidy is negatively
correlated with the probability of exit and is highly significant. The results also show
a significant negative coefficient on R&D indicating that lower probability of exit is
associated with firms that have R&D activities.
The dataset was further divided into two groups: SMEs and large enterprises and
analyzed the determinants of survival for each group separately. Using tariff as
globalization variable, the results indicate the same general findings with older and
more productive firms being less likely to exit. Firms with foreign ownership as well
as those that are export-oriented are also less likely to exit. The coefficient on tariff is

VII-33
negative and highly significant indicating that firms facing reduced tariffs on their
products are more likely to exit.
SMEs face a number of constraints such as scale disadvantage, lack of high-level
employees, and financial access. To grow and adapt to the market environment and
increase their survival probability, they need to increase their size. As many previous
studies suggest, larger firms are more likely to have levels of output close to the
minimum efficient scale (MES), ceteris paribus, hence smaller firms have an inherent
size disadvantage (Holmes, Hunt, and Stone, 2010). Apart from scale disadvantage,
smaller firms also suffer from lack of financial access. It is important to note that
firms with foreign equity are more likely to survive due to the financial backing
which is likely to be provided by the foreign partner.
Meanwhile, for large enterprises, the results show that the coefficient on the
trade variable is negative and highly significant. Capital-intensity is significant with
its negative coefficient indicating that more capital-intensive firms are less likely to
exit. Export, subsidy, and R&D are also significant. The Cox regression results also
show that for large enterprises, capital-intensive firms and those engaged in R&D
and export activities are less likely to exit. Large enterprises must continue to learn to
adapt quickly to the highly changing competitive environment by upgrading and
innovating because as the “liability of senescence” shows, upon reaching a certain
age, enterprises again face a rising death risk.
All these tend to show that in a more open trade and investment policy regime,
firms need to adopt efficient methods to reduce cost, improve quality and enable
more productive firms to grow more rapidly and increase their survival. It is widely
accepted that multinational firms are a vital source of international capital and
technology and their entry can facilitate the transfer of technical and business know-
how resulting in productivity gains and competitiveness among domestic firms. The
entry of multinational firms may also increase competition and force domestic firms
to imitate and innovate. Multinationals also have established global or regional
production bases where domestic firms can link with by serving as potential
suppliers. With their extensive marketing networks, multinational firms also have the
potential of making significant contributions to facilitating the marketing of exports
of their domestic partners.

VII-34
Government SME policy should be directed towards measures that would
enhance firm productivity and attracting more foreign direct investment especially
those that would improve SME linkages with multinational companies. Deepening
linkages with multinational firms’ international production networks would be
important in realizing the potential gains from the trade and investment liberalization
arising from regional economic integration through the ASEAN Economic
Community. At the same time, policies should focus on carefully crafted support
programs that would improve SME productivity to help them grow and develop. For
large enterprises, policies should be directed on programs that would enhance
innovation and upgrading activities.
References
Aldaba, R. (2011), Globalization and Firm Survival in Philippine Manufacturing.
Paper submitted to the Economic Research for ASEAN and East Asia.
Alvarez, R. and S. Vergara (2006) Globalization, survival, and growth of small and
medium firms. http://ssrn.com/abstract=880785 or
http://dx.doi.org/10.2139/ssrn.880785
Audretsch, D.B. and T. Mahmood. 1995. The propensity to exit and innovation.
Review of Industrial Organization. 10: 589-605.
Baggs, J. (2004), ‘Changing Trade Barriers and Canadian Firms: Survival and Exit
After the Canada-US Free Trade Agreement’, Research Paper, Analytical
Studies Branch, Statistics Canada.
Baldwin, J. R. and Rafiquzzaman, M. (1995), “Selection vs. evolutionary adaptation:
learning and post entry performance”. International Journal of Industrial
Organization. 13: 501-22.
Bernard, Andrew., J. B. Jensen and P. Schott (2006), ‘Survival of the best fit:
Exposure to low-wage countries and the (uneven) growth of US
manufacturing firms,' Journal of International Economics 68 (2006): 219-
237.
Bernard, A., J.B. Jensen, and P. Schott (2003), ‘Falling Trade Costs, Heterogeneous
Firms, and Industry Dynamics’, NBER Working Paper Series, No. 9639,
Cambridge, MA: NBER.
Bernard, A. and J.B. Jensen (2002), ‘The Deaths of Manufacturing Plants’, NBER
Working Paper Series, No. 2096, Cambridge, MA: NBER.
Cao, Yu. (2012), “A survival analysis of SMEs in central China and their
determinants”. African Journal of Business Management. Vol. 6(10): 834-
3850.
Colantone, I., Kristien Coucke, and Leo Sleuwaegen (2010), “Globalization and Firm
Exit: Differences Between Small and Large Firms”. Hogerschool-Universiteit
Brussel (HUB) Research Paper 2010/19. MEU 2010.

VII-35
Couke, K. and L. Sleueaegen (2008). Exit in Globalizing Industries: the Role of
International Outsourcing. Journal of International Business Studies. On-line,
1-17.
Disney, R., J. Haskel, and Y. Heden (2003), Entry, exit and establishment survival in
UK manufacturing. Journal of Industrial Economics. 51. 91-122.
Facanha, L.O., M.Resende, and V. Cardoso (2012), Determinants of survival of
newly created SMEs in the Brazilian Manufacturing: an econometric study.
CESifo Working Paper No. 3735.
Ferragina, A., R. Pittiglio and F. Reganati (2010), ‘The impact of FDI on firm
survival in Italy’, 6th
International Scientific Conference, May 13-14 2010,
Lithuania. Business and Management, 2010 Selected Papers. Vilnius.
Giovannetti, G., G. Ricchiuti, and M. Velluchi (2011), Size, Innovation and
Internationalization: A Survival Analysis of Italian Firms. Applied
Economics. 43: 1511-20.
Gu, Wulong, G. Sawchuk and L. Whewell (2003), ‘The Effect of Tariff Reductions
on Firm Size and Firm Turnover in Canadian Manufacturing’, Economic
Analysis Research Paper Series. Statistics Canada.
Holmes, P., A. Hunt, and I. Stone (2010), “An analysis of new firm survival using a
hazard function”. Applied Economics. 42: 185-195.
Hyytinen, A. and M. Pajarinen (2004), Is the Cost of Debt Capital Higher for
Younger Firms? Discussion Paper No. 946. The Research Institute of the
Finnish Economy. Finland.
Liedholm, C. and D. Mead (1998), The Dynamics of Micro and Small Enterprises in
Developing Countries. World Development. Vol. 26: 61-74. Elsevier.
Levinsohn, J. and A. Petrin (2003), ‘Estimating Production Functions Using Inputs to
Control for Unobservables’, Review of Economic Studies 70, No. 2: 317-341.
Liu, J. and D. Pang (2006) Determinants of survival and growth of listed SMEs in
China.
Mata, J. and P. Portugal (2001), ‘The survival of new domestic and foreign-owned
firms’, Banco de Portugal Economics Research Department. WP 1-01.
McCloughan, P. and I. Stone. (1998), “Life duration of foreign multinational
subsidiaries: evidence from UK northern manufacturing industry 1970-93.
International Journal of Industrial Organization. 16: 719-48.
Melitz, M. (2003), ‘The Impact of Trade on Intra-Industry Reallocations and
Aggregate Industry Productivity’, Econometrica. Vol. 71. No. 6 (November):
1695-1725.
Nunes, P.M and Z. Serrasquiro (2013), Are young SMEs’ survival determinants
different? Empirical evidence using panel data. Applied Economics Letters.
19(9): 849-855.
Perez, S.E., A.S. Llopis and J.A.S Llopis (2004), Determinants of survival of Spanish
manufacturing firms. Review of Industrial Organization. 25: 251-73.
Persson, H. (2004), The survival and growth of new establishments in Sweden, 1987-
1995. Small Business Economics. 23: 423-40.


