Understanding the Mechanism of Tsunami-induced … · E-mail: [email protected]...
34
Received 6 March 2014 © 2014 The Japan Society of Mechanical Engineers ISBN 978-4-88898-244-3 24 Report of the JSME Research Committee on the Great East Japan Earthquake Disaster The Japan Society of Mechanical Engineers Chapter 4 Understanding the Mechanism of Tsunami-induced Damage to Machines and Structures Based on a Discipline of Mechanics Shinobu YOSHIMURA*, Hitoshi NAKAMURA**, Hiroshi KANAYAMA***, Takayuki AOKI****, Takehiro HIMENO*****, Yuzuru SAKAI******, Seiichi KOSHIZUKA*******, Daigoro ISOBE********, and Hideki FUJII******* *Leader of WG2 Department of Systems Innovation, The University of Tokyo 7-3-1 Hongo, Bunkyo-ku, Tokyo 113-8656, Japan E-mail: [email protected] **Science and Engineering Systems Division, ITOCHU Techno-Solutions Corp. 3-2-5 Kasumigaseki, Chiyoda-ku, Tokyo 100-6080, Japan E-mail: [email protected] ***Information Technology Center, Nagoya University Furo-cho, Chikusa-ku, Nagoya 464-8601, Japan E-mail: [email protected] ****Global Scientific Information and Computing Center, Tokyo Institute of Technology 2-12-1 Ookayama, Meguro-ku, Tokyo 152-8550, Japan E-mail: [email protected] *****Department of Aeronautics and Astronautics, The University of Tokyo 7-3-1 Hongo, Bunkyo-ku, Tokyo 113-8656, Japan E-mail: [email protected] ******College of Education and Human Sciences, Yokohama National University 79-1 Tokiwadai, Hodogaya-ku, Yokohama, Kanagawa 240-8501, Japan E-mail: [email protected] *******Department of Systems Innovation, The University of Tokyo 7-3-1 Hongo, Bunkyo-ku, Tokyo 113-8656, Japan E-mail: {koshizuka, fujii}@sys.t.u-tokyo.ac.jp ********Graduate School of Systems and Information Engineering, University of Tsukuba 1-1-1 Tennodai, Tsukuba, Ibaraki 305-8577, Japan E-mail: [email protected] Abstract This chapter describes an investigation and examination of the complicated mechanisms of damage to machines and structures caused by tsunamis. We attempted to understand the mechanisms of tsunami-induced damage from a bird’ s-eye-view in the case when civil and architectural structures, machinery and equipment are damaged and become unable to function, in addition to understanding a tsunami propagating from a seismic source. Toward this purpose, we studied actual phenomena that took place during the Great East Japan Earthquake (GEJE). Furthermore, we comprehensively examined the mechanisms of tsunami-induced damage that may occur in the future, and then aimed at obtaining useful knowledge towards future disaster prevention and mitigation. A vast quantity of recorded visual information on tsunami-induced damage during the GEJE was reviewed for the investigation and examination. Moreover, each member of Working Group 2 (WG2) performed his own field survey and simulation-based research. We then comprehensively examined those results.
Transcript of Understanding the Mechanism of Tsunami-induced … · E-mail: [email protected]...

Received 6 March 2014 © 2014 The Japan Society of Mechanical Engineers ISBN 978-4-88898-244-3
24
Report of the JSME Research Committee on the Great East Japan Earthquake Disaster
The Japan Society of Mechanical Engineers
Chapter 4
Understanding the Mechanism of Tsunami-induced Damage
to Machines and Structures Based on a Discipline of
Mechanics
Shinobu YOSHIMURA*, Hitoshi NAKAMURA**, Hiroshi KANAYAMA***, Takayuki AOKI****,
Takehiro HIMENO*****, Yuzuru SAKAI******, Seiichi KOSHIZUKA*******, Daigoro
ISOBE********, and Hideki FUJII*******
*Leader of WG2
Department of Systems Innovation, The University of Tokyo
7-3-1 Hongo, Bunkyo-ku, Tokyo 113-8656, Japan
E-mail: [email protected]
**Science and Engineering Systems Division, ITOCHU Techno-Solutions Corp.
3-2-5 Kasumigaseki, Chiyoda-ku, Tokyo 100-6080, Japan
E-mail: [email protected]
***Information Technology Center, Nagoya University
Furo-cho, Chikusa-ku, Nagoya 464-8601, Japan
E-mail: [email protected]
****Global Scientific Information and Computing Center, Tokyo Institute of Technology
2-12-1 Ookayama, Meguro-ku, Tokyo 152-8550, Japan
E-mail: [email protected]
*****Department of Aeronautics and Astronautics, The University of Tokyo
7-3-1 Hongo, Bunkyo-ku, Tokyo 113-8656, Japan
E-mail: [email protected]
******College of Education and Human Sciences, Yokohama National University
79-1 Tokiwadai, Hodogaya-ku, Yokohama, Kanagawa 240-8501, Japan
E-mail: [email protected]
*******Department of Systems Innovation, The University of Tokyo
7-3-1 Hongo, Bunkyo-ku, Tokyo 113-8656, Japan
E-mail: {koshizuka, fujii}@sys.t.u-tokyo.ac.jp
********Graduate School of Systems and Information Engineering, University of Tsukuba
1-1-1 Tennodai, Tsukuba, Ibaraki 305-8577, Japan
E-mail: [email protected]
Abstract
This chapter describes an investigation and examination of the complicated mechanisms of damage to
machines and structures caused by tsunamis. We attempted to understand the mechanisms of tsunami-induced
damage from a bird’s-eye-view in the case when civil and architectural structures, machinery and equipment
are damaged and become unable to function, in addition to understanding a tsunami propagating from a
seismic source. Toward this purpose, we studied actual phenomena that took place during the Great East Japan
Earthquake (GEJE). Furthermore, we comprehensively examined the mechanisms of tsunami-induced damage
that may occur in the future, and then aimed at obtaining useful knowledge towards future disaster prevention
and mitigation. A vast quantity of recorded visual information on tsunami-induced damage during the GEJE
was reviewed for the investigation and examination. Moreover, each member of Working Group 2 (WG2)
performed his own field survey and simulation-based research. We then comprehensively examined those
results.

The Japan Society of Mechanical Engineers
Report of JSME Research Committee on the Great East Japan Earthquake Disaster
© 2014 The Japan Society of Mechanical Engineers ISBN 978-4-88898-244-3
25
Keywords: Tsunami phenomena, Tsunami-induced damage, Machines, Structures, Computational mechanics,
Tsunami proof design.
1. Introduction
We investigated and examined the complicated mechanisms of damage to machines and structures caused by
tsunamis. Tsunami phenomena such as initiation, propagation and run-up might be basically discussed in specialized
academic societies such as the Japan Society of Civil Engineers. However, we, as the Japan Society of Mechanical
Engineers, attempted to understand the mechanisms of tsunami-induced damage from a bird’s-eye-view in the case
when civil and architectural structures, machinery and equipment are damaged and become unable to function, in
addition to understanding a tsunami propagating from a seismic source. Toward this purpose, we studied actual
phenomena that took place during the Great East Japan Earthquake (GEJE). Furthermore, we comprehensively
examined the mechanisms of tsunami-induced damage that may occur in the future, and then we aimed at obtaining
useful knowledge towards future disaster prevention and mitigation. A vast quantity of recorded visual information on
tsunami-induced damage during the GEJE was reviewed for the investigation and examination. Each member of
Working Group 2 (WG2) also performed his own field survey and simulation-based research. We then comprehensively
examined those results.
1.1 Anticipated roles of an analytical scientific approach based on a discipline of mechanics
During the GEJE, we were shocked by the frightfully damaging power of the huge tsunami and felt powerless
against the forces of nature. However, it is inevitable that a huge tsunami will again strike Japan, due to its proximity to
plate boundaries. Therefore, it is imperative that scientists and engineers do their best to prevent and mitigate damage
caused by huge tsunamis. For this purpose, we should first understand the mechanisms of tsunami-induced damage to
machines and structures, and second establish measures to prevent and mitigate such damage.
Fundamentally, the propagation and run-up of a tsunami can be regarded as phenomena of fluids, while damage to
machines and structures is a phenomenon of solids. Therefore, the tsunami-induced damage to machines and structures
can be regarded as multi-physics phenomena of fluids and solids. It should also be noted that tsunamis caused by the
dynamics of the earth result in far more complex and severe conditions than those anticipated when designing and
operating machines and structures. A tsunami caused by the movement of plate boundaries propagates for hundreds to
thousands of kilometers in the ocean, rushes to adjacent seas ranging from hundreds to thousands of meters, inundates
stretches of coastal ranging from tens to thousands of meters in length, and finally damages machines and structures at
the scale of centimeters to meters. This is a typical multi-scale phenomenon. Multi-physics and multi-scale phenomena
are some of the latest scientific topics being studied. While research and development of methods to analyze and
evaluate these phenomena have been ongoing worldwide, practical methods have not been established yet (JST CREST,
2009).
We believe that approaches based on a discipline of mechanics would provide us with a bird’s-eye-view for
understanding the mechanisms of tsunami-induced damage and essential solutions for preventing and mitigating this
damage. This would also lead to a new area of study.
1.2 Roles of simulations for design scientific view based on a discipline of mechanics
A quantitative and reliable methodology for tsunami proof design of machines and structures is indispensable for
seeking measures for preventing and mitigating tsunami-induced damage. For example, the mechanisms of and area
damaged by a 5 m high tsunami and 15 m high tsunami differ considerably. Thus, different but concrete measures for
protection against those tsunamis must be designed precisely.
Measures against tsunamis were enacted in several standards and guides even before the GEJE (JSCE, 2002, CAO,
2005). After the GEJE, several additional standards and guides were enacted, considering the actual damage caused by
the huge tsunami. For example, the Guide for Setting Tsunami Inundation Assumption was revised by the Ministry of

The Japan Society of Mechanical Engineers
Report of JSME Research Committee on the Great East Japan Earthquake Disaster
© 2014 The Japan Society of Mechanical Engineers ISBN 978-4-88898-244-3
26
Land, Infrastructure, Transport and Tourism (MLIT, 2012a). The revised guide includes a simulation-based method for
quantitatively assessing the tsunami inundation assumption. The Ministry of Land, Infrastructure, Transport and
Tourism also published the Interpretation of Requirements to Structures of Tsunami Refuge Building and other
documents, which contain a tsunami proof design method (MLIT, 2012b). The Atomic Energy Society of Japan
published the Implementation Standard Concerning Tsunami Probabilistic Risk Assessment of Nuclear Power Plants
(AESJ, 2011).
The conventional design of machines and structures usually employs relatively simple design formula and safety
margins. However, it is very difficult to apply such a simplified formula for measures to prevent and mitigate
tsunami-induced damage because different phenomena and factors are involved. Moreover, because tsunami-related
phenomena are natural phenomena, the magnitude of a tsunami’s influence has a much wider range of uncertainty, and
it is difficult to set rational and sufficient design margins in a design standard. Consequently, direct computer
simulation of the phenomena would be the most appropriate in terms of reliability. Simulation-based design is currently
a well-accepted method for testing the crash worthiness and aerodynamics-related vibration and noise in automotive
design. Such a trend could become indispensable in the tsunami proof design of machines and structures. For
automotive design, the reliability of the method can be improved though accumulating verification and validation
(V&V) of simulation results via comparison with experimental results. However, it is very hard to apply V&V
processes to tsunami-related simulations.
2. Objectives and approaches
A tsunami ultimately causes various types of damage to machines and structures located in coastal areas as a
result of the following process: (1) Generation of tsunami, (2) Long-distance propagation in ocean, (3)
Propagation in adjacent sea, (4) Arrival at coastal land and run-up. Below, the details of each process and related
factors are described.
(1) The generation of a tsunami is influenced by earth-scientific factors such as the magnitude of the earthquake, and
fracture characteristics of the fault and plate boundaries. In the GEJE, the superposition of two different tsunami
sources generated a huge tsunami (Maeda, et al., 2011). Because tsunami generation is an earth-scientific phenomenon,
it is very difficult to predict the magnitude of tsunamis accurately. Therefore, the prediction inevitably has a wide range
of uncertainty.
(2) The long-distance propagation of a tsunami in the ocean is influenced by the topography of the ocean floor.
(3) The propagation of a tsunami in adjacent seas is influenced by the topography of the adjacent seafloors and the
geography of the adjacent bays, capes and islands. In the offing of Fukushima, the seafloor in some areas features
overhangs that extend away from the coast. Because of this unique geographical feature, some of the waves from the
tsunami were reflected and focused away from the shallow area, which consequently increased the height of the
tsunami (Sato, et al., 2012). On the other hand, in Matsushima Bay of Miyagi Prefecture, a number of small and large
islands reduced the tsunami effects. Therefore, to understand the phenomena of (2) and (3), knowledge of oceanics and
coastal engineering is very important. Compared with mechanical engineering, the prediction of such processes
contains an uncertain band as well.
(4) The arrival and run-up of a tsunami are influenced by the characteristics of the land and sites, types of land use, and
spatial arrangements of buildings and other outdoor structures. Therefore, knowledge of civil and architectural
engineering is important. At TEPCO’s Fukushima Dai-Ni Nuclear Power Plant facilities, seawater heat exchanger
buildings were placed 4 m above sea level, while reactor buildings were placed 12 m above sea level. A tsunami wave
with an estimated height of 9 m struck the sites. Sites 4 m above sea level were completely inundated, and seawater
entered most buildings at the site. Important machines and electronic equipment were not damaged in one building
because its door remained intact. On the other hand, because there was a slope at the south side of the site, the tsunami
wave ran up the slope, reaching sites 12 m above sea level. Consequently, seawater entered some buildings at the site
(TEPCO, 2011).
(4) The arrival and run-up of a tsunami is often characterized simply by the tsunami height. In reality, the tsunami
should be characterized by the following five parameters: (a) Tsunami height, (b) Tsunami speed, (c) Inundation depth,
The Japan Society of Mechanical Engineers
Report of JSME Research Committee on the Great East Japan Earthquake Disaster
© 2014 The Japan Society of Mechanical Engineers ISBN 978-4-88898-244-3
27
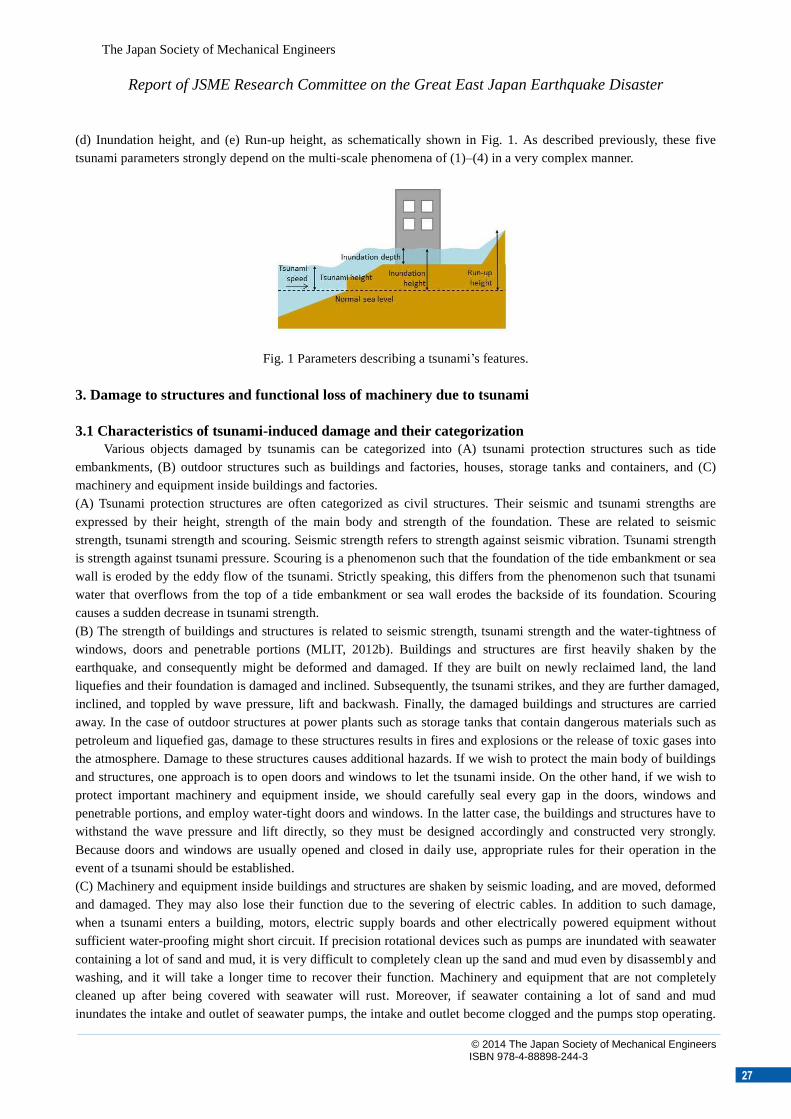
(d) Inundation height, and (e) Run-up height, as schematically shown in Fig. 1. As described previously, these five
tsunami parameters strongly depend on the multi-scale phenomena of (1)–(4) in a very complex manner.
Fig. 1 Parameters describing a tsunami’s features.
3. Damage to structures and functional loss of machinery due to tsunami
3.1 Characteristics of tsunami-induced damage and their categorization
Various objects damaged by tsunamis can be categorized into (A) tsunami protection structures such as tide
embankments, (B) outdoor structures such as buildings and factories, houses, storage tanks and containers, and (C)
machinery and equipment inside buildings and factories.
(A) Tsunami protection structures are often categorized as civil structures. Their seismic and tsunami strengths are
expressed by their height, strength of the main body and strength of the foundation. These are related to seismic
strength, tsunami strength and scouring. Seismic strength refers to strength against seismic vibration. Tsunami strength
is strength against tsunami pressure. Scouring is a phenomenon such that the foundation of the tide embankment or sea
wall is eroded by the eddy flow of the tsunami. Strictly speaking, this differs from the phenomenon such that tsunami
water that overflows from the top of a tide embankment or sea wall erodes the backside of its foundation. Scouring
causes a sudden decrease in tsunami strength.
(B) The strength of buildings and structures is related to seismic strength, tsunami strength and the water-tightness of
windows, doors and penetrable portions (MLIT, 2012b). Buildings and structures are first heavily shaken by the
earthquake, and consequently might be deformed and damaged. If they are built on newly reclaimed land, the land
liquefies and their foundation is damaged and inclined. Subsequently, the tsunami strikes, and they are further damaged,
inclined, and toppled by wave pressure, lift and backwash. Finally, the damaged buildings and structures are carried
away. In the case of outdoor structures at power plants such as storage tanks that contain dangerous materials such as
petroleum and liquefied gas, damage to these structures results in fires and explosions or the release of toxic gases into
the atmosphere. Damage to these structures causes additional hazards. If we wish to protect the main body of buildings
and structures, one approach is to open doors and windows to let the tsunami inside. On the other hand, if we wish to
protect important machinery and equipment inside, we should carefully seal every gap in the doors, windows and
penetrable portions, and employ water-tight doors and windows. In the latter case, the buildings and structures have to
withstand the wave pressure and lift directly, so they must be designed accordingly and constructed very strongly.
Because doors and windows are usually opened and closed in daily use, appropriate rules for their operation in the
event of a tsunami should be established.
(C) Machinery and equipment inside buildings and structures are shaken by seismic loading, and are moved, deformed
and damaged. They may also lose their function due to the severing of electric cables. In addition to such damage,
when a tsunami enters a building, motors, electric supply boards and other electrically powered equipment without
sufficient water-proofing might short circuit. If precision rotational devices such as pumps are inundated with seawater
containing a lot of sand and mud, it is very difficult to completely clean up the sand and mud even by disassembly and
washing, and it will take a longer time to recover their function. Machinery and equipment that are not completely
cleaned up after being covered with seawater will rust. Moreover, if seawater containing a lot of sand and mud
inundates the intake and outlet of seawater pumps, the intake and outlet become clogged and the pumps stop operating.

The Japan Society of Mechanical Engineers
Report of JSME Research Committee on the Great East Japan Earthquake Disaster
© 2014 The Japan Society of Mechanical Engineers ISBN 978-4-88898-244-3
28
The sand drift caused by a tsunami must also be assessed sufficiently. In summary, the driving forces behind
tsunami-induced damage can be categorized into the following five types:
Type 1: Water coverage
Type 2: Coverage by seawater containing sand, mud and salt
Type 3: Deformation, fracture, floating, falling down, carrying away by massive amounts of water flowing at high
speed (tens of meters per second)
Type 4: Impact, deformation and fracture by tsunami debris
Type 5: Scouring and sand drift
Once we understand the driving forces behind tsunami-induced damage, we know that preventing water-invasion
by improving the water-tightness of buildings is important to protect machinery and equipment inside the buildings. At
the same time, it is important to apply water-proofing to machinery and equipment inside the buildings or to set them in
a sufficiently higher place to prevent water damage. A tsunami is not a simple increase in the height of water, but a
massive amount of water (an incompressible fluid) traveling at a very high speed. That is why tsunamis have such
damaging force. It is very difficult not only to design structures that can withstand the massive force of a tsunami, but
also to take sufficient measures against it.
For example, spherically shaped storage tanks are good for containing highly pressurized fluid; however, they
lack sufficient strength against local and/or non-symmetric external loading. Because a large amount of lift is applied to
buildings and structures with high quality water-tightness, they are easily lifted unless they are well fixed to the ground.
Some outdoor structures are only held to the ground by self-weight loading or ordinary bolts. These structures are
easily lifted, toppled and carried away. Considering the complex effects of both seismic loading and a tsunami, the
earthquake first breaks the support structures and damages the foundation due to liquefaction and then the tsunami
strikes. Debris carried away by the tsunami impacts other structures and buildings. Therefore, it is not sufficient to
consider only tsunami pressure, lifting force and water-tightness. It is also necessary to take into account impacts from
tsunami debris, by considering the spatial arrangement of buildings and structures. Photo 1 shows a large ship that was
sent crashing into a coastal factory by the huge tsunami following the GEJE (Yahoo! JAPAN, 2011).
Photo 1 A large ship that was sent crashing into a coastal factory by the huge tsunami following the GEJE (Yahoo!
JAPAN, 2011).
3.2 Simulation: the method for quantitative analysis
As described previously, the mechanisms of tsunami-induced damage are very complex. The interaction between
seismic loading and the tsunami makes the phenomena more complex. Because they are earth-scientific phenomena, it
is very difficult to accurately predict both when they will occur and their potential magnitudes. Therefore, it is
insufficient to establish measures for prevention and mitigation using only information on tsunami height. For example,
if the Central Disaster Prevention Council declares that the estimated maximum height of a tsunami at a certain region
is 20 m, would tsunami-related problems be solved by constructing a huge, 20 m high sea wall? The issue we are facing
is not that simple. Constructing a 20 m high sea wall is costly, and the surrounding community is completely

The Japan Society of Mechanical Engineers
Report of JSME Research Committee on the Great East Japan Earthquake Disaster
© 2014 The Japan Society of Mechanical Engineers ISBN 978-4-88898-244-3
29
disconnected from the beautiful scenery of the coast. The lifestyle of people living near the sea is also significantly
disturbed. Based on the inherent situation of the area, there are alternate measures, i.e., constructing a lower sea wall in
order to prevent frequent but lower-height tsunamis, constructing a tsunami refuge building with sufficient height,
tsunami strength and water-tightness, preparing a sufficient and workable plan of evacuation to higher ground,
enhancing the seismic and tsunami strength of machinery and equipment, and preparing spare equipment at higher
places for emergencies. This combination of multiple measures is much more useful. To do so, we have to understand
well the seismic mechanisms and those of tsunami-induced damage. Based on this understanding, we could develop an
assessment methodology for prevention and mitigation of damage to civil and architectural structures, machinery and
equipment, and take multiple measures more appropriately. The actual simulations required are as follows.
(1) Simulation of tsunami generation and propagation (over long distances and near coastal areas)
(2) Simulation of tsunami run-up
(3) Simulation of seismic responses of structures, machinery and equipment, and that of damage assessment
(4) Simulation of water coverage, deformation and fracture due to the tsunami (pressure by massive water with a high
speed, and lift)
(5) Simulation of transportation and impact of debris such as ships and containers
(6) Simulation of scouring and sand drift by the tsunami
4. Analyses and tsunami-induced damage and mitigation methods based on a discipline of mechanics
4.1 Coupling of three-dimensional fluid analyses and ocean tsunami propagation analyses
4.1.1 Objective
Various studies on tsunami wave source evaluation and ocean tsunami propagation have been performed based on
non-linear long-wave theory (shallow-water theory) (Imamura, et al., 1988), inversion analysis (Satake, 1989) and so
on. However, after the GEJE, which severely damaged critical infrastructure facilities, it was pointed out that previous
tsunami analysis approaches were insufficient for evaluating the phenomenon, including the inundation of land.
Regarding the evaluation of tsunami force, several formulas (Imamura, 1988) based on experiments targeting
breakwaters have been developed. However, the methods for evaluating the tsunami force on terrestrial structures are
not well established.
Tsunami analyses based on the non-linear long-wave theory have already been used by the Japanese government
in the disaster prevention plan for estimating tsunami damage (MLIT, 2012a). In conjunction with that, it is highly
desired to establish a practical method for predicting the tsunami force against terrestrial structures. In a
two-dimensional model for ocean tsunami propagation analysis based on the non-linear long-wave theory, the variables
to be calculated at grid points are the velocity vector and sea level. However, water pressure is not calculated directly. If
we can use the coupling approach of ocean tsunami propagation analyses and three-dimensional fluid analyses
(hereinafter referred to as the coupling tsunami analysis), it is expected that we will be able to evaluate tsunami forces
and understand complicated tsunami phenomena in a terrestrial region.
In this section, we present a case study of the coupling tsunami analysis for the GEJE (Fujiwara, et al., 2012). Port
Soma located in Fukushima Prefecture was selected as the object for the analysis.
4.1.2 Ocean tsunami propagation analysis for the GEJE
The Tsunami_N2 code developed by Imamura (Imamura, et al., 1988) is used for tsunami analysis based on the
non-linear long-wave theory. This code is based on a finite difference method with a staggered leap-frog scheme.
The analysis region for ocean tsunami propagation analysis is a rectangular area about 1,000 km in east–west
length and 1,700 km in north–south width including the wave source region of the GEJE and Port Soma, as shown in
Fig. 2(a). The grid size was reduced in five steps from 1,215 m to 15 m from the ocean toward Port Soma. The terrain
model was created based on the public data of the Japan Coast Guard, GSI, Marine Information Research Center,
General Bathymetric Chart of Oceans and elevation data of Soma City. The distribution of the wave source model
shown in Fig. 2(a) was adjusted based on the previous model (Fujii, et al., 2011).

The Japan Society of Mechanical Engineers
Report of JSME Research Committee on the Great East Japan Earthquake Disaster
© 2014 The Japan Society of Mechanical Engineers ISBN 978-4-88898-244-3
30
Figure 2(b) shows the distribution map of the tsunami sea level at 30 min after the earthquake occurrence. Figure
2(c) shows a comparison of the simulation waveform and GPS wave gauge observation of the Nationwide Ocean Wave
information network and HAbourS (NOWPHAS). These waveforms are the raw unfiltered data. The simulation
reproduces the observed waveform very well.
Fig. 2(a) Analysis region of tsunami wave propagation in ocean and tsunami source model, (b) Tsunami sea level
distribution at 30 min after the earthquake occurrence, (c) Comparison between observed sea level (blue) and
simulation result (red).
A tsunami source model is produced and optimized using the inversion analysis from many observed values of the
tsunami. The waveform obtained by the ocean tsunami propagation analysis as a forward analysis is consistent with the
naturally observed one. However, these results indicate that, once the exact wave source model is set, the propagation
behavior itself of the ocean tsunami can be evaluated appropriately.
4.1.3 Tsunami simulation in Port Soma by three-dimensional fluid analysis
A commercial code, FINAS/CFD, using an unstructured grid of the finite volume method was applied for the
three-dimensional fluid analysis. The governing equation of the three-dimensional flow is an expression of momentum
conservation and mass conservation for incompressible fluid. The speed–pressure coupling method is the SIMPLEC
method (Ferziger and Peric, 2002). Further, in order to express the free surface of the tsunami, the analysis space was
modeled as a two-phase fluid flow of air and seawater based on the volume of fluid (VOF) method (Hirt and Nicholls,
1981).
In the three-dimensional tsunami analysis, due to the limitations of computational capacities, it is necessary to
restrict the volume of the analysis region and the analysis time to a few minutes. The region of interest for
three-dimensional fluid analysis of Port Soma has an area of 1200 m × 2220 m, indicated by the red box in Fig. 3. The
land area of the region is 25 m high and the water area is 15 m high. The flow velocity vector and sea level obtained
from the ocean tsunami propagation analysis were assigned to the interior of the analysis region as initial values. The
time histories of the flow velocity vector and sea level obtained from the ocean tsunami propagation analysis were used
for the outer sides of the analysis region as a boundary condition. For the analysis, we selected a 12 min period near the
arrival time of the second tsunami wave. This is the time during which the sea level rose significantly, as shown in Fig.
4.
(a) (b)
GPS wave gauge (central Iwate) offshore
Port
Soma
Sea level change [m]
Time [min]
(c)

The Japan Society of Mechanical Engineers
Report of JSME Research Committee on the Great East Japan Earthquake Disaster
© 2014 The Japan Society of Mechanical Engineers ISBN 978-4-88898-244-3
31
Fig. 3 Analysis region of three-dimensional flow simulation (Port Soma area).
-15
-10
-5
0
5
10
15
0 60 120 180
時間(分)
水位(m)
Fig. 4 Calculated time history of sea level change in Port Soma during tsunami. (The position is marked by “◎” in Fig.
3.)
A bird's-eye-view of the grid model for the three-dimensional fluid analysis is shown in Fig. 5. The grid model is
based on the terrain model generated in the ocean tsunami propagation analysis. It was modeled in more detail for land
structures and seafloor terrain. The cell size is 3 m in the horizontal direction, and 1 m in the vertical direction. The
number of cells is approximately 8 million. This calculation was performed using the FOCUS supercomputer system
(FOCUS, 2013). Forty-eight parallel computing cores (6 × 8 core node) were used, and the computation took 2 weeks.
Fig. 5 Grid model for three-dimensional fluid analysis of Port Soma.
The bird's-eye-views of the calculated water surface at the time points are shown in Fig. 6. These water surfaces
are obtained by plotting the iso-surfaces with an F value of 0.5 in the VOF method. Figure 7 corresponds to the time
when the second wave of the tsunami flowed over the levee. At this time, a significant area of the land had already been
flooded by the first wave, and the high second wave had arrived. Figure 6(b) is a bird’s-eye-view when the second
wave arrives at the front of the building on the pier. Point 1 is indicated in Fig. 5.
2220 m
1200 m
◎
N
Second wave
Wave First wave
Point 1
N
Sea level change [m]
Time [min]
Point 2

The Japan Society of Mechanical Engineers
Report of JSME Research Committee on the Great East Japan Earthquake Disaster
© 2014 The Japan Society of Mechanical Engineers ISBN 978-4-88898-244-3
32
(a) 63.2 min: Second tsunami wave overflowing the levee.
(b) 64.0 min: Second tsunami wave reaches point 1.
Fig. 6 Bird’s-eye-view of water surface.
Fig. 7 Calculated time histories of flooding depth and wave pressure at point 1.
The time history of the wave pressure on the ground surface and that of flooding depth at point 1 (front of the
building on pier tip) are shown in Fig. 7. The wave pressure and flooding depth have a similar shape. When the stage
wave collides with the structure wall at point 1 at 64.0 min, the water surface instantaneously upsurges in front of the
wall, the flood depth becomes 14 m and the depth decreases to 6 m a few seconds later. According to a field survey
report (PARI, 2011), the vulnerable slate wall of the building at point 1 was destroyed, and the observed flood depth at
the nearest point was 6.77 m. The analysis results are roughly consistent with these observations.
A tsunami analysis based on the non-linear long-wave theory was also performed in the port area, and compared
with the three-dimensional fluid analysis. The time history and distribution of the flooding depth and sea level were
nearly identical in both methods. This is a reasonable result because the terrain in the port is almost flat.
4.1.4 Conclusion and future work
13.9 m
Wave
pressure [kPa]
Inundation
depth [m]
時間(分)
109 kPa
Point 1 Maximum depth: 13.9 m
Front of second wave
Propagation direction of the tsunami
Front of second wave
Time [min]
Wave pressure
Inundation depth

The Japan Society of Mechanical Engineers
Report of JSME Research Committee on the Great East Japan Earthquake Disaster
© 2014 The Japan Society of Mechanical Engineers ISBN 978-4-88898-244-3
33
Due to the protection of critical infrastructure such as nuclear power plants against tsunamis, protective measures
such as waterproofing of the building and installation of a flood barrier will be conducted from now on. To design such
protective facilities, the wave force and flooding dynamics must be predicted more accurately. The coupling tsunami
analysis is expected to meet this requirement. As shown in the examples described above, the three-dimensional fluid
analysis can be considered to be a practical solution. However, further technological developments and the studies
described below are desirable in order to apply the coupling tsunami analysis to safety evaluation and design.
(a) Standardization and validation of methods and models
To apply the design analysis, it is necessary to standardize the analysis methods and models to allow for quality
control of the required levels. Numerical accuracy management and validation will then be required through
comparison with observations and experiments (so called V&V). It should be noted that such an empirical approach
covering both analyses and experiments has been conducted in the development of numerical wave waterways,
CADMAS-SURF/3D (CDIT, 2010) for port facilities.
(b) Improvement of three-dimensional fluid analysis technology In the three-dimensional fluid analysis required for the evaluation of critical infrastructure facilities, depending on
the grid size and analysis area, the number of grid points easily exceeds several tens of millions. In some tsunami
events, it may be required to analyze the event continuously for tens of minutes. These types of high-speed calculations
for huge models will be required for practical use, and more sophisticated parallel processing techniques are desired.
The use of very high-speed supercomputers such as the "K computer" will be considered as well.
(c) Analysis technology for shock wave pressure
In the fluid analysis dealing with incompressible fluid, the pressure caused by the momentum change when the
tsunami collides against the structure can be obtained. However, generation and propagation of the sound pressure
(shock wave) due to compressibility of the fluid cannot be evaluated. An explicit approach for fluid analysis
considering the compressibility is required to deal with such a phenomenon. The computational load for compressible
fluid analysis further increases, compared with incompressible fluid analysis. Advances in technology for very efficient
calculation are required for this purpose. Moreover, the shock wave will cause a very large wave pressure
instantaneously, but the impulse on structures will not be very large in general. Therefore, it is expected that the impact
on structures is not critical. Coupled structural and fluid analyses will be required in order to evaluate this effect
quantitatively.
4.2 Tsunami propagation from the open sea to the coast
4.2.1 Estimation of wave height and arrival time
The coastal areas of the Tohoku region suffered serious damage from the tsunami caused by the 2011 off the
Pacific Coast of Tohoku Earthquake that occurred on March 11, 2011 (MLIT, 2011). Numerical simulations are used to
develop disaster-prevention measures to deal with such tsunami disasters. They are also used to predict potential future
tsunami disasters, to design disaster-prevention facilities such as coastal breakwaters and levees, and to predict tsunami
attacks immediately after an earthquake occurs (Goto and Sato, 1993, Takahashi, 2004). The Central Disaster
Prevention Council (CDMC, 2013) prepares basic disaster prevention plans and participates in the determination of
important disaster-prevention matters. The Tonankai–Nankai Earthquake may cause considerable damage.
Consequently, the council has been performing numerical calculations to predict wave height and arrival time when a
tsunami reaches the coast.
4.2.2 Viscous shallow-water equations
As mentioned above, the tsunami generated by the GEJE caused serious damage to the coastal areas of the Tohoku
region. Numerical simulations are used to predict damage caused by tsunamis. Shallow-water equations are generally
used in numerical simulations of tsunami propagation from the open sea to the coast. This subsection focuses on
viscous shallow-water equations and attempts to generate a computational method using finite element techniques
based on the previous investigations of Kanayama and Ohtsuka (Kanayama and Ohtsuka, 1978).
In the numerical analysis of tsunamis, the viscosity term is often omitted (Ulutas, 2012). In this subsection,
however, a computational method that includes the viscosity term is adopted because it enables more rigorous analysis
The Japan Society of Mechanical Engineers
Report of JSME Research Committee on the Great East Japan Earthquake Disaster
© 2014 The Japan Society of Mechanical Engineers ISBN 978-4-88898-244-3
34
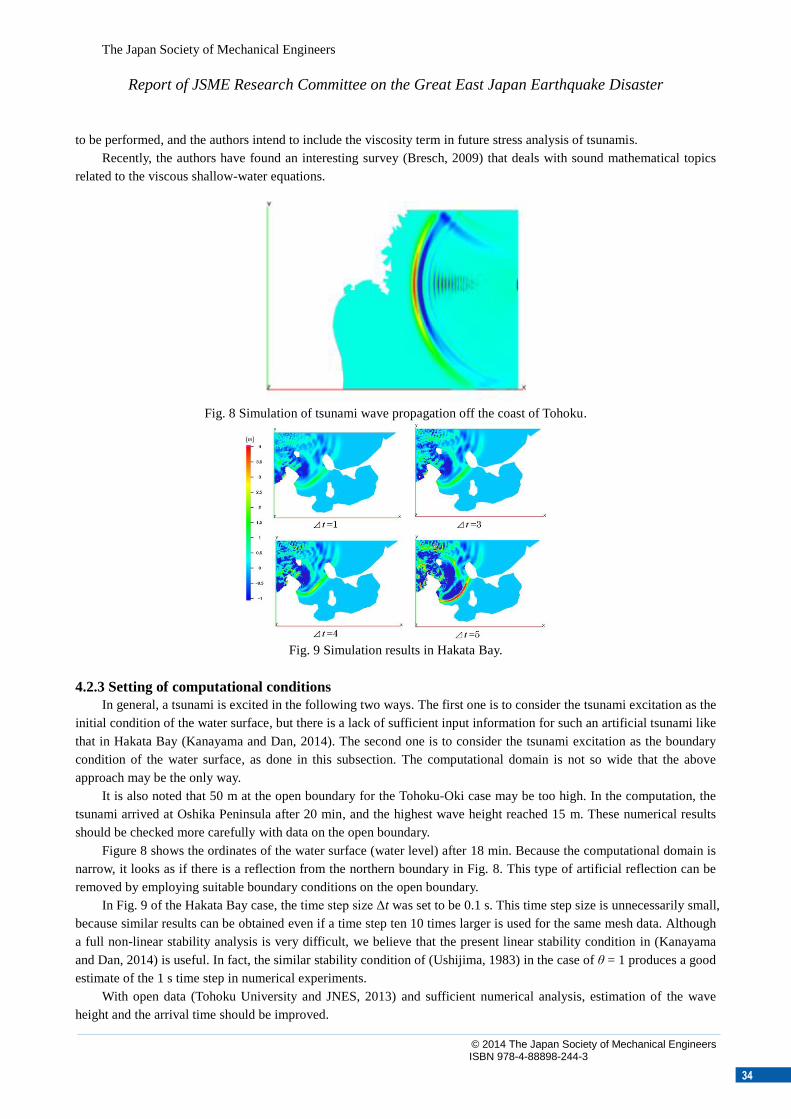
to be performed, and the authors intend to include the viscosity term in future stress analysis of tsunamis.
Recently, the authors have found an interesting survey (Bresch, 2009) that deals with sound mathematical topics
related to the viscous shallow-water equations.
Fig. 8 Simulation of tsunami wave propagation off the coast of Tohoku.
Fig. 9 Simulation results in Hakata Bay.
4.2.3 Setting of computational conditions
In general, a tsunami is excited in the following two ways. The first one is to consider the tsunami excitation as the
initial condition of the water surface, but there is a lack of sufficient input information for such an artificial tsunami like
that in Hakata Bay (Kanayama and Dan, 2014). The second one is to consider the tsunami excitation as the boundary
condition of the water surface, as done in this subsection. The computational domain is not so wide that the above
approach may be the only way.
It is also noted that 50 m at the open boundary for the Tohoku-Oki case may be too high. In the computation, the
tsunami arrived at Oshika Peninsula after 20 min, and the highest wave height reached 15 m. These numerical results
should be checked more carefully with data on the open boundary.
Figure 8 shows the ordinates of the water surface (water level) after 18 min. Because the computational domain is
narrow, it looks as if there is a reflection from the northern boundary in Fig. 8. This type of artificial reflection can be
removed by employing suitable boundary conditions on the open boundary.
In Fig. 9 of the Hakata Bay case, the time step size Δt was set to be 0.1 s. This time step size is unnecessarily small,
because similar results can be obtained even if a time step ten 10 times larger is used for the same mesh data. Although
a full non-linear stability analysis is very difficult, we believe that the present linear stability condition in (Kanayama
and Dan, 2014) is useful. In fact, the similar stability condition of (Ushijima, 1983) in the case of θ = 1 produces a good
estimate of the 1 s time step in numerical experiments.
With open data (Tohoku University and JNES, 2013) and sufficient numerical analysis, estimation of the wave
height and the arrival time should be improved.

The Japan Society of Mechanical Engineers
Report of JSME Research Committee on the Great East Japan Earthquake Disaster
© 2014 The Japan Society of Mechanical Engineers ISBN 978-4-88898-244-3
35
4.3 Issues related to prediction of long-distance propagation of tsunamis
When an earthquake occurs, the Japan Meteorological Agency issues a tsunami alert and warning before the
tsunami arrives at the coast. The alert system employs a database-based method, and its insufficient accuracy has often
been pointed out. The main reason of the inaccuracy is as follows. The database consists of a priori simulation of a
tsunami’s long-distance propagation for a variety of tsunami parameters. The parametric study cannot sufficiently cover
every possible parameter space.
It is easy to solve such a tsunami’s long-distance propagation problem based on shallow-water approximation by
employing the latest high-resolution simulation method for hyperbolic equations. No supercomputer is needed. A
tsunami simulation of a wide area shown in Fig. 10 can be simulated on 8,000 4,000 grid points with a 100 m width
using multiple GPUs in tens of seconds (Acuna and Aoki, 2010). By increasing the number of GPUs, a linear speed-up
can be attained as shown in Fig. 11. Figure 12 shows a snapshot of the real-time simulation of the tsunami propagation
on 512 512 grid points using one GPU equipped in an ordinary notebook PC (Acuna and Aoki, 2011). This
simulation includes the tsunami’s run-up onto land.
Fig. 10 Large region of tsunami propagation simulation off the coast of Sanriku.
Fig. 11 Speed-up of computation time of tsunami propagation simulation for the number of GPUs.
An attempt to start calculating tsunami propagation right after an earthquake occurs was expected to drastically
improve the accuracy of the alert for tsunami arrival at the coast. Although the anticipated area of the calculation of
tsunami propagation is similar in size to the area shown in Fig. 10, it was found that such a calculation of tsunami
propagation was not practically useful for a tsunami alert. The calculation of tsunami propagation is one of the initial
condition problems for solving hyperbolic-type shallow-water equations. Therefore, the calculation must be started by
inputting the displacement in shape of the seafloor during the earthquake. A current monitoring system of such
displacement information cannot obtain very accurate information in such a short period of tsunami propagation. It is
only possible to estimate an initial value from the observed arrival times of tsunamis at various coastal areas and the
tsunami heights. Thus, the calculation is not useful for a tsunami early warning system. At least, it is indispensable to
equip systems for monitoring the water level change in a wider oceanic area including seismic sources as soon as
Number of GPUs
10 s

The Japan Society of Mechanical Engineers
Report of JSME Research Committee on the Great East Japan Earthquake Disaster
© 2014 The Japan Society of Mechanical Engineers ISBN 978-4-88898-244-3
36
possible.
Not limited to tsunami propagation simulation, computational mechanics based on analyses of tsunami damage
tend to be only case studies. It is very difficult to obtain general knowledge on damage mechanisms useful for disaster
prevention and mitigation. Validation of such analyses is also difficult. In general, computational mechanics is a field of
study in which responses (results) to applied forces (inputs) are analyzed. In many cases, we assume that the applied
force is a controllable parameter in the simulation. However, in natural disasters, the assumption of applied force plays
a much bigger role than the simulation itself. A conventional approach to computational mechanics does not work very
well. To solve such problems effectively, it is necessary to develop an interdisciplinary approach to computational
mechanics by collaborating with other fields of study such as earthquake science, soil mechanics, oceanology, earth
science, civil engineering, information technology and social engineering.
Fig. 12 GPU-based real-time simulation of tsunami propagation with run-up.
4.4 Estimation of hydrodynamic force
To estimate the impact force and impulse of a tsunami hitting walls or buildings, it is important to predict the
non-linear motion and surface deformation of liquid, which are sometimes affected by the surrounding gaseous phase.
In other words, it is necessary to observe the violent motion including the wave-breaking of the tsunami and to describe
it as the flow field of free-surface flow. We can look back over the last two decades at the outstanding development of
CFD techniques for the analysis of free-surface flow. Focusing on numerical methods with a fixed grid system, not
only the convective schemes avoiding numerical diffusion of the VOF function (Hirt and Nicholls, 1981), but also the
surface capturing methods without artificial smoothing of fluid properties around the gas–liquid interface have been
proposed. With such a numerical method employing these techniques as piecewise linear interface calculation
(PLIC)-VOF or constrained interpolation profile (CIP) (Yabe and Takei, 1988), the gas–liquid interface were captured
sharply; that is, the jump of properties across the interface were captured within a cell.
For example, the results of an experiment and numerical simulation for a dam-breaking problem with a block
(Koshizuka, et al., 1995) are shown in Fig. 13 (Himeno, et al., 2010). In the experiment, after the contact line of the
liquid surface running on the bottom collided with the block, the water rose up over the block and reached the right
wall. In the corresponding computation, both the liquid and gaseous phases were described by the Navier–Stokes
equation for a homogeneous two-phase flow and numerically solved by the CIP based Level Set & MARS (CIP-LSM)
code (Himeno, et al., 2010), in which the CIP scheme (Yabe and Takei, 1988) and the MARS method (Kunugi, 2001)
are employed to solve the convective terms, and the level-set technique (Sussman, et al., 1994) is also utilized to obtain
the shape of the interface. Compared with the experimental results, the shapes of the leaping water wave (a), the water
bridge and the vapor room (b) were found to be reproduced clearly.

The Japan Society of Mechanical Engineers
Report of JSME Research Committee on the Great East Japan Earthquake Disaster
© 2014 The Japan Society of Mechanical Engineers ISBN 978-4-88898-244-3
37
(a) 0.20 s (b) 0.50 s
Experimental results (Koshizuka, et al., 1995).
(a) 0.20 s (b) 0.50 s
Simulation results (Himeno, et al., 2010).
Fig. 13 Liquid motion of dam breaking problem with a block.
For another example of liquid collision, the experiment and the numerical simulation of the jet-sled decelerated by
a water brake are shown in Fig. 14 (Nakata, et al., 2013). In the experiment, the sled on straight guide rails was
accelerated by a model jet-engine up to a velocity of 20 m/s. Then, rushing into an open channel containing shallow
water, the sled was decelerated to a stop. A rectangular plate was equipped at the front of the sled to receive the
hydrodynamic force of water. In a series of experiments, several types of braking plate were tested. When focused on
the splashing shape (a) and the braking force (b), the computations were found to give results in good agreement with
the corresponding experiments.
Thus, the numerical analysis has the potential to provide helpful assessments of natural phenomena, which are
difficult to measure and repeat experimentally in a cost-effective manner. Further improvements of the numerical
method are expected to clarify various aspects of free-surface flows for the establishment of disaster-prevention or
disaster-reduction technologies.
Type S3 Type S1 Type S6
(a) Shape of open channel with breaking plate.
The Japan Society of Mechanical Engineers
Report of JSME Research Committee on the Great East Japan Earthquake Disaster
© 2014 The Japan Society of Mechanical Engineers ISBN 978-4-88898-244-3
38
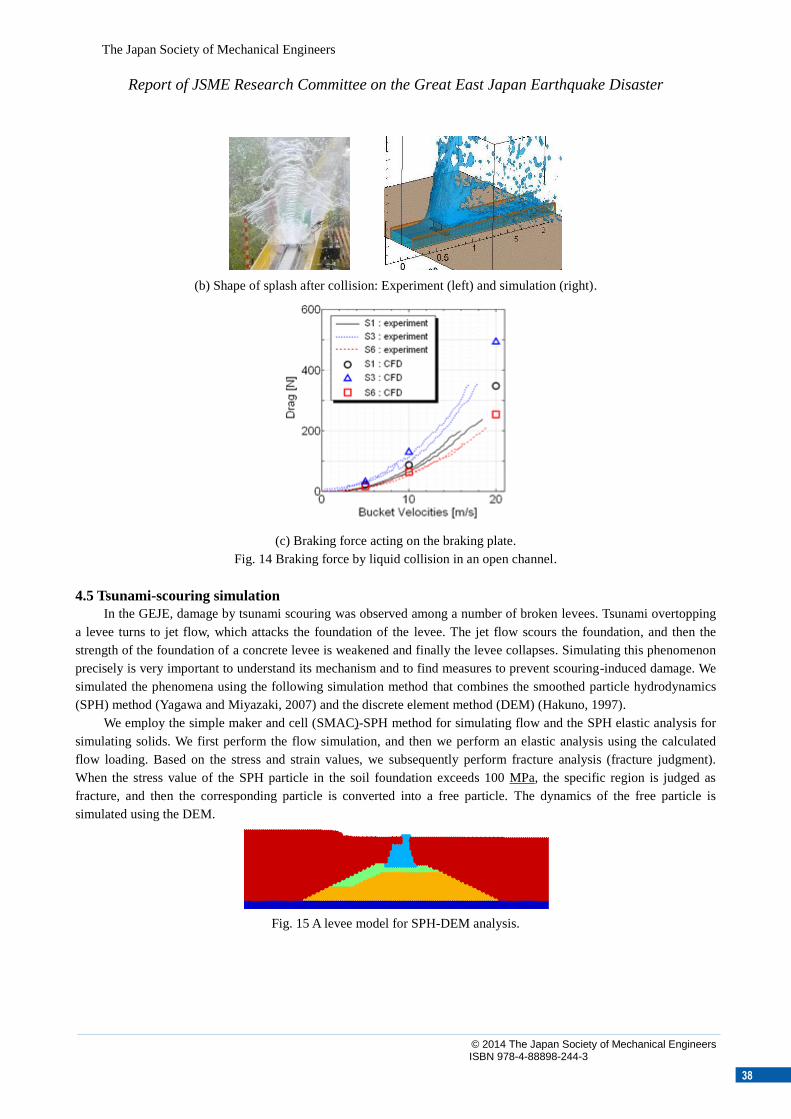
(b) Shape of splash after collision: Experiment (left) and simulation (right).
(c) Braking force acting on the braking plate.
Fig. 14 Braking force by liquid collision in an open channel.
4.5 Tsunami-scouring simulation
In the GEJE, damage by tsunami scouring was observed among a number of broken levees. Tsunami overtopping
a levee turns to jet flow, which attacks the foundation of the levee. The jet flow scours the foundation, and then the
strength of the foundation of a concrete levee is weakened and finally the levee collapses. Simulating this phenomenon
precisely is very important to understand its mechanism and to find measures to prevent scouring-induced damage. We
simulated the phenomena using the following simulation method that combines the smoothed particle hydrodynamics
(SPH) method (Yagawa and Miyazaki, 2007) and the discrete element method (DEM) (Hakuno, 1997).
We employ the simple maker and cell (SMAC)-SPH method for simulating flow and the SPH elastic analysis for
simulating solids. We first perform the flow simulation, and then we perform an elastic analysis using the calculated
flow loading. Based on the stress and strain values, we subsequently perform fracture analysis (fracture judgment).
When the stress value of the SPH particle in the soil foundation exceeds 100 MPa, the specific region is judged as
fracture, and then the corresponding particle is converted into a free particle. The dynamics of the free particle is
simulated using the DEM.
Fig. 15 A levee model for SPH-DEM analysis.
The Japan Society of Mechanical Engineers
Report of JSME Research Committee on the Great East Japan Earthquake Disaster
© 2014 The Japan Society of Mechanical Engineers ISBN 978-4-88898-244-3
39
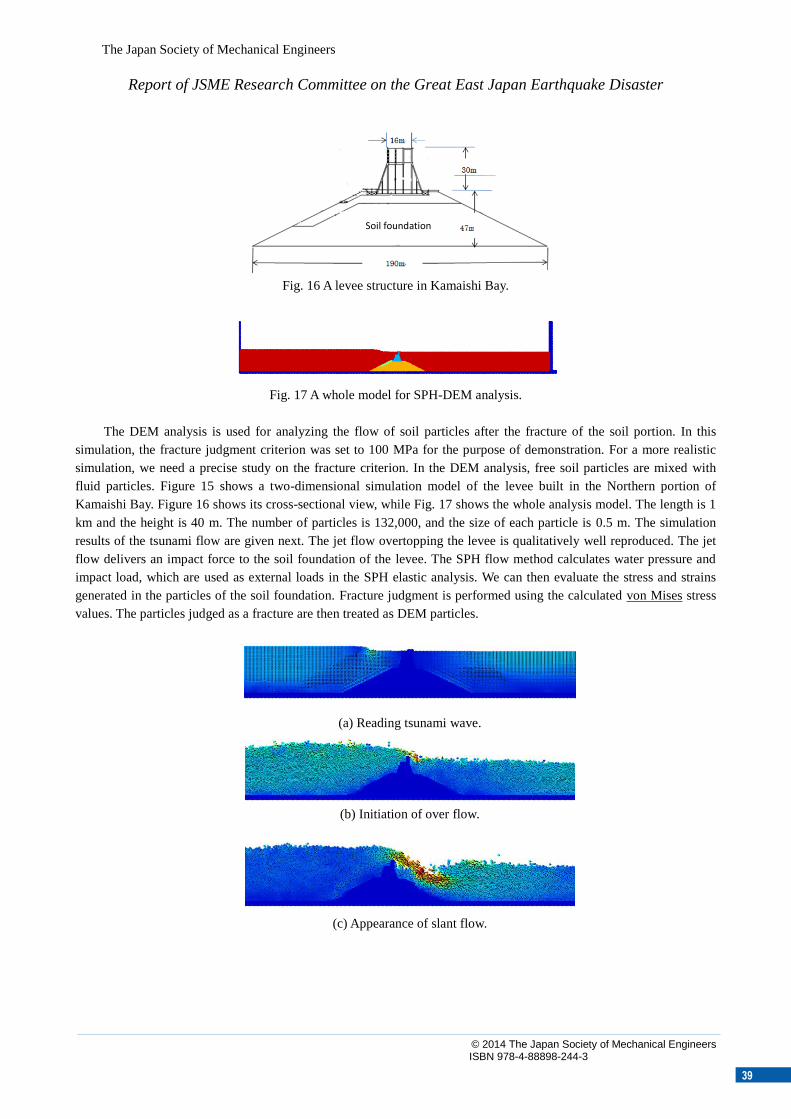
Fig. 16 A levee structure in Kamaishi Bay.
Fig. 17 A whole model for SPH-DEM analysis.
The DEM analysis is used for analyzing the flow of soil particles after the fracture of the soil portion. In this
simulation, the fracture judgment criterion was set to 100 MPa for the purpose of demonstration. For a more realistic
simulation, we need a precise study on the fracture criterion. In the DEM analysis, free soil particles are mixed with
fluid particles. Figure 15 shows a two-dimensional simulation model of the levee built in the Northern portion of
Kamaishi Bay. Figure 16 shows its cross-sectional view, while Fig. 17 shows the whole analysis model. The length is 1
km and the height is 40 m. The number of particles is 132,000, and the size of each particle is 0.5 m. The simulation
results of the tsunami flow are given next. The jet flow overtopping the levee is qualitatively well reproduced. The jet
flow delivers an impact force to the soil foundation of the levee. The SPH flow method calculates water pressure and
impact load, which are used as external loads in the SPH elastic analysis. We can then evaluate the stress and strains
generated in the particles of the soil foundation. Fracture judgment is performed using the calculated von Mises stress
values. The particles judged as a fracture are then treated as DEM particles.
(a) Reading tsunami wave.
(b) Initiation of over flow.
(c) Appearance of slant flow.
Soil foundation

The Japan Society of Mechanical Engineers
Report of JSME Research Committee on the Great East Japan Earthquake Disaster
© 2014 The Japan Society of Mechanical Engineers ISBN 978-4-88898-244-3
40
(d) Generation of flow attacking levee foundation.
Fig. 18 Flow analysis of a tsunami wave over a levee.
The forces impacting the foundation are included in the equation of motion. The pressure is then calculated
implicitly by the SMAC-SPH method. The impact load caused due to jet flow is included in the Newton equation of
motion assuming that a massive amount of fluid with a certain velocity attacks the foundation. Figure 19 shows the
stress values that occurred in the soil foundation by fluid force. Because of this stress generation, the foundation is
weakened and gradually fractures. Figure 20 shows the simulation results of coupling analysis between DEM particles
modeling the foundation and SPH particles modeling fluid. Figure 21 shows the scouring effects on the soil foundation
by the jet flow. Figure 22 shows an enlarged view of the scoured portion of the foundation.
(a) 30 s after overflow.
(b) 60 s after overflow.
(c) 3 min after overflow.
Fig. 19 Stress distributions at levee foundation.
Fig. 20 A combination of the flow analysis and ground analysis.

The Japan Society of Mechanical Engineers
Report of JSME Research Committee on the Great East Japan Earthquake Disaster
© 2014 The Japan Society of Mechanical Engineers ISBN 978-4-88898-244-3
41
Fig. 21 Behaviors of flow and levee foundation.
Fig. 22 Ground collapse by jet flow over levee.
4.6 Debris transportation simulation by tsunami
4.6.1 Objective
Debris exacerbated the damage caused by the tsunami that occurred after the GEJE. The origins of such debris are
ships in ports, automobiles, destroyed buildings and houses, and so on. The evaluation of debris impacting buildings,
structures and water-tight doors was found to be important for nuclear power plants. Such situations demand coupling
analyses between debris and fluid during a tsunami’s run-up, and the impact analyses of debris colliding with buildings
and structures. If the deformation of debris is negligible, it is considered a rigid body in the analysis. The phenomena of
a tsunami carrying debris can then be solved as fluid–rigid body interaction problems. This section reviews a
state-of-the art particle method for such interaction problems.
The particle method is a simulation method such that the dynamics of continuum media are considered a
collection of particles. Because the method does not need a mesh or grid, it can easily simulate complex behaviors of
flow with a free surface. The state-of-the art review of particle methods in the field of civil engineering is given in
reference (JSCE, 2012).
The following technologies are necessary to analyze tsunami run-up onto land with debris and its impact on
buildings and structures.
(a) Large-scale and fast simulation based on particle method
(b) Fluid–rigid body interaction method
(c) Impact analysis and its validation
Issues with each technology are summarized in the following.
(a) Large-scale and fast simulation based on particle method
To simulate tsunami propagation realistically with an actual bathometry chart of the seafloor, an area of several
kilometers wide must be calculated in tens of minutes. Moreover, current particle methods require a uniform spatial
resolution. Assuming a tsunami height of several meters, we need to employ a spatial resolution that sufficiently
resolves such a tsunami height. For example, if we employ a 1 m size particle for a 10 m high tsunami in a 1 km2 area,
the total number of particles reaches 10 million. Thus, we need to develop a large-scale and fast simulation for the
particle method.

The Japan Society of Mechanical Engineers
Report of JSME Research Committee on the Great East Japan Earthquake Disaster
© 2014 The Japan Society of Mechanical Engineers ISBN 978-4-88898-244-3
42
Flow with a free surface can be regarded as incompressible if the flow velocity is sufficiently smaller than the
sound velocity. Then a semi-implicit scheme is generally employed. A moving particle semi-implicit (MPS) method is a
particle method that employs a semi-implicit method. Recently, a new method has been proposed. Here, the sound
velocity is virtually set to be much slower than the real one, and a flow is solved as compressible flow using an explicit
method (Shakibaeinia and Jin, 2010). Furthermore, if the Mach number, which is the ratio of flow velocity to the sound
velocity, is set as 0.2, a critical time increment t determined from a numerical stability condition is found to be
identical between the conventional semi-implicit method and the explicit method (Oochi, et al., 2010). The error of
mass density caused due to the assumption of virtually lower sound velocity is within approximately 1% for the Mach
0.2 case (Oochi, et al., 2011). In the explicit method, the pressure can be calculated from the particle number density n
as:
where n0 is the reference value of the particle number density. The explicit method does not need to solve a linear
equation system, being different from the conventional semi-implicit method. As described previously, an identical
time increment can be employed. Thus, the calculation becomes drastically fast. The explicit MPS (Moving Particle
Simulation) method is considered to be useful in tsunami run-up analyses.
Parallel algorithms for the explicit MPS method were then studied (Murotani, et al., 2012a). A two-layered
parallel algorithm for a heterogeneous supercomputer was developed as well (Murotani, et al., 2012b).
We next show a three-dimensional tsunami simulation with actual, large-scale bathometric data of the seafloor
using the explicit MPS method. Figure 23 shows a calculation model, which is a part of Ishinomaki City (4.0 km 3.5
km). Its lower edge is the inlet boundary. The tsunami that occurred after the GEJE and then propagated from its source
is calculated by solving a two-dimensional shallow-water equation, and the result is used in the explicit MPS analysis.
The particle size is set as 2 m. The total number of particles is approximately 21 million. To simulate 25 min (1,500
seconds) in real time, the calculation time was 27 hours using 48 nodes (768 cores) of the Fujitsu FX10 supercomputer
at the University of Tokyo. Figure 24 shows the simulation results. It reproduces well the situation such that the
tsunami flows over a sea wall and runs up onto the land. The tsunami concentrates into the river end, and the tsunami
inundated into a wider area along the river. However, the tsunami reached the edge of the calculation area, so that
further run-up onto the upper area could not be calculated. We need to enlarge the calculation area, and increase the
spatial resolution. The parallel calculation of the fluid–rigid body interaction to be described next is also needed.
Fig. 23 Analysis setup of three-dimensional particle-based model for tsunami run-up in Ishinomaki City.
River
h Port
3.5
km
4.0km
02
0
nncn
P ii

The Japan Society of Mechanical Engineers
Report of JSME Research Committee on the Great East Japan Earthquake Disaster
© 2014 The Japan Society of Mechanical Engineers ISBN 978-4-88898-244-3
43
(a) 1,000 s
(b) 1,100 s
(c) 1,200 s
Fig. 24 Simulation result of tsunami run-up into Ishinomaki City.
(b) Fluid–rigid body interaction analysis
In the MPS method, by applying the Gaussian divergence theorem, an area integral of pressure on the fluid–rigid
body interface can be transformed into a volumetric integral of the pressure gradient. Using this, we can perform a
fluid–rigid body interaction analysis using the following simpler algorithm. Consider a calculation at some time step.
We first perform fluid analysis without discriminating between fluid particles and rigid body particles. Next, for the
rigid body particles, the rigid body shape is recovered in order to conserve the parallel and rotational movement of the
rigid body (Koshizuka, et al., 1998). In this algorithm, we do not need to trace the fluid–rigid body interface explicitly.
A number of rigid bodies can be treated in an identical manner. The method is suitable to simulate tsunami run-up
carrying debris.
Next, we show some examples of the fluid–rigid body interaction analysis using the explicit MPS algorithm
(Oochi, 2012). Figure 25 shows a part of Kamaishi City. There are seven ships in the port. Tsunami flow is modeled as
a dam break for this demonstration. The ships are carried by the tsunami run-up onto the land. The calculation area is

The Japan Society of Mechanical Engineers
Report of JSME Research Committee on the Great East Japan Earthquake Disaster
© 2014 The Japan Society of Mechanical Engineers ISBN 978-4-88898-244-3
44
955 m long and 1,005 m wide. The real simulation period is 30 s, and the particle size is set as 1 m. The total number of
particles is approximately 13 million. Figure 26 shows the simulation results. The ships are clearly transported by the
tsunami. In the near future, we will calculate more debris in a much wider calculation region. We will also calculate the
fracture of buildings and transportation of the broken buildings as debris.
Fig. 25 Initial condition of fluid–rigid body interaction simulation.
(a) 10 s
(b) 20 s
The Japan Society of Mechanical Engineers
Report of JSME Research Committee on the Great East Japan Earthquake Disaster
© 2014 The Japan Society of Mechanical Engineers ISBN 978-4-88898-244-3
45
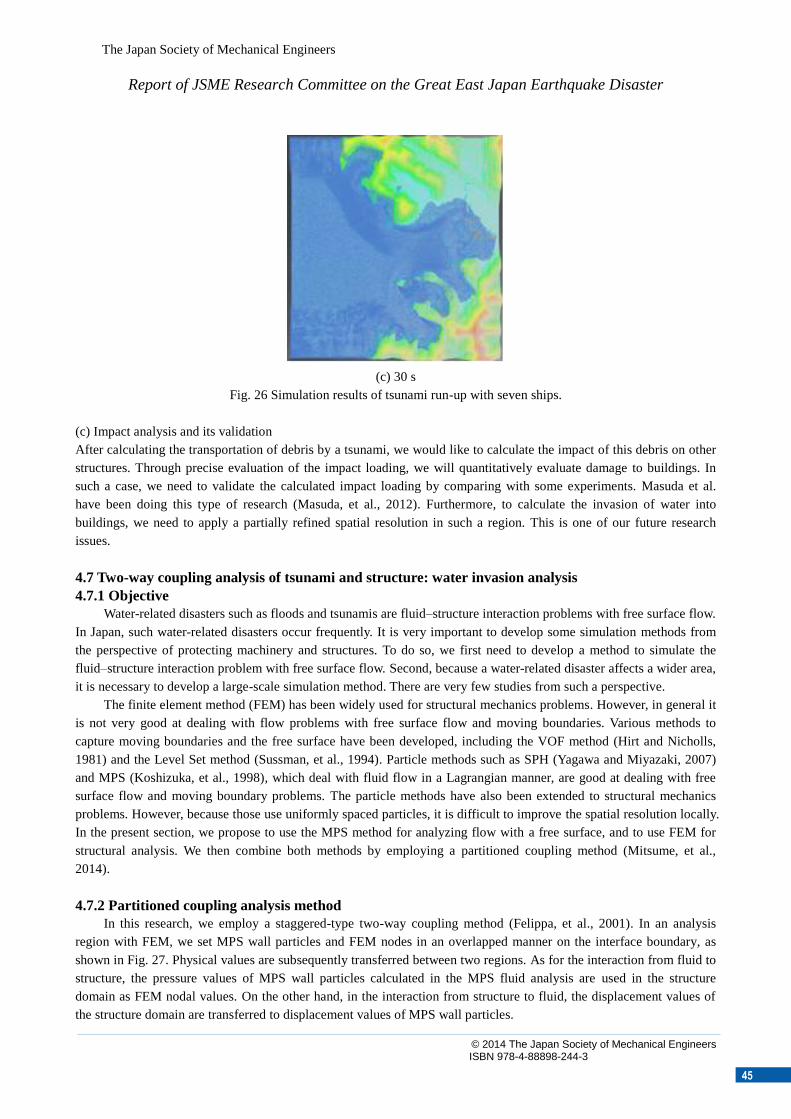
(c) 30 s
Fig. 26 Simulation results of tsunami run-up with seven ships.
(c) Impact analysis and its validation
After calculating the transportation of debris by a tsunami, we would like to calculate the impact of this debris on other
structures. Through precise evaluation of the impact loading, we will quantitatively evaluate damage to buildings. In
such a case, we need to validate the calculated impact loading by comparing with some experiments. Masuda et al.
have been doing this type of research (Masuda, et al., 2012). Furthermore, to calculate the invasion of water into
buildings, we need to apply a partially refined spatial resolution in such a region. This is one of our future research
issues.
4.7 Two-way coupling analysis of tsunami and structure: water invasion analysis
4.7.1 Objective
Water-related disasters such as floods and tsunamis are fluid–structure interaction problems with free surface flow.
In Japan, such water-related disasters occur frequently. It is very important to develop some simulation methods from
the perspective of protecting machinery and structures. To do so, we first need to develop a method to simulate the
fluid–structure interaction problem with free surface flow. Second, because a water-related disaster affects a wider area,
it is necessary to develop a large-scale simulation method. There are very few studies from such a perspective.
The finite element method (FEM) has been widely used for structural mechanics problems. However, in general it
is not very good at dealing with flow problems with free surface flow and moving boundaries. Various methods to
capture moving boundaries and the free surface have been developed, including the VOF method (Hirt and Nicholls,
1981) and the Level Set method (Sussman, et al., 1994). Particle methods such as SPH (Yagawa and Miyazaki, 2007)
and MPS (Koshizuka, et al., 1998), which deal with fluid flow in a Lagrangian manner, are good at dealing with free
surface flow and moving boundary problems. The particle methods have also been extended to structural mechanics
problems. However, because those use uniformly spaced particles, it is difficult to improve the spatial resolution locally.
In the present section, we propose to use the MPS method for analyzing flow with a free surface, and to use FEM for
structural analysis. We then combine both methods by employing a partitioned coupling method (Mitsume, et al.,
2014).
4.7.2 Partitioned coupling analysis method
In this research, we employ a staggered-type two-way coupling method (Felippa, et al., 2001). In an analysis
region with FEM, we set MPS wall particles and FEM nodes in an overlapped manner on the interface boundary, as
shown in Fig. 27. Physical values are subsequently transferred between two regions. As for the interaction from fluid to
structure, the pressure values of MPS wall particles calculated in the MPS fluid analysis are used in the structure
domain as FEM nodal values. On the other hand, in the interaction from structure to fluid, the displacement values of
the structure domain are transferred to displacement values of MPS wall particles.

The Japan Society of Mechanical Engineers
Report of JSME Research Committee on the Great East Japan Earthquake Disaster
© 2014 The Japan Society of Mechanical Engineers ISBN 978-4-88898-244-3
46
Fig. 27 Overlapping finite elements and MPS wall particles along the fluid–solid interface.
4.7.3 Verification of the method
To verify the MPS-FE method, one benchmark problem (Murotani, et al., 2012a) was solved. The problem was
also solved by a space–time FEM (Walhorn, et al., 2005) and a particle FEM (Ryzhakov, et al., 2010) by other
researchers. Figure 28 shows an analysis domain. Here, flow caused due to a dam break arrives and impacts an elastic
wall. The material properties of the elastic wall are mass density s = 2,500 kg/m2, Young’s modulus E = 1.0 10
6
kg/m2, Poisson’s ratio = 0, width of 0.012 m and height of 0.08 m. Material properties of the fluid are mass density f
= 1,000 kg/m3, dynamic viscosity = 1.0 10
–6 m
2/s, width of 0.146 m and height of 0.292 m. Gravitational
acceleration is g = 10.0 m/s2 and the time increment is t = 1.0 10
–4 s. The elastic wall is subdivided into 40 6
sections. Second-order tetrahedral elements are employed. Small strain and large deformation analysis is performed.
The fluid domain (column) is expressed with 146 73 MPS particles, and the particle space is 0.002 m. The explicit
MPS method (Oochi, et al., 2010) is used for fluid analysis.
Figure 29 shows the time history of displacement of the top edge of the elastic wall in the x direction. Figure 30
shows several snapshots of the simulation results. Figure 29 shows a comparison of the present simulation results with
other results (Walhorn, et al., 2005, Ryzhakov, et al., 2010). The time to collide and the peak value of the displacement
of the MPS-FE method coincide well with the results of the particle FEM.
Fig. 28 Analysis setting of dam break problem with elastic obstacle.

The Japan Society of Mechanical Engineers
Report of JSME Research Committee on the Great East Japan Earthquake Disaster
© 2014 The Japan Society of Mechanical Engineers ISBN 978-4-88898-244-3
47
Fig. 29 Calculated time histories of displacement of the top edge of the elastic wall
Fig. 30 Simulation results of fluid flow and deformation of elastic plate.
4.7.4 Water invasion analysis
Next, we performed a simulation of water-invasion right after the deformation of the elastic wall. Figure 31 shows
the simulation results (Mitsume, et al., 2014). As for buildings containing important machines, their structure is built to
be very strong, and furthermore water-tight doors might be equipped. In such cases, even though the structure itself is
not destroyed and damaged, the water-tight door might be deformed by impulsive water pressure, and consequently
water may enter the building causing damage to important machines. Therefore, this kind of simulation is very
important to quantitatively evaluate the practical performance of water-tight doors.

The Japan Society of Mechanical Engineers
Report of JSME Research Committee on the Great East Japan Earthquake Disaster
© 2014 The Japan Society of Mechanical Engineers ISBN 978-4-88898-244-3
48
Fig. 31 Fluid invading simulation.
4.7.5 Future research issues
In section 4.7, we explained the MPS-FE method to analyze fluid–structure interaction problems with free surface
flow. This method can solve basic water-invasion problems. To solve real problems, we need further development for
treating large-scale and complex shape problems. Moreover, verification and validation of the method are also
indispensable.
4.8 Behavior of steel-frame buildings upon collision with tsunami debris
4.8.1 Objective
The giant tsunami that occurred after the GEJE carried debris such as ships and cars upstream and caused
additional damage to buildings in the area. For example, some buildings were irreversibly damaged, even though they
were placed higher than the tsunami trace in Kesen-numa City, Miyagi Prefecture, as shown in Photo 2. It is thought
that this damage resulted from large tsunami debris such as ships that were originally moored in the harbor (PARI,
2011b). The wave height of the tsunami that reached Kesen-numa harbor was approximately 6 m. Supposing that the
wave velocity was 6–7 m/s, the force generated by the giant tsunami can be estimated as approximately 10 ton/m2,
which is sufficient to completely destroy buildings (NIRIM, 2011).
Photo 2 A ship washed up by the tsunami (Sankei Digital News, 2011).
Substantial effort has been made to estimate damage resulting from tsunami debris, even before the GEJE.
Following the Indian Ocean tsunami after the 2004 Sumatra-Andaman earthquake, the Cabinet Office issued a report
on the “Guidelines for Tsunami Refuge Building” (CAO, 2005) in 2005, and FEMA released the “Guidelines for

The Japan Society of Mechanical Engineers
Report of JSME Research Committee on the Great East Japan Earthquake Disaster
© 2014 The Japan Society of Mechanical Engineers ISBN 978-4-88898-244-3
49
Design of Structures for Vertical Evacuation from Tsunamis” (FEMA, 2008) in 2008.
In this section, some finite element analyses are carried out on a six-story, three-span steel-frame building being
struck by a debris model mimicking a ship to investigate the mechanical effects of the impact force experienced by a
building that remained standing after the seismic motion. This analysis is carried out using a collapse analysis code
developed using the ASI-Gauss technique (Lynn and Isobe, 2007). The simulated seismic wave and fluid force are
calculated from the height and maximum run-up height of the tsunami observed in Kesen-numa City (City of Sendai,
2012). Furthermore, the effects of the seismic motion, fluid force and impact force of the debris are compared between
buildings constructed at different heights above sea level.
4.8.2 Numerical model and conditions
A six-story, three-span steel-frame building designed with a base shear coefficient of 0.3 is used as a numerical
model. The span length and the floor height of the building are 6 m and 3.6 m, respectively. The floor load is set to 400
kgf/m2. The specifications of the building are shown in Table 1.
Table 1 Specifications of the steel structure
Fig. 32 Seismic wave observed in Kesen-numa City. (Data from 0–150 s is used as input.)
Damage to the building model under seismic motion is investigated by applying a Kesen-numa wave, as shown in
Fig. 32, until 150 s from the beginning of the seismic activity. A buoyant force is then applied statically and a fluid
Column
Shape and dimension [mm] Steel type
1, 2nd
floor □–400 400 19 SS400
3, 4th
floor □–400 400 12 SS400
5, 6th
floor □–300 300 9 SS400
Beam
Shape and dimension [mm] Steel type
1, 2nd
floor H-400 400 13 21 SS400
3, 4th
floor H-400 400 11 18 SS400
5, 6th
floor H-400 200 8 13 SS400
Time [s]
Acc
eler
atio
n [g
al]
EW
0 50 100 150 200 250 300-400
-200
0
200
400
Time [s]
Acc
eler
atio
n [g
al]
NS
0 50 100 150 200 250 300-400
-200
0
200
400
Time [s]
Acc
eler
atio
n [g
al]
UD
0 50 100 150 200 250 300-400
-200
0
200
400

The Japan Society of Mechanical Engineers
Report of JSME Research Committee on the Great East Japan Earthquake Disaster
© 2014 The Japan Society of Mechanical Engineers ISBN 978-4-88898-244-3
50
force dynamically to the building and debris models, as shown in Fig. 33. The fluid force is calculated by assuming the
maximum run-up height of the tsunami as R* = 21 m and the tsunami height as h = 15 m, based on the data observed in
Kesen-numa City (City of Sendai, 2012). Two building models are investigated, built at 9 m and 11 m above sea level.
Fig. 33 Fluid force and buoyant force subjected to the building and tsunami debris.
The buoyant force that acts on a structure when the structure is partially or fully under water is expressed as
follows.
gVF sb (1)
Here, ρs is the density of seawater, g is gravitational acceleration, and V is the seawater volume displaced by the
structure. The buoyant force acts opposite gravity, and may topple the building. In this analysis, buoyant forces
generated in the volumes of the frame members of the building are applied to the nodes under the water level in the
vertical direction. Similarly, the buoyant force equal to the weight of the ship is applied to the nodes under the water
level in the debris model.
The fluid force composed of the pressure difference and the drag acting on a structure when the wave velocity of
the tsunami is high, is given as follows.
max2)(
2
1huBCF dsd (2)
Here, Cd is the drag coefficient, B is the width of the structure, u is the velocity of the tsunami wave, and (hu2) is the
momentum flux. The following equation can be used to approximate the maximum momentum flux value (NIRIM,
2011).
2
2max
2 11.0235.0125.0R
z
R
zgRhu (3)
Here, R is the run-up height of the tsunami used for the design, equal to 1.3 R*, and z is the height above sea level.
Fluid forces are applied to the underwater area on the tsunami side of the building and to the underwater area of the
stern of the ship. The relationship between the height of the tsunami h, the level above sea level z and the inundation
height d is as follows.
dzh (4)
After applying the seismic wave, the buoyant force and the fluid force to the building, an initial velocity of 10 m/s is
applied to the debris model (weight: 40 ton, length: 27 m, width: 6 m, height: 8 m, material: aluminum alloy) so that it
collides with the building. The sequence mentioned above is seamlessly analyzed, and the behavior of the building is
investigated in each sequence. The colors in the figure indicate the yield function value given by the following
equation.

The Japan Society of Mechanical Engineers
Report of JSME Research Committee on the Great East Japan Earthquake Disaster
© 2014 The Japan Society of Mechanical Engineers ISBN 978-4-88898-244-3
51
2
0
2
0
2
0
N
N
M
M
M
Mf
y
y
x
xy
(5)
Here, Mx, My and N are the bending moments around the x-axis and the y-axis, and the axial force, respectively. The
terms with the subscript 0 result in a fully plastic section in an element if they act independently on the cross section.
The time increment of the dynamic analysis is set to 1 ms, and an implicit solution scheme using Newmark's β method
is adopted in the analyses (β = 4/9 and δ = 5/6 are used to consider numerical damping).
4.8.3 Numerical results
The deformation of the steel-frame building at the point of the maximum acceleration of the Kesen-numa wave is
shown in Fig. 34. While some slight deformations can be observed in the building, the seismic motion is not large
enough to critically damage the building. The building behavior under the buoyant force and the fluid force when it is
located 9 m above sea level (thus the inundation height d = 6 m from Eq. (4)) and 11 m above sea level (thus d = 4 m)
is shown in Fig. 35. The building located at 11 m above sea level is slightly deformed but does not collapse, while the
building located 9 m above sea level is critically damaged. Figure 36 shows the behavior of each building when an
initial velocity of 10 m/s is applied to the ship debris model in addition to the fluid force. Although there are some
differences, collapse beginning from lower levels can be observed in both cases. The influence of the fluid force
applied to the debris is confirmed to be larger than that of the impact force itself because the overall results do not
significantly change when a low initial velocity is applied to the debris.
Fig. 34 Behavior of the building at maximum acceleration at 49.8 s.
Fig. 35 Behavior of the building under fluid force and buoyant force
(a: 9 m above sea level, and b: 11 m above sea level).
fy
00.0
34.0
67.0 80.0
00.1 90.0

The Japan Society of Mechanical Engineers
Report of JSME Research Committee on the Great East Japan Earthquake Disaster
© 2014 The Japan Society of Mechanical Engineers ISBN 978-4-88898-244-3
52
Fig. 36 Collapse of the building due to tsunami debris collision.
4.8.4 Conclusion and future issues
This section presented some numerical results on the debris impact and collapse behavior of a steel-frame
building determined using the ASI-Gauss code. The effects of seismic motion, a buoyant force, a fluid force and an
impact force on buildings located at different levels above sea level are compared. The fluid force is confirmed to have
a large influence, and it may result in severe damage to the building at a lower height above sea level. Furthermore, the
impact force of the debris also has a significant influence, and it may damage a building, even if the building has
survived the tsunami itself. This indicates that the anti-collision and anti-tsunami considerations are of similar
importance in the structural design of a tsunami refuge building. It may be necessary to investigate the dynamic
behavior of buildings in tsunamis using more detailed data obtained from CFD simulations. We acknowledge the
contribution of Mr. Yuan Qi Dong, a graduate student at the University of Tsukuba.
4.9 Evaluation by design engineering techniques
In the previous subsections, we show how to simulate the behavior of tsunami propagation and the deformation
and fracture processes of machines and structures by using existing fluid mechanics and fluid–structure interaction
methods. In this subsection, we describe a method for analyzing the chained impact of fluid and mechanical structures
on a whole system.
Figure 37 shows a disaster scenario including debris caused by a tsunami, which has been proposed by Fujii and
Imamura (Fujii and Imamura, 2010). Because this scenario involves a surging tsunami, their scenario must be
combined with other analysis methods, such as failure mode and event analysis (FEMA) and fault tree analysis (FTA)
in order to deal with the loss of functions of equipment or the whole system. We show an example of applying the FTA
to the scenario of the loss of function of the system by a tsunami. At first, the loss of function of the whole system is set
as the top event, and is deployed to intermediate events connecting to the top event. Moreover, the intermediate events
(a) 9 m above sea level.
(b) 11 m above sea level.

The Japan Society of Mechanical Engineers
Report of JSME Research Committee on the Great East Japan Earthquake Disaster
© 2014 The Japan Society of Mechanical Engineers ISBN 978-4-88898-244-3
53
are deployed to lower-level events until they are broken down to basic events, the failures of which can be evaluated
directly. An example of the fault tree is shown in Fig. 38. All lower-level events are connected to upper-level events via
an "AND gate", which means that an upper-level event occurs when all lower-level events occur, or an "OR gate",
which means that an upper-level event occurs when at least one lower-level event occurs. In the case of the usual FTA,
the top event probability is calculated from the fault tree and an individual basic event probability corresponding to the
failure rate of each device. However, in the case of such events as tsunamis, they are very rare but cause significant
damage. Therefore, applications of the conventional methods may not be sufficient. In reverse, it is appropriate to
enumerate all conditions that cause the top event, to clarify the causal relationship between the loss in the whole system
and external force due to tsunamis (such as wave power, buoyancy, impact force by debris) and inundation applied to
the facilities and equipment, and to efficiently plan disaster prevention and mitigation based on those analyses.
However, in the case of huge complex systems, such as industrial plants, it is not practical to break down into
individual components and discuss their failure rate one by one. In order to realize the above-mentioned analyses in the
future, it is necessary to clarify the relationship between tsunamis and the loss of function of the equipment with a
batch of certain degrees.
Fig. 37 Disaster scenario according to drifting bodies.
Fig. 38 Example of fault tree.

The Japan Society of Mechanical Engineers
Report of JSME Research Committee on the Great East Japan Earthquake Disaster
© 2014 The Japan Society of Mechanical Engineers ISBN 978-4-88898-244-3
54
5. Proposal to proceed with efforts to understand the mechanisms of tsunami-induced damage based
on a discipline of mechanics
In this chapter, we investigated the complex mechanism of damage to structures and machinery caused by a
tsunami. We, as the Japan Society of Mechanical Engineers, attempted to understand the mechanisms of
tsunami-induced damage from a global perspective such that the effects on machines, civil structures and architecture
are considered, in addition to understanding tsunami propagation from seismic sources. For this purpose, we studied
various types of observed phenomena that occurred during the GEJE. Furthermore, we examine mechanisms of future
tsunami-induced damage and aim at obtaining useful knowledge for future disaster prevention and mitigation. The
methods employed for investigation and examination were to examine a huge amount of recorded visual information
on tsunami-induced damage during the GEJE. Moreover, each member performed his own field study and
simulation-based research. Based on this additional information, we performed a comprehensive examination.
Referring to the latest technologies, we perform simulations reproducing the mechanisms of tsunami-induced
damage, and we investigate issues for future development.
It was found that real problems include various phenomena that exceed the state-of-the art simulation theories and
models. Furthermore, it is very difficult to obtain input data for simulations and to verify and validate the methods. On
the other hand, even though there are many difficulties, it is also clearly recognized that the simulation-based approach
is very important and useful. Following such results, we summarize some proposals to make efforts to understand the
mechanisms of tsunami-induced damage based on a discipline of mechanics.
(1) Tsunami hazards contain a large range of uncertainty. It is difficult to protect machinery and structures from
tsunami-induced damage only using tsunami-protection structures such as sea walls and levees. It is very important to
perform studies from the perspective of how to protect the functions of machinery and structures from tsunamis and
how to design the protective measures and take appropriate actions. To do so, we need to precisely understand the
mechanism of tsunami-induced damage. We then need to consider appropriate measures to protect them from tsunamis.
The JSME should recognize these issues as one of their main targets, and as a whole, the JSME makes a big effort to do
so and to implement the obtained results in our society.
(2) Various phenomena are related to the mechanisms of tsunami-induced damage. The range of damage caused by a
tsunami is also very wide. In many cases, experimental approaches cannot be applied. Thus, computational mechanics
plays a very important role in realizing proposal (1). On the other hand, current computational mechanics simulations
can cover only a limited portion. There are a number of R&D issues in reproducibility, analysis scale, quantitative
accuracy, computation speed, and practical application to prevention and mitigation design. By collaborating with other
academic societies, the JSME as a whole should work hard.
(3) The results of proposals (1) and (2) are not only used to reproduce actual phenomena and to publish results in
academic journals, but also implemented as tsunami proof design codes and guides for structures and machinery, so
that our society can utilize the results in daily life.
(4) As described repeatedly, a tsunami does not occur solely. Structures, machinery and machines are first shaken by an
earthquake, and then the tsunami strikes. Therefore, studies on complex mechanisms of damage from earthquakes and
tsunamis should be accelerated.
6. References Acuna, M. R. A. and Aoki, T., Multi-GPU computing and scalability for real-time tsunami simulation, Information
Processing Society of Japan,2010 High Performance Computing and Computational Science Symposium
(HPCS2010), (2010), pp.125-132. (in Japanese)
Acuna, M. R. A and Aoki, T., Multi-GPU tsunami simulation on TSUBAME GPU Supercomputer, Proceedings of
SIAM Conference on Mathematical & Computational Issues in the Geosciences (SIAM GS11), Long Beach,
The Japan Society of Mechanical Engineers
Report of JSME Research Committee on the Great East Japan Earthquake Disaster
© 2014 The Japan Society of Mechanical Engineers ISBN 978-4-88898-244-3
55
California, March 23, (2011).
AESJ (Atomic Energy Society of Japan) Standards, Implementation Standard Concerning the Tsunami Probabilistic
Risk Assessment of Nuclear Power Plants (AESJ-SC-RK004E), (2011).
Asakua, R., Iwase, K., Iketani, T., Takao, M., Kanedo, T., Fujii, N. and Omori, M., Experimental study on force of
wave overflowed levee, Proceedings of Coastal Engineering, Vol.47, (2000), pp.911-915. (in Japanese)
Bresch, D., Shallow-water equations and related topics, In : Dafermos, C., Pokorny, M. (eds.) Handbook of Differential
Equations : Evolutionary Equations, Vol.5 (2009), pp.1-104
CAO (Cabinet Office, Government of Japan), The Committee on Guideline for Tsunami Refuge Buildings, Guidelines
for Tsunami Refuge Buildings, (2005). (in Japanese)
CDIT (Coastal Development Institute of Technology), CADMAS-SURF/3D, Research and development of numerical
wave flume, (2010). (in Japanese)
CDMC (The Central Disaster Management Council), Special Investigation Council concerning Tounankai and Nankai
Earthquakes, (2013). (in Japanese)
City of Sendai, The Year Following the 2011 Great East Japan Earthquake, Moving Forward As One –Sendai-, (2012).
(in Japanese)
Felippa, C. A., Park, K. C. and Farhat, C., Partitioned analysis of coupled mechanical systems, Computer Methods in
Applied Mechanics and Engineering, Vol.190 (2001), pp. 3247–3270.
FEMA (Federal Emergency Management Agency), Guidelines for Design of Structures for Vertical Evacuation from
Tsunamis, FEMA P646, (2008).
Ferziger, J. H. and Peric, M., Computational Method for Fluid Dynamics, 3rd Edition, (2002), Springer.
FOCUS (Foundation for Computational Science), http://www.j-focus.or.jp/ (2013).
Fujii, N. and Imamura F., Proposal of the practical evaluation method for tsunami disaster of oil storage tanks and
impact by the drifting bodies” Journal of Japan Society for Natural Disaster Science, Vol. 28, No. 4 (2010),
pp.371-386. (in Japanese).
Fujii, Y., Satake, K., Sakai, S., Shinohara, M. and Kanazawa, T., Tsunami source of the 2011 off the Pacific Coast of
Tohoku, Japan, Earthquake, Earth Planets Space, Vol.63 (2011), pp.815-820.
Fujiwara, R., Karakida, Y., Kunishi H., Akiyama, S., Tamiya, T., Korenaga , M., Sato, A., Tamukai, T., Shirai, Y., Jin,
C.-R. and Nakamura, H., Development of tsunami simulation by a coupling approach of three-dimensional fluid
analysis and non-linear long-wave theory analysis, Proceedings of the Conference on Computational Engineering
and Science ,Vol.17 (2012), B-3-1. (in Japanese)
Goto, C. and Sato, K., Development of tsunami numerical simulation system for Sanriku coast in Japan, Report of the
Port and Harbour Research Institute, Vol.32, No.2 (1993), pp.3-44. (in Japanese)
Hakuno, M., Simulation of Fracture, Morikita Publishing, (1997). (in Japanese)
Himeno, T., Negishi, H., Nonaka, S., Inoue, T., Watanabe, Y. and Uzawa, S., Numerical analyses of free surface flow in
various acceleration environments (Improvement of CIP-MARS-Level Set Combined Method), Transactions of
Japan Society of Mechanical Engineers, Ser.B, Vol.76, No.765 (2010), pp.778-788. (in Japanese)
Hirt, C. W. and Nicholls, B. D., Volume of Fluid (VOF) method for dynamics of free boundaries, Journal of
Computational Physics, Vol.39 (1981), pp.201-221.
Imamura, F., Shuto, N. and Goto, C., Numerical simulations of the transoceanic propagation of tsunamis, Proceedings
of 6th Congress of the Asia and Pacific Division of International Association for Hydro-Environment Engineering
and Research (APD-IAHR), (1988), pp.265-272.
JSCE (Japan Society of Civil Engineers), The Tsunami Evaluation Subcommittee, The Nuclear Civil Engineering
Committee, Tsunami Assessment Method for Nuclear Power Plants in Japan, (2002). (in Japanese)
JSCE (Japan Society of Civil Engineers), Numerical Wave Generation Water Tank – towards Deepening Breaking
Wave Calculation and Revolution of Wave-proof Design, (2012). (in Japanese)
JST CREST Projects on High Performance Computing for Multi-scale and Multi-physics Phenomena (online),
http://www.jst.go.jp/kisoken/crest/ryoikiarchive/multi/en/index.html (2009).
Kanayama, H. and Ohtsuka, K., Finite element analysis on the tidal current and COD distribution in Mikawa Bay.
Coastal Engineering in Japan, Vol.21 (1978), pp.157-171. (in Japanese)
Kanayama,H. and Dan, K., A tsunami simulation of Hakata Bay using the viscous shallow-water equations, Japan
Journal of Industrial and Applied Mathematics, (2014).
Koshizuka, S. and Oka, Y., Moving-particle semi-implicit method for fragmentation of incompressible fluid, Nuclear

The Japan Society of Mechanical Engineers
Report of JSME Research Committee on the Great East Japan Earthquake Disaster
© 2014 The Japan Society of Mechanical Engineers ISBN 978-4-88898-244-3
56
Science and Engineering, Vol. 123 (1996), pp. 421–434.
Koshizuka, S., Tamako, H. and Oka, Y., A particle method for incompressible viscous flow with fluid fragmentation,
Computational Fluid Dynamics Journal, Vol. 4 (1995), pp.29-46.
Koshizuka, S., Nobe, A. and Oka, Y., Numerical analysis of breaking waves using the moving particle semi-implicit
method, International Journal for Numerical Methods in Fluids, Vol.26 (1998), pp.751-769.
Kunugi, T., MARS for multiphase calculation, Computational Fluid Dynamics Journal, Vol.9, No.1 (2001), IX-563.
Lynn, K. M. and Isobe, D., Finite element code for impact collapse problems of framed structures, International Journal
for Numerical Methods in Engineering, Vol.69, No.12 (2007), pp.2538-2563.
Maeda, T., Furumura, T., Sakai, S. and Shinohara, M., Significant tsunami observed at ocean-bottom pressure gauges
during the 2011 off the Pacific Coast of Tohoku Earthquake, Earth Planets Space, Vol.63, No.7 (2011),
pp.803-808.
Masuda, M., Masuda, K., Ikoma, T. and Shoji, K., A study on the collision forces induced by the floating structures
washed onto the apron by tsunamis, Journal of the Japan Society of Naval Architects and Ocean Engineers, Vol.12
(2012), pp.101-106. (in Japanese) Mitsume, N., Yoshimura, S., Murotani, K. and Yamada, T., MPS-FEM coupling approach for fluid-structure interaction
problems involving free surface flows, International Journal of Computational Methods, (2014).
MLIT (Ministry of Land, Infrastructure, Transport and Tourism), NILIM (National Institute for Land and Infrastructure
Management, Japan) and BRI (Building Research Institute, Incorporated Administrative Agency, Japan), Quick
report of the field survey and research on the 2011 off the Pacific Coast of Tohoku Earthquake, Technical Note,
No.636, Building Research Data. No.132 (2011). (in Japanese)
MLIT (Ministry of Land, Infrastructure, Transport and Tourism), Water and Disaster Management Bureau & National
Institute for Land and Infrastructure Management, Procedure for Setting Tsunami Inundation Assumption,
(2012a). (in Japanese)
MLIT (Ministry of Land, Infrastructure, Transport and Tourism), NILIM (National Institute for Land and Infrastructure
Management) & BPSA (Building Performance Standardization Association), Explanation on Requirements onto
Structures of Tsunami Refuge Building, (2012b). (in Japanese)
Murotani, K., Oochi, M., Fujisawa, T., Koshizuka, S. and Yoshimura, S., Distributed memory parallel algorithm for
explicit MPS using ParMETIS, Transactions of Japan Society of Computational Engineering and Science,
No.20120012, (2012a). (in Japanese) Murotani, K., Koshizuka, S., Fujisawa, T., Mitsume, N. and Yoshimura, S., Hierarchical domain decomposition explicit
MPS method for a large-scale tsunami analysis, Proceedings of JSME-CMD International Computational
Mechanics Symposium (JSME-CMD ICMS2012), Kobe, October 9-11, (2012b).
Nakata, D., Tanatsugu, N., Higashino, K., Higuchi, K., Tsuchiya, T. and Himeno, T., Rocket sled track facility as a test
platform and a launch assist of space planes, No. O11, Proceedings of Ground-based Space Facilities Symposium,
Paris, 12-14 June, (2013).
NIRIM (National Institute for Land and Infrastructure Management), Report on Field Surveys and Subsequent
Investigations of Building Damage Following the 2011 Off the Pacific Coast of Tohoku Earthquake, Technical
Note No. 636, Building Research Data No. 132, (2011). (in Japanese)
Oochi, M., Study on Explicit MPS Method for Large Scale CFD Analysis with Free Surface, Master Thesis of the
University of Tokyo, (2012). (in Japanese)
Oochi, M., Koshizuka, S. and Sakai, M., Explicit MPS algorithms for free surface flow analysis, Transactions of Japan
Society of Computational Engineering and Science, No.20100013, (2010). (in Japanese)
Oochi, M., Yamada, Y., Koshizuka, S. and Sakai, M., Validation of pressure calculation in explicit MPS method,
Transactions of Japan Society of Computational Engineering and Science, No.20110002, (2011). (in Japanese)
PARI (The Port and Airport Research Institute), Port Soma and Port Onahama Survey Report (Preliminary),
http://www.nilim.go.jp/lab/bbg/saigai/h23tohoku/yokosuka/6.pdf. , (2011a). (in Japanese)
PARI (the Port and Airport Research Institute), Technical Note, An Investigation Report on the Seismic and Tsunami
Damages of Port, Coast and Airport due to 2011 Great East-Japan Earthquake, (2011b). (in Japanese)
Ryzhakov, P. B., Rossi, R., Idelsohn, S. R. and Onate, E., A monolithic Lagrangian approach for fluid-structure
interaction problems, Computational Mechanics, Vol. 46 (2010), pp.883-899.
Sankei Digital News, http://sankei.jp.msn.com/ , (2011). (in Japanese)
Satake, K., Inversion of sunami waveforms for the estimation of heterogeneous fault motion of large submarine
earthquakes, Journal of Geophysical Research, Vol.94, No.5 (1989), pp.5627-5636.
Sato, S., Yeh, H., Isobe, M., Mizuhashi, K., Aizawa, H. and Ashino, H., Coastal and nearshore behaviors of the 2011
Tohoku Tsunami along the Central Fukushima Coast, Journal of Japan Society of Civil Engineers, Ser.B2 (Coastal
The Japan Society of Mechanical Engineers
Report of JSME Research Committee on the Great East Japan Earthquake Disaster
© 2014 The Japan Society of Mechanical Engineers ISBN 978-4-88898-244-3
57
Engineering), Vol.68, No.2 (2012), pp.I_346-I_350. (in Japanese) Shakibaeinia, A. and Jin, Y.-C., A weakly compressible MPS method for modeling of open-boundary free-surface flow,
International Journal for Numerical Method in Fluids, Vol.63 (2010), pp.1208–1232.
Sussman, M., Smereka, P. and Osher, S., A Level Set approach for computing solutions to incompressible two-phase
flow, Journal of Computational Physics, Vol.114 (1994), pp. 146-159.
Takahashi, T., Application of numerical simulation to tsunami disaster prevention, Journal of Japan Society of
Computational Fluid Dynamics, Vol.12, No.2 (2004), pp.23-32. (in Japanese)
TEPCO (Tokyo Electric Power Company), Report on Investigation Results of Tsunami Occurred in 2011 Off the
Pacific Coast of Tohoku Earthquake Attacking Fukushima Daiichi NPPs and Daini NPPs (2nd
Report), July 8,
(2011). (in Japanese)
Tohoku University and JNES (Japan Nuclear Energy Safety Organization), Japan Tsunami Trace Database,
http://tsunami3.civil.tohoku.ac.jp/tsunami/mainframe.php/, (2013).
Ulutas, E., The 2011 off the Pacific Coast of Tohoku-Oki Earthquake and tsunami : Influence of the source
characteristics on the maximum tsunami heights, Proceedings of the International Symposium on Engineering
Lessons Learned from the 2011 Great East Japan Earthquake, pp.602-611, (2012).
Ushijima, T., A semi-group theoretical analysis of a finite element method for a linearized viscous shallow-water
system, Publications of Research Institute for Mathematical Sciences, Kyoto University, Vol.19 (1983),
pp.1305-1328.
Walhorn, E., Koelke, A., Huebner, B. and Dinkler, D., Fluid-structure coupling within a monolithic model involving
free surface flows, Computers and Structures, Vol. 83 (2005), pp. 2100–2111.
Yabe, T. and Takei, E., A new higher-order Godnov method for general hyperbolic equations, Journal of Physics
Society of Japan, Vol.57 (1988), pp.2598-2601.
Yagawa, G. and Miyazaki, N., Computational Mechanics Handbook, Asakura Publishing, (2007), p.90. (in Japanese)
Yahoo! JAPAN East Japan Earthquake Picture Record Project, (2011).