Understanding the gamma-ray sky - UCLA · Understanding the gamma-ray sky: ... 1 TeV with the Fermi...
43
1 Toby Burnett University of Washington Launch of Fermi (née GLAST) June 11, 2008 Understanding the gamma-ray sky: 3 years of Fermi data Moorea 9/11/2011 T. Burnett
Transcript of Understanding the gamma-ray sky - UCLA · Understanding the gamma-ray sky: ... 1 TeV with the Fermi...

1
Toby Burnett University of Washington
Launch of Fermi (née GLAST) June 11, 2008
Understanding the gamma-ray sky: 3 years of Fermi data
Moorea 9/11/2011 T. Burnett

2
GN
HEASARC
-
-
DELTA
7920H •
White Sands
TDRSS SN
S & Ku
LAT Instrument
Science
Operations Center
(SLAC)
GBM Instrument
Operations Center
GRB
Coordinates Network
• Telemetry 1 kbps •
- •
S
Alerts
Data, Command Loads
Schedules
Schedules
Mission Operations
Center (MOC)
Fermi Science
Support Center
• m sec •
•
•
Fermi Spacecraft
Large Area Telescope
& GBM GPS
Fermi MISSION ELEMENTS
Moorea 9/11/2011 T. Burnett

Observation modes
Pointing (traditional telescope) • Continuous stare, if not obscured • Otherwise:
– Follow Earth limb (CGRO strategy) – Slew to a secondary point – Survey mode
• Recent targets – Nadir, to detect TGF events – Crab, during flare – GC: MW campaign
Survey mode – our standard – Look away from Earth, but rock toward
poles to equalize north/south
– Full sky coverage every 3 hours.
3
Maximum deviation 30%
Note that south pole is less
due to South Atlantic Anomaly N
S
Moorea 9/11/2011 T. Burnett
2FGL survey mode exposure

Fermi-LAT collaboration
United States • California State University at Sonoma • University of California at Santa Cruz - Santa Cruz Institute of Particle Physics • Goddard Space Flight Center – Laboratory for High Energy Astrophysics • Naval Research Laboratory • Ohio State University • Stanford University (SLAC and HEPL/Physics) • University of Washington
France • IN2P3, CEA/Saclay
Italy • INFN, ASI
Japanese GLAST Collaboration • Hiroshima University • ISAS/JAXA, RIKEN • Tokyo Inst of Technology
Spain • ICREA and Inst de Ciencies de l’Espi
Swedish GLAST Collaboration • Kalmar University • Royal Institute of Technology (KTH) • Stockholm University
4
PI: Peter Michelson (Stanford & SLAC)
~270 Members (including ~90 Affiliated
Scientists, plus 37 Postdocs, and 48
Graduate Students)
Cooperation between NASA and DOE, with
key international contributions from
France, Italy, Japan and Sweden.
Managed at Stanford Linear Accelerator
Center (SLAC).
Moorea 9/11/2011 T. Burnett

2-years of LAT data
5 Moorea 9/11/2011 T. Burnett

Zoom in on Galactic center
T. Burnett 6 Moorea 9/11/2011

A pause from gamma rays: Fermi can measure
electrons and positrons too! (but cannot distinguish them)
7 T. Burnett Moorea 9/11/2011
(these data are also not public)

ATIC: “A Whisper, Perhaps, From the Universe’s Dark Side”*
8
*NY Times headline Nov 25, 2008
ATIC 1+2, Alpha Magnetic Spectrometer,
HEAT magnetic spectrometer, BETS,
PPB-BETS, Emulsion chambers
T. Burnett Moorea 9/11/2011

Fermi can measure electrons, too!
9 T. Burnett
Our paper “Measurement of the Cosmic Ray e++e- Spectrum from 20 GeV to 1 TeV with the Fermi Large Area Telescope” (05/2009 has 266 citations.
Moorea 9/11/2011

New result: positron asymmetry!
T. Burnett 10 Moorea 9/11/2011
arXiv:1109.0521 Use Earth’s magnetic field

Asymmetry confirms PAMELA
T. Burnett 11 Moorea 9/11/2011

Detecting gamma-rays: Pair conversion detector design & requirements
12
• Anticoincidence shield: – required by very high flux of cosmic rays
relative to gammas (~104) – Must be very efficient – Segmented to reduce self-veto
• Conversion foil (W): – High Z – thick for efficiency – But: thin for good PSF, due to multiple
scattering
• Tracking (Si strips in Fermi) – Good efficiency, coverage – Small pitch
• Calorimeter (CsI in Fermi) – Thick to contain shower – But: Thin to reduce mass for launch – Segmented for shower pattern recognition
Also:
• Trigger system
• Data acquisition
• Onboard analysis
charged particle anticoincidence shield
pair conversion foils
particle tracking detectors
calorimeter e+ e-
Photon cross sections in Pb
Spacecraft:
• Power
• communication
• Orientation, control, info
• Downlink T. Burnett Moorea 9/11/2011

13
e+ e–
Overview of the LAT
• Precision Si-strip Tracker (TKR) 18 XY tracking planes. Single-sided silicon strip detectors (228 mm pitch) Measure the photon direction; gamma ID.
• Hodoscopic CsI Calorimeter(CAL) 1536 CsI(Tl) crystals in 8 layers. Measure the photon energy; image the shower.
• Segmented Anticoincidence Detector (ACD) 89 plastic scintillator tiles. Reject background of charged cosmic rays; segmentation removes self-veto effects at high energy.
• Electronics System Includes flexible, robust hardware trigger and software filters.
Systems work together to identify and measure the flux of cosmic
gamma rays with energy 20 MeV - >300 GeV.
Calorimeter
Tracker
ACD
[surrounds 4x4
array of TKR
towers]
1.7 m
T. Burnett Moorea 9/11/2011

Real events can be messy!
Analysis goals: • measure incoming direction and energy • Identify particle
T. Burnett Moorea 9/11/2011 14

Real events can be messy!
Actually, two detectors: ‘Front’ and ‘Back’
T. Burnett Moorea 9/11/2011 15

Our angular resolution, or PSF
16
3 Orders of magnitude
Dashed line is a measurement using the data. Current public representation is wrong by x2 at high energies. This misunderstanding played a role in at least two external “discoveries”
Moorea 9/11/2011
x30
T. Burnett

The Gamma-ray data set is (partly) public Many independent analyses
T. Burnett 17 Moorea 9/11/2011

Did Hooper and
Goodenough discover
DM in our data?
18
"When I look at this data, it lines up perfectly," he says. "It quacks like a duck."
Moorea 9/11/2011 T. Burnett

19
And did Ando and Kusenko discover “primordial magnetic fields” by detecting halos around AGN’s that we missed?
Moorea 9/11/2011 T. Burnett

Our Nearest Non-blazar AGN
Moorea 9/11/2011 20 T. Burnett

Our Nearest Non-blazar AGN
Moorea 9/11/2011 21 T. Burnett
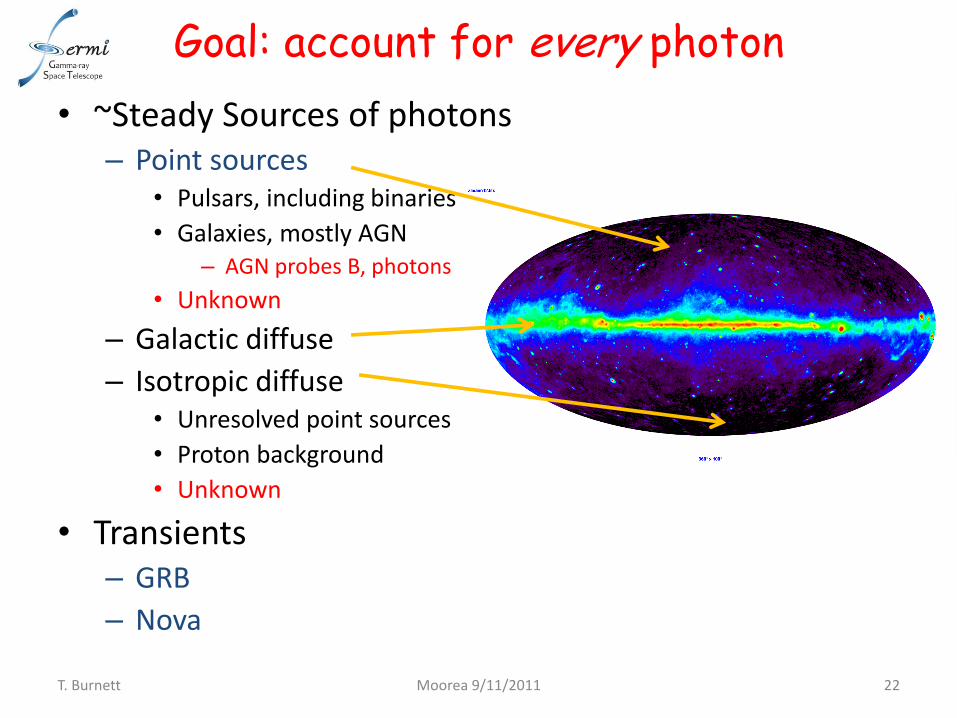
Goal: account for every photon
• ~Steady Sources of photons – Point sources
• Pulsars, including binaries
• Galaxies, mostly AGN – AGN probes B, photons
• Unknown
– Galactic diffuse
– Isotropic diffuse • Unresolved point sources
• Proton background
• Unknown
• Transients – GRB
– Nova
22 Moorea 9/11/2011 T. Burnett

Making the 2FGL catalog
Moorea 9/11/2011 23 T. Burnett

Understanding the sky: extract a list of sources for the 2FGL catalog
Data: 28 M
Exposure: 52 Ms
Two years (excluding 3 GRBs) “Pass7 processing” [1FGL: 11 months]
2FGL Table 1873 entries [1FGL: 1451]
24
Light curves, SED plots, associations
+ Moorea 9/11/2011 T. Burnett

Bright sources at high latitudes are easy
Moorea 9/11/2011 25 T. Burnett

Strong source high latitude example: SED plots
Circles are 3, 100 MeV PSF (‘front’ section) (varies by a factor of 30 with energy!)
Use log parabola if better fit
Pulsars fit with exponential cutoff
26
Power law
Moorea 9/11/2011 T. Burnett

Measuring point source properties: maximize likelihood
Model of the sky must account for all photons PSF Aeff Galactic, isotropic diffuse including CR 1/8 degree grid, pixels centered on plane Earth limb
An important issue: how to measure significance? Test Statistic: TS=-2log(Lfit/Lnull)
We conservatively choose only sources with TS>25.
27
TS=14 TS=32 TS=1000
null
max
TS/2
flux
Log(L
)
Moorea 9/11/2011 T. Burnett

CenA Lobes
MSH 15-52
Vela X
IC 443
LMC
SMC W28 W30 HESS J1825-137
W44 W51C
Cygnus Loop
Extended source templates
Moorea 9/11/2011 28 T. Burnett

Details about the sky model
Tessellate sky using HEALPix: 1728 regions
Each ~5 square pixel defines:
Center of circular regions for:
data (5 deg)
sources (10 deg)
sources inside are varied; those outside fixed to results of previous iteration
Note ~x3 overlap of data: not independent
Diffuse component normalizations free
Iteration procedure:
Each region fit (full likelihood maximized) independently
Each fit remeasures point source positions: Apply updates between cycles.
Check changes in log(L): iterate until none changes by more than 10 (8-10 iterations required)
29
Colors: HEALPix index
Moorea 9/11/2011 T. Burnett

Localization
Basic principle: the likelihood function, as a function of the position of a source, is an estimator of the position, with the curvature defining the resolution.
30
Demo with 3C 273.
PSF: 3 @ 100 MeV (front)
PSF: 0.1 for E>10 GeV (front)
Error ellipse defined by 95% contour (2.45). Plot shows contours, and results of fit to quadratic surface
‘TS plot’
Moorea 9/11/2011 T. Burnett

galactic 67.3%
isotropic 23.7%
limb 0.5%
sources 8.5%
2FGL skymodel
Stage I Summary
31
Example consistency check: all photons in 5 radius circle (Approx. 12 d.o.f.)
Contributions for all energies, full sky
Ch
i squ
ared
Consistency mostly good
Limb distribution
Free parameters
Type Number
Spectra 7603
Diffuse normalization 3456
Location ( 2 per TS>16 source)
5096
Moorea 9/11/2011 T. Burnett

It is not all so rosy… Most sources apparently associated with diffuse structures probably result from inadequate representation of the diffuse itself
32
Galactic center is complicated! Orion molecular cloud:
Sources: TS>10 seeds for 2FGL
Moorea 9/11/2011 T. Burnett

Sources: did we miss any?
33
TS residual map, threshold=10, ~3 (catalog: 25)
Moorea 9/11/2011 T. Burnett

Variability analysis
T. Burnett Moorea 9/11/2011 34
Blazar PKS 1510-089 variability index is based on 24
~monthly flux measurements.
likelihood ratio of observed values
to the null, constant hypothesis
A total of 458 sources were found
to be variable with high confidence.
2FGL J2124.0−1513 Unassociated
Sun within 2.5°

2FGL Associations
35 Moorea 9/11/2011 35 T. Burnett
Red symbols: Identified sources Blue symbols: Associated sources

Classifications
36 Moorea 9/11/2011 36 T. Burnett

Properties of the unassociated
T. Burnett 37 Moorea 9/11/2011

Additional details
• Why are so many 1FGL sources (352 out of 1499) not included in 2FGL??
T. Burnett 38 Moorea 9/11/2011
Green circles
Detailed analysis, ~10 pages, 8 figures focusing on different procedures narrows down to 89 ‘non-confirmed’

Some potential sources that we don’t find are important!
• Milky Way satellite analysis
T. Burnett 39 Moorea 9/11/2011

WIMP annihilation from Dwarf spherioidals
T. Burnett 40 Moorea 9/11/2011
Particle physics:
Astrophysics:
Uncertainties matter!

The result
T. Burnett 41 Moorea 9/11/2011
Hint of an exclusion

No time to cover
• Pulsars – up to 100 now, many MSPs, breakthroughs in blind detection
• AGNS
• GRBs
• The nova
• Diffuse analysis: do unresolved sources account for it?
T. Burnett 42 Moorea 9/11/2011

Summary • Many discoveries
• But: After three years, we are still trying to understand both the performance of the detector, and subtleties in the sky!
• Dark matter still the holy grail
43 Moorea 9/11/2011 T. Burnett