Understanding merchant adoption of m-payments in South Africa
104
University of Cape Town Understanding merchant adoption of m-payments in South Africa Department of Computer Science, University of Cape Town Thesis presented in partial fulfilment for the degree of M.Sc. Information Technology Anesh Kalan 2-15-2016
Transcript of Understanding merchant adoption of m-payments in South Africa

Univers
ity of
Cap
e Tow
n
Understanding merchant adoption of m-payments in South Africa Department of Computer Science, University of Cape Town
Thesis presented in partial fulfilment for the degree of M.Sc. Information Technology
Anesh Kalan 2-15-2016
The copyright of this thesis vests in the author. No quotation from it or information derived from it is to be published without full acknowledgement of the source. The thesis is to be used for private study or non-commercial research purposes only.
Published by the University of Cape Town (UCT) in terms of the non-exclusive license granted to UCT by the author.
Univers
ity of
Cap
e Tow
n
1
Abstract
Despite the proliferation of mobile communication technology and smartphone adoption, a
number of barriers, most notably trust and security, and the lack of critical mass, have slowed
the uptake of mobile payments (m-payments). Little is understood about the factors driving
the success of novel, intermediating technologies such as m-payments, particularly in
emerging markets. In this thesis, we empirically investigated the factors that affect the
success of m-payments in Cape Town, from the merchant’s perspective. The research model
is based on the Perceived Characteristics of Innovation (PCI) instrument developed by Moore
and Benbasat (1991) which measures an individual’s perception of adopting m-payments.
Our results found the main adoption drivers to be relative advantage, ease of use, results
demonstrability, convenience, speed of transaction, and service provider brand value. The
key barriers to adoption include cost as well as trust and security. Based on our findings,
implications for practice and future studies are suggested.
2
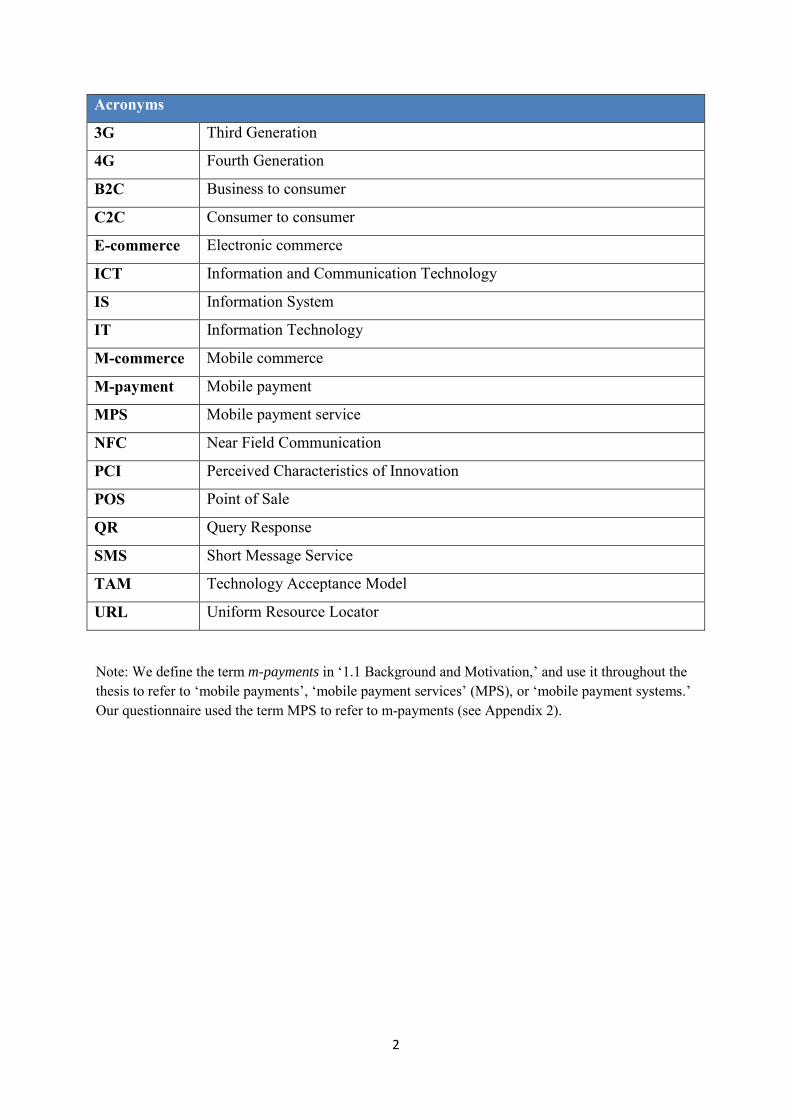
Acronyms
3G Third Generation
4G Fourth Generation
B2C Business to consumer
C2C Consumer to consumer
E-commerce Electronic commerce
ICT Information and Communication Technology
IS Information System
IT Information Technology
M-commerce Mobile commerce
M-payment Mobile payment
MPS Mobile payment service
NFC Near Field Communication
PCI Perceived Characteristics of Innovation
POS Point of Sale
QR Query Response
SMS Short Message Service
TAM Technology Acceptance Model
URL Uniform Resource Locator
Note: We define the term m-payments in ‘1.1 Background and Motivation,’ and use it throughout the thesis to refer to ‘mobile payments’, ‘mobile payment services’ (MPS), or ‘mobile payment systems.’ Our questionnaire used the term MPS to refer to m-payments (see Appendix 2).
3
Table of Contents
1. Introduction ....................................................................................................................................... 5
1.1 Background and Motivation .......................................................................................................... 5
1.2 Research Goal ............................................................................................................................... 8
1.3 Research Question ......................................................................................................................... 8
1.4 Approach ....................................................................................................................................... 8
1.5 Outline of Thesis ........................................................................................................................... 9
2. Literature Review ........................................................................................................................... 10
2.1 Technology Acceptance .............................................................................................................. 10
2.2 M-payment Adoption .................................................................................................................. 12
2.3 Factors Affecting Adoption ........................................................................................................ 14
2.3.1 Drivers for the Adoption of M-payments ............................................................................ 15
2.3.2 Barriers to the Adoption of M-payments ............................................................................. 20
3. Research Methodology ................................................................................................................... 26
3.1 Construct Measurement .............................................................................................................. 26
3.2 Data Collection Procedure .......................................................................................................... 28
3.3 Sample ......................................................................................................................................... 29
3.4 Qualitative Content Analysis ...................................................................................................... 30
3.5 Missing Data ............................................................................................................................... 32
4. Results .............................................................................................................................................. 33
4.1 Demographic Analysis ................................................................................................................ 33
4.2 Intention to Use ........................................................................................................................... 36
4.3 Construct Analysis ...................................................................................................................... 40
4.3.1 Relative Advantage .............................................................................................................. 42
4.3.2 Image ................................................................................................................................... 45
4.3.3 Compatibility ....................................................................................................................... 49
4.3.4 Ease of Use .......................................................................................................................... 53
4.3.5 Visibility .............................................................................................................................. 57
4.3.6 Trust and Security ................................................................................................................ 60
4.3.7 Result Demonstrability ........................................................................................................ 64
4.4 Qualitative Content Analysis ...................................................................................................... 68
4.4.1 Merchant’s Reason for Choosing their Particular Service Provider .................................... 69
4.4.2 Open Comments from Merchants Regarding the Use of M-payments in their Business .... 73
4.5 Reliability and Validity Analysis ................................................................................................ 76
4.6 Discussion ................................................................................................................................... 77
5. Conclusion ....................................................................................................................................... 81
4
5.1 Implications ................................................................................................................................. 81
5.2 Limitations .................................................................................................................................. 82
5.3 Future Research........................................................................................................................... 83
6. Acknowledgements ......................................................................................................................... 85
7. Appendix .......................................................................................................................................... 86
8. References ........................................................................................................................................ 94
5
1. Introduction
1.1. Background and motivation
The proliferation of mobile-friendly technology services demonstrates how strong the
connection between technology and commerce has become. By 2016, it is estimated that the
m-commerce market will reach US$800 billion worldwide (Ericsson, 2014). This is
attributable to two main factors: the rapid increase in smartphone adoption; and consumers
migrating to mobile broadband technology as 3G and 4G network availability and
affordability increase (GSMA, 2015a). Analysts predict that, by 2015, 5.4 billion
smartphones will be in circulation worldwide (Paymenteye, 2014). Moreover, the use of the
smartphone as a multi-functional, transactional device has created a universal marketplace for
consumers to transact anywhere, anytime (Van der Heijden, 2002). The 2015 Mobile
Economy report estimates that, by 2020, the mobile industry will contribute US$3.9 trillion to
the world’s economy, comprising 4.2% of the projected global gross domestic product
(GSMA, 2015b).
One phenomenon driving the new age of connected commerce is m-payments. M-payments
are commonly defined as an alternative method of payment for goods, services and bills,
using a mobile device such as a smartphone or tablet to facilitate the initiation, authorization
and realisation of the payment process through wireless and other communication technology
(Au and Kauffman, 2008; Mohammadi and Jahanshahi, 2008; Dahlberg et al., 2007;
Pousttchi, 2003). This definition incorporates the two essential elements of m-payments: the
use of a mobile device to facilitate the payment transaction, and the transfer of monetary
value between two or more actors during the transaction (Au and Kauffman, 2008;
Mohammadi and Jahanshahi, 2008; Dahlberg et al., 2007; Pousttchi, 2003).
Mohammadi and Jahanshahi (2008) identify three different scenarios1 - differentiated with
regard to the Point of Sale (POS) - where m-payment transactions take place. They are: m-
commerce, which include applications and services on a mobile device; e-commerce, which
include B2C and C2C transactions via the Internet; and stationary merchant transactions,
which include brick and mortar transactions between a consumer and a merchant 1 Our research excludes money transfers between individuals, known as mobile money transfers (Mohammadi and Jahanshahi, 2008).

6
(Mohammadi and Jahanshahi, 2008). The widespread appeal of m-payments is derived from
its ability to deliver value in many domains (Lai and Chuah, 2010). Consequently, m-
payments are applicable across a variety of retail contexts, including m-commerce, vending,
electronic ticketing, and purchases for items in-store or at restaurants (Lai and Chuah, 2010;
Mohammadi and Jahanshahi, 2008).
M-payments have become a valuable application in the exchange relationship between buyers
and sellers. While existing adoption research often implicitly assumes a single adopting
group - the consumer - intermediating technologies such as m-payments are applicable to
multiple stakeholders, each of whom has a different adoption strategy (Plouffe et al., 2001b).
Plouffe et al. (2001b: 66) define intermediating technologies as “technologies that use
electronic data storage, transfer and communications to add value to the exchange
relationship between at least two groups,” most commonly the consumer and merchant. This
is known as multigroup adoption since the success of the technology is reliant on the
acceptance by more than just the consumer. This distinction is important because
intermediating technologies fundamentally change the dynamic of the exchange process by
engaging new stakeholders and developing new channels of distribution. Each stakeholder in
the exchange therefore has a unique relationship with the adoption of m-payments since they
have different requirements and applications in mind for the technology, including the fact
that different stakeholders value different aspects of the technology (Van der Heijden, 2002;
Plouffe et al., 2001b).
Pousttchi (2003) argues that the commercial success (widespread adoption) of an
intermediating technology requires a comprehensive understanding of consumer behaviour.
For consumers, the perceived value of m-payments is based on the utility they gain from
using the technology (Plouffe et al., 2001b). Bertrand and Ahmad (2014), for example, note
that consumers derive utility from m-payments because of the specific advantages it provides
over debit or credit cards. For merchants, however, the perceived value of m-payments is
primarily determined by the price-performance ratio (relative advantage), and whether the
innovation enhances profit potential in the business (Plouffe et al., 2001b). Profit potential
relates to both revenue-generating and cost-saving activities. The potential value of m-
payments to merchants is then: the improvement in operational efficiency; the increase in
sales; the decrease in costs; a solution to facilitate ubiquitous micropayments; and an
alternative payment solution to cash- and card-based payments (Bertrand and Ahmad, 2014;
7
Lai and Chuah, 2010; Au and Kauffman, 2008; Ondrus and Pigneur, 2006). Moreover,
merchants have a unique and evolving role in the success m-payments since they act as both
users of the payment applications offered by the service providers, and serve as providers to
consumers. The role of the merchant is crucial for securing multiple points of contact with
multiple stakeholders, and managing supply and demand dynamics (Guo and Harry, 2014;
Dahlberg et al., 2007).
Although the global adoption of m-payments was slow prior to 2015, many researchers and
analysts believe that the uptake of m-payments is imminent (Bertrand and Ahmad, 2014; Kim
et al., 2010; Au and Kauffman, 2008; Dahlberg et al., 2007). Paymenteye (2014) reports that
the increased adoption of smartphones could result in $1 trillion of m-payments worldwide
by 2015. The report estimates that m-payment subscribers will increase approximately five
times from 206 million users worldwide in 2010 to 1.05 billion users in 2015 (Paymenteye,
2014). Deloitte (2015) reports that in-store POS m-payments are the fastest growing segment
in m-payments. In this segment, transaction values are expected to grow over 30 times from
2014 levels to reach $118 billion in 2018 (Deloitte University Press, 2015). Peter Miller, head
of retail at wiGroup, says technologies like m-payments can play a leading role in the success
of South Africa’s small business sector (wiGroup, 2015). He says the ability to transact with
a mobile device will transform local businesses and make them more competitive against
large companies (wiGroup, 2015). The optimism underlying m-payments extends to other
domains at the intersection of commerce and technology (Bill and Melinda Gates Foundation,
2015). The 2015 Annual Gates Letter by Bill and Melinda Gates highlights the impact that
digital banking will have in transforming the lives of the poor. The Letter states that, by 2030,
2 billion more people will have access to a mobile bank account (Bill and Melinda Gates
Foundation, 2015).
Despite the proliferation of mobile communication technology and an optimistic sentiment
favouring m-payments adoption and changing spending habits, a number of barriers, most
notably trust and security, and the lack of critical mass, have slowed the uptake of m-
payments (Ahmad et al., 2014; Mallat and Tuunainen, 2008; Mohammadi and Jahanshahi,
2008; Dahlberg et al., 2007). Since the early 2000s, numerous m-payment services, including
electronic payments and Internet banking services, have been unsuccessfully introduced all
over the world (Mallat and Tuunainen, 2008; Dahlberg et al., 2007). Notable examples
include the Simpay initiative and Paybox launched in several European countries. These
8
payment initiatives were neither as widespread nor as rapidly adopted as expected (Mallat
and Tuunainen, 2008). Globally, the uptake of m-payments in 2015 was slower than
anticipated. Gartner has lowered its global growth forecast of m-payments to account for only
2% of total global transaction value in 2013 and 5% of the global transaction value in 2017
(Shen, 2013). Bertrand and Ahmad (2014) note two significant observations: first, in-store m-
payments in 2013 were still relatively small, with only 7% of consumers using their phones
for micropayments for items such as coffee, books and other physical goods; and, second,
consumers still view m-payments as an extension of their existing credit and debit cards,
rather than as a direct substitute for either the card- or cash-based payments. The authors
further stated that m-payments will only become mainstream in the next three years (Bertrand
and Ahmad, 2014). Mallat and Tuunainen (2005) report that merchants agree that the benefits
of m-payments are mostly impending and are only expected to be realised in the future.
1.2. Research goal
The mobile phenomenon has revolutionised commerce in the 21st century. Novel,
intermediating technologies such as m-payments fill a distinct yet vital function in the
payment ecosystem. Despite this, relatively little is understood about the factors driving its
success, particularly in emerging markets. This thesis has the following objective: to
investigate the adoption factors of m-payments from the merchant’s perspective, and provide
new insight into m-payments in the South African context.
1.3. Research question
What are the factors driving the success of merchant adoption of m-payments in Cape Town?
1.4. Approach
Our study used the Perceived Characteristics of Innovation (PCI) instrument developed by
Moore and Benbasat (1991) to empirically investigate merchant adoption of m-payments in a
retail context. The instrument is applicable to study adoption behaviour since it captures rich,
individual information from key antecedent constructs across many different contexts
(Plouffe et al., 2001b). We gathered both quantitative and qualitative data through an online
questionnaire carried out in June 2015 in the Greater Cape Town area. The key distinction in
9
our research is that the measurement items are intended to measure how merchants perceive
IT innovation, and how they adopt new technology in their businesses.
1.5. Outline of thesis
The remainder of the thesis is organised as follows. In the next section we present the
theoretical basis in technology acceptance and the literature review. This is followed by a
description of the research methods. We then present the analysis with a detailed discussion
of our findings, and the limitations of our study. Finally, we conclude the thesis. Based on our
findings, implications for practice and future studies are suggested.
10
2. Literature Review
The literature review presents findings from existing research and reports on m-payments.
We begin with a general examination of technology acceptance. We then evaluate the
literature based on the adoption and implementation of m-payments within an organisation.
Finally, we conclude the literature review with a synthesis of the drivers and barriers to
adoption. A summary of the factors is presented in Table 2 and Table 3.
2.1. Technology Acceptance
Prior research on innovation and technological diffusion argues that in order to maximise the
benefits from information technology (IT) investments, organisations must understand and
manage the implementation process (Cooper and Zmud, 1990; Kwon and Zmud, 1987).
Cooper and Zmud (1990) propose a staged model of IT implementation activities. The
model’s first stage - the initiation of the IT implementation - is driven by pressure on the
organisation to evolve. The organisation attempts to match an organisational opportunity or
problem with an IT solution. The second stage in the model is the adoption of the IT solution,
whereby the organisation invests the resources needed to pursue the implementation. The
adoption stage is followed by the adaptation, acceptance, routinisation, and infusion of the IT
application. Our research examines the early phases of the m-payment diffusion process,
namely the initiation and adoption, and evaluates the factors affecting the adoption of m-
payments in organisations. Empirical research supports the application of the diffusion of
innovation theory across different technologies, including the adoption of financial and
mobile technologies, and m-commerce (Mohammadi and Jahanshahi, 2008; Mallat and
Tuunainen, 2005). According to the diffusion of innovation theory, the overall value
proposition for each adopting group is dependent on the specific nature of the innovation and
the characteristics of the adopting group (Rogers, 1983).
Within the information systems (IS) field, models predicting technology adoption have
primarily used attitudinal constructs taken from psychological theory. The Technology
Acceptance Model (TAM), for example, has become a leading model to explain and predict
technological adoption behaviour (intentions, actions, beliefs and attitudes) at the individual
level (Davis et al., 1989). TAM is an extension of Fishbein and Ajzen’s (1975) Theory of
Reasoned Action and states that adoption behaviour of IS is determined by the intention of
11
the user to use a particular system. TAM and its variants are applicable to a wide range of
technologies, user groups and organisations that favour the model’s validity and reliability
(Yang et al., 2012; Schierz et al., 2010; Kim, 2009; Plouffe et al., 2001b; Venkatesh & Davis,
2000; Davis et al., 1989). Furthermore, TAM is useful in that it provides a parsimonious
framework with which to measure the effect of system and individual variables, such as
subjective norm, perceived risks on the system or actual usage (Kim et al., 2009).
Broadening the range of innovation characteristics, the Perceived Characteristics of
Innovation (PCI) instrument measures an individual’s perceptions of adopting an IT
innovation. The PCI instrument is applicable to study m-payments since adoption behaviour
requires a robust instrument that captures rich, individual information from many constructs
across many different contexts (Plouffe et al., 2001b). These constructs explain a high
proportion of the variance in the context of real-world adoption decisions (Plouffe et al.,
2001a). Moreover, the PCI instrument is intended to study the initial adoption of IT and the
diffusion of technology within an organisation, where diffusion of innovation refers to the
cumulative decision of individuals to adopt technology (Moore and Benbasat, 1991). Hence,
it is the perception of using the innovation that is key to whether the innovation diffuses
(Moore and Benbasat, 1991).
The perceptions of adoption are based on five key characteristics of innovation that determine
the rate of diffusion of innovation (Rogers, 1983). They are: relative advantage;
compatibility; complexity; observability; and triability (Rogers, 1983). The PCI instrument
incorporates four of these constructs: relative advantage; compatibility; complexity (renamed,
“ease of use”); and triability. The instrument includes four additional constructs: visibility,
image, result demonstrability, and voluntariness. Moore and Benbasat (1991) support the
inclusion of the image construct in the PCI model. Rogers argues that the need to gain social
status is one of the most important motivations to adopt an innovation (Rogers, 1983: 215).
Moore and Benbasat (1991) identified visibility and result demonstrability to replace Rogers’
original construct, observability. Additionally, our research model includes trust and security
as a construct based on findings in the literature and the significance of this variable in an
emerging market context (Guo and harry, 2014; Mohammadi and Jahanshahi, 2008; Mallat
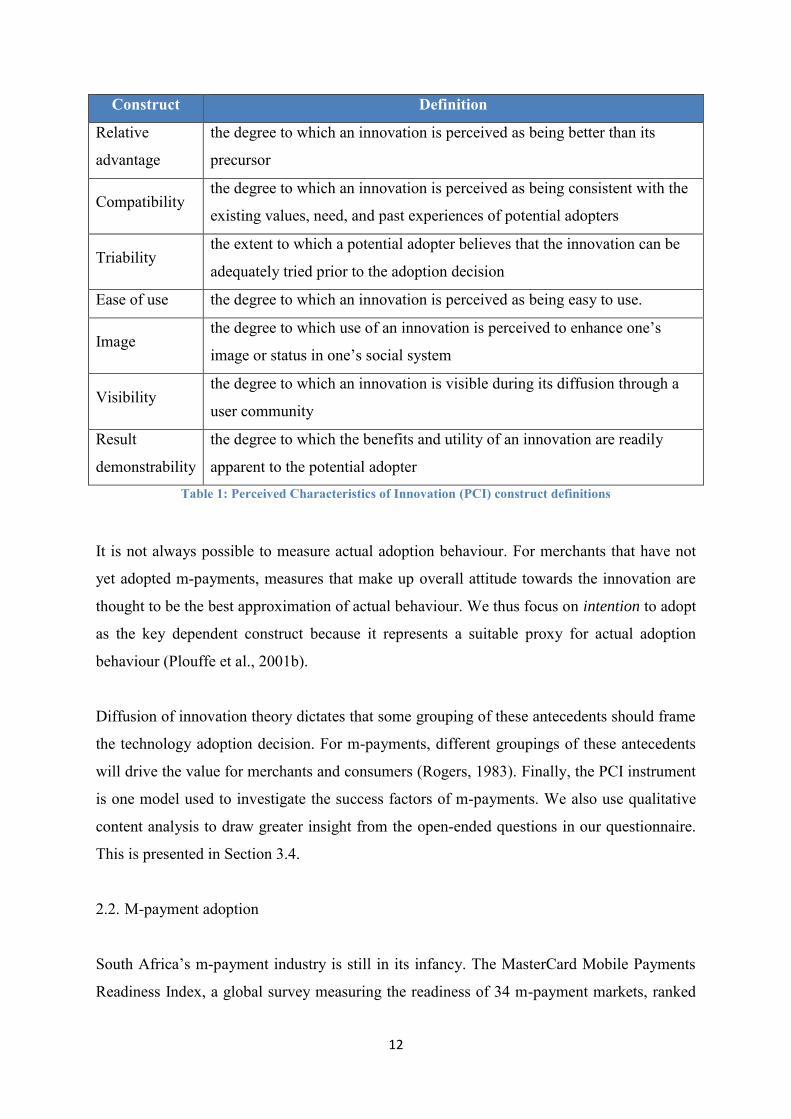
and Tuunainen, 2008, 2005; Van der Heijden., 2002). Table 1 present a summary of the PCI
constructs and their definitions (Moore and Benbasat, 1991).
12
Construct Definition
Relative
advantage
the degree to which an innovation is perceived as being better than its
precursor
Compatibility the degree to which an innovation is perceived as being consistent with the
existing values, need, and past experiences of potential adopters
Triability the extent to which a potential adopter believes that the innovation can be
adequately tried prior to the adoption decision
Ease of use the degree to which an innovation is perceived as being easy to use.
Image the degree to which use of an innovation is perceived to enhance one’s
image or status in one’s social system
Visibility the degree to which an innovation is visible during its diffusion through a
user community
Result
demonstrability
the degree to which the benefits and utility of an innovation are readily
apparent to the potential adopter Table 1: Perceived Characteristics of Innovation (PCI) construct definitions
It is not always possible to measure actual adoption behaviour. For merchants that have not
yet adopted m-payments, measures that make up overall attitude towards the innovation are
thought to be the best approximation of actual behaviour. We thus focus on intention to adopt
as the key dependent construct because it represents a suitable proxy for actual adoption
behaviour (Plouffe et al., 2001b).
Diffusion of innovation theory dictates that some grouping of these antecedents should frame
the technology adoption decision. For m-payments, different groupings of these antecedents
will drive the value for merchants and consumers (Rogers, 1983). Finally, the PCI instrument
is one model used to investigate the success factors of m-payments. We also use qualitative
content analysis to draw greater insight from the open-ended questions in our questionnaire.
This is presented in Section 3.4.
2.2. M-payment adoption
South Africa’s m-payment industry is still in its infancy. The MasterCard Mobile Payments
Readiness Index, a global survey measuring the readiness of 34 m-payment markets, ranked
13
South Africa 26th with an index score of 29.1, below the index average of 33.2 (MasterCard,
2012). The scores are calculated from data comprised of over 50 inputs, and shows that South
Africa’s weak position is primarily driven by a lack of partnerships between banks and
telecommunication companies, as well as lagging infrastructure and a poor overall
environment scores. Singapore, the survey’s top-ranked country, by contrast, has an overall
score of 45.6, which is indicative of an efficient regulatory system and mobile phone
infrastructure, and robust financial services sector. Interestingly, no country progressed to the
inflection score of 60, defined as the point where the mobile device consists of a considerable
share of the payment mix (MasterCard, 2012).
The Small Merchants and Mobile Payments 2013 Survey measuring technology awareness
and adoption found that 47% of respondents had no plan to implement mobile-based POS
payments in the foreseeable future, while 22% were unsure and 20% were somewhat
interested (ControlScan, 2013). The study also found that the percentage of small merchants
using m-payments increased from 10% to 17%, with no corresponding decrease in the use of
traditional POS payment solutions. This supports the idea that merchants view m-payments
as a complementary payment method and not a substitute for existing methods. Interestingly,
nearly half of merchants who only use an m-payment solution have less than ten employees,
suggesting m-payments are mainly used by small businesses (ControlScan, 2013).
Accenture’s research shows 60% of South African mobile phone users are planning to adopt
m-payments, with this number increasing to 66% among users aged 18 to 29 (Accenture,
2014). An estimated 65% of users aged 18 to 29 also noted they would be likely to use their
phones to make payments if the phone generated instant discount vouchers (Accenture,
2014). Bertrand and Ahmad (2014) surveyed 25 000 consumers in the US and Western
European markets. The study provides three key findings. First, more than 20% of consumers
in these regions already shop on their mobile phones; second, in-store purchases are still
small, but growing exponentially; and, third, half of consumers already know about m-
payments. In France, the study found that 80% of consumers are aware of m-payments; it is
the highest country segment in terms of awareness. Moreover, the study notes that the
number of consumers using m-payments between 2012 and 2013 will nearly double. The
study also found that m-payment users tend to be younger and more affluent than the average
consumer (Bertrand and Ahmad, 2014). These users spend more than twice as much through
digital channels. Mallat and Tuunainen (2005) conducted two concurrent empirical surveys
on merchant adoption of m-payments in Finland. Over half of the interviewees and 43% of

14
the survey respondents reported that they plan to offer m-payments for customers in the
future. Further, m-payments were perceived as an additional payment service,
complementing existing methods rather than a substitute method that replaces existing
payment methods. These findings suggest that while m-payments hold a lot of potential,
particularly in certain businesses, the majority of merchants do not perceive m-payments as a
mature technology ready for adoption (Mallat and Tuunainen, 2005). Mallat and Tuunainen
(2008) identify the prerequisites, drivers and barriers to merchant adoption of m-payments.
The four prerequisites are: wide penetration of mobile phones, a viable m-payment
infrastructure, knowledge of m-payments, and the need for an alternate payment system
(Mallat and Tuunainen, 2008). Finally, Ondrus and Pigneur (2006) conducted a multi-
stakeholder and multi-criteria market analysis of m-payments. The study highlights the
hesitation of the Swiss market to agree on a technology and standard for m-payment
adoption. The findings also conclude that the contactless card was most suitable for
merchants. Overall, existing literature on m-payments adoption provides mixed results
regarding the success of the technology.
2.3. Factors affecting adoption
The benefits of m-payments are important because they form the foundation of the
merchant’s decision to adopt and implement the technology. Bertrand and Ahmad (2014)
argue that mass adoption of m-payments will only be triggered when the benefits – both
perceived and real - become clear to consumers and merchants. The Small Merchants and
Mobile Payments 2013 Survey notes that because m-payments are still relatively new, the
benefits largely pertain to the perceived potential until the service is adopted widely and the
benefits accrue to everyone (ControlScan, 2013).
A study by Mohammadi and Jahanshahi (2008) established a framework for evaluating the
barriers and drivers of customer and merchant adoption of m-payments. The authors defined
four categories of barriers to merchant adoption: relative advantage, compatibility,
complexity and costs. Network externalities and security and trustworthiness of the m-
payments were also considered as relevant factors in m-payment adoption. Lai and Chuah
(2010) developed a framework specific to retailing in Hong Kong to understand how the
multi-factor, external forces and internal capabilities can influence merchant adoption
decisions. The study defined four forces shaping m-payments adoption in retailing: provider
15
forces (supply-side push), consumer attitude (demand-side pull), organizational enablers
(internal), and market drivers (external). The authors conclude that m-payments are subject to
multiple influences, including market forces, organisational enablers, and the notion that both
willingness to adopt and the capability to implement are likely to influence merchant
adoption of m-payments. The study found the cost of switching and implementation efforts to
be the key inhibiting factors influencing managerial attitude towards m-payment use. This
shows that merchants are especially concerned about the implementation of m-payments. The
study also suggests that merchants must enhance their appeal to younger consumers and
micropayment transactions. Finally, Plouffe et al. (2001b) conducted a multi-stakeholder
empirical study of m-payments adoption. The authors argue that merchants place more value
on constructs that have the potential to enhance profit potential, noting that many constructs
drive this result (Plouffe et al., 2001b).
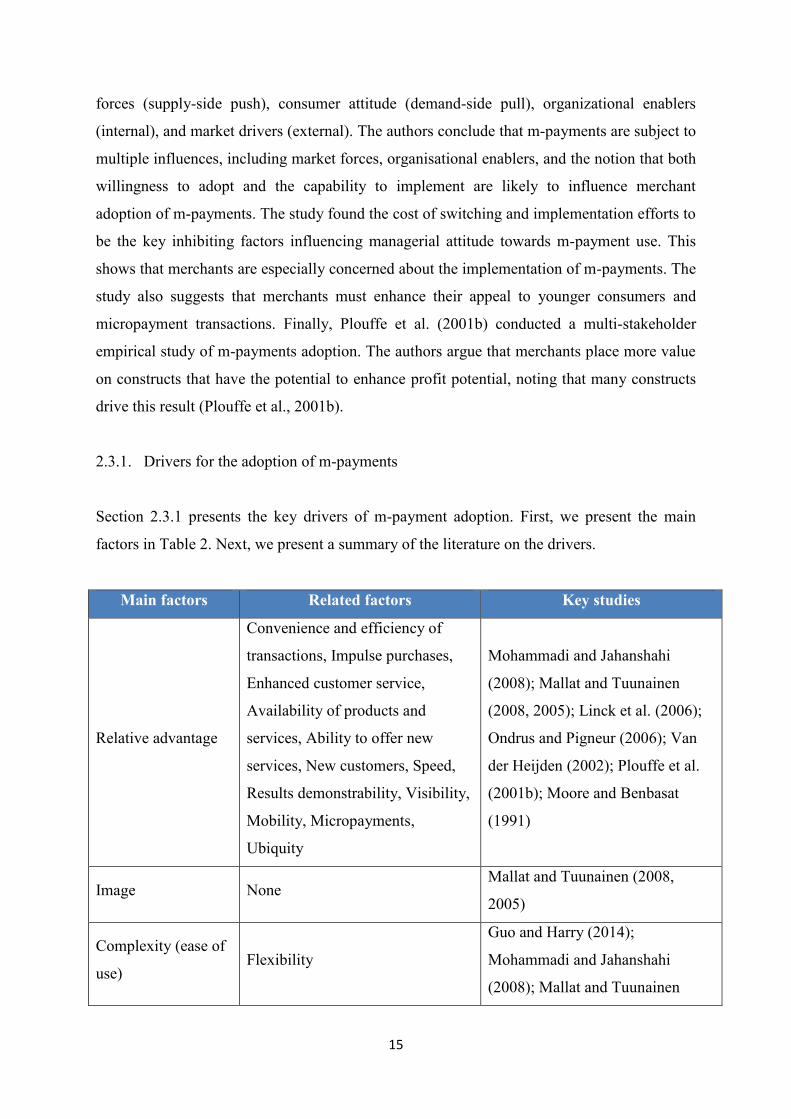
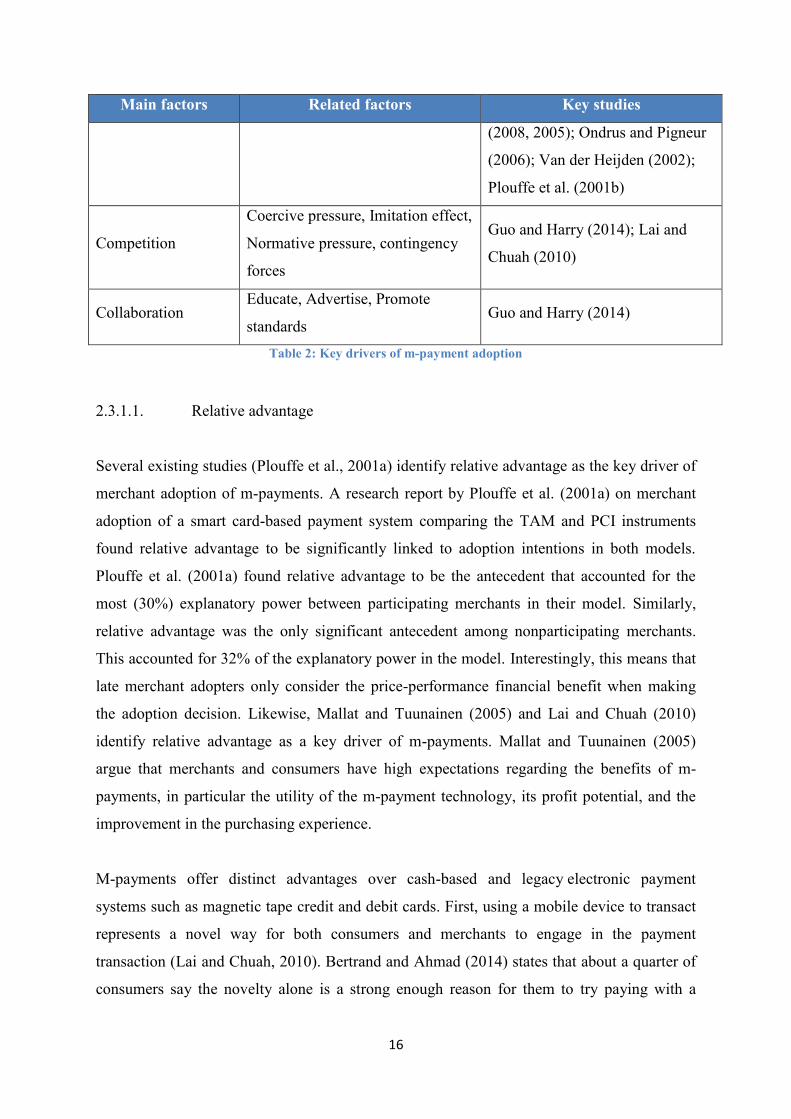
2.3.1. Drivers for the adoption of m-payments
Section 2.3.1 presents the key drivers of m-payment adoption. First, we present the main
factors in Table 2. Next, we present a summary of the literature on the drivers.
Main factors Related factors Key studies
Relative advantage
Convenience and efficiency of
transactions, Impulse purchases,
Enhanced customer service,
Availability of products and
services, Ability to offer new
services, New customers, Speed,
Results demonstrability, Visibility,
Mobility, Micropayments,
Ubiquity
Mohammadi and Jahanshahi
(2008); Mallat and Tuunainen
(2008, 2005); Linck et al. (2006);
Ondrus and Pigneur (2006); Van
der Heijden (2002); Plouffe et al.
(2001b); Moore and Benbasat
(1991)
Image None Mallat and Tuunainen (2008,
2005)
Complexity (ease of
use) Flexibility
Guo and Harry (2014);
Mohammadi and Jahanshahi
(2008); Mallat and Tuunainen
16
Main factors Related factors Key studies
(2008, 2005); Ondrus and Pigneur
(2006); Van der Heijden (2002);
Plouffe et al. (2001b)
Competition
Coercive pressure, Imitation effect,
Normative pressure, contingency
forces
Guo and Harry (2014); Lai and
Chuah (2010)
Collaboration Educate, Advertise, Promote
standards Guo and Harry (2014)
Table 2: Key drivers of m-payment adoption
2.3.1.1. Relative advantage
Several existing studies (Plouffe et al., 2001a) identify relative advantage as the key driver of
merchant adoption of m-payments. A research report by Plouffe et al. (2001a) on merchant
adoption of a smart card-based payment system comparing the TAM and PCI instruments
found relative advantage to be significantly linked to adoption intentions in both models.
Plouffe et al. (2001a) found relative advantage to be the antecedent that accounted for the
most (30%) explanatory power between participating merchants in their model. Similarly,
relative advantage was the only significant antecedent among nonparticipating merchants.
This accounted for 32% of the explanatory power in the model. Interestingly, this means that
late merchant adopters only consider the price-performance financial benefit when making
the adoption decision. Likewise, Mallat and Tuunainen (2005) and Lai and Chuah (2010)
identify relative advantage as a key driver of m-payments. Mallat and Tuunainen (2005)
argue that merchants and consumers have high expectations regarding the benefits of m-
payments, in particular the utility of the m-payment technology, its profit potential, and the
improvement in the purchasing experience.
M-payments offer distinct advantages over cash-based and legacy electronic payment
systems such as magnetic tape credit and debit cards. First, using a mobile device to transact
represents a novel way for both consumers and merchants to engage in the payment
transaction (Lai and Chuah, 2010). Bertrand and Ahmad (2014) states that about a quarter of
consumers say the novelty alone is a strong enough reason for them to try paying with a
17
mobile phone. Second, m-payments provide a much-needed solution to facilitate electronic
micropayments. The need for electronic micropayments has arisen in several applications,
including remote and proximity transactions (Linck et al., 2006). Third, m-payments facilitate
quick mobile commercial transactions that take place in real-time (Lai and Chuah, 2010; Kim
et al., 2009). Polasik et al. (2012) argue that m-payments are as fast as cash transactions in
terms of time efficiency, while both are faster than traditional card-based payments. The
authors highlight the importance of a fast checkout, stating that the time servicing a payment
be regarded as part of the merchant cost (Polasik et al., 2012).
Next, m-payments are advantageous because they are ubiquitous. The mobile device has
become an indispensable tool for consumers because it can be used independent of time and
location (Paymenteye, 2014; ControlScan, 2013). Jarvenpaa and Lang (2005) report that
consumers have become used to keeping their mobile devices within arm’s reach, and
actually experience discomfort when turning them off. Frolic and Chen (2004) cite ubiquity
as the most important driver of m-payments. The study notes that the ubiquity of m-payments
allows merchants to sell their products and services at any time and from most locations.
Similarly, Clarke (2001) states that ubiquity is the fundamental difference between mobile
commerce and its predecessor, stationary e-commerce. This is due to the notion that the wider
the reach of the telecommunication network, the greater the value of m-payments. A
widespread mobile channel gives more merchants and consumers access to the network,
creating a larger base of stakeholders that can transact remotely. Mallat and Tuunainen
(2008) note that ubiquity enhances the value of m-payments, as transactions can take place in
the context of mobile commerce, remote commerce, and POS transactions. Merchants are
able to create more contact points with consumers via the mobile channel, and can even target
them individually. The specific benefits of ubiquity are: the generation of additional sales
because of the increase in the volume of transactions; new revenue streams; the formation of
new relationships with prospective customers; an increase in impulse purchases; the increase
in the availability of products and services; and the introduction of new types of services and
customers (Lai and Chuah, 2010; Mallat and Tuunainen, 2008, 2005).
Impulse purchases are defined as the persistent urge to buy something immediately (Dennis
Rook, 1987). Impulse purchases drive adoption insofar as m-payments allow merchants and
consumers to transact immediately, when the desire arises. For customers, impulse purchases
are useful in several scenarios: when one has to make an unexpected payment due to time
18
pressure; to avoid queuing; and when one is short on cash or forgets his or her wallet at home
(Mohammadi and Jahanshahi, 2008). 55% of survey respondents in a study by Mallat and
Tuunainen (2005) report that an increase in perceived impulse purchases is a specific
advantage of m-payments over former payment systems. In a similar study by Mallat and
Tuunainen (2008), merchants identified the potential to increase impulse purchases as a
specific benefit of m-payments.
Finally, convenience is a key factor underpinning relative advantage. Several studies
highlight convenience as a key driver of adoption for both merchants and consumers
(Bertrand and Ahmad, 2014; Paymenteye, 2014; ControlScan, 2013). 73% of respondents in
the Small Merchants and Mobile Payments 2013 Survey cite ubiquity and convenience as the
key driver of m-payments adoption (ControlScan, 2013). Bertrand and Ahmad (2014) report
that about two-thirds of consumers want a more convenient payment option.
2.3.1.2. Image
Mallat and Tuunainen (2008, 2005) found that m-payments had a positive effect on company
image. The 2005 study found that two thirds of respondents considered companies offering
mobile payments as innovative. The 2008 study, however, found that the effects of image
were somewhat contradictory. Plouffe et al. (2001b) also found image to be a significant
antecedent for participating merchants in their model. The authors stated that image
explained 17% of the variance in intention to adopt in the group of participating merchants.
2.3.1.3. Complexity (ease of use)
Siau and Shen (2003) argue that system design has in the past placed limitations on the use of
m-payments. These limitations included small displays and keyboards, poor battery life,
limited processing power and memory, and stability and reliability issues. Mallat and
Tuunainen (2005) identify the complexity of m-payment technology as a key barrier to
adoption. The study notes that respondents found previous payment solutions to be “complex
and difficult to use,” citing too many steps in the payment process. Similarly, Mohammadi
and Jahanshahi (2008) found that existing solutions are still perceived as too complex.
Plouffe et al. (2001b) found ease of use to be an insignificant antecedent between both
nonparticipating and participating merchants in their model.

19
2.3.1.4. Visibility
Plouffe et al. (2001b) found visibility to be a significant antecedent for nonparticipating and
participating merchants in their model. The construct accounted for 13% of the explanatory
power in the model.
2.3.1.5. Results Demonstrability
Plouffe et al. (2001b) found results demonstrability to be an insignificant antecedent for
nonparticipating and participating merchants in their model. Results demonstrability is
included in our research model because it is deemed relevant in the context of a retail
environment.
2.3.1.6. Triability
Plouffe et al. (2001b) found triability to be an insignificant antecedent between both
nonparticipating and participating merchants in their model. Triability is not included in our
research model.
2.3.1.7. Engagement
M-payment technology allows merchants to engage with the consumer beyond the
transaction by taking advantage of loyalty and couponing opportunities. Ahmad et al. (2014)
found that consumers want additional value from m-payment applications through rewards
programmes and personalised marketing offers. 13% of consumers are reportedly attracted by
financial rewards, with many prepared to trade their personal data in exchange for these
benefits (Ahmad et al., 2014). For merchants, m-payments present an opportunity to engage
those consumers in a value-added experience. (Guo and Harry, 2014) argue that businesses
are incentivised to invest in a mobile strategy that promotes greater engagement and a unified
shopping experience in order to gain an advantage over traditional retailers. Merchants will
likely use this to target and acquire new customers with personalised offers based on data
collected from the payment applications (Bertrand and Ahmad, 2014). Moreover, Guo and
Harry (2014) note that merchants can benefit from greater customer loyalty. In South Africa,
20
FlickPay, a POS-integrated closed-loop payments application, has partnered with the local
coffee franchise Vida e Caffe, to encourage greater engagement through in-store benefits
such as discounts (Le Cordeur, 2014).
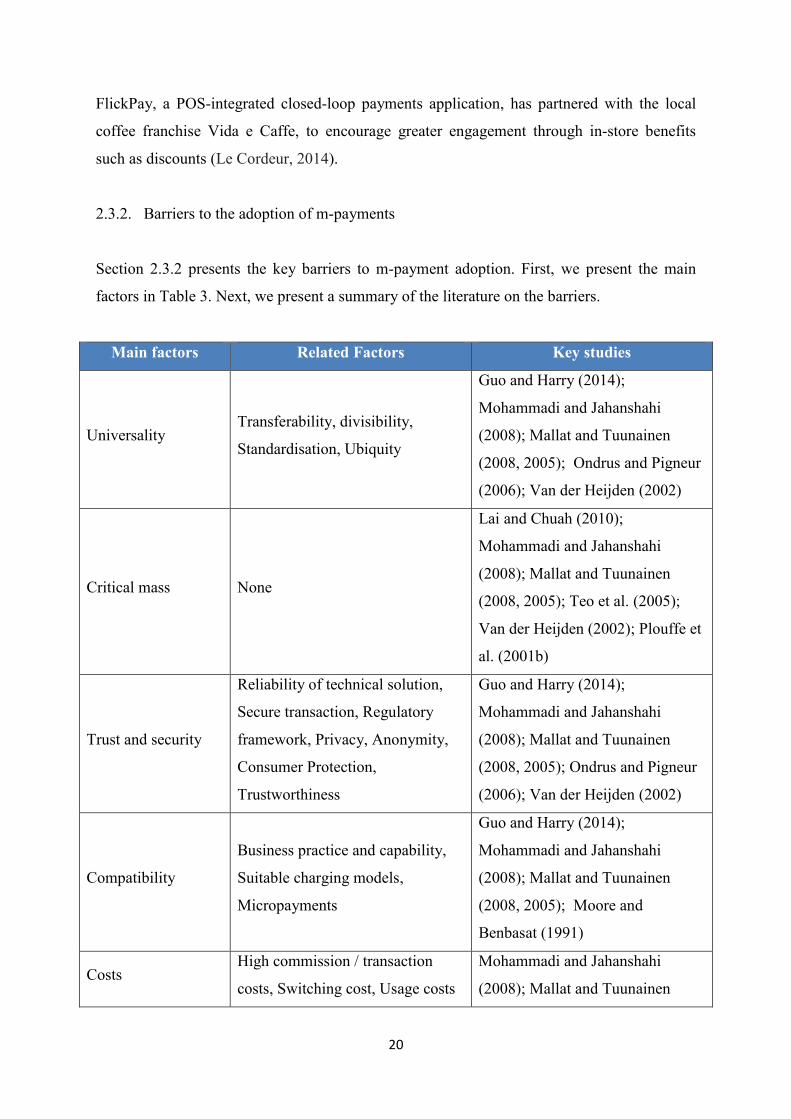
2.3.2. Barriers to the adoption of m-payments
Section 2.3.2 presents the key barriers to m-payment adoption. First, we present the main
factors in Table 3. Next, we present a summary of the literature on the barriers.
Main factors Related Factors Key studies
Universality Transferability, divisibility,
Standardisation, Ubiquity
Guo and Harry (2014);
Mohammadi and Jahanshahi
(2008); Mallat and Tuunainen
(2008, 2005); Ondrus and Pigneur
(2006); Van der Heijden (2002)
Critical mass None
Lai and Chuah (2010);
Mohammadi and Jahanshahi
(2008); Mallat and Tuunainen
(2008, 2005); Teo et al. (2005);
Van der Heijden (2002); Plouffe et
al. (2001b)
Trust and security
Reliability of technical solution,
Secure transaction, Regulatory
framework, Privacy, Anonymity,
Consumer Protection,
Trustworthiness
Guo and Harry (2014);
Mohammadi and Jahanshahi
(2008); Mallat and Tuunainen
(2008, 2005); Ondrus and Pigneur
(2006); Van der Heijden (2002)
Compatibility
Business practice and capability,
Suitable charging models,
Micropayments
Guo and Harry (2014);
Mohammadi and Jahanshahi
(2008); Mallat and Tuunainen
(2008, 2005); Moore and
Benbasat (1991)
Costs High commission / transaction
costs, Switching cost, Usage costs
Mohammadi and Jahanshahi
(2008); Mallat and Tuunainen

21
Main factors Related Factors Key studies
(2008, 2005); Ondrus and Pigneur
(2006); Van der Heijden (2002)
Relative
disadvantage
Profitability uncertain, networked
effect
Mohammadi and Jahanshahi
(2008); Mallat and Tuunainen
(2005)
Strategic orientation
of merchants
Capabilities and resources of
organisation, M-payment
Knowledge, Technological
opportunism, Transaction strategy
Guo and Harry (2014); Lai and
Chuah (2010)
Consumer readiness
Understanding the role, increased
extrinsic and intrinsic motivation,
MP Knowledge, Individual
capacity
Guo and Harry (2014); Lai and
Chuah (2010)
Liljander et al. (2006)
Table 3: Key barriers to m-payment adoption
2.3.2.1. Critical mass
The broad acceptance of a highly networked, intermediating technology service such as m-
payments is reliant upon the value added to the exchange relationship by multiple
stakeholders (Plouffe et al., 2001b). Several authors identify the number of interdependent
consumer and merchant participants, known as the critical mass, as the key challenge
affecting adoption (Lai and Chuah, 2010; Mohammadi and Jahanshahi, 2008; Mallat and
Tuunainen, 2008, 2005; Teo et al., 2005; Van der Heijden, 2002; Plouffe et al., 2001b). One
of the main reasons why m-payments have not been adopted widely is the failure to create a
roll-out with enough momentum to reach a tipping point for creating a critical mass (Guo and
Harry, 2014).
The widespread adoption of m-payments is reliant on the acceptance by both merchants and
consumers. This presents the common chicken-egg problem: consumers will not accept and
use m-payments unless a significant number of merchants offer it, while merchants will not
accept and offer m-payments unless a significant number of consumers use it (Pousttchi,
2007; Economides and Himmelberg, 1995). Network benefits arise when new consumers
22
adopting the technology indirectly increase the value or expected utility of the network for all
consumers because they attract new merchants to join the network (Katz and Shapiro, 1992).
Similarly, new merchants increase the value of the network for both merchants and
consumers (Shapiro and Varian, 2013). Without either consumers or merchants, the value of
a mobile payments platform is zero, and the expected utility for each participant is zero (Guo
and Harry, 2014; Au and Kauffman, 2008). Moreover, the consumer’s decision to adopt m-
payments is based in-part on the size of the consumer base, as well as how universally
available the payment system is (Mohammadi and Jahanshahi, 2008; Van der Heijden, 2002).
The benefits of m-payments are only realised once enough consumers and merchants are
using the service (Kauffman et al., 2000). This is made more difficult by the fact that the
value proposition to these two segments is different (Mallat and Tuunainen, 2008).
Guo and Harry (2014) developed an analytical framework for m-payments acceptance from
the merchant’s perspective. The study identifies five categories of barriers and drivers that
will achieve critical mass, the key driver of merchant acceptance. They are: technology,
demand, organisations, ecosystem and environment. The authors note that the development of
m-payments is reliant on multiple stakeholders, especially service providers (Guo and Harry,
2014). Van der Heijden (2002) explored the factors that affect the early implementation of m-
payments in a qualitative study conducted with executives in Sweden and the Netherlands.
The study found that a dynamic relationship between merchants and consumers in the early
stages was a significant adoption factor. Overall, the study also found that stakeholders were
sceptical about m-payments. Mallat and Tuunainen (2008) explored the drivers and barriers
of merchant adoption of m-payment systems in Finland. They found the lack of critical mass
to be the main adoption barrier. Mallat and Tuunainen (2005) further underlined that only a
large consumer-base would make m-payments profitable for merchants and other service
providers to offer the technology.
Broadly speaking, the value of m-payments is largely determined by strategic relationships
and interests between a diverse group of stakeholders in the payment ecosystem (Guo and
Harry, 2014; Lai and Chuah, 2010; Van der Heijden, 2002). These stakeholders comprise the
retail, financial services and telecommunication sectors, and include governments, banks,
payment service providers, mobile network operators, mobile hardware manufacturers,
merchants, and other service-related participants (Guo and Harry, 2014; Au and Kauffman,
2007). Building the mobile channel and retail payment architecture is a shared responsibility
23
that relies on both collaborative and competitive forces between key stakeholders (Guo and
Harry, 2014; Lai and Chuah, 2010). Ghezzi et al. (2010) argues that the strongest inhibitors
of m-payment adoption could be value chain relationships and the lack of cooperation among
participants. Similarly, Ahmad et al. (2014) report that executives agree unanimously that the
success of a dynamic, highly interrelated payment market is reliant on the growth and
contribution of each market participant, who in turn benefits from their own relationship with
this market. Mobile network operators, for example, are incentivised to capitalise on new
revenue opportunities enabled by m-payments. Banks, on the other hand, can increase their
customer-base by targeting a new segment of consumers (Lai and Chuah, 2010). Finally,
Iansiti and Levien (2004) argue that keystone participants – those participants at the core of
the ecosystem – have a duty to improve the overall state of the system by facilitating value
creation and value sharing with other participants (Iansiti and Levien, 2004).
2.3.2.2. Trust and security
Trust and security measures validate the use and integrity of m-payment technology (Guo and
Harry, 2014). Security is crucial within the mobile domain because it protects confidential
information from being misused when financial transactions occur independently over the
network, and it guarantees the users’ privacy (Guo and Harry, 2014; Mohammadi and
Jahanshahi, 2008). The core security concerns include privacy, confidentiality,
authentication, authorization, reliability, accountability, integrity, availability, and non-
repudiation (Guo and Harry, 2014; Mohammadi and Jahanshahi, 2008; Mallat and
Tuunainen, 2005; Van der Heijden, 2002). Several studies identify trust and security as an
important prerequisite or factor for merchant and service provider adoption (Guo and Harry,
2014; Chen, 2008; Mohammadi and Jahanshahi, 2008; Mallat and Tuunainen, 2005; Van der
Heijden, 2002). Mallat and Tuunainen (2005) argue that trust and security is an important but
not key barrier for m-payment adoption. Half of the respondents in the study perceived banks
as trustworthy. Similarly, Mohammadi and Jahanshahi (2008) found security to be an
important factor, but not as crucial as issues related to network externalities and costs.
Respondents reported that the reliability of the technical solution and the trustworthiness of
the service provider are important for adoption (Mohammadi and Jahanshahi, 2008). Teo et
al. (2005) conducted a study on inhibitors and facilitators of m-payment adoption in
Australia. The study identified security as the major obstacle to growth.

24
2.3.2.3. Compatibility
Mallat and Tuunainen (2005) found m-payments to be most compatible with micro
purchases. However, the study found that the frequency of the purchases for goods and
services are low, suggesting that merchants do not consider m-payments as the best solution
to pay for small-value purchases. Moreover, many respondents mentioned that m-payments
are not compatible with existing business systems and operations. Half of respondents did not
consider m-payments to be compatible with their products, work routines, or existing
payment methods (Mallat and Tuunainen, 2005). Mohammadi and Jahanshahi (2008) argue
that existing m-payment solutions are perceived to be compatible with micro purchases but
incompatible with business practices. Plouffe et al. (2001b) found compatibility to be a
significant antecedent between participating merchants in their model. The construct
accounted for 17% of the explanatory power in the model. Finally, Lai and Chuah (2010)
argue that the incompatibility with retail POS and ICT infrastructure will inevitably hinder
the pace of adoption. The authors state that this is strongly linked to a lack of standardisation
and inconsistent interfaces. In summary, the literature on compatibility indicates mixed
results.
2.3.2.4. Standardisation
Today, the prevalence of different technology standards (SMS, QR code and NFC), 3G and
4G, and the introduction of several stakeholders in competition with each other, including
mobile operators, third party payment providers, and large financial institutions, has created
widespread heterogeneity, and a challenge for applying an industry-wide standard to m-
payments (Guo and Harry, 2014). Several studies have found the lack of standardisation to be
a key barrier to both consumer and merchant adoption, as well as a hindrance to compatibility
(Guo and Harry, 2014; Shapiro and Varian, 2013; Mallat and Tuunainen, 2008; Kadhiwala
and Zulfiquar, 2007; Ondrus and Pigneur, 2006; Van der Heijden, 2002). Tirole (1988)
argues that standardisation helps the consumer to adopt new technology immediately, choose
among alternatives, and reduces the consumer’s search cost. Mallat and Tuunainen (2008)
argue that respondents had trouble linking m-payment applications to existing banking and
telecommunication services. The respondents stated that they would prefer standardised
solutions that are applicable to a wider customer base. Furthermore, the interviewees were
concerned that the increase in competition for payment solutions, and the lack of standards
25
would cause both providers and consumers to become disinterested in creating a common
collaborative solution. Finally, Guo and Harry (2014) state that stakeholders have
heterogeneous interests that result in complexity in standards and the degradation of the ease
of use of the system and its experience.
2.3.2.5. Cost
Finally, merchants and service providers require a cost-effective solution to incentivise and
sustain the use of m-payments. Cost comprises several subcategories, including: setup costs,
monthly fees, transaction fees, service provider fees, hardware and software upgrades, and
training personnel (Mohammadi and Jahanshahi, 2008; Mallat and Tuunainen, 2008, 2005;
Van der Heijden, 2002).
Several studies found perceived transaction fees to be a significant factor inhibiting merchant
adoption of m-payments (Lai and Chuah, 2010; Mallat, 2005; Van der Heijden, 2002). Mallat
(2005) argues that m-payment adoption rises when the transaction fees and usage costs are
perceived to be lower than existing payment methods. The author found that m-payments
were unprofitable for some merchants due to the high commission charged. Moreover, the
author found that respondents did not find any particular cost advantages to m-payment use,
and noted that lower processing costs were not likely. Lai and Chuah (2010) found that
merchants want minimal setup charges and low transaction fees. Van der Heijden (2002)
argues that merchants are at the mercy of large financial institutions that have greater
flexibility in setting transaction fees due to their large customer base. Finally, it is worth
noting that m-payments are free for consumers because of the ease with which they can
switch back (Van der Heijden, 2002).
In summary, the literature indicates that m-payments have been studied across a variety of
contexts, using the PCI instrument. This is an indication that the PCI instrument is reliable
and widely applicable. Furthermore, the drivers and barriers identified in the literature
provide a useful overview of the factors driving the success of m-payments. In the next
section, we present the research methodology.

26
3. Research methodology
The objective of our research is to empirically investigate merchant adoption of m-payments
by gathering both quantitative and qualitative data. As such, the questionnaire incorporates
both open- and close-ended questions. Section 3 is organised as follows. First, we present a
discussion of the constructs and how they are measured. This is followed by an outline of the
data collection procedure and the sample. We then present an overview of qualitative content
analysis. Finally, we conclude with a brief discussion on missing data.
3.1. Construct measurement
We conducted an empirical study using the Perceived Characteristics of Innovation (PCI)
instrument to investigate the factors affecting merchant adoption of m-payments. The
measures for the PCI model were operationalized and modified to fit the merchant’s
perception of m-payments, and the retail context of m-payments adoption (Plouffe et al.,
2001b). The key distinction in our research is that the measurement items are intended to
measure how merchants perceive IT innovation, and how they adopt new technology in their
businesses. All items were measured on a 7-point scale, anchored by “strongly agree” (1) and
“strongly disagree” (7). On this scale, we assume that the mathematical middle (4) is neutral.
For the PCI belief constructs, we selected the short-form scales of ten PCI measurement
items, and one additional image item (see Appendix 2) (Moore and Benbasat, 1991). The
remaining measurement items in Moore and Benbasat’s list were rejected as they were
deemed irrelevant to the context of our study. A trust and security construct consisting of six
measurement items was included in the questionnaire. The voluntariness construct was
excluded from the study.
We identified two measurement items to capture the dependent construct, intention to adopt
(Plouffe et al., 2001b). They are:
1. I intend to use an MPS in my business in the future.
2. I intend to use an MPS in my business as often as possible.
The two selected measurement items are task-focused and were modified to capture “the
respondent’s sense of urgency to formally adopt the innovation once it becomes widely

27
available” (Plouffe et al., 2001b). We assume that, for participating merchants, their intention
to use m-payments in the future, and as often as possible, is equivalent to the continuation of
its use.
The questionnaire was initially tested in a small-scale pilot study involving 14 merchants.
The pilot study resulted in the removal of five items from the questionnaire as the
questionnaire was deemed too long. They are:
Relative advantage
Mobile payments decrease business costs
Using an MPS enables me and my staff to process payments more quickly
Ease of use
It is easy to instruct customers on how to use an MPS
Trust and security
When using an MPS to receive payments, I double-check confirmation of the payment
transaction with the customer
The MPS application PIN and/or fingerprint authentication provides a necessary layer of
security
The final questionnaire consisted of 25 measurement items (see Appendix 2). The
questionnaire has three sections. The first section comprises general questions, and one open-
ended question. These questions include the age of the business, the industry type, the
payment channels used, and the reason merchants chose their particular m-payment service
provider. The second section includes 25 main quantitative questions relating to m-payments
adoption, grouped by construct. These include questions relating to intention to use, relative
advantage, image, compatibility, ease of use, visibility, trust and security, and results
demonstrability. The third section includes one open-ended question. The question asked
merchants if they had further comments regarding the use and impact of m-payments in their
business.
28
3.2. Data collection procedure
The data required for this study was not readily available. A questionnaire was drawn up and
the measures were pre-tested in a small-scale pilot study in Cape Town. First, we dropped
100 flyers at individual merchant stalls at the Old Biscuit Mill and Woodstock Palms markets
in Woodstock, Cape Town on the morning of 30 May 2015. We asked merchants to visit a
website identified by a URL printed on the flyer. The response rate was 0. Following this
failure, we visited 14 merchants in-person between 4 and 6 June 2015 in Rondebosch and
Observatory in Cape Town and filled the questionnaires during interviews. The visits were
not scheduled.
Each interview had roughly the following structure. First, we introduced ourselves and gave
some background about the research. We then carried out the interview with the merchant.
Following this, we had a general discussion around m-payments, where the merchants were
asked to speak and question freely. The merchants were generous to give us up to 15 minutes
of their time to discuss our research and complete the questionnaire. We guaranteed that the
merchant’s confidentiality would be protected if they so wished. One questionnaire was
discarded at this stage as there were too many missing responses. These interviews concluded
the pre-test.
The questionnaire was then revised. Five items were removed from the questionnaire as it
was deemed too long. Our data sample and subsequent analysis was drawn only from the
revised questionnaire to ensure consistency.
The final questionnaire was distributed over email from a Gmail account
([email protected]) created especially for this research project. Google Forms was
used to capture the questionnaire answers in an electronic format. Approximately 1652
merchants in the Greater Cape Town area received our mail between 8 and 18 June 2015.
Each email contained a cover letter, questionnaire design and instructions for the merchants
(Dillman, 1978). The email addresses of the businesses and merchants were collected
individually over the Internet. These were all publically available on the Internet.
Collecting email addresses individually was a challenge. Many merchants did not have up-to-
date information online. All emails were specifically addressed to the owners or managers, as
29
these individuals were likely to be the ones making the decision to adopt and implement m-
payments in the business. On 22 June 2015, a final reminder email was sent out to all invitees
who had not yet responded.
All the merchants who received and responded to the final questionnaire were eligible for a
R1000 cash prize that was funded by the University of Cape Town Computer Science
Department. The cash prize was used to incentivise merchants to respond.
3.3. Sample
Existing literature provided a useful guideline on the sample of merchants we intended to
target. Our sample included small- and medium-sized retailers operating in the Greater Cape
Town area who conduct B2C POS transactions (see Appendix 1). This included both
merchants that use m-payments and those that do not. All merchants considered were
assumed to have had the opportunity to adopt and use m-payments. All information
pertaining to these merchants was publicly available, either on the Internet, or on the
merchant maps built into the Snapscan, Zapper and FlickPay m-payment applications. The
merchant maps were up-to-date, accurate and generally reliable.
The selection criteria for the individual interviewees in the pre-test included persons who
were in managerial positions, whose responsibilities included adopting and implementing m-
payments in the business, and who were thus knowledgeable enough to discuss the issue.
(Mallat and Tuunainen, 2008).
Questionnaires were distributed to merchants with a valid email address in our target
population. We eliminated businesses where we did not have up-to-date contact information,
or otherwise where we deemed the merchant not applicable to the target population.
In total, 82 completed questionnaires were collected, representing an effective response rate
of 5%. We are mindful of the fact that the number of merchants in our sample not using m-
payments is low. As such, strong conclusions are not drawn. Table 4 summarises the number
of final invitations sent out and the resulting response rate.
30
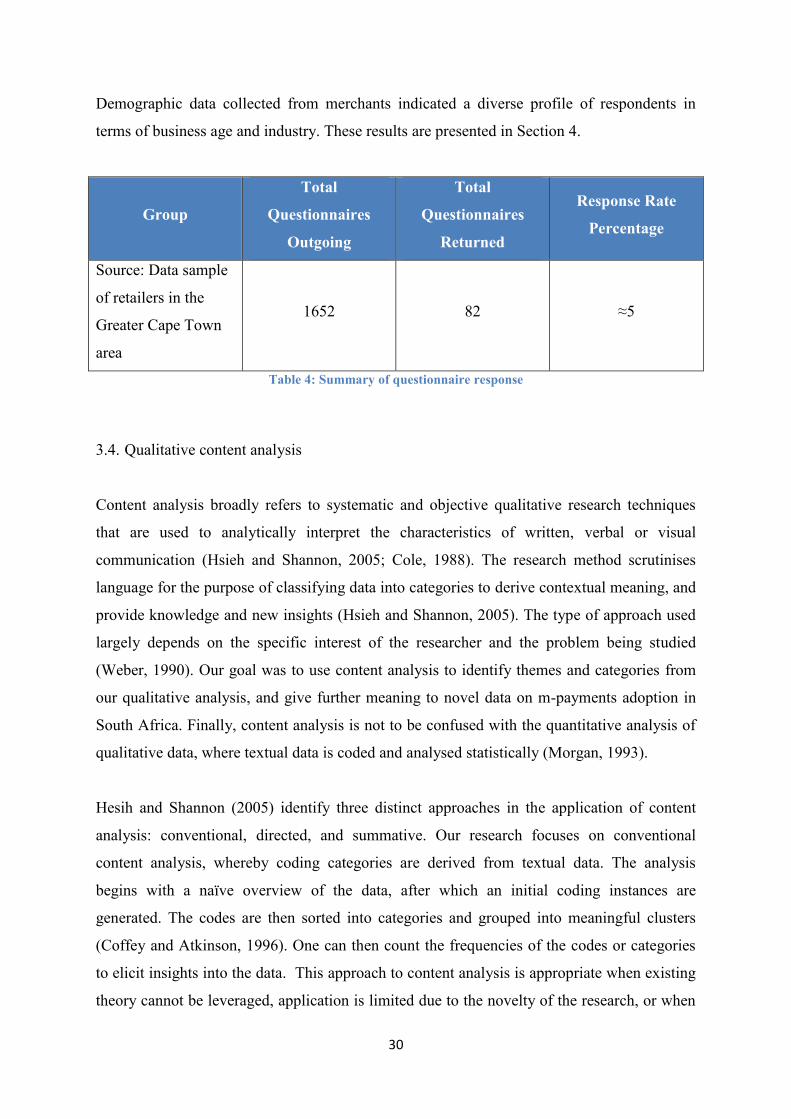
Demographic data collected from merchants indicated a diverse profile of respondents in
terms of business age and industry. These results are presented in Section 4.
Group
Total
Questionnaires
Outgoing
Total
Questionnaires
Returned
Response Rate
Percentage
Source: Data sample
of retailers in the
Greater Cape Town
area
1652 82 ≈5
Table 4: Summary of questionnaire response
3.4. Qualitative content analysis
Content analysis broadly refers to systematic and objective qualitative research techniques
that are used to analytically interpret the characteristics of written, verbal or visual
communication (Hsieh and Shannon, 2005; Cole, 1988). The research method scrutinises
language for the purpose of classifying data into categories to derive contextual meaning, and
provide knowledge and new insights (Hsieh and Shannon, 2005). The type of approach used
largely depends on the specific interest of the researcher and the problem being studied
(Weber, 1990). Our goal was to use content analysis to identify themes and categories from
our qualitative analysis, and give further meaning to novel data on m-payments adoption in
South Africa. Finally, content analysis is not to be confused with the quantitative analysis of
qualitative data, where textual data is coded and analysed statistically (Morgan, 1993).
Hesih and Shannon (2005) identify three distinct approaches in the application of content
analysis: conventional, directed, and summative. Our research focuses on conventional
content analysis, whereby coding categories are derived from textual data. The analysis
begins with a naïve overview of the data, after which an initial coding instances are
generated. The codes are then sorted into categories and grouped into meaningful clusters
(Coffey and Atkinson, 1996). One can then count the frequencies of the codes or categories
to elicit insights into the data. This approach to content analysis is appropriate when existing
theory cannot be leveraged, application is limited due to the novelty of the research, or when
31
one may want to avoid using preconceived categories. (Kondracki et al., 2002). The benefit
of the conventional approach is that the researcher is able to obtain a unique perspective from
participants that is grounded in actual data. Moreover, this approach is void of any biases
found in preconceived theories (Hsieh and Shannon, 2005).
Elo and Kyngäs (2007) argue that the content analysis process is either deductive or inductive
in nature. A deductive approach is used when the purpose of the analysis is to test existing
data or theory in different contexts or over different time-periods. Inductive content analysis
is used when there is no or little prior research on the topic (Elo and Kyngäs, 2007). Our
research hence follows an inductive approach, where specific instances of data are observed
and then combined into larger categories. This process comprises open coding which refers to
the process of tagging instances of the data, and then transferring the instances onto a coding
sheet (Elo and Kyngäs, 2007). Categories of instances are then generated to reduce the
number of instances. Larger, high-level categories are then generated (Hsieh & Shannon,
2005). The distinction in inductive analysis is that the researcher has the freedom to decide
what to put in each category (Dey, 1993). The purpose of grouping data into categories is that
it allows a comparison to be made between categories, allowing for greater insight and
understanding.
The objective of our content analysis was to categorise the data collected from two open-
ended questions in order to draw additional insights to support the overall thesis question. To
begin, the data collected from the open-ended questions was tabulated in Microsoft Excel.
Each textual answer was separated into distinct instances, and tagged by service provider and
sentiment, as either positive or negative. Where a data point or instance was represented by
two service providers (the case where a merchant used two service providers), the instance
was represented separately by each service provider. High-level, group categories were then
generated from the instances. Responses with similar patterns and wording were coded under
the same categories. This process was carried out twice to ensure that categories were applied
consistently and with no errors. After revising and categorising all the interviews, a
comprehensive list of factors was produced. These results are discussed in Section 5.
32
3.5. Missing data
For the most part, missing data was not an issue in the sample. Most responding merchants
provided full information for the measures of interest. None of the responses were removed
due to an unacceptably large number of missing responses. The final sample size was 82.
Nine merchants answered most, but not all, of the measures of interest. A total of 73
merchants completed the entire questionnaire.
33
4. Results
Section 4 presents the results of our research. First, we present the demographic analysis.
This is followed by a detailed analysis of each construct. Next, we present the qualitative
content analysis. This is followed by the reliability and validity analysis. Finally, we conclude
with a detailed discussion of our findings.
4.1. Demographic Analysis
Figure 1: Distribution by merchant type
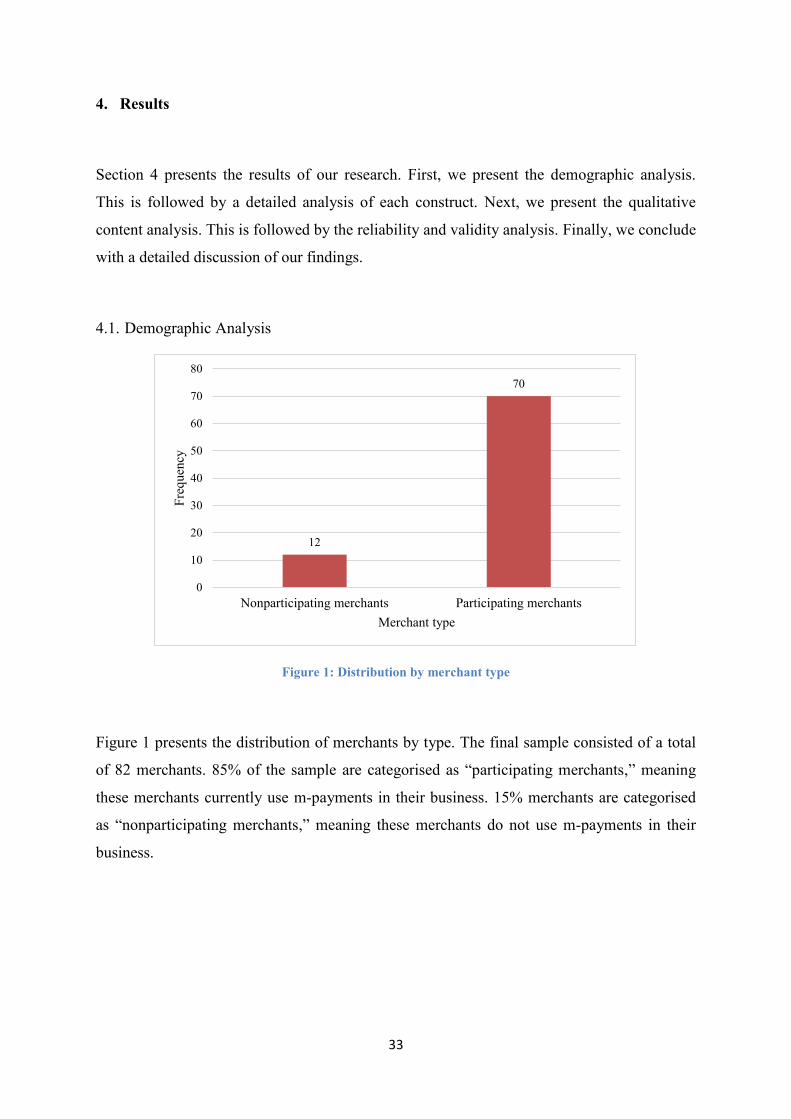
Figure 1 presents the distribution of merchants by type. The final sample consisted of a total
of 82 merchants. 85% of the sample are categorised as “participating merchants,” meaning
these merchants currently use m-payments in their business. 15% merchants are categorised
as “nonparticipating merchants,” meaning these merchants do not use m-payments in their
business.
12
70
0
10
20
30
40
50
60
70
80
Nonparticipating merchants Participating merchants
Freq
uenc
y
Merchant type
34
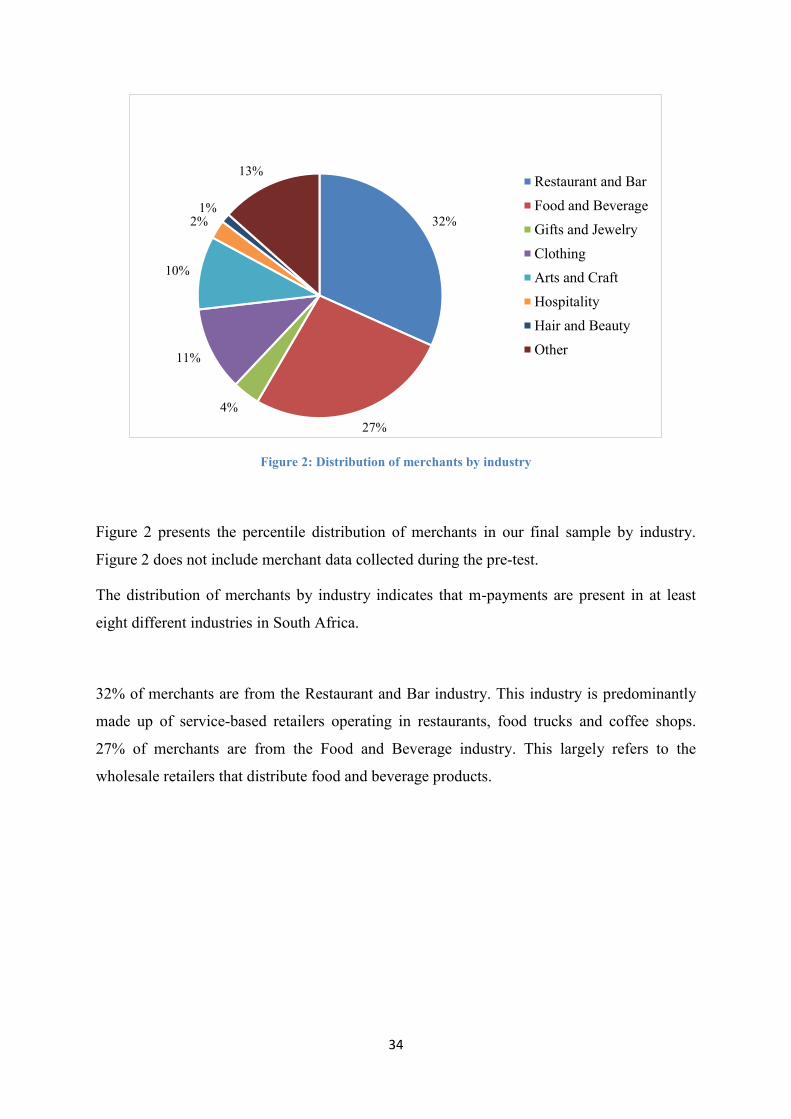
Figure 2: Distribution of merchants by industry
Figure 2 presents the percentile distribution of merchants in our final sample by industry.
Figure 2 does not include merchant data collected during the pre-test.
The distribution of merchants by industry indicates that m-payments are present in at least
eight different industries in South Africa.
32% of merchants are from the Restaurant and Bar industry. This industry is predominantly
made up of service-based retailers operating in restaurants, food trucks and coffee shops.
27% of merchants are from the Food and Beverage industry. This largely refers to the
wholesale retailers that distribute food and beverage products.
32%
27%4%
11%
10%
2%1%
13%Restaurant and BarFood and BeverageGifts and JewelryClothingArts and CraftHospitalityHair and BeautyOther
35
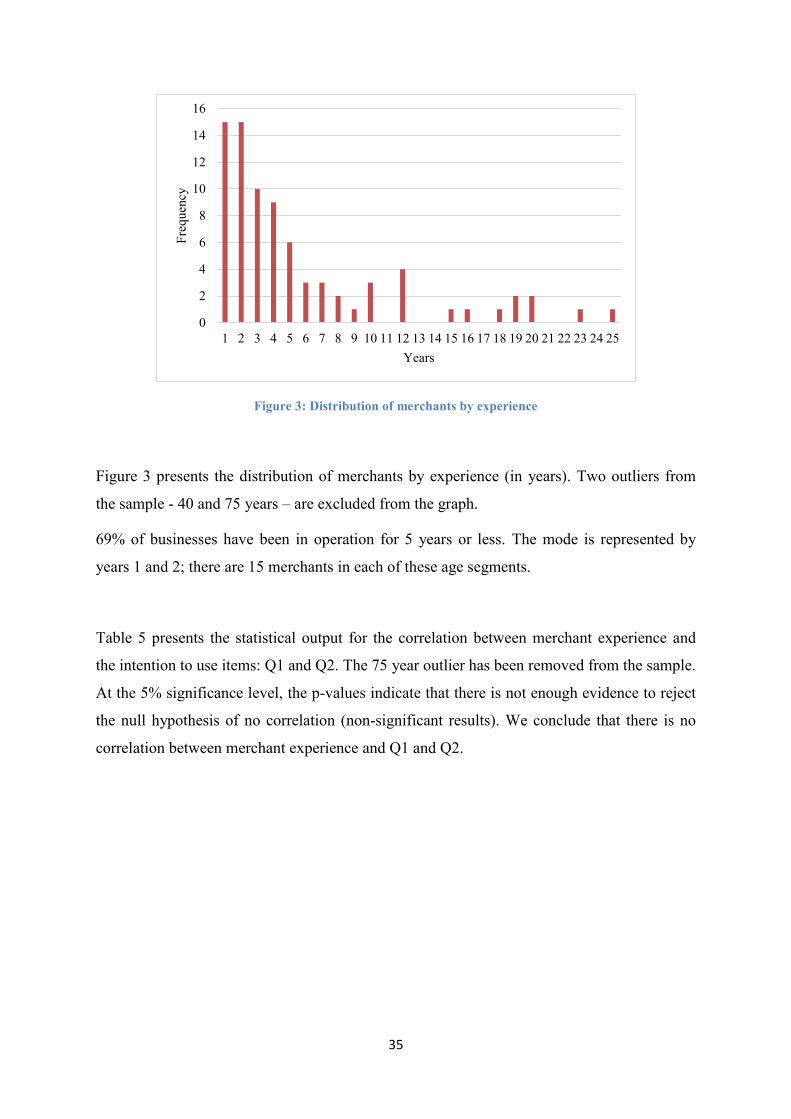
Figure 3: Distribution of merchants by experience
Figure 3 presents the distribution of merchants by experience (in years). Two outliers from
the sample - 40 and 75 years – are excluded from the graph.
69% of businesses have been in operation for 5 years or less. The mode is represented by
years 1 and 2; there are 15 merchants in each of these age segments.
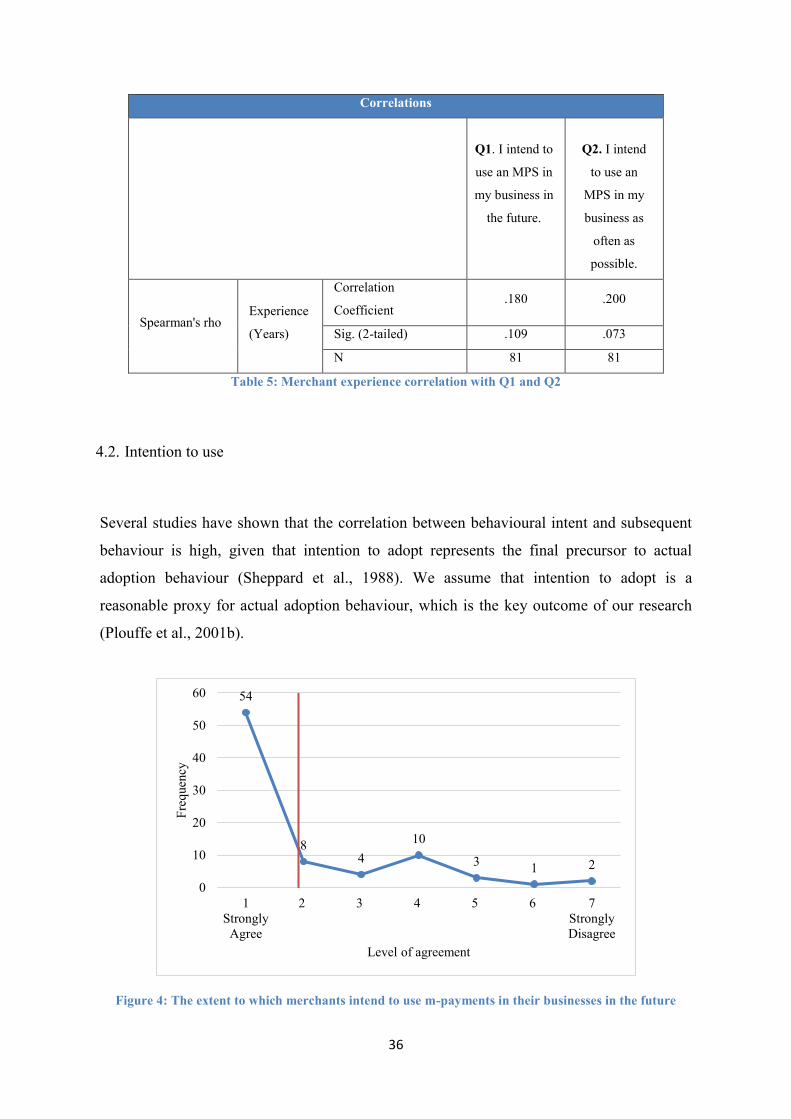
Table 5 presents the statistical output for the correlation between merchant experience and
the intention to use items: Q1 and Q2. The 75 year outlier has been removed from the sample.
At the 5% significance level, the p-values indicate that there is not enough evidence to reject
the null hypothesis of no correlation (non-significant results). We conclude that there is no
correlation between merchant experience and Q1 and Q2.
0
2
4
6
8
10
12
14
16
1 2 3 4 5 6 7 8 9 10 11 12 13 14 15 16 17 18 19 20 21 22 23 24 25
Freq
uenc
y
Years
36
Correlations
Q1. I intend to
use an MPS in
my business in
the future.
Q2. I intend
to use an
MPS in my
business as
often as
possible.
Spearman's rho Experience
(Years)
Correlation
Coefficient .180 .200
Sig. (2-tailed) .109 .073
N 81 81
Table 5: Merchant experience correlation with Q1 and Q2
4.2. Intention to use
Several studies have shown that the correlation between behavioural intent and subsequent
behaviour is high, given that intention to adopt represents the final precursor to actual
adoption behaviour (Sheppard et al., 1988). We assume that intention to adopt is a
reasonable proxy for actual adoption behaviour, which is the key outcome of our research
(Plouffe et al., 2001b).
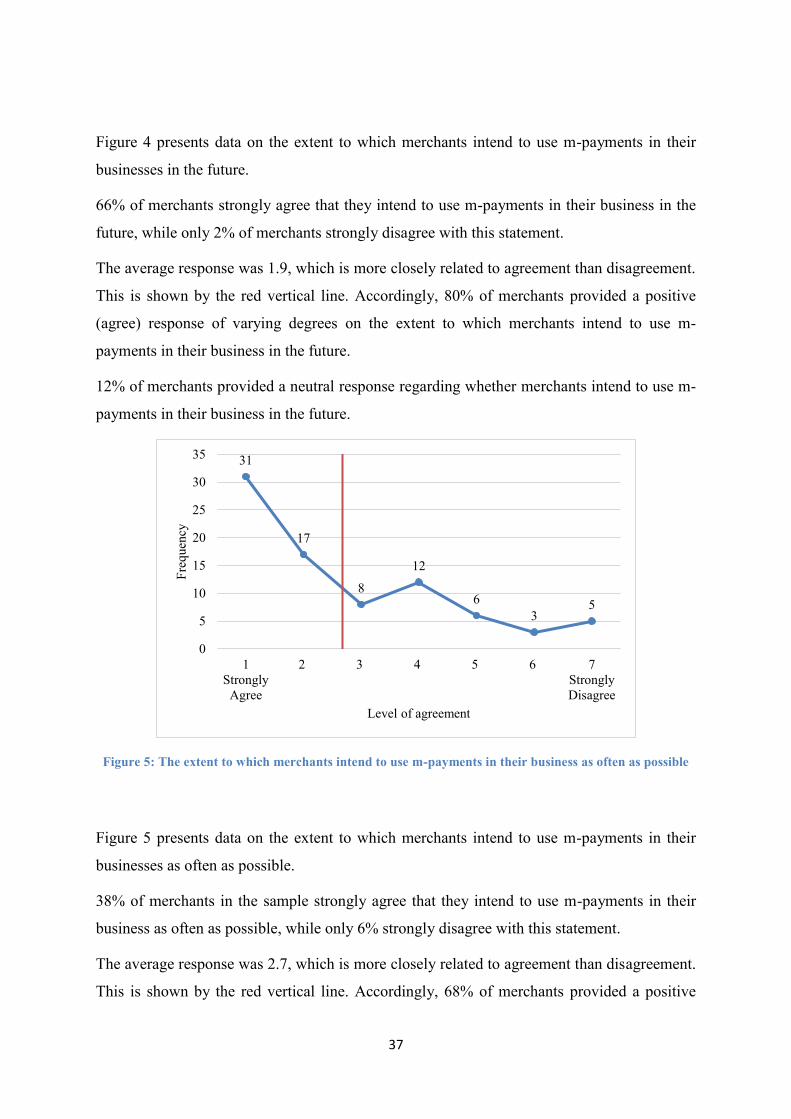
Figure 4: The extent to which merchants intend to use m-payments in their businesses in the future
54
84
10
3 1 2
0
10
20
30
40
50
60
1Strongly
Agree
2 3 4 5 6 7StronglyDisagree
Freq
uenc
y
Level of agreement
37
Figure 4 presents data on the extent to which merchants intend to use m-payments in their
businesses in the future.
66% of merchants strongly agree that they intend to use m-payments in their business in the
future, while only 2% of merchants strongly disagree with this statement.
The average response was 1.9, which is more closely related to agreement than disagreement.
This is shown by the red vertical line. Accordingly, 80% of merchants provided a positive
(agree) response of varying degrees on the extent to which merchants intend to use m-
payments in their business in the future.
12% of merchants provided a neutral response regarding whether merchants intend to use m-
payments in their business in the future.
Figure 5: The extent to which merchants intend to use m-payments in their business as often as possible
Figure 5 presents data on the extent to which merchants intend to use m-payments in their
businesses as often as possible.
38% of merchants in the sample strongly agree that they intend to use m-payments in their
business as often as possible, while only 6% strongly disagree with this statement.
The average response was 2.7, which is more closely related to agreement than disagreement.
This is shown by the red vertical line. Accordingly, 68% of merchants provided a positive
31
17
8
12
63
5
0
5
10
15
20
25
30
35
1Strongly
Agree
2 3 4 5 6 7StronglyDisagree
Freq
uenc
y
Level of agreement

38
(agree) response of varying degrees on the extent to which merchants intend to use m-
payments in their businesses as often as possible.
15% of merchants provided a neutral response regarding whether merchants intend to use m-
payments in their business as often as possible.
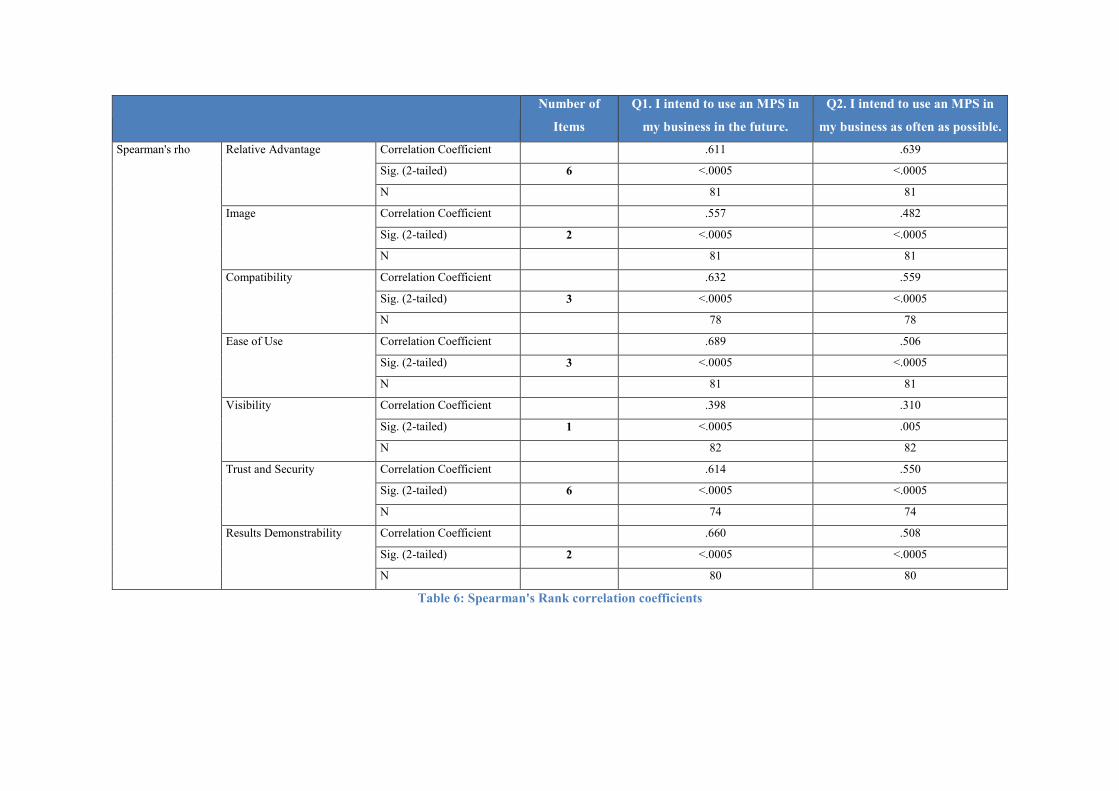
Number of
Items
Q1. I intend to use an MPS in
my business in the future.
Q2. I intend to use an MPS in
my business as often as possible.
Spearman's rho Relative Advantage Correlation Coefficient .611 .639
Sig. (2-tailed) 6 <.0005 <.0005
N 81 81
Image Correlation Coefficient .557 .482
Sig. (2-tailed) 2 <.0005 <.0005
N 81 81
Compatibility Correlation Coefficient .632 .559
Sig. (2-tailed) 3 <.0005 <.0005
N 78 78
Ease of Use Correlation Coefficient .689 .506
Sig. (2-tailed) 3 <.0005 <.0005
N 81 81
Visibility Correlation Coefficient .398 .310
Sig. (2-tailed) 1 <.0005 .005
N 82 82
Trust and Security Correlation Coefficient .614 .550
Sig. (2-tailed) 6 <.0005 <.0005
N 74 74
Results Demonstrability Correlation Coefficient .660 .508
Sig. (2-tailed) 2 <.0005 <.0005
N 80 80
Table 6: Spearman's Rank correlation coefficients
Table 6 presents Spearman’s rank correlation coefficient between each of the seven
constructs in our questionnaire and the intention to use items: Q1 and Q2. All the p-values are
small and below the conventional significance level of 0.05, suggesting that there is evidence
to reject the null hypotheses of no correlation. We conclude that, at the 5% significance level,
all correlations are significant.
The Spearman’s rank coefficients range between 0.398 and 0.689 in Q1, and 0.31 and 0.639
in Q2.
There is a strong positive correlation between relative advantage and Q1 and Q2.
There is a moderate positive correlation between image and Q1 and Q2.
There is a strong positive correlation between compatibility and Q1, and a moderate positive
relationship between compatibility and Q2.
There is a strong positive correlation between ease of use and Q1, and a moderate positive
relationship between ease of use and Q2.
There is a weak positive correlation between visibility and Q1 and Q2.
There is a strong positive correlation between trust and security and Q1, and a moderate
positive relationship between trust and security and Q2.
There is a strong positive correlation between results demonstrability and Q1, and a moderate
positive relationship between demonstrability and Q2.
4.3. Construct analysis
Section 4.3 presents an analysis of each of the seven constructs. For each construct, we
present selected line graphs, a box plot, and a histogram analysis. The box plot and histogram
are segmented by nonparticipating merchants (No), participating merchants (Yes), and all
merchants (All). Table 7 presents a summary of the construct results.
The y-axis on each box plot and the x-axis on each histogram is labelled as the construct in
question, and represents the total construct score. This is equal to the sum of the items that
form the construct.
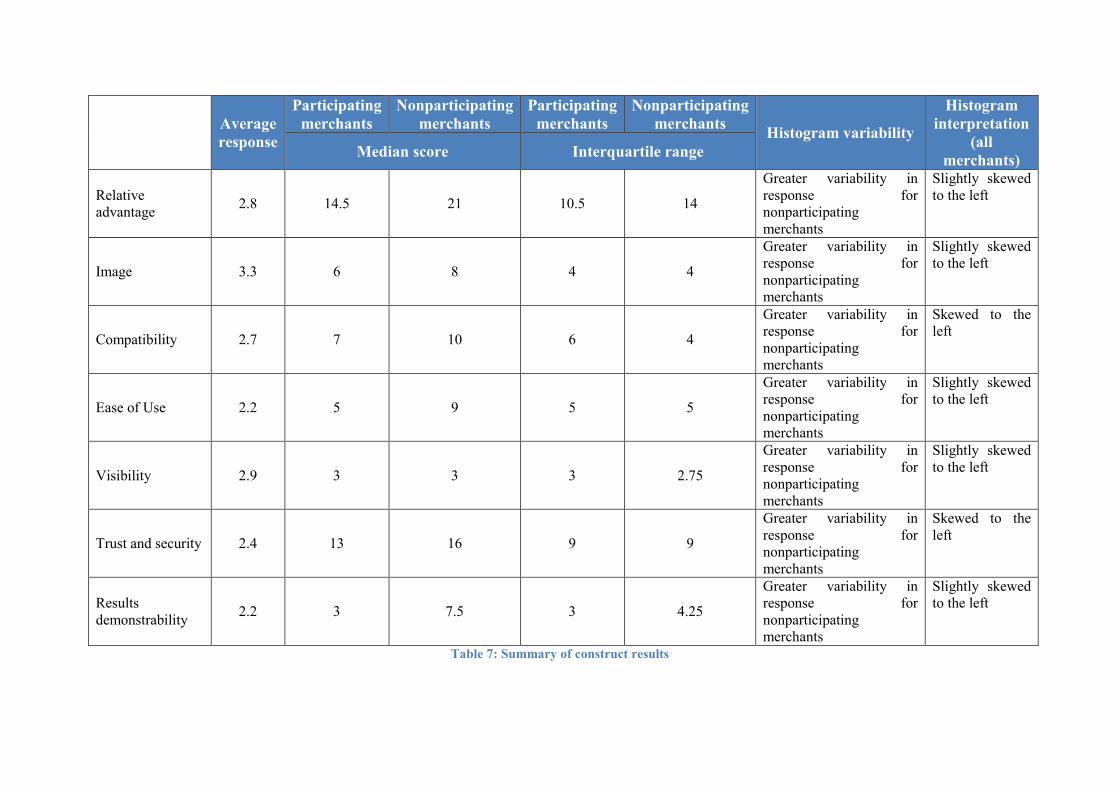
Average response
Participating merchants
Nonparticipating merchants
Participating merchants
Nonparticipating merchants Histogram variability
Histogram interpretation
(all merchants) Median score Interquartile range
Relative advantage 2.8 14.5 21 10.5 14
Greater variability in response for nonparticipating merchants
Slightly skewed to the left
Image 3.3 6 8 4 4
Greater variability in response for nonparticipating merchants
Slightly skewed to the left
Compatibility 2.7 7 10 6 4
Greater variability in response for nonparticipating merchants
Skewed to the left
Ease of Use 2.2 5 9 5 5
Greater variability in response for nonparticipating merchants
Slightly skewed to the left
Visibility 2.9 3 3 3 2.75
Greater variability in response for nonparticipating merchants
Slightly skewed to the left
Trust and security 2.4 13 16 9 9
Greater variability in response for nonparticipating merchants
Skewed to the left
Results demonstrability 2.2 3 7.5 3 4.25
Greater variability in response for nonparticipating merchants
Slightly skewed to the left
Table 7: Summary of construct results
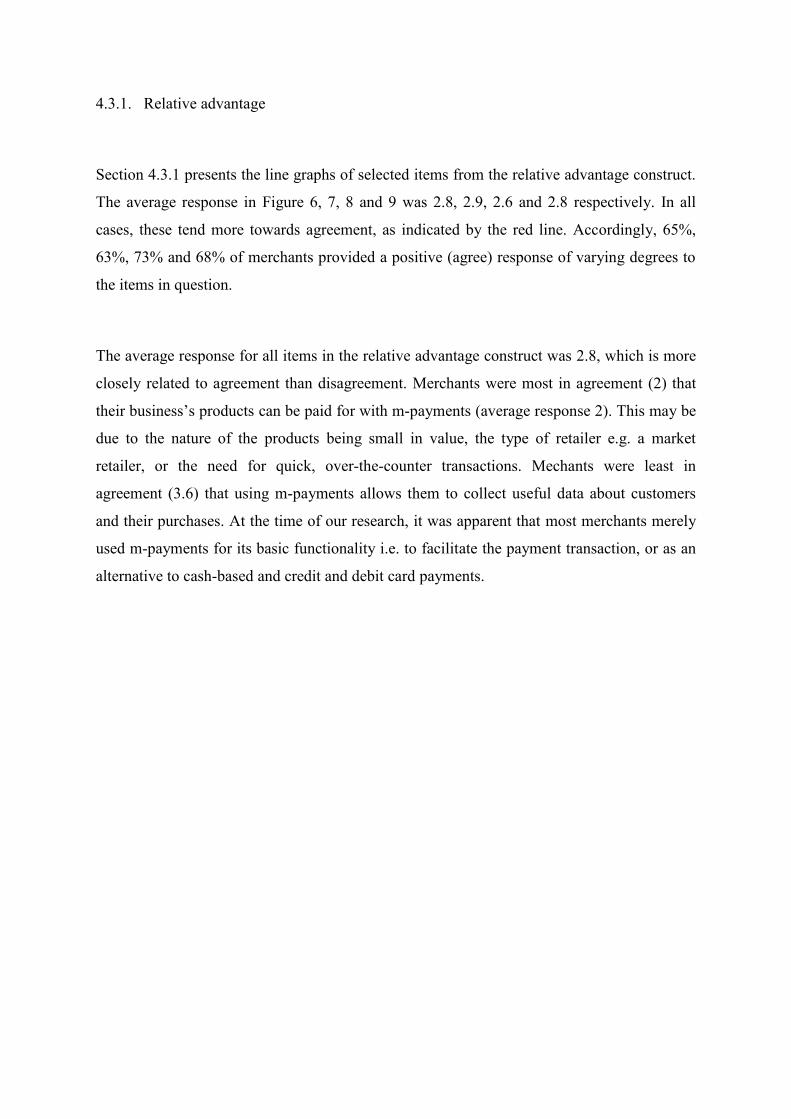
4.3.1. Relative advantage
Section 4.3.1 presents the line graphs of selected items from the relative advantage construct.
The average response in Figure 6, 7, 8 and 9 was 2.8, 2.9, 2.6 and 2.8 respectively. In all
cases, these tend more towards agreement, as indicated by the red line. Accordingly, 65%,
63%, 73% and 68% of merchants provided a positive (agree) response of varying degrees to
the items in question.
The average response for all items in the relative advantage construct was 2.8, which is more
closely related to agreement than disagreement. Merchants were most in agreement (2) that
their business’s products can be paid for with m-payments (average response 2). This may be
due to the nature of the products being small in value, the type of retailer e.g. a market
retailer, or the need for quick, over-the-counter transactions. Mechants were least in
agreement (3.6) that using m-payments allows them to collect useful data about customers
and their purchases. At the time of our research, it was apparent that most merchants merely
used m-payments for its basic functionality i.e. to facilitate the payment transaction, or as an
alternative to cash-based and credit and debit card payments.

Figure 6: The extent to which m-payments increase business sales
Figure 7: The extent to which m-payments increase impulse purchases
Figure 8: The extent to which paying with a mobile phone speeds up
payments
Figure 9: The extent to which using m-payments enhances the merchant's
effectiveness on the job
34
9 1013
5 47
05
10152025303540
1Strongly
Agree
2 3 4 5 6 7StronglyDisagree
Freq
uenc
y
Level of agreement
30
139
127
47
05
101520253035
1Strongly
Agree
2 3 4 5 6 7StronglyDisagree
Freq
uenc
y
Level of agreement
30
16 1410
5 52
05
101520253035
1Strongly
Agree
2 3 4 5 6 7StronglyDisagree
Freq
uenc
y
Level of agreement
26
1416
13
6 6
1
0
5
10
15
20
25
30
1Strongly
Agree
2 3 4 5 6 7StronglyDisagree
Freq
uenc
yLevel of agreement
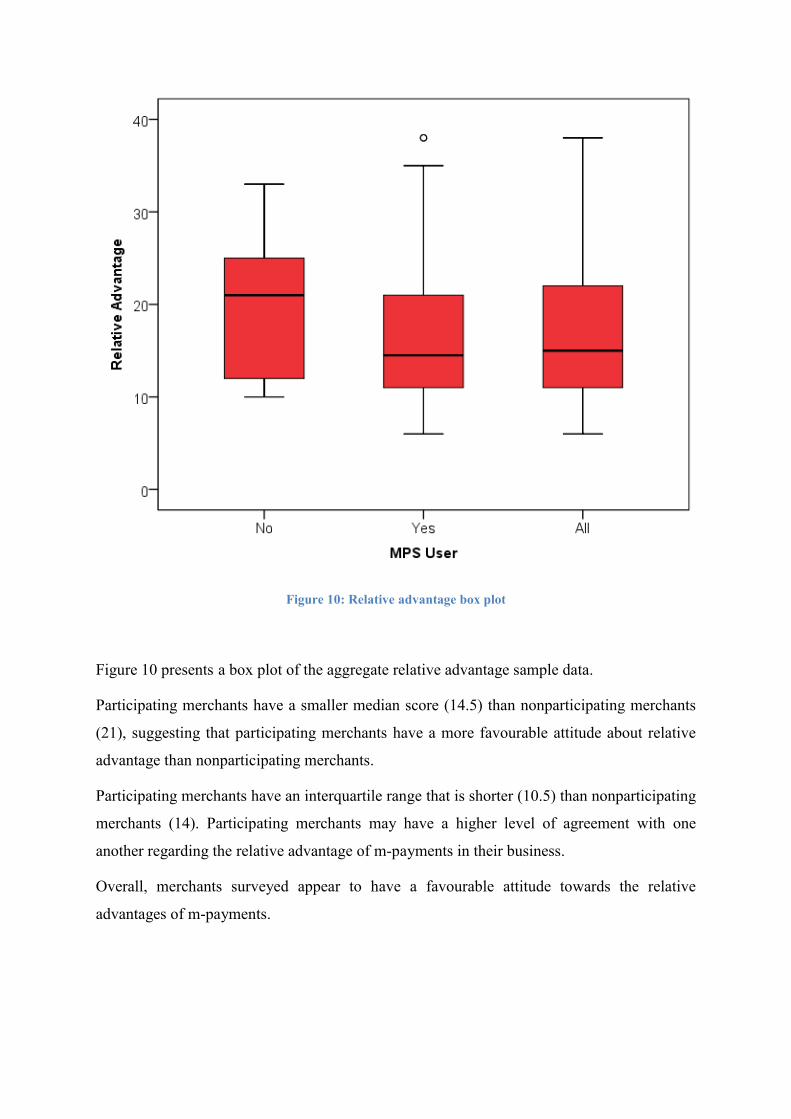
Figure 10: Relative advantage box plot
Figure 10 presents a box plot of the aggregate relative advantage sample data.
Participating merchants have a smaller median score (14.5) than nonparticipating merchants
(21), suggesting that participating merchants have a more favourable attitude about relative
advantage than nonparticipating merchants.
Participating merchants have an interquartile range that is shorter (10.5) than nonparticipating
merchants (14). Participating merchants may have a higher level of agreement with one
another regarding the relative advantage of m-payments in their business.
Overall, merchants surveyed appear to have a favourable attitude towards the relative
advantages of m-payments.
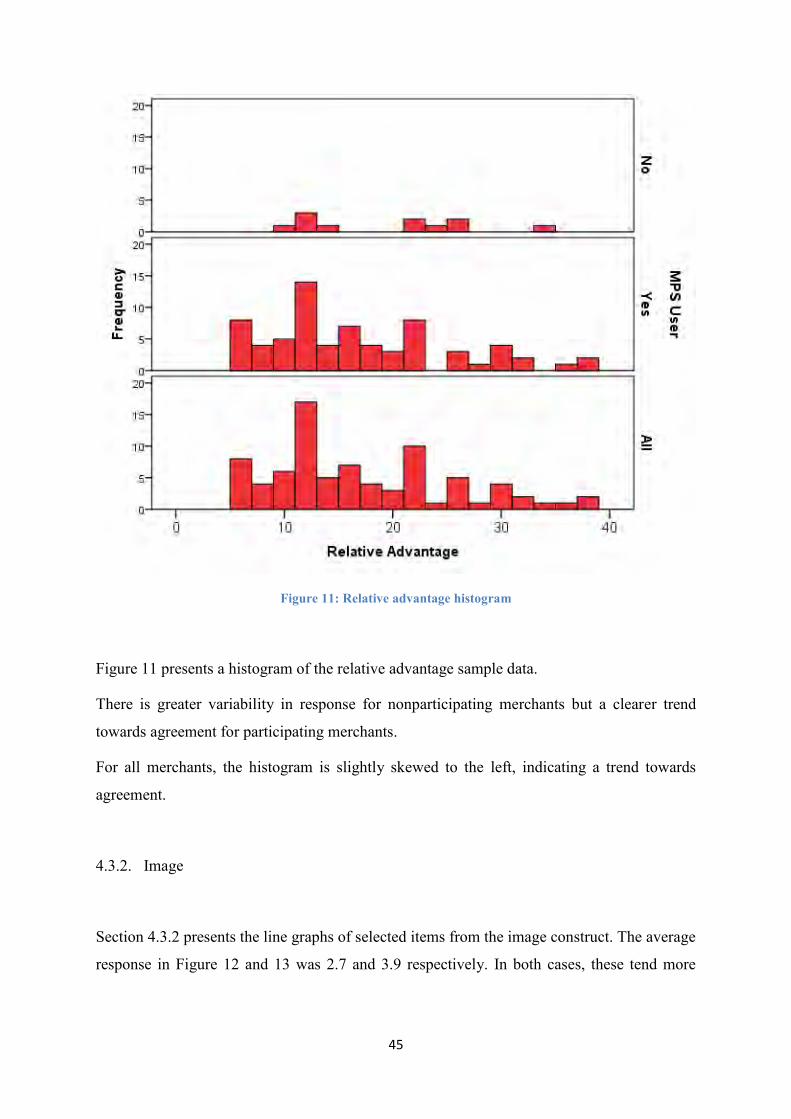
45
Figure 11: Relative advantage histogram
Figure 11 presents a histogram of the relative advantage sample data.
There is greater variability in response for nonparticipating merchants but a clearer trend
towards agreement for participating merchants.
For all merchants, the histogram is slightly skewed to the left, indicating a trend towards
agreement.
4.3.2. Image
Section 4.3.2 presents the line graphs of selected items from the image construct. The average
response in Figure 12 and 13 was 2.7 and 3.9 respectively. In both cases, these tend more
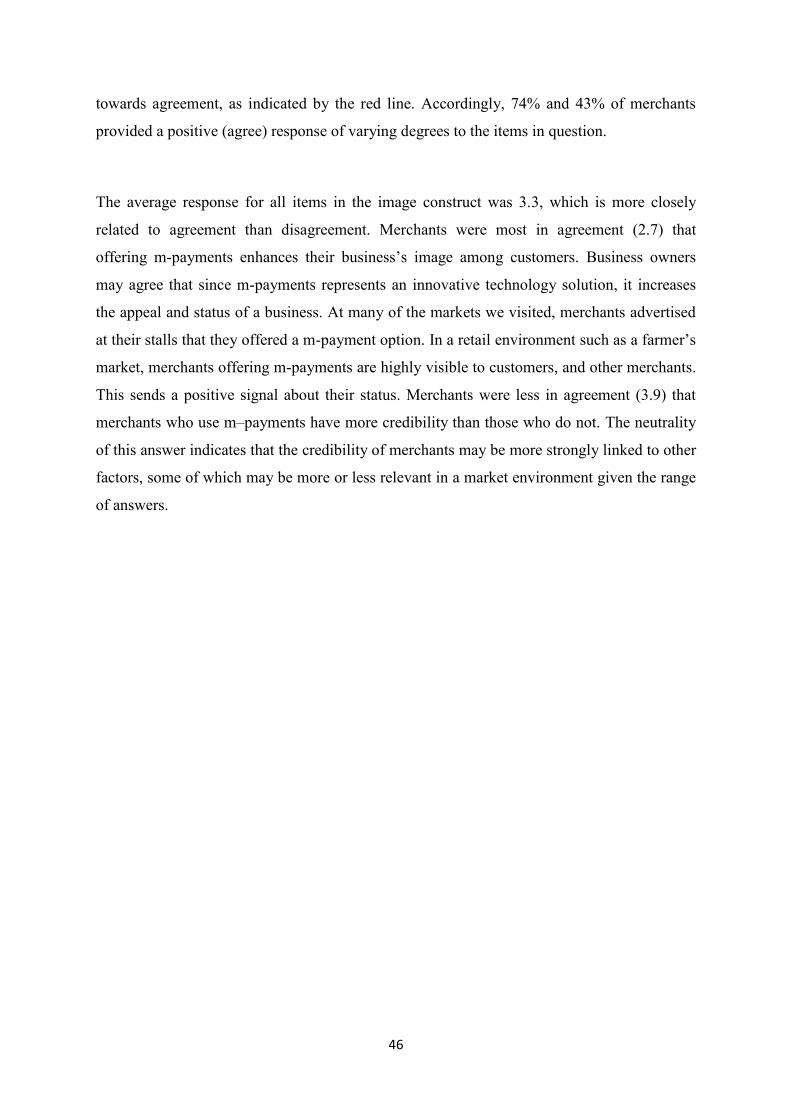
46
towards agreement, as indicated by the red line. Accordingly, 74% and 43% of merchants
provided a positive (agree) response of varying degrees to the items in question.
The average response for all items in the image construct was 3.3, which is more closely
related to agreement than disagreement. Merchants were most in agreement (2.7) that
offering m-payments enhances their business’s image among customers. Business owners
may agree that since m-payments represents an innovative technology solution, it increases
the appeal and status of a business. At many of the markets we visited, merchants advertised
at their stalls that they offered a m-payment option. In a retail environment such as a farmer’s
market, merchants offering m-payments are highly visible to customers, and other merchants.
This sends a positive signal about their status. Merchants were less in agreement (3.9) that
merchants who use m–payments have more credibility than those who do not. The neutrality
of this answer indicates that the credibility of merchants may be more strongly linked to other
factors, some of which may be more or less relevant in a market environment given the range
of answers.
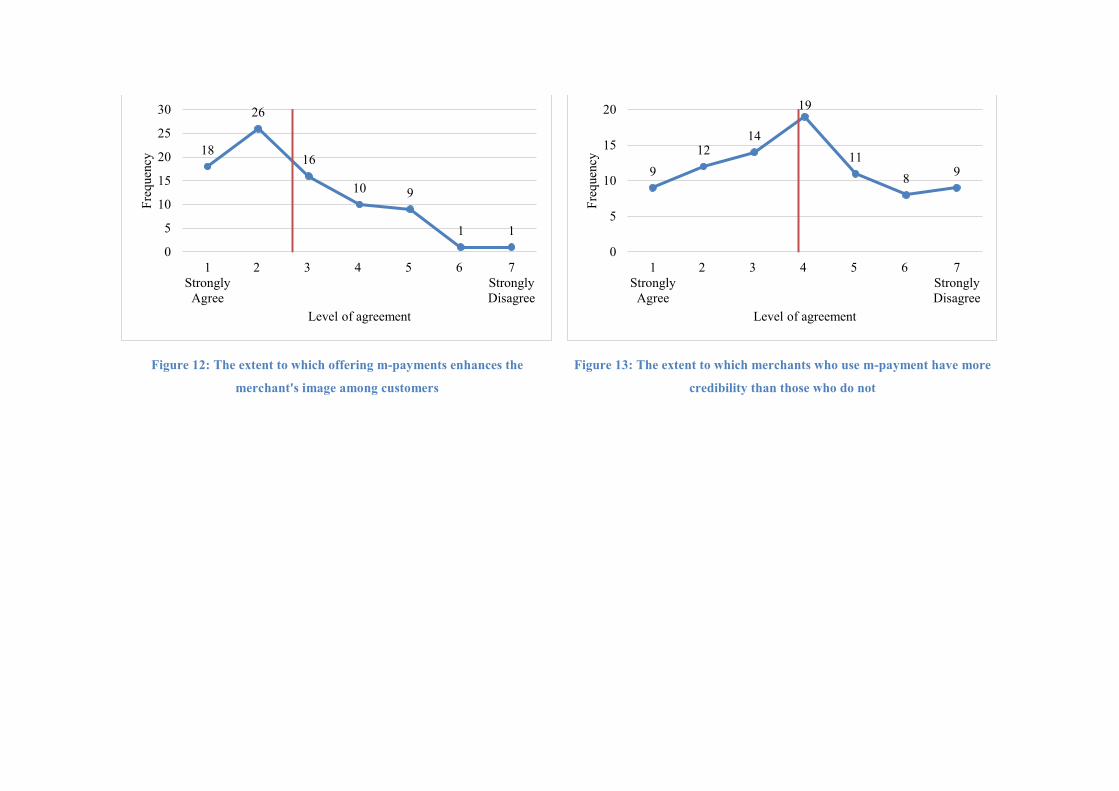
Figure 12: The extent to which offering m-payments enhances the
merchant's image among customers
Figure 13: The extent to which merchants who use m-payment have more
credibility than those who do not
18
26
16
10 9
1 10
5
10
15
20
25
30
1Strongly
Agree
2 3 4 5 6 7StronglyDisagree
Freq
uenc
y
Level of agreement
912
14
19
118 9
0
5
10
15
20
1Strongly
Agree
2 3 4 5 6 7StronglyDisagree
Freq
uenc
y
Level of agreement
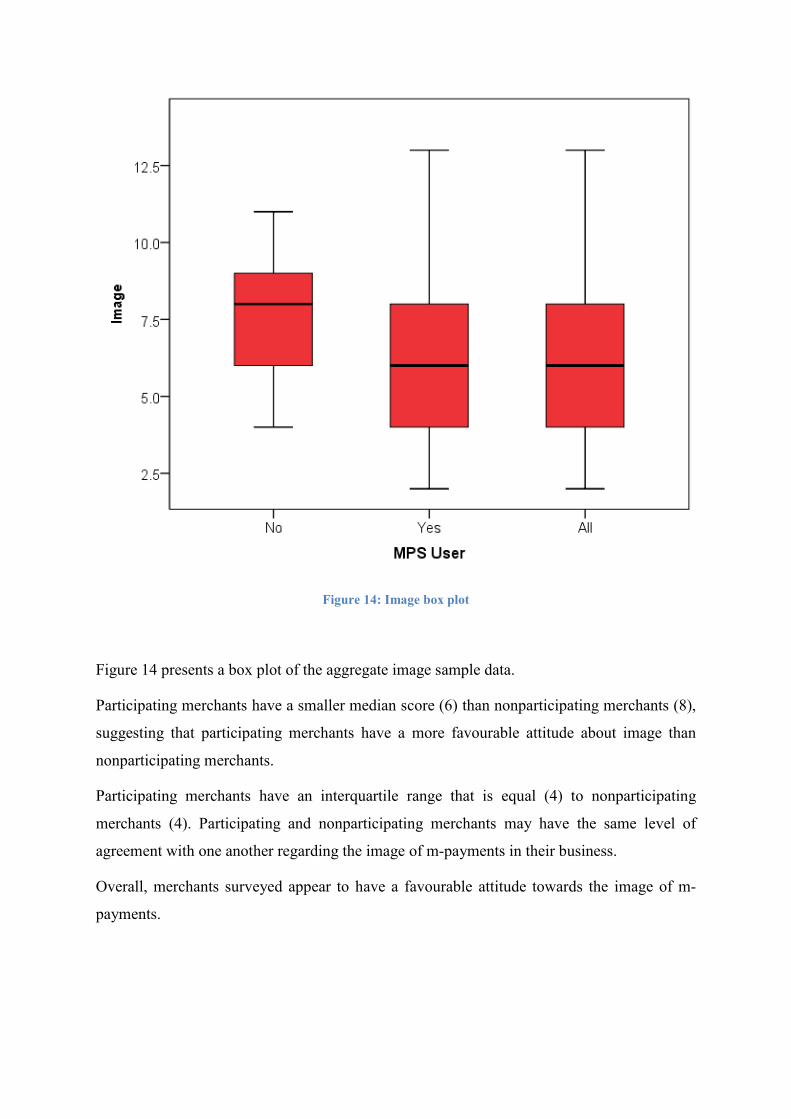
Figure 14: Image box plot
Figure 14 presents a box plot of the aggregate image sample data.
Participating merchants have a smaller median score (6) than nonparticipating merchants (8),
suggesting that participating merchants have a more favourable attitude about image than
nonparticipating merchants.
Participating merchants have an interquartile range that is equal (4) to nonparticipating
merchants (4). Participating and nonparticipating merchants may have the same level of
agreement with one another regarding the image of m-payments in their business.
Overall, merchants surveyed appear to have a favourable attitude towards the image of m-
payments.
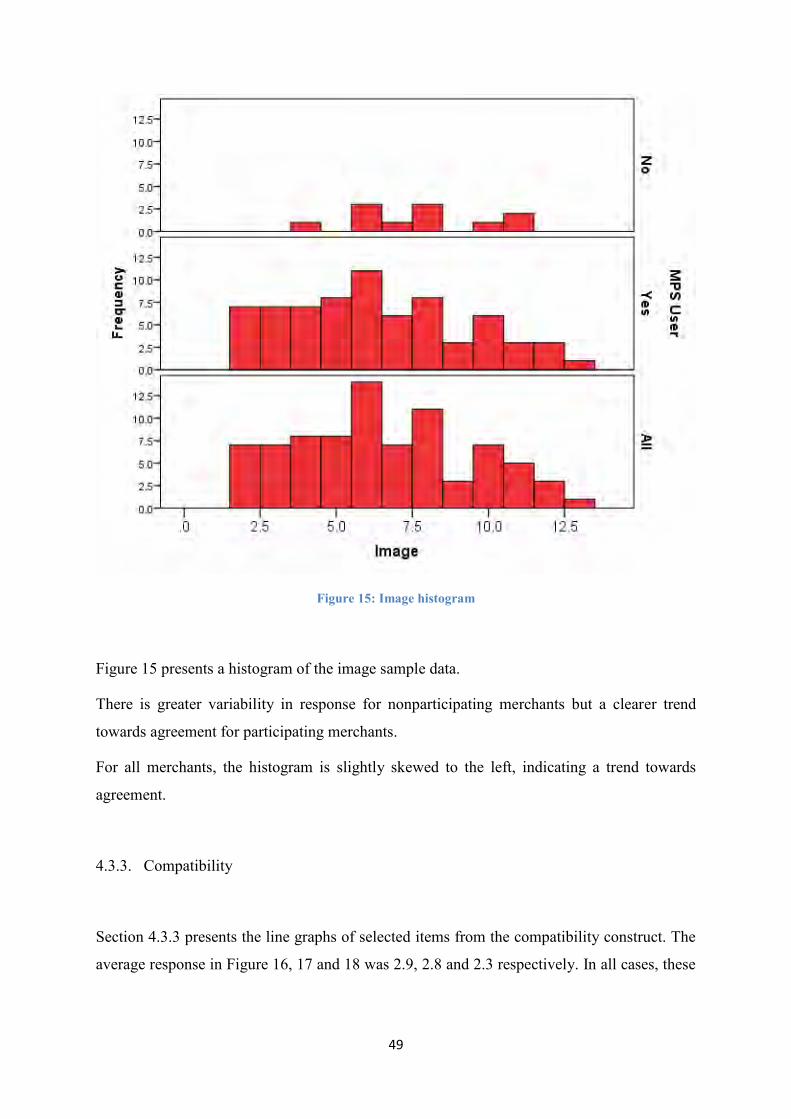
49
Figure 15: Image histogram
Figure 15 presents a histogram of the image sample data.
There is greater variability in response for nonparticipating merchants but a clearer trend
towards agreement for participating merchants.
For all merchants, the histogram is slightly skewed to the left, indicating a trend towards
agreement.
4.3.3. Compatibility
Section 4.3.3 presents the line graphs of selected items from the compatibility construct. The
average response in Figure 16, 17 and 18 was 2.9, 2.8 and 2.3 respectively. In all cases, these

50
tend more towards agreement, as indicated by the red line. Accordingly, 67%, 68% and 62%
of merchants provided a positive (agree) response of varying degrees to the items in question.
The average response for all items in the compatibility construct was 2.7, which is more
closely related to agreement than disagreement. Merchants were most in agreement (2.3) that
m-payments are compatible with their business’s POS system. This may be due to the easy
sign up and integration with many different POS systems offfered by service providers.
Similarly, mechants were in agreement that: m-payments are compatible with all aspects of
their business’s sales transactions (2.9); and using m-payments fits well with the way their
staff and they like to receive payment for goods and services (2.8). This may be due to factors
that may include compatibility with micropurchases, the business’s products and services,
existing business operations or practices, and work routines. Additionally, this is likely linked
to higher levels of standardisation.
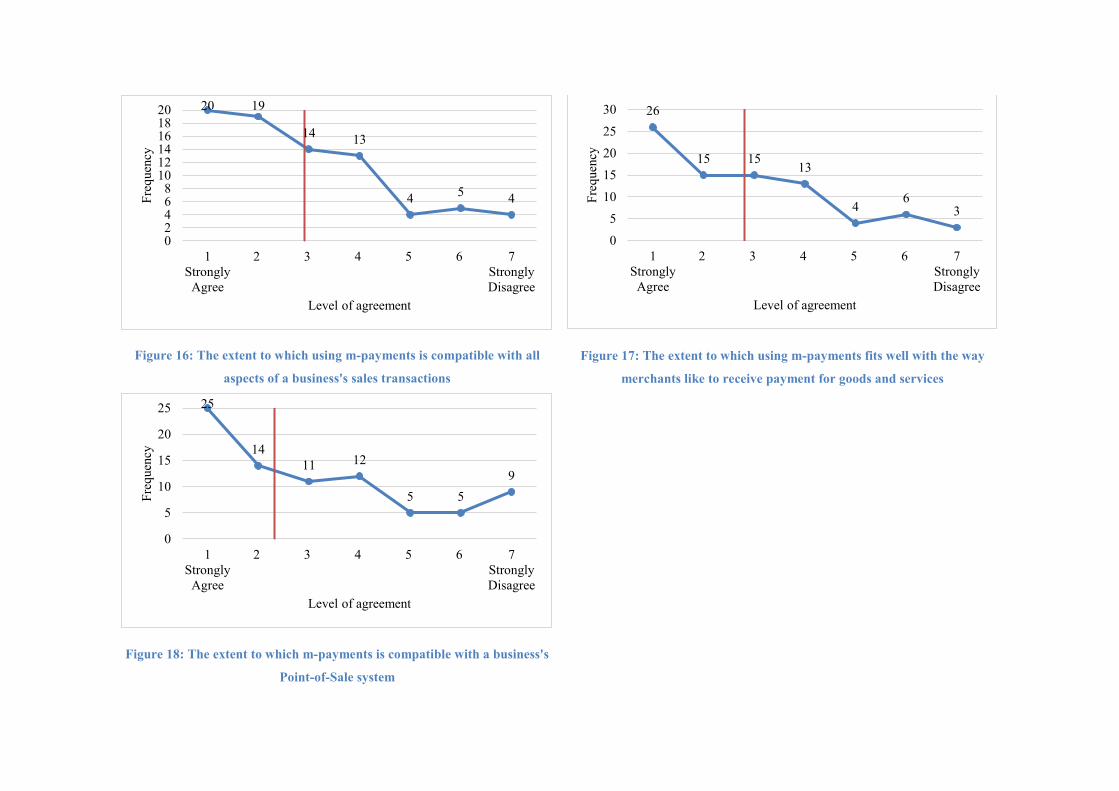
Figure 16: The extent to which using m-payments is compatible with all
aspects of a business's sales transactions
Figure 17: The extent to which using m-payments fits well with the way
merchants like to receive payment for goods and services
Figure 18: The extent to which m-payments is compatible with a business's
Point-of-Sale system
20 19
14 13
4 5 4
02468
101214161820
1Strongly
Agree
2 3 4 5 6 7StronglyDisagree
Freq
uenc
y
Level of agreement
26
15 1513
46
3
0
5
10
15
20
25
30
1Strongly
Agree
2 3 4 5 6 7StronglyDisagree
Freq
uenc
y
Level of agreement
25
1411 12
5 59
0
5
10
15
20
25
1Strongly
Agree
2 3 4 5 6 7StronglyDisagree
Freq
uenc
y
Level of agreement
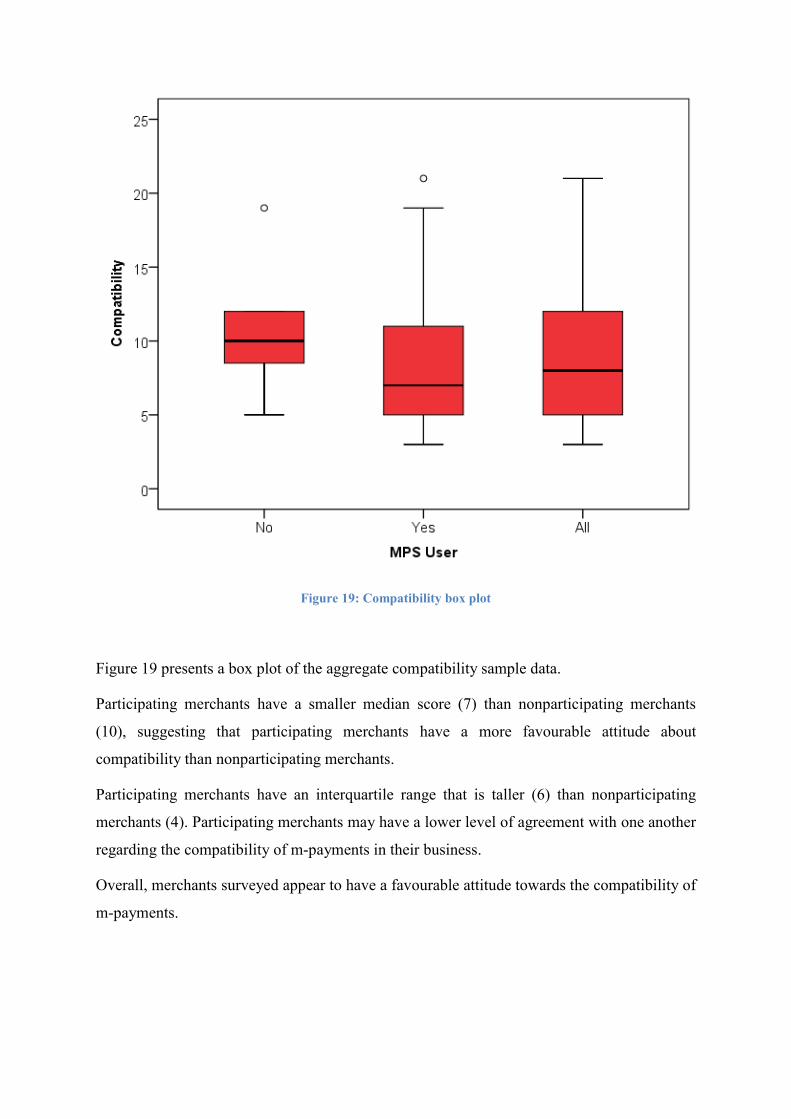
Figure 19: Compatibility box plot
Figure 19 presents a box plot of the aggregate compatibility sample data.
Participating merchants have a smaller median score (7) than nonparticipating merchants
(10), suggesting that participating merchants have a more favourable attitude about
compatibility than nonparticipating merchants.
Participating merchants have an interquartile range that is taller (6) than nonparticipating
merchants (4). Participating merchants may have a lower level of agreement with one another
regarding the compatibility of m-payments in their business.
Overall, merchants surveyed appear to have a favourable attitude towards the compatibility of
m-payments.
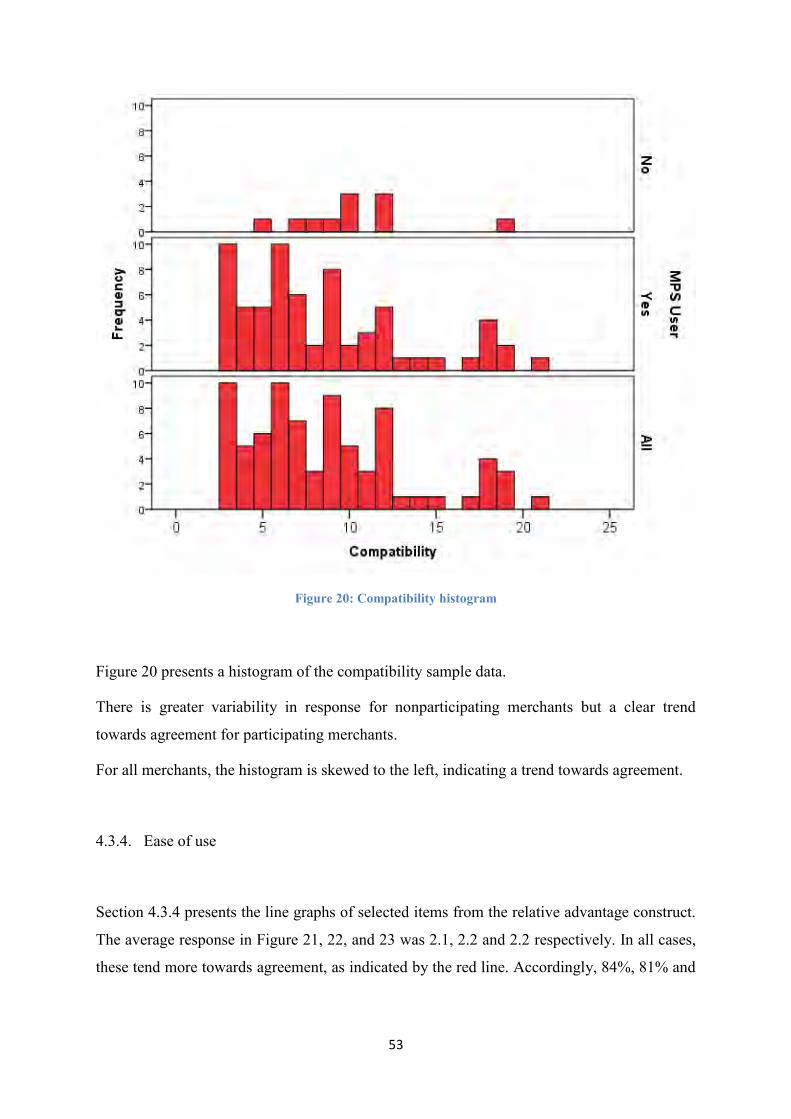
53
Figure 20: Compatibility histogram
Figure 20 presents a histogram of the compatibility sample data.
There is greater variability in response for nonparticipating merchants but a clear trend
towards agreement for participating merchants.
For all merchants, the histogram is skewed to the left, indicating a trend towards agreement.
4.3.4. Ease of use
Section 4.3.4 presents the line graphs of selected items from the relative advantage construct.
The average response in Figure 21, 22, and 23 was 2.1, 2.2 and 2.2 respectively. In all cases,
these tend more towards agreement, as indicated by the red line. Accordingly, 84%, 81% and
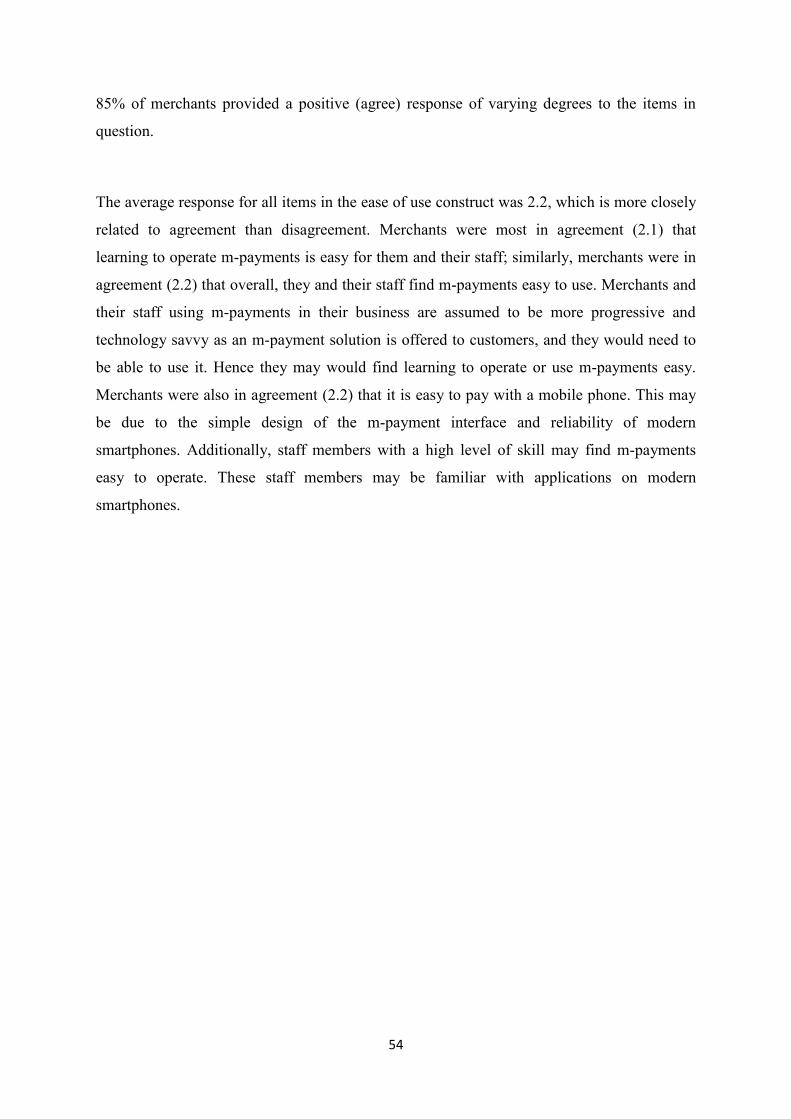
54
85% of merchants provided a positive (agree) response of varying degrees to the items in
question.
The average response for all items in the ease of use construct was 2.2, which is more closely
related to agreement than disagreement. Merchants were most in agreement (2.1) that
learning to operate m-payments is easy for them and their staff; similarly, merchants were in
agreement (2.2) that overall, they and their staff find m-payments easy to use. Merchants and
their staff using m-payments in their business are assumed to be more progressive and
technology savvy as an m-payment solution is offered to customers, and they would need to
be able to use it. Hence they may would find learning to operate or use m-payments easy.
Merchants were also in agreement (2.2) that it is easy to pay with a mobile phone. This may
be due to the simple design of the m-payment interface and reliability of modern
smartphones. Additionally, staff members with a high level of skill may find m-payments
easy to operate. These staff members may be familiar with applications on modern
smartphones.
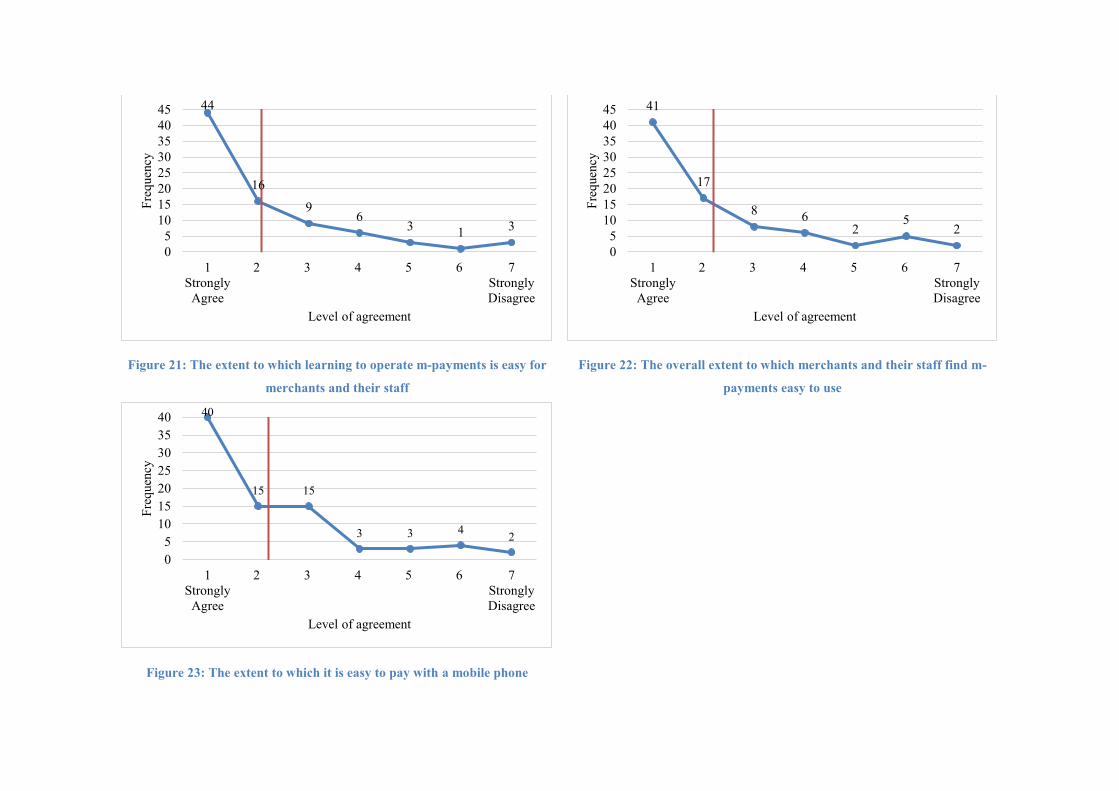
Figure 21: The extent to which learning to operate m-payments is easy for
merchants and their staff
Figure 22: The overall extent to which merchants and their staff find m-
payments easy to use
Figure 23: The extent to which it is easy to pay with a mobile phone
44
16
96
3 1 3
05
1015202530354045
1Strongly
Agree
2 3 4 5 6 7StronglyDisagree
Freq
uenc
y
Level of agreement
41
17
8 62
52
05
1015202530354045
1Strongly
Agree
2 3 4 5 6 7StronglyDisagree
Freq
uenc
y
Level of agreement
40
15 15
3 3 4 2
05
10152025303540
1Strongly
Agree
2 3 4 5 6 7StronglyDisagree
Freq
uenc
y
Level of agreement
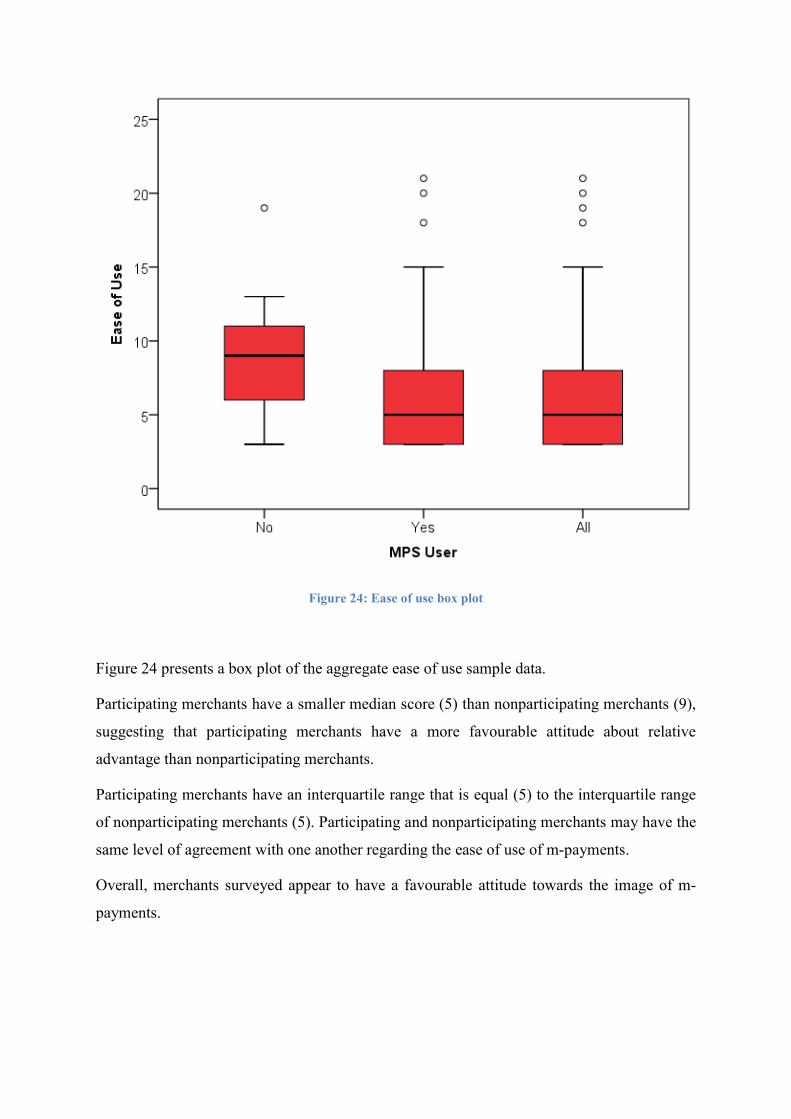
Figure 24: Ease of use box plot
Figure 24 presents a box plot of the aggregate ease of use sample data.
Participating merchants have a smaller median score (5) than nonparticipating merchants (9),
suggesting that participating merchants have a more favourable attitude about relative
advantage than nonparticipating merchants.
Participating merchants have an interquartile range that is equal (5) to the interquartile range
of nonparticipating merchants (5). Participating and nonparticipating merchants may have the
same level of agreement with one another regarding the ease of use of m-payments.
Overall, merchants surveyed appear to have a favourable attitude towards the image of m-
payments.
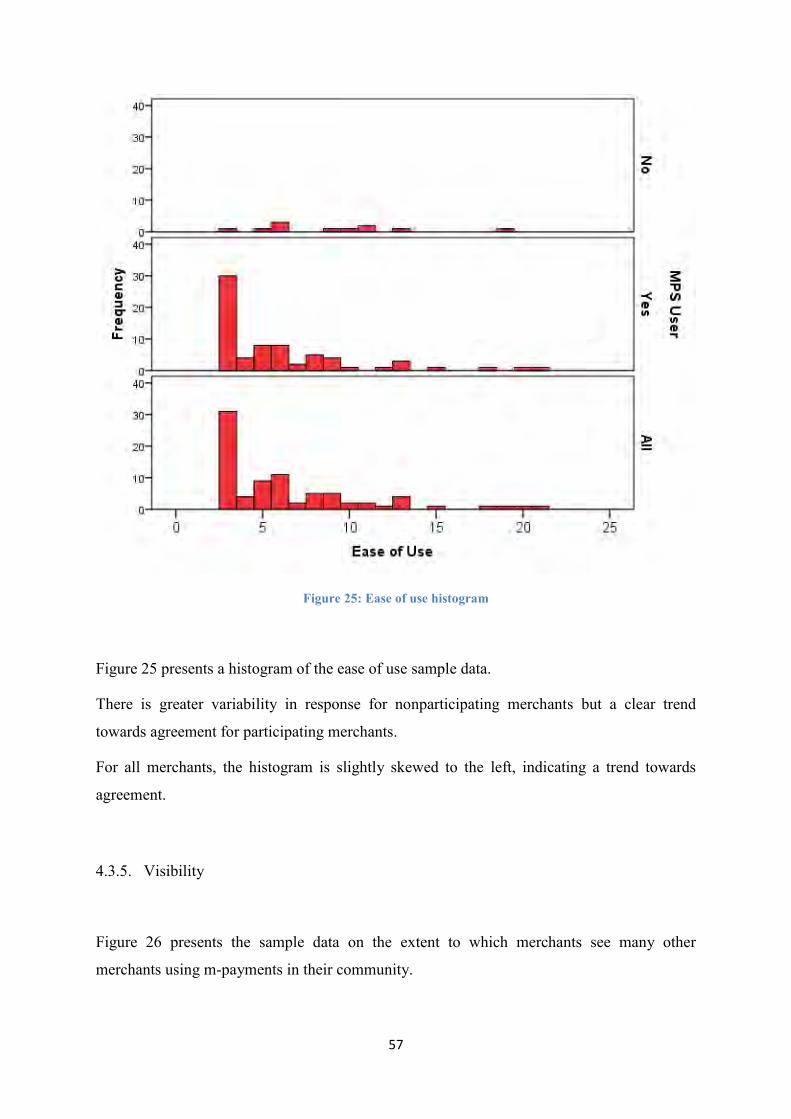
57
Figure 25: Ease of use histogram
Figure 25 presents a histogram of the ease of use sample data.
There is greater variability in response for nonparticipating merchants but a clear trend
towards agreement for participating merchants.
For all merchants, the histogram is slightly skewed to the left, indicating a trend towards
agreement.
4.3.5. Visibility
Figure 26 presents the sample data on the extent to which merchants see many other
merchants using m-payments in their community.
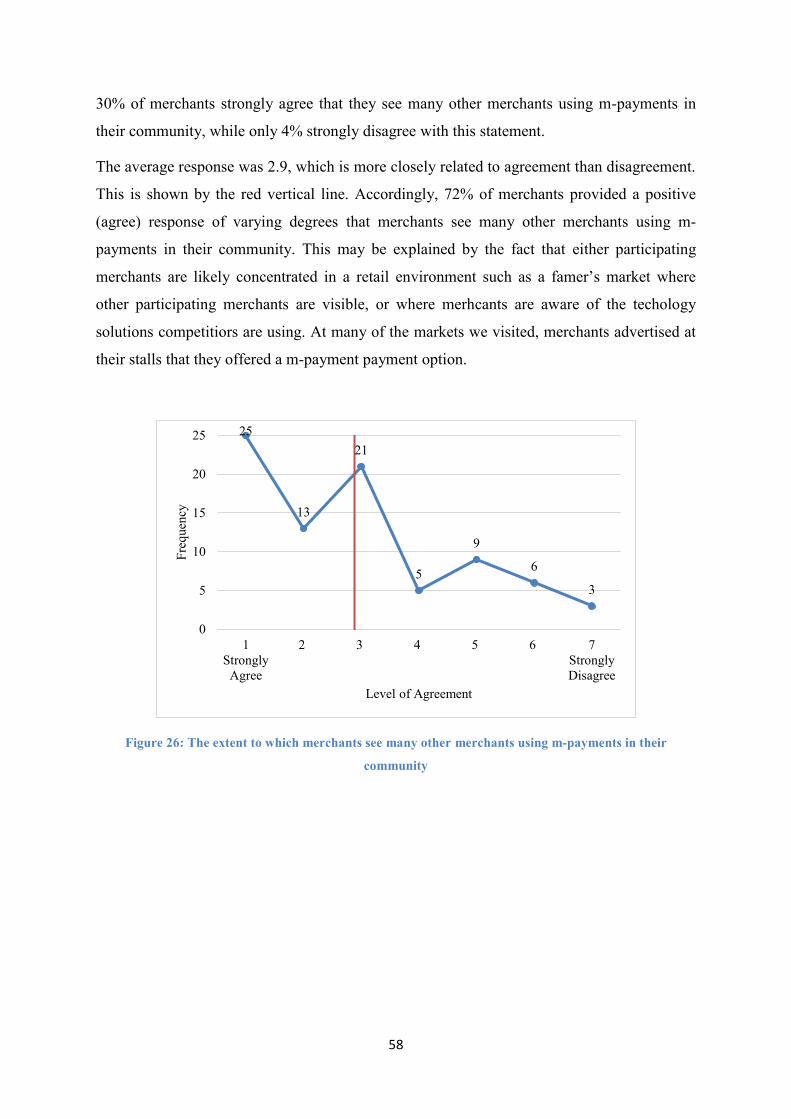
58
30% of merchants strongly agree that they see many other merchants using m-payments in
their community, while only 4% strongly disagree with this statement.
The average response was 2.9, which is more closely related to agreement than disagreement.
This is shown by the red vertical line. Accordingly, 72% of merchants provided a positive
(agree) response of varying degrees that merchants see many other merchants using m-
payments in their community. This may be explained by the fact that either participating
merchants are likely concentrated in a retail environment such as a famer’s market where
other participating merchants are visible, or where merhcants are aware of the techology
solutions competitiors are using. At many of the markets we visited, merchants advertised at
their stalls that they offered a m-payment payment option.
Figure 26: The extent to which merchants see many other merchants using m-payments in their
community
25
13
21
5
9
6
3
0
5
10
15
20
25
1Strongly
Agree
2 3 4 5 6 7StronglyDisagree
Freq
uenc
y
Level of Agreement
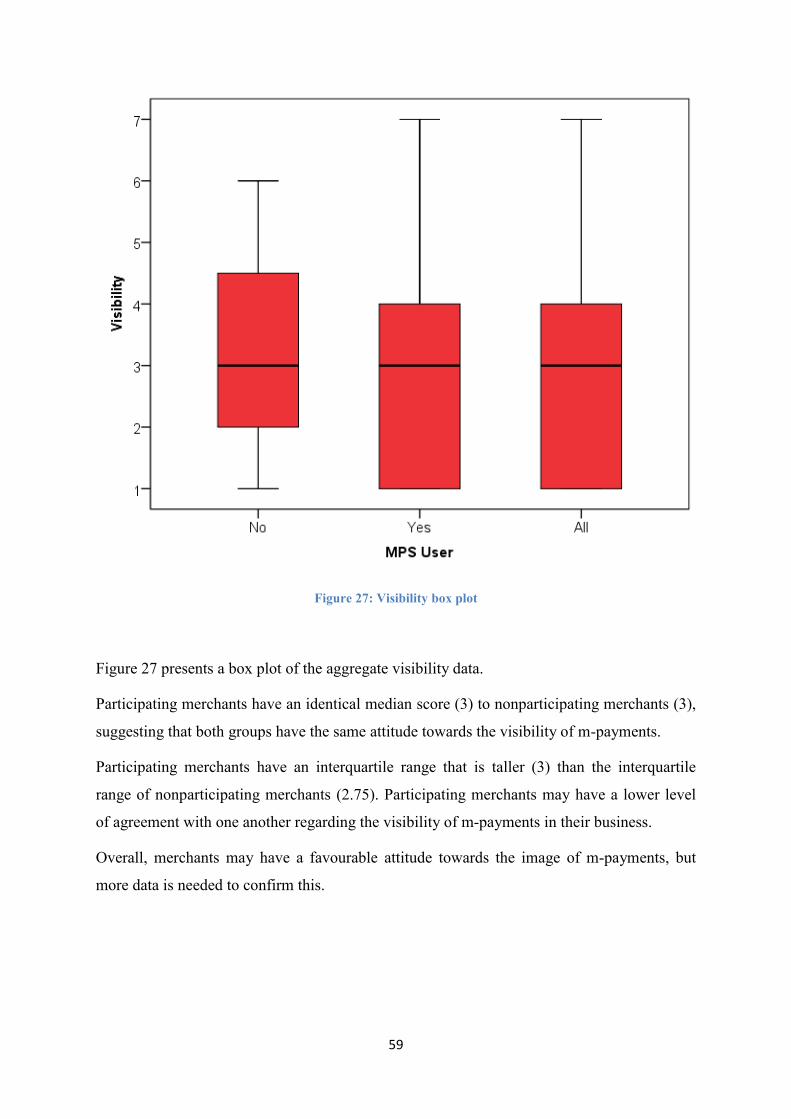
59
Figure 27: Visibility box plot
Figure 27 presents a box plot of the aggregate visibility data.
Participating merchants have an identical median score (3) to nonparticipating merchants (3),
suggesting that both groups have the same attitude towards the visibility of m-payments.
Participating merchants have an interquartile range that is taller (3) than the interquartile
range of nonparticipating merchants (2.75). Participating merchants may have a lower level
of agreement with one another regarding the visibility of m-payments in their business.
Overall, merchants may have a favourable attitude towards the image of m-payments, but
more data is needed to confirm this.

60
Figure 28: Visibility histogram
Figure 28 presents a histogram of the visibility sample data.
There is greater variability in response for nonparticipating merchants but a clear trend
towards agreement for participating merchants.
For all merchants, the histogram is slightly skewed to the left, indicating a trend towards
agreement.
4.3.6. Trust and security
Section 4.3.6 presents the line graphs of selected items from the rust and security construct.
The average response in Figure 29, 30, 31 and 32 was 2.5, 2.6, 2.8 and 2.4 respectively. In all
cases, these tend more towards agreement, as indicated by the red line. Accordingly, 80%,
61
80%, 77% and 73% of merchants provided a positive (agree) response of varying degrees to
the items in question.
The average response for all items in the trust and security construct was 2.4, which is more
closely related to agreement than disagreement. Merchants were most in agreement (2) that
when using m-payments to receive payments, they get immediate SMS or POS confirmation
of the payment transaction. In practice, the staff member facilitating the payment is equipped
with a mobile phone to confirm to the customer that the payment has been received and
approved. Similarly, merchants were in agreement that: m-payments are trustworthy (2.5);
mobile phones are reliable enough for payment transactions (2.6); mobile networks are
reliable enough for payment transactions (2.8); the data sent by the MPS during the
transaction is confidential (2.4); and m-payment technology is secure.
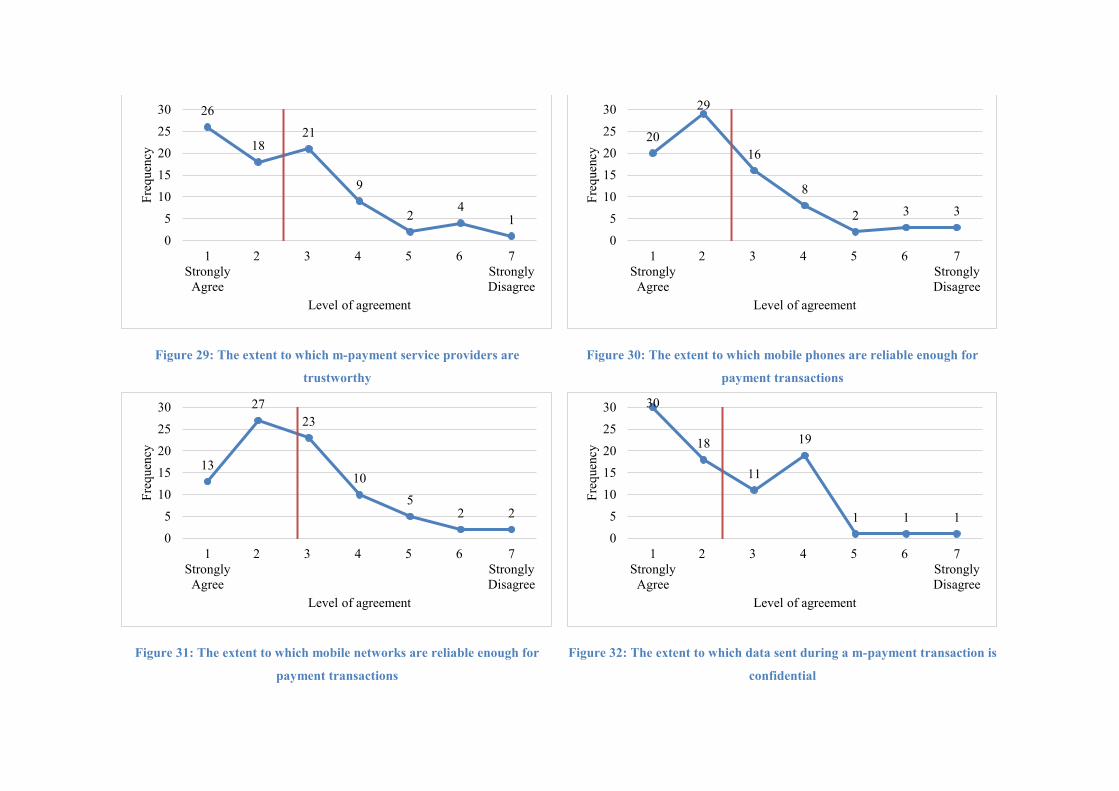
Figure 29: The extent to which m-payment service providers are
trustworthy
Figure 30: The extent to which mobile phones are reliable enough for
payment transactions
Figure 31: The extent to which mobile networks are reliable enough for
payment transactions
Figure 32: The extent to which data sent during a m-payment transaction is
confidential
26
1821
9
24
10
5
10
15
20
25
30
1Strongly
Agree
2 3 4 5 6 7StronglyDisagree
Freq
uenc
y
Level of agreement
20
29
16
8
2 3 3
0
5
10
15
20
25
30
1Strongly
Agree
2 3 4 5 6 7StronglyDisagree
Freq
uenc
y
Level of agreement
13
2723
10
52 2
0
5
10
15
20
25
30
1Strongly
Agree
2 3 4 5 6 7StronglyDisagree
Freq
uenc
y
Level of agreement
30
18
11
19
1 1 10
5
10
15
20
25
30
1Strongly
Agree
2 3 4 5 6 7StronglyDisagree
Freq
uenc
yLevel of agreement
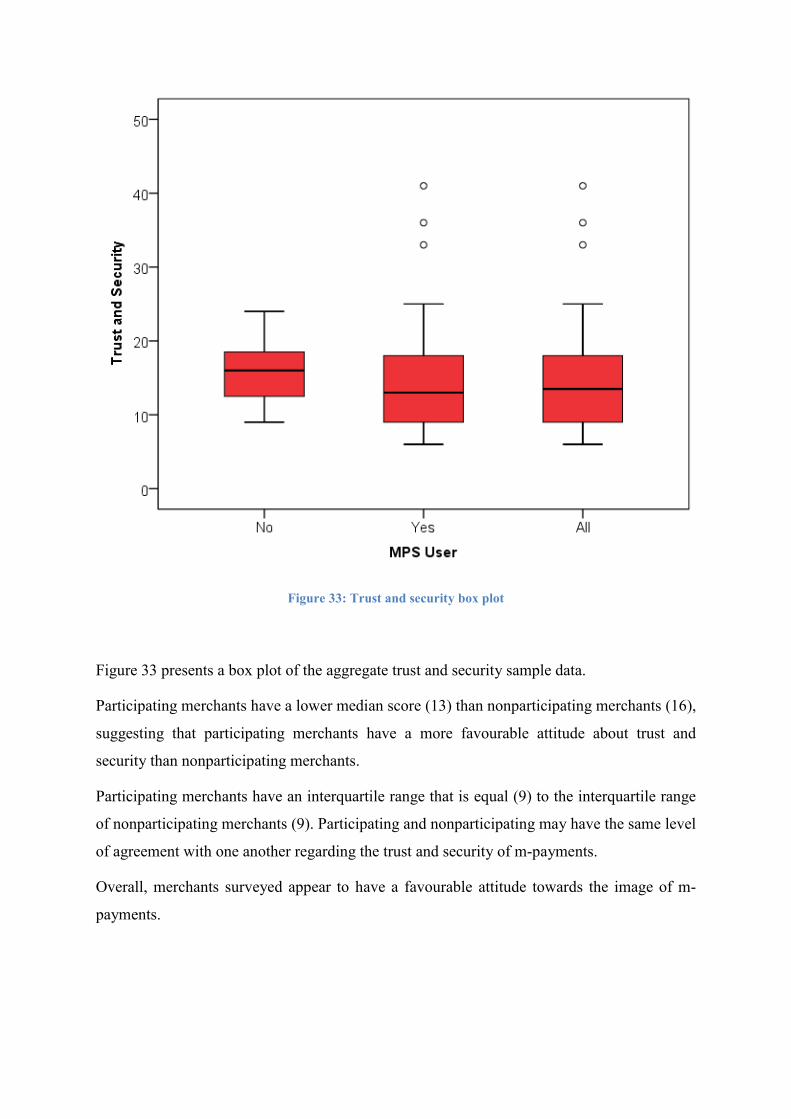
Figure 33: Trust and security box plot
Figure 33 presents a box plot of the aggregate trust and security sample data.
Participating merchants have a lower median score (13) than nonparticipating merchants (16),
suggesting that participating merchants have a more favourable attitude about trust and
security than nonparticipating merchants.
Participating merchants have an interquartile range that is equal (9) to the interquartile range
of nonparticipating merchants (9). Participating and nonparticipating may have the same level
of agreement with one another regarding the trust and security of m-payments.
Overall, merchants surveyed appear to have a favourable attitude towards the image of m-
payments.
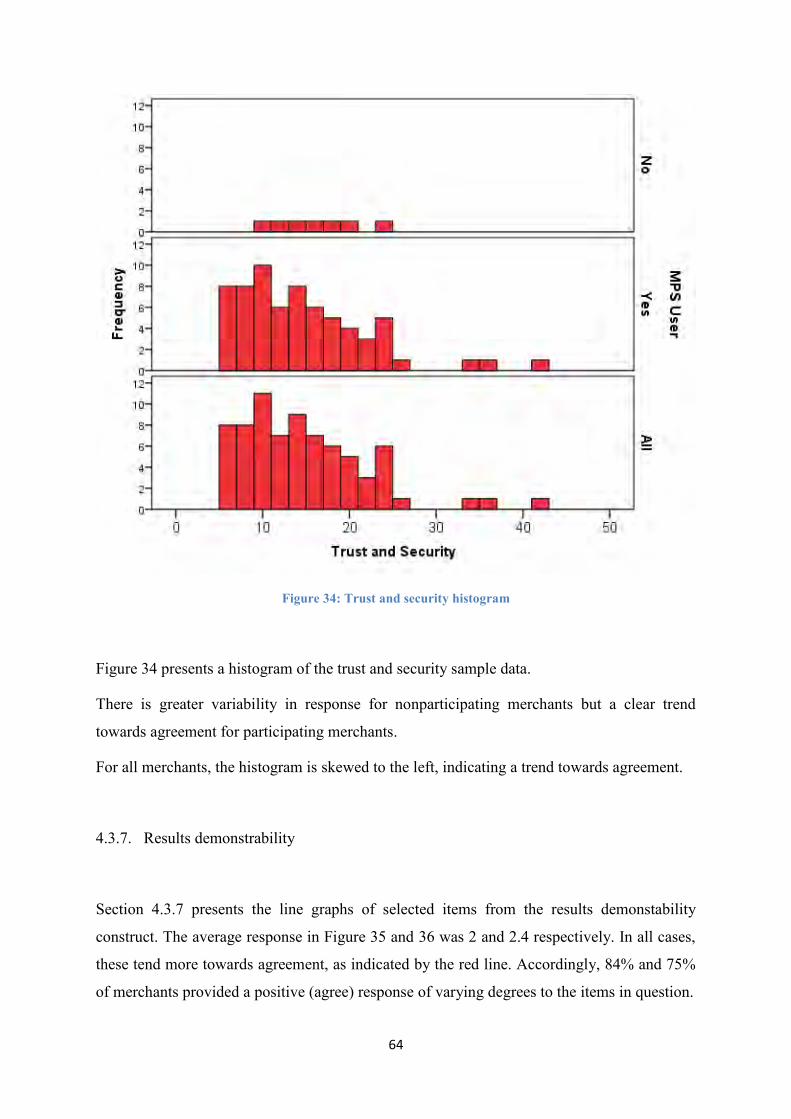
64
Figure 34: Trust and security histogram
Figure 34 presents a histogram of the trust and security sample data.
There is greater variability in response for nonparticipating merchants but a clear trend
towards agreement for participating merchants.
For all merchants, the histogram is skewed to the left, indicating a trend towards agreement.
4.3.7. Results demonstrability
Section 4.3.7 presents the line graphs of selected items from the results demonstability
construct. The average response in Figure 35 and 36 was 2 and 2.4 respectively. In all cases,
these tend more towards agreement, as indicated by the red line. Accordingly, 84% and 75%
of merchants provided a positive (agree) response of varying degrees to the items in question.

65
The average response for all items in the results demonstrability construct was 2.2, which is
more closely related to agreement than disagreement. Merchants were most in agreement (2)
that their staff and they would have no difficulty telling others about their experience or
results using m-payments. Merchants may have no difficulty communicating with other
merchants in an environment where all merchants are closely located. In addtion, whether the
experience is positive or negative, merchants can quickly determine – after perhaps a few
transactions – their feelings about m-payments, and communicate these to others. There
would be no difficulty telling others as the transactions are visible to all. Similarly, merchants
were in agreement (2.4) that the results of using the m-payments are apparent to their staff
and them. In a retail environment such as a farmer’s market, type and speed of over-the-
counter transactions are conducive to the results of using m-payments being apparent to other
businesses and merchants in the ecosystem. Competing merchants are immediately able to
see other customers using m-payments, and their reaction to using the technology. In
addition, businesses may be aware of the technology solutions their competitiors are using,
and thus may be enticed to adopt similar to techology in order to remain competitive.
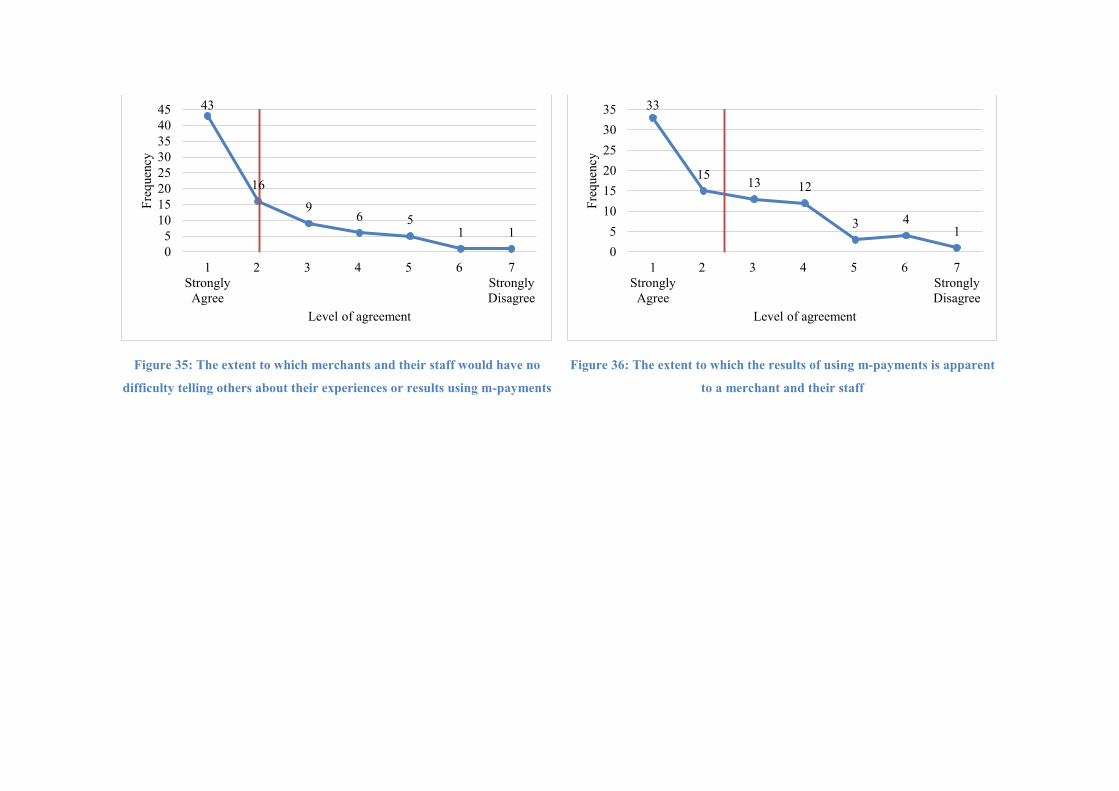
Figure 35: The extent to which merchants and their staff would have no
difficulty telling others about their experiences or results using m-payments
Figure 36: The extent to which the results of using m-payments is apparent
to a merchant and their staff
43
16
96 5
1 105
1015202530354045
1Strongly
Agree
2 3 4 5 6 7StronglyDisagree
Freq
uenc
y
Level of agreement
33
15 13 12
3 41
05
101520253035
1Strongly
Agree
2 3 4 5 6 7StronglyDisagree
Freq
uenc
y
Level of agreement
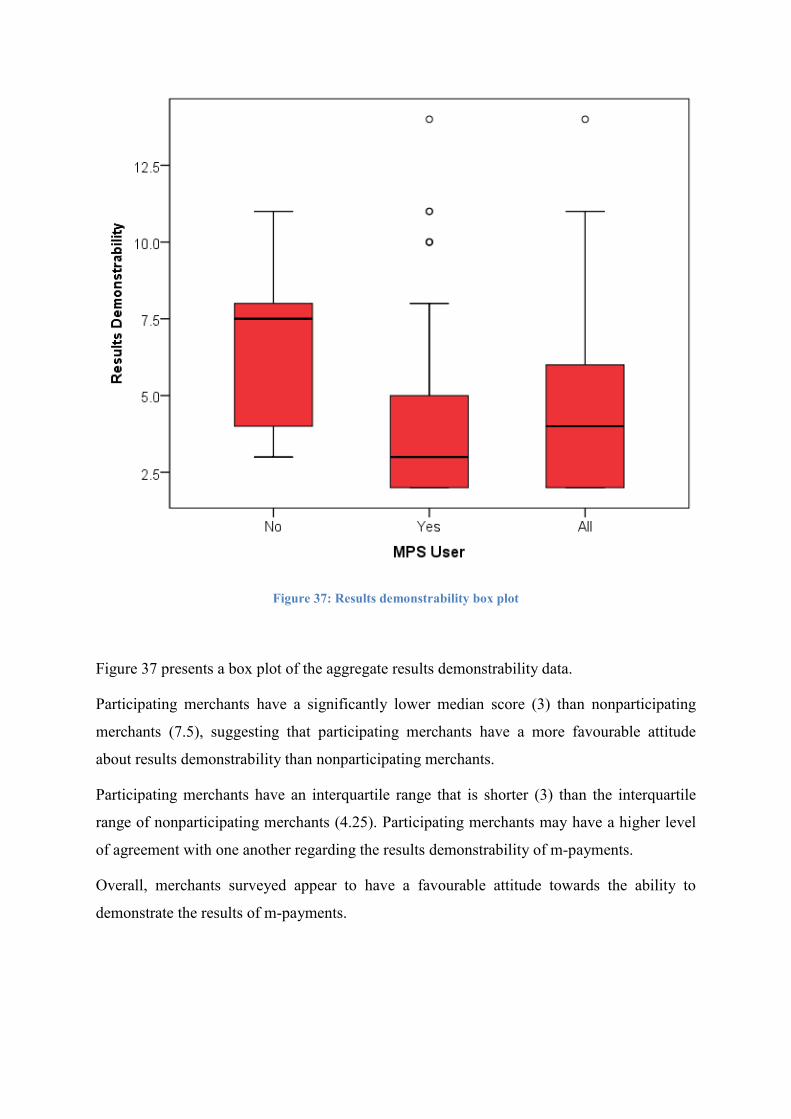
Figure 37: Results demonstrability box plot
Figure 37 presents a box plot of the aggregate results demonstrability data.
Participating merchants have a significantly lower median score (3) than nonparticipating
merchants (7.5), suggesting that participating merchants have a more favourable attitude
about results demonstrability than nonparticipating merchants.
Participating merchants have an interquartile range that is shorter (3) than the interquartile
range of nonparticipating merchants (4.25). Participating merchants may have a higher level
of agreement with one another regarding the results demonstrability of m-payments.
Overall, merchants surveyed appear to have a favourable attitude towards the ability to
demonstrate the results of m-payments.
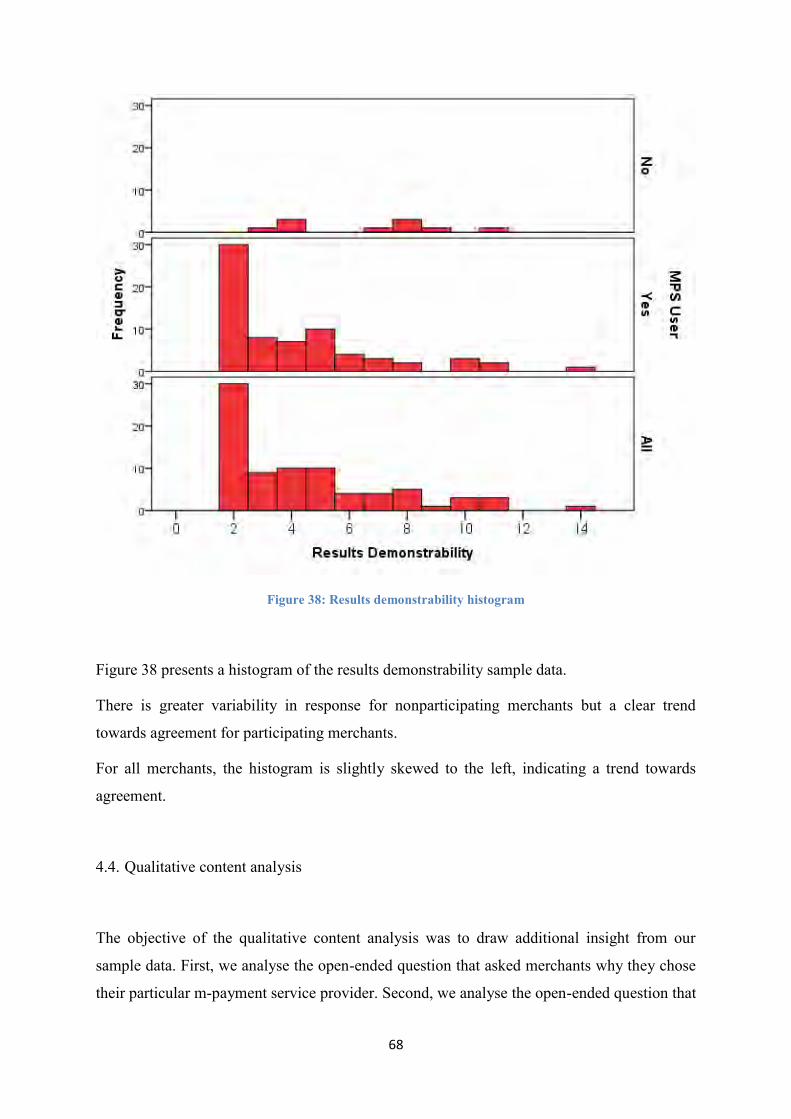
68
Figure 38: Results demonstrability histogram
Figure 38 presents a histogram of the results demonstrability sample data.
There is greater variability in response for nonparticipating merchants but a clear trend
towards agreement for participating merchants.
For all merchants, the histogram is slightly skewed to the left, indicating a trend towards
agreement.
4.4. Qualitative content analysis
The objective of the qualitative content analysis was to draw additional insight from our
sample data. First, we analyse the open-ended question that asked merchants why they chose
their particular m-payment service provider. Second, we analyse the open-ended question that
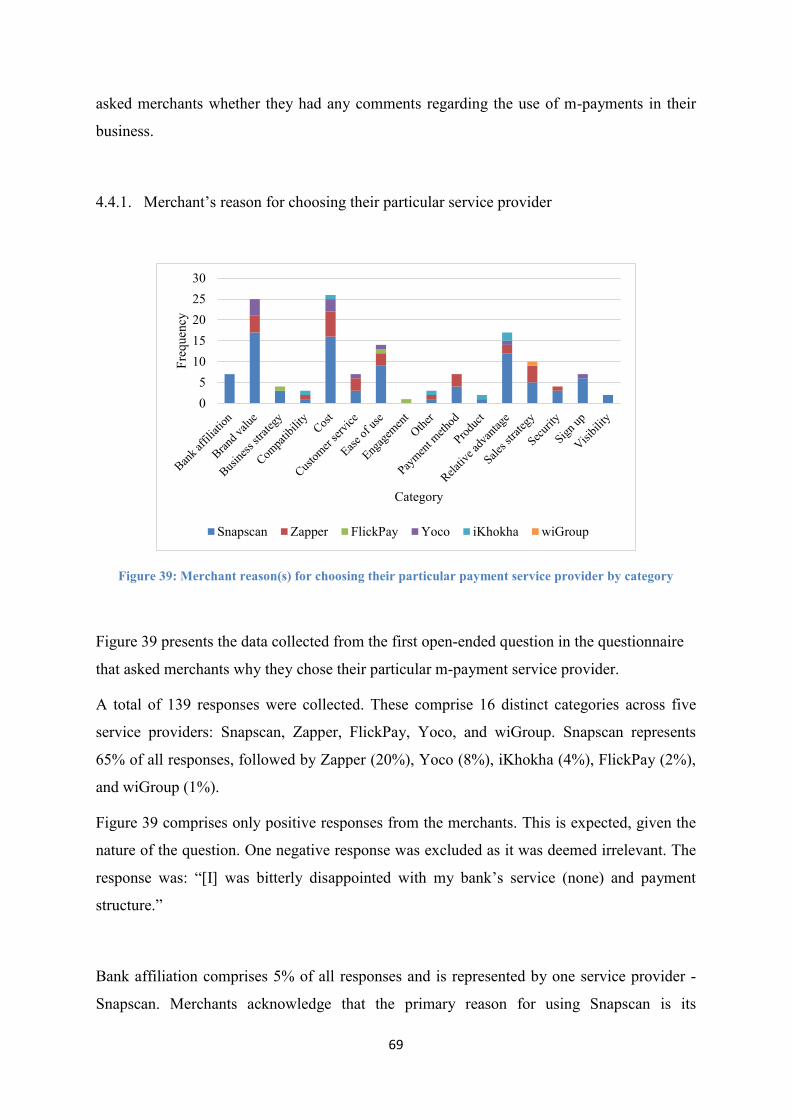
69
asked merchants whether they had any comments regarding the use of m-payments in their
business.
4.4.1. Merchant’s reason for choosing their particular service provider
Figure 39: Merchant reason(s) for choosing their particular payment service provider by category
Figure 39 presents the data collected from the first open-ended question in the questionnaire
that asked merchants why they chose their particular m-payment service provider.
A total of 139 responses were collected. These comprise 16 distinct categories across five
service providers: Snapscan, Zapper, FlickPay, Yoco, and wiGroup. Snapscan represents
65% of all responses, followed by Zapper (20%), Yoco (8%), iKhokha (4%), FlickPay (2%),
and wiGroup (1%).
Figure 39 comprises only positive responses from the merchants. This is expected, given the
nature of the question. One negative response was excluded as it was deemed irrelevant. The
response was: “[I] was bitterly disappointed with my bank’s service (none) and payment
structure.”
Bank affiliation comprises 5% of all responses and is represented by one service provider -
Snapscan. Merchants acknowledge that the primary reason for using Snapscan is its
05
1015202530
Freq
uenc
y
Category
Snapscan Zapper FlickPay Yoco iKhokha wiGroup
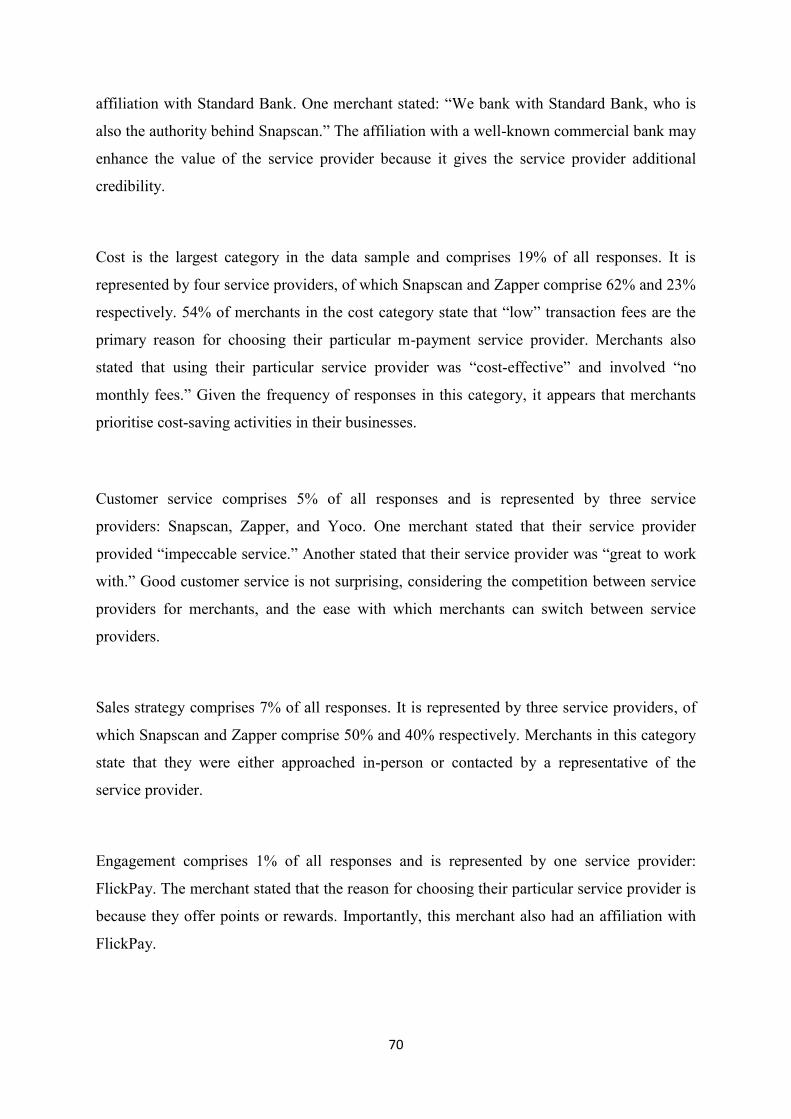
70
affiliation with Standard Bank. One merchant stated: “We bank with Standard Bank, who is
also the authority behind Snapscan.” The affiliation with a well-known commercial bank may
enhance the value of the service provider because it gives the service provider additional
credibility.
Cost is the largest category in the data sample and comprises 19% of all responses. It is
represented by four service providers, of which Snapscan and Zapper comprise 62% and 23%
respectively. 54% of merchants in the cost category state that “low” transaction fees are the
primary reason for choosing their particular m-payment service provider. Merchants also
stated that using their particular service provider was “cost-effective” and involved “no
monthly fees.” Given the frequency of responses in this category, it appears that merchants
prioritise cost-saving activities in their businesses.
Customer service comprises 5% of all responses and is represented by three service
providers: Snapscan, Zapper, and Yoco. One merchant stated that their service provider
provided “impeccable service.” Another stated that their service provider was “great to work
with.” Good customer service is not surprising, considering the competition between service
providers for merchants, and the ease with which merchants can switch between service
providers.
Sales strategy comprises 7% of all responses. It is represented by three service providers, of
which Snapscan and Zapper comprise 50% and 40% respectively. Merchants in this category
state that they were either approached in-person or contacted by a representative of the
service provider.
Engagement comprises 1% of all responses and is represented by one service provider:
FlickPay. The merchant stated that the reason for choosing their particular service provider is
because they offer points or rewards. Importantly, this merchant also had an affiliation with
FlickPay.
71
Business strategy comprises 3% of all responses and is represented by two service providers:
Snapscan and FlickPay. Merchants in this category state that they chose their particular
service provider because they were “first to market.” One merchant stated: “At the time they
were the only people offering the service.”
Visibility comprises 1% of all data points and is represented by one service provider. One
merchant stated: “[I] saw a lot of other traders at markets use them”
Brand value comprises 18% of all responses. It is represented by three service providers, of
which Snapscan, Zapper and Yoco comprise 68%, 16% and 16% respectively.
Figure 40: Brand value analysis
Figure 40 presents the subcategories in the brand category. They are: awareness, credibility,
global, local, and popularity.
We expect the brand value of the service provider to carry substantial weight given the
novelty of the technology to the market and consumers. This may seem counterintuitive since
many of the service providers are young. Consequently, brand awareness, credibility, local
and popularity comprise the key subcategories in this category.
0
2
4
6
8
10
12
Awareness Credibility Global Local Popularity
Freq
uenc
y
Subcategory
Yoco
Zapper
Snapscan

72
Popularity is the largest subcategory in the brand category and comprises 48% of all
responses. It is represented by three service providers, of which Snapscan comprises 75%.
Merchants in this subcategory simply stated that Snapscan is the most popular service
provider, or the service provider that they recognise the most.
The awareness, local, credibility, and global subcategories comprise 24%, 12%, 12%, and 4%
respectively.
Relative advantage comprises 12% of all responses. It is represented by four service
providers, of which Snapscan, Zapper, iKhokha and Yoco comprise 71%, 12%, 12% and 6%
respectively. This category is presented in more detail below.
Figure 41: Relative advantage analysis
Figure 41 presents the subcategories in the relative advantage category. They are: payment
method, convenience, efficiency, speed, ubiquity, and mobility.
Convenience is the largest subcategory in the relative advantage category and comprises 41%
of all responses. It is represented by three service providers, of which Snapscan comprises
71%. Merchants in this subcategory stated that Snapscan is convenient for both merchants
and consumers. One merchant stated: “Convenience for customers when they want to buy but
don't have cash on them”
0
1
2
3
4
5
6
7
Freq
uenc
y
Subcategory
iKhokha
Yoco
Zapper
Snapscan
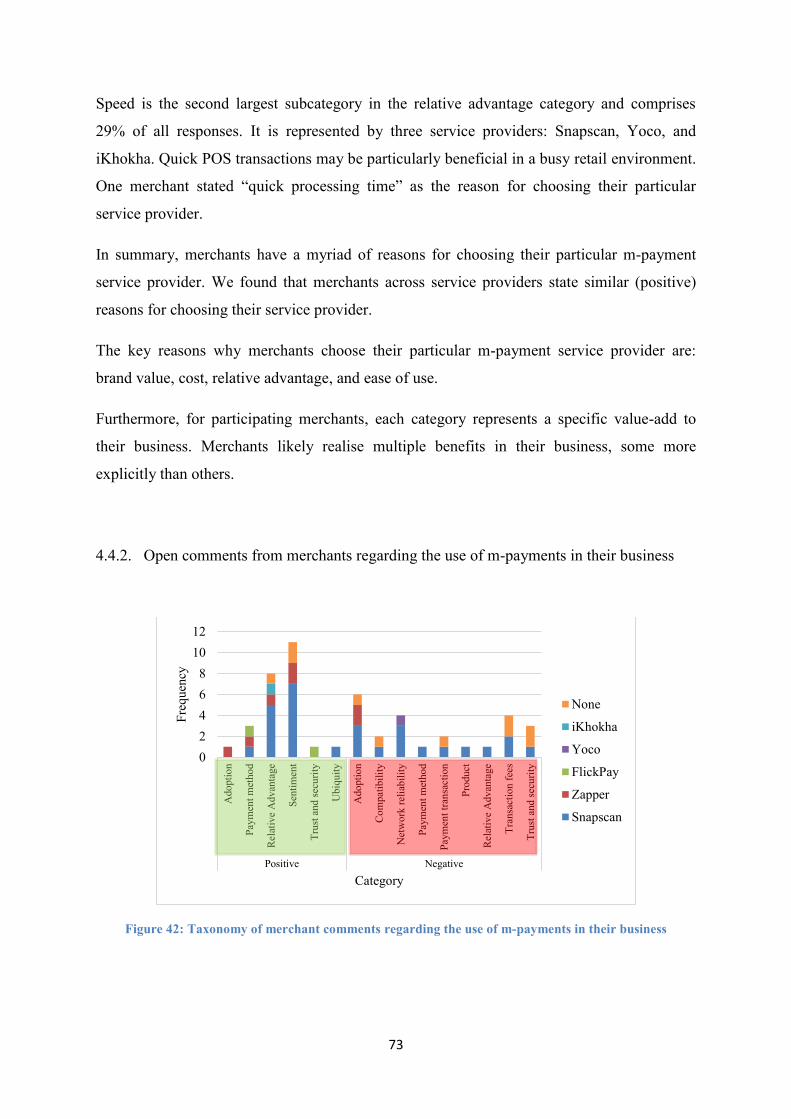
73
Speed is the second largest subcategory in the relative advantage category and comprises
29% of all responses. It is represented by three service providers: Snapscan, Yoco, and
iKhokha. Quick POS transactions may be particularly beneficial in a busy retail environment.
One merchant stated “quick processing time” as the reason for choosing their particular
service provider.
In summary, merchants have a myriad of reasons for choosing their particular m-payment
service provider. We found that merchants across service providers state similar (positive)
reasons for choosing their service provider.
The key reasons why merchants choose their particular m-payment service provider are:
brand value, cost, relative advantage, and ease of use.
Furthermore, for participating merchants, each category represents a specific value-add to
their business. Merchants likely realise multiple benefits in their business, some more
explicitly than others.
4.4.2. Open comments from merchants regarding the use of m-payments in their business
Figure 42: Taxonomy of merchant comments regarding the use of m-payments in their business
02468
1012
Ado
ptio
n
Paym
ent m
etho
d
Rela
tive
Adv
anta
ge
Sent
imen
t
Trus
t and
secu
rity
Ubi
quity
Ado
ptio
n
Com
patib
ility
Net
wor
k re
liabi
lity
Paym
ent m
etho
d
Paym
ent t
rans
actio
n
Prod
uct
Rela
tive
Adv
anta
ge
Tran
sact
ion
fees
Trus
t and
secu
rity
Positive Negative
Freq
uenc
y
Category
None
iKhokha
Yoco
FlickPay
Zapper
Snapscan
74
Figure 42 presents the data collected from the second open-ended question in the
questionnaire, which asked merchants whether they had any comments regarding the use of
m-payments in their business.
A total of 49 responses or data points were collected. These comprise 11 distinct categories
across four service providers: Snapscan, Zapper, FlickPay, and Yoco. There is a category for
merchants that do not use m-payments, labelled “None.”
The categories were also categorised as either positive or negative. 49% of responses are
positive; 51% of responses are negative.
Snapscan represents 57% of all responses, followed by None (20%), Zapper (14%), FlickPay
(4%), Yoco (2%), and iKhokha (2%).
We define sentiment as any view regarding the use of m-payments that is expressed (Oxford
Dictionary, 2016). Positive sentiment comprises 22% of all responses and is represented by
two service providers: Snapscan and Zapper, and None. Merchant responses included: “we
love using it,” “It is the future of payments,” “I like Snapscan to replace cash purchases,” and
“It is one of the best possible inventions.” Interestingly, even merchants not using m-
payments had favourable views about the use of m-payments, and its future.
Relative advantage is represented in both the positive and negative categories. In the positive
category, relative advantage comprises 16% of all responses and is represented by three
service providers: Snapscan, Zapper and iKhokha, and None. Merchant responses included:
“It is a very effective form of payment,” “It has definitely increased my overall sales,” and “It
is very convenient during load shedding.” In the negative category, relative advantage
comprises 2% of all responses and is represented by one service provider: Snapscan. The
merchant stated: “Using Snapscan is free but it doesn't offer many benefits over a regular
card machine.”
Ubiquity is represented in the positive category. It comprises 2% of all responses and is
represented by one service provider: Snapscan. One merchant stated: “it makes payment at
various locations easier, seeing that my staff and I do not have to carry a card machine, but
75
rather only the piece of paper with the QR code. Very convenient for both ends of the
transaction!”
Network reliability refers to the reliability of the overall network to provide communication
in the event of failure of a component (Medhi, 1999). Network reliability is represented in the
negative category. It comprises 8% of all responses and is represented by two service
providers: Snapscan and Yoco. Merchant responses included: “[m-payments are] heavily
reliant on the networks which make them inconsistent” and “My only negative feedback
would be connectivity to my MPS network.”
Trust and security is represented in both the positive and negative categories. In the positive
category, trust and security comprises 2% of all responses and is represented by one service
provider: FlickPay. In the negative category, trust and security comprises 6% of all responses
and is represented by one service provider: Snapscan, and None. Merchant responses
included: “[many customers] aren't confident with its [m-payment] security” and “my staff
would feel unsure about challenging someone if they felt that they were trying to fraudulently
receive goods by faking a MPS transaction.”
Adoption is represented in both the positive and negative categories. In the positive category,
adoption comprises 2% of all responses and is represented by one service provider: Zapper.
In the negative category, adoption comprises 12% of all responses and is represented by two
service providers: Snapscan and Zapper, and None. Merchant responses included: “Despite
offering Zapper as a payment option for the past 6 months, we've had very few payments”
and “Customer take up is low.” Moreover, merchants also recognised that m-payments are
suitable for different customer segments, especially younger customers. Merchant responses
included: “MPS suited for different customers, especially younger customers” and “Adopters
tend to be younger.”
In summary, the open merchant responses regarding the use of m-payments in their business
were mixed in terms of the sentiment (positive or negative), by category type, and by service
provider. Participating merchants comprise 80% of all responses, of which 56% are positive

76
and 44% are negative. These merchants may have a slightly more favourable attitude towards
m-payments. Nonparticipating merchants comprise 20% of all responses, of which 30% are
positive and 70% are negative. These merchants may have a less favourable attitude towards
m-payments.
There are two key positive results from this question. First, there is considerable excitement
surrounding m-payments. The strength and volume of positive responses, particularly from
Snapscan merchants, was noteworthy. This may be due to m-payments being an innovative
technology. Second, merchants recognise relative advantage as a key positive result. This
may be due to the wide-ranging and practical benefits of m-payments. For example, one
merchant stated that m-payments is convenient during load shedding. Moreover, merchants
across different service providers stated similar positive responses relating to relative
advantage.
The key negative result from this question was trust and security. Merchants appear to be
concerned about the reliability of the network, m-payments security, and fraudulent activity.
This may be due to the reliability of m-payments since it represents a novel technology
facilitating monetary transactions. Two merchants made negative statements about the
reliability of the network.
4.5. Reliability and validity analysis
IBM SPSS Statistics (Version 22, IBM Corporation) was used to estimate the PCI model.
The adequacy or internal consistency of a measurement model can be assessed by looking at
the individual item reliabilities (Fornell and Larcker, 1981). Individual items with a Cronbach
alpha coefficient of more than 0.7 are deemed reliable (Nunnally, 1978). All measurement
items had a positive coefficient greater than 0.7 (see Table 8). The values range between
0.719 and 0.911, indicating a high reliability. All measurement items were thus retained.
Visibility is not applicable to this analysis as only one item was used to construct the scale.
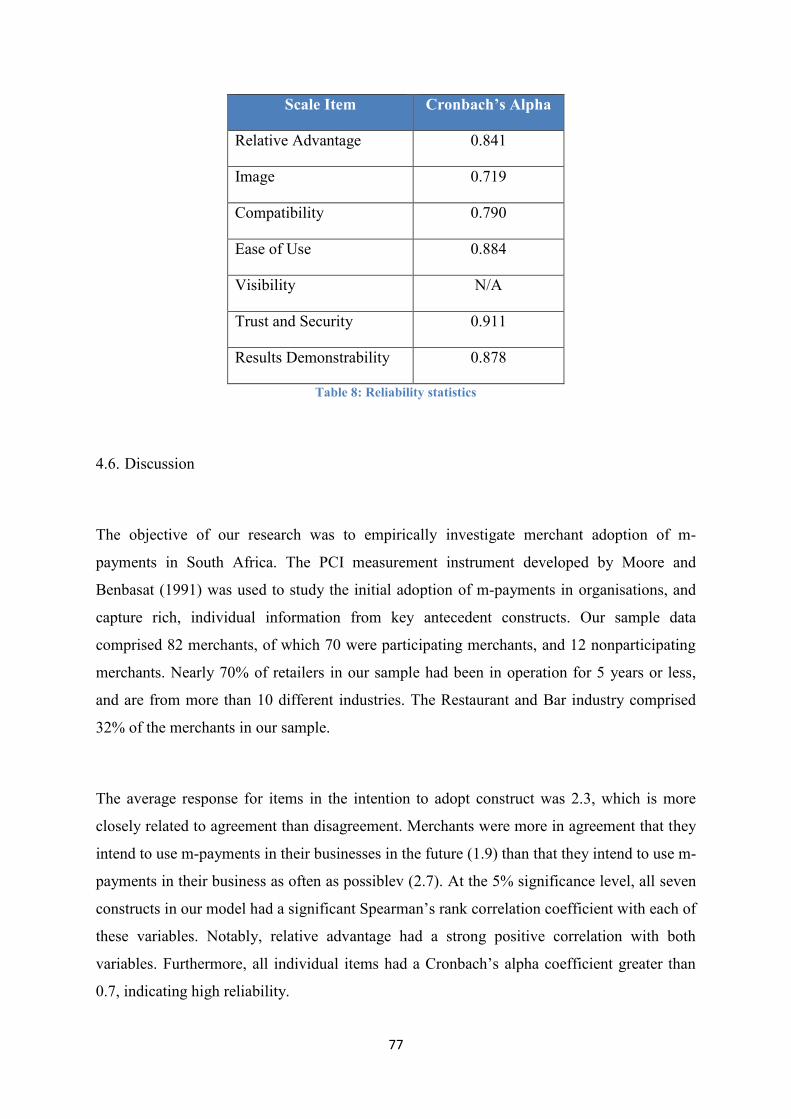
77
Scale Item Cronbach’s Alpha
Relative Advantage 0.841
Image 0.719
Compatibility 0.790
Ease of Use 0.884
Visibility N/A
Trust and Security 0.911
Results Demonstrability 0.878
Table 8: Reliability statistics
4.6. Discussion
The objective of our research was to empirically investigate merchant adoption of m-
payments in South Africa. The PCI measurement instrument developed by Moore and
Benbasat (1991) was used to study the initial adoption of m-payments in organisations, and
capture rich, individual information from key antecedent constructs. Our sample data
comprised 82 merchants, of which 70 were participating merchants, and 12 nonparticipating
merchants. Nearly 70% of retailers in our sample had been in operation for 5 years or less,
and are from more than 10 different industries. The Restaurant and Bar industry comprised
32% of the merchants in our sample.
The average response for items in the intention to adopt construct was 2.3, which is more
closely related to agreement than disagreement. Merchants were more in agreement that they
intend to use m-payments in their businesses in the future (1.9) than that they intend to use m-
payments in their business as often as possiblev (2.7). At the 5% significance level, all seven
constructs in our model had a significant Spearman’s rank correlation coefficient with each of
these variables. Notably, relative advantage had a strong positive correlation with both
variables. Furthermore, all individual items had a Cronbach’s alpha coefficient greater than
0.7, indicating high reliability.
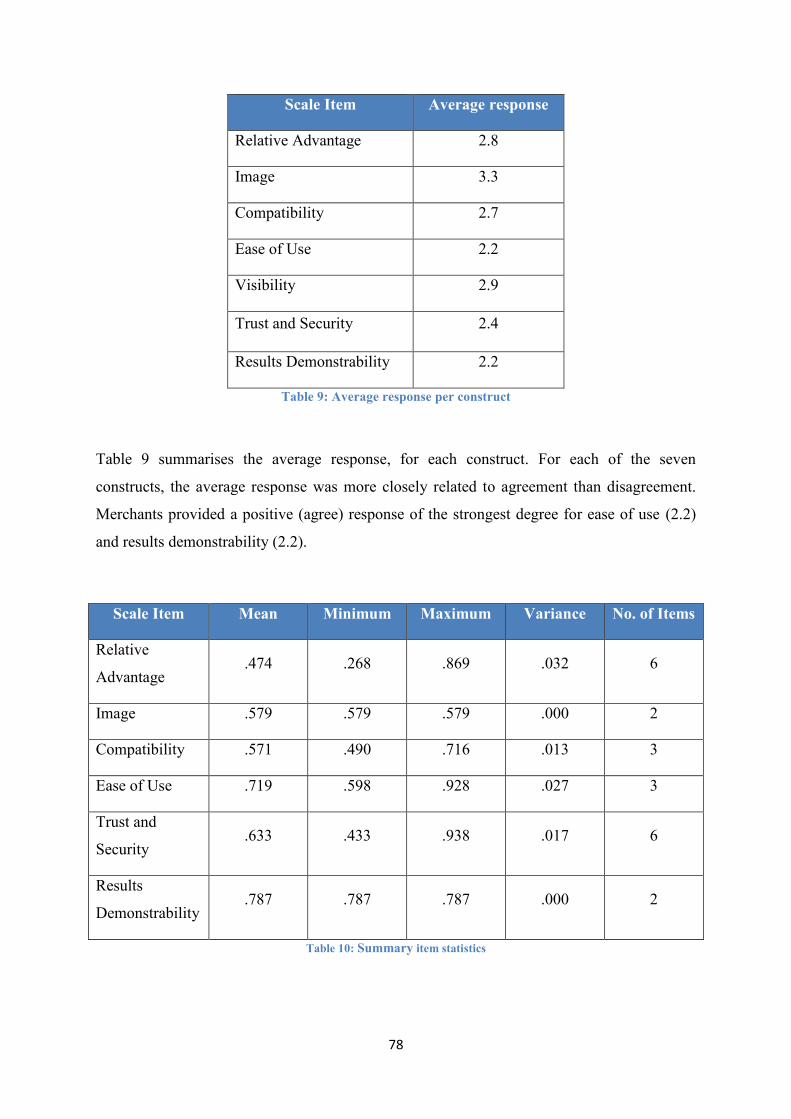
78
Scale Item Average response
Relative Advantage 2.8
Image 3.3
Compatibility 2.7
Ease of Use 2.2
Visibility 2.9
Trust and Security 2.4
Results Demonstrability 2.2
Table 9: Average response per construct
Table 9 summarises the average response, for each construct. For each of the seven
constructs, the average response was more closely related to agreement than disagreement.
Merchants provided a positive (agree) response of the strongest degree for ease of use (2.2)
and results demonstrability (2.2).
Scale Item Mean Minimum Maximum Variance No. of Items
Relative
Advantage .474 .268 .869 .032 6
Image .579 .579 .579 .000 2
Compatibility .571 .490 .716 .013 3
Ease of Use .719 .598 .928 .027 3
Trust and
Security .633 .433 .938 .017 6
Results
Demonstrability .787 .787 .787 .000 2
Table 10: Summary item statistics
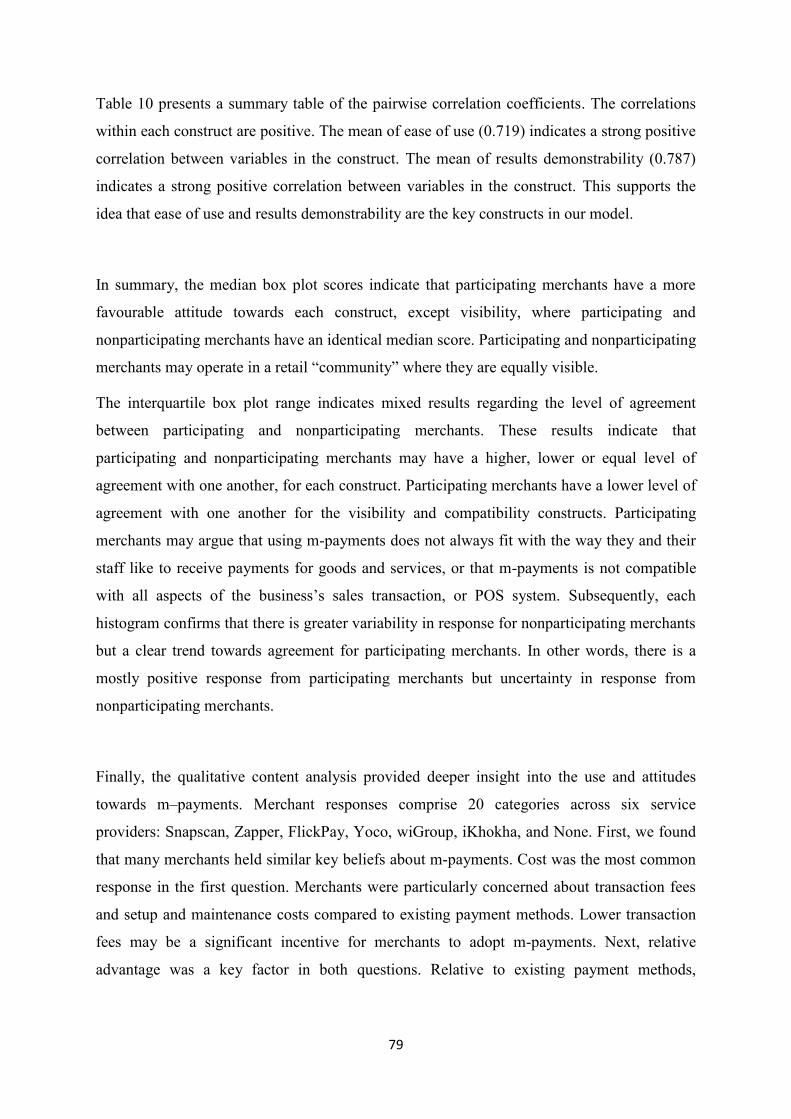
79
Table 10 presents a summary table of the pairwise correlation coefficients. The correlations
within each construct are positive. The mean of ease of use (0.719) indicates a strong positive
correlation between variables in the construct. The mean of results demonstrability (0.787)
indicates a strong positive correlation between variables in the construct. This supports the
idea that ease of use and results demonstrability are the key constructs in our model.
In summary, the median box plot scores indicate that participating merchants have a more
favourable attitude towards each construct, except visibility, where participating and
nonparticipating merchants have an identical median score. Participating and nonparticipating
merchants may operate in a retail “community” where they are equally visible.
The interquartile box plot range indicates mixed results regarding the level of agreement
between participating and nonparticipating merchants. These results indicate that
participating and nonparticipating merchants may have a higher, lower or equal level of
agreement with one another, for each construct. Participating merchants have a lower level of
agreement with one another for the visibility and compatibility constructs. Participating
merchants may argue that using m-payments does not always fit with the way they and their
staff like to receive payments for goods and services, or that m-payments is not compatible
with all aspects of the business’s sales transaction, or POS system. Subsequently, each
histogram confirms that there is greater variability in response for nonparticipating merchants
but a clear trend towards agreement for participating merchants. In other words, there is a
mostly positive response from participating merchants but uncertainty in response from
nonparticipating merchants.
Finally, the qualitative content analysis provided deeper insight into the use and attitudes
towards m–payments. Merchant responses comprise 20 categories across six service
providers: Snapscan, Zapper, FlickPay, Yoco, wiGroup, iKhokha, and None. First, we found
that many merchants held similar key beliefs about m-payments. Cost was the most common
response in the first question. Merchants were particularly concerned about transaction fees
and setup and maintenance costs compared to existing payment methods. Lower transaction
fees may be a significant incentive for merchants to adopt m-payments. Next, relative
advantage was a key factor in both questions. Relative to existing payment methods,
80
merchants noted a wide-range of benefits that m-payments provide. In particular, the speed,
ubiquity, and convenience of the payment method stood out.
Trust and security was a key factor with mixed results. Merchants stated that they were
concerned about network reliability, fraud, and general security. This may be due to the
novelty of the payment method. One merchant stated that “many many customers aren’t
confident with its security.” Conversely, merchants in the first question specifically stated
that the safety of m-payments was a key driver for adoption.
Finally, adoption was also a key factor with mixed results. In both questions, merchants made
positive comments about the use and future of m-payments. Merchants additionally stated
that m-payments were common amongst a younger segment. However, both participating and
nonparticipating merchants noted slow adoption rates. Adoption was the most common
negative response found in the qualitative analysis.
81
5. Conclusion
With this thesis, we have contributed to the body of knowledge on mobile payments by
empirically investigating the adoption factors of m-payments from the merchant’s
perspective, and providing new insight into m-payments in the South African context. The
research model is based on the Perceived Characteristics of Innovation (PCI) instrument
developed by Moore and Benbasat (1991) to measures various perceptions of using an
information technology innovations. To our knowledge, this study is one of the first to
empirically develop a comprehensive PCI model of the factors affecting the merchant
adoption of m-payments in South Africa.
On the driver’s side, our findings suggest that ease of use and results demonstrability are the
most significant variables in our PCI model. We also found relative advantage, convenience,
speed and brand value to be key drivers for adoption. Regarding the barriers to adoption, trust
and security, and cost, especially transaction fees, were found to be concerns for merchants.
Finally, while there is considerable excitement surrounding m-payments, our findings suggest
a varied sentiment regarding intention to adoption.
5.1. Implications
Our findings provide several contributions to emerging m-payment research. First, our
research ventures from existing technology adoption research and adds to the theoretical
discussion on the adoption of new technologies using the PCI framework. Our model uses
selected constructs that were identified in a structured format, and offers a comprehensive
instrument for existing and future m-payment research. In addition, a well-rounded
understanding of merchant adoption can be achieved when considering the drivers and
barriers to adoption using this PCI framework. Second, our results contribute to the
knowledge-base on m-payments, and provide key insights to numerous stakeholders such as
service providers, merchants and consumers. This is important given the need for new
payment methods, and merchants’ uncertainty about the market, adoption, and operational
and strategic objectives such as profitability. Third, since m-payment adoption is a novel
research field in South Africa, our research includes both quantitative and qualitative data to
82
understand merchant perceptions and the implications of the constructs. We hence elicit a
more comprehensive yet parsimonious conceptualisation of IT artifacts in different contexts
(Orlikowski and Iacono, 2001).
In addition, our findings have several implications for management, and the development of
m-payments. Service providers and merchants should consider the drivers and barriers as
levers for adoption. First, the drivers of m-payment adoption provide insight into the areas
that service providers should focus on. Our findings suggest that m-payments should be easy
to use, convenient, quick, and have a positive brand value that appeals to both merchants and
consumers, thus driving a critical mass. To realise these benefits, service providers and
developers need to foster a collaborative relationships in the development of m-payment
systems. Second, the barriers provide insight into the areas of m-payment development that
require immediate attention. Our findings suggest that customers need to be convinced of the
security, reliability and transaction costs related to m-payments. These concerns were
particularly evident in the qualitative analysis. Service providers can ensure that transaction
costs are competitive against existing payment systems such as credit and debit card
payments. Third, there is a mixed sentiment regarding m-payment technology. This needs to
be address in a way that makes the technology appear user-friendly and reliable to all
stakeholders. Fourth, we recommend that service providers conduct market research to
evaluate whether merchants are ready to adopt.
5.2. Limitations
Our research has several limitations. First, despite the fact that over 1650 questionnaires were
distributed, the response rate of approximately 5% was poor. I believe the questionnaire was
too long, including the fact that all the questions were presented directly after one another
without reading breaks. In addition, the incentive cash prize did not appear to work. Second,
because the data was collected via an electronic questionnaire, we work under the assumption
that merchants had a full understanding of the questions, and had no biases when self-
reporting. Third, and in contradiction to the questionnaire being too long, there were too few
questions for each construct. Hence the way in which data was gathered did not allow for a
comprehensive understanding of the results. Fourth, our sample size of 82 respondents is

83
small, and compels us to not draw strong conclusions from our data. Fifth, our findings were
obtained in only one specific empirical context. As a result, we cannot generalise our findings
beyond the current sample and adoption context (Plouffe et al., 2001b). Sixth, the dependent
construct in our model represents behavioural intent rather than actual adoption behaviour
(Plouffe et al., 2001b). However, in this context, intention to adopt and actual adoption
behaviour are highly correlated. We therefore assume that intention to adopt is a reasonable
proxy for actual adoption behaviour (Plouffe et al., 2001b). In addition, because novel
technologies such as m-payments represent a small, incremental improvement in payment
technology, consumers and merchants may be hesitant to adopt the technology simply
because the benefit does not clearly outweigh the cost. As a result it is difficult to measure
merchant’s true perception of m-payments without the having tried the technology. Finally,
there is the lack of recent research studies on the topic, and research studies conducted in
similar, developing markets. This is important given that m-payment technology is evolving
quickly which means more recent studies are more applicable. In addition, this limited the
understanding of the research problem in a developing market context.
5.3. Future research
Our findings provide several contributions for future research on m-payments. First, we
suggest that additional research is carried out using empirical methods to investigate the
relationship between selected PCI constructs and adoption intent. The researcher should aim
to generate a larger sample size and better response rate in order to draw stronger conclusions
from the data. A shorter questionnaire will help drive these objectives. In addition, this
research should be carried out for merchants and consumers separately since the success of
both groups is interdependent. Second, since our research identifies key adoption factors
using a comprehensive approach, we suggest that future research uses our model as a base for
adoption research in different countries. This will further test and validate our model. Third,
since m-payments represent a novel technology, we suggest using a quantitative and
qualitative approach to develop a greater understanding of the nuances of m-payment success
and a more comprehensive conceptualisation of m-payments in different contexts. Fourth, we
recommend that service providers and developers of payment systems collaborate with
merchants and consumers to gain a better understanding of the requirements to go to market
84
with a more robust m-payment service. These requirements should anticipate the needs of
changing business and revenue sharing models. In addition, more research is needed to
examine viable revenue sharing models for m-payments. Fifth, more research is needed to
understand the potential network externalities and their effects on both customer and
merchant adoption of m-payments. Finally, more research is needed to understand how to
promote cooperation and standardisation in the South African industry.

85
6. Acknowledgements
The process of writing a thesis is long and arduous – and I have been fortunate to have the
support of several people that deserve a special mention. First, I would like to thank my
family and girlfriend for their unwavering encouragement and understanding. It would not
have been possible to achieve my goals without them. Second, I would like to extend my
deepest gratitude to my supervisor, Dr. Hussein Suleman. Without his guidance, expertise
and patience, this research and thesis would not have happened. I would also like to thank the
University of Cape Town Computer Science Department for giving me the opportunity to
pursue this undertaking. Finally, I would like to acknowledge the Statistical Consulting
Services from the Department of Statistical Sciences at the University of Cape Town for their
assistance in computing my results.
Any opinion, findings and conclusions or recommendations expressed in this document are
those of the author. The Statistical Consulting Service (UCT) does not accept responsibility
for the statistical correctness of the research results reported.
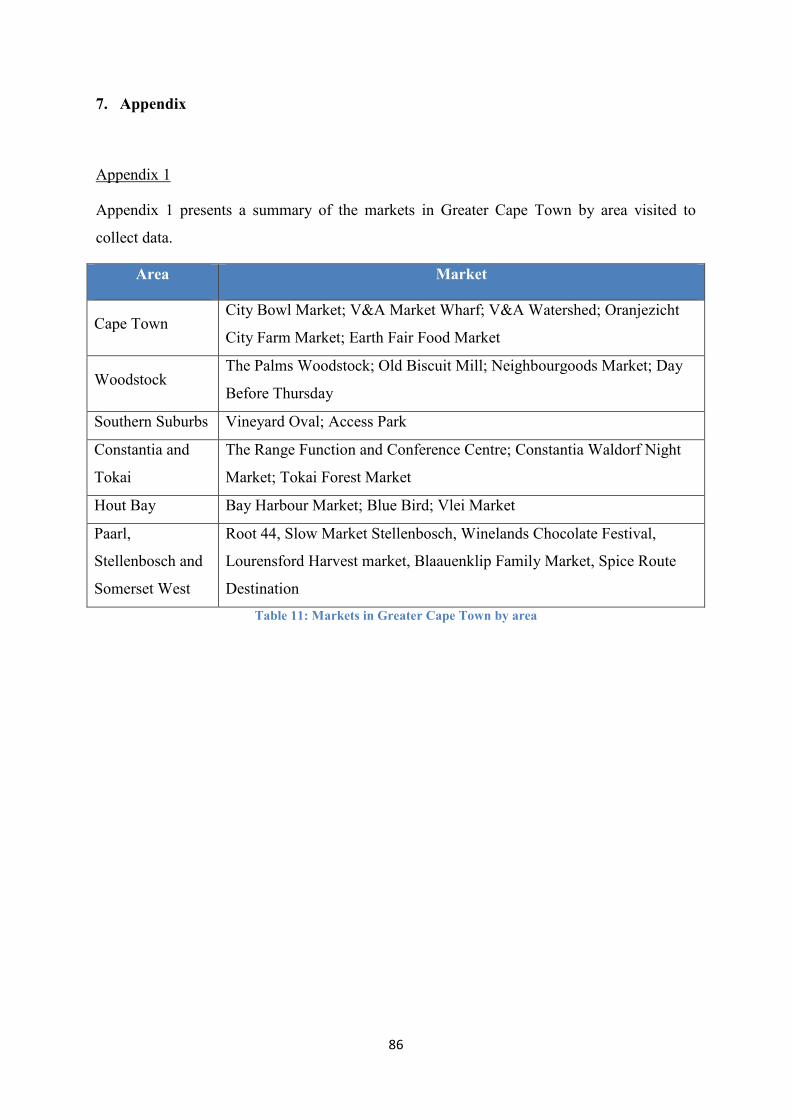
86
7. Appendix
Appendix 1
Appendix 1 presents a summary of the markets in Greater Cape Town by area visited to
collect data.
Area Market
Cape Town City Bowl Market; V&A Market Wharf; V&A Watershed; Oranjezicht
City Farm Market; Earth Fair Food Market
Woodstock The Palms Woodstock; Old Biscuit Mill; Neighbourgoods Market; Day
Before Thursday
Southern Suburbs Vineyard Oval; Access Park
Constantia and
Tokai
The Range Function and Conference Centre; Constantia Waldorf Night
Market; Tokai Forest Market
Hout Bay Bay Harbour Market; Blue Bird; Vlei Market
Paarl,
Stellenbosch and
Somerset West
Root 44, Slow Market Stellenbosch, Winelands Chocolate Festival,
Lourensford Harvest market, Blaauenklip Family Market, Spice Route
Destination Table 11: Markets in Greater Cape Town by area
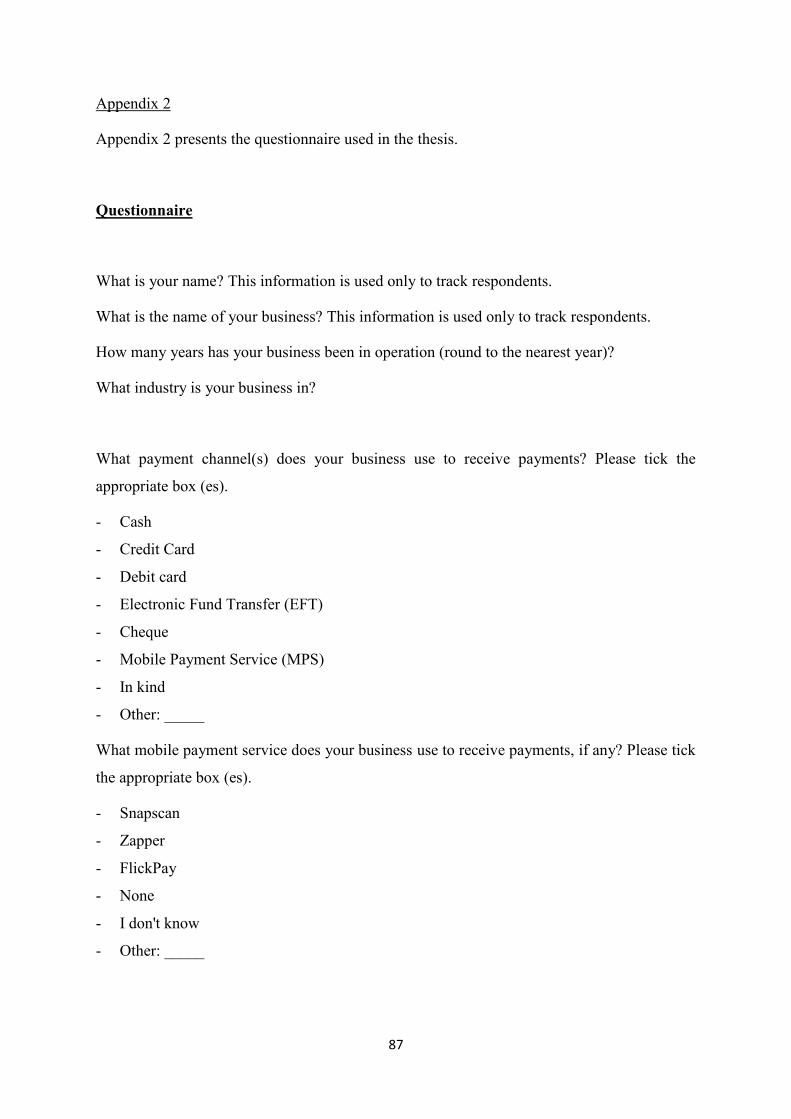
87
Appendix 2
Appendix 2 presents the questionnaire used in the thesis.
Questionnaire
What is your name? This information is used only to track respondents.
What is the name of your business? This information is used only to track respondents.
How many years has your business been in operation (round to the nearest year)?
What industry is your business in?
What payment channel(s) does your business use to receive payments? Please tick the
appropriate box (es).
- Cash
- Credit Card
- Debit card
- Electronic Fund Transfer (EFT)
- Cheque
- Mobile Payment Service (MPS)
- In kind
- Other: _____
What mobile payment service does your business use to receive payments, if any? Please tick
the appropriate box (es).
- Snapscan
- Zapper
- FlickPay
- None
- I don't know
- Other: _____

88
Why did you choose your particular mobile payment service provider? This question is only
for merchants currently using an MPS.
In the following choices, please circle the number which corresponds most closely to your
desired response for each statement. Please answer all questions.
The terms “mobile payment” and “mobile payment service (MPS)” are used interchangeably.
Intention to Use
1. I intend to use an MPS in my business in the future.
2. I intend to use an MPS in my business as often as possible.
Relative advantage
3. Mobile payments increase business sales.
4. Mobile payments increase impulse purchases.
5. Our business’s products can be paid for with an MPS.
6. Paying with a mobile phone speeds up payments.
* 7. Using an MPS enhances the merchant’s effectiveness on the job.
8. Using an MPS allows me to collect useful data about customers and their purchases.
Image
^ 9. Offering mobile payments enhances our business’s image among customers.
* 10. Merchants who use an MPS have more credibility than those who do not.
Compatibility
* 11. Using an MPS is compatible with all aspects of my business’s sales transactions.
* 12. Using an MPS fits well with the way my staff and I like to receive payment for goods
and services.
13. MPS is compatible with my business’s Point-of-Sale system.
Ease of Use
* 14. Learning to operate an MPS is easy for me and my staff.

89
* 15. Overall, my staff and I find an MPS easy to use.
* 16. It is easy to pay with a mobile phone.
Visibility
* 17. In my community, I see many merchants using mobile payment services.
Trust and security
18. MPS providers are trustworthy.
19. Mobile phones are reliable enough for payment transactions.
20. Mobile networks are reliable enough for payment transactions.
21. The data sent by the MPS during the transaction is confidential.
22. MPS technology is secure.
23. When using an MPS to receive payments, I get immediate SMS or Point-of-Sale
confirmation of the payment transaction. [Only for current users]
Results Demonstrability
* 24. My staff and I would have no difficulty telling others about our experience or results
using the MPS.
* 25. The results of using the MPS are apparent to my staff and me.
Do you have any other comments regarding the use of mobile payments in your business?
Key
* = short form scale item taken from Moore and Benbasat’s list of items by construct
^ = item taken from Moore and Benbasat’s list of items by construct
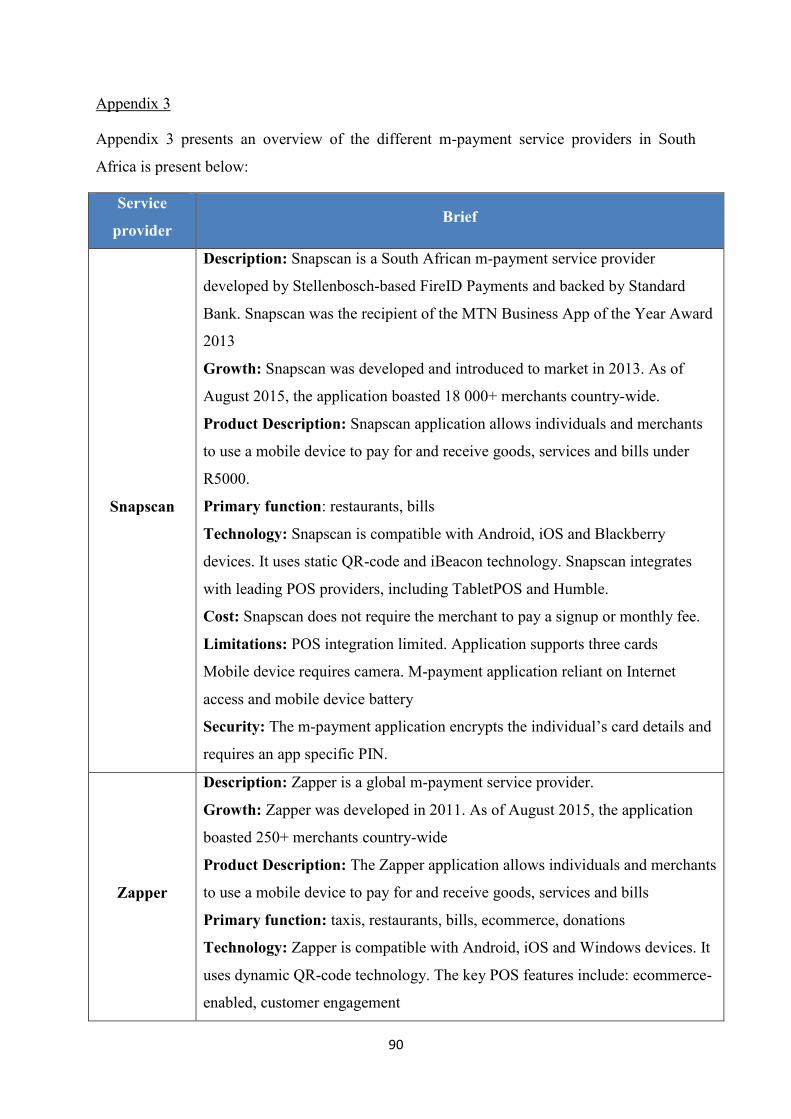
90
Appendix 3
Appendix 3 presents an overview of the different m-payment service providers in South
Africa is present below:
Service
provider Brief
Snapscan
Description: Snapscan is a South African m-payment service provider
developed by Stellenbosch-based FireID Payments and backed by Standard
Bank. Snapscan was the recipient of the MTN Business App of the Year Award
2013
Growth: Snapscan was developed and introduced to market in 2013. As of
August 2015, the application boasted 18 000+ merchants country-wide.
Product Description: Snapscan application allows individuals and merchants
to use a mobile device to pay for and receive goods, services and bills under
R5000.
Primary function: restaurants, bills
Technology: Snapscan is compatible with Android, iOS and Blackberry
devices. It uses static QR-code and iBeacon technology. Snapscan integrates
with leading POS providers, including TabletPOS and Humble.
Cost: Snapscan does not require the merchant to pay a signup or monthly fee.
Limitations: POS integration limited. Application supports three cards
Mobile device requires camera. M-payment application reliant on Internet
access and mobile device battery
Security: The m-payment application encrypts the individual’s card details and
requires an app specific PIN.
Zapper
Description: Zapper is a global m-payment service provider.
Growth: Zapper was developed in 2011. As of August 2015, the application
boasted 250+ merchants country-wide
Product Description: The Zapper application allows individuals and merchants
to use a mobile device to pay for and receive goods, services and bills
Primary function: taxis, restaurants, bills, ecommerce, donations
Technology: Zapper is compatible with Android, iOS and Windows devices. It
uses dynamic QR-code technology. The key POS features include: ecommerce-
enabled, customer engagement
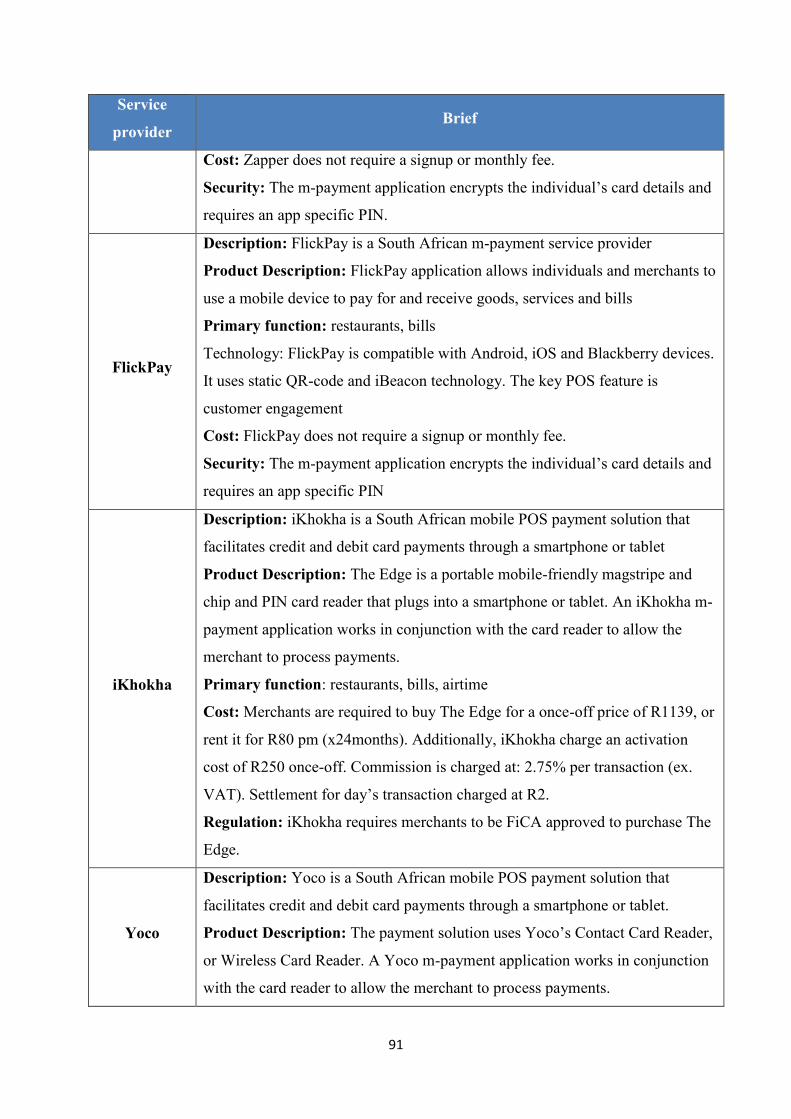
91
Service
provider Brief
Cost: Zapper does not require a signup or monthly fee.
Security: The m-payment application encrypts the individual’s card details and
requires an app specific PIN.
FlickPay
Description: FlickPay is a South African m-payment service provider
Product Description: FlickPay application allows individuals and merchants to
use a mobile device to pay for and receive goods, services and bills
Primary function: restaurants, bills
Technology: FlickPay is compatible with Android, iOS and Blackberry devices.
It uses static QR-code and iBeacon technology. The key POS feature is
customer engagement
Cost: FlickPay does not require a signup or monthly fee.
Security: The m-payment application encrypts the individual’s card details and
requires an app specific PIN
iKhokha
Description: iKhokha is a South African mobile POS payment solution that
facilitates credit and debit card payments through a smartphone or tablet
Product Description: The Edge is a portable mobile-friendly magstripe and
chip and PIN card reader that plugs into a smartphone or tablet. An iKhokha m-
payment application works in conjunction with the card reader to allow the
merchant to process payments.
Primary function: restaurants, bills, airtime
Cost: Merchants are required to buy The Edge for a once-off price of R1139, or
rent it for R80 pm (x24months). Additionally, iKhokha charge an activation
cost of R250 once-off. Commission is charged at: 2.75% per transaction (ex.
VAT). Settlement for day’s transaction charged at R2.
Regulation: iKhokha requires merchants to be FiCA approved to purchase The
Edge.
Yoco
Description: Yoco is a South African mobile POS payment solution that
facilitates credit and debit card payments through a smartphone or tablet.
Product Description: The payment solution uses Yoco’s Contact Card Reader,
or Wireless Card Reader. A Yoco m-payment application works in conjunction
with the card reader to allow the merchant to process payments.
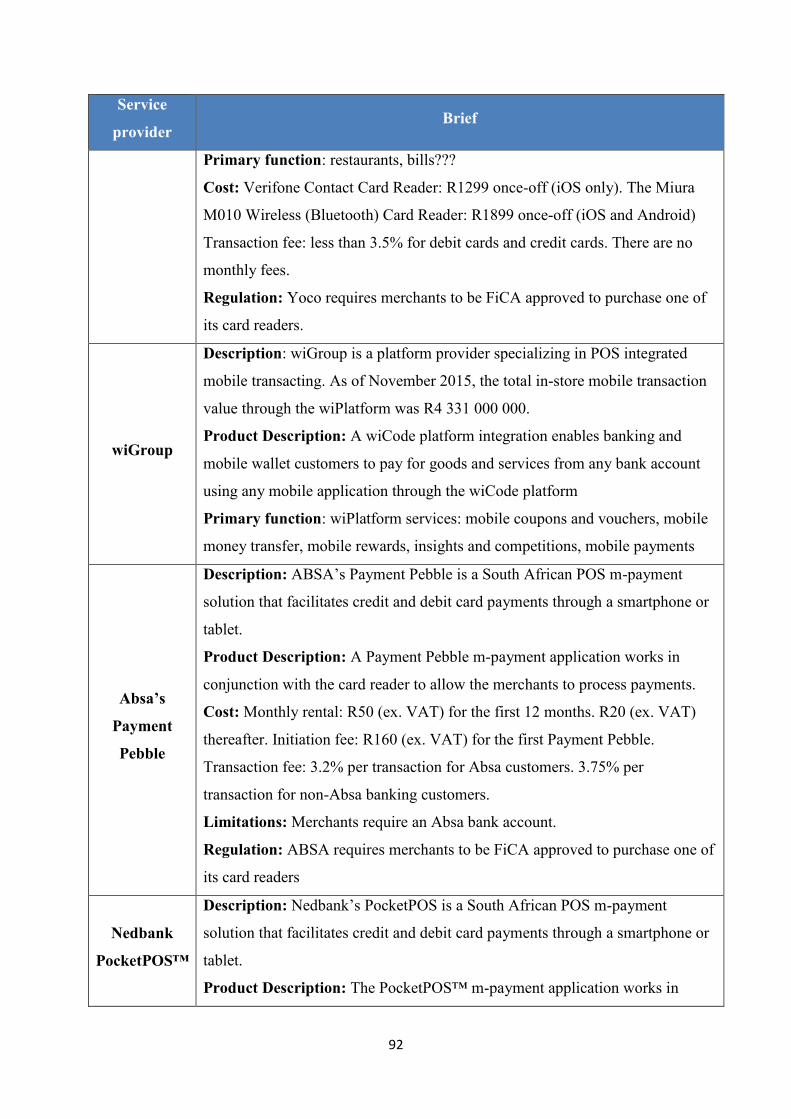
92
Service
provider Brief
Primary function: restaurants, bills???
Cost: Verifone Contact Card Reader: R1299 once-off (iOS only). The Miura
M010 Wireless (Bluetooth) Card Reader: R1899 once-off (iOS and Android)
Transaction fee: less than 3.5% for debit cards and credit cards. There are no
monthly fees.
Regulation: Yoco requires merchants to be FiCA approved to purchase one of
its card readers.
wiGroup
Description: wiGroup is a platform provider specializing in POS integrated
mobile transacting. As of November 2015, the total in-store mobile transaction
value through the wiPlatform was R4 331 000 000.
Product Description: A wiCode platform integration enables banking and
mobile wallet customers to pay for goods and services from any bank account
using any mobile application through the wiCode platform
Primary function: wiPlatform services: mobile coupons and vouchers, mobile
money transfer, mobile rewards, insights and competitions, mobile payments
Absa’s
Payment
Pebble
Description: ABSA’s Payment Pebble is a South African POS m-payment
solution that facilitates credit and debit card payments through a smartphone or
tablet.
Product Description: A Payment Pebble m-payment application works in
conjunction with the card reader to allow the merchants to process payments.
Cost: Monthly rental: R50 (ex. VAT) for the first 12 months. R20 (ex. VAT)
thereafter. Initiation fee: R160 (ex. VAT) for the first Payment Pebble.
Transaction fee: 3.2% per transaction for Absa customers. 3.75% per
transaction for non-Absa banking customers.
Limitations: Merchants require an Absa bank account.
Regulation: ABSA requires merchants to be FiCA approved to purchase one of
its card readers
Nedbank
PocketPOS™
Description: Nedbank’s PocketPOS is a South African POS m-payment
solution that facilitates credit and debit card payments through a smartphone or
tablet.
Product Description: The PocketPOS™ m-payment application works in
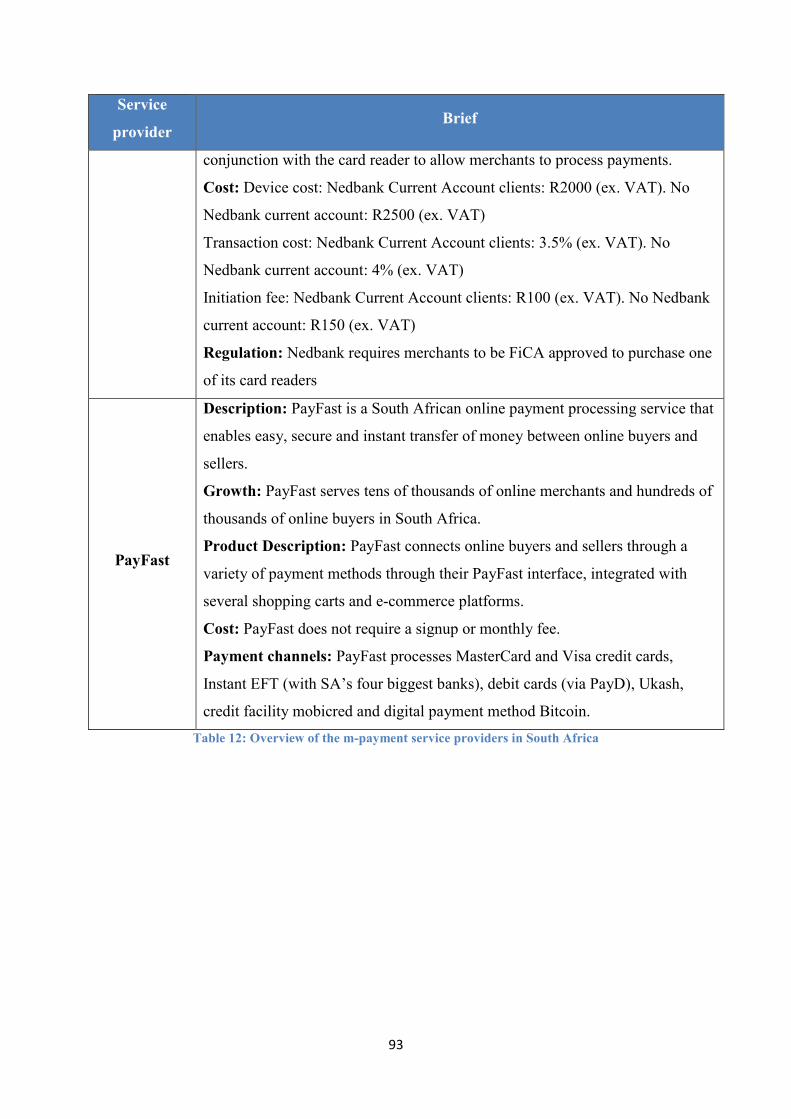
93
Service
provider Brief
conjunction with the card reader to allow merchants to process payments.
Cost: Device cost: Nedbank Current Account clients: R2000 (ex. VAT). No
Nedbank current account: R2500 (ex. VAT)
Transaction cost: Nedbank Current Account clients: 3.5% (ex. VAT). No
Nedbank current account: 4% (ex. VAT)
Initiation fee: Nedbank Current Account clients: R100 (ex. VAT). No Nedbank
current account: R150 (ex. VAT)
Regulation: Nedbank requires merchants to be FiCA approved to purchase one
of its card readers
PayFast
Description: PayFast is a South African online payment processing service that
enables easy, secure and instant transfer of money between online buyers and
sellers.
Growth: PayFast serves tens of thousands of online merchants and hundreds of
thousands of online buyers in South Africa.
Product Description: PayFast connects online buyers and sellers through a
variety of payment methods through their PayFast interface, integrated with
several shopping carts and e-commerce platforms.
Cost: PayFast does not require a signup or monthly fee.
Payment channels: PayFast processes MasterCard and Visa credit cards,
Instant EFT (with SA’s four biggest banks), debit cards (via PayD), Ukash,
credit facility mobicred and digital payment method Bitcoin. Table 12: Overview of the m-payment service providers in South Africa
94
8. References
Accenture. 2014. Driving the Adoption of Mobile Payments - What SA Consumers Want.
http://www.cas-ag.eu/SiteCollectionDocuments/Local_South_Africa/PDF/Accenture-driving-
Adoption-for-Mobile-Payments-What-do-consumers-South-Africa-want.pdf [Online: 2
March 2015].
Ahmad, K., Bertrand, S. and du Toit, G. 2014. Mobile Payments: The Next Step in a Bank’s
Digital Journey. Bain & Company.
http://www.bain.com/Images/BAIN_BRIEF_Mobile_payments_the_next_step_in_a_banks_d
igital_journey.pdf [Online: 3 May 2015].
Au, Y.A. and Kauffman, R.J. 2008. The Economics of Mobile Payments: Understanding
Stakeholder Issues for an Emerging Financial Technology Application. Electronic Commerce
Research and Applications. Vol.7: 141 - 164.
Bertrand, S. and Ahmad, K. 2014. Mobile Payments: Finally Ready to Take Off? Bain &
Company. http://www.bain.com/publications/articles/mobile-payments-finally-ready-to-take-
off.aspx [Online: 3 March 2015].
Bill and Melinda Gates Foundation. 2015. Our Big Bet for the Future. 2015 Gates Annual
Letter.
https://al2015.gatesnotesazure.com/assets/media/documents/2015_Gates_Annual_Letter_EN.
pdf [Online: 3 March 2015].
Chen, J.J. and Adams, C. 2005. User Acceptance of Mobile Payments: A Theoretical Model
for Mobile Payments. Proceedings of the Fifth International Conference on Electronic
Business. Hong Kong, China. 619 - 624.
95
Chen, L.D. 2008. A Model of Consumer Acceptance of M-Payment. International Journal of
Mobile Communications. Vol.6, No.1: 32 - 52.
Clarke, I. 2001. Emerging Value Propositions for M-Commerce. Journal of Business
Strategies. Vol. 18, No.2: 133 - 149
Coffey, A. and Atkinson, P. 1996. Making Sense of Qualitative Data: Complementary
Research Strategies. Thousand Oaks: Sage.
Cole, F.L. 1988. Content Analysis: Process and Application. Clinical Nurse Specialist. Vol.2,
No.1: 53 - 57.
ControlScan, 2013. Small Merchants and Mobile Payments: 2013 Survey of Technology
Awareness and Adoption. https://www.controlscan.com/small-merchants-and-mobile-
payments-white-paper. [Online: 3 July 2015].
Cooper, R.B. and Zmud, R.W. 1990. Information Technology Implementation Research: A
Technological Diffusion Approach. Informs: Management Science. Vol.36, No.2: 123 - 139.
Dahlberg, T., Mallat, N., Ondrus, J. and Zmijewska, A. 2007. Past, Present and Future of
Mobile Payments Research: A Literature Review. Electronic Commerce Research and
Applications. Vol.7, No.2. 165 - 181.
Davis, F.D., Bagozzi, R.P. and Warshaw, P.R. 1989. User Acceptance of Computer
Technology: A Comparison of Two Theoretical Models. Management Science. Vol.35, No.8:
982 - 1003.

96
Deloitte University Press. 2015. Smart Device, Smart Pay: Taking Mobile Payments from
Coffee Shops to Retail Stores. http://dupress.com/articles/mpayments-mobile-pos-system-in-
retail [Online: 3 December 2015].
Dey, I. 1993. Qualitative Data Analysis. A User-Friendly Guide for Social Scientists.
London, England.
Dillman, D.A. 1978. Mail and Telephone Surveys: The Total Design Method. New York:
John Wiley and Sons.
Economides, N. and Himmelberg, C. 1995. Critical Mass and Network Size with Application
to the US FAX Market. Paper No: EC-95-11. New York University, Stern
School of Business.
Elo, S. and Kyngäs, S.H. 2008. The Qualitative Content Analysis Process. Journal of
Advanced Nursing. Vol.62, No.1: 107 – 115.
Ericsson. 2014. Boost The Uptake of Mobile Money With Incentives. Ericsson M-commerce:
The Call for the Change Blog. http://www.ericsson.com/m-commerce/blog/boost-uptake-
mobile-money-incentives [Online: 1 February 2016].
Fishbein, M. and Ajzen, I. 1975. Belief, Attitude, Intention and Behavior: An Introduction to
Theory and Research. Reading: Addison-Wesley.
Frolic, M.N. and Chen, L. 2004. Assessing M-commerce Opportunities. Information Systems
Management. Vol.21: 53 - 61.
97
Ghezzi, A., Renga, F., Balocco, R. and Pescetto, P. 2010. Mobile Payment Applications:
Offer State of The Art in the Italian Market. Vol.12, No.5: 3 - 22. Emerald Group Publishing
Limited.
GSMA. 2015a. One Billion New Unique Mobile Subscribers by 2020.
http://www.gsma.com/newsroom/press-release/one-billion-new-unique-mobile-subscribers-
by-2020-gsma [Online: 10 March 2015].
GSMA. 2015b. The Mobile Economy.
http://www.gsmamobileeconomy.com/GSMA_Global_Mobile_Economy_Report_2015.pdf
[Online: 8 December 2015].
Guo, J. and Harry, B. 2014. Developing an Analytical Framework for Mobile Payments
Acceptance: Merchants’ Perspective. Proceedings of 13th International Conference on
Mobile Business. London, England.
Hsieh, H.F. and Shannon, S.E. 2005. Three Approaches to Qualitative Content Analysis.
Qualitative Health Research, Vol.15, No.9. 1277 - 1288.
Iansiti, M. and Levien, R. 2004. The Keystone Advantage: What the New Dynamics of
Business Ecosystems Means for Strategy, Innovation, and Sustainability. Harvard Business
School Press.
Jarvenpaa, S.L. and Lang, K.R. 2005. Managing the Paradoxes of Mobile Technology.
Information systems management. Vol.22: 7 - 23.
Kadhiwal, S. and Zulfiquar, A. 2007. Analysis of Mobile Payment Security Measures and
Different Standards. Elsevier Ltd. Computer Fraud & Security. Vol.6: 12 - 16.

98
Katz, M. and Shapiro, C. 1992. Product Introduction with Network Externalities. The Journal
of Industrial Economics. Vol.XL, No.1.
Kauffman, R.J., McAndrews, J. and Wang, Y. 2000. Opening the "Black Box" of Network
Externalities in Network Adoption. Informs. Information Systems Research. Vol.11, No.1:
61 - 82.
Kim, C., Mirusmonov, M. and Lee, I. 2010. An Empirical Examination of Factors
Influencing the Intention to Use Mobile Payments. Elsevier Ltd. Computers in Human
Behavior. Vol.26, No.3. 310 - 322.
Kondracki, N.L., Wellman, N.S. and Amundson, D.R. 2002. Content Analysis: Review of
Methods and Their Applications in Nutrition Education. Journal of Nutrition Education and
Behavior. Vol.34: 224 - 230.
Kwon, T.H. and Zmud, R.W. 1987. Unifying the Fragmented Models of Information Systems
Implementation. Critical Issues in Information Systems Research. New York: John Wiley &
Sons.
Lai, P.M. and Chuah, K.B., 2010. Developing an Analytical Framework for Mobile Payments
Adoption in Retailing: A Supply-Side Perspective. Fourth International Conference on
Management of e-Commerce and e-Government (ICMeCG). IEEE. Chengdu, China. 356 –
361.
Le Cordeur, 2014. App Yourself a Cup of Coffee. Fin24.
http://www.fin24.com/Tech/News/App-yourself-a-cup-of-coffee-20140710 [Online: 7
October 2015].
99
Linck, K., Pousttchi, K. and Wiedemann, D.G. 2006. Security Issues in Mobile Payment from
the Customer Viewpoint. In Proceedings of the 14th European Conference on Information
Systems. ECIS. Göteborg, Sweden.
Mallat, N. and Tuunainen, V.P. 2005. Merchant Adoption of Payment Systems. Proceedings
of the International Conference on Mobile Business (ICMB’05). IEEE.
Mallat, N. and Tuunainen, V.P. 2008. Exploring Merchant Adoption of Mobile Payment
Systems: An Empirical Study. Indiana University Press. E-Service Journal. Vol.6, No.2: 24-
57.
MasterCard. 2012. The Mobile Payments Readiness Index: A Global Market Assessment.
MasterCard Worldwide. New York, United States of America.
Medhi, D. 1999. Network Reliability and Fault Tolerance. Wiley Encyclopaedia of Electrical
& Electronics Engineering. http://sce2.umkc.edu/csee/dmedhi/papers/old/m_jweee99.pdf
[Online: 3 February 2014].
Mohammadi, S. and Jahanshahi, H. 2008. A Study of Mobile Payment Systems’
Functionality in Europe. Proceedings of l1th International Conference on Computer and
Information Technology. Khulna, Bangladesh.
Moore, G.C. and Benbasat, I. 1991. Development of an Instrument to Measure the
Perceptions of Adopting an Information Technology Innovation. Information Systems
Research. Vol.2, No.3: 192 - 223.
Morgan, D.L. 1993. Qualitative Content Analysis: A Guide to Paths Not Taken. Qualitative
Health Research. Vol.3, No. 112.
100
Ondrus, J. and Pigneur, Y. 2006. Towards a Holistic Analysis of Mobile Payments: A
Multiple Perspectives Approach. Electronic Commerce Research and Applications. Vol.5,
Issue 3: 246-257.
Orlikowski, W. J. and Iacono, S. C. 2001. Research Commentary: Desperately Seeking the
‘IT’ in IT Research—A Call to Theorizing the IT Artifact. Information Systems Research
Vol.12, No.2: 121–134.
Oxford Dictionary. 2016. http://www.oxforddictionaries.com/definition/english/sentiment
[Online: 5 February 2016].
Paymenteye. 2014. The Changing Face of Mobile Payments: An Overview of the Mobile
Revolution. http://www.paymenteye.com/white-papers/changing-face-of-mobile-payments
[Online: on 3 March 2015].
Plouffe, C.R., Hulland, J.S. and Vandenbosch, M. 2001a. Research Report: Richness versus
Parsimony in Modelling Technology Adoption Decisions - Understanding Merchant
Adoption of a Smart Card-Based Payment System. Information Systems Research. Vol.12,
No.2: 208 - 222.
Plouffe, C.R., Vandenbosch, M. and Hulland, J. 2001b. Intermediating Technologies and
Multigroup Adoption: A Comparison of Consumer and Merchant Adoption Intentions
Toward a New Electronic Payment System. The Journal of Product Innovation Management.
Vol. 18: 65 - 81.
Polasik, M., Gorka, J., Wilczewski, G., Kunkowski, J., Przenajkowska, K. and Tetkowska, N.
2012. Time Efficiency of Point of Sale Payment Methods: Empirical Results for Cash, Cards,
and Mobile Payment. Torun, Poland.
101
Pousttchi, K. 2003. Conditions for Acceptance and Usage of Mobile Payment Procedures.
mBusiness 2003 - The Second International Conference on Mobile Business. Vienna, Italy.
201 - 210.
Pousttchi, K 2007. An Analysis of the Mobile Payment Problem in Europe.
http://mpra.ub.unimuenchen.de/2915. MPRA. Paper No.2915.
Rogers, E. 1983. Diffusion of Innovations. Fourth Edition. New York: The Free Press.
Rook, D.W. 1987. Oxford University Press. Journal of Consumer Research. Vol.14, No.2:
189 – 199.
Shapiro, C. and Varian, H.R. 1999. Information Rules: A Strategic Guide to the Network
Economy. Harvard Business School Press. Boston, United States of America.
Shen, S. 2013. Forecast: Mobile Payment, Worldwide, 2013 Update. Gartner.
https://www.gartner.com/doc/2484915/forecast-mobile-payment-worldwide [Online: 11
December 2014].
Sheppard, B. H., Hartwick, J. and Warshaw, P.R. 1988. The Theory of Reasoned Action: A
Meta-Analysis of Past Research with Recommendations for Modifications and Future
Research. J. Consumer Res. Vol.15, No.3: 325 - 343.
Siau, K. and Shen, Z. 2003. Building Customer Trust in Mobile Commerce. ACM. Vol. 46,
No. 4.
Teo, E., Bardo, F. and Chandana, U. 2005. Inhibitors and Facilitators for Mobile Payment
Adoption in Australia: A Preliminary study. International Conference on Mobile Business
(ICMB’05). IEEE. California, United States of America. 663 - 666.
102
Tirole, J. 1988. The Theory of Industrial Organization. MIT Press. Cambridge, United States
of America.
Van der Heijden, H. 2002. Factors Affecting the Successful Introduction of Mobile Payment
Systems. 15th Bled Electronic Commerce Conference eReality: Constructing the eEconomy.
Bled, Slovenia.
Venkatesh, V. and Davis, F.D. 2000. A Theoretical Extension of the Technology Acceptance
Model: Four Longitudinal Field Studies. Informs: Management Science. Vol.46, No.2: 186 -
204.
wiGroup. 2015. SME Mobile Readiness Survey 2015. http://www.mobileforsme.com
[Online: 3 October 2015].
Weber, R.P. 1990. Basic Content Analysis. Beverly Hills: Sage.