
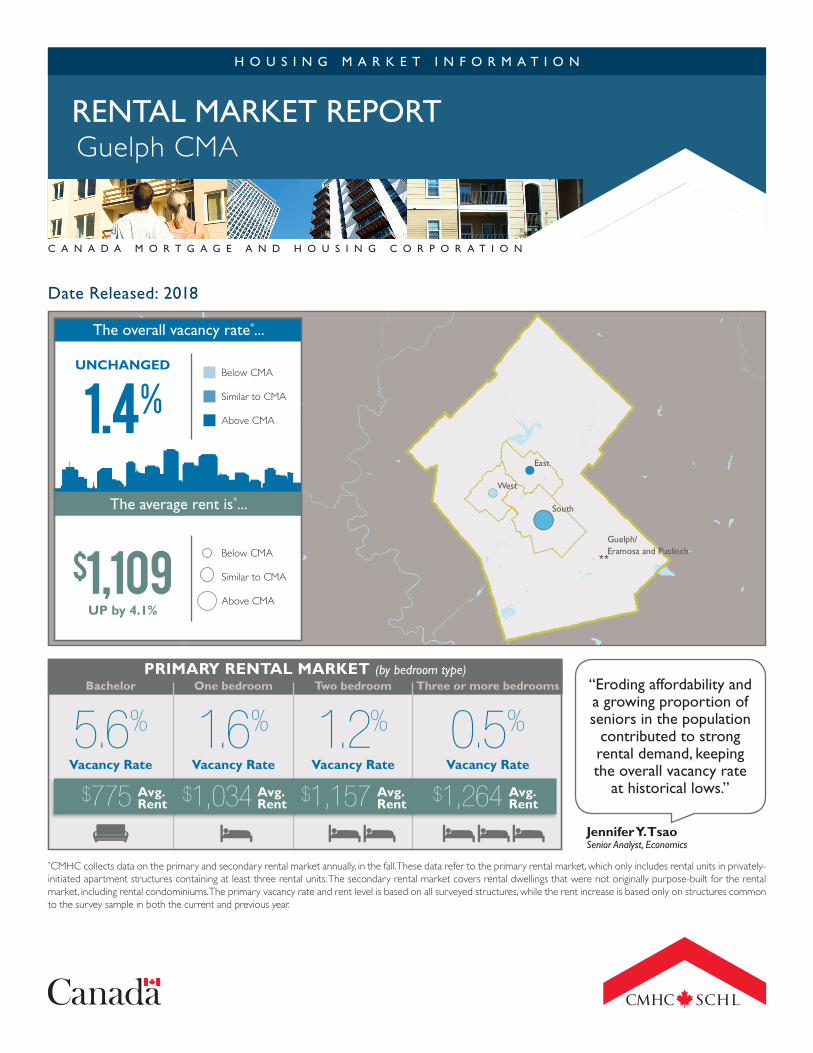
UNCHANGED 1 - assets.cmhc-schl.gc.ca
25
* * ! ( ! ( ! ( Guelph/ Eramosa and Puslinch West East South Vacancy Rate Vacancy Rate Vacancy Rate Vacancy Rate * CMHC collects data on the primary and secondary rental market annually, in the fall.These data refer to the primary rental market, which only includes rental units in privately- initiated apartment structures containing at least three rental units. The secondary rental market covers rental dwellings that were not originally purpose-built for the rental market, including rental condominiums.The primary vacancy rate and rent level is based on all surveyed structures, while the rent increase is based only on structures common to the survey sample in both the current and previous year. One bedroom Bachelor Two bedroom Three or more bedrooms Avg. Rent PRIMARY RENTAL MARKET (by bedroom type) Avg. Rent Avg. Rent Avg. Rent The overall vacancy rate * ... The average rent is * ... Below CMA Similar to CMA Above CMA Below CMA Similar to CMA Above CMA HOUSING MARKET INFORMATION RENTAL MARKET REPORT Date Released: CANADA MORTGAGE AND HOUSING CORPORATION Guelph CMA 2018 “Eroding affordability and a growing proportion of seniors in the population contributed to strong rental demand, keeping the overall vacancy rate at historical lows.” Jennifer Y.Tsao Senior Analyst, Economics 5.6 % 1.6 % 1.2 % 0.5 % $ 1,157 $ 1,264 $ 1,034 $ 775 UNCHANGED 1.4 % $ 1,109 UP by 4.1%
Transcript of UNCHANGED 1 - assets.cmhc-schl.gc.ca
**
!(
!(
!(Guelph/Eramosa and Puslinch
West
East
South
Vacancy Rate Vacancy RateVacancy Rate Vacancy Rate
*CMHC collects data on the primary and secondary rental market annually, in the fall. These data refer to the primary rental market, which only includes rental units in privately-initiated apartment structures containing at least three rental units. The secondary rental market covers rental dwellings that were not originally purpose-built for the rental market, including rental condominiums. The primary vacancy rate and rent level is based on all surveyed structures, while the rent increase is based only on structures common to the survey sample in both the current and previous year.
One bedroomBachelor Two bedroom Three or more bedrooms
Avg.Rent
PRIMARY RENTAL MARKET (by bedroom type)
Avg.Rent
Avg.Rent
Avg.Rent
The overall vacancy rate*...
The average rent is*...
Below CMA
Similar to CMA
Above CMA
Below CMA
Similar to CMA
Above CMA
H O U S I N G M A R K E T I N F O R M A T I O N
RENTAL MARKET REPORT
Date Released:
C A N A D A M O R T G A G E A N D H O U S I N G C O R P O R A T I O N
Guelph CMA
2018
“Eroding affordability and a growing proportion of seniors in the population
contributed to strong rental demand, keeping the overall vacancy rate
at historical lows.”
Jennifer Y. TsaoSenior Analyst, Economics
5.6% 1.6% 1.2% 0.5%
$1,157 $1,264 $1,034 $775
UNCHANGED
1.4%
$1,109UP by 4.1%
Rental Market Report - Guelph CMA - Date Released - 2018
2
Key Analysis Findings �� Rental supply has kept pace
with growth in demand
�� The vacancy rate increased for apartments renting above $1,200, but fell in units renting for less $1,200
�� Vacant apartments are renting at a 14% premium over occupied units
The Rental Market in Guelph Remains TightAccording to the Rental Market Survey (RMS) of October 2018, the vacancy rate in the Guelph Census Metropolitan Area remained stable at 1.4%, compared to 1.2% in October 20171,2. It is important to note that this vacancy rate is still below the ten-year historical average, indicating that rental market conditions remain tight. Demographic factors, such as the continuing growth of international students as well as the increasing proportion of seniors, continued to support rental demand.
Increase in Supply Kept Pace with Growth in DemandRental demand and supply for purpose-built apartments grew at the same pace this past year, where both increased by just under 300 units. Out of all bedroom types, 2-Bedroom units saw demand grow the most, by just over 7%. In addition, Guelph South saw a 6% increase in supply added, which was the strongest out of all the survey areas in Guelph CMA.
Year-over-year growth in rental demand has been picking up pace over the last two years, which coincides with the period of price acceleration. For instance, between 2016 Q1 and 2017 Q1, seasonally adjusted average MLS® prices in Guelph CMA grew by 28%. As of 2018, home prices continue to be relatively high. Amidst eroding affordability, more people are opting to stay in the rental market, partly explaining the growing rental demand; however, it is interesting to note that over the past year, the number of occupied units below the first quintile has decreased, while the number of occupied units above this same threshold has increased. This suggests that while homeownership has become more difficult, those who choose to rent prefer apartments of perhaps better quality. A tightening labour market, particularly in manufacturing, has allowed wages to grow, which facilitates this choice.
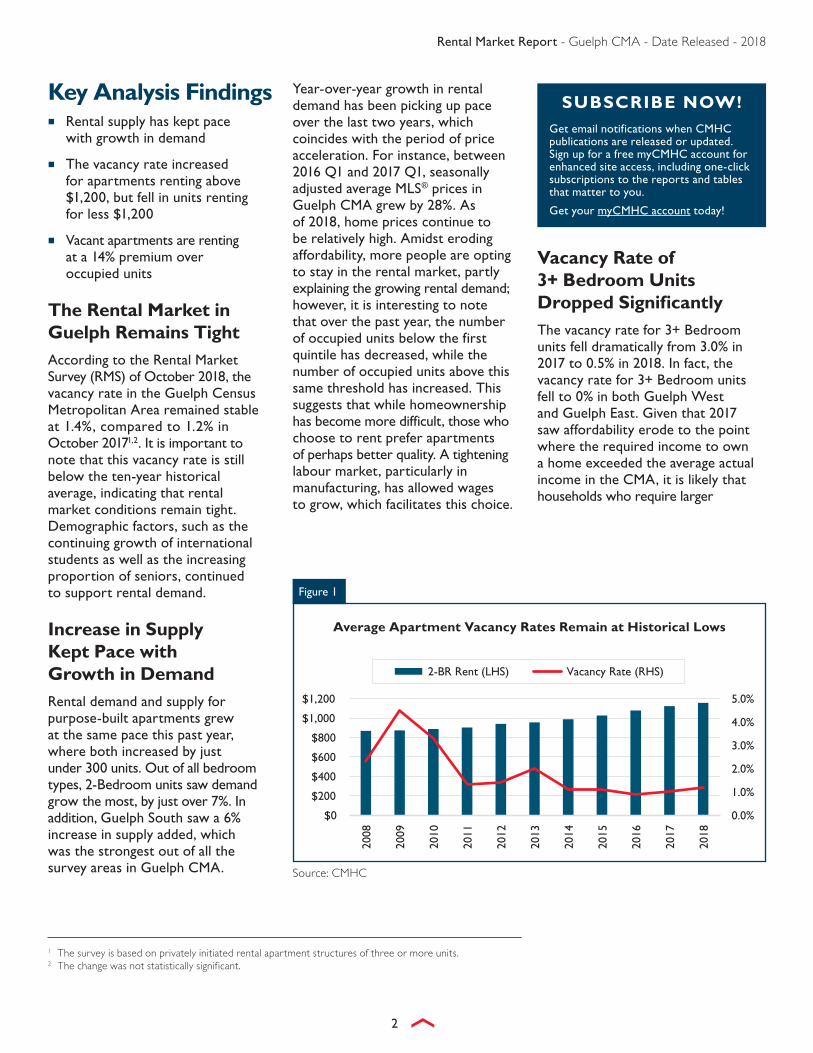
Vacancy Rate of 3+ Bedroom Units Dropped SignificantlyThe vacancy rate for 3+ Bedroom units fell dramatically from 3.0% in 2017 to 0.5% in 2018. In fact, the vacancy rate for 3+ Bedroom units fell to 0% in both Guelph West and Guelph East. Given that 2017 saw affordability erode to the point where the required income to own a home exceeded the average actual income in the CMA, it is likely that households who require larger
1 The survey is based on privately initiated rental apartment structures of three or more units.2 The change was not statistically significant.
SUBSCRIBE NOW!Get email notifications when CMHC publications are released or updated. Sign up for a free myCMHC account for enhanced site access, including one-click subscriptions to the reports and tables that matter to you.
Get your myCMHC account today!
0.0%
1.0%
2.0%
3.0%
4.0%
5.0%
$0
$200
$400
$600
$800
$1,000
$1,200
2008
2009
2010
2011
2012
2013
2014
2015
2016
2017
2018
2-BR Rent (LHS) Vacancy Rate (RHS)
Source: CMHC
Figure 1
Average Apartment Vacancy Rates Remain at Historical Lows

Rental Market Report - Guelph CMA - Date Released - 2018
3
homes – for example, families – are staying in the rental market and saving up for homeownership. As mortgage carrying costs increased in 2018, this trend of stronger demand for larger rental units is likely to continue.
Average Apartment Rents Increased above Provincial GuidelineThe increase in the average rent for a sample of apartment structures common to the RMS in 2017 and 2018 was 4.1%, up from 3.4% between 2016 and 2017.3 This is above the 1.8% provincial guideline for 2018. The turnover rate4 in Guelph was 17.5% in October 2018, down from 23.4% a year earlier, but still above the
provincial average. A higher turnover rate allows landlords to raise the rent on vacated units more often, which can contribute to average rents increasing above the provincial guideline. In Guelph, vacant units are renting at an average of 14% above occupied units.
Unsurprisingly, out of all the survey zones in Guelph CMA, the turnover rate was highest in Guelph South, at 20.0%. Since this is in proximity to the University of Guelph, the larger proportion of student population explains the higher turnover. As a result, Guelph South continues to exhibit the strongest increase in average rent, which was 4.6% in between October 2017 and 2018.
3 When comparing year-over-year average rents, the age of the building needs to be taken into consideration because rents in newly built structures tend to be higher than in existing buildings. By comparing rents for units that are common to both 2017 and 2018 Fall Rental Market Surveys, we can get a better indication of actual rent increases paid by most tenants.
4 Please see Methodology and/or Definitions for the definition of turnover and the calculation of turnover rate.

Rental Market Report - Guelph CMA - Date Released - 2018
4
Puslinch
Guelph
Guelph/Eramosa
Erin
CentreWellington
Milton
HaltonHills
Hamilton
NorthDumfries
Cambridge
Kitchener
Woolwich
01
02
03
04
Zone - Name
01 - West
02 - South
03 - East
04 - Guelph/Eramosa and Puslinch
Municipal Boundary (2016) 0 5.5 11km´

Rental Market Report - Guelph CMA - Date Released - 2018
5
Zone 1 West - CTs: 0009.03, 0009.04, 0009.05, 0009.06, 0010.01, 0010.02, 0011.00 and 0015.00. Description: City of Guelph West of the Speed River, North of Suffolk/Paisley, West of the Hanlon Parkway, East of Whitelaw, South of Malcolm/Wilbert.
Zone 2 South - CTs: 0001.02, 0001.03, 0001.05, 0001.06, 0001.07, 0001.08, 0001.09, 0002.00, 0006.00, 0007.00 and 0008.00. Description: City of Guelph East of the Speed River, South of Suffolk/Paisley, West of Victoria, North of Maltby Rd
Zone 3 East - CTs: 0003.00, 0004.01, 0004.02, 0004.03, 0005.00, 0012.00, 0013.01 and 0013.02. Description: City of Guelph East of the Speed River, North of the Eramosa River, West of Norton/Marshall.
Zone 4 Townships - CTs: 0014.00, 0100.00 and 0101.00. Description: Guelph/Eramosa and Puslinch.
Zones 1-4 Guelph CMA
RMS ZONE DESCRIPTIONS - GUELPH CMA

Rental Market Report - Guelph CMA - Date Released - 2018
6
Available in ALL Rental Market Reports
Private Apartment Data: 1.1.1 Vacancy Rates (%) by Zone and Bedroom Type
1.1.2 Average Rents ($) by Zone and Bedroom Type
1.1.3 Number of Units in the Universe by Zone and Bedroom Type
1.1.4 Availability Rates (%) by Zone and Bedroom Type (Not available for Québec centres)
1.1.5 Estimate of Percentage Change (%) of Average Rent by Zone and Bedroom Type
1.1.6 Turnover Rates (%) by Zone and Bedroom Type
1.2.1 Vacancy Rates (%) by Year of Construction and Bedroom Type
1.2.2 Average Rents ($) by Year of Construction and Bedroom Type
1.2.3 Turnover Rates (%) by Year of Construction and Bedroom Type
1.3.1 Vacancy Rates (%) by Structure Size and Bedroom Type
1.3.2 Average Rents ($) by Structure Size and Bedroom Type
1.3.3 Vacancy Rates (%) by Structure Size and Zone
1.3.4 Turnover Rates (%) by Structure Size and Bedroom Type
1.4 Vacancy Rates (%) by Rent Range and Bedroom Type Available in SELECTED Rental Market Reports
Private Row (Townhouse) Data: 2.1.1 Vacancy Rates (%) by Zone and Bedroom Type
2.1.2 Average Rents ($) by Zone and Bedroom Type
2.1.3 Number of Units in the Universe by Zone and Bedroom Type
2.1.4 Availability Rates (%) by Zone and Bedroom Type (Not available for Québec centres)
2.1.5 Estimate of Percentage Change (%) of Average Rent by Zone and Bedroom Type
2.1.6 Turnover Rates (%) by Zone and Bedroom Type
Private Apartment and Row (Townhouse) Data: 3.1.1 Vacancy Rates (%) by Zone and Bedroom Type
3.1.2 Average Rents ($) by Zone and Bedroom Type
3.1.3 Number of Units in the Universe by Zone and Bedroom Type
3.1.4 Availability Rates (%) by Zone and Bedroom Type (Not available for Québec centres)
3.1.5 Estimate of Percentage Change (%) of Average Rent by Zone and Bedroom Type
3.1.6 Turnover Rates (%) by Zone and Bedroom Type Available in the Halifax, Quebec, Montreal, Gatineau, Ottawa, Toronto, Hamilton, Kitchener-Cambridge-Waterloo, London, Winnipeg, Regina, Saskatoon, Edmonton, Calgary, Kelowna, Vancouver and Victoria Reports
Rental Condominium Apartment Data 4.1.1 Rental Condominium Apartments and Private Apartments in the RMS - Vacancy Rates (%)
4.1.2 Rental Condominium Apartments and Private Apartments in the RMS - Average Rents ($) by Bedroom Type
4.1.3 Rental Condominium Apartments - Average Rents ($) by Bedroom Type
4.2.1 Rental Condominium Apartments and Private Apartments in the RMS - Vacancy Rates (%) by Building Size
4.3.1 Condominium Universe, Rental Units, Percentage of Units in Rental and Vacancy Rate
4.3.2 Condominium Universe, Rental Units, Percentage of Units in Rental and Vacancy Rate by Project Size

Rental Market Report - Guelph CMA - Date Released - 2018
7
For an explanation of the letters and symbols used in the Rental Market tables, please refer to our Methodology page.
Zone 1 - West 0.0 d 2.1 c ↑ 1.6 b 1.5 b - 0.9 a 1.0 a - 1.0 a 0.0 c ↓ 1.1 a 1.2 a -
Zone 2 - South ** ** 1.1 a 1.5 a - 0.9 a 1.4 a - 0.0 c 1.5 d ↑ 1.0 a 1.4 a ↑Zone 3 - East ** ** 1.0 a ** 1.1 a 1.4 d - 6.6 c 0.0 d ↓ 1.8 c 2.1 c -
Zone 4 - Townships ** ** ** ** ** ** ** ** ** **
Guelph CMA ** 5.6 d 1.3 a 1.6 a - 1.0 a 1.2 a - 3.0 d 0.5 b ↓ 1.2 a 1.4 a -
Oct-18Oct-18 Oct-17 Oct-18 Oct-17Oct-18 Oct-17 Oct-18 Oct-17
1.1.1 Private Apartment Vacancy Rates (%)by Zone and Bedroom Type
Guelph CMA3 Bedroom + Total
ZoneBachelor 1 Bedroom 2 Bedroom
Oct-17
Zone 1 - West 790 a 805 a 972 a 1,021 a 1,109 a 1,134 a 1,223 a 1,270 a 1,062 a 1,094 a
Zone 2 - South 732 b 751 b 1,015 a 1,077 a 1,176 a 1,220 a 1,331 b 1,434 a 1,091 a 1,149 a
Zone 3 - East 770 a 817 b 893 a 931 a 1,081 a 1,115 a 1,124 a 1,117 b 1,033 a 1,066 a
Zone 4 - Townships ** ** ** ** ** ** ** ** ** **
Guelph CMA 751 a 775 a 980 a 1,034 a 1,124 a 1,157 a 1,200 a 1,264 a 1,066 a 1,109 a
Oct-18Oct-18 Oct-17 Oct-18 Oct-17Oct-18 Oct-17 Oct-18 Oct-17
1.1.2 Private Apartment Average Rents ($)by Zone and Bedroom Type
Guelph CMA
ZoneBachelor 1 Bedroom 2 Bedroom 3 Bedroom + Total
Oct-17
Rental Market Report - Guelph CMA - Date Released - 2018
8
For an explanation of the letters and symbols used in the Rental Market tables, please refer to our Methodology page.
by Zone and Bedroom TypeGuelph CMA
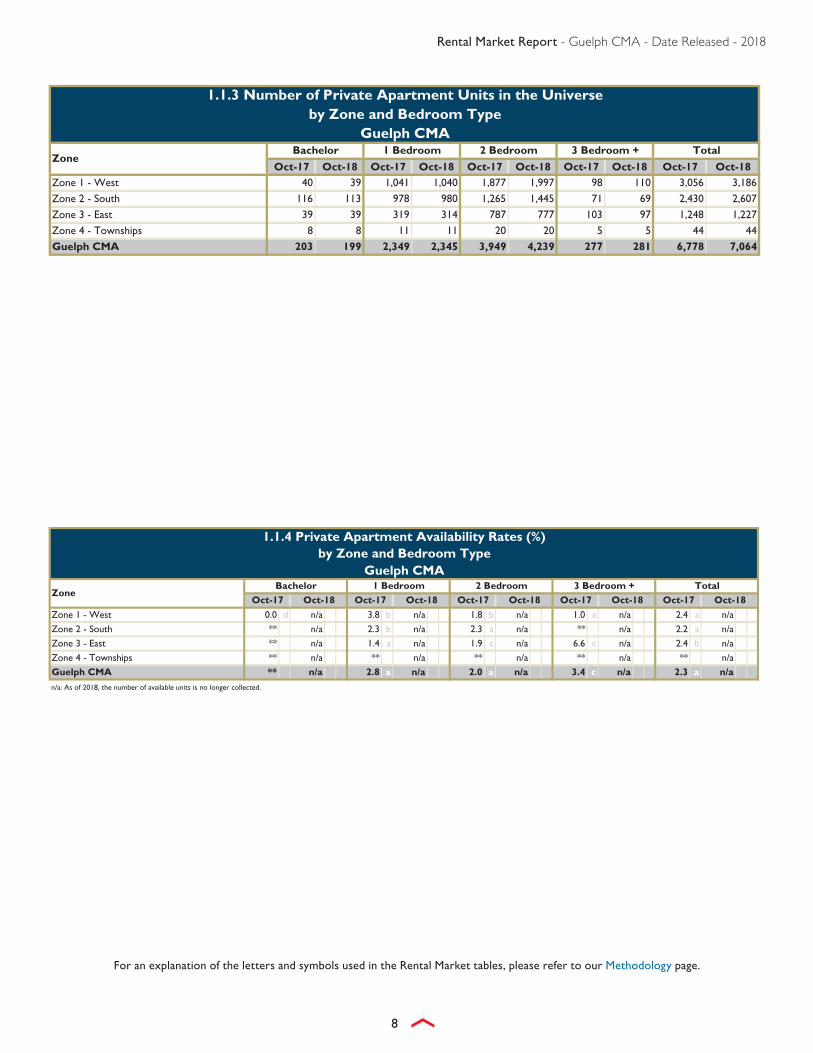
Oct-17 Oct-18 Oct-17 Oct-18 Oct-17 Oct-18 Oct-17 Oct-18 Oct-17 Oct-18Zone 1 - West 40 39 1,041 1,040 1,877 1,997 98 110 3,056 3,186
Zone 2 - South 116 113 978 980 1,265 1,445 71 69 2,430 2,607
Zone 3 - East 39 39 319 314 787 777 103 97 1,248 1,227
Zone 4 - Townships 8 8 11 11 20 20 5 5 44 44
Guelph CMA 203 199 2,349 2,345 3,949 4,239 277 281 6,778 7,064
Total
1.1.3 Number of Private Apartment Units in the Universe
ZoneBachelor 1 Bedroom 2 Bedroom 3 Bedroom +
1.1.4 Private Apartment Availability Rates (%)by Zone and Bedroom Type
Guelph CMA
Zone 1 - West 0.0 d n/a 3.8 b n/a 1.8 b n/a 1.0 a n/a 2.4 a n/a
Zone 2 - South ** n/a 2.3 b n/a 2.3 a n/a ** n/a 2.2 a n/a
Zone 3 - East ** n/a 1.4 a n/a 1.9 c n/a 6.6 c n/a 2.4 b n/a
Zone 4 - Townships ** n/a ** n/a ** n/a ** n/a ** n/a
Guelph CMA ** n/a 2.8 a n/a 2.0 a n/a 3.4 c n/a 2.3 a n/a
n/a: As of 2018, the number of available units is no longer collected.
Oct-17 Oct-18Oct-17 Oct-18 Oct-17 Oct-183 Bedroom + Total
ZoneBachelor 1 Bedroom 2 Bedroom
Oct-17 Oct-18 Oct-17 Oct-18

Rental Market Report - Guelph CMA - Date Released - 2018
9
For an explanation of the letters and symbols used in the Rental Market tables, please refer to our Methodology page.
1.1.5 Private Apartment Estimate of Percentage Change (%) of Average Rent 1
by Zone and Bedroom TypeGuelph CMA
Zone 1 - West ** 4.5 d ** 5.2 c 2.3 c 3.6 c ++ 3.4 b 2.3 c 4.2 c
Zone 2 - South ++ 3.2 b 5.3 b 4.9 b 4.8 b 4.4 b 3.1 d ** 4.7 b 4.6 a
Zone 3 - East ** ** 4.8 d ** 3.4 d 3.4 d 2.2 c ** 3.4 c 3.1 d
Zone 4 - Townships ** ** ** ** ** ** ** ** ** **
Guelph CMA ** 3.9 d 3.8 c 4.8 b 3.4 b 3.9 b 2.1 c ++ 3.4 b 4.1 b1The Percentage Change of Average Rent is a measure of the market movement, and is based on those structures that were common to the survey sample for both years.
Oct-17 Oct-18
Oct-17
Oct-17 Oct-18 Oct-17
Oct-16
Oct-18
Oct-17to to
2 Bedroom
Zone
Bachelor 1 Bedroom
to to to toOct-16 Oct-17 Oct-16
3 Bedroom + TotalOct-16 Oct-17 Oct-16 Oct-17
Oct-17 Oct-18to to
Oct-17 Oct-18to to
Zone 1 - West ** ** ** 23.0 d ** 12.6 c ** ** ** 15.9 d Zone 2 - South ** ** ** 19.0 d ** 20.2 d ** ** ** 20.0 d Zone 3 - East ** ** ** ** ** 14.4 d ** ** 12.3 d 16.8 d ↑Zone 4 - Townships ** ** ** ** ** ** ** ** ** ** Guelph CMA ** ** ** 20.7 d 19.2 d 15.1 d ↓ 13.9 d ** 23.4 d 17.5 a ↓
Oct-18 Oct-17 Oct-18
Oct-18 Oct-17 Oct-18 Oct-17
Oct-18 Oct-17Oct-17
1.1.6 Private Apartment Turnover Rates (%)by Zone and Bedroom Type
Guelph CMA
ZoneBachelor 1 Bedroom 2 Bedroom 3 Bedroom + Total

Rental Market Report - Guelph CMA - Date Released - 2018
10
For an explanation of the letters and symbols used in the Rental Market tables, please refer to our Methodology page.
1.2.1 Private Apartment Vacancy Rates (%)by Year of Construction and Bedroom Type
Guelph CMA
Guelph CMAPre 1960 0.0 d ** 0.0 d ** 0.0 c ** 0.0 d 0.0 d - 0.0 c **
1960 - 1974 ** ** 1.6 a 1.6 b - 1.2 a 1.3 a - 4.2 d 0.7 b ↓ 1.5 a 1.4 a -
1975 - 1989 ** ** 1.0 a 1.1 a - 0.8 a 1.1 a ↑ 1.7 c ** 0.9 a 1.1 a -
1990+ - - 0.0 d ** 0.0 d 0.0 d - ** ** 0.0 d ** Total ** 5.6 d 1.3 a 1.6 a - 1.0 a 1.2 a - 3.0 d 0.5 b ↓ 1.2 a 1.4 a -
Oct-17 Oct-18Oct-17 Oct-18 Oct-17 Oct-183 Bedroom + Total
Year of ConstructionBachelor 1 Bedroom 2 Bedroom
Oct-17 Oct-18 Oct-17 Oct-18
Guelph CMAPre 1960 643 b 680 b 880 b 896 b 1,053 a 1,081 b 1,152 b ** 937 b 961 b
1960 - 1974 781 a 787 b 962 a 1,014 a 1,083 a 1,112 a 1,157 a 1,225 b 1,040 a 1,082 a
1975 - 1989 869 a 899 a 1,023 a 1,082 a 1,195 a 1,243 a 1,343 a 1,442 a 1,125 a 1,174 a
1990+ - - ** 1,148 d 1,343 c ** ** ** 1,326 c 1,261 d
Total 751 a 775 a 980 a 1,034 a 1,124 a 1,157 a 1,200 a 1,264 a 1,066 a 1,109 a
Oct-18Oct-18 Oct-17 Oct-18 Oct-17Oct-18 Oct-17 Oct-18 Oct-17
1.2.2 Private Apartment Average Rents ($)by Year of Construction and Bedroom Type
Guelph CMA
Year of ConstructionBachelor 1 Bedroom 2 Bedroom 3 Bedroom + Total
Oct-17

Rental Market Report - Guelph CMA - Date Released - 2018
11
For an explanation of the letters and symbols used in the Rental Market tables, please refer to our Methodology page.
1.2.3 Private Apartment Turnover Rates (%)by Year of Construction and Bedroom Type
Guelph CMA
Guelph CMA Pre 1960 ** ** ** ** ** ** ** 0.0 d 29.2 d **
1960 - 1974 ** ** ** 18.3 d 18.7 d 15.0 a ↓ ** ** ** 16.5 a
1975 - 1989 ** ** ** 23.9 d ** ** ** ** ** 19.2 d
1990+ - - ** ** ** ** ** ** ** ** Total ** ** ** 20.7 d 19.2 d 15.1 d ↓ 13.9 d ** 23.4 d 17.5 a ↓
Oct-17 Oct-18 Oct-17 Oct-18
Oct-18Total
Oct-18Year of Construction
Oct-17Bachelor
Oct-17 Oct-181 Bedroom
Oct-172 Bedroom 3 Bedroom +
1.3.1 Private Apartment Vacancy Rates (%)by Structure Size and Bedroom Type
Guelph CMA
Guelph CMA3 to 5 Units ** ** 0.0 d 0.0 d - ** ** 0.0 d 0.0 d - ** **
6 to 19 Units ** ** ** ** 0.5 b ** ** 0.0 d 1.4 a 2.1 c -
20 to 49 Units ** 3.5 c 0.5 b 1.5 a ↑ 1.3 a 1.9 c - 0.0 c 2.4 c ↑ 0.9 a 1.8 c ↑50 to 99 Units 0.0 a 2.6 a ↑ 1.8 a 1.7 a - 1.3 a 1.0 a - 0.0 a 0.0 c - 1.4 a 1.3 a -
100+ Units 5.5 a 0.0 a ↓ 0.9 a 0.6 a - 0.4 a 0.8 a ↑ ** ** 0.7 a 0.7 a -
Total ** 5.6 d 1.3 a 1.6 a - 1.0 a 1.2 a - 3.0 d 0.5 b ↓ 1.2 a 1.4 a -
Oct-17 Oct-18Oct-17 Oct-18 Oct-17 Oct-183 Bedroom + Total
SizeBachelor 1 Bedroom 2 Bedroom
Oct-17 Oct-18 Oct-17 Oct-18
Rental Market Report - Guelph CMA - Date Released - 2018
12
For an explanation of the letters and symbols used in the Rental Market tables, please refer to our Methodology page.
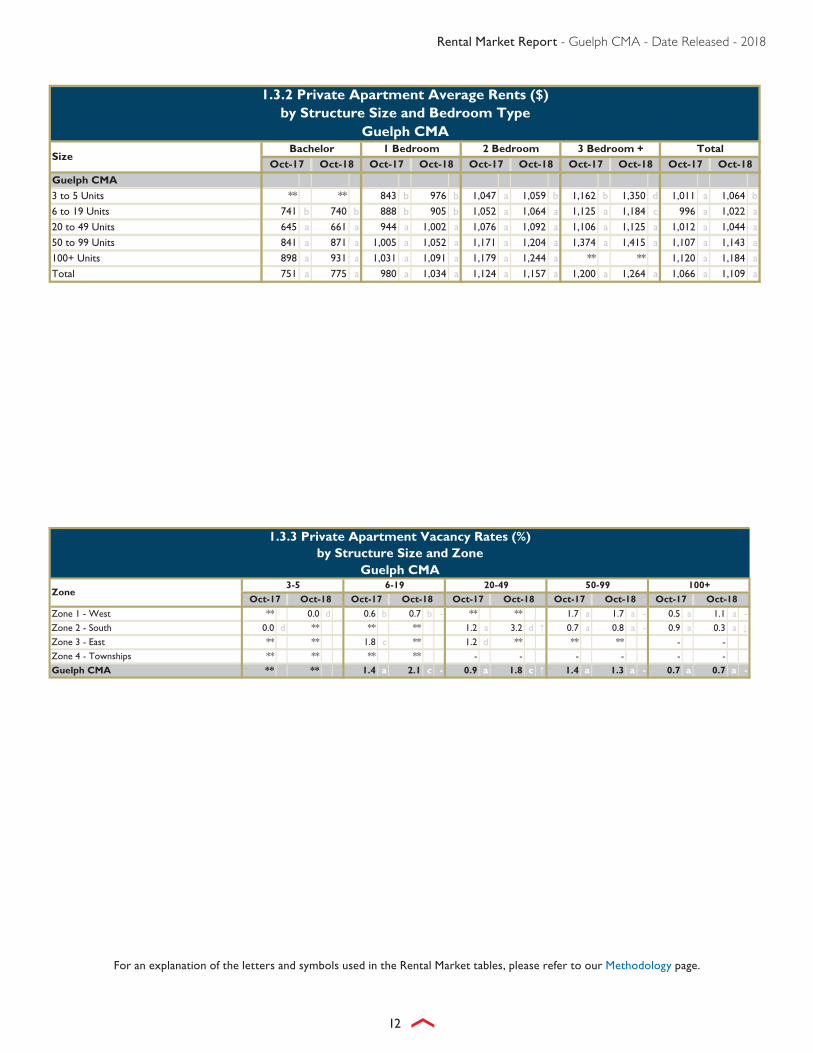
Guelph CMA3 to 5 Units ** ** 843 b 976 b 1,047 a 1,059 b 1,162 b 1,350 d 1,011 a 1,064 b
6 to 19 Units 741 b 740 b 888 b 905 b 1,052 a 1,064 a 1,125 a 1,184 c 996 a 1,022 a
20 to 49 Units 645 a 661 a 944 a 1,002 a 1,076 a 1,092 a 1,106 a 1,125 a 1,012 a 1,044 a
50 to 99 Units 841 a 871 a 1,005 a 1,052 a 1,171 a 1,204 a 1,374 a 1,415 a 1,107 a 1,143 a
100+ Units 898 a 931 a 1,031 a 1,091 a 1,179 a 1,244 a ** ** 1,120 a 1,184 a
Total 751 a 775 a 980 a 1,034 a 1,124 a 1,157 a 1,200 a 1,264 a 1,066 a 1,109 a
Oct-18Oct-18 Oct-17 Oct-18 Oct-17Oct-18 Oct-17 Oct-18 Oct-17
1.3.2 Private Apartment Average Rents ($)by Structure Size and Bedroom Type
Guelph CMA
SizeBachelor 1 Bedroom 2 Bedroom 3 Bedroom + Total
Oct-17
1.3.3 Private Apartment Vacancy Rates (%)by Structure Size and Zone
Guelph CMA
Zone 1 - West ** 0.0 d 0.6 b 0.7 b - ** ** 1.7 a 1.7 a - 0.5 a 1.1 a -
Zone 2 - South 0.0 d ** ** ** 1.2 a 3.2 d ↑ 0.7 a 0.8 a - 0.9 a 0.3 a ↓Zone 3 - East ** ** 1.8 c ** 1.2 d ** ** ** - -
Zone 4 - Townships ** ** ** ** - - - - - -
Guelph CMA ** ** 1.4 a 2.1 c - 0.9 a 1.8 c ↑ 1.4 a 1.3 a - 0.7 a 0.7 a -
Oct-17 Oct-18Zone
3-5 6-19 20-49Oct-17 Oct-18 Oct-17 Oct-18Oct-17 Oct-18
50-99 100+Oct-17 Oct-18

Rental Market Report - Guelph CMA - Date Released - 2018
13
For an explanation of the letters and symbols used in the Rental Market tables, please refer to our Methodology page.
1.3.4 Private Apartment Turnover Rates (%)by Structure Size and Bedroom Type
Guelph CMA
Guelph CMA 3 to 5 Units ** ** ** ** ** ** ** ** ** ** 6 to 19 Units ** ** ** ** 11.5 d 13.1 d - ** ** 15.0 d 15.7 d -20 to 49 Units ** 5.9 c ** 14.3 d 26.2 d 12.8 c ↓ ** ** ** 13.2 c 50 to 99 Units ** ** ** 20.4 d ** 13.3 c ** ** ** 16.0 d 100+ Units ** 17.5 a 15.2 d ** 21.7 d ** ** ** 18.3 d ** Total ** ** ** 20.7 d 19.2 d 15.1 d ↓ 13.9 d ** 23.4 d 17.5 a ↓
Oct-17 Oct-18 Oct-17 Oct-18
Oct-18Total
Oct-18Size
Oct-17Bachelor
Oct-17 Oct-181 Bedroom
Oct-172 Bedroom 3 Bedroom +
Guelph CMALT $800 0.0 d ** ** ** 0.0 d 0.0 d - ** ** 0.7 b **
$800 - $899 ** ** 0.2 b 0.0 c ↓ ** 0.0 d ** ** 0.8 a 0.0 c ↓$900 - $999 ** ** 1.4 a 0.5 a ↓ 0.5 b 0.2 b - ** ** 1.0 a 0.6 a -
$1000 - $1099 ** ** 1.7 b 1.6 c - 0.3 b 0.2 b - ** ** 1.0 a 0.7 a -
$1100 - $1199 ** ** 0.6 a 1.6 c ↑ 1.2 a 0.5 b ↓ 0.0 d 0.0 d - 1.0 a 0.9 a -
$1200+ ** ** 2.8 c 4.1 c - 1.4 a 2.5 b ↑ ** 0.9 d 1.8 b 2.7 a ↑Total ** 5.6 d 1.3 a 1.6 a - 1.0 a 1.2 a - 3.0 d 0.5 b ↓ 1.2 a 1.4 a -1Vacancy rate by rent range when rents are known. For the Total, vacancy rates include all structures.
Oct-18Oct-18 Oct-17 Oct-18 Oct-17Oct-18 Oct-17 Oct-18 Oct-17
1.4 Private Apartment Vacancy Rates (%)1
by Rent Range and Bedroom TypeGuelph CMA
3 Bedroom + TotalRent Range
Bachelor 1 Bedroom 2 BedroomOct-17

Rental Market Report - Guelph CMA - Date Released - 2018
14
For an explanation of the letters and symbols used in the Rental Market tables, please refer to our Methodology page.
2.1.1 Private Row (Townhouse) Vacancy Rates (%)by Zone and Bedroom Type
Guelph CMA
Zone 1 - West - - - - ** ** ** ** ** 3.5 a
Zone 2 - South - - - - 0.0 a ** 0.9 a 0.3 b ↓ 0.7 a 0.2 b ↓Zone 3 - East ** ** ** ** ** ** - - ** **
Zone 4 - Townships - - - - - - - - - -
Guelph CMA ** ** ** ** 0.8 a 1.1 a - 1.7 a 1.1 a ↓ 1.5 a 1.1 a -
Oct-17 Oct-18Oct-17 Oct-18 Oct-17 Oct-183 Bedroom + Total
ZoneBachelor 1 Bedroom 2 Bedroom
Oct-17 Oct-18 Oct-17 Oct-18
Zone 1 - West - - - - ** ** ** ** ** 1,222 a
Zone 2 - South - - - - 1,255 a 1,298 a 1,422 a 1,432 a 1,386 a 1,400 a
Zone 3 - East ** ** ** ** ** ** - - ** **
Zone 4 - Townships - - - - - - - - - -
Guelph CMA ** ** ** ** 1,210 a 1,284 a 1,365 a 1,375 a 1,328 a 1,351 a
Oct-18Oct-18 Oct-17 Oct-18 Oct-17Oct-18 Oct-17 Oct-18 Oct-17
2.1.2 Private Row (Townhouse) Average Rents ($)by Zone and Bedroom Type
Guelph CMA
ZoneBachelor 1 Bedroom 2 Bedroom 3 Bedroom + Total
Oct-17

Rental Market Report - Guelph CMA - Date Released - 2018
15
For an explanation of the letters and symbols used in the Rental Market tables, please refer to our Methodology page.
2.1.3 Number of Private Row (Townhouse) Units in the Universeby Zone and Bedroom Type
Guelph CMA
Oct-17 Oct-18 Oct-17 Oct-18 Oct-17 Oct-18 Oct-17 Oct-18 Oct-17 Oct-18Zone 1 - West 0 0 0 0 58 58 142 142 200 200
Zone 2 - South 0 0 0 0 118 118 424 424 542 542
Zone 3 - East 1 1 1 1 2 2 0 0 4 4
Zone 4 - Townships n/a n/a n/a n/a n/a n/a n/a n/a n/a n/a
Guelph CMA 1 1 1 1 178 178 566 566 746 746
3 Bedroom + TotalZone
Bachelor 1 Bedroom 2 Bedroom
2.1.4 Private Row (Townhouse) Availability Rates (%)by Zone and Bedroom Type
Guelph CMA
Zone 1 - West - n/a - n/a ** n/a ** n/a ** n/a
Zone 2 - South - n/a - n/a 1.7 a n/a 2.4 a n/a 2.2 a n/a
Zone 3 - East ** n/a ** n/a ** n/a - n/a ** n/a
Zone 4 - Townships - n/a - n/a - n/a - n/a - n/a
Guelph CMA ** n/a ** n/a ** n/a 2.7 a n/a 2.9 b n/a
n/a: As of 2018, the number of available units is no longer collected.
Oct-17 Oct-18Oct-17 Oct-18 Oct-17 Oct-183 Bedroom + Total
ZoneBachelor 1 Bedroom 2 Bedroom
Oct-17 Oct-18 Oct-17 Oct-18

Rental Market Report - Guelph CMA - Date Released - 2018
16
For an explanation of the letters and symbols used in the Rental Market tables, please refer to our Methodology page.
2.1.5 Private Row (Townhouse) Estimate of Percentage Change (%) of Average Rent 1
by Zone and Bedroom TypeGuelph CMA
Zone 1 - West - - - - ** ** ** ** ** **
Zone 2 - South - - - - 3.0 a 3.5 a 2.1 a 2.6 a 2.3 a 2.9 a
Zone 3 - East ** ** ** ** ** ** - - ** **
Zone 4 - Townships - - - - - - - - - -
Guelph CMA ** ** ** ** 8.1 c 5.3 b ** 2.3 a ** 3.5 b1The Percentage Change of Average Rent is a measure of the market movement, and is based on those structures that were common to the survey sample for both years.
Oct-17 Oct-18
Oct-17
Oct-17 Oct-18 Oct-17
Oct-16
Oct-18
Oct-17to to
2 Bedroom
Zone
Bachelor 1 Bedroom
to to to toOct-16 Oct-17 Oct-16
3 Bedroom + TotalOct-16 Oct-17 Oct-16 Oct-17
Oct-17 Oct-18to to
Oct-17 Oct-18to to
Zone 1 - West - - - - ** ** ** ** ** ** Zone 2 - South - - - - 15.3 a 24.1 a ↑ 10.6 a 13.6 c ↑ 11.6 a 16.1 d ↑Zone 3 - East ** ** ** ** ** ** - - ** ** Zone 4 - Townships - - - - - - - - - - Guelph CMA ** ** ** ** 12.8 c 18.7 d ↑ 10.9 a 11.6 c - 11.3 a 13.3 c ↑
Oct-18 Oct-17 Oct-18
Oct-18 Oct-17 Oct-18 Oct-17
Oct-18 Oct-17Oct-17
2.1.6 Private Row (Townhouse) Turnover Rates (%)by Zone and Bedroom Type
Guelph CMA
ZoneBachelor 1 Bedroom 2 Bedroom 3 Bedroom + Total

Rental Market Report - Guelph CMA - Date Released - 2018
17
For an explanation of the letters and symbols used in the Rental Market tables, please refer to our Methodology page.
3.1.1 Private Row (Townhouse) and Apartment Vacancy Rates (%)by Zone and Bedroom Type
Guelph CMA
Zone 1 - West 0.0 d 2.1 c ↑ 1.6 b 1.5 b - 1.0 a 1.1 a - 2.6 b 2.0 b - 1.3 a 1.3 a -
Zone 2 - South ** ** 1.1 a 1.5 a - 0.9 a 1.3 a - 0.8 a 0.5 a - 0.9 a 1.2 a -
Zone 3 - East ** ** 1.0 a ** 1.1 a 1.4 d - 6.6 c 0.0 d ↓ 1.8 c 2.1 c -
Zone 4 - Townships ** ** ** ** ** ** ** ** ** **
Guelph CMA ** 5.6 d 1.3 a 1.6 a - 1.0 a 1.2 a - 2.2 a 0.9 a ↓ 1.2 a 1.4 a -
Oct-17 Oct-18Oct-17 Oct-18 Oct-17 Oct-183 Bedroom + Total
ZoneBachelor 1 Bedroom 2 Bedroom
Oct-17 Oct-18 Oct-17 Oct-18
Zone 1 - West 790 a 805 a 972 a 1,021 a 1,109 a 1,138 a 1,208 a 1,235 a 1,069 a 1,102 a
Zone 2 - South 732 b 751 b 1,015 a 1,077 a 1,183 a 1,227 a 1,408 a 1,433 a 1,144 a 1,193 a
Zone 3 - East 763 a 807 b 893 a 931 a 1,081 a 1,115 a 1,124 a 1,117 b 1,032 a 1,065 a
Zone 4 - Townships ** ** ** ** ** ** ** ** ** **
Guelph CMA 750 a 773 a 980 a 1,034 a 1,128 a 1,163 a 1,305 a 1,336 a 1,092 a 1,133 a
Oct-18Oct-18 Oct-17 Oct-18 Oct-17Oct-18 Oct-17 Oct-18 Oct-17
3.1.2 Private Row (Townhouse) and Apartment Average Rents ($)by Zone and Bedroom Type
Guelph CMA
ZoneBachelor 1 Bedroom 2 Bedroom 3 Bedroom + Total
Oct-17

Rental Market Report - Guelph CMA - Date Released - 2018
18
For an explanation of the letters and symbols used in the Rental Market tables, please refer to our Methodology page.
3.1.3 Number of Private Row (Townhouse) and Apartment Units in the Universeby Zone and Bedroom Type
Guelph CMA
Oct-17 Oct-18 Oct-17 Oct-18 Oct-17 Oct-18 Oct-17 Oct-18 Oct-17 Oct-18Zone 1 - West 40 39 1,041 1,040 1,935 2,055 240 252 3,256 3,386
Zone 2 - South 116 113 978 980 1,383 1,563 495 493 2,972 3,149
Zone 3 - East 40 40 320 315 789 779 103 97 1,252 1,231
Zone 4 - Townships 8 8 11 11 20 20 5 5 44 44
Guelph CMA 204 200 2,350 2,346 4,127 4,417 843 847 7,524 7,810
3 Bedroom + TotalZone
Bachelor 1 Bedroom 2 Bedroom
3.1.4 Private Row (Townhouse) and Apartment Availability Rates (%)by Zone and Bedroom Type
Guelph CMA
Zone 1 - West 0.0 d n/a 3.8 b n/a 1.9 c n/a 2.6 b n/a 2.5 a n/a
Zone 2 - South ** n/a 2.3 b n/a 2.3 a n/a 2.3 a n/a 2.2 a n/a
Zone 3 - East ** n/a 1.4 a n/a 1.9 c n/a 6.6 c n/a 2.4 b n/a
Zone 4 - Townships ** n/a ** n/a ** n/a ** n/a ** n/a
Guelph CMA ** n/a 2.8 a n/a 2.0 a n/a 3.0 a n/a 2.4 a n/a
n/a: As of 2018, the number of available units is no longer collected.
Oct-17 Oct-18Oct-17 Oct-18 Oct-17 Oct-183 Bedroom + Total
ZoneBachelor 1 Bedroom 2 Bedroom
Oct-17 Oct-18 Oct-17 Oct-18

Rental Market Report - Guelph CMA - Date Released - 2018
19
For an explanation of the letters and symbols used in the Rental Market tables, please refer to our Methodology page.
3.1.5 Private Row (Townhouse) and Apartment Estimate of Percentage Change (%) of Average Rent 1
by Zone and Bedroom TypeGuelph CMA
Zone 1 - West ** 4.5 d ** 5.2 c 3.3 d 4.0 c ** 3.1 c 3.5 d 4.3 c
Zone 2 - South ++ 3.2 b 5.3 b 4.9 b 4.4 b 4.2 a 2.7 b 2.7 b 4.2 b 4.2 a
Zone 3 - East ** ** 4.7 d 3.3 d 4.4 c 3.3 d 2.2 c ** 3.7 c 3.1 d
Zone 4 - Townships ** ** ** ** ** ** ** ** ** **
Guelph CMA ** 3.9 d 3.8 c 4.8 b 3.9 b 4.0 b 3.6 d 1.0 d 3.8 b 4.1 b1The Percentage Change of Average Rent is a measure of the market movement, and is based on those structures that were common to the survey sample for both years.
Oct-17 Oct-18
Oct-17
Oct-17 Oct-18 Oct-17
Oct-16
Oct-18
Oct-17to to
2 Bedroom
Zone
Bachelor 1 Bedroom
to to to toOct-16 Oct-17 Oct-16
3 Bedroom + TotalOct-16 Oct-17 Oct-16 Oct-17
Oct-17 Oct-18to to
Oct-17 Oct-18to to
Zone 1 - West ** ** ** 23.0 d ** 12.4 c 12.6 d ** ** 15.3 d Zone 2 - South ** ** ** 19.0 d 25.9 d 20.6 d - 11.2 c 17.0 d ↑ 27.4 d 19.3 a ↓Zone 3 - East ** ** ** ** ** 14.3 d ** ** 12.3 d 16.8 d ↑Zone 4 - Townships ** ** ** ** ** ** ** ** ** ** Guelph CMA ** ** ** 20.7 d 18.9 d 15.3 a ↓ 12.1 c 14.7 c - 22.2 d 17.1 a ↓
Oct-18 Oct-17 Oct-18
Oct-18 Oct-17 Oct-18 Oct-17
Oct-18 Oct-17Oct-17
3.1.6 Private Row (Townhouse) and Apartment Turnover Rates (%)by Zone and Bedroom Type
Guelph CMA
ZoneBachelor 1 Bedroom 2 Bedroom 3 Bedroom + Total

Rental Market Report - Guelph CMA - Date Released - 2018
20

Rental Market Report - Guelph CMA - Date Released - 2018
21
Canada Mortgage and Housing Corporation (CMHC) conducts the Rental Market Survey (RMS) every year in October to estimate the relative strengths in the rental market. The survey is conducted on a sample basis in all urban areas with populations of 10,000 and more. The survey targets only privately initiated structures with at least three rental units, which have been on the market for at least three months. The survey collects market rent levels, availability (outside Quebec), turnover and vacancy unit data for all sampled structures.
The survey is conducted by a combination of telephone interviews and site visits, and information is obtained from the owner, manager, or building superintendent. The survey is conducted during the first two weeks of October, and the results reflect market conditions at that time.
CMHC is constantly reviewing the Universe of rental structures in the rental market Universe to ensure that it is as complete as possible. Every year, any newly completed rental structures with at least 3 rental units are added to the Universe. In addition to this, CMHC undertakes comprehensive reviews by comparing the Universe listing to other sources of data to ensure that the list of structures is as complete as possible.
CMHC’s Rental Market Survey provides a snapshot of vacancy, availability (outside Quebec), and turnover rates and average rents in both new and existing structures. There also exists a measure for the change in rent that is calculated based on existing structures only. The estimate is based on structures that were common to the survey sample for both the previous and the current Rental Market Surveys. The change in rent in existing structures is an estimate of the change in rent that the landlords charge and removes compositional effects on the rent level movement due to new buildings, conversions, and survey sample rotation. The estimate of percent change in rent is available in all Canada and Provincial Highlights publications, and also in the CMA reports. The rent levels in new and existing structures are also published. While the percent change in rents in existing structures published in the reports are statistically significant, changes in rents that one might calculate based on rent levels in new and existing structures may or may not be statistically significant.
Canada Mortgage and Housing Corporation (CMHC) conducts the Condominium Apartment Survey (CAS) in late summer and early fall to estimate the relative strengths in the condo apartment rental market The CAS collects the number of units being rented out and the vacancy and rent levels of these units in the following CMAs: Calgary, Edmonton, Gatineau, Halifax, Hamilton, Kelowna, Kitchener, London, Montréal, Ottawa, Québec, Regina, Saskatoon, Toronto, Vancouver, Victoria and Winnipeg. The CAS is conducted by telephone interviews and information is obtained from the property management company, condominium (strata) board, or building superintendent. If necessary, this data can be supplemented by site visits if no telephone contact is made.
CMHC publishes the number of units rented, vacancy rates and average rents from the Condominium Apartment Survey. A letter code representing the statistical reliability (i.e., the coefficient of variation (CV)) for each estimate is provided to indicate the data reliability.
L i n k f o r M e t h o d o l o g y p a g e s

Rental Market Report - Guelph CMA - Date Released - 2018
22
CMHC does not publish an estimate (e.g. Vacancy Rates and Average Rents) if the reliability of the estimate is too low or the confidentiality rules are violated. The ability to publish an estimate is generally determined by its statistical reliability, which is measured using the coefficient of variation (CV). CV of an estimate is defined as the ratio of the standard deviation to the estimate and CV is generally expressed a percentage. For example, let the average rent for one bedroom apartments in a given CMA be and its standard deviation be . Then the Coefficient of Variation is given by .
Reliability Codes for Proportions
CMHC uses CV, sampling fraction and universe size to determine the ability to publish proportions such as vacancy rates, availability rates and turnover rates. The following letter codes are used to indicate the level of reliability of proportions: a — Excellent b — Very good c — Good d — Fair (Use with Caution) ** — Poor — Suppressed ++ – Change in rent is not statistically significant. This means that the change in rent is not statistically different than zero (0). - – No units exist in the universe for this category n/a – Not applicable The following two tables indicate the level of reliability of proportions: If the proportion is Zero (0) and sampling fraction is less than 100% then the following levels are assigned:
Sampling Fraction (%) range
Structures in Universe (0,20]* (20,40] (40,60] (60,80] (80,100)
3 – 10 Poor Poor Poor Poor Poor
11 – 20 Poor Fair Fair Fair Good
21 – 40 Poor Fair Fair Good Very Good
41 – 80 Poor Fair Good Good Very Good
81+ Poor Good Good Very Good Very Good *(0, 20] means sampling fraction is greater than 0% but less than or equal to 20%; others are similar. Otherwise, the following table is used to determine the reliability level of proportions:
Coefficient of Variation (CV) %
Vacancy Rate 0 (0,5] (5,10] (10,16.5] (16.5,33.3] (33.3,50] 50+
(0,0.75] Excellent Excellent Excellent Excellent Excellent V. Good V. Good
(0.75,1.5] Excellent Excellent Excellent Excellent Excellent Fair Poor
(1.5,3] Excellent Excellent Excellent V. Good Good Poor Poor
(3,6] Excellent Excellent V. Good Good Fair Poor Poor
(6,10] Excellent Excellent V. Good Good Poor Poor Poor
(10,15] Excellent Excellent Good Fair Poor Poor Poor
(15,30] Excellent Excellent Fair Poor Poor Poor Poor
(30,100] Excellent Excellent Poor Poor Poor Poor Poor

Rental Market Report - Guelph CMA - Date Released - 2018
23
Reliability Codes for Averages and Totals
CMHC uses the CV to determine the reliability level of the estimates of average rents and a CV cut-off of 10% for publication of totals and averages. It is felt that this level of reliability best balances the need for high quality data and not publishing unreliable data. CMHC assigns a level of reliability as follows (CV’s are given in percentages):
a — If the CV is greater than 0 and less than or equal to 2.5 then the level of reliability is Excellent. b — If the CV is greater than 2.5 and less than or equal to 5 then the level of reliability is Very Good. c — If the CV is greater than 5 and less than or equal to 7.5 then the level of reliability is Good. d — If the CV is greater than 7.5 and less than or equal to 10 then the level of reliability is Fair. ** — If the CV is greater than 10 then the level of reliability is Poor. (Do Not Publish)
Arrows indicate Statistically Significant Changes
Use caution when comparing statistics from one year to the next. Even if there is a year over year change, it is not necessarily a statistically significant change. When applicable, tables in this report include indicators to help interpret changes:
↑ indicates the year-over-year change is a statistically significant increase. ↓ indicates the year-over-year change is a statistically significant decrease. – indicates that the effective sample does not allow one to interpret any year-over-year change as being statistically significant.
indicates that the change is statistically significant
Availability: A rental unit is considered available if the existing tenant has given, or has received, notice to move, and a new tenant has not signed a lease; or the unit is vacant (see definition of vacancy below).
Rent: The rent refers to the actual amount tenants pay for their unit. No adjustments are made for the inclusion or exclusion of amenities and services such as heat, hydro, parking, and hot water. For available and vacant units, the rent is the amount the owner is asking for the unit.
It should be noted that the average rents reported in this publication provide a sound indication of the amounts paid by unit size and geographical sector. Utilities such as heating, electricity and hot water may or may not be included in the rent.
Rental Apartment Structure: Any building containing three or more rental units, of which at least one unit is not ground oriented. Owner-occupied units are not included in the rental building unit count.
Rental Row (Townhouse) Structure: Any building containing three or more rental units, all of which are ground oriented with vertical divisions. Owner-occupied units are not included in the rental building unit count. These row units in some centres are commonly referred to as townhouses.
Vacancy: A unit is considered vacant if, at the time of the survey, it is physically unoccupied and available for immediate rental.
Turnover: A unit is counted as being turned over if it was occupied by a new tenant moved in during the past 12 months. A unit can be counted as being turned over more than once in a 12 month period.
Definitions of Census Areas referred to in this publication are as follows:
A census metropolitan area (CMA) or a census agglomeration (CA) is formed by one or more adjacent municipalities centred on a large urban area (known as the urban core). The census population count of the urban core is at least 10,000 to form a census agglomeration and at least 50,000 to form a census metropolitan area. To be included in the CMA or CA, other adjacent municipalities must have a high degree of integration with the central urban area, as measured by commuting flows derived from census place of work data. CMAs and CAs contain whole municipalities or Census Subdivisions.
October 2017 and October 2018 data is based on Statistics Canada’s 2016 Census area definitions.
Acknowledgement
The Rental Market Survey and the Condominium Apartment Survey could not have been conducted without the cooperation of the rental property owners, managers, building superintendents and household members throughout Canada. CMHC acknowledges their hard work and assistance in providing timely and accurate information. As a result of their contribution CMHC is able to provide information that benefits the entire housing industry.

Rental Market Report - Guelph CMA - Date Released - 2018
24
CMHC HELPS CANADIANS MEET THEIR HOUSING NEEDS.
Canada Mortgage and Housing Corporation (CMHC) has been helping Canadians meet their housing needs for more than 70 years. As Canada’s authority on housing, we contribute to the stability of the housing market and financial system, provide support for Canadians in housing need, and offer unbiased housing research and advice to Canadian governments, consumers and the housing industry. Prudent risk management, strong corporate governance and transparency are cornerstones of our operations.
For more information, visit our website at www.cmhc.ca or follow us on Twitter, LinkedIn, Facebook, Instagram and YouTube.
You can also reach us by phone at 1-800-668-2642 or by fax at 1-800-245-9274. Outside Canada call 613-748-2003 or fax to 613-748-2016.
Canada Mortgage and Housing Corporation supports the Government of Canada policy on access to information for people with disabilities. If you wish to obtain this publication in alternative formats, call 1-800-668-2642.
©2018 Canada Mortgage and Housing Corporation. All rights reserved. CMHC grants reasonable rights of use of this publication’s content solely for personal, corporate or public policy research, and educational purposes. This permission consists of the right to use the content for general reference purposes in written analyses and in the reporting of results, conclusions, and forecasts including the citation of limited amounts of supporting data extracted from this publication. Reasonable and limited rights of use are also permitted in commercial publications subject to the above criteria, and CMHC’s right to request that such use be discontinued for any reason.
Any use of the publication’s content must include the source of the information, including statistical data, acknowledged as follows:
Source: CMHC (or “Adapted from CMHC,” if appropriate), name of product, year and date of publication issue.
Other than as outlined above, the content of the publication cannot be reproduced or transmitted to any person or, if acquired by an organization, to users outside the organization. Placing the publication, in whole or part, on a website accessible to the public or on any website accessible to persons not directly employed by the organization is not permitted. To use the content of this CMHC publication for any purpose other than the general reference purposes set out above or to request permission to reproduce large portions of, or the entire content of, this CMHC publication, please send a Copyright request to the Housing Knowledge Centre at [email protected]. Please provide the following information: Publication’s name, year and date of issue.
Without limiting the generality of the foregoing, no portion of the content may be translated from English or French into any other language without the prior written permission of Canada Mortgage and Housing Corporation.
The information, analyses and opinions contained in this publication are based on various sources believed to be reliable, but their accuracy cannot be guaranteed. The information, analyses and opinions shall not be taken as representations for which Canada Mortgage and Housing Corporation or any of its employees shall incur responsibility.

■■ Housing Information Monthly■■ Housing Market Assessment■■ Housing Market Insight■■ Housing Now Tables■■ Housing Market Outlook, Canada■■ Housing Market Outlook, Highlight Reports – Northern Housing■■ Housing Market Outlook, Canada and Major Centres■■ Preliminary Housing Starts Data■■ Rental Market Reports, Canada and Provincial Highlights ■■ Rental Market Reports, Major Centres■■ Seniors’ Housing Reports■■ Mortgage and Consumer Credit Trends Report
DATA TABLES AVAILABLE ONLINE■■ Funding and Securitization Data■■ Household Characteristics■■ Housing Market Data■■ Housing Market Indicators■■ Mortgage and Debt Data■■ Rental Market Data
PUBLICATIONS AND REPORTS AVAILABLE ONLINELocal, regional and national analysis and data on current market conditions and future trends.
HOUSING MARKET INFORMATION PORTALThe housing data you want, the way you want it.
■✔ Information in one central location
■✔ Desktop and mobile friendly
■✔ Neighbourhood-level data
cmhc.ca/hmiportal
SUBSCRIBE NOWGet email notifications when CMHC publications are released or updated. Sign up for a free myCMHC account for enhanced site access, including one-click subscriptions to the reports and tables that matter to you.
Get your myCMHC account today!
Get the market intelligence you need today!Find all the latest trends, research and insights at cmhc.ca/housingmarketinformation
Housing market intelligence you can count on
Housing ObserverFeaturing quick reads and videos on...
• Analysis and data • Timely insights• Updates to housing conditions, trends and much more!
Subscribe today to stay in the know!
www.cmhc.ca/observer


![[Unchanged] Growth Matters](https://static.fdocuments.net/doc/165x107/618bb69e8a49993a96117cb7/unchanged-growth-matters.jpg)
![ÉTUDE SUR LES IMPACTS SOCIAUX DES … · sociaux qui avaient été relevés dans l’étude de 2011. ... schl.gc.ca/odpub/pdf/66751.pdf]. ... Au cours des dernières années, ...](https://static.fdocuments.net/doc/165x107/5b9d390b09d3f29a298c1e9e/etude-sur-les-impacts-sociaux-des-sociaux-qui-avaient-ete-releves-dans-letude.jpg)


![[Unchanged] Data is king](https://static.fdocuments.net/doc/165x107/622b292a62201e0dd8397a05/unchanged-data-is-king.jpg)
