UNCERTAINTIES IN EXPLOSION RISK …conference.ing.unipi.it/ichs2011/papers/240.pdf · The eventual...
22
UNCERTAINTIES IN EXPLOSION RISK ASSESSMENT FOR A HYDROGEN REFUELING STATION Koos Ham a) , Matthijs de Maaijer a) , Vincent van de Hoogenband a) , Corina Dam a) , Marcel Weeda b) , Jaco Reijerkerk c) , Gert Jan Kramer d) a) TNO 1 , b) ECN, c) Linde Gas Benelux B.V., d) Shell Global Solutions International B.V. ABSTRACT The project “Towards a Hydrogen Refueling Infrastructure for Vehicles” (THRIVE) aimed at the determination of conditions to stimulate the building of a sustainable infrastructure for hydrogen as a car fuel in The Netherlands. Economic scenarios were constructed for the development of such an infrastructure for the next one to four decades. The eventual horizon will require the erection of a few hundred to more than a thousand hydrogen refueling stations (HRS) in The Netherlands. The risk acceptability policy in The Netherlands, implemented in the External Safety Establishments decree, requires the assessment and management of safety risks imposed on the public by car fuelling stations. In the past, a risk-informed policy has been developed for the large scale introduction of liquefied petroleum gas (LPG) as a car fuel, and a similar policy will also be required if hydrogen is introduced in the public domain. A risk assessment methodology, dedicated to cope with accident scenarios relevant for hydrogen applications, is to be developed. Within the THRIVE project, a demo risk assessment was conducted for the possible implementation of an HRS within an existing station for conventional fuels. The studied station is located in an urban area, occupied with housing and commercial activities. The HRS is based on delivery and on-site storage of liquid hydrogen and dispensing of high pressure gaseous hydrogen into vehicles. The main challenges in the risk assessment were in the modeling of release and dispersion of liquid hydrogen. Definition of initial conditions for computational fluid dynamics (CFD) modeling to evaluate dispersion of a cold hydrogen air mixture appears rather complex, and is not always fully understood. The modeling assumptions in the initial conditions determine, to a large extent, the likelihood and severity of potential explosion effects. The paper shows the results of the investigation and the sensitivity to the basic assumptions in the model input. 1 Corresponding author: J.M. Ham, TNO, Princetonlaan 6, P.O.Box 80015, 3508 TA Utrecht, The Netherlands; [email protected]
Transcript of UNCERTAINTIES IN EXPLOSION RISK …conference.ing.unipi.it/ichs2011/papers/240.pdf · The eventual...

UNCERTAINTIES IN EXPLOSION RISK ASSESSMENT FOR A
HYDROGEN REFUELING STATION
Koos Hama)
, Matthijs de Maaijera)
, Vincent van de Hoogenbanda)
, Corina Dama)
, Marcel Weedab)
,
Jaco Reijerkerkc), Gert Jan Kramer
d)
a)
TNO1,
b) ECN,
c) Linde Gas Benelux B.V.,
d) Shell Global Solutions International B.V.
ABSTRACT The project “Towards a Hydrogen Refueling Infrastructure for Vehicles” (THRIVE) aimed at the
determination of conditions to stimulate the building of a sustainable infrastructure for hydrogen as a car
fuel in The Netherlands. Economic scenarios were constructed for the development of such an
infrastructure for the next one to four decades. The eventual horizon will require the erection of a few
hundred to more than a thousand hydrogen refueling stations (HRS) in The Netherlands.
The risk acceptability policy in The Netherlands, implemented in the External Safety Establishments
decree, requires the assessment and management of safety risks imposed on the public by car fuelling
stations. In the past, a risk-informed policy has been developed for the large scale introduction of liquefied
petroleum gas (LPG) as a car fuel, and a similar policy will also be required if hydrogen is introduced in
the public domain. A risk assessment methodology, dedicated to cope with accident scenarios relevant for
hydrogen applications, is to be developed.
Within the THRIVE project, a demo risk assessment was conducted for the possible implementation of an
HRS within an existing station for conventional fuels. The studied station is located in an urban area,
occupied with housing and commercial activities. The HRS is based on delivery and on-site storage of
liquid hydrogen and dispensing of high pressure gaseous hydrogen into vehicles.
The main challenges in the risk assessment were in the modeling of release and dispersion of liquid
hydrogen. Definition of initial conditions for computational fluid dynamics (CFD) modeling to evaluate
dispersion of a cold hydrogen air mixture appears rather complex, and is not always fully understood. The
modeling assumptions in the initial conditions determine, to a large extent, the likelihood and severity of
potential explosion effects.
The paper shows the results of the investigation and the sensitivity to the basic assumptions in the model
input.
1 Corresponding author:
J.M. Ham, TNO, Princetonlaan 6, P.O.Box 80015, 3508 TA Utrecht, The Netherlands; [email protected]

1 INTRODUCTION
The objectives of the project “Towards a Hydrogen Refueling Infrastructure for Vehicles” (THRIVE)
were to determine the requirements for the development of a sustainable infrastructure of hydrogen as a
car fuel in The Netherlands. Both the economic drivers and the environmental opportunities were
evaluated and scenarios were developed for the expected growth of this infrastructure in the decades
between 2010 and 2050.
The THRIVE project was conducted in a collaborative effort of the Energy research Centre of the
Netherlands (ECN, coordinator), The Netherlands Organization for Applied Scientific Research (TNO),
Linde Gas Benelux and Shell Hydrogen. The project was run in the period 2008 to 2010 and was
sponsored through the Energy Research Subsidy Long-Term program of the Dutch Ministry of Economic
Affairs. The findings of the infrastructure studies and the expected environmental impact were, among
others, presented in the World Hydrogen Energy Conference (WHEC), held in Essen, Germany [WHEC,
2010].
The project included an extensive study into the possible safety risks of accidents with hydrogen in a
hydrogen refueling station (HRS), particularly for risks to the surroundings (the built environment). This
would probably reveal knowledge gaps in the application of quantitative risk assessment (QRA) in the
permitting and land-use decision making for newly planned HRS’s, as required in The Netherlands.
The initial intention was to conduct a QRA for the proposed situation: incorporation of a hydrogen
delivery installation in an existing fuelling station for delivery of conventional fuels (gasoline, diesel,
LPG). The original objective could however not be fully realized, mainly because of two reasons. First,
the definition of the process design evolved during the course of the project due to introduction of the
newest technological developments incorporated in the design. This made it not feasibly to timely define
the eventual design and to conduct a complete QRA accounting for the potential operational risks. And
second, the statistical data for failure frequencies of hydrogen equipment appears yet too limited to
identify representative probability values for the relevant loss of containment events. For that reason, the
focus of the project was put on obtaining a better understanding of dispersion and possible explosion
effects of accidental hydrogen releases and of the influence of obstacles on cloud formation and behavior.
In other words, main emphasis was put on consequence analysis, rather than on risk assessment including
probability determination.
A subtask of the study was the identification of analogies and differences in QRA requirements for an
LPG refueling installation, being a sector for which much QRA experience and risk policy practices have
been developed in the Netherlands over the past two to three decades.
The risk study included the following topics:
� Identification of knowns and unknowns in the implementation of (regulatory) QRA policy for
hydrogen refueling stations;
� Literature survey into explosion modeling and empirical research concerning hydrogen explosions;
� Definition of the hydrogen delivery, storage and dispensing systems in an existing HRS;
� Identification of scenarios of loss of containment from the hydrogen system;
� Dispersion of hydrogen release cases through CFD modeling and determination of explosive volume;
� Assessment of overpressure in case of ignition of hydrogen clouds.
The selected HRS involved a system with truck delivery of liquid hydrogen at cryogenic conditions and
dispensing of hydrogen gas at maximum 87 MPa to vehicles, thus achieving a pressure of 70 MPa in the
vehicle tank.
2 OBJECTIVES OF THE SAFETY STUDY RELATED TO THE OFF-SITE RISK POLICY IN
THE NETHERLANDS
In The Netherlands, risk informed criteria are applied in the permit application for new installations
involving hazardous substances. The risk of fatality in off-site vulnerable objects (houses, schools,
hospitals, etc) due to incidents in a major hazard establishment shall not exceed one in a million per year
(10-6
/year). This same criterion is also applied in decision making about land use: no vulnerable objects
are allowed to be erected within the area where the individual risk caused by hazardous establishments or
transport is higher than 10-6
/year.
For most new developments in land use or for new environmental permits, a quantitative risk assessment
(QRA) will be required. Although specific characteristics of an establishment and its surroundings can be
accounted for, the process of risk assessment is to a large extend standardized: generic release scenarios
for types of containment are prescribed, generic failure frequencies are applied and also the risk
assessment software is standardized, in order to derive transparent and robust conclusions.
For some categories of hazardous installations no QRA is required; in such cases uniform separation
distances apply between the establishment and vulnerable objects. Such generic distances are applied for
installations of which large numbers are in operation and where conducting QRA’s for each situation
would be quite cumbersome and costly with little added value. These categories include LPG refueling
stations and ammonia refrigeration installations. The separation distances are risk based: they are
determined by the distance of the 10-6 individual risk contour for a typical (generic) installation of this
category.
Assuming a growth in the number of hydrogen refueling stations over the next few decades -as evaluated
in the THRIVE project- the need to set standardized safety distances may also evolve for these
establishments. Therefore, one of the objectives of the safety study in THRIVE was to determine the
requirements and boundaries for determination of risk based separation distances around an HRS and to
identify the knowledge gaps to be closed before such distances can be determined. A representative
location was selected to conduct a pilot risk assessment for an HRS to be incorporated into an existing car
refueling station.
3 UNCERTAINTIES AND KNOWLEDGE GAPS IN PERFORMING QRA ON A HYDROGEN
REFUELING STATION
The risk assessment study in the THRIVE project aimed at, among other things, determination of
hazardous zones within and outside a hydrogen refueling station (HRS) and other safety / risk
requirements that need to be considered in the permitting procedure for establishing and operating an HRS
in the vicinity of populated areas. A lay-man question was formulated as follows: “Could an HRS
installation be established and operated within an existing refueling station that already holds a permit
for LPG refueling?”, and “How do the risks of both applications compare?”.
In The Netherlands, a quantitative risk assessment (QRA) for the activities with dangerous substances will
be required in the permitting process, as set out in Section 2. At present however, there are too few HRS’s
in The Netherlands for application of a generic approach, using generic -risk informed- safety distances
like there are for LPG refueling stations. Therefore, as long as there is no regulation that identifies HRS’s
as ‘categorized establishments’ a situation specific QRA will be required for each new initiative.
In this Chapter, the identified ‘unknowns and uncertainties’ on quantitative risk assessment for an HRS
are identified and discussed. The discussion includes the similarities and differences as compared to LPG
refueling and using the existing (= prescribed) QRA methodologies and tools.
The following aspects are successively discussed:
1. (Variations in) type of refueling installation for hydrogen: technology and lay-out
2. Uncertainties in scenario identification
3. Knowledge gaps in effects modeling and consequence assessment
4. Uncertainties in failure rates and incident frequencies
3.1 Type of refueling installation for hydrogen: technology and lay-out
3.1.1 Practice for LPG refueling station.
The current practice of an LPG refueling station (LRS), usually integrated in a station with conventional
car fuels like gasoline and diesel, involves the following main activities:
� Delivery of LPG (a gas liquefied by pressure, at ambient temperature) by tank truck. Capacities of the
truck vary between 40 – 63 m3 (max. 27,000 kg).

� Unloading of the truck into an underground storage at the refueling station. Most storage tanks have a
capacity of 20 m3. Only in a minority of the locations (2 – 3%) the storage tank is placed above
ground, and another few percent is buried in a hill.
� Delivery of LPG to the consumer’s vehicle, via an underground pipeline, an LPG dispenser unit, and a
delivery hose + nozzle. Average delivery quantities amount to approx. 25 – 40 liter (13 – 20 kg) per
refueling.
Safety distances apply for the permitting of an LRS. Minimum distances shall be enforced between at one
hand vulnerable objects in the surroundings and at the other the location of unloading of the LPG truck,
the location of the storage tank and the location of the dispenser unit, respectively. These safety distances
shall ensure that the location based risk limit (or individual risk) of 10-6
/year will not be exceeded in
vulnerable areas such as housing areas. In most cases, the safety distance around the truck unloading is the
largest of the three, and consequently the most determining one. However, if the LPG equipment is
spatially separated within the establishment, then in some cases a storage tank close to build-up
environment turns out to be the most critical piece of equipment. This is particularly true for above-ground
storages for which larger safety distances apply.
3.1.2 Practice for Hydrogen refueling station
From the description of LPG refueling stations, it appears that the infrastructures of these establishments
are rather uniform, with respect to the product, its delivery and its storage.
For hydrogen refueling stations, there is a bigger variety of options in infrastructure and construction. The
following options are available, for which different risk assessment approaches will be required and
different outcomes can be expected:
� Origen of hydrogen, both production on-site and delivery are possible:
o Production on-site:
� through electrolysis, or
� through reforming process
o Delivery:
� liquid (cryogenic) hydrogen by tank trucks, or
� gaseous hydrogen by tube trailers, or
� gaseous hydrogen by cylinder packages, or
� continuous by pipeline
� Storage of hydrogen on-site, both compressed gaseous hydrogen(CGH2) and liquid hydrogen (LH2)
are possible:
o Gaseous hydrogen:
� at intermediate pressure (~ 20 MPa) in cylinders and/or tube trailer, with boosting compressor
for dispensing
� at increased / final pressure (70 – 80 MPa) in (intermediate) buffer storage
o Liquid hydrogen:
� cryogenic in above ground tank
� cryogenic in underground tank (in cellar, not buried)
� Infrastructure, this may influence possible escalation scenarios:
o HRS installation integrated within an existing refueling station holding conventional fuels and
LPG
o HRS as a separate entity
� Refueling procedure, this will determine the equipment requirements as well as the storage conditions:
o ‘Fast-fill’: vehicle is refilled within a few minutes, from a high pressure and/or cascade buffer
storage; this is the preferred option for consumer vehicles
o ‘Slow-fill’: vehicle is refilled during several hours, usually in-line with production and/or
delivery; this option is often considered for public transport (buses) during their parking in garage
during the night hours.
The reference station for the THRIVE study comprises from the above options (see section 4):
� Delivery of LH2, by tank truck

� Storage of LH2 in an above ground tank, at cryogenic conditions
� Intermediate storage of CGH2 in a set of pressure vessels, at high pressure
� Refueling of vehicles with CGH2, in fast-fill option
Conclusions from the risk assessment in this project will -in principle- only apply for the configuration as
defined for THRIVE. The above shows that several other configurations are possible. The development of
generic safety distances for permitting purposes or land-use decisions will in principle require that a QRA
be conducted for each configuration separately. Since it is not certain how many, and which,
configurations will be realized, the effort and modeling requirements for a full roll-out of a generic QRA
approach cannot be determined at the moment.
3.2 Uncertainties in scenario identification
The accident scenarios to be included in a QRA for an establishment shall be in conformity with the
directives given in [HaRi, 2009]. This means that the evaluated consequences are based on the minimum
requirements for a ‘standard QRA’ in The Netherlands. A detailed scenario identification exercise is
recommended to define the realistic LoC events, in accordance with QRA requirements prescribed in
[HaRi, 2009] and accounting for the system design and ‘state of the art’ protective measures in the
installation.
In the consequence assessment for the selected installation equipment, worst case scenarios have been
evaluated. It will be assumed that built-in safety provisions will not function and that, consequently,
maximum release rates occur. In reality, the probability that the incidents will develop to this magnitude
may be quite low.
On the other hand, the number of possible LoC events that should be included in a complete QRA is
higher than the worst case scenarios only. The more credible scenarios, like small leakages resulting in
smaller effects, will determine the risk levels at shorter distances and will particularly have on-site
consequences. The potential of escalation scenarios, with impact to the hydrogen installations or even to
the equipment of other fuels, has not been considered in the risk study in THRIVE.
3.3 Knowledge gaps in effects - and consequence modeling
The effects and consequence modeling results for the selected THRIVE scenarios have shown that the
general models used in risk assessment, and as described in the so called Colored Books [PGS, 2005], are
less appropriate for modeling hydrogen releases, especially for the extreme physical conditions (high
pressure or very low temperature) at which the hydrogen is handled.
Clearly, there is a lack of validated modeling of high pressure gas release (supersonic jet), vaporization of
cryogenic liquid hydrogen in contact with objects or the ground, and the dispersion of a cold but yet
buoyant cloud of hydrogen-air mixture. In the calculations, several parameter assumptions had to be taken
in order to apply the available models within their apparent range of validity but, consequently, beyond
the actual physical conditions of the hydrogen.
During the past approximately 5 - 10 years, several research programs have been carried out all over the
world in order to narrow and close knowledge gaps in this area. Much of this work has been reported in
the biannual International Conference on Hydrogen Safety (ICHS), in 2005, 2007 and 2009 [ICHS].
In the latest Conference, in Ajaccio 2009, it was concluded that still a number of uncertainties and
unresolved modeling issues do exist, particularly on the behavior of liquid hydrogen. Dispersion modeling
with even the most sophisticated CFD tools still provides results that are not fully understood. Particularly
the thermodynamics of interaction between (liquid) hydrogen at one hand and the subsoil and atmospheric
air and humidity at the other appears to be a matter yet too complex to resolve with the existing tools and
experience. The available models seem to be very sensitive to obviously minor modifications in the input
parameters.
The need for further validation of the models has been emphasized by many. From [Venetsanos, 2010],
the following is quoted: “Further research is needed both computationally and experimentally to address
the issues of LH2 dispersion, under-expanded hydrogen jets including evaluation of the ground effect
(impinging jets or jets parallel and close to walls), as well as releases in confined spaces at a wider range
of conditions (release location, strength, direction, ventilation, obstructions).”

The attempts to reliably model some of the scenarios for the THRIVE reference HRS and the conclusions
thereof have confirmed the validity of this recommendation, as will be shown in this paper.
3.4 Uncertainties in failure rates and incident frequencies
It has appeared that conducting a full quantitative risk assessment, in which both the consequences as well
as the likelihood of the various Loss of Containment events are evaluated, was not feasible in this study.
Several reasons can be mentioned for this, which were partly due to evolution of the design and
implementation of newest technological developments during the course of the project, but also due to
lack of reliable statistics for failure rates of hydrogen equipment. Some of the issues are highlighted
hereunder.
3.4.1 Incomplete data for the installation
The following remarks are made for the definition of the hydrogen refueling installation that served as the
reference object for the risk assessment study:
� A frozen design of the system could not be completed during the course of the project. Initially, only
preliminary designs were available that evolved during the study, partly based on definition of
requirements for the QRA. During the entire project, new developments were proposed with regard to
the technical details like system capacities, application of specific equipment (compressors or cryo
pump), implementation of boil-off recovery, system of dispensing, etc. Also the preferable lay-out of
the installation within the existing station configuration was not made definitive. Although this
practice is inherent to design and implementation of new technologies, it seriously hampered the
progress in defining the points of departure in the QRA.
� The ongoing modifications in the design of the basic installation made it unfeasible to consider the
detailed safety measures and instrumentation that will be implemented in the system. Much of this
was under consideration with the installation developers, and moreover detailed data was considered
as commercially confidential. Data about preventive and repressive emergency systems that will be
installed in the system were not available in the study. This meant also that no risk reduction factors
could be granted for the reliability and effectiveness of these (technical and organizational) measures.
Consequently, conservative approaches had to be followed in the definition of the accident scenarios.
It is concluded that an appropriate QRA requires the availability of descriptions of the installation and its
system controls, the emergency instrumentation and procedures and the lay-out. Hazard identification is
usually applied by means of HAZOP, LOPA and/or FMEA analysis. Their results are crucial input to the
QRA. Since the design of the HRS in THRIVE was still under development such analyses were not yet
completed and, thus, were not available for the QRA. And finally, the lay-out of the installation within the
station configuration still had to be determined in which the minimum internal distances are met, as a base
requirement.
With regard to the implementation of safety measures, the current situation was described as follows:
“Currently, hydrogen refueling stations are built despite missing data. For QRA purpose, missing data is
estimated using data for comparable systems, or expert judgment. To compensate for lack of experience
extra safety measures are included leading to (relatively) high cost”. In other words, in order to
‘compensate’ for the uncertainties in adequate risk assessment hydrogen installations are often over-
dimensioned with regard to integrity and safety / hazard control.
In order to avoid unnecessary high costs and investments, appropriate and validated data on system
failures is indispensible for conducting a QRA that creates confidence in the results.
3.4.2 Failure frequencies
A QRA requires as an input the frequency of failure (loss of containment) of the various equipment. The
[HaRi, 2009] provides (generic) LoC frequencies for various types of process – and storage equipment as
used in the chemical industry and in the oil & gas sector.
The design of hydrogen equipment, however, is very specific. Failure figures from oil & gas are probably
not applicable to hydrogen installations. Some attempts have already been made under NoE HySafe and
under IEA-HIA Task19 to develop a set of generic failure frequencies for hydrogen equipment, both for
CGH2 and for (cryogenic) LH2. Due to the limited amount of failure data for hydrogen equipment from
experience in practice, there is currently no sufficient basis to deviate from the values that are prescribed

in [HaRi, 2009]. Moreover, failure data is also lacking for risk reduction measures that are / will be
implemented in hydrogen systems.
There is a big need to collect data about accident frequencies and system reliability, worldwide. IEA HIA
Task 19 has made first steps in this. It is recommended that this development is used in the
implementation of hydrogen specific failure rates in the QRA requirements in The Netherlands.
4 DESCRIPTION OF THE HYDROGEN STATION
4.1 Location and surroundings
An existing refueling station in Rotterdam was selected as the object for the safety study in THRIVE. The
station is located along the Stadionweg, a major entry route from the south towards the city and close to
the football stadium of Feyenoord Rotterdam. The area comprises mainly business activities like offices,
car repair workshops and a restaurant. South of the road, there is a densely occupied urban area with
houses.
Figure 1 shows an aerial picture of the station and its surroundings. The altitude of the road and the petrol
station is about 2 - 3 m higher than the housing area.
This location was selected as a situation typical for a refueling station in urban surroundings and
comprising the delivery of conventional car fuels: gasoline, diesel oil and LPG. For study purposes the
hydrogen installation was projected at the current location of the car wash cabinet of the station.
Figure 1: Aerial picture of existing refueling station (centre). Surroundings show: business activities (north, top of picture); housing area (south, bottom-right); restaurant (at the right of fuelling station). [Source: Google Earth]
4.2 The hydrogen system
The proposed hydrogen refueling station is based on the following system; see also Figure 2 and 3.
� Delivery of liquid hydrogen (LH2) by road tanker, capacity 40 m3 (~ 3,400 kg); unloading to storage
takes place by hose, under increased pressure imposed on vapor phase of the tank truck.
� Storage in a super-insulated cryogenic tank, above ground, capacity 17.6 m3 (1,000 kg); storage at
temperature ~ 23 K (-250 oC), pressure ~ 200 kPa (2 bar).
� Transfer from the storage, by means of a cryogenic pump and via heat exchanger tubes, to a series of
gaseous hydrogen (CGH2) buffer storage tanks, at 50 MPa and 85 MPa.

� The vapor boil-off from the storage is also fed into the CGH2 buffer tanks, by a separate boil-off
compressor.
� Transfer of CGH2 to hydrogen dispenser from which vehicle fuel tank is filled, with maximum fuel
tank pressure of 70 MPa. The dispenser is located underneath a canopy (roof) west of the station’s
shop, together with dispensers for other fuels.
Figure 2: Schematic of hydrogen refueling system
Figure 3: Virtual Hydrogen Refueling Station, projected on the existing refueling station; Hydrogen
installations in green and yellow in the lower left corner
5 DETERMINATION OF RELEASE CASES; LOSS OF CONTAINMENT EVENTS
The standardized QRA practice in The Netherlands requires that loss of containment events are defined
for each type of equipment that involves hazardous material: transshipment, storage, piping, pump, etc.
These release cases comprise both the likely events such as a small leak from dispenser connections as
well as the, less likely, catastrophic events such as the explosion of a storage tank.
Standardized release cases include, for instance:
LH2
Road tanker
LH2 Storage tank
Boil off gas management (compressor)
LH2 Cryo pump
Medium & High
pressure storage
Heat Exchanger
GH2 Dispenser
Heat Exchanger
Heat Exchanger

• For tanks, vessels and reactors:
- catastrophic rupture resulting in instantaneous release of the inventory,
- a large hole resulting in the release of the inventory within 10 minutes, at constant release rate
- a small hole in the tank’s body, with representative diameter of 10 mm
• For piping:
- guillotine rupture
- a leak hole of 10% of the pipe diameter
A complete QRA for all hydrogen containing equipment in an HRS will easily involve several tens, to
over one hundred release cases. Moreover, the consequence models in the generally used QRA tools such
as SAFETI and RiskCurves are not fully appropriate to accurately model the physical behavior of the
specific characteristics of hydrogen, especially its extremely low gas density and the low temperatures of
liquid hydrogen. Particularly, the generally applied vaporization and source term models are not validated
for LH2 releases. Therefore, a standardized risk assessment was not feasible in this study without
compromising the specific properties of hydrogen. A dedicated approach was followed in order to identify
sensitivities and uncertainties in the modeling. A reduced number of, mostly worst case scenarios were
identified and consequence assessments were done in more detail.
Table 1 and Figure 4 show the 15 leak cases that were initially identified as the most likely ones
dominating the off-site consequence distances.
Table 1: System properties of the HRS at locations of QRA scenarios
Equipment Scen.
ID
Scenario Inventory Diam.
inner
Phase Nominal flow Pressure Temp
[kg], [m3] [mm] [kg·s
-1], [kg·h
-1] [MPa] [K]
Tank truck 1.a Instantaneous failure 4000 kg Liquid 0.6 20
Unloading hose 2.a Rupture 25 Liquid 0.5 20
LH2 tank 3.a Instantaneous failure 17.6 m3 Liquid 0.5 20
3.b Release in 10 min 17.6 m3 Liquid 0.5 20
Piping tank – Cryo pump 4.a Rupture 44.3 Liquid 0.25 - 0.45 20
Cryo pump 5.a Rupture 12 Liquid 100 kg·h-1
85 20
Heat exchanger 6.a Rupture 12 Gas 100 kg·h-1
85 173
Buffer 85 MPa 7.a Rupture cylinder 0.05 m3 /pc Gas 85 288
7.b Rupture line 12 Gas 85 288
Buffer 50 MPa 8.a Rupture 1 cylinder 0.05 m3 /pc Gas 50 288
8.b Rupture line 4.7 Gas 50 288
Boil-off line, upstream
compressor
9.a Rupture line 29.7 Gas 0.4 20
Boil-off line, downstream
compressor
10.a Rupture line 4.7 Gas Max. 3 kg·h-1
45 173
Line buffer - dispenser 11.a Rupture line 12 Gas 85 233
Hose dispenser – vehicle 12.a Rupture hose 4.7 Gas Max. 0.06 kg·s-1
70 233

Figure 4: Process flow diagram of hydrogen system, with locations of release scenarios; the numbers in red were modeled
For several reasons, the scope for detailed analysis was limited:
• The definition of the dimensions of the hydrogen system was under development during a great part of
the study. The final system definition was agreed in a late stage of the project. For still unknown /
undecided situations, reasonable system assumptions were made.
• The conditions of source terms (release rate, pool evaporation) were complex. Physical conditions like
temperature, pressure and (sonic) release velocity are rather extreme. Standard models for
consequence assessment are not validated for these extreme conditions. Specific model applications
had to be developed and judged. Particularly regarding the behavior of liquid hydrogen (LH2)
knowledge gaps as identified among others by [Jordan, 2009] were confirmed in this study.
• Modeling the dispersion of hydrogen releases in (partly) obstructed surroundings, using sophisticated
CFD codes appeared very complex. Definition of grids detailed enough to account for the objects
within the fuelling station and capable to converge to realistic results, proved to be a complicated task.
• Source definition of LH2 releases and subsequent dispersion did not reveal credible results in all cases.
Much is still insufficiently understood in this field, as is also confirmed by others active in the
development and application of consequence models for hydrogen releases.
6 CONSEQUENCE MODELS
6.1 Source term modeling
Release rates and evaporation for the identified scenarios were modeled using TNO’s software EFFECTS-
8, based upon models recommended in the Yellow Book [PGS 2, 2005]. For the selected installation
equipment, worst case scenarios have been evaluated. It has been assumed that built-in safety provisions
will not function (or are not in place) and that, consequently, maximum release rates occur. In reality, the
probability that the incidents will develop to this magnitude may be quite low.
In some cases, the physical conditions like vapor temperatures or virtual release nozzles had to be adapted
in order to make them appropriate as input for the dispersion calculations. Such cases are explained with
the modeling results in Section 7.
Cryo-storage
Cryo-Pump
100 kg/hr
875 bar
Evaporator
Cooling
K
bar
Phase
55
875
SC
300
875
G
232 LL
232 V
23
2
V233
875
G
21
>2
L
L - Liquid
V - Vapor
SC – Supercritical
G - Gas
5 kg/hr
400 bar
Energy = 2.5 kWh/kg
Bu
ffer
Total Boil-off = 13 kg/d
Size = 17600 litreBoil-off = 7 kg/day
Standby Boil-off = 5 kg/day
Work Boil-off = 97 %Energy = 0.5 kWh/kg
Refrigeration @ -40 CEnergy = 0.13 kWh/kg
Dis
pens
er
CGH2 Buffer Storage
Boil-off Buffer
Storage
Boil-off Compressor
2X2
3
6
11
12
4 5 7 8
9
10
1

6.2 Dispersion modeling
Dispersion calculations have been performed using CFD (Computational Fluid Dynamics). The used
software for the calculations is FLUENT (version 12.0 and 12.1). In CFD a 3D (or 2D) geometry is
divided in small fluid elements. For every element the conservation laws of mass, momentum and energy
are solved and in case of dispersion of hydrogen also conservation of species. The result is a spatially
resolved solution of the flow field and species distribution. The use of CFD allows to model obstacles in
the flow field that will influence the dispersion of gasses.
Most CFD codes (including FLUENT) were originally not developed for calculations of atmospheric
dispersion. The atmospheric boundary layer is not automatically solved correctly. When a theoretically
derived, logarithmic wind profile is applied to the inlet boundary this profile does not remain constant
over the entire domain. To solve this an extra piece of code (udf=user-defined-function) should be used
for a neutral boundary layer that will keep a logarithmic wind profile constant over the entire domain
when it is empty; see Figure 5 for logarithmic wind profiles in a neutral atmosphere.
For non-neutral boundary layers, i.e. stable and unstable conditions, the same procedure is under
development. The use of the correct boundary layer profile is mainly important in the open field; for
releases close to buildings and obstacles the dispersion is dominated by the turbulence generated by the
obstacles and correct modeling of the boundary layer is less important.
0
100
200
300
400
500
600
0 2 4 6 8 10 12 14
velocity (m/s)
heig
ht
(m)
1.5 m/s
5 m/s
Figure 5: Velocity profiles for 0.5 m surface roughness, 1.5 and 5 m/s wind velocity at 10 m height.
For CFD, as for any model, the quality of the results depends on the quality of the input data by the user:
boundary conditions, chosen (turbulence) models, mesh size, etc. Especially close to the source region the
mesh should be fine enough to be able to describe the large gradients in velocity and species concentration
correctly.
For all scenarios a similar domain was defined representing the fuelling station. See Figure 6.
The domain includes two CGH2 dispensers, a roof (canopy) over the dispensers and the nearby shop. At
some distance on the terrain the cylinder for liquid hydrogen storage and some other hydrogen related
obstacles are located. These were modeled as boxes. The boundaries of the domain are chosen in such a
way that the solution is not influenced by their positions. This means that for small releases the boundaries
can be closer to the source than for larger releases.
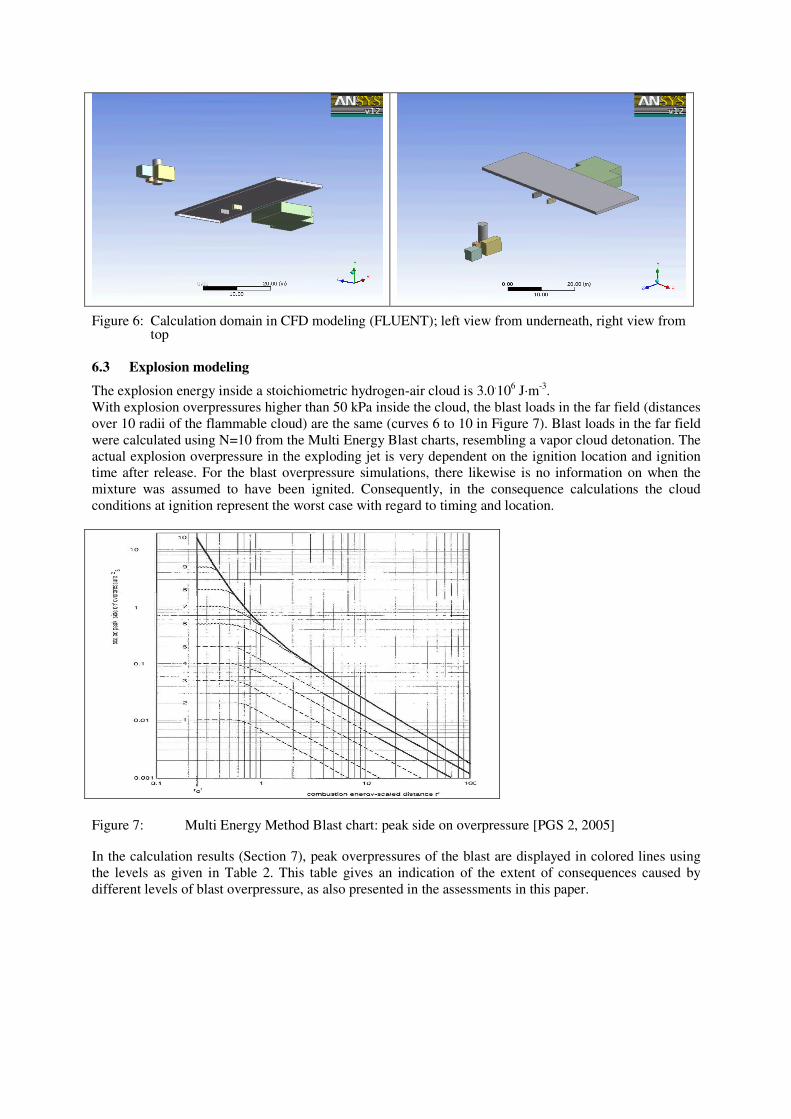
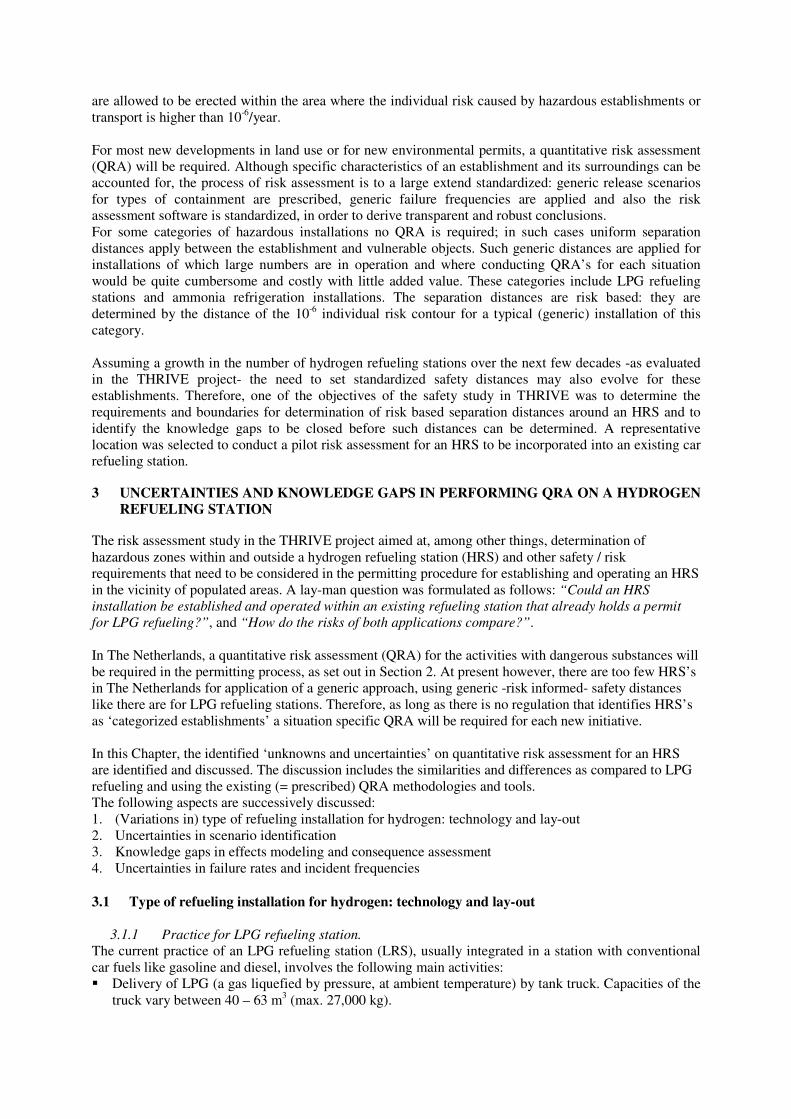
Figure 6: Calculation domain in CFD modeling (FLUENT); left view from underneath, right view from top
6.3 Explosion modeling
The explosion energy inside a stoichiometric hydrogen-air cloud is 3.0.10
6 J·m
-3.
With explosion overpressures higher than 50 kPa inside the cloud, the blast loads in the far field (distances
over 10 radii of the flammable cloud) are the same (curves 6 to 10 in Figure 7). Blast loads in the far field
were calculated using N=10 from the Multi Energy Blast charts, resembling a vapor cloud detonation. The
actual explosion overpressure in the exploding jet is very dependent on the ignition location and ignition
time after release. For the blast overpressure simulations, there likewise is no information on when the
mixture was assumed to have been ignited. Consequently, in the consequence calculations the cloud
conditions at ignition represent the worst case with regard to timing and location.
Figure 7: Multi Energy Method Blast chart: peak side on overpressure [PGS 2, 2005]
In the calculation results (Section 7), peak overpressures of the blast are displayed in colored lines using
the levels as given in Table 2. This table gives an indication of the extent of consequences caused by
different levels of blast overpressure, as also presented in the assessments in this paper.

Table 2: Consequence to property and people from blast with certain peak overpressures (color coded
as for reference)
Peak overpressure (kPa)
Contour
color
Consequence to property Consequence to people
30 Red Destruction of all buildings that were not designed to withstand explosions
Many fatalities of people inside buildings
10 Orange Severe damage to buildings Serious injuries to people inside; few fatalities
3 Green Failure of large window panes Injuries by glass fragments
1 Blue No or limited damage; possibly crack of windows
None
7 RESULTS OF CONSEQUENCE MODELING
From the originally 12 scenario locations as identified in Section 5, totally five were selected to be studied
in detail:
• 2a: Rupture of the tank truck unloading hose to the cryogenic storage, followed by evaporation of
LH2 from a pool
• 6a: Rupture of a line in the heat exchanger (evaporator) downstream the cryo pump
• 8: Rupture of a CGH2 buffer tank
• 11a: Rupture of the line from the CGH2 buffer storage to the dispensers
• 12a: Rupture of a dispenser hose
The results of the case numbers 2a, 11a and 12a are discussed hereafter in detail. These scenarios provided
the most interesting findings from CFD modeling point of view.
For each case, the following parameters are successively described:
- Source term definition: hydrogen release rate and conditions; assumptions taken to obtain the most
appropriate input for dispersion (CFD) modeling
- Dispersion modeling: definition of calculation domain, result in cloud size (dimension of LFL
contour; volume and/or mass of flammable hydrogen cloud) and images of the calculated clouds at
different release conditions and wind speeds
- Explosion modeling: (maximum) distances of overpressure criteria.
7.1 Scenario 2a: Rupture of the tank truck unloading hose
7.1.1 Source term definition
The initial temperature of the release of liquid hydrogen is very low: ~ 20 K = -253 oC. It was assumed
that initially a liquid pool would be formed and that evaporation would take place from that pool by
extracting heat from the soil and from exchange with air and moisture from atmosphere. The surface area
of the pool was calculated with TNO’s software EFFECTS 8. A constant inflow of LH2 into the pool was
assumed, the evaporation rate was calculated based on the heat flux from the surroundings to the pool
(ground, air and solar radiation), using the used CFD tool FLUENT version 12.0 and 12.1.
The input parameters for the hydrogen source term for the pool evaporation are given in Table 3. The pool
temperature will be the boiling temperature of liquid hydrogen at atmospheric pressure, i.e. 20 K.
However, during the set-up of the CFD calculations it was found that using such a low temperature
yielded results that are physically inconsistent. The formed vapor seemed to act as a solid barrier not
allowing the entrainment of air. The flow lines calculated by FLUENT indicated that surrounded air was
pushed upward, over the body of cold vapor.
In order to be able to calculate the dispersion for this scenario it was decided to use a higher inlet
temperature of 100 K. Using a higher inlet temperature will result in a lower vapor density and a higher
(vertical) gas velocity. This results in faster mixing and thus a smaller explosive cloud than when the

boiling temperature would be used as input temperature. However, this velocity is still lower than the
wind velocity and the influence of this effect is expected to be limited: close to the pool differences may
result, but at larger distances the differences may be negligible.
To understand the extend of this effect a temperature study should be done by performing CFD
calculations at different input temperatures. No such study has been performed in this project.
Table 3: Input parameters for CFD calculation of scenario 2a
Theoretical values Used values for CFD
Evaporation rate [kg·s-1
] 1.29 1.29
Pool radius [m] 4.5 4.5
Temperature [K] 20 100
7.1.2 Dispersion after pool evaporation
The geometry for scenario 2a is shown in Figure 8.a. The blue parts display the obstacles in the domain;
the red circle is the hydrogen source (LH2 pool). The wind direction is in the positive x-direction, 5 m/s,
with a constant wind profile on the inlet. No heat exchange is modeled between the ground and the air.
The resulting LFL contour is shown in Figure 7.b. The calculated cloud is very large and extends almost
to the end of the calculation domain. Close to the release the cold hydrogen is denser than air and without
upward momentum remains close to the ground. The released hydrogen shows dense gas behavior.
The calculated dimensions for the cloud are: LFL volume = 39x103 m
3, LFL mass = 300 kg.
Figure 8.a: Geometry used for scenario 2. The blue items display the obstacles; the red circle is the hydrogen source (pool) with 9 m diameter. The wind is in the positive x-direction.
Figure 8.b: LFL contour for pool evaporation with 5 m·s-1
wind velocity. The colors indicate the height of the contour.
Also further downstream the calculations indicate that the dense gas behavior continues, even when the
density and temperature differences between the cloud and the ambient air decrease in the calculation. The
shown behavior is contrary to what is expected. The cold hydrogen gas increases in temperature due to
heat exchange with the ground and mixing with ambient air. Both the temperature increase and the mixing
will result in less dense hydrogen and the hydrogen should become a neutral or even buoyant gas. Large
scale experiments, e.g. by Sandia [Witcofsky, 1984] confirm that plume rise is indeed observed for
hydrogen evaporating from a LH2 pool. It is noted that wind velocity conditions in these experiments were
lower (u = 2.2 m/s) than those for which the CFD modeling was performed (u = 5 m/s).
A second reason to question the results from CFD are the values found with EFFECTS. When the same
calculation is performed with EFFECTS a much smaller explosive cloud results.
Possible causes for the large cloud, indicating a reduced mixing and heating of the hydrogen, are the used
turbulence model, the damping of the turbulence due to the presence of cold hydrogen and the fact that no
logarithmic velocity profile has been used. The k-ε-model modeling turbulence is known for the fast
damping of vortices behind an obstacle. The source of hydrogen acts as a kind of obstacle for the main
flow and using the k-ε-model for turbulence will cause an underestimation of the length of the turbulent
wake behind an obstacle. This will diminish the mixing of the hydrogen with air.

In addition, the cold hydrogen will in reality locally stabilize the atmosphere and reduce mixing. This is a
real physical effect, but may be enhanced in the CFD.
The second difficulty for this case is the very low inlet velocity. This has large influence on the dispersion
and mixing of the hydrogen. With the small vertical momentum the cold and dense hydrogen remains
close to the ground near the source. The correct description of the atmospheric boundary layer close to the
ground then becomes very important. For sources with a larger vertical momentum this is of less
importance.
Concluding on scenario 2a it can be said that it is a difficult scenario to calculate with CFD. The first
difficulty is the extremely low (boiling) temperature of hydrogen. Using this temperature as a boundary
condition for CFD has proven not possible at the moment. The large temperature gradients, the not-ideal
gas behavior and unknown thermodynamic properties all contribute to the difficulty.
7.1.3 Explosion
Because there is some doubt about the outcome of the dispersion calculations no complete explosion
modeling was done for scenario 2a. From the results however, one can conclude that a large flammable
cloud can be generated. Even without the influence of obstacles as flame accelerators -a driver for
pressure generation- some flame acceleration will occur due to the flame instabilities inherent to
hydrogen-air flames. This process however will not be effective in the lean part of the cloud (below 11 %
v/v) which takes up the largest part of the cloud. The effect is expected to be a heavy flash fire with minor
overpressure generation as long as the cloud does not enter a congested or heavily obstructed region. This
minor blast from the large flammable cloud will however have an effect over a large area. The peak
overpressures deteriorate slowly over distance as compared to the jet explosion scenarios (e.g. 11 and 12).
The influence of congested areas or heavily obstructed regions as local overpressure generators is
important and should be kept to a minimum.
7.2 Scenario 11a: Rupture of the line from the CGH2 buffer storage to the dispensers
7.2.1 Source term
In scenario 11a the pipe between the buffer and the dispenser is ruptured. The position of this rupture will
influence the maximum mass flow rate through the hole. A longer pipe between the buffer and the leak
will have an increased friction and pressure drop over the length and subsequently a lower mass flow rate.
The position of the leak was chosen underneath the canopy of the HRS. This is assumed to be a worst case
scenario with respect to the accumulation of the cloud; without the canopy the hydrogen will rise and will
be diluted faster in the atmosphere.
The distance from the buffer to the canopy is approximately 25 m. This distance is set as the pipe length to
determine the mass flow rate: 1.36 kg/s with a representative nozzle diameter of d = 85 mm and
temperature T = 106 K.
7.2.2 Dispersion
The position of the leak is underneath the canopy close to one of the dispensers. The direction of the
release is assumed vertically upward. The calculations have been performed with 1.5 and 5 m/s wind
velocity. The calculations are performed with and without the presence of the roof. A detail view from the
bottom of the roof is shown in Figure 6. The shape of the roof may cause the lock up of part of the
hydrogen released underneath.
The resulting cloud shapes of the calculations are shown in Figure 9.
If no roof is present, the vertically released jet would continue to rise until the concentration is diminished
due to mixing with the surrounding air. During the rising the cloud also drifts with the mean wind
direction.
If a roof is present, the vertical momentum of the jet is stopped and the dispersion mainly continues due to
the presence of the mean wind field. When the hydrogen reaches the sides of the roof plume rise is visible.
However, at the downwind side of the roof no plume rise is visible. Probably at this position intensive
mixing is observed due to wind shear caused by the presence of the roof.

The cloud sizes are reported in Table 4. As expected the higher wind velocity (5 m/s) causes faster mixing of
the hydrogen and as a result a smaller explosive mass of hydrogen-air. A second conclusion from the table is
that the presence of the roof increases the explosive mass in the hydrogen cloud. The roof prevents plume rise
and as a result less mixing of hydrogen with surrounding air will occur. For safety reasons, it should be
considered not to locate hydrogen equipment underneath a roof that will prevent accidental hydrogen releases
to rise and dilute.
Figure 9: Cloud shapes for 1.5 m/s wind velocity (top) and 5 m/s (bottom), without (left) and with (right) roof.
Table 4: Resulting hydrogen cloud calculated for scenario 11a; for 1.5 m/s and 5 m/s wind velocities,
with and without canopy.
Wind velocity [m/s] Volume LFL [m3] Explosive mass [kg]
With roof Without roof With roof Without roof
1.5 4.1 x 10³ 1.7 x 10
3 33.0 10.9
5 1.2 x 10³ 0.8 x 10
3 9.5 5.8
7.2.3 Explosion
For a hydrogen jet release forming a flammable cloud containing 33, 10.9, 9.5 and 5.8 kg of hydrogen
respectively, blast loads were defined using the Multi Energy Blast charts. The total explosion energy
inside the cloud amounts to 3960 MJ, 1307 MJ, 1139 MJ and 696 MJ, respectively. The maximum
distances to possible blast loads are given in Table 5, for the minimum (5.8 kg) and maximum (33 kg)
cloud sizes. Consequence contours for the different blast distances are presented in Figure 10.
The results show that heavy damage (p ≥ 10 kPa) will cover the entire refueling station and may reach up
to the first houses in the urban area. Fragmenting of glass windows (p ≥ 3 kPa) will happen in the greater
part of the houses south of the HRS, up to 275 m distance for the worst case.
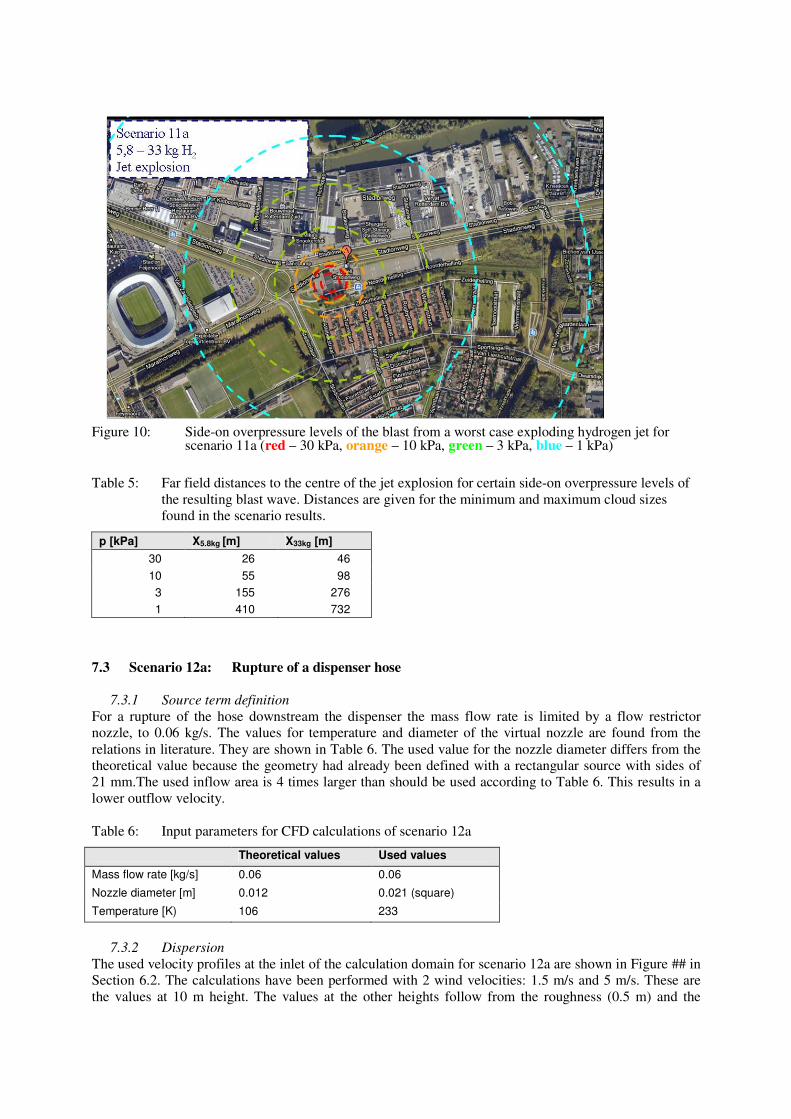
Figure 10: Side-on overpressure levels of the blast from a worst case exploding hydrogen jet for scenario 11a (red – 30 kPa, orange – 10 kPa, green – 3 kPa, blue – 1 kPa)
Table 5: Far field distances to the centre of the jet explosion for certain side-on overpressure levels of
the resulting blast wave. Distances are given for the minimum and maximum cloud sizes
found in the scenario results.
p [kPa] X5.8kg [m] X33kg [m]
30 26 46
10 55 98
3 155 276
1 410 732
7.3 Scenario 12a: Rupture of a dispenser hose
7.3.1 Source term definition
For a rupture of the hose downstream the dispenser the mass flow rate is limited by a flow restrictor
nozzle, to 0.06 kg/s. The values for temperature and diameter of the virtual nozzle are found from the
relations in literature. They are shown in Table 6. The used value for the nozzle diameter differs from the
theoretical value because the geometry had already been defined with a rectangular source with sides of
21 mm.The used inflow area is 4 times larger than should be used according to Table 6. This results in a
lower outflow velocity.
Table 6: Input parameters for CFD calculations of scenario 12a
Theoretical values Used values
Mass flow rate [kg/s] 0.06 0.06
Nozzle diameter [m] 0.012
0.021 (square)
Temperature [K) 106 233
7.3.2 Dispersion
The used velocity profiles at the inlet of the calculation domain for scenario 12a are shown in Figure ## in
Section 6.2. The calculations have been performed with 2 wind velocities: 1.5 m/s and 5 m/s. These are
the values at 10 m height. The values at the other heights follow from the roughness (0.5 m) and the

reference velocities at 10 m. In order to keep the wind profile constant throughout the domain UDFs (user
defined functions) are used. The wind direction differs from the one used in the other scenarios: the wind
comes from the positive x- and z-direction.
The jet is directed in the positive x-direction, see Figure 11. The resulting contours for the LFL (4 % v/v
H2) and 25 % LFL (1 % v/v H2) are shown for the two wind velocities. Close to the source a cigar-shaped
jet is visible. The wind has no big influence on the dispersion jet (4% v/v contour). When most
momentum of the jet is lost, the cloud shape is more influenced by the wind (1% v/v contour). The length
of the LFL jet is about 15 m. Since the wind has a component in the opposite x-direction with respect to
the source, the length decreases when the wind velocity increases.
Figure 11: Hydrogen clouds with 4 % v/v H2 (left) and 1 % v/v H2 (right); wind velocities 1.5 m/s (top) and 5 m/s (bottom).
A second set of calculations has been performed with a larger virtual source size of 12 cm x 12 cm. The
results are shown in Figure 12. Using a larger source size with equal mass inflow reduces the velocity and
momentum of the inflow. Due to this lower velocity, the wind dominates the dispersion and the jet
changes direction closer to the source.
The presented results show that the LFL contour is influenced by the source velocity (source area), wind
velocity and local geometry.

Figure 12: LFL contours for 1.5 m/s and 5 m/s with larger source area of 12 cm x 12 cm.
Since in the simulations the total hydrogen mass within the flammable cloud has not been monitored
correctly, this mass can only be estimated roughly. A conservative estimation for the maximum total mass
of hydrogen within the flammable cloud is 0.6 kg. The stoichiometric cloud volume is approx. 25 m3.
7.3.3 Explosion
For a hydrogen jet release forming a flammable cloud containing 0.6 kg of hydrogen, blast loads were
defined using the Multi Energy Blast charts. The total explosion energy inside the cloud is 75 MJ. The
maximum distances to possible blast loads are given in Table 7.
Consequence contours for the different blast distances are presented in Figure 13. Serious damage (p ≥ 10
kPa) will be done to the HRS’s canopy and shop. In the urban area, some damage by glass shards can be
expected (p ≥ 3 kPa) can be expected, but probably no fatalities.
Figure 13: Side-on overpressure levels of the blast from a worst case exploding hydrogen jet for
scenario 12 (red – 30 kPa, orange – 10 kPa, green – 3 kPa, blue – 1 kPa)

Table 7: Far field distances to the centre of the jet explosion for certain side-on overpressure levels of
the resulting blast wave, scenario 12a.
p (kPa) X0.6kg (m)
30 12
10 26
3 74
1 195
8 DISCUSSION AND CONCLUSIONS DISPERSION CALCULATIONS WITH CFD
CFD is a very powerful tool to compute and display the distribution of species in a domain with obstacles.
Spatial information becomes available which would not be available with the use of integral release and
dispersion models.
However, there are limitations as the current study has also shown. The use of CFD for atmospheric
dispersion calculation is still under development and, ideally, the used models should be validated with
actual releases. This has not been done for the models used for the calculations in this study. For this
reason there is an uncertainty on the absolute value of the numbers mentioned. The effects of increasing
wind velocity or of removing a roof show the expected trends, however, the absolute values may differ
from the results in real life. The numbers are expected to be in the correct order of magnitude.
One of the developments is the correct implementation of the boundary layer profile of the velocity and
turbulence. A procedure to apply a neutral boundary layer was shown for scenario 12a. The achievement
to obtain a constant wind-profile in an empty domain is a necessary first step to model the atmospheric
boundary layer more correctly. However, many open questions remain, e.g. on how to choose the
roughness in the far field and closer to the area of interest, how to apply non-neutral atmospheric
conditions, and which turbulence model is best to describe the atmospheric turbulence.
Another aspect is the correct modeling of the source term. As could be seen in the results of scenario 12a,
the definition of the source term and the virtual source dimensions strongly influence the outcome. For
high velocity releases the concept of a virtual nozzle should be used. In addition the high velocity and
large gradients close to the source require a fine local mesh to capture the flow correctly. For transient
calculations this results in small time steps and consequently in long calculation times. For this reason
only steady-state calculations are shown in this report.
The main problem in modeling hazardous scenarios is found for the large spills of liquid hydrogen (LH2).
Current CFD modeling tools probably overestimate considerably the size of flammable clouds from such
large spills of liquid hydrogen. This is because within the CFD modeling tools the gas formed by fast
boiling liquid hydrogen spills seems to be treated as a heavy gas during the entire simulation. Moreover,
the ability to adequately model phase transition (e.g. evaporation of aerosols) is questioned. Therefore
current dispersion results can be considered as over-conservative for modeling of hydrogen dispersion.
It is known that flammable clouds from the strong evaporation of fast boiling liquid hydrogen spills can be
large and may initially show heavy gas behavior due to the extreme cold. Further away from the source
however, they will have the tendency to rise under the influence of buoyancy once the temperature of the
initially very cold gaseous hydrogen (heavy gas) increases fast due to heat exchange with the environment
and mixing with the much warmer air (to form a flammable mixture).
The current (commercial) calculation tools do not have validated models for appropriately modeling the
dispersion of a large spill of liquid hydrogen. Such models need to be developed and validated against
experiments in order to properly assess the potential consequences of loss of containment accidents in
hydrogen refueling stations.
The general conclusion is that despite CFD for atmospheric dispersion needs further development and
validation with test data, the method is very useful. CFD is increasingly used to study complex dispersion
phenomena. It provides insight into the effects of obstacles on the dispersion, which obviously is not

available from other models. This study has revealed interesting results from numerical modeling but has
also shown some of its limitations.
9 IN SUMMARY: WHAT IS NEEDED FOR AN APPROPRIATE QRA?
In this paper, the most important knowledge gaps and uncertainties in the QRA process for hydrogen
installations have been described. For conducting a QRA with a maximum rate of confidence the
following will be necessary:
� A clear and closed design of the installation, its way of operation, its equipment and control systems
and the spatial layout. A LOPA and/or HAZOP study will be the basis for identification of realistic
release scenarios. This will also include (the adequacy of) protective systems implemented in the
design.
� Consensus about the incident scenarios (loss of containment events), involving the ‘minimum setting’
as per [HaRi, 2009] and modified for the hydrogen specific aspects and system designs.
� State-of-the-art effect models for release, evaporation and dispersion of hydrogen. Implementation of
modeling recommendations from recent research. Validation of models, particularly for dispersion
modeling with CFD tools, based on results from recent and ongoing experimental work. Further
experimental research will be required, for instance on evaporation and dispersion of LH2 releases,
possible explosion effects of large scale hydrogen clouds and heat radiation from hydrogen fires.
� Validation and further improvement of failure frequencies for hydrogen equipment. Demonstrate
whether specific properties of this equipment justify the application of specific failure data, deviating
from the generic [HaRi, 2009] figures.
� Evaluation of the ignition probability of hydrogen releases and dispersed mixtures of hydrogen-air,
and possibly modification of the generic [HaRi, 2009] figures, thus accounting for hydrogen’s high
reactivity.
The technology of hydrogen applications is still a non-mature area. Investigations in new developments
are still continuing and are gradually introduced. This, together with observed uncertainties in
consequence modeling and in dedicated failure statistics make that QRA for these applications would in
this stage be built on too many uncertainties to propose and implement generic risk-informed off-site
safety zones. Defining generic separation distances could frustrate current challenges in the development
of better modeling and safer technologies.
10 REFERENCES
[HaRi, 2009] Reference manual Bevi Risk Assessments
National Institute for Public Health and Environment RIVM, 2009
[ICHS] Proceedings of International Conference on Hydrogen Safety, 2005, 2007, 2009.
[Jordan, 2009] Th. Jordan (coordinator NoE HySafe
Latest Advances in Hydrogen Safety R&D
3rd
ICHS, Ajaccio, September 2009
[Maaijer, 2010] M. de Maaijer, J. M. Ham
THRIVE - Literature Study on Experimental Research for Hazardous Effects of
Hydrogen,
TNO DV 2010 C502, 2010

[PGS 1, 2005] Methoden voor het bepalen van mogelijke schade (aan mensen en goederen door het
vrijkomen van gevaarlijke stoffen)
“Green Book” in Publicatiereeks Gevaarlijke Stoffen, 2005
[PGS 2, 2005] Methods for the calculation of physical effects
“Yellow Book” in Publicatiereeks Gevaarlijke Stoffen, 2005
[PGS 3, 2005] Guidelines for Quantitative Risk Assessment
“Purple Book” in Publicatiereeks Gevaarlijke Stoffen, 2005
[PGS 4, 2005] Methods for determining and processing probabilities
“Red Book” in Publicatiereeks Gevaarlijke Stoffen, 2005
[Schefer, 2007] R.W. Schefer, W.G. Hoef, T.C. Williams, B. Bourne, J. Colton
Characterization of High-Pressure, Under-expanded Hydrogen-jet Flames
International Journal of Hydrogen Energy 32 (2007) 2081-2093
[THRIVE] Towards a Hydrogen Refueling Infrastructure for Vehicles
http://www.ecn.nl/docs/library/report/2011/e11005.pdf
[Venetsanos, 2010] A. Venetsanos, E. Papanikolaou, J.G. Bartzis,
The ADREA-HF CFD code for consequence assessment of hydrogen applications
International journal of hydrogen energy 35 (2010) 3908 – 3918
[Verfondern, 1997] K. Verfondern, B. Dienhart,
Experimental and theoretical investigation of liquid hydrogen pool spreading and
vaporization
J. Hazard. Mater. 22 (1997), pp. 649–660
[WHEC, 2010] B. Hoevenaars, M. Weeda, P. Lebutsch, B. v.d. Broek
Hydrogen Vehicle Deployment and Required Policy Support for Roll-out Scenarios in
the Dutch THRIVE Project
Proceedings of WHEC, Essen, May 2010
[Witcofsky, 1984] R.D. Witcofsky, Chirivella J.E.,
Experimental and analytical analysis of the mechanisms governing the dispersion of
flammable clouds formed by liquid hydrogen spills
International Journal of Hydrogen Energy, 9: p425-435, 1984
[Xiao, 2009] J. Xiao, J.R. Travis, W. Breitung
Hydrogen Release from a High-Pressure GH2 Reservoir in Case of a Small Leak
3rd
International Conference on Hydrogen Safety, September 16-18 2009, France