Umbrella Branding of Private Labels by Sophie Theron A ... Dissertation Presented in Partial...
139
Umbrella Branding of Private Labels by Sophie Theron A Dissertation Presented in Partial Fulfillment of the Requirements for the Degree Doctor of Philosophy Approved July 2014 by the Graduate Supervisory Committee: Timothy Richards, Chair Carola Grebitus Renee Hughner ARIZONA STATE UNIVERSITY August 2014
Transcript of Umbrella Branding of Private Labels by Sophie Theron A ... Dissertation Presented in Partial...

Umbrella Branding of Private Labels
by
Sophie Theron
A Dissertation Presented in Partial Fulfillment
of the Requirements for the Degree
Doctor of Philosophy
Approved July 2014 by the
Graduate Supervisory Committee:
Timothy Richards, Chair
Carola Grebitus
Renee Hughner
ARIZONA STATE UNIVERSITY
August 2014

i
ABSTRACT
Private labels command a growing share of food retailers’ shelf space. In this
dissertation, I explain this phenomenon as resulting from “umbrella branding,” or the
ability of a single brand to reach across categories. Conceptually, I define umbrella
branding as a behavioral attribute that describes a shopper’s tendency to ascribe a
performance bond to a brand, or to associate certain performance characteristics to a
private label brand, across multiple categories. In the second chapter, I describe the
performance bond theory in detail, and then test this theory using scanner data in the
chapter that follows. Because secondary data has limitations for testing behavioral
theories, however, I test the performance bond theory of umbrella branding using a
laboratory experiment in the fourth chapter. In this chapter, I find that households tend to
transfer their perception of private label performance across categories, or that a
manifestation of umbrella branding behavior can indeed explain private labels' success.
In the fifth chapter, I extend this theory to compare umbrella branding in international
markets, and find that performance transference takes its roots in consumers' cultural
backgrounds. Taken together, my results suggest that umbrella branding is an important
behavioral mechanism, and one that can be further exploited by retailers across any
consumer good category with strong credence attributes.

ii
ACKNOWLEDGMENTS
Like they say: “if it was easy, everyone would do it”... So, for their support, I would like
to thank my family back in France and my parents in particular. Next on the list, I have to
thank my committee with a special mention to Tim Richards who it was an honor to work
with for the past three years and who allowed me to work on this AFRI grant. Finally, I
would like to thank my fellow PhD students for making me feel I was not the only one
embarking on this journey with a special thanks to Will Allender for his patience.

iii
TABLE OF CONTENTS
Page
LIST OF TABLES ........................................................................................................... v
LIST OF FIGURES ........................................................................................................ vi
CHAPTER
1 INTRODUCTION ................. ............................................................................. 1
2 THEORETICAL BACKGROUND ..................................................................... 9
Conceptual Model of Private Label Penetration .................................. 11
Regional or National Factors.............................................................. 11
Market Level Factors ......................................................................... 13
Store Level Factors ............................................................................ 15
Product Category Factors ................................................................... 17
Behavioral Factors ............................................................................. 21
3 EVIDENCE OF PRIVATE LABEL UMBRELLA BRANDING ....................... 25
Conceptual Model ............................................................................. 28
Empirical Model ............................................................................... 34
Data Description................................................................................ 48
Results .............................................................................................. 53
Conclusion ........................................................................................ 59

iv
CHAPTER Page
4 AN EXPERIMENTAL ANALYSIS OF PRIVATE LABEL UMBRELLA
BRANDING ........................................................................................ 61
Experimental Design and Description ................................................ 63
Empirical Model ............................................................................... 70
Results .............................................................................................. 75
Conclusion ........................................................................................ 79
5 CULTURAL EFFECTS ON PRIVATE LABEL UMBRELLA BRANDING .... 82
Background on Private Labels and Culture ......................................... 86
Culture and Consumer Personality ..................................................... 89
Methodology and Data ...................................................................... 93
Econometric Model ........................................................................... 95
Descriptive Statistics ......................................................................... 97
Results ............................................................................................ 101
Conclusion ...................................................................................... 105
6 CONCLUSION ................... ........................................................................... 108
REFERENCES....... .................................................................................................... 111
APPENDIX
A EXPERIMENTAL SURVEY INSTRUMENT .............................................. 121
B PERSONALITY SCALE INSTRUMENT ..................................................... 131

v
LIST OF TABLES
Table Page
1. Factors Affecting PL Market Share ................................................................ 20
2. Means of Store Data and Demographics ......................................................... 50
3. Models of Panel Data ..................................................................................... 54
4. Product Brands and Price Levels .................................................................... 67
5. Preferred Models’Estimation for Experimental Data ................................... 76
6. Personality Traits Comparison by Country ..................................................... 99
7. Sample Differences in Personality ................................................................ 100
8. Personality Models ...................................................................................... 102

vi
LIST OF FIGURES
Figure Page
1. Private Label Growth ................................................................................ 1
2. Factors Influencing Private Labels Penetration ....................................... 10
3. Frequency of Private Labels Purchased per Shopping Trip ...................... 51
4. Household Tendency to Purchase Private Labels Across Product
Categories ........................................................................................................ 52
5. Households Distribution Over the Main Constructs .................................. 52
6. Sample Income Distribution .................................................................... 70

1
CHAPTER 1
INTRODUCTION
Over the past two decades, several fundamental changes have occurred in the
retail grocery market. One of the most notable shifts has been the increasing share of
private labels, or store brands. While originally introduced as a way of capturing a price-
sensitive market segment, retailers soon found many ways to generate value from private
labels. For example, in April 2009 Wal-Mart reduced the amount of shelf space allocated
to nationally branded bottle waters such as Dasani and Aqua Fina, in favor of their own,
more profitable, private label brands (Thompson, 2010). Recognizing that national
brands may not necessarily be the most important elements of many categories, retailers
began offering their own store-brand solutions. In the US, private labels are gaining
market share each year, rising to 23.6% of the units sold in all categories, with a dollar
share of 19.5% by the end of December 2011 (Figure 1 below).
Source: SymphonyIRI Consumer Network Reports
Figure 1. Private label growth.
10
12
14
16
18
20
22
24
26
Unit Share
Dollar
Share
%
Time

2
Private label growth is a global phenomenon. In France, for example, the unit share
of private labels has reached 36%, and in Germany they capture fully 41% of the retail
grocery market (Freeman, 2012). In this dissertation, I aim to investigate whether the
growth of private labels is a function of the attributes of a particular retail market, of the
products themselves, or more fundamental principles of consumer behavior. The aim of
this dissertation is to determine whether there is a behavioral explanation for private label
growth, and to test its importance in several retail markets.
While there are many alternative explanations for the rise in private label
popularity, their ability to serve as umbrella brands for retailers, conveying a value or
quality image across many, possibly unrelated categories, has been largely ignored.
Umbrella branding describes a strategy of developing one brand that includes products
from several categories, often at a distinct price-quality tier and offering a consistent
value proposition. Successful introduction of the brand in one category, therefore,
improves the likelihood of success of the same brand in other, perhaps unrelated,
categories. National brand manufacturers often use umbrella branding to leverage
marketing investments across several categories. Special K (cereal and snacks), Crest
(toothpaste and toothbrushes), and Virgin (airlines, records, and many others) are but
three notable examples. Umbrella branding is apparently successful in some national
brands (Erdem, 1998; Erdem and Sun, 2002), but there is limited evidence that umbrella
branding is similarly effective among private labels (Erdem and Chang, 2012; Hansen et
al, 2006). Therefore, the primary objective of this dissertation is to determine whether
there are significant umbrella, or cross-category, effects among private label brands.

3
The definition of what constitutes a private label brand has evolved over the past
twenty years. Originally thought of as low-priced, generic versions of national brands,
they have emerged to include not only generic knock-offs, but medium-quality
competitors, or high-quality, high-price “image” offerings as well. Because many
retailers offer private labels in two or more quality “tiers,” I test for the umbrella
branding effect while controlling for the possibility that store brands are offered for other
strategic reasons.
Purchasing products under the same store brand across numerous categories may
occur for a number of reasons. Erdem and Chang (2012) suggest that this behavior may
be due to a learning spillover effect. Consumers learn over time that the attributes
embodied in private labels in one category are similar to attributes they prefer in other,
related categories. Just as in Erdem (1998), the authors model consumers learning about
mean brand quality level through Bayesian updating. Learning parameters are identified
by patterns in switching behavior, conditional on past product choice. Although this way
to explain cross-category effects is interesting, it can be questioned how learning really
impacts product choice. If a consumer purchases the same brand repeatedly, no learning
effect from one trip to the other can be identified. If the consumer switches brands from
one trip to the next, the learning effect is not an explanation for that switch. In this
dissertation, I argue that consumers purchase private labels in different categories due to
a different set of behaviors or attitudes. Differently from Erdem and Chang (2012), I
hypothesize that this behavior could be explained by a perception of performance
transference of private labels across product categories. Using prior experience and
product information, consumers certainly build expectations toward the brand they buy. I

4
hypothesize that a certain behavior or attitude is engaged when consumers repeatedly
choose the private label in a category, other than justified by the lower cost. Namely,
consumers transfer their perception of private labels’ level of performance across
categories. Each individual has its own degree of performance transference towards
private labels creating specific behaviors which has not been studied under that theory
before. This difference in behavior could be observed at a larger scale across culture if
the performance transference varies across markets. This explanation has not yet been
studied in the past.
In conducting this analysis, I address three primary questions: Can umbrella
branding help explain private label proliferation? Is umbrella branding explained from a
behavioral perspective? Is umbrella branding consistent with consumer purchase data,
both in the U.S. and in other retail markets? Answering these questions will help create a
better understanding why private labels have evolved from niche, “generic” offerings to
perhaps the core element of many retail assortment strategies.
There are many reasons why retailers have aggressive private label branding
programs. Private label brands are particularly attractive to retailers because they
generally have higher margins, whether through eliminating the double marginalization
problem or by providing leverage over national brand manufacturers (Ailawadi and
Harlam, 2004; Cotterill et al., 2000; Sayman et al., 2002; Pauwels and Srinivasan, 2004;
Mills, 1995, 1999; Richards et al., 2010). Eliminating double marginalization problem
involves providing one less step between the product and the consumer as the retailers do
not loose market power by directly providing their own products. Private labels also
contribute to store loyalty because some consumers might choose a particular store

5
because they have a preference for the brands offered by that store – brands that are not
available from other stores by definition (Ailawadi et al, 2008). A store’s image is
shaped by its private labels because consumers tend to make a cognitive association
between the store and its private label line(s). However, the notion that retailers exploit
umbrella branding effects when offering private labels has only recently been advanced
(Erdem and Chang, 2012) and not from the behavioral perspective advanced here. This
relative lack of research is somewhat surprising given that a successful umbrella branding
strategy can mean significant gains in profit for a retailer as a consumer's positive
experience with a store-brand in one category can lead to that consumer buying the same
brand in other categories. On an intuitive level, this is precisely what store brands are
intended to do.
This research makes three fundamental contributions to the literature on private
label expansion. First, it is the first to formally consider the possibility that umbrella
branding is responsible for the growth in private label share. Second, I test a behavioral
theory of umbrella branding that has not appeared in either the quantitative marketing or
economics literatures. Third, I offer a pair of experimental tests that avoid the problems
inherent in studying umbrella branding with secondary (scanner) data. In this regard, I
present evidence of sharp differences in private label-perception among consumers in
different countries based on their cultural background – a comparison that has not been
made in the extant literature.
I provide evidence that supports the notion that umbrella branding is, at least in
part, responsible for the proliferation of private labels. The theoretical framework
described in Chapter 2 advances the hypothesis that behavioral mechanisms underlie

6
private label preference across categories. When choosing private label products in
different categories, consumers use prior experiences and information to build
expectations and form attitudes which are at play during their choice. Therefore, in
Chapter 3, I develop an empirical model identifying the multiple choices of private labels
across categories and incorporating behavioral variables, designed to test the hypothesis
that a consumer purchases a private label from one category based on his/her purchase of
a private label in other categories. Revealed preference data, however, cannot always
control for the complexity of the retail environment in which private labels compete. In
Chapter 4, I design and implement an economic experiment that is intended to test the
behavioral mechanisms underlying umbrella branding. My experiment addresses the
weaknesses inherent in measuring consumer behavior with revealed preference data. For
example, in the panel-scanner data, all private labels offered by a particular retailer are
grouped under the same Universal Product Code (UPC) even if they do not have the same
name or the same tier positioning (generic versus premium). In addition, revealed
preference data does not include behavioral questions so evaluating consumers’ level of
performance transference. Another reason is that revealed preference data can only
partially control for heterogeneity in store and brand preference. By carefully choosing
product descriptions in an experimental framework, I can have a controlled laboratory
environment with behavioral questions added and the identity of the private label and its
quality tier.
Still, conducting an experiment in a population of relatively homogeneous
consumers does not generate data sufficient to test whether cultural factors are important
in generating umbrella-branding effects. Therefore, in a second experiment, I consider

7
the possibility that cultural differences help frame the underlying behavioral mechanism
by comparing purchase behaviors between subjects in France and Germany. I use the
relationship between personality and culture in order to study the impact on cross-
category purchases. If umbrella branding exists in the US, with relatively low private-
label penetration rates, then it should be particularly important in European markets with
much higher private label penetration rates. I test my theory in the French and German
markets in Chapter 5. Therefore, I investigate whether umbrella branding exists among
private labels in other countries and, if it does, to what extent it differs across cultural
boundaries. This study compares perceptions of private labels in two different
international markets. If the underlying mechanism behind umbrella branding is indeed
rooted in cultural and social norms as I hypothesize, then the experiment described in
Chapter 5 will reveal sharp differences in consumer behavior between French and
German consumers. Testing the umbrella branding theory in retail environments that are
fundamentally different from that in the U.S. will provide corroborating evidence and,
more generally, provide a more general test of the underlying mechanism involved.
Differences in private label penetration across countries might come from a stronger
umbrella branding effect – one that finds its roots in cultural differences that are more
conducive to cross-category perceptions of private label value.
Each of the empirical tests finds support for the umbrella branding hypothesis as a
factor for private label market share. In revealed preference data, I find that consumers
do buy private labels across product categories and that they have a behavioral tendency
to do so. This shows there is a potential for private labels umbrella branding across
product categories. Consumers tend to transfer their expectations of private label

8
performance across grocery categories, showing potential for the idea that private labels
are linked by a performance bond. The subsequent results reinforce that hypothesis,
especially for consumers buying a high number of private labels. However, results
indicate that tier level or specific category have a limited impact on private label umbrella
branding.
In overseas markets, we also found evidence of private labels umbrella branding
based on consumer performance transference. We also found that different cultures have
different effect on cross-category purchases which can impact retailers’ expansion
policies. For example, in France, the least neurotic are the consumers who enjoy private
labels across categories the most while in Germany, the extroverts and the least conscious
consumers are the ones who choose store branded products across categories.
My findings provide more general insights to consumer behavior in retail markets
other than the consumer packaged goods considered here. For example, if umbrella
branding is truly driven by fundamental psychological processes, then vehicle dealers
may be able to offer products across different platforms under a single brand, banks a
wider range of financial and risk management products, and even government agencies a
broader suite of services. My results are thus fundamental not only to the retailing
function but also to the definition of the extent of the firm (Williamson, 1975).
The reminder of this dissertation is organized as follows: In the second chapter, I
provide a theoretical model of umbrella branding in which I argue that umbrella branding
goes beyond cross-category learning to more fundamental mechanisms of performance
transference and relationship-building. I develop and estimate an econometric model of
multi-category purchases using revealed preference, household-panel scanner data in the

9
third chapter. Chapter 4 presents an experimental analysis of umbrella branding using a
sample of U.S. consumers that includes more explicit descriptions of each store brand,
and behavioral constructs that capture more detail on consumers’ true motivations for
buying private labels than is possible with revealed preference data. The following
chapter tests my theory of umbrella branding in the French and German markets
hypothesizing that this phenomenon could be linked to cultural roots and local social
norms using personality traits as a proxy. I discuss several generalizations, strategic
implications, limitations and extensions of my research in the final chapter.

10
CHAPTER 2
THEORETICAL BACKGROUND
Private label penetration, which is defined as the market share of all private labels at
either the country, store, or category levels, may vary across markets due to either purely
economic, behavioral, or social factors (Dhar and Hoch 1997). Dhar and Hoch (1997)
identify socioeconomic factors related to the consumer such as price sensitivity (less
wealthy and elderly population); factors inherent to the retailer such as the level of
quality invested in the private label brand, store name-association with the private label;
the number of national brands present in the product category, and the price of the
competition. Each of these factors reflects a structural, economic rationale for private
label penetration. In addition to these structural factors, I argue that private label
penetration rates depend on a number of behavioral, cultural, and social factors. I
develop this model at four levels of manifestation: the consumer level, the market level,
the store level and the category level. The objective of this chapter is to outline the
behavioral factors that may explain private label success. More specifically, I introduce
the idea that umbrella branding, or, in this case, the strategy for a retailer to offer
products across categories under the same brand is one of those factors. Once I identify
the behavioral factors that may form part of the explanation, I use the subsequent
empirical chapters to test the specific mechanism behind my theory of umbrella branding
of private labels in three complementary ways.
I summarize the model explaining private labels success factors in Figure 2
below. The rationale for including each factor within each level is based on first
principles of consumer behavior, and placed in the context of previous research. The

11
model includes both structural, or economic factors that help explain private label
penetration at an aggregate level, and behavioral, social, and cultural elements that
operate at the level of the individual consumer. At the consumer level, I identify a
number of macro level factors that describe all consumers, stores and the economic
environment in which they shop or compete. Market-level group factors relate to local
competition, growth, supply chain, and the maturity of private labels. Among store-level
factors, I indentify the pricing structure of the retailer, store loyalty, store image, and
specific private-labels strategies as primary factors affecting the private label penetration
rate. Finally, at the product-category level, I discuss the nature of the category and the
impact of national brands. I explain these factors in more details below.
Figure 2. Factors influencing private label penetration.
Consumer Level:
- Storage capacity
- Importance of brand names and shopper perception
- Shopping trip duration
- Economic situation
Market Level:
- Competition concentration
- Private labels maturity phase
- Market growth
- Supply chain structure
Store Level:
- Pricing structure EDLP/ HiLo
- Store clientele loyalty
- Store image
- Number of categories carrying PL
- Quality of PL developed
Category Level:
- Perceived social risk
- Price level
- Number of private labels tiers
- Number of national brands
PL penetration

12
Conceptual Model of Private Label Penetration
Consumer products succeed or fail for a number of reasons. These reasons can be either
inherent in the product themselves, the retailer that sells them, or more extrinsic factors in
the retail environment. Conditioning each of these factors are more fundamental features
of how consumers behave, and how their preferences interact with the retail and product
environment. In this section, I create a conceptual model of these factors in which I
explain the nature of the effect, and the level at which it operates, from the macro or
aggregate level to the specific store and category in which the product is introduced to
finally the consumer who buys it. While my focus is on private label products, this
framework should be considered a general model of how the retail environment interacts
with consumer preferences in determining the success or failure of an individual product,
or a brand more generally. The part of the model I will emphasize is the behavioral
component which is the last factor that takes place in the decision making process. I will
explain how a performance bond between related products can influence consumers’
purchases.
Consumer Factors
Whether a product succeeds or fails is often dependent upon household attributes that are
true of most households in an economy. For example, the amount of storage capacity
available in a typical home is critically important in shaping purchasing behavior.
Intuitively, one might think that more storage would benefit private labels, because they
tend to be low-priced, high-volume, value items. But, according to Ailawadi et al.
(2001), high storage capacity is a significant factor for shoppers who stockpile promoted
items. For example, if a national brand is discounted, shoppers tend to purchase larger

13
quantities, at the expense generally lower-priced, competing items. Thus, a high storage
capacity is associated with a high national brands purchase and thus a low private-label
penetration rate.
Brand names are also important. Rubio and Yague (2007) argue that advertising
investments by national brands can be overwhelming compared to the virtually non-
existent level of advertising by private labels. Consumers facing this advertisement
might develop a strong preference for national brands. National brand preference,
therefore, can be proxied by the amount of money spent by national brands
manufacturers; high national brand advertising leads to lower private label share.
More fundamentally, consumers have an inherent desire to be perceived as “smart
shoppers.” Value conscious or deal prone shoppers are more inclined to buy private
labels (Garreston et al., 2002; Burton et al., 1998). However, even value-conscious
consumers do not want prices that are too low, because, even if they are looking for a
deal, low prices often are interpreted as signals of low quality. De Wulf et al. (2005)
show that private label orange juice is judged of the same or better quality than the
national brand during blind taste tests in the Netherlands. This evidence disputes the
common stereotype of private labels being cheap and low quality.
How long the consumer spends shopping, which is interpreted as an indicator of
the care taken in considering alternative products, may also be associated with private
label penetration. Private labels will have higher penetration rates when consumers take
the time to think about their choice in the aisle, and do not make impulsive purchases
(Burton et al., 1998). For this reason, trip duration and private label share are expected to

14
be positively correlated as consumers take the time to carefully choose products, and
perhaps are more likely to make explicit price-quality comparisons.
As evidenced by the rise in private-label share during the recession of 2009 –
2011, general economic conditions affect the relative competitiveness of private labels.
In fact, trials of private labels might actually occur more by constraint than by choice.
During economic downturns, some shoppers switch to private labels because of their
cheaper prices (Lamey et al., 2007). When the economic situation improves, consumers
tend to stick with the private labels, suggesting that private label share tends to “racket
up” during poor economic times. Lamey et al. (2007) measure the economic climate
through either GDP growth, unemployment change, or consumer buying power, so this
effect appears to be a very general one.
Market Level Factors
A second set of factors are specific to individual markets Market structure refers to the
competitiveness of a particular retail market, and is typically measured as the size and
concentration of the firms in a market. Shankar and Bolton (2004) identify a number of
factors influencing retailer pricing strategy, including competitive factors (price and deal
frequency), and chain factors, (positioning and the size of the supply chain). Private label
share is clearly dependent upon both the presence and the strategic orientation of other
retailers.
The Herfindhal Index (HI, Weinstock, 1982), or the sum of the square of each
firm’s market share, is a common measure of market structure. The lower the index, the
more competitive the market is. HI can also be calculated for national brands as a
measure of manufacturers’ concentration. There is some evidence national brand

15
manufacturers increase their prices and carry fewer sales when they are confronted with
strong private label competition (Ward et al., 2002), indicating that national brand
manufacturers tend to prefer differentiation to engaging in a price war. Therefore, the
number of national brand manufacturers and the level of national brand prices may
influence private label penetration.
Maturity of the private label market is another key market-level success factor.
Steenkamp et al. (2010) study a cross-section of national private label market shares and
classify each as in the mature stage (found mostly in Western Europe and North
America), or in the development stage (Eastern Europe, Asia, South America), based on
the number of years that private labels have been present. They show that the willingness
to pay a premium for national brands over private labels is smaller in mature countries
mainly because the quality gap between those products is smaller in such markets.
Maturity can also apply across retailers rather than across countries, and can be measured
relative to a diffusion model benchmark (Bass, 1969). In this case, the retailer is deemed
mature if the first difference of the adopter curve equals zero. I expect that more mature
markets according to this measure will have higher private label market shares.
Independent of its phase of private label development, the rate of market growth
is also an important factor driving private label share, even after controlling for pricing
and product line strategies of competitors (Rubio and Yague 2007). Rubio and Yague
(2007) find that when market growth is positive, national brand market share grows at the
expense of private labels. Growing markets tend to favor higher-priced items because
consumers are less price-sensitive when markets are growing in aggregate.

16
At the market level, the structure of the supply chain also influences private label
share. Chen et al. (2010) show that national brand manufacturers benefit from producing
private labels if they have excess capacity. Indeed, vertically integrating private labels
insure lower prices for consumers compared to a vertically separated supply chain model.
Therefore, if the supply chain is vertically integrated, I expect private label share to be
higher as prices will, in general, be lower.
Store Level Factors
Several factors operate at the level of the store (or the chain, or parent organization, as
opposed to individual stores). First, retail pricing strategy, or whether the retailer uses an
everyday low price (EDLP) or HI-LO strategy, can influence private label share. For
example, Wal-Mart’s EDLP strategy, combined with a single private label brand (Great
Value), represents an entirely different approach from Kroger’s HI-LO pricing strategy
and multiple tiers of private labels (from Kroger brand to Private Selection). Which is
more effective at increasing private label share, however, is an empirical question.
Bolton and Shankar (2003) classify retailers as exclusive, moderately promotional, HI-
LO, EDLP, and aggressive. Ailawadi et al. (2001) show that retailers with EDLP
strategies have higher private label penetration rates, due to the observation that the
private label is typically positioned as the low-price leader in many important categories.
Therefore, I hypothesize that the private label penetration rate will be higher for EDLP
than HI-LO stores.
Customer loyalty is another variable influencing private label penetration. Stores
with strong loyalty tend to have stronger images, which reinforces brands that bear the
store’s name (Ailawadi et al, 2008; Semeijn et al 2004). However, having a positive

17
store image does not necessarily imply strong loyalty, so these two factors operate as
independent factors driving private label share.
In addition to store loyalty, Vahie and Paswan (2006) consider store atmosphere
or ambiance as significant factors. A pleasant shopping experience can improve a store’s
image and thus the store brand perception. Convenience and perception of the price-for-
value of the product are also positive factors. By offering a positive overall shopping
experience to the consumer, a retailer can increase its store image and thus its store brand
image, and market share.
Private-label breadth, or the number of categories with private labels, can either
raise or lower private label share. Ailawadi et al. (2008) show that if private labels are
present across many categories in the store, consumer satisfaction decreases due to a
perceived lack of choice and the possible absence of favorite national brands. As a
consequence, they observe a U-shaped curve for private label share: private label share is
high when there is only a moderate breadth of private labels across categories. On the
other hand, cross-category private labels increase brand awareness and market share.
Therefore, I expect to find that private label share is a non-linear function of the number
of categories in which private labels appear.
Quality, or the positioning of store brands, is clearly an important factor in private
label share. Corstjens and Lal (2000) study private labels in multiple countries: UK,
USA, France, and Canada and find that, in addition to increasing profit margins and
bargaining power for the retailer, a quality private label increases store loyalty. They find
that a premium store brand can help differentiate one retailer’s private labels from
another, whereas a low quality store brand only has a price-effect. Using a high-quality

18
private label to drive share, however, requires a segment of consumers willing to switch
to store brands, as well as a segment of consumers who keep buying national brands.
They conclude that a quality store brand will better serve a retailer’s image in addition to
drawing the attention of more shoppers. Arriving at the same conclusion, Braak et al.
(2013) found that premium private labels have better retail margins than economic
private labels even if the best margins remain for “me too” private labels.
Product Category Factors
Another set of factors function at the level of the category, or have an effect that differs
depending upon the nature of the category itself. Each product category is unique in the
sense that national brands are rarely present in more than one category, the price points
are different, and the importance of the category depends on consumer preferences (for
instance, olive oil for Spanish consumers or cheese for French consumers).
One way to describe categories is on the basis of the risk associated with a
category purchase. Semeijn et al. (2004), for example, classify product categories by
their degree of financial risk, functional risk, or psychological risk. Financial risk refers
to the general dollar-importance of the category in consumer budgets. Functional risk
describes the potential negative impact of choosing the wrong product (the product would
not perform as expected), while psychological risk is defined the risk of choosing the
wrong product in the eyes of peers when the product is presented to family or friends, for
example. Toothpaste is an example of high functional risk and low financial risk and
wine carries a high financial risk and high psychological risk. Zielke and Dobbelstein
(2007) simplify this notion by emphasizing only the degree of social risk for a product
category. For example, in the wine or chips categories, the social risk is high because

19
those products are more likely to be consumed with friends, and consequently the
shopper wants to offer a product of high quality, a product of a famous brand, and the
consumer wants be sure of a consistent quality profile. Social risk favors premium or
high-quality store brand penetration, but may be a negative influence on value private
labels. Indeed, if a social risk is higher on value or generic private labels, consumers are
going to be more skeptical applying their perception of private label performance for
lower quality products than for premium products. Risk could form an important
explanation for private label share if there is a difference in risk perception across product
categories.
Price-positioning is perhaps the most critical strategic decision retailers can make
regarding their private labels. Semeijn et al. (2004) find that, relative to national brands,
store brands are most successful when positioned in the range of -10% or -40% of the
national brand’s price. The middle of this U-shape curve (around -20%) is considered
too expensive for a value private label and not expensive enough for a quality store
brand. Therefore, price point is another factor influencing private labels penetration,
although it seems that different price points are appropriate for different tiers. It seems
that consumers would then only consider private labels priced accordingly either at -40%
or at -10% depending on their positioning. If retailers want consumers to trust their
products across categories, it would seem that a right pricing strategy across categories is
necessary.
Many retailers use a multi-tier positioning strategy. Sethuraman et al. (2009) and
Raju and Dhar (1995) find that private labels have higher penetration when the product
category is characterized by a high number of national brands. However, when this effect

20
is broken down among private labels tiers, the results differ. Geyskens et al. (2010) show
that both economy and premium private labels tend to cannibalize a standard private label
product because mid-tier private labels are considered as “me-too brands,” imitating the
national brand at often lower quality. Further, mid-tier private labels compete with
national brands, whereas value or premium store brands do not always raise retailer
market share (Bontemps et al., 2005). Considering both sides of the argument, it is clear
that the effect of the number of private label tiers chosen by the retailer is an empirical
question.
In Table 1, I summarize the constructs that form the conceptual model identified
from the literature. Based on the review of previous findings, the factors that should
positively influence private label market share are: smart shopper perception, shopping
trip duration, maturity of private label development, vertically integrated supply chain,
EDLP pricing structure, store clientele loyalty, store image, quality of private label
developed, very small or very large price gap with national brands, and the number of
national brands in the category. The remaining factors are expected to have a negative
impact or have no clear a priori effect.

21
Table 1
Factors Affecting Private Labels Market Share
Construct Source Measurement
Consumer:
- Consumer risk aversion
- Storage capacity
- Importance of brand names
- Smart shopper perception
- Shopping trip duration
- Economic Situation
Erdem and Chang, 2012
Ailawadi et al, 2001
Rubio and Yague, 2007
Garreston et al, 2002
Burton et al, 1998
Lamey et al, 2007
Scanner Panel data/ Self
report
Hosftede scale
Scanner Panel data/ Self
report
Advertising $
Self Report
Self Report, in minutes
GDP/unemployment/
Consumer Index
Market based:
- Competition concentration
- PL maturity phase
- Market growth
- Supply chain structure
Shankar and Bolton,
2004
Steenkamp et al, 2010
Rubio and Yague, 2007
Chen et al, 2010
Herfindhal Index
Dummy based on diffusion.
Percentage from scanner
data
Vertical / Horizontal dummy
Store Based:
- Pricing structure
- Store clientele loyalty
- Store image
- Number of categories
carrying PL
- Quality of PL
Bolton and Shankar,
2003
Semeijn et al, 2004
Vahie and Paswan,2006
Ailawadi et al, 2008
Corstjens and Lal, 2000
EDLP / Hilo dummy
Self report
Self report
% of total categories
Self report
Product Category based:
- Perceived social risk
- Price level
- Number of NB
- Number of PL tiers
Zielke and Dobbelstein,
2007
Zielke and Dobbelstein,
2007
Sethuraman et al, 2009
Geyskens et al, 2010/
Bontemps et al, 2005
Self report
Gap at 40% or 10% =1,
other=0
Number
Number

22
Behavioral Factor
A behavioral factor refers to an action resulting from underlying psychological process;
and in this case, I am interested in the behavior or the response an individual offers from
an environmental stimulus, namely the possibility to choose private label. Of the factors
considered in the conceptual model above, few refer to specific psychological or
behavioral attributes of private label consumers. One behavioral attribute in particular
may constitute a core mechanism behind private label penetration – umbrella branding.
Umbrella branding is defined as the tendency for consumers to associate performance
characteristics of a brand in one category, to products of the same brand in other
categories. My behavioral theory of umbrella branding rests on the notion that private
labels embody an implicit warranty of consistent quality across categories. Wernerfelt
(1988) argues that consumers expect the same level of quality for different products with
the same brand -- a promise by retailers that is akin to a "performance bond" for umbrella
branded products. Because the identity of a chain as a manufacturer of consumer
products relies almost entirely on the quality of its private labels, such a behavioral
element is likely to be critically important in the case of private labels. Consumers use
brand name as a quality signal, or as a means of reducing the expected risk that they will
be disappointed by the product upon consumption. Umbrella branding reduces the
consumer's perceived purchase risk, increasing their expected utility and the likelihood
that they will select an umbrella-branded product. Retailers recognize this risk-reduction
effect, and take advantage by introducing a new product in a different category under the
same brand.

23
The risk in leveraging a brand across multiple categories is that a poor experience
with a product in one category can erode the perceived quality of products in other
categories with the same brand. In other words, the perceived quality of the brand is only
as good as the lowest-quality product. Consistent quality is critical across products in
different categories. This point is crucial for private labels since retailers usually
introduce new private label products in a large number of categories. The objective of
this section is to outline how branding across multiple categories, or umbrella branding,
can drive market share growth for private labels through the performance bond
mechanism.
Research shows that an umbrella branding strategy can be effective in a number
of contexts. Balachander and Ghose (2003) study a number of national brands and find
an umbrella branding strategy to be successful for a number of reasons. For example,
brand extensions spread brand awareness and contribute to brand image, increasing
parent brand equity. Use experience and advertising umbrella effects are also significant
determinants of the demand for national brand toothpastes and toothbrushes (Erdem and
Sun, 2002). In a cross-category sample of national brands, Erdem (1998) finds that
umbrella brands benefit from a transfer of perceived quality. Each of these studies,
however, uses data from national brands. Effective umbrella branding among national
brands is perhaps to be expected because manufacturers are in a position to invest
millions of dollars in developing and supporting brand equity, and introducing products
that are closely related to existing, strong brands.
Umbrella branding among private labels, however, is not necessarily as effective
a priori because retailers lack the resources to develop strong store-brands. Without the

24
ability to develop brand equity using the usual methods by which brands are built,
namely advertising and trade promotion, retailers instead rely on the provision of value
through a performance bond that works like an insurance contract. If consumers face an
inherent quality risk in purchasing consumer goods, then retailers provide an implicit
insurance contract by assuming some of the risk that a quality guarantee offered in one
category can be successfully transferred to other categories. If a consumer purchases a
private label in one category, he or she is more likely to purchase a private label in
another category on the next purchase occasion because he or she expects the evident
quality of private labels in one category to transfer to the same brand in another category.
This study provides support for the existence of this form of umbrella branding in private
labels, while controlling variations in perceived quality.
The theoretical model I propose differs from the previous literature because it
looks at umbrella branding of private labels in a somewhat unique way. Rather than
learning about the existence and quality of private labels in other categories from one trip
to the next, as in Erdem and Chang (2012), the behavioral mechanism relies instead on
the transfer of value perception among products of the same brand. According to the
performance bond developed by Wernefelt (1988), the image of private labels is linked to
past experiences and expectations, reducing consumer risk. Umbrella branding is then
applied because past experience with one private label creates an expectation of similar
value for the purchase of the next private label. In the past, the stimuli revolved around
an image that store brands were “cheap products,” but recent trends show that this might
have changed. More than simply learning about a particular private label, this theory is
more general in that it implies that consumers consider a product based on past

25
experiences, related products in the same brand, and the related store attached to the
brand. Developing encompassing attitudes toward private label products orients
consumer behavior toward a whole line of private labels, and not just those in a single
category. Because this perception varies by retailer, the umbrella branding effect can be
identified by pooling private label purchases across consumers, retailers and over time.
The factors mentioned in Figure 2 and the behavioral factors added are
econometrically taken into consideration, when the data allows, in the following chapters.
These factors are important for umbrella branding because they can more or less facilitate
the transfer of performance of across categories. For example, store loyalty should have
a positive effect on umbrella branding. If the consumer is loyal to a store, they have a
positive opinion of the store name and thus are likely to have a positive opinion of all
private labels linked to that store name. In Chapter 3, I use an econometric approach
applied to household panel data to explain private label share using some of the factors
outlined in the conceptual model described in Table 1, while isolating umbrella branding
as a new element. Secondary data, however, cannot capture the behavioral elements
necessary to fully test the performance bond theory of umbrella branding. Therefore, in
Chapters 4 and 5, I test for the presence of umbrella branding in an experimental
treatment of consumers in the U.S., and in Europe, respectively. In this way, I control for
cultural factors that may potentially confound the identification of pure umbrella effects.

26
CHAPTER 3
EVIDENCE OF PRIVATE LABEL UMBRELLA BRANDING
Umbrella branding implies that consumers who buy a private label in one category will
have a higher probability of purchasing a private label in another category (Erdem and
Chang 2012; Richards et al., 2014), everything else held constant. Correlated purchasing
patterns, however, can be consistent with many other explanations. Therefore, the
empirical challenge in testing the performance bond theory of umbrella branding lies in
identifying empirical relationships among brands that are unique to that theory.
Specifically, I test whether the tendency for households to transfer their perception of
private label performance to private labels in other categories explains the private label
share of their total shopping basket. This involves testing the performance bond theory
developed by Wernerfelt (1988), which implies that all products under the same brand
name inspire the same performance perception from the consumers. In this chapter, I
present a comprehensive empirical model that isolates this specific mechanism driving
umbrella branding of private labels.
Other factors are clearly important in determining private label share. Product
prices, often associated with different store formats, directly affect the choice of private
labels (Bolton and Shankar, 2003). The number of private labels versus the number of
national brands offered also has a significant impact. Empirically, more private labels in
other categories increases the share of private labels in the target category while it
decreases the sale of national brands (Sayman et al., 2002). Households with different
demographic and socioeconomic profiles tend to differ in their private label penetration
rates (Hansen et al., 2006) for a number of reasons. Lower income households tend to

27
search for lower-priced substitutes to popular national brands (Hansen et al., 2006), while
more highly educated households tend to favor the better value propositions offered by
store brands. Even though demographics explain a small part of the variability in
consumer choice in their study, Sudhir and Talukdar (2004) report that older consumers
and those with large families tend to be private label consumers.
In addition to demographics, other household-based factors can influence
consumers’ choices of private labels over national brands. For example, household
loyalty to a particular retail chain can increase private label share. Moreover, Semeijn et
al. (2004), find a linear, positive relationship between store image (physical layout,
merchandise, service) and consumers’ attitudes toward its private label line. Indeed,
consumers that are store loyal are more likely to buy the store brand (Bonfrer and
Chintagunta, 2004). However, brand loyalty can reduce private label share. Consumers
also have loyalties toward national brands, and Ailawadi et al. (2008) found that brand
loyal consumers have lower private label share. Risk aversion is another household-
based factor to take into consideration. In the U.S., consumers are risk averse, which
means that they favor national brands when store-brand quality is uncertain (Erdem and
Chang, 2012). Once these other factors are taken into consideration, there may remain a
tendency for consumers to prefer private labels in many, seemingly unrelated, categories.
Observed heterogeneity among households, however, can only explain part of their
tendency to purchase private labels (Erdem and Chang, 2012). Unobserved
heterogeneity, in the form of preferences or other behavioral motivations, may also be
important. In this chapter, I capture these elements in an empirical model of household-
level private-label penetration. Namely, I maintain that there is a behavioral tendency to

28
purchase private labels across multiple categories that is driven by transference of
performance characteristics across product categories (Wernerfelt, 1988). For example,
if a consumer purchases a private label ice cream one week, and likes it, then he or she is
more likely to purchase a private label cookie, in addition to the private label ice cream,
on the next trip to the store, on the assumption that the cookie is likely to perform as well
as the private label ice cream.
I test this hypothesis using a data set that represents a panel of household shopping-
basket (multi-category) purchases across a number of different groceries stores. I define
private label penetration as the share of items in each shopping basket attributable to
some form of store-brand. I use a discrete choice model to estimate households’ private
label market share, conditional on socioeconomic, demographic, and marketing mix
variables, while isolating variables that capture the performance bond concept.
I find that this latent private label tendency has a positive effect on the likelihood of
purchasing multiple private labels on each trip to the store. I interpret this finding as
suggesting there is a household trait, largely driven by a latent performance-perception
effect that is independent of any other mechanisms driving brand choice and leads to
greater private-label brand penetration. This latent performance perception is evidence of
an umbrella branding effect.
This chapter contributes to both the theoretical literature on private label penetration
and the substantive literature on cross-category purchases. First, no other study considers
an explicitly behavioral element in explaining umbrella branding of private labels.
Empirically, I find evidence that supports this theory as the private label performance
proposition appears to be transferred across product categories. Second, my study

29
examines cross-category purchases using a discrete choice model and latent purchase
construct that is able to identify significant interactions among products in different
grocery categories. This approach is unique in that it estimates households specific
private labels share and tie this to their individual tendency to purchase store brands
across product categories.
The chapter is organized as follows: The next section presents the conceptual model
of umbrella branding. In the second section, I describe an empirical model of private
label penetration in which I introduce variables that capture both macro and micro-factors
that may be important. In the third section, I describe the data used to estimate the
empirical model. In the fourth section, I present the estimation results, and interpret their
implications for food retailing more generally. The final section concludes and offers
some implications for managerial strategy, and the economic efficiency of the private
label grocery market.
Conceptual Model
In this section, I outline a conceptual model of multi-category private-label purchase in
which I describe a range of possible motivations for consumers to purchase, or retailers to
offer, private labels across multiple categories, and then explain how umbrella branding
can be identified uniquely from these other factors.
Retailers have many ways in which they can attract consumers to purchase private
labels. First, retailers tend to offer private labels, or store brands, as alternatives to
popular national brands (Chan Choi and Coughlan, 2006). In this study, the authors look
at private-label positioning in a product category with two national brands of different
quality levels. They find that the profit curve generated by private labels is convex,

30
namely, if the private label product is of high quality, the private label should imitate the
better quality national brand, but if the private label is too low in quality, it should imitate
the lowest-quality national brand. If the two national brands are not differentiated in
quality, the private label should then be differentiated from both (Chan Choi and
Coughlan, 2006). Competition with similar national brands is, therefore, likely to be
important in attracting private-label buyers.
Second, retailers often price store brands in order to attract value-seeking shoppers
(Hansen et al., 2006). As evidence, when retailers price discriminate with lower-price
private labels, national brand prices may rise after the private label is introduced
(Bontemps et al., 2005; Ward et al., 2002; Steiner, 2004). Price discriminating with
private labels essentially means that retailers use their own brands to segment the market,
skimming the cream by pricing national brands relatively high, and building volume by
selling value-level private labels to more price-conscious shoppers.
Third, the fact that national brand prices tend to rise when private labels are
introduced may also reflect a differentiation strategy on the part of retailers (Chan Choi
and Coughlan, 2006). Retailers often sell private labels that are differentiated, even from
others in the private label line, because doing so allows them to capture specific segments
of the market that prefer attributes slightly different from those offered by the national
brands. Typically, private labels are positioned to imitate the quality of leading national
brands, but using multiple quality tiers allows retailers to compete across the quality
spectrum. This kind of pricing strategy and quality positioning is crucial in establishing a
significant private label market share (Steiner, 2004).

31
There is some question as to whether private labels in different quality tiers are
even recognized as store brands by consumers. Implicitly, therefore, my operating
assumption is that if consumers can only buy a particular brand at one store, they identify
it as a store brand, even if it differs from another store brand they may typically buy. For
example, Private Selection products are the premium private labels in many Kroger
banners, and can only be purchased there, thus consumers consider Private Selection
products private labels just as Kroger’s branded products. While this assumption may
impute more conscious thought on the part of consumers than is true in reality, it is both
necessary and descriptive. Because most retailers offer dozens of different brands
throughout the store, identifying the relationship between different store brands within
the same retailer requires that I make this assumption. Second, it reflects retailers’
marketing strategies as most advertise their store brands together on websites, through
promotional materials, and through in-store merchandising.
Private label market share can depend on factors related directly to the purchaser.
Indeed, the tendency to purchase private labels in multiple categories can depend on
differences among households in terms of fundamental consumer needs, simply because
private label penetration rates vary by category. For example, if a household tends to
purchase milk, ice cream, and cookies, their measured private-label tendency will likely
be greater than another household that purchases breakfast cereal, carbonated soft drinks,
and condiments simply because the former are purchased more often, and tend to contain
more private labels.
Household risk aversion can also be important. In fact, some categories are more
likely to be conducive to private-label purchase due to the level of risk assumed by the

32
consumer by selecting a private label compared to a national brand (Semeijn et al., 2004;
Zielke and Dobbelstein, 2007). Categories with high “social risk” are categories that
carry products susceptible to social pressure, and are likely to be used with family and
friends. For example, opening a bottle of store branded wine or opening a bag of store
branded potatoes chips might be perceived negatively by guests. Indeed, those products
can still have a stigma in society regarding their apparent quality level, and product
categories such as wine or chips still have a strong national brand presence.
Alternatively, low social risk categories include those that are consumed alone and
involve little social stigma, such as toothpaste or yogurt. As a consequence, categories
with high social risk have the lowest likelihood of having successful private labels.
Still, there may be an incentive for retailers to offer private labels even in more
“risky” categories. Indeed, private labels benefit from being present in a large number of
categories across the store (Sayman et al., 2002) because doing so raises consumer
awareness simply due to ubiquity. Sayman and colleagues (2002), find that higher
numbers of private labels in other categories increases the likelihood consumers will
purchase a private label in a target category because of the increased buyer-awareness
across the store.
Store perception also influences the share of private labels (Bonfrer and
Chintagunta, 2004; Semeijn et al., 2004). These studies find that a positive attitude
toward a particular store has a tendency to increase its private label share. This notion is
supported empirically as Ailawadi et al. (2008), show that there is a relationship between
a household’s private label share and consumers’ loyalty to a particular store, where
loyalty is defined as the share of shopping trips taken in one store. Ailawadi et al. (2008)

33
describe private label share in two retailers in the Netherlands and find that household
preference for private labels derives from the lower prices offered by private labels.
Consumers are thus loyal to a store that offers an affordable line of private labels, at a
quality level that is revealed to be acceptable. They also explain that households are
loyal to private labels in general, not to a specific private label brand, but do not test for
any behavioral explanations.
Prices are of obvious importance in explaining observed private label market
shares. Hansen et al. (2006), show that the purchase of private labels is linked to a
household’s idiosyncratic price sensitivity. Households that are more price-sensitive
have a greater tendency to purchase private labels in multiple categories. That said,
Hansen et al. (2006), show that unobserved household factors are more important than
demographics in explaining preferences, so this finding suggests that there are other,
perhaps behavioral, factors that explain private label share.
In this study, I add structure to this unobserved factor by recognizing that there may
be behavioral traits within households that drive multi-category private label demand -- in
addition to price sensitivity. Namely, the effectiveness of umbrella branding may be due
to the trust that consumers carry over from store perception to all product categories
within the store. The tendency to buy the same brand across product categories, called
umbrella, or spillover effects, is effective in increasing the share of national brands
(Balachander and Ghose, 2003; Erdem, 1998; Erdem and Sun, 2002), and private labels
alike (Erdem and Chang, 2012). However, there is no empirical test that explains
umbrella branding of private labels from a behavioral perspective. In this chapter, I
synthesize the behavioral approach of Ailawadi et al., (2008) and the empirical approach

34
taken by Erdem and Chang, (2012) in testing for the umbrella effect among private
labels.
Testing for behavioral drivers of private label penetration requires operationalizing
the performance bond theory. Wernerfelt (1988) explains that different products under a
same brand have a performance bond. Performance bonding means that consumers
assume that performance from one product sold under the brand is the same for any other
product sold under the same brand. The existence of a performance bond relies on a
consumer’s ability to transfer perceptions of quality from one product to the next within a
family of brands (Wernerfelt, 1988). I test for the performance bond explanation for
private label proliferation based on the hypothesis that consumers transfer their
perception of private label performance between categories, within brands, as a
manifestation of their trust in that brand. What is needed is a single instrument that is
able to sufficiently capture the notion of a performance bond.
I adopt a revealed-preference approach in modeling the existence of a performance
bond, which is a latent construct, by observing households’ past brand purchases. That
is, a revealed tendency to purchase the same brand, all else constant, is interpreted as the
manifestation of a performance bond. By examining past purchases, I estimate a
household’s tendency to purchase private labels across categories. This way, I assume
that each household has a particular behavior towards private labels, which must derive
from their own performance transference across categories. The result is a household
specific private label market share that reflects a performance bond between the private
label brand, and the household. I explain how this construct is derived more formally in
the next section.

35
Empirical Model
Empirical models of brand choice tend to focus on single categories, or nest
category incidence and brand choice (Lattin and Bucklin, 1989). However, multi-
category choice, which describes a consumer’s shopping basket choice, is more complex
than brand choice or a category choice because the decision typically involves factors
that are interrelated, and rarely observed.
Much of the advance in multi-category analysis is driven by data availability.
Seetharaman et al., (2005) review various models used in studying retail-choice models
and argue that the recent availability of data describing multi-category choice has enabled
more advanced methods. Because private-label penetration is only defined in terms of
households’ shopping basket composition, my model falls into this more general
literature.
In a multi-category context, there are many different types of choices. Some
researchers consider purchase incidence, or category choice, across multiple categories
using a multinomial probit model (Manchanda et al., 1999; Chib et al., 2001; and Deepak
et al., 2002), but category choice cannot address the private-label issue. Although
category choice models provide a useful point of departure, it is not appropriate in the
present study because category choices are more often planned in advance based on
consumers needs (Bucklin and Gupta, 1992; Bucklin and Lattin, 1991; Dillon and Gupta,
1996) and not on the existence of a private label or national brand. The behavioral
component of this research applies to brand choice, so purchasing multiple private labels
across categories is not likely driven by need.

36
Others consider how the choice of a single brand across fixed categories (Ainslie
and Rossi, 1998; Erdem, 1998; Seetharaman et al., 1999; Kim et al., 1999; Iyengar et al.,
2003; and Singh et al., 2005) can be used to test a univariate version of the umbrella
hypothesis. However, such a framework is unable to explain why multiple private labels
are purchased across various categories. Indeed, some of these studies consider the
effects of marketing mix variables across only a small number of categories (Ainslie and
Rossi, 1998; Iyengar et al., 2003). The price coefficient is the main focus, although
Erdem (1998) and Singh et al. (2005) introduce brand preference. The models used in
this literature range from a simple correlation model (Anislie and Rossi, 1998) to
multinomial probit or logit models (Erdem, 1998) and the categories studied are usually
closely related. In order to test the hypothesis maintained here, it is necessary to test for
umbrella branding in unrelated product categories. Indeed, if private labels are linked by
a performance bond, then studying unrelated categories would show effects other than
complementarity or substitutability. Also, in addition to marketing mix and price
coefficients, consumer behavior is an important element in private-label choice.
Models that estimate brand choice across multiple categories can be used to answer
a number of practical problems in consumer-product retailing. Bell and Lattin (1998)
consider consumers’ choice of store format – whether to patronize an everyday low price
(EDLP) or a promotion-based (HILO) store using basket size preference and category
choice. Because they use a structural model to do so, they estimate households’ brand
choice and purchase incidence, nested with store choice. Although their model is an
elegant approach to study brand and category choice in an integrated framework, their
model consists of a limited number of categories, and focuses on the basket-size effect on

37
store format choice. Private label penetration, however, refers not to store choice, but to
brand choice across categories. Mehta (2007), on the other hand, studies category and
brand choice in an integrated model that is similar in spirit to Bell and Lattin (1998).
Choices in Mehta (2007) represent basket-utility maximization that allows for interaction
across brands in different categories. However, his framework restricts choices to one
brand per category, and the errors are identically distributed across categories. These
assumptions do not allow tests of the umbrella branding effect. Similar to Mehta (2007),
Song and Chintagunta (2007) study complementarity and substitutability of brand choice
across categories. However, their model differs fundamentally from Mehta (2007)
because they add quantity to category and brand choice. They use four non-food product
categories and they found that purchase-coincidence effects across categories, (effects
arising through consumers joint purchase incidence decisions due the decreased
attractiveness of the outside option), are larger than complementarity effects. Although
their model produces results that would be useful in testing cross-category private-label
choice, the complexity of the model confines their analysis to only a few categories, not
the dozens required for a study of private-label penetration.
My model builds on this literature by considering multi-category choice in a
discrete-choice, random utility framework. The utility distribution is assumed to be
randomly distributed and more specifically, I use a random coefficient model.
Consumers are assumed to already have made their store-and-category choices, so are left
with determining what brands to include in their shopping baskets. A consumer’s
shopping basket – or least their potential shopping basket -- is assumed to consist of the

38
entire store. Based on this definition of a shopping basket, I estimate the share of private
label products purchased, or the proportion of brands in the basket that are private labels.
Umbrella branding is tested by evaluating factors affecting the cross category
purchases of private labels. A discrete-choice approach is widely used to study cross-
category correlations in purchase patterns (Erdem, 1998; Anslie et al., 2002; Hansel et al.,
2003; and Singh et al., 2005). A discrete choice model describes the decision to purchase
a brand (or an attribute), across all of the brands (or attributes) present in the product
categories studied. Consumer learning (Erdem, 1998), marketing mix elements, and
consumer brand-preferences are three examples (Singh et al., 2005). My model differs in
the sense that discrete choices between private labels and national brands are driven by a
behavioral variable is consumer-specific. Private label shares then represent the
aggregation of these discrete choices across multiple categories.
Consumers are assumed to make discrete choices among differentiated food items
in 1,023 categories across the store. Within each category, a consumer purchases the
item that provides the highest level of utility from among all suitable alternatives. I then
aggregate these decisions over all categories in a consumer’s potential shopping basket to
arrive at the share of private labels. Consumers buy one alternative at a time, the one that
has higher utility than all other choices, which describes a discrete choice or random
utility data generating process.
I further assume that the chooser has attributes that are likely to impact their
product choice. Some attributes, however, are inherently unobserved and are likely to be
correlated with observed choices. Therefore, a mixed, or random coefficient, logit is
preferred (Allenby and Rossi, 1998; Train, 2009).

39
I assume indirect utility is a linear function of product and chooser attributes. The
utility is also indexed by the time and the product category because I chose to study every
category in the store, and the consumer can choose which one he or she will consume
from. Also, depending on the product category, the number of private labels offered
compared to the number of national brands offered can vary, which can impact consumer
utility. The utility obtained by consumer h from consuming brand j in shopping trip t in
category c is expressed by:
(1)
where:
k= subscript describing a product attribute
= the price of the product
= product specific factors
= household specific factors
= brand-based heterogeneity that is unobserved by the econometrician
= household-based random variation in preferences
The error, is assumed to be independently and identically Type I Extreme
Value distributed, reflecting the random nature of consumer preferences.
The first set of factors reflects consumer attributes. First, household storage
capacity will have an impact on how much inventory households can hold, which is
likely to be relevant when considering choice within a shopping trip (Bawa and Ghosh,
1999). Second, risk aversion is likely to be important (Kahneman and Tversky, 1979).
Each household’s level of risk aversion is represented by calculating the squared
household expenditure for each trip. Squared expenditure is a useful proxy for risk

40
aversion because it is well understood that higher income households are more willing to
take risks with their purchases, so I expect this variable to have a negative parameter. As
noted by Erdem and Chang (2012), risk aversion should negatively impact private label
share.
Store-level factors are clearly important in determining private-label performance.
Although they are constant over households, variation between stores will help explain
why some private labels are sold more broadly than others. I included store-level fixed
effects in order to capture differences in private label quality, which is a general variable
that captures the inherent attractiveness of each store’s brand portfolio. Private label
quality varies among stores, but is inherently unobservable. The parameters for each
store-fixed effect are interpreted as measuring the relative quality of their store brands
compared to other stores’ brands, as each store sells the same set of national brands, and
there are no other systematic differences that can explain variation in private label share.
Store-level prices are captured by using an index of national brand and private label
prices. In order to measure the relationship between private label and national brand
prices, I calculated the price index, Pindex as a ratio of the private label price to the average
price for all national brands prices in a particular category. Because each observation is a
shopping trip, I used all the categories represented in the shopping trip to calculate the
price ratio. All category-level price ratios were then averaged to create an index of
relative prices. Price indices are necessary and used often in the literature (Ailawadi et
al., 2008; Bonfrer and Chintagunta, 2004) to explain private label penetration relative to
national brands. I expect to see a negative relationship between the price ratio and the
likelihood of purchasing private labels.

41
Store loyalty is also likely to be important (Ailawadi et al., 2008; Corstjens and Lal,
2000; Steenkamp and Dekimpe, 1997). There are many ways to capture store loyalty.
For example, the extent to which a household is a loyal to a store can be calculated by
measuring a household’s intent to continue shopping once the store is visited, their
intent to recommend the store, perceived store image, loyalty-program popularity, store-
brand penetration rate, or the frequency and number of purchases made at that store. I
define store loyalty in terms of the ratio of the number of times the household does not
switch retailers over the total number of shopping trips. That is, each purchase occasion
represents an opportunity to switch stores, so the cumulative number of non-switching
events is an accurate measure of loyalty. Store loyalty should positively impact the
private label share according to Bonfrer and Chintagunta (2004) because shoppers who
are loyal to a store have a tendency to have a positive perception of the retailer’s brand,
which implies a higher likelihood of buying the retailer’s product.
Category-level factors constitute another set of explanatory variables. The number
of categories in which private labels appear impacts private label success (Sayman et al.,
2002). The more categories a retailer offers private labels in, the greater the potential
private-label penetration rate. Also, the number of national brands and private labels in
the category reflects fundamental category-level drivers of private-label penetration.
Indeed, the more private labels are present in a category, the more consumers will be
aware of their presence. I measure this variable by calculating a ratio of the number of
private labels over the national brands in each product category. The variable PLNBratio
was calculated as a ratio of categories offering private labels to all categories per store
and per week. Because this ratio varies by store and week, I specified PLNBratio at the

42
store-and-week level across all categories in the store. It is assumed that if a private label
has never been bought by any household, then a private label does not exist for that
category. Because I use a large data set including purchases from over 3,500 households
over a two year period, this is a reasonable assumption. My hypothesis is that as the
number of private labels relative to national brands rises, the awareness of private labels
rises and consumers are more likely to purchase the private label in each category.
In addition, brand loyalty is key to explaining private label penetration (Ailawadi et
al., 2008). Brand loyalty can either be calculated through consumer surveys, capturing
attitudinal brand loyalty, or through observed repeat purchase (Aaker, 1991; Chaudhuri
and Holbrook, 2001; Keller, 1993; Oliver, 1999). Brand loyalty can also be measured
empirically as the price gap between one brand and another necessary to induce the
consumer to switch (Agrawal, 1996). However, implementing this method of measuring
loyalty first requires estimating the willingness-to-pay for each brand, and then
calculating the difference in reservation prices between each. To capture brand loyalty, I
adopt a more simple and intuitive approach and include observed repeated choices of the
same brand as an empirical measure of loyalty. I express this value as a ratio by dividing
the number of brand-repeat purchases by all repeat purchases in each product category.
Based on the findings of previous research, brand loyal consumers are hypothesized to be
less willing to purchase private labels (Ailawadi et al., 1998; Burton et al., 1998;
Garretson et al., 2002).
Controlling for each of these factors, I identify umbrella branding as a household-
specific behavioral construct. Specifically, I calculate each household’s tendency to
purchase private labels from a prior calibration period, and interpret this as a measure of

43
their behavioral proclivity toward umbrella brands, all else constant. Because I control
for other factors that may explain private label purchase, this construct reflects a latent
performance bond between the household, and each private-label brand as described by
Wernerfelt (1988). To calculate each household’s tendency to purchase private labels, I
use the first 25% of shopping trips for each household and calculate their individual
private label share by counting how many private label products were bought compared
to national brands in the product categories in which any purchase was made. The
variable UBtendency is constant across shopping trips for each household, but varies across
households. My hypothesis is that households have a perception of private label
performance, that this perception is reflected in the UBtendency variable, and that this
performance bond helps explain private label share. As such, I expect to observe a
positive correlation between tendency and private-label share.
Other variables capture observed household heterogeneity. The model includes
demographic variables that others find to be influential in explaining private label share
(Bonfrer and Chintagunta, 2004). More precisely, I include household size and
household income in my model. Household size is expected to have a positive effect on
the purchase of private labels because previous literature shows that large families tend to
purchase store branded product either for their larger packaging, or lower prices (Sudhir
and Talukdar, 2004). On the other hand, income is expected to have a negative effect
since price sensitive households are more likely to choose private labels (Hoch, 1996).
Consistent with the logit model developed above, the dependent variable, PLshare,
represents the log-volume share of the private label products chosen in a shopping trip
compared to national brand products. Shopping trips that contain more than ten items

44
each are used, to ensure that the share is meaningful (compared to a shopping trip
including only two items for example). Others define the private-label share using dollar-
share or purchase-share, and use only the categories in which private labels are offered
(Ailawadi et al., 2008). Because the objective of this study is to explain private-label
share across categories, it is important to include every product category in the store even
if they do not include private labels.
Equation (1) can be simplified by defining mean utility as so that:
(2)
where represents the mean utility of consuming product j.
The random error term reflects heterogeneity in consumer tastes. Consumers
prefer different product attributes and thus make different choices based on those
preferences. Consumers then choose the product (or brand) with the highest realization
of utility. In the present case, some consumers have a tendency to favor private labels
over national brands. For that reason, brands are categorized as either private labels (PL),
or national brands (NB). For practical purposes, this amounts to defining each brand as
either a private label, or not, so all brands chosen that are not private labels form the
outside option. Consistent with Berry et al. (1995), I define the outside option as the total
potential product purchases of a consumers shopping basket minus the amount of private
labels purchased.
Assuming the discrete brand choice is replicated throughout all c = 1,2,3,…,C
categories, I aggregate over all categories to describe the composition of the entire
shopping basket. The Type I Extreme Value assumption implies that each discrete choice

45
is represented by a logit probability expression. Aggregating the logit probabilities over
all C categories provides a model of the shopping-basket share for each brand j, or Shjt.
(3)
or, more compactly as:
(4)
The market share of the outside good is s0 and the share I am interested in, sj, is the
probability that a private label will be purchased. I then apply the linearization described
by Berry (1994) to yield a tractable model of shopping-basket share. That is, I take the
logarithm of both sides to find:
(5)
I then move the last part of this previous equation (representing the outside option) to the
left end side and expend the to show the different factors impacting the share:
(6)
This logit model presents some limitations. This model assumes the error term is
i.i.d. so it represents random variation in taste, which yields the independence of
irrelevant alternatives (IIA) property. This implies that the choice made is independent of
the utility made from any other choice. However, choosing private labels in other
product categories is rather assumed to impact the choice of a private label in the target
categories, according to my theory, which is a violation of the i.i.d. error property. The
simple logit model is thus not appropriate, so I estimate a mixed logit model that relaxes
the IIA assumption (McFadden, 1978).

46
In a mixed-logit framework, choices are assumed to be correlated through the
unobserved heterogeneity term. This correlation is captured by allowing one or more
parameters of the utility function to be random variables. In my model, I allow the
tendency to buy private labels across categories to be randomly distributed over
households. I examine the appropriateness of the mixed logit assumption by estimating a
simple logit model, and compare the goodness of fit across models.
More formally, utility is written as:
(7)
where the random term varies over households and represents the household
tendency to buy private labels across product categories, which is intended to capture the
latent umbrella branding effect. I explain the construction of this variable in more detail
below. I assume that the umbrella effect is a normally distributed parameter, or:
(8)
I compare three models in order to examine the robustness of my empirical results.
The first is a simple logit model where the independent variables are product specific,
category specific, store specific or household specific factors impacting private label
share, but where the tendency for umbrella branding is omitted. This is the base model
that reflects explanatory variables consistent with the literature. The second model is a
simple logit where the tendency variable is added. It has the same econometric structure
as it is a simple logit but the tendency variable capturing the umbrella branding
hypothesis is introduced. The third model is a mixed logit that assumes the umbrella
branding effect to be randomly distributed among sample members.

47
Category-choice is assumed to be exogenous, but brand choice in each category is
endogenous. Therefore, the dependent variable represents an aggregation of discrete
choices over all categories in the shopping basket. In aggregate data, private label prices
and some of the other category and store-level factors are likely to be endogenous, so
instrumental-variables estimation is required. However, in household data the error term
is likely to be independent of each factor that I include in the model, so endogeneity is
not likely to be a significant source of estimation bias.
Including all of the variables described above, the empirical model is written as:
(9)
The UBtendency variable is estimated as random parameter since I hypothesize that
there is likely to be substantial unobserved heterogeneity in how the performance bond is
manifested in each household’s choice of private labels relative to national brands. The
entire model is estimated using simulated maximum likelihood (Train, 2009) with 40
Halton draws in order to improve the speed of estimation.
The linear model cannot be estimated with Ordinary Least Square (OLS) because
the random parameters introduce a source of non-linearity into the estimation routine, so
simulated maximum likelihood (SML) is used (Train, 2003). Also, as Moulton (1986)
noted, OLS with large cross sectional data sets gives inflated standard errors resulting in
biased t-stats. SML is commonly used to estimate random parameter logit models (Bhat,
2001; Train, 2001, 2009).

48
Data Description
The data consists of household-panel scanner data from Nielsen Homescan (Kilts
Center1, 2012). Homescan links household characteristics (e.g., income, size, education)
to purchases on each shopping trip. The purchase data includes the store chosen, product
identification, price, any promotion activity, and coupons used. Household panel data is
required because the model requires cross-sectional variation in private label penetration
in order to identify the umbrella-branding effect.
Each observation in Homescan is a household-shopping trip taken at one of three
major retailers over the most recent two years, 2008 and 2009, and includes every food
category in dry goods, frozen products, grocery, meat and dairy. Only those shopping
trips in which at least ten items were purchased in any food category are included in the
analysis. In order to identify household-specific behaviors, I also limited the data to
households reporting at list ten shopping trips over the two-year period. These two
restrictions ensure that enough data for each household are available to analyze cross-
category purchases, and umbrella branding behavior. The final dataset comprised 62,813
observations representing the total number of shopping trips for the 3,559 households.
In general, the Homescan data describes households that are relatively similar to
the general U.S. population. In this particular sample subset, household size is similar to
the national average at 2.6, but the median income is higher comparing to the national
median at $51,371 (US census, 2012). This difference can be explained by the fact that
households in the Homescan data represent consumers who can afford to shop at the
grocery store.
1 The author thanks the Kilts Center of the Booth School of Business at the University or Chicago for
making the Homescan data available.

49
Table 2 presents demographic and socio-economic data for the sample, as well as
price and share variables for each retailer. The data in this table reveals that there are
substantial differences among retailers on each of these factors. Table 2 shows that
consumers who shop at Store 3 have the highest mean income and the largest family size.
Store 3 shoppers also have the highest level of risk aversion and are the most store-loyal.
However, they also have the lowest brand loyalty. Based on the hypotheses made earlier,
large family size, high store loyalty and low brand loyalty are positive indicators for
private label purchases, but high income and high risk aversion are expected to be
negatively correlated. If shoppers trust the store name, and the private-label offering is of
a high quality, this environment should be favorable to private label umbrella branding.
Store 1, on the other hand, is frequented by patrons with the lowest income, risk aversion,
family size, and store loyalty. Store 1 likely benefits from value shoppers attracted to
lower-priced private labels. The low risk aversion of shoppers of Store 1 should also
suggest they will sell a high share of private labels. However, other demographics for
Store 1, namely low household size, low store loyalty and high brand loyalty, are not
supportive of a strong private label strategy.
Due to the apparent difference in private label strategies, and patron
demographics, the sample stores differ widely in terms of PL penetration. Store 3
displays the highest prices, but the lowest number of private labels compared to national
brands, while consumers who shop at Store 3 have the lowest private label share. It
appears from Table 2 that Store 3 does not seem to be a favorable environment for private
label umbrella branding. On the contrary, Store 1 has the lowest prices, higher private
label share, and a higher ratio of the number of private labels compared to the number of

50
national brands. It seems that the low income and low risk aversion of Store 1 shoppers
have then a bigger impact than the other factors on private label choice. Formal
econometric estimation is necessary, however, to control for these other factors and test
the umbrella branding hypothesis.
Table 22
Means of store data and demographics
Store Household
Income ($)
Household
Size
Store
loyalty
Brand
loyalty
Risk
aversion
Price
Index
PL/NB
ratio
PL
share
1 62,918 2.5 0.886 0.777 1.106 77.25% 18.44% 33.06%
2 77,198 2.6 0.915 0.775 1.208 85.46% 11.79% 26.81%
3 82,395 3.1 0.939 0.699 1.739 86.99% 8.54% 16.99%
The data in that table also reveals a considerable diversity in store-format choice.
Because different retailers have different policies regarding private label strategy,
including a binary variable capturing store choice, or store fixed-effects as described
above is clearly necessary. Finally, based on that table only, it seems that the highest
private label share is found where the household income is the lowest, but also the
household size, the store loyalty, the risk aversion and the price index are the lowest
while the brand loyalty and the ratio of private labels to national brands in the store are
the highest.
2 Income represents the mean income of the household (household head and other active members
counted). The size is the average number of person, including the household head. The store loyalty and
brand loyalty are the ratio of the store choice and brand choice over all trip and purchase occasions. The
risk aversion factor is represented by an index linked to household expenditure. Price index reflects the
ratio of private labels prices versus national brands prices if only private labels were chose in a basket
compared to only national brands. The share is expressed by the number of private labels chosen over the
total number o f items purchased. The ratio PL NB describes the number of private labels over the number
of national brands, aggregated per category and then per store in this case.

51
Private labels are present in many shopping baskets. Figure 3 shows the
frequency with which private labels are purchased per shopping trip. Although there are
some 7% of shopping trips where consumers buy no private labels, it is very likely that
consumers will choose to purchase at least one, and often several private labels. In fact,
3 or 4 private labels are purchased on 24% of shopping trips, and 35% of the time 5 to
10 private labels are purchased Clearly, private label purchase occurs across multiple
categories, but it remains to determine why.
Figure 3. Frequency of private labels purchased per shopping trip.
My primary concern is the tendency of households to buy private labels across
categories. Figure 4 shows the distribution of tendency values across households. The
data in this figure is interpreted as follows: About 28% of households from the sample
(N=3,559) have a 30% chance of choosing private label in any category.

52
Figure 4. Households’ tendency to purchase private labels across product categories.
As shown on Figure 4, most households are in the 20 - 30% range of the tendency
variable. This is consistent with the overall private-label market share in the U.S. (23%
in 2011, Symphony IRI) so lends some validity to the accuracy of this construct. The
tendency variable also appears to be a good predictor for the share as illustrated by the
relationship between those two variables on Figure 5 below.
Figure 5. Households’ distribution over the main constructs
0.0000
0.0500
0.1000
0.1500
0.2000
0.2500
0.3000
0.1 0.2 0.3 0.4 0.5 0.6 > 0.6
-0.0500
0.0000
0.0500
0.1000
0.1500
0.2000
0.2500
0.3000
0.3500
0.0000 0.0500 0.1000 0.1500 0.2000 0.2500 0.3000
% households
PL share
UB tendency
UB tendency

53
Overall, those preliminary results show diversity among stores in terms of their
private label strategies, and outcomes, but also in households’ behavior. Their
demographics, the number of private labels bought, and the scope of tendency for
umbrella branding show substantial variation and, hence, opportunity to identify
significant relationships among them. In the next section, I present more formal
econometric tests of the umbrella branding hypotheses that control for each of these
household and store-specific factors.
Results
In order to test the importance of the behavioral variable UBtendency, I estimate three
different regression models. The first one does not include the tendency construct, while
the second one includes UB, and the third does so as a random parameter. In the first two
models, the specification also includes a constant term to account for the baseline
tendency of households to purchase private labels. Model 1 represents the base model
while Model 2 and Model 3 represent tests of the umbrella branding hypothesis. In order
to test the appropriateness of the random coefficient specification for the UB parameter, I
used a t-test for the UB parameter and a Likelihood ratio test to compare the models.
Table 3 shows the results of the different models but only the preferred specification is
interpreted.

54
Table 3
Models of Panel Data
MODEL 13 MODEL 2 MODEL 3
PL Share Coefficient t- ratio Coefficient t- ratio Coefficient t- ratio
Constant 0.0129 1.56 -0.0308*** -4.34 0.0252*** 4.43
UB 0.6959*** 148.54
UB (random) 0.6570*** 173.90
Std. Dev. UB
(random) 0.1220*** 662.56
Risk -0.0014*** -8.62 -0.0008*** -5.88 -0.0006*** -4.97
Income -0.0403*** -29.49 -0.0117*** -9.84 -0.0125*** -13.40
Size 0.0048*** 10.24 0.0022*** 5.45 0.0033*** 10.16
Store1 0.1596*** 34.07 0.0399*** 9.72 0.0548*** 16.29
Store2 0.0930*** 44.36 0.0331*** 17.92 0.0533*** 36.28
Pindex 0.0112*** 2.38 0.0107*** 2.47 0.0122*** 3.53
Sloyalty 0.0834*** 21.75 0.0253*** 7.63 0.0239*** 8.64
Bloyalty 0.1388*** 20.95 0.0394*** 6.87 -0.0523*** -11.20
PLNBratio -0.0986*** -2.32 0.2187*** 5.98 0.2775*** 9.39
LLF 27876 37332 40477
N=62,813, Note: ***, **, * => Significance at 1%, 5%, 10% level
The t-test for the UB variable between Model 2 and Model 3 is as follows:
(10)
The calculated t-value is greater than the t-statistic at 5% (1.96), so the null hypothesis is
rejected and I conclude that the UB parameters are statistically different from each other.
In addition, the likelihood ratio between the two models including the behavioral variable
is:
(11)
3 Model 1 is a simple logit with factors from the literature. Model 2 is also a simple logit but in addition to
the factors from the previous model I add the UB tendency variable. Model 3 is a random parameter logit
model where UB tendency varies among households.

55
Compared to the Chi-square value at 5% (3.84), the LR value is large so the null
hypothesis is rejected; the two models are statistically different. Model 3 thus is the
preferred model.
I focus my interpretation below on the random coefficient specification. Based
on the results reported in Table 3, all of Model 3 explanatory variables are statistically
significant. Each household attribute has a significant impact on PL share. The income
estimate is negative indicating that households with higher income have a preference for
national brands, as expected. The fact that the income variable has a significant and
negative impact on the share of private labels is consistent with my prior expectations
that wealthier consumers do not buy private labels. Indeed, consumers who can afford
national brands might not want to take the risk associated with the purchase of private
labels. National brands are still more expensive on average and convey the image of trust
and quality stability in a consumer’s mind. This also explains why risk-averse consumers
appear to be less willing to purchase private labels. Indeed, risk aversion is significant
and negative indicating that consumers still associate a certain level of risk with private
labels and as the risk aversion increases, share of products that are private labels
decreases. Household size has a positive effect, indicating that larger families have a
higher likelihood of purchasing private labels. Store loyalty, on the other hand, has a
positive effect, so consumers who are attached to a particular store also purchase their
store brands. This result is again, intuitive. Brand loyalty reduces the share of private
labels, perhaps because national brands inspire greater loyalty than do store brands.
Those estimates are all consistent with results reported elsewhere in the literature.
Importantly, the brand loyalty estimate appears positive in Model 1 and 2 against

56
expectations and changes sign in the preferred model, which highlights the bias inherent
in models that do not account for unobserved household heterogeneity. The number of
private labels offered across all product categories has a significant and positive effect on
the private label share, which is consistent with my expectations. Indeed based on the
literature, having more private labels in the store compared to the number of national
brands should increase their awareness in the consumer’s mind and should translate to
more private label purchases (Sayman et al., 2002). Illustrating the extent of bias in
Model 1 that omits the UB variable, the sign of the PLNB ratio is inconsistent with my
expectations in that model.
Store-level fixed effects have the expected effect on private label share. Store 1,
which has lower overall prices and a higher private label share in calibration, has a
significant and positive effect. This result reflects the likelihood that Store 1 has a
successful store-brand strategy relative to the other retailers. Based on their lower income
clientele, and less risk averse customers, the retailer is apparently able to offer a line of
private labels that suits their shoppers and takes advantage of the umbrella branding
effect at the same time. Based also on the fact that store loyalty is high for Store 1, it
would seem that consumers trust the store name. By offering a large number of private
labels across categories at an attractive price for these value seeking shoppers, this
retailer has successfully implemented their private label policy.
Prices are clearly important. The results in Table 3 show that the price index
variable has a significant and positive effect. As it represents the ratio of private label
prices compared to national brands, it seems that the closer private label prices are to
national brand prices, the higher is private-label share, contrary to expectations. This

57
variable reflects a more fundamental aspect of private label strategy. Steiner (2004) as
well as Bontemps et al., (2005) argue that private labels are tools for price discriminating
between national brands and private labels, so if private labels are positioned closely to
national brands, I would expect more intense competition between the two. At the same
time, however, more intense competition between national brands and private labels that
closely mimic their attributes is likely to reflect a Hotelling-competition dynamic
(Hotelling, 1929). Namely, if retailers closely imitate national brands in both price and
attribute space, then they are more likely to split the market in half than if a
differentiated, or lower-price private label strategy were to be adopted.
Most important to the goals of this chapter, the UB variable appears to be both
statistically and economically significant in Model 3, which provides empirical support
for the Performance Bond theory. Because I control for all other factors available in the
Homescan data that may explain private labels penetration, I interpret this finding as
indicating the presence of a performance bond effect. In other words, even after
controlling for all other explanations for household-level private label penetration, there
appears to be a latent tie between households and private labels across several categories.
This conclusion is supported by the significance of the scale parameter for the random
umbrella branding effect. Because this parameter measures the importance of
unobserved heterogeneity, it essentially picks up all of the unexplained variation in PL
share among households. Indeed, this shows that households have a behavioral tendency
to purchase private labels and that this tendency is particular to each one of them. In
explaining private label market share, the umbrella branding tendency of the shoppers is
thus a key element.

58
The implications of these findings are likely to be more general than the specific
results reported above. First, recommendations to the retailers aiming at increasing their
private labels share would be the following. Increasing the number of private labels
across categories, matching private labels prices to national brands prices and developing
marketing strategies to increase store loyalty are the three main factors to focus on. This
can be done by extending the private labels line and ensuring that the quality gap with the
national brands is as small as possible, and engaged promotion such as advertising.
Communicating about the quality of their store brands would also be beneficial for
retailers. Store displays and taste tests are examples of such strategies. Second, from the
consumer perspective, evidence of umbrella branding shows that shoppers feel
comfortable buying a known brand across categories. National brands have been able to
capitalize on their brand name reputation across close categories (toothbrushes and
toothpaste for example), but with the presence of private labels across the store in a
significant number of categories, there is a real opportunity for private labels. Consumers
can develop a trust in the store brand and diminish their perceived risk by choosing the
same brand across categories. This could result in easier shopping choices for the
consumers if they choose to be loyal to the store brand. In each category they would not
have a whole new consideration set since the store brand would be their consistent brand,
like a familiar marker. Last, in light of those implications, national brand manufacturers
face a challenge. If the private label share continues to increase, they might need to
rethink their product line and offer differentiated products, in attributes or prices.
Innovation for new product development is still the national manufacturers’ advantage
since most private labels offer similar products to existing ones.

59
Conclusion
Private labels continue to extend their reach throughout most U.S. supermarkets. In this
chapter I offer the hypothesis that, in addition to the usual store, category, and consumer-
based explanations, consumers tend to transfer their expectations of private label
performance across grocery categories, in an effect akin to a performance bond, or
extension of trust in one brand across several others.
Using an econometric model of household-level private label market share, I test
this theory by controlling for the other factors likely to explain private label purchase and
including a latent construct intended to capture households’ preferences for store brands.
I find that this private-label tendency variable has a strong and statistically-significant
impact on the share of private labels in each shopping cart. Moreover, this effect shows
substantial and significant heterogeneity across households so does indeed reflect a
behavioral influence that is not captured by other measureable variables. The results
suggest that if households transfer their behavior towards one private label among other
private labels, retailers can potentially benefit from offering private labels across as many
product categories as possible as long as product performance can be maintained.
There are many implications of these findings, both for retail practice and the
existing knowledge in this field. Food retailers can capitalize on that finding by
developing their private labels lines across categories in order to tap into the umbrella
branding tendency. However, this recommendation is tempered by the realization that if
private labels in different categories have a performance bond, the extensions need to be
at the level of performance of the existing products. In other words, the performance
bond theory is likely to cut both ways – if good performance transfers across categories,

60
so will poor performance too. In addition, this result encourages retailers to invest in
their private labels. Consumers do have a specific behavior towards private labels and
the retailer should focus on pleasing their consumers with their private label lines so they
can extend their perception across categories. Consumers are thus inclined to have a
reduced risk while shopping across product categories by trusting the private labels line
of products. The retailers can capitalize on that behavior by displaying favorably their
private labels line in physical stores or online. If consumers are used to the store brand
level of performance, shopping through retailers’ website would become easier. Further
studies would be necessary to affirm that implication.
My findings contribute to the broader literature on private label marketing in that
a behavioral approach to explaining private label share has not been implemented to the
extent that I have here. Whereas others have tested the umbrella branding hypothesis in
both private labels and national brands, none have done so using a construct that directly
measures the extent of a performance bond between consumers and their private label
brands.
One limitation of this research is that I use secondary or revealed-preference data.
Revealed preference data always suffers from the weakness that purchase motivations are
never explicit, and must be inferred from observed behavior. Therefore, in order to test
this hypothesis more directly, in the next chapter I present a complementary analysis
based on primary choice data.

61
CHAPTER 4
AN EXPERIMENTAL ANALYSIS OF
PRIVATE LABEL UMBRELLA BRANDING
In the previous chapter, I test for evidence of cross category effects that have the potential
to be associated with the behavioral mechanisms underlying umbrella branding. My
empirical evidence, based on secondary data, suggests that consumers who buy private
labels in one product category are more likely to buy private labels in other categories.
Inference from revealed preference data, even data gathered at the household level,
however, is only indirect. Because umbrella branding is hypothesized to derive from
behavioral mechanisms that operate at the consumer-level, experimental data may
provide useful, corroborating evidence. Indeed, if consumers who perceive private labels
favorably purchase them in multiple categories, and if their purchase behavior is
moderated by a perception that private labels offer superior quality, then an experiment
will provide a more direct test of the performance bond theory of umbrella branding.
Through the experiment, I can also vary private label offerings to include a generic or a
premium product in the same category in order to identify the effect of quality-tier
strategies by the retailer. The objective of this chapter, therefore, is to evaluate
consumers’ perceptions of private labels offered by the same retailer across product
categories, and determine how their perceptions influence the willingness to purchase the
same private label brand in multiple categories. Controlling for price and quality tier
effects with experimental data, I test whether cross-category spillover, or umbrella
effects, are based on some notion of transference of quality expectations within brands.

62
Secondary data analyses are unable to control for many behavioral factors, such
as a consumer’s perception of the image projected by a brand, or product attributes such
as the quality tier, that may be important in the selection of private labels across multiple
categories (Semeijn et al., 2004). While designing a survey provides such flexibility,
estimating willingness to pay that way can be biased if it remains hypothetical (Hensher,
2010). Thus, I chose to use an incentive compatible framework to accurately reflect
consumers’ real-life choices. In this context, incentive compatibility means that
subjects had an incentive to report their true willingness to pay. Therefore, in this
chapter, I develop an incentive compatible choice experiment in which I test for umbrella
effects in a controlled, experimental environment.
I test the theory that perceptions of quality transfer among like-branded products
in different categories, or the performance bond theory of umbrella branding advanced in
Chapter 2. A number of hypotheses are tested that are relevant to this objective. First, I
test whether the evidence of cross-category purchase behavior found in the previous
chapter holds in primary data as it does in the secondary data used in that chapter. Cross-
category purchase behavior, however, is a necessary, but not sufficient, condition for the
identification of umbrella branding. Cross-category purchases can be driven instead by
price effects, preference heterogeneity, or simple brand preference. Rather, if consumers
perceive private label brands in different categories are fundamentally the same quality,
and purchase across categories, then I will have evidence in support of the performance
bond theory of umbrella branding. My second hypothesis is that consumers perceive
distinctions between different categories, or quality-tiers, of private labels. The third
hypothesis is that the nature of the category determines the extent of umbrella branding.

63
Logically, if products are inherently complementary in use (e.g. milk and cereal) then
there is greater scope for quality transference across categories, and stronger umbrella
effects.
I test these hypotheses using primary data gathered through a choice based
conjoint (CBC, Louviere, 1988) laboratory experiment conducted using a sample of
subjects from the general population of grocery shoppers in a large Southwestern U.S.
metropolitan area. In the experiment, I ask shoppers to risk their own money in making
decisions regarding the purchase of milk, cereal, and ice cream brands as part of a
simulated “shopping basket”. By choosing from among private labels and national
brands in each category, subjects reveal whether they value the implicit performance
bond offered by retailers as a reason for purchasing private labels across multiple
categories. To this end, I introduce measures of general attitudes towards private labels
in order to isolate the behavioral component of my theory.
This chapter is organized as follows: First, I detail the experiment and how it was
conducted. Then, I describe the empirical framework that I use and how I intend to test
my core hypotheses in the context of an econometric model of experimental choice.
The results are discussed in the third section, both in summary form and in more detail
from the econometric model. The final section concludes, and offers several implications
for retailing strategy more generally.
Experimental Design and Description
Others test for evidence of cross category effects that are driven by other behaviors that
underlie umbrella branding. For example, Erdem and Chang (2012) test for cross-
category learning effects, while Richards et al. (2014), test for complementarity driven by

64
unobserved preferences for private labels. This evidence, based on secondary data,
suggests that consumers who buy private labels in one category are more likely to buy
private labels in other categories. Secondary data, however, does not inform of any
behavioral factors that might be at play when consumers shop. If consumers purchase
private labels due to the presence of an implicit performance bond, then evidence linking
specific attitudes regarding the quality, reliability, and consistency of private labels to
purchase behaviors is required.
If umbrella branding derives from behavioral mechanisms that operate at the
consumer-level, then experimental data is necessary. Indeed, if consumers who perceive
private labels favorably purchase them in multiple categories, and if their purchase
behavior is moderated by a perception that private labels offer superior quality, then
experimental data provides a more direct test of the performance bond theory of umbrella
branding. Secondary data analyses are unable to control for many behavioral factors,
such as a consumer’s perception of the image projected by a brand, or product attributes
such as the quality tier, that may be important in the selection of private labels across
multiple categories (Semeijn et al., 2004).
In my experiment, I control for these behavioral factors by asking a number of
questions that uncover subjects’ underlying motivations for purchasing private labels.
Specifically, the behavioral questions I use in the survey instrument ask consumers to rate
statements about their perception of private label quality, the level of performance they
expect from private labels and the level of trust they have in private labels. Those items
were rated on a Likert type scale and used to develop the performance transference
variable. Through the experiment, I also vary the range of private label offerings,

65
including a generic or a premium product in the same category in order to identify any
variety or “tier” effects that retailers commonly use to position store brands.
The experimental framework is incentive compatible in order to accurately
capture choices that consumers would make in the “real world”. In this context,
incentive compatibility means that subjects are provided the opportunity to make real
money, so have an incentive to behave as they would in a store, and report their true
willingness to pay.
The experiment is designed as a choice based conjoint (CBC, Louviere, 1988)
laboratory experiment, and is conducted using a sample of subjects from the general
population of grocery shoppers in a large Southwestern metropolitan area. The
laboratory experiment was conducted using 200 participants recruited through the social
website Craigslist. Participants were offered up to $40 to participate (depending on
whether they choose to buy goods as part of the experiment). Subjects needed to be at
least 18 years of age, be the primary grocery shopper at their household and principally
shop at Fry’s, Safeway, or Target. Focusing on these shoppers is necessary because these
chains are the only supermarkets in the area that offer multiple-tier store brand strategies
in the ice cream category. This also ensures variety in the store format and store policy
which would strengthen my results. Once in the laboratory, participants were given the
option of keeping their $40 and leaving the experiment, or using some of their
endowment to choose from a set of products in three different categories. Within each
category, participants were free to choose from national brands and private label brands
at different price levels or choose to purchase nothing (See the survey instrument in
Appendix A).

66
I ask shoppers to risk their own money in making decisions regarding the
purchase of milk, cereal, and ice cream brands as part of a simulated “shopping
basket.” By choosing from among private labels and national brands in each category,
subjects reveal whether they value the implicit performance bond offered by retailers as a
reason for purchasing private labels across multiple categories. To this end, I introduce
measures of general attitudes towards private labels in order to isolate the behavioral
component of my theory.
Milk, ice cream and breakfast cereal were chosen as product categories because
private labels vary in prominence among them. While private label penetration is
typically over 90% in the milk category, it is more often below 20% in the cereal
category. They also come from different departments within the grocery store (frozen,
dairy, dry goods) which is important in identifying umbrella branding effects independent
from the effect of use-complementarity between some product-pairs (such as
toothbrushes and toothpaste). In general, the choice of these three product categories is
appropriate to study umbrella branding as quality perceptions are likely to transfer among
products in categories that have strong brands that are important to each store’s private
label strategy, and in which quality is an important choice variable. Within the ice cream
category, I included three brands: One national brand and two private labels, one of
which is a premium private label and the other a “value” or low-priced brand. For this
category, I then assess whether variation in choice probability is related to the tier of the
private label. For the cereal category, I allow the choice of one national brand or one
private label. Similarly, there are two choices for milk, one national brand and one
private label. Each one of these brands is assigned three different price levels. Because

67
of the different price levels, it is important to note that some of the choice involves
options where the private label is as expensive as or even more expensive than the
national brand. This ensures that preference is not only based on a lower price criterion.
Studies use all kind of different discounts for the price levels (Della Bitta et al., 1981;
Dodds et al., 1991; Grewal et al., 1998); I chose -25% and -50%:

68
Table 4
Product brands and price levels
SAFEWAY Shelf price -25% -50%
Kellogg’s Cereal 4.99 3.74 2.5
Safeway Cereal 3.29 2.47 1.65
Horizon Milk 4.79 3.59 2.4
O'organics Milk 2.99 2.24 1.5
Breyers Ice cream 4.39 3.29 2.2
Safeway Ice cream 2.33 1.75 1.17
Lucerne Ice cream 2.75 2.06 1.38
FRY'S
Kroger Cereal 2.49 1.87 1.25
Kellogg’s Cereal 4.39 3.29 2.2
Fry's Milk 2.69 2.02 1.35
Shamrock Milk 3.49 2.62 1.75
Breyers Ice cream 5.99 4.49 2.99
Kroger Ice cream 2.67 2 1.34
Private Selection Ice cream 5.49 4.12 2.75
TARGET
Market Pantry Cereal 2.69 2.02 1.35
Kellogg’s Cereal 3.14 2.35 1.57
Milk
Market Pantry 2.59 1.94 1.29
Shamrock 4.09 3.07 2.05
Breyers Ice cream 3.69 2.77 1.85
Market Pantry Ice cream 2.99 2.24 1.49
Archer Farms Ice cream 3.99 2.99 1.99
The experimental design used is a fully orthogonal, fractional factorial in which
price levels and national brand / private label attributes were varied such that the main

69
effects of interest are identified (see Table 1). The 36 bundles were randomly grouped by
three to create choice sets so that the participants faced 12 bundle choices. After each
subject made all his or her choices, one of the 36 bundles was chosen at random to serve
as the “winning” bundle. If a subject chose this bundle in the CBC procedure, he or she
is to receive the chosen products and gave up an amount of cash equal to the sum of the
prices of the three products. This mechanism, a variation on the Becker, DeGroot,
Marshack (BDM) mechanism (Becker al., 1967), is well-understood to be incentive
compatible. The BDM mechanism is originally used in an auction context. Participants
formulate bids, and depending on the computer’s randomly picked price value, the
participants receive the product or not. This mechanism has been used in behavioral
economics to evaluate product choice and willingness to pay (Lusk et al., 2004). In this
particular context, consumers who choose to purchase the auction bundle were given
store gift cards for the products they purchase, and cash for the balance of their account.
Once the experiment was completed, each subject completed a survey in which they
recorded their demographic data and general questions regarding their shopping behavior,
store loyalty, and attitudes toward private labels. The experiment was designed and
implemented using Qualtrics online experimentation software.
Although the sample used fit a certain number of criteria explained before (chosen
stores and categories shoppers), I did not screen the participants on their demographic
variables. The final sample was comprised of 57% male shoppers. Participants range in
age from 18 to 69, with a mean of 33 years old. About half of the participants have never
been married. Their income distribution is represented below.

70
Figure 6. Sample income distribution.
The income distribution of the sample show a large part of lower income compared to the
state average of that area. This, in addition to the marital status and younger average age
might be due to the fact that 21% of the participants were students. The location of the
experiment on a college campus is probably a factor influencing the nature of the sample.
Empirical Model
The mechanism that causes umbrella branding that I propose differs from the previous
literature because it derives from consumers’ inherent risk aversion and search for some
guarantee of performance. Rather than learning about the existence and quality of private
labels in other categories as in Erdem and Chang (2012), the behavioral mechanism relies
instead on the transfer of value or performance perception among products of the same
brand (Wernerfelt, 1988). The image of private labels is linked to past experiences and
expectations. Umbrella branding is important because past experience with one private
label creates an expectation of similar value for the purchase of the next private label. In
the past, the stimuli revolved around an image that store brands were “cheap products,”
but recent trends show that this might have changed. More than simply learning about a

71
particular private label, the performance transference theory is more general in that it
implies that consumers consider a product based on past experiences, related products in
the same brand, and the related store attached to the brand.
Umbrella branding implies that consumers who buy a private label in one
category will have a higher probability of purchasing a private label in another category
(Erdem and Chang, 2012; Richards et al., 2014). Correlated purchasing patterns,
however, can be consistent with many alternative explanations for umbrella branding.
Therefore, the empirical challenge in testing the performance bond theory of umbrella
branding is identifying empirical relationships among brands that are unique to the
Performance Bond theory. Because the existence of a performance bond effect relies on
consumers’ ability to transfer perceptions of quality from one product to the next within a
family of brands, my model tests for inter-brand correlation in latent quality.
I use the experimental data described above to test the theory that perceptions of
quality transfer among like-branded products in different categories, or the performance
bond theory of umbrella branding. When investigating the reasons why consumers
purchase products from different categories, a multi-category demand model is required.
Traditional discrete-choice models are not appropriate, because the data generating
process underlying multi-category decision making is not independently and identically
distributed (i.i.d.) when it comes to alternatives (Bell and Lattin, 1998; Ansari and Gupta,
2004; Metha, 2006; Song and Chintagunta; 2007). In my model the errors are
independent over the choices, thus I take another approach from these authors: I develop
a basket-utility maximization framework wherein the object of a consumer’s choice is a
bundle of goods from a fixed set of categories, rather than a set of goods from categories
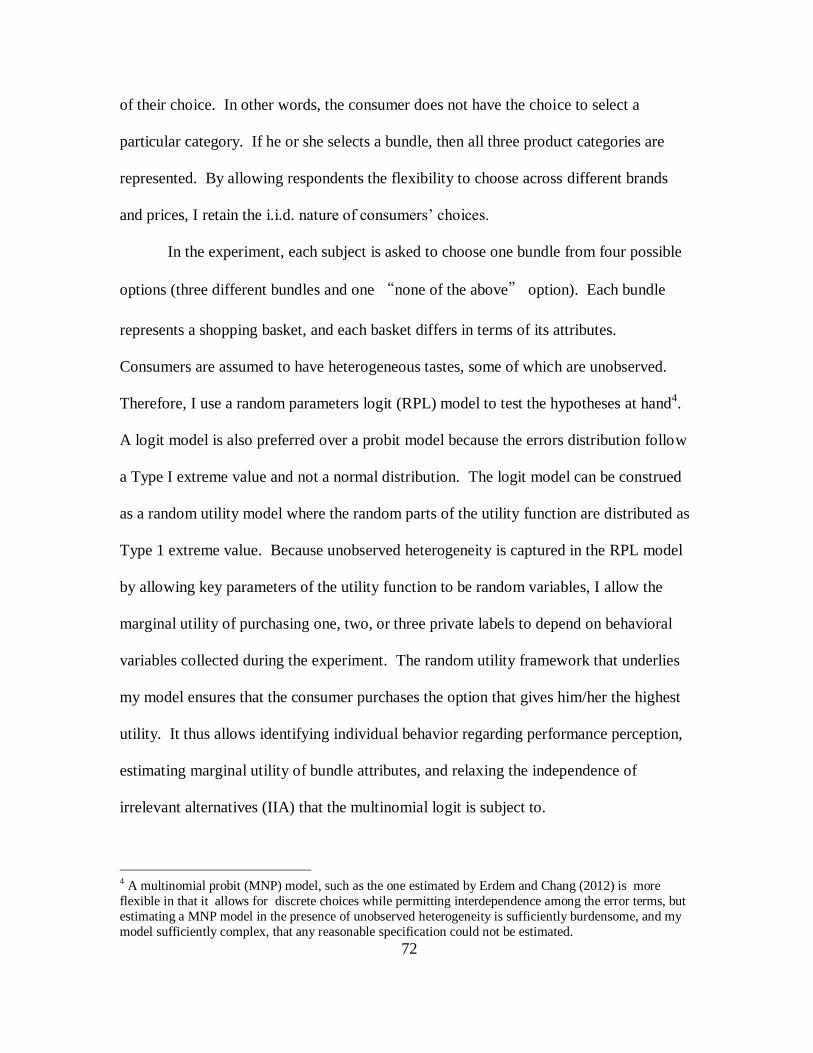
72
of their choice. In other words, the consumer does not have the choice to select a
particular category. If he or she selects a bundle, then all three product categories are
represented. By allowing respondents the flexibility to choose across different brands
and prices, I retain the i.i.d. nature of consumers’ choices.
In the experiment, each subject is asked to choose one bundle from four possible
options (three different bundles and one “none of the above” option). Each bundle
represents a shopping basket, and each basket differs in terms of its attributes.
Consumers are assumed to have heterogeneous tastes, some of which are unobserved.
Therefore, I use a random parameters logit (RPL) model to test the hypotheses at hand4.
A logit model is also preferred over a probit model because the errors distribution follow
a Type I extreme value and not a normal distribution. The logit model can be construed
as a random utility model where the random parts of the utility function are distributed as
Type 1 extreme value. Because unobserved heterogeneity is captured in the RPL model
by allowing key parameters of the utility function to be random variables, I allow the
marginal utility of purchasing one, two, or three private labels to depend on behavioral
variables collected during the experiment. The random utility framework that underlies
my model ensures that the consumer purchases the option that gives him/her the highest
utility. It thus allows identifying individual behavior regarding performance perception,
estimating marginal utility of bundle attributes, and relaxing the independence of
irrelevant alternatives (IIA) that the multinomial logit is subject to.
4 A multinomial probit (MNP) model, such as the one estimated by Erdem and Chang (2012) is more
flexible in that it allows for discrete choices while permitting interdependence among the error terms, but
estimating a MNP model in the presence of unobserved heterogeneity is sufficiently burdensome, and my
model sufficiently complex, that any reasonable specification could not be estimated.

73
Recall that umbrella branding, in general, implies that purchases in one category
increase the probability of purchasing in another category. I test for umbrella effects by
including a set of binary indicator variables that equal 1 when one, two, or three private
label products are included in the bundle. If the presence of a private label increases the
probability of purchase, then I interpret this as evidence of umbrella effects. If a subject
chooses more than one private label, then I expect the performance bond effect to be
stronger. Implicitly, therefore, my empirical model allows for the performance bond
hypothesis to have a non-linear effect on purchase outcomes.
Whether umbrella branding implies the existence of a performance bond between
the retailer and consumer, however, depends on the notion that the cross-category effect
is moderated by a perception of quality transference across categories. I test for this
effect by considering the effect of each subject’s perception of the inherent quality of
private labels on the cross-category purchase of private labels. If the coefficient on this
variable is significant, then the model provides evidence not only of umbrella branding,
but of the performance bond mechanism hypothesized in the theory.
The other variables in the model include bundle characteristics: The total price of
the bundle, the number of private labels in the bundle, the presence of a premium private
label, and the product category in which a private label is present. For consumer
characteristics, the theory aims at studying consumers and their performance perception
across categories, not demographics. Thus, the performance transference is the only
consumer specific variable used. The bundle variables will indicate which private labels
(what category/premium or not), has an effect on the bundle choice while the consumer
variable is entered as the random parameter.

74
Given these considerations, the form of the estimated utility function is expressed
as:
where:
= 1 for one private label in the chosen bundle
= 1 for two private labels in the chosen bundle
= 1 for three private labels in the chosen bundle
= 1 for a premium private label in the chosen bundle
= 1 for a private label ice cream in the chosen bundle
= 1 for a private label cereal in the chosen bundle
= 1 for a private label milk in the chosen bundle
is the i.i.d. error term
The parameters are fixed while the and are allowed to vary randomly over subjects.
I allow each of the gamma parameters to vary with each household’s perception of
private label performance (Perf) in order to test the primary hypothesis of the paper.
Intuitively, if the tendency to purchase one or more private labels (PL) depends on
performance perception in a significant way, then there must be some form of
performance bond between the subject and the retailers’ brands. Thus, each random
parameter gamma test the behavioral hypothesis and varies according to a specific
household and the number of private labels found in a product bundle. The parameter
is then defined as a mean value based on the number of private labels, plus the effect

75
of the performance transference, plus a normalized standard deviation. Formally, the
random parameter functions are written as:
(13)
(14)
If each of the tau ( parameters is significant and positive, then the notion that
consumers transfer their perception across categories is supported. In terms of the
predictions of the model, a positive effect of performance perception suggests that the
performance bond theory is the reason why households choose bundles containing private
labels.
Estimation must account for the fact that the functional form for the probability of
choosing each bundle does not have a closed form due to the fact that I include three
random parameters. Therefore, in estimating this model, I use simulated maximum
likelihood (SML) (Train, 2003) with 40 Halton draws in order to expedite estimation.
Results
In this section, I present the results obtained from estimating the RPL bundle-choice
model in (12) above. I first present the results from specification tests to establish the
validity of the maintained model, and then interpret the coefficient estimates from the
preferred specification. I draw implications from this model for both the presence of
umbrella branding, and the relevance of the Performance Bond theory of umbrella
branding.
In the table below, I compare the three models estimated. Model 1 represented a
fixed parameter model with the bundle variables only, while Model 2 consists of a mixed
logit model with price as only random parameter. Model 3 is the most comprehensive

76
specification with random parameters on each of the price, and performance functions.
I compare the goodness of fit across model specifications using likelihood ratio (LR)
tests. Based on this criterion, I find that Model 3 is preferred.
(15)
The LR is greater than the Chi-square statistic value at 5% (3.84), so the two models are
judged significantly different from one another.
Table 5
Models estimation from experimental data
MODEL 15 MODEL 2 MODEL 3
Coefficient t- ratio Coefficient t- ratio Coefficient t- ratio
Price -0.0037*** -15.25
PL1 1.0288*** 9.83 1.5432*** 13.12
PL2 1.9231*** 13.90 2.9728*** 17.06
PL3 3.5114*** 22.98 5.0338*** 23.80
Price
(random) -0.0051*** -15.09 -0.0050 *** -11.05
PL1(random) 1.8826*** 9.13
PL2(random) 3.5451*** 14.09
PL3(random) 5.5299*** 15.55
Pm -1.4382*** -12.70 -2.0022*** -15.81 -2.11325*** -16.16
Ice -1.6107*** -12.84 -2.1302*** -15.30 -2.24621*** -15.50
Cer -1.8454*** -19.59 -2.4246*** -22.02 -2.5346*** -22.22
Mlk -0.6499*** -7.86 -1.1816*** -11.99 -1.2325*** -12.15
Price*Perf 0.0004 1.10
PL1*Perf 0.1066 0.48
PL2*Perf 0.0397 0.18
PL3*Perf 0.6946** 2.16
LLF -2450 -2248 -2226
N=2076, Note: ***, **, * => Significance at 1%, 5%, 10% level
5 Model 1 is the base model with fixed parameters. Model 2 has the price coefficient as a random
parameter. Model 3 has a price and the performance transference parameters as random.

77
I focus my interpretation of the results on Model 3. Several inferences can be made from
the results reported in Table 5. First, note that price is defined as the total price of all
products in the bundle. Therefore, the more expensive the bundle, the less likely it is to
be chosen since the price coefficient is negative. This effect is expected, and is consistent
with prior expectations. Note, however, that the interaction between price and
performance has a positive effect, although not statistically significant at conventional
significance levels. This finding implies that consumers’ price-sensitivity does not
change depending upon their performance perception, which is somewhat surprising.
Because the point estimate is positive, there is weak evidence that consumers become less
price-sensitive the higher their expectation of performance, which is an intuitive result.
Second, the presence of a premium private label has a negative impact on bundle
choice as the Prem parameter is negative and significant. It is possible that consumers do
not associate premium private labels with the store they are in as retailers commonly use
brand names to differentiate premium labels from their usual, value offerings. For
example, Target uses Archer Farms and Market Pantry, while Kroger uses Kroger
branded goods alongside their premium Private Selection. Investigating this further
would require a follow up study on consumers’ association of premium private label
names with each retailer in question. In addition, a private label in the cereal category
reduces the probability of bundle purchase more than the presence of private labels in
either of the other two categories. This may be due to the fact that the cereal category has
strong national brands. Consumers seem to attach and unusual importance to having
national brand cereals in their chosen bundle. Based on those bundle characteristics,
retailers can adjust their policies knowing that their premium private labels and their

78
private label in the cereal category will face bigger challenges. For example, they can
emphasize their promotion tools on those products.
Third, bundle choice is positively affected by the number of private labels it
contains: A bundle with three private labels (so having a private label in every category
in this case), is more likely to be chosen relative to a bundle with two private labels, and a
bundle with two private labels is more likely to be chosen relative to a bundle with one
private label. Moreover, a bundle with one private label is more likely to be chosen than
one without private labels. This is observed by the positive and significant PL1, PL2, and
PL3 variables. This shows indication of the household tendency to buy private labels
across categories. The interaction between the performance transference and the bundle
choice containing private labels are all positive coefficients, bringing support to my
hypothesis that households have a behavioral tendency to buy store brands across
categories. The intent in allowing the performance and private-label indicator
interactions to vary randomly is to test my primary hypothesis that umbrella branding –
or the tendency to purchase several private labels on the same trip – is related to
consumers’ perceptions of private label performance. In this regard, the interaction term
between the performance transference the choice for bundles highly populated with
private label is positive and significant at the 5% level. This indicates that performance
transference is significant for the bundle containing three private labels. For consumers
purchasing the most private labels, it appears that perceived performance is an important
consideration. More importantly, the tendency to purchase private labels in multiple
categories depends on a common perception of performance, which I interpret as support
for the Performance Bond theory.

79
Overall, the results show evidence of the quality transference theory as the
tendency to purchase across-categories depends on the perception of performance. This
finding has important implications for consumers, retailers, and both private label and
national brand manufacturers. Namely, retailers need to ensure that their private labels
maintain a level of consistency if shoppers are going to apply their performance
perception of one product to other products in various categories. As private labels are
tied to the store, it is important that retailers keep a positive image in consumers’ mind.
Enhancing store image and the store brand image through advertising campaigns are
recommended for retailers. For shoppers, they should expect retailers to understand this
mechanism, and ensure that they offer consistent quality within private label lines. Since
consumers transfer their performance transference, they develop expectations and reduce
their risk. At the same time, private label suppliers should also realize that quality needs
to be uniform and that retailers will want to expand their line across categories. By
developing their line and increasing their private labels share, retailers might gain market
power and enter tougher negotiations with their suppliers. For national brand
manufacturers, trying to compete on the umbrella branding front does not seem to be
possible as national brands are usually offered until one or a few related product
categories. Innovation and differentiation still remains the recommendations if they want
to keep market share.
Conclusion
This chapter aims at studying the umbrella branding theory of private labels in an
experimental setting. After finding evidence of umbrella branding in the previous
chapter, I further evaluate the possibility for this phenomenon to be linked to consumer’

80
behavior. I specifically investigate the perception of a common level of performance
across private label brands. The main findings are that private labels have the potential
for umbrella branding because shoppers do transfer their perception of performance
across product categories. This behavior can lead consumers to develop trust in the store
brands, thus their likelihood of choosing them across the store, and then contributing to
an increased private label share.
My research contributes to the private label literature in that I offer an explanation
for umbrella branding, and for private-label proliferation, that is fundamentally
behavioral. Because the results show that consumers transfer their performance
perception for bundles with the largest amount of private labels, I conclude that that
umbrella branding in private labels is linked to consumers’ performance transference.
This work has several implications. First retailers can exploit umbrella branding
and may benefit from extending private label lines across categories. In fact, private
labels can carry an implicit performance bond, and this bond serves as quality insurance
across categories for the consumers. The categories where strong national brands exist
are a bigger challenge, but may still yield an umbrella branding effect. Private labels are
thus linked by a performance bond (Wernerfelt, 1988) and retailers need to introduce
private labels that are consistent in quality across product categories. Retailers also can
benefit from more market power regarding their suppliers or their competitors (national
brand manufacturers).
Our findings can be generalized to other retailing contexts. For example, in the
auto industry, Toyota already uses different tiers of its brand to expand new lines such as
Lexus or Scion. Retailers may also consider expanding their brands into other, unrelated

81
lines of business, such as Kirkland insurance at Costco or Private Selection tools at Fred
Meyers’ stores.
The experimental analysis presented here has a possible weakness, however, in
that the subjects are all relatively homogeneous in that they are U.S. shoppers. Because
private label penetration is higher in other countries – France and Germany, for example
– umbrella branding may, in fact, be due to other, cultural factors. Because of the
homogeneity of my U.S. sample in this study, I am unable to comment on this possibility,
and leave this task to the next chapter.

82
CHAPTER 5
CULTURAL EFFECTS ON PRIVATE LABEL UMBRELLA BRANDING
If a consumer expects a brand to perform in one category as it does in another, then there
is, in essence, a performance bond between the brand and the consumer (Wernerfelt,
1989). Such behavior would result in umbrella branding among private labels if the
consumer likes the private label product in one category, he or she would be willing to try
it in other product categories. In this way, umbrella branding may be a factor in
explaining the rapid growth in private label-penetration in U.S. food retailing industry.
However, the share of private labels is even higher in European countries: While the
share in the U.S. is approximately 23% of units sold, the share in France is 36%, and in
Germany is 41% (Freeman, 2012). This disparity could derive from differences in
umbrella branding strategies across regions, or could be evidence of a more fundamental,
cultural difference among consumers since usually consumers of a culture “share certain
patterns of thinking, feeling and behavior (Thommen and Wettstein, 2010).” Extending
the analysis of psychometric determinants (perception and attitudes) of consumer choices
regarding product bundles in the previous chapters, I investigate the role of cultural
background on the cross-category purchases of private labels by means of personality
traits.
Culture engages “processes unfolding in time” between an individual and their
environment (Thommen and Wettstein, 2010, p.217). The human living, psychic and
social systems co-evolve with a culturally-constructed environment. In that dynamic
context, Triandis and Suh (2002) conclude that culture is constitutive of personality.
Indeed, personality traits are thought to capture how people think, feel, and behave

83
(Borghans et al., 2008) and hence, are able to explain the shared behavioral patterns in a
culture.
Even though some individual variations must occur, overall, shoppers from a
same culture possess similar shopping behavior (Triandis and Suh, 2002). If personality
traits impact consumer product choice and culture is expressed by personality, then
different cultures should show variations in their shopping behavioral trends. In addition,
there is growing evidence that differences in personality explain variability in economic
outcomes and can explain inconsistencies in observed choices (Almlund et al., 2011;
Grebitus et al., 2013). Therefore, my focus is to test if differences in personalities
explain differences in private label penetration rates.
To accomplish this objective, I conduct a cross-country study of two countries
(France and Germany) that have similarly high private label penetration rates and,
therefore, enable me to uncover the influence of cultural effects measured through
personality traits on cross-category purchases of private labels. Umbrella branding of
private labels is an important factor explaining its penetration rate in a market.
Perceptual effects associated with umbrella branding may be cultural in origin providing
an explanation for the difference in private label share. Again, I hypothesize that
consumers’ cultural background has an impact on the success of umbrella branding. In
this chapter, I aim to test whether or not the perception of private label performance is
related to consumers’ cultural background expressed through personality traits.
The previous literature offers many explanations for why private label penetration
rates differ among countries, but without focusing on the interaction between umbrella
branding and cultural influence (Ailawadi et al., 2008; Erdem et al., 2004; Lamey et al.,

84
2007). For example, Ailawadi et al. (2008), study private label share in Europe, using
Dutch data, but they did not analyze the effect that consumers’ cultural background could
have on their product choice across categories. However, other studies give reason to
believe that consumers with differing cultural backgrounds may perceive private labels in
fundamentally different ways (Dhar and Hoch, 1997; Guerrero et al., 2000; Steenkamp et
al., 2010). Indeed, because of their personality, consumers might have different product-
choice behaviors (e.g., Grebitus et al., 2013). For example, in some cultures consumers
can be more or less trusting of store brands based on how much they worry about fitting
in with their friends and family (Erdem et al., 2006). Being worried, nervous or moody,
however, are characteristics of the personality trait ‘neuroticism’ (e.g., Clark et al., 2007).
Thus, I study the cultural aspect of consumers when it comes to choice of private labels
across categories using personality measurement and a multinomial framework of
product choice to add more detail to the hypothesis that cultural background may be the
core mechanism behind umbrella branding of private labels.
The findings of this chapter show that, first, the umbrella branding effect among
private labels is also found in markets other than the U.S. . This supports my theory that
umbrella branding of private labels exists and that it can be explained by consumers’
performance transference. Second, the results indicate that the umbrella effect stems
from consumers’ cultural backgrounds through the manifestation of individual
personality. I show that performance transference from one product category to another
heavily depends on consumers’ personality, which largely reflects culture (Triandis and
Suh, 2002). My findings help explain private label market share in different markets,
regardless of differences in store, category, and regional factors uncovered earlier.

85
There are many implications that follow from my findings. First, retailers can
learn from those findings by considering consumers’ personalities and cultural
background of a targeted new market and adjust their private labels offering accordingly.
Mainly, the quality, or the name of a store brand can be modified based on the level of
trust or willingness to try new products expressed by the local shoppers. If retailers find
that consumers in a new market might be skeptical of store brands, they can use higher
quality and a brand name that is not associated with the store. Second, consumers, based
on their dominant personalities, can take advantage of the private labels offerings. If the
retailers feel like that they are in a market where cheaper private labels or more
promotion is needed to reach a large consumer base, then the whole market benefits from
it. Third, national brands manufacturers might want to inversely take advantage of
cultural markets that are not in favor of store brands.
I contribute to the literature by demonstrating that culture as expressed by
personality has an impact on consumers’ behavior, by serving as a motivating factor for
the multi-category purchase of private labels. In other words, variation in private label
penetration rates among markets can result from differences in culture. This study is
unique because it uses personality traits as a proxy to evaluate consumers‘ culture based
on the relationship that culture is constitutive of personality (Higgins, 2008; Markus and
Kitayama, 1998; Triandis and Suh, 2002). I show that dominant personality traits among
a population of shoppers impacts product choice across product categories. While others
have considered personality as a factor in more general product-choice environments
(Kassarjian, 1971; Sirgy, 1982), personality traits and consumers’ cultural effects have
not been considered as potential drivers of cross-category purchase behavior.

86
This chapter is organized as follows: I first establish the validity of culture and
personality as potentially important factors in private label purchase. I then describe the
experiment implemented in France and Germany to test the importance of personality and
culture on cross-category purchases of retail brands. In the third section, I explain how I
test the effect of culture on cross-category purchases using an econometric model. The
results section presents and discusses my findings, and I conclude by offering more
general implications for retailing practice, and marketing strategy.
Background on Private Labels and Culture
In this section I establish the link between culture and private label purchases. Although
culture and private label purchases have not been studied, it is well understood that
consumer characteristics can impact product choices, and more specifically private label
purchases.
Consumer characteristics significantly influence private labels purchases. Dhar
and Hoch (1997) identify factors inherent to the retailer, such as the level of private-label
quality or the fact that the private label has the retailer’s name, as impacting private label
purchase, as well as factors related to the consumer himself. For example, price
sensitivity, particularly among the less wealthy and more elderly populations, proved to
be significant in their study. Nevertheless, the authors do not tie these attributes to
consumers’ purchases of private labels across categories. Furthermore, Dhar and Hoch
(1997) did not investigate consumer characteristics other than demographics.
Risk aversion, which is related to the performance bond concept, is also important
in private label choice. Erdem and Chang (2012), show that risk-averse U.S. consumers
purchase fewer private labels. They find that private labels in the U.S. provide less

87
consistent consumer experiences than in Europe, so the perceived risk of buying a private
label over a national brand is higher in the U.S.. While they offer risk aversion as an
explanation, it is also consistent with the performance bond theory that implies all private
labels convey an equivalent level of performance across categories. Erdem et al. (2002)
also show that the brand equity in European private labels is higher than for American
store brands. Higher brand equity indicates that European consumers seem to trust local
private labels more than is the case in the U.S.. The authors identify consumers’ attitudes
toward risk, quality, and price, and find that consumer learning directly impacts the
success of private labels. Consumers thus develop a set of expectations that impacts their
future purchases of private labels. Those expectations can then be applied across product
categories and lead to umbrella branding.
National or regional characteristics reflective of a culture or country may
influence private label penetration rates. Erdem et al. (2006) show that national brands
might be favored in some cultures compared to others. If national brands are a sign of
superior product quality in the consumer’s mind, countries where the culture is
characterized by a strong importance of the group (collectivism), and a low tolerance for
ambiguity (high uncertainty avoidance), tend to avoid private labels purchases. As a
result, culture has an effect on consumer behavior and product choice. Shoppers differ in
nature because of their cultural background, which in turn influences their buying
behavior, and the private label share. Guerrero et al. (2000) find that cultural background
matters for private label purchases, especially in certain product categories. The authors
consider olive oil purchases among Spanish consumers relative to Irish consumers, and
find a strong interest in olive oil from the Spanish participants relative to the Irish.

88
Because olive oil is a key product in the Spanish culture, Spanish consumers are
particularly careful with the quality and the product image of their choice and would then
disfavor private labels. However, since the researchers considered only a single product
category more research is needed to identify how cultural differences can spread across
product types.
The hypothesis advanced in this chapter is supported by Steenkamp et al. (2010)
and, indirectly, by Erdem and Chang (2012). Both of these studies find empirical results
that suggest culture is important in private label brand choice. In each case, the authors
looked at each country’s history of private label penetration and classified each as in the
mature stage (mostly in Western Europe and North America) or in the development stage
(Eastern Europe, Asia, South America), based on the number of years private labels have
been present on the market. They show that consumers are less willing to pay a premium
for national brands over private labels in mature countries, mainly because the quality
gap between those products is smaller. Consumers recognize and trust store brands, and
modify their behavior accordingly. Although cultural effects are not measured,
differences between each group of countries could as easily be explained by differences
in culture. I extend these studies by investigating consumers’ choice of private labels
across product categories based on their cultural background.
My hypothesis is that private label umbrella branding differs in strength across
countries because consumer behavior is driven, in part, by culture that differs across
markets. As culture is expressed by consumers’ personalities and consumers’
personalities’ impact product choice, I propose that the performance transference leading
to umbrella branding of private labels, is impacted by such consumer characteristics. In

89
order to test this hypothesis, I collect data in different cultural contexts concerning the
consumers themselves and the product choices that they make. I address this gap in the
literature by investigating the hypothesis that the importance of umbrella branding might
explain observed variations in the penetration of private labels between countries, and
that because the primary difference among countries is culture, umbrella branding may be
described as a cultural phenomenon.
Culture and Consumer Personality
First, a culture is defined in general terms by its norms, values and habits (Higgins, 2008;
Triandis and Suh, 2002). Culture and personality have been studied in the field of
psychology since the late 1950s and early 1960s (Siegel, 1963). Earlier, anthropologists
embraced the concept of a national character defining personality characteristics of a
society. This notion lost interest until 1971, when Lynn published a book relating
personality studies he had done indifferent countries. The researcher found that mean
personality characteristics were common at a cultural level and comparisons could be
made across cultures. Thus, from an individual level--personality, conclusions could be
made at a collective level—culture. The empirical literature has evolved to conclude that
an individual’s personality is created through the process of enculturation, or in other
words, that culture builds personality (Hofstede and McCrae, 2004). The same authors
show that measures of cultural aspects are highly correlated with measures of personality
dimensions. The process of internalizing a culture to build a personality arises in an
individual between the age of 3 and 6 (Higgins, 2008). The personality, then, translates
into predispositions for a stable individual to show differences in behavior. Triandis and
Suh (2002) explain that behavior is likely to be a function of one’s culture and

90
personality. The authors elaborate that individual personality is, among other factors,
such as living environment and parenting influence, shaped by individual culture. I use
the relationship between consumers’ personalities and their cultures in order to study the
impact of culture on product preference.
A consumer’s personality is defined by an individualized and specific pattern of
thoughts, emotions and behavior (Funder, 1997). The subject of personality has been
studied under different theories that involve more or less factors or characteristics
descriptive of personality called “personality traits” (Digman, 1990). Personality traits
are mental dispositions of human personality that tend to be stable over time but differ
across individuals, and are thought to capture how people actually think, and behave
(Borghans et al., 2008). In the literature, there is a consensus around the most popular
model of personality structure used to evaluate those personality traits (McCrae and
Costa, 1987; Digman, 1990). McCrae (2002) stated that the Five Factor Model of
Personality is a universally valid taxonomy of traits. Other competing systems comprised
of 3, 10 or 16 traits were identified but the superiority of the five traits model is well
documented (McCrae and Costa, 1987). Analyzing individual personality traits offers a
bottom-up approach where the individual is the unit of analysis compared to the bottom-
down approach where the culture is the unit of analysis (McCrae and Terracciano, 2004).
The cultural approach was used by Hofstede and McCrae (2004), and four main
dimensions of culture were identified: power distance, uncertainty avoidance,
individualism and masculinity; but all of those dimensions are correlated with one or
more traits from the Big Five model. The model categorizes any individual personality
along five main traits: Openness, Conscientiousness, Extraversion, Agreeableness, and

91
Neuroticism (OCEAN). The openness to experience trait describes individuals who
prefer novelty to convention; who favor originality and creativity, and are flexible in
ideas and emotions. The second trait, conscientiousness, describes the individual’s level
of organization; how responsible, detail oriented, and perfectionist the individual is. That
trait is the one that predicts behavior the most accurately (Almund et al., 2011).
Extraversion measures the sociability of an individual, or how socially active he or she is.
Extroverted individuals like to be the center of attention and are very outgoing. Next,
agreeableness represents how kind and trustworthy an individual is. Agreeable
individuals are warm, caring and cooperative. Last, neuroticism represents how stable or
unstable emotionally an individual is. Neurotic individuals can be stressed out and
nervous (Digman, 1990; John and Srivastava, 1999; McCrae, 2002). Those five traits
will be used in this research project to collect data on consumers’ culture.
Based on the OCEAN model, I develop hypotheses about how each trait can
influence the shopper’s behavior when it comes to private label purchases. Individuals
who are open are perceived to be creative and enjoy novelty. I expect them to favor
private labels that are considered less established brands compared to national brands,
and could be perceived as new products for the shopper. Consumers are used to
purchasing national brands (since the market share of private labels has only been
increasing in the last decade) so switching to private labels is hypothesized to be easier
for open individuals. Since conscientious individuals are thought of as organized, quality
oriented, perfectionist and very responsible, this would seem to discourage private label
purchases. Indeed, private labels are still perceived as less consistent in quality and
consumers would more easily trust a national brand. The extraversion trait can be

92
interpreted as either favoring or disfavoring private label purchase. Because extroverts
are very outgoing and social, it may be the case that they do not mind making a statement
by buying a store branded product, but the social risk that those products can carry could
discourage extroverts from selecting private labels. Because agreeable personalities are
trustworthy, sympathetic, and cooperative, their likelihood to buy private labels is high.
It takes trustworthy and cooperative consumers for them to take the risk to buy the store
brand compared to a more trusted and well known national brand. Finally, neurotic
shoppers are self-conscious and anxious, and might be less likely to buy private labels
because of the perceived risk they project. Those consumers have high uncertainty
avoidance and would rather choose a national brand that is established and trusted.
Through the use of the Big Five model, I am able to measure individual
personality traits, which gives a perspective on the overall culture of my sample subjects.
Personality traits are each, present in every culture, and in every individual, but the
importance of each (score) is what matters. The literature reveals that even if there is
variability across individuals, those individual differences are dominated to give overall
aggregated scores at the culture level. Those overall personality traits scores can thus be
used by researchers to characterize various eclectic cultures (McCrae, 2002; McCrae and
Terracciano, 2005). The use of personality traits was previously employed to predict
different consumers’ behaviors such as time preference or risk aversion (Almlund et al.,
2011). Although the Big Five is a widely used instrument, its use in this model in
relation to private label purchases is a new methodology for this literature to the best of
the author’s knowledge. This approach allows me to test my hypotheses and study the

93
potential effect of cultural factors and consumer decisions on the cross-category purchase
of private labels.
Methodology and Data
I use an experimental method similar to the U.S. experiment described in Chapter 4, but
applied to consumers in Germany and France. Specifically, I use a non-hypothetical
choice-based conjoint experiment. The differences are that the questionnaires are
translated from English to French and German, and that the products represent those
offered by local food retailers.
I chose major retailers that have private label strategies and different tiers of
private labels in one of the three product categories chosen for the previous experiment:
Milk, ice cream and breakfast cereal. For France, I selected Carrefour and Leclerc, and
the national brands included Kelloggs for cereal, Lactel for milk and La Laitiere for ice
cream. For Germany, I selected Rewe and Real stores, and the following national brands:
Dr Oekter for cereal, Berchtesgardener Land for milk, and Langnese Cremissimo for ice
cream. These national brands are the most common in their respective product category
and are available in both stores from each country. For those markets, instead of
including three brands of ice cream (one national brand and two private labels), I study
the “tier effect” with the cereal category for both France and Germany. I do not study
tiers for ice cream because Carrefour, the top retailer in France, does not have multiple
tiers for ice cream. I also present the bundle choices through product pictures as a shelf
simulation technique to reduce any possible confusion or bias. Representing an
experimental situation as close to a real life situation as possible provides reasonably
valid results (Burke et al., 1992; Hensher, 2010).

94
My experiments were non-hypothetical, which means that one of the bundles was
randomly determined as the binding bundle and, in order to be compensated, participants
had to actually purchase that bundle with currency. That is, subjects had to pay money
for the bundle and take ownership of the products. Bundle payment was made by a third-
party firm that was used to recruit participants. However, two of the products included in
the bundles were perishable (milk and ice cream). Hence, participants did not get a
package sent with the chosen products but a coupon to be redeemed at the relevant
supermarket
The experiment was carried out by using the online survey tool, Qualtrics, which
allowed me to reach the most individuals possible, over a wide geographic frame. Online
experiments have been shown to be valid by Couper (2000) and Wright (2005) for
entirely different purposes. The sample was recruited by the market research company
Skopos. They used their panel of consumers in each of France and Germany. Using a
recruitment company with a consumer panel provides a better confidence in the accuracy
of the answers given, even though bias is not completely eliminated compared to
laboratory experiments. The participants had to be 18 years of age, shop at the selected
grocery stores and regularly consume milk, ice cream and cereal.
The survey instrument comprised demographics questions, 12 bundle choices,
some behavioral questions and a personality scale. For each bundle, I capture the price of
each item and the total price of the bundle. I created a variable to express how many
private labels are in each bundle and if private labels from the cereal category, ice cream
category or milk category are included. I also created a variable to indicate the presence
of a premium private label in the bundle.

95
The Big Five survey instrument was included in this experiment to measure
consumers’ personality. I use the survey instrument by John and Srivastava (1999) that
represents 44 items or adjectives to construct the five OCEAN traits (see Appendix B).
The personality questions were measured using a 5-point Likert-type scale. The five
traits are computed by calculating the mean value of the adjectives for each. I start by
calculating the mean for each adjective, then summing up those adjectives that are ‘part’
of a personality trait and dividing it by the number of adjectives that are part of the
respective personality trait. This methodology is the most widely used and accepted in
the personality literature (McCrae et al., 2002). It also has the advantage of
characterizing consumers’ personalities in five clearly identifiable traits.
Econometric Model
To model cross-category purchases of private labels, I use a multinomial logit model.
Consumers make a discrete choice of a product bundle from among all the possible
choices. I use a random utility framework because performance transference, and hence
umbrella branding, is an individual attribute that is likely to explain heterogeneity in
private-label preference. In addition, the personality traits are also assumed to be
individual specific and are added as random parameters as well. I hypothesize that those
unobserved attributes are correlated with observed choice. More formally, the utility
function for consumer h is expressed by:
(16)
where:
represents the price of the bundle
represents that two out of three products in the bundle are private labels

96
represents a bundle with all products being private labels
represents a bundle with the premium private label
represents a bundle with a private label in the ice cream category
represents a bundle with a private label in the cereal category
represents a bundle with a private label in the milk category
represents the i.i.d. error term
The error term is i.i.d Type 1 extreme value to reflect the random nature of
consumer preferences. The parameters are fixed while the are the random
parameters of the model. The random parameter structure accounts for considerable
unobserved heterogeneity of individuals and allow me to relax the independence of
irrelevant alternative issue. I test my hypotheses using the variable Perf as the
consumers’ perception of private labels performance and adding each personality trait.
The performance transference and the personality trait are normally distributed
parameters.
(17)
The performance transference variable indicates if consumers do transfer their perception
across product categories with respect to private labels or not. The personality traits
indicate a positive or negative impact on private labels purchase across categories
reflecting consumers’ cultural effects. The tau parameters are part of the gamma which
are impacting themselves the PL2 and PL3 variables indicating product bundles highly
populated in private labels across categories. If is positive and significant, this
reinforces the umbrella branding theory and the impact of consumers’ performance

97
transference. In order for my personality hypotheses to hold, and should be
positive and significant, and should be negative and significant.
I estimate the model through simulated maximum likelihood because OLS is not
an option with a random parameters model (Train, 2003). I expect to find evidence of
umbrella branding of private labels due to the performance transference factor. In
addition, I expect to find that the umbrella branding effect is also affected by the
consumers’ cultural background. In other words, cultural differences may explain
variations in the umbrella effects among European consumers relative to U.S. consumers.
Descriptive Statistics
I first describe both the German and the French samples, and then establish the
differences in personality profiles between the two sub-samples. The sample consists of
exactly 152 participants for each German store, and 101 participants for each French
store for a total of 304 participants in Germany and 202 participants in France. The two
samples have approximately similar number of males and females: 51% of males in the
German sample and 54% of males in the French sample. Participants are, on average, 43
years of age in the German sample and 49 years of age in the French sample. The
average household is slightly larger in France averaging at 2.62 persons versus 2.35 for
Germany. However, the mean household income is higher in Germany, (35,000 Euros)
compared to France (30,000 Euros). Students’ t-tests for two samples of unequal
variance shows that there is no statistical differences between the French and German
samples regarding key socio-demographics.
Table 7 presents the calculated means of the aggregated personality traits and the
means of the single items used to construct the overall measures for each country. Each

98
single item mean was aggregated over individuals for each country, and each overall
country trait mean was calculated by aggregating individual trait scores. For example, I
know the individual score for each item or adjective given by the raw data. For the
overall country trait score, I calculate the five individual scores first, and then I aggregate
over individuals.

99
Table 6
Personality Traits Comparison by Country
Trait FRANCE GERMANY corresponding adjectives FRANCE GERMANY
Openness 3.52 3.53 Original 3.27 3.45
Curious 4.21 4.18
Ingenious 3.83 3.78
Imaginative 3.56 3.71
Inventive 3.45 3.61
values aesthetics 3.27 3.62
doesn’t like work routine 3.61 2.57
Reflective 3.96 3.52
Artistic 3.27 3.41
Sophisticated 2.66 3.29
Conscientiousness 3.71 3.72 Thorough 3.76 4.06
Careful 3.74 3.47
Reliable 3.80 4.19
Organized 3.95 3.50
not lazy 3.05 3.23
Perseverant 4.00 3.83
Efficient 3.98 3.84
always follows through 3.77 3.80
Focused 3.23 3.64
Extraversion 3.27 3.38 Talkative 2.80 3.63
not reserved 2.81 3.01
Energetic 3.70 3.60
Enthusiastic 3.79 3.66
Loud 2.33 3.28
assertive personality 3.66 3.46
Outgoing 3.02 3.01
Sociable 3.95 3.39
Agreeableness 3.73 3.60 doesn’t blame others 3.87 3.13
Helpful 4.00 3.97
avoid conflict 4.15 4.25
forgive full 3.20 3.35
Trustworthy 3.52 3.73
Warm 2.99 2.96
Considerate 4.11 3.93
Polite 3.68 3.12
Cooperative 3.92 3.81
Neuroticism 2.70 2.56 Depressed 1.93 2.23
stressed out 2.43 2.46
Tense 3.47 2.71
Worried 3.08 2.93
emotionally unstable 2.75 2.52
Moody 2.63 2.69
not calm 2.46 2.50
Nervous 2.92 2.51

100
For the single items, Table 7 shows that French consumers see themselves as
curious while German consumers score the highest in avoiding conflicts. Consumers
from both countries do not see themselves as depressed. For the overall traits, most
means are close to 3, which is the average score. Agreeableness has the highest score for
France at 3.73 while the average German subject scored 3.60. The highest score for
German participants is the conscientiousness trait at 3.72, while French subjects were
close behind at 3.71. Openness is also very close for both countries at 3.52 and 3.53,
respectively, for France and Germany. Extraversion is slightly higher for German
shoppers at 3.38 versus 3.27 for French shoppers. Last, neuroticism has the lowest
numbers for both countries with 2.70 for France and 2.56 for Germany. Both countries
have the same levels of openness and conscientiousness, but vary considerably on the
extraversion, agreeableness, and neuroticism components. Both countries, therefore,
differ in terms of their personality profile, which implies a difference in culture, and thus,
likely differ in their product choice.
In order to identify the effect of personality on product choice, and to link these
personality traits to culture, it is critical that the aggregated personalities differ between
the two countries. Student t-tests are performed on the personality traits, comparing both
German and French sample of individuals. For a two tails distribution and for two
samples of unequal variance, I obtain the following probabilities:
Table 7
Sample differences in personality
Openness Conscientiousness Extroversion Agreeableness Neuroticism
Probability associated
with the Student t-test
0.8866 0.4804 0.0387 0.0023 0.0233

101
At the 5% level, the two samples are statistically different on the extroversion,
agreeableness and neuroticism traits. Based on those differences, I can assume that as a
whole, the two cultures are fundamentally different, although not uniformly across all
personality traits. Econometrically, variation in extroversion, agreeableness, and
neuroticism can identify differences in product choice between the two countries, but not
openness nor conscientiousness.
Results
I first establish the validity of my maintained specification, and then interpret the
results obtained from the preferred model. I present the results for French shoppers in
one model for German shoppers in another model and for the pooled sample in a third
model. I separated the two markets in two different models since I had two different
samples.
(18)
(19)
Both LR calculated values are large indicating that the pooled model is statistically
different than the single sample models (Chi-square statistic equals 3.84 at 5% level).
In the results presented below, the key parameters are the interactions between the
personality traits and the choice of bundle as well as the interaction between the
personality traits and the performance transference. They test whether personality is
important, and whether personality supports or detracts from the umbrella branding
hypothesis.

102
Table 8
Cross-category Purchases Models
FRANCE GERMANY ALL
Coefficient t- ratio Coefficient t- ratio Coefficient t- ratio
Random parameters in utility functions
Perf -1.4713 -0.42 0.0579 0.04 0.9050 0.67
PL3 0.2397 0.15 -1.6817* -1.71 -1.6845** -2.01
Stdev. Perf 2.5416*** 6.49 2.1631*** 12.75 2.2169*** 15.04
Stdev. PL3 0.9762*** 7.95 0.5037*** 4.18 0.7428*** 8.96
Non-random parameters in utility functions
Price -0.0001 -0.28 -0.0009*** -3.45 -0.0009*** -4.15
PL2 -0.7572*** -3.93 -1.3455*** -9.08 -1.1223*** -9.57
CePL 1.0085*** 5.62 0.7873*** 5.43 0.8763*** 7.88
MiPL 1.0421*** 5.97 1.1598*** 8.48 1.1252*** 10.47
IcePL 0.8710*** 4.86 1.0207*** 7.46 0.9417*** 8.82
PremPL 0.8183*** 4.58 1.0029*** 7.31 0.9253*** 8.52
None 0.6268** 2.25 0.5497*** 2.68 0.4244*** 2.86
Heterogeneity in mean random coefficients
Perf*Extro 1.0640* 1.74 0.5248** 2.47 0.5958*** 3.17
Perf*Agre -0.6320 -1.13 0.0947 0.36 -0.0984 -0.44
Perf*Cons -0.4749 -0.74 -0.7645*** -2.89 -0.9669*** -3.67
Perf*Neu -0.2833 -0.63 0.2807 1.32 0.0414 0.25
Perf*Open 1.2132** 2.31 0.3712 1.38 0.5780** 2.53
Perf*France 0.8224*** 3.17
PL3*Extro 0.0014 0.01 0.1610 1.28 0.0832 0.78
PL3*Agre 0.1305 0.53 -0.2977* -1.73 -0.1089 -0.78
PL3*Cons -0.1940 -0.77 -0.1609 -1.14 -0.1634 -1.31
PL3*Neu -0.4919** -2.34 0.0263 0.22 -0.0918 -0.89
PL3*Open -0.2244 -0.88 -0.0444 -0.32 -0.0533 -0.44
PL3*France 0.5090*** 4.11
LLF -2807 -4244 -7104
N=2172, Note: ***, **, * => Significance at 1%, 5%, 10% level
Concerning the model for France, the first significant parameter appears to be of
negative sign for PL2 indicating that French shoppers do not have a natural tendency to
select bundles with the most private labels. The product category specific parameters are
all positive and significant and the presence of a premium private label also makes the

103
bundle more desirable for the consumer since that parameter is positive and significant.
In the interaction terms, the results in Table 8 show significant and positive effect of
extroversion and openness and the performance transference phenomenon. As indicated
in my hypotheses above, those two traits are likely to be associated with higher private
labels share. This result means that French shoppers with a personality prominent in
extroversion and openness will be more likely to easily transfer their perception of the
quality of the private labels from one category to the next. Extroversion is also a trait that
is fundamentally different between German and French cultures. French retailers can
then target extrovert shoppers through communication techniques (such as ads showing
the private label used in a group of friends). The last significant parameter of this model
is the interaction between neuroticism and the purchase of private labels across
categories. This trait had been identified as prominent in the French culture in the
descriptive statistics mentioned above and is also fundamentally different from the
German culture. This negative effect implies that more neurotic consumers are less
inclined to purchase private labels across product categories. This is consistent with the
hypothesis ventured above. This implies that when encountering culture that has a high
likelihood of containing neurotic shoppers, retailers should prepare to face challenge
when it comes to their store brands. A higher quality and a different name might be a
solution to address those consumers who are less trusting and are more susceptible to not
trust private labels.
The results for the German sample are slightly different. The German shoppers
seem to naturally be unlikely to purchase the bundles with the most private labels, as the
parameter on the PL3 variable is statistically significant and negative. However, similar

104
to the results for France, private labels in each product category have a positive and
significant effect on bundle choice. Further, a premium private label has a positive and
significant effect on the likelihood of bundle selection. Concerning the interaction terms
with the performance transference, the personality effects, extroversion and
conscientiousness, are the two traits that are significant determinants. As anticipated in
my hypotheses, conscientiousness has a negative effect and extroversion has a positive
effect on the behavioral mechanism behind umbrella branding. This indicates that quality
oriented, organized and detail oriented consumers do not favor private labels as a product
choice. A higher level of quality and informative promotion technique could re-ensure
those consumers in Germany. On the other hand, extroverted consumers are the easier
ones for retailers to target since they have a natural tendency to choose store brands.
Extroversion and conscientiousness are two traits that are strong in the German culture
and their effects, positive and negative respectively, validate previous hypotheses,
although only the extroversion trait is fundamentally different with the French culture.
Concerning the interactions between the personality and the cross-category purchases, the
only notable effect is a negative impact of agreeableness. This result seems to go against
our hypotheses but the significance level is the weakest in our model (10%) and the
coefficient on agreeableness and performance transference interaction is non-significant
but positive. Thus, this last effect is rather inconclusive.
The pooled model is interesting to look for the country interaction. The
interaction between France and the Perf and PL3 variables are both significant and
positive, indicating a natural tendency for French consumers to transfer their perceived
105
level of performance and buy private labels across categories that is higher compared to
German shoppers.
Overall, these results show that the umbrella branding of private labels across
product categories is impacted by personality traits. Also, by examining two different
countries it appears that different personality traits are at play, suggesting an impact of
cultural origin. In France, retailers have to appeal to extroverts and manage neurotic
shoppers while in Germany, retailers should appeal to the extroversion trait of the
consumer base while re-ensuring the conscientious shoppers. Due to the high penetration
rate of private labels in those countries, it seems that local retailers already have a good
understanding of their consumers and know how to manage the cultural effects.
Secondary results show that umbrella branding was detected in the data. I also found that
the present product categories positively impact private label cross-category purchases, as
well as the presence of a premium private label also. Finally, French shoppers seem to
have a natural tendency to choose private labels across the store and transfer their
perceived level of performance compared to Germans. Implications of those results also
apply for national brand manufacturers. They can take advantage of markets where
consumers’ personalities are not in favor of private label choice.
Conclusion
Private label penetration differs among countries for a variety of reasons. My hypothesis
is that cross-category purchases are linked to cultural factors. By conducting a choice
experiment in both France and Germany, I was able to analyze the potential effect of
those cultural factors. Personality traits, reflective of consumers’ cultures, vary in

106
significance across the chosen markets, but have a significant impact on the cross-
category purchase of private labels.
In general, my results corroborate those from the U.S. sample in that I find
evidence of umbrella branding among private labels in European markets. Cross-
category purchases are linked to culture indirectly through aggregate measures of subject
personalities in each country. Considering the fundamental differences between the two
cultures, I get the following conclusions: in France, extroverts and less neurotic
consumers display behavior resulting in umbrella branding. It seems that retailers in
France would need to take into consideration the self-consciousness of the shoppers to
guarantee success of private labels across the store. To do so, retailers could focus on
offering higher quality private labels and engage in more aggressive promotion strategies
such as store tasting to convince shoppers. Establishing brand trust and loyalty for
private labels would be a way to address this concern and fulfill extroverts’
expectations. In Germany, the most extrovert consumers are the ones who choose store
branded products most often. Again, the retailers would need to reassure the shoppers
about the private label level of performance, and possibly gear any marketing strategy
towards social and active shoppers. Extroversion and Neuroticism are two traits that
were found fundamentally different across the two countries ‘cultures. For France,
neuroticism is the main cultural trait to control for the retailer while in Germany;
extroverted consumers are the ones to target for retailers. It seems that considering the
private label market share in those countries, retailers have been succeeding in
implementing those strategies. Considering other markets, the countries with consumers

107
who score low on neuroticism but high on extraversion seem to be the most favorable to
private labels umbrella branding.
Those results have direct implications for retailers who wish to expand overseas.
Cultural factors need to be taken into consideration when potential markets are examined
for expansion. Indeed, based on culture, some branding strategies might need to be
adapted. Some consumers’ personality traits might be more pronounced in one market
compared to another, and being aware of the receptiveness for novelties for example, can
be essential for the success of a product. More precisely, in the case of private labels, it
seems that if the dominant personality trait is neuroticism, offering only high end private
labels under a premium brand name might be the best option for the retailer. On the other
end, countries where shoppers are particularly extroverts seem to be more flexible in
terms of private labels offering and strategy. Measuring personality traits as part of the
market research would then be a recommendation to any company extending business in
new markets.
One of the limitations of this study is that it was done in a limited number of
countries. Adding multiple countries in other parts of the world would strengthen the
tested theory, for example, using countries that might have even stronger cultural
differences than France and Germany (e.g., comparing Asian and European countries).
Another extension of this work would be to collect data with retailers who have already
made extension overseas and analyze how they were able to adapt their products to local
culture in order to guarantee their success from a shopper’s behavior standpoint.
Finally, latent class analyses or cluster analyses could analyze the underlying factors of
why the personality traits affect private label purchase.

108
CHAPTER 6
CONCLUSION
The dissertation contributes to the literature on private label proliferation by explaining
the breadth of private label throughout grocery stores in the U.S. and abroad as resulting
from umbrella branding. My work adds to the theoretical literature in that I develop an
explanation for umbrella branding that is fundamentally behavioral, that is, conditional
on prices, incomes, marketing mix, socioeconomic and demographic effects. In the first
substantial essay, I found evidence of private labels cross-category purchases with a
significant household tendency to do so. This first study was a way of explaining private
label market share and considering umbrella branding as one of the factors influencing it,
using secondary data. Store effects: price levels and assortment of brands offered, and
demographic effects: income household size and loyalty, were also found as significant
factors. The second essay investigates the behavioral aspect of umbrella branding deeper
by realizing a choice experiment. Evidence of umbrella branding of private labels was
shown based on a behavioral explanation. I identify, in this work, how consumers
develop performance transference across categories regarding their perception of private
labels. The impact of specific product categories or private label tier is not found
important in that essay. In the final one, I test the performance theory in other markets
and investigate the possible cultural impact as an explanation for varying private labels
penetration rate across markets. In that last part of my work, I find that umbrella
branding effects are identified in overseas markets. Product categories and the presence
of premium private labels in the products offered do increase the likelihood of the
consumer to purchase private labels. Most importantly, I found some influence of culture

109
through consumers’ personality traits when it comes to their purchase of private labels
across product categories and performance transference behavior.
This dissertation’s findings imply that retailers should have a broad line of private
labels across their stores in order to take advantage of the umbrella branding effect. They
also need to make sure that the level of quality of their products is consistent across
categories since the consumers show signs of performance transference. Communicating
the quality of their products is important if retailers want to benefit from umbrella
branding, thus marketing campaign such as store display are essentials. Retailers also
benefit from an increased market power regarding their suppliers and competitors if they
can take advantage of umbrella branding. Finally, they should focus on targeting the
right consumers or adapt their product to the consumers’ personality in the chosen
market. A certain level of trust is necessary to be established in some markets. Studying
consumer behavior and background culture is thus a major recommendation for retailer
planning expansions in new markets.
Overall, the findings of this work concerning consumer behavior could be applied
to any retailing context. In the clothing industry or transportation industry, consumers
likely display similar behaviors where they apply behaviors resulting in umbrella
branding. Thus, it would be in any retailer best interest to develop their private labels
lines across products, maintaining a consistent quality.
There are a few limitations to this work that could be further researched as work
extensions. First, the notion of private labels’ tiers and determining whether or not
having the retailers name affiliated to the private label could be clarified in future
research. This topic could also be analyzed from suppliers’ point of view by comparing

110
retailers adopting one overall store brand policy compared to a multiple tiers, multiple
store brands policy. It is indeed interesting to see that some categories have private
labels, some don’t, some of them multiple tiers in the same categories, and some private
labels have the retailer’s name while some don’t. The reasoning behind those policies
could be further investigated in relation to the umbrella branding and what this means for
the performance bond across those private labels. This would give some insight to why
Wal-Mart, the number one retailer in the world, succeeds with only one private label
across the board compared to other stores who try to develop multiple tiers of private
labels. Studying other retailing contexts would also be of interest. For example, how
does umbrella branding fits in the transportation industry when one company develops
different brands of cars? Finally studying other markets are retailers extensions overseas
and how they adapt their store line of products to local consumers is another topic to
consider in the future.

111
REFERENCES
Aaker, D. A. (1991). Managing Brand Equity: Capitalizing on the Value of a Brand
Name. New York: The Free Press.
Aaker, D. A. (1996). Building strong brands. New York: Free Press.
Agrawal, D. (1996). Effect of brand loyalty on advertising and trade promotions: A game
theoretic analysis with empirical evidence. Marketing science, 15(1), 86-108.
Ailawadi, K., Neslin, S.A., and Gedenk, K. (2001). Pursuing the value-conscious
consumer: store brands versus national brand promotions. Journal of Marketing, Vol. 65,
No. 1, 71-89.
Ailawadi, K. L., Lehmann, D. R., and Neslin, S.A. (2003). Revenue premium as an
outcome measure of brand equity. Journal of Marketing, Vol. 27, 4, 1-17.
Ailawadi, K., and Harlam, B. (2004). An Empirical Analysis of the Determinants of
Retail Margins: The Role of Store-Brand Share. Journal of Marketing, 68, 147-165.
Ailawadi, K., Pauwels, K., and Steenkamp J. (2008). Private-Label use and Store
Loyalty. Journal of Marketing, 72, 19-30.
Ainslie, A. and Rossi, P.E. (1998). Similarities in choice behavior across product
categories. Marketing Science, 17: 91–106.
Ajzen, I., and Fishbein, M. (1973). Attitudinal and normative variables as predictors of
specific behavior. Journal of Personality and Social Psychology, 27(1), 41-57.
Allenby, G. M., and Rossi, P. E. (1998). Marketing models of consumer heterogeneity.
Journal of Econometrics, 89(1), 57-78.
Almlund, M., Duckworth, A. L., Heckman, J., and Kautz, T. (2011). Personality
psychology and economics, IZA discussion paper no. 5500.
Balachander, S., and Ghose, S. (2003). Reciprocal Spillover Effects: A Strategic Benefit
of Brand Extensions. Journal of Marketing, Vol. 67, 4-13.
Bass, F. (1969). A new product growth model for consumer durables. Management
Science, 15, 5, 215–227.
Bawa, K., & Ghosh, A. (1999). A model of household grocery shopping behavior.
Marketing letters, 10(2), 149-160.

112
Bhat, C. R. (2001). Quasi-random maximum simulated likelihood estimation of the
mixed multinomial logit model. Transportation Research Part B: Methodological, 35(7),
677-693.
Becker, G., DeGroot, M., and Marschak, J. (1964), Measuring utility by a single-response
sequential method. Behavioral Science, 9, 226–236.
Bell, D.R. and Lattin, J.M. (1998). Shopping behavior and consumer preference for store
price format: why ‘large basket’ shoppers prefer EDLP. Marketing Science 17: 66–88.
Berry,S.T. (1994). Estimating Discrete-Choice Models of Product Differentiation. The
RAND Journal of Economics, Vol. 25, No. 2, 242-262.
Berry, S., Levinsohn, J., & Pakes, A. (1995). Automobile prices in market equilibrium.
Econometrica: Journal of the Econometric Society, 841-890.
Bhat, C. (2008). The multiple discrete-continuous extreme value (MDCEV) model: Role
of utility function parameters, identification considerations, and model extensions.
Transportation Research Part B, Vol. 42, 3, 274-303.
Bhat, C, and Pinjari, A. R. (2010). The Generalized Multiple Discrete-Continuous
Extreme Value (GMDCEV) Model:Allowing for Non-Additively Separable and Flexible
Utility Forms. Journal of Agricultural Economics.
Birch, K., Olsen, J. K., and Tjur, T. (2005). Regression models for market share. Center
for Statistics, Copenhagen Business School.
Bolton, R.N., and Shankar, V. (2003). An empirically derived taxonomy of retailer
pricing and promotion strategies, Journal of Retailing, 122, 1-13.
Bonfrer, A., and Chintagunta. P. (2004). Store Brands: Who Buys Them and What
Happens to Retail Prices When They are Introduced? Review of Industrial Organization
24: 195-218.
Borgatta, E. F. (1964). The structure of personality characteristics. Behavioral Science,
9(1), 8-17.
Borghans, L., Duckworth, A. L., Heckman, J. J., and ter Weel, B. (2008). The economics
and psychology of personality traits. Institute for the Study of Labor. Discussion paper
no. 3333.
Bontemps, C., Orozco V., Requillart V., and Trevisiol A. (2005). Price Effects of Private
Label Development. Journal of Agricultural & Food Industrial Organization 3: 1-16.

113
Braak, A. T., Dekimpe, M.G., and Geyskens, I. (2013), Retailer Private-Label margíns:
The Role of Supplier and Quality-Tier Differentiation. Journal of Marketing
Vol. 77, 86-103.
Bucklin, R. E., and Gupta, S. (1992). Brand choice, purchase incidence, and
segmentation: An integrated modeling approach. Journal of Marketing Research.
Bucklin, R. E., and Lattin, J. M. (1991). A two-state model of purchase incidence and
brand choice. Marketing Science, 10(1), 24-39.
Burke, R. R., Harlam, B. A., Kahn, B. E., and Lodish, L. M. (1992). Comparing dynamic
consumer choice in real and computer-simulated environments. Journal of Consumer
Research, 71-82.
Burton, S., Lichtenstein, D., Netemeyer,R., and Garretson, J.(1998). A scale for
measuring attitude toward private label products and an examination of its psychological
and behavioral correlates. Journal of the Academy of Marketing Science, Vol. 26, 4, 293-
306.
Chan Choi, S., and Coughlan A. (2006). Private Label Positioning: Quality Versus
Feature Differentiation From the National Brand. Journal of Retailing, 82: 79-93.
Chaudhuri, A., and Holbrook, M. B. (2001). The chain of effects from brand trust and
brand affect to brand performance: the role of brand loyalty. Journal of Marketing, 65(2),
81-93.
Chen, J.X., Narasimhan, O., John, G., and Dhar, T. (2010). An empirical investigation of
private label supply by national label producers. Marketing Science, Vol. 29, (4), 738–
755.
Chib, S., Seetharaman, P.B. and Strijnev, A. (2001). Analysis of multi-category purchase
incidence decisions using IRI market basket data. Advances in Econometrics 16: 57–92.
Clark, J., Boccaccini, M. T., Caillouet, B., & Chaplin, W. F. (2007). Five factor model
personality traits, jury selection, and case outcomes in criminal and civil cases. Criminal
Justice and Behavior, 34(5), 641-660.
Cooper, L. G., Nakanishi, M. (1988). Market share analysis. International Series in
Quantitative marketing, Kluwer Academic Publishers.
Corstjens, M., and Lal, R., (2000), Building store loyalty through store brands, Journal of
Marketing Research, Vol. 37, (3), 281-291.
Cotterill, R., Putsis, W., and Dhar, R. (2000). Assessing the Competitive Interaction
Between Private Labels and National Brands. The Journal of Business, 73, 109-137.

114
Couper, M. P. (2000). Web-based surveys: A review of issues and approaches. Public
Opinion Quarterly, 64 (4), 464–494.
De Wulf, K., Odekerken-Schroder G., Goedertier F., and Van Ossel G. (2005). Consumer
perceptions of store brands versus national brands. Journal of Consumer Marketing, Vol.
22, (4), 223–232.
Della Bitta, A. J., Monroe, K. B., and McGinnis, J. M. (1981). Consumer perceptions of
comparative price advertisements. Journal of Marketing Research, 416-427.
Dhar, S., and Hoch, S. (1997). Why Store Brand Penetration Varies by Retailer.
Marketing Science, 16: 208-227.
Digman, J.M. (1990). Personality structure: Emergence of the five-factor model. Annual
Review of Psychology, 41, 417–440.
Dillon, W. R., and Gupta, S. (1996). A segment-level model of category volume and
brand choice. Marketing Science, 15(1), 38-59.
Dodds, W. B., Monroe, K. B., and Grewal, D. (1991). Effects of price, brand, and store
information on buyers' product evaluations. Journal of marketing research, 307-319.
Erdem, T. (1998). An Empirical Analysis of Umbrella Branding. Journal of Marketing
Research, 35: 339-351.
Erdem, T., and Chang, S.R. (2012). A cross-category and cross-country analysis of
umbrella branding for national and store brands. Journal of the Academy of Marketing
Science, Vol. 40, 86-101.
Erdem, T., and Sun, B. (2002). An Empirical Investigation of the Spillover Effects of
Advertising and Sales Promotions in Umbrella Branding. Journal of Marketing Research,
Vol. 39, 408-420.
Erdem, T., Swait, J., and Valenzuela, A. (2006). Brands as signals: a cross-country
validation study. Journal of Marketing, 70(1), 34-49.
Erdem, T., Zhao, Y., & Valenzuela, A. (2004). Performance of store brands: a cross-
country analysis of consumer store-brand preferences, perceptions, and risk. Journal of
Marketing Research, 41(1), 86-100.
Fiske, D. W. (1949). Consistency of the factorial structures of personality ratings from
different sources. The Journal of Abnormal and Social Psychology, 44(3), 329.
Freeman, C. (2012). Private Labels Thrive Overseas. PL Buyer, 14-17.
115
Funder, D.C. (2009). Persons, behaviors and situations: An agenda for personality
psychology in the postwar era. Journal of Research in Personality, 43(2), 120–126.
Garretson, J., Fisher, D., and Burton, S. (2002). Antecedents of private label attitude and
national brand promotion attitude: similarities and differences. Journal of Retailing, 78,
91-99.
Geyskens, I., Gielens, K., and Gijsbrechts, E. (2010), Proliferating Private-Label
Portfolios: How Introducing Economy and Premium Private Labels Influences Brand
Choice. Journal of Marketing Research, Vol. XLVII, 791–807.
Grebitus, C, Lusk, J., L., and Nayga Jr, R.,M. (2013). Explaining differences in real and
hypothetical experimental auctions and choice experiments with personality. Journal of
Economic Psychology, 36, 11–26.
Grewal, D., Krishnan, R., Baker, J., and Borin, N. (1998). The effect of store name, brand
name and price discounts on consumers' evaluations and purchase intentions. Journal of
retailing, 74(3), 331-352.
Guerrero, L., Colomer, Y., Guardia, M.D., Xicola, J., and Clotet, R. (2000). Consumer
attitude towards store brands. Food Quality and Preference, 11, 387-395.
Hanemann, W. M. (1984). Discrete/continuous models of consumer demand.
Econometrica: Journal of the Econometric Society, 541-561.
Hansen, K., Singh, V., and Chintagunta, P. (2006). Understanding Store-Brand Purchase
Across Categories. Marketing Science 25: 75-90.
Hensher, D. (2010) Hypothetical bias, choice experiments and willingness to pay.
Transportation Research Part B, 44,735–752.
Higgins, E. T. (2008). Culture and personality: Variability across universal motives as the
missing link. Social and Personality Psychology Compass, 2(2), 608-634.
Hofstede, G., and McCrae, R. R. (2004). Personality and culture revisited: Linking traits
and dimensions of culture. Cross-cultural research, 38(1), 52-88.
Hoch, S. J. (1996). How should national brands think about private labels. Sloan
Management.
Hotelling, H. (1929). Stability in Competition. The Economic Journal, 39, 41-57.
Iyengar, R., Ansari, A. and Gupta, S. (2003). Leveraging information across categories.
Quantitative Marketing and Economics, 1: 425–465.

116
Iyengar, R., Gupta, S. (2006). Chapter 14: Advanced regression models. The Handbook
of Marketing Research.
John, O. P., & Srivastava, S. (1999). The Big Five trait taxonomy: History, measurement,
and theoretical perspectives. Handbook of personality: Theory and research, 2, 102-138.
Kahneman, D., & Tversky, A. (1979). Prospect theory: An analysis of decision under
risk. Econometrica: Journal of the Econometric Society, 263-291.
Kassarjian, H. H. (1971). Personality and consumer behavior: A review. Journal of
Marketing Research, 409-418.
Keller, K. L. (1993). Conceptualizing, measuring, and managing customer-based brand
equity. The Journal of Marketing, 1-22.
Keller, K. L., & Aaker, D. A. (1992). The effects of sequential introduction of brand
extensions. Journal of Marketing Research, 29(1), 35-50.
Keller, K. L., & Aaker, D. A. (1997). Managing the corporate brand: The effects of
corporate marketing on consumer evaluations of brand extensions. Retrieved from
Marketing Science Institute website: http:// www.msi.org/publications/publication.cfm
?pub=454
Kim, B., Srinivasan, K. and Wilcox, R. (1999). Identifying price sensitive consumers: the
relative merits of demographic vs. purchase pattern information. Journal of Retailing
75: 173–193.
Lamey, L., Deleersnyder B., Dekimpe M., and Steenkamp J.B. (2007). How business
cycles contribute to private-label success: evidence from the United States and Europe.
Journal of Marketing, Vol. 71, (January), 1–15.
Lattin, J. M., and Bucklin, R. E. (1989). Reference Effects of Price and Promotion on
Brand Choice Behavior. Journal of Marketing Research, 26 (August), 299-310.
Lineaires, (2012) retrieved on January 19th 2013, “Parts de marche: Carrefour tombe
encore en Janvier”, http://www.lineaires.com/LA-DISTRIBUTION/Les-actus/Parts-de-
marche-Carrefour-tombe-encore-en-janvier-36194
Louviere, J.J. (1988). Conjoint Analysis Modelling of Stated Preferences: A Review of
Theory, Methods, Recent Developments and External Validity. Journal of Transport
Economics and Policy, Vol. 22, 1, 93-119.
Louviere, J., Train, K., Ben-Akiva, M., Bhat, C., Brownstone, D., Cameron, T. A., &
Waldman, D. (2005). Recent progress on endogeneity in choice modeling. Marketing
Letters, 16(3-4), 255-265.

117
Lusk, J. L., Feldkamp, T., & Schroeder, T. C. (2004). Experimental auction procedure:
impact on valuation of quality differentiated goods. American Journal of Agricultural
Economics, 86(2), 389-405.
Lynn, R. (1971). Personality and national character.
Manchanda, P., Ansari, A. and Gupta, S. (1999). The shopping basket: a model for
multicategory purchase incidence decisions. Marketing Science 18: 95–114.
Markus, H. R., & Kitayama, S. (1998). The cultural psychology of personality. Journal of
cross-cultural psychology, 29(1), 63-87.
McFadden, D. (1978). Modeling the Choice of Residential Location. Spatial Interaction
Theory and Planning Models, eds. A. Karlqvist, L. Lundqvist, F. Snickars, and J.
Weibull. North-Holland: Amsterdam. pp. 75-96.
McFadden, D. (1986). The choice theory approach to market research. Marketing
Science, Vol.5, p.274-297.
McCrae, R. R. (2002). NEO-PI-R data from 36 cultures: Further intercultural
comparisons. In R. R. McCrae & J. Allik (Eds.), The five-factor model of personality
across cultures (pp. 105–125). New York: Kluwer Academic/Plenum Publishers.
McCrae, R. R., & Costa, P. T. (1987). Validation of the five-factor model of personality
across instruments and observers. Journal of personality and social psychology, 52(1),
81.
McCrae, R. R., & Terracciano, A. (2005). Personality profiles of cultures: aggregate
personality traits. Journal of personality and social psychology, 89(3), 407.
Mehta, N. (2007). Investigating Consumers’ Purchase Incidence and Brand Choice
Decisions Across Multiple Product Categories: A Theoretical and Empirical Analysis.
Marketing Science 26: 196-217.
Mills, D. E. (1995). Why Retailers Sell Private Labels. Journal of Economics &
Management Strategy 4: 509-528.
Mills, D. E. (1999). Private Labels and Manufacturer Counterstrategies. European
Review of Agricultural Economics, 26: 125-145.
Moulton, B. R. (1986). Random group effects and the precision of regression estimates.
Journal of econometrics, 32(3), 385-397.

118
Nielsen wire (2012) Global Private Label Report: The Rise of the Value-Conscious
Shopper, http://blog.nielsen.com/nielsenwire/consumer/global-private-label-report-the-
rise-of-the-value-conscious-shopper/, retrieved on March 12, 2012.
Norman, W. T. (1963). Toward an adequate taxonomy of personality attributes:
Replicated factor structure in peer nomination personality ratings. The Journal of
Abnormal and Social Psychology, 66(6), 574.
Oliver, R. L. (1999). Whence consumer loyalty? Journal of Marketing, 33-44.
Pauwels, K., and Srinivasan, S. (2004). Who Benefits from Store Brand Entry?
Marketing Science 23, 364-390.
Pinjari, A. R., and Bhat. C. (2010). A Multiple Discrete-Continuous Nested Extreme
Value (MDCNEV) Model: Formulation and Application to Non-Worker Activity Time-
Use ant Timing Behavior on Week-days. Transportation Research Part B 44: 562-583.
Private Label Manufacturer Association, Market Profile (2012), available at
http://plma.com/storeBrands/sbt12.html, retrieved on March 12, 2012.
Raju, J. S., Sethuraman, and Dhar, S. K. (1995). The introduction and performance of
store brands, Management Science. Vol. 41, (6), 957–978.
Richards, T. J., Hamilton, S. F., and Patterson, P. (2010). Spatial Competition in Private
Labels, Journal of Agricultural and Resource Economics, 35(2), 183-208.
Richards, T. J., Yonezawa, K., Winter, S. T. (2014). Cross-Category Effects and Private
Labels: a Multiple Discrete Continuous Extreme Value Model. European review of
Agricultural Economics, forthcoming.
Rubio, N., and Yague, M.J. (2007). Alternative panel models to evaluate the store brand
market Share, Evidence from the Spanish market. European Journal of Marketing, Vol.
43, 1/2, 110-138.
Sayman, S., Hoch, S., and Raju, J. (2002). Positioning of Store Brands. Marketing
Science, 21, 378-397.
Semeijn, J., Van Riel, A., and Ambrosini, A. (2004). Consumer Evaluations of Store
Brands: Effects of Store Image and Product Attributes. Journal of Retailing and
Consumer Services, 11: 247-258.
Sethuraman, R. (2009). Assessing the external validity of analytical results. Marketing
Science, Vol. 28, 4, 759–781.

119
Seetharaman, P.B., Ainslie, A. and Chintagunta, P. (1999). Investigating household state
dependence effects across categories. Journal of Marketing Research, 36: 488–500.
Seetharaman, P.B., Chib, S., Ainslie, A., Boatwright, P., Chan, T., Gupta, S., Mehta, N.,
Rao, V. and Strijnev, A. (2005). Models of multi-category choice behavior. Marketing
Letters, 16: 239–254.
Shankar, V., and Bolton, R. N. (2004). An empirical analysis of determinants of retailer
pricing strategy. Marketing Science, 23(1), 28-49.
Siegal, B. (1963) Biennal Review of Anthropology. Vol. 3
Singh, V.P., Hansen, K. and Gupta, S. (2005). Modeling preferences for common
attributes in multicategory brand choice. Journal of Marketing Research 42: 195–209.
Sirgy, M. J. (1982). Self-concept in consumer behavior: a critical review. Journal of
consumer research, 287-300.
Song, I., and Chintagunta, P. (2007). A Discrete-Continuous Model for Multicategory
Purchase Behavior of Households. Journal of Marketing Research, 44: 595-612.
Steenkamp, J. B. E., & Dekimpe, M. G. (1997). The increasing power of store brands:
building loyalty and market share. Long range planning, 30(6), 917-930.
Steenkamp, J.B. E.M., Hofstede, F., and Wedel, M. (1999), A cross-national
investigation into the individual and national cultural antecedents of consumer
innovativeness. Journal of Marketing, Vol 63, 2, 55-69.
Steenkamp, J.B. E.M., Van Heerde, H.J., and Geyskens, I. (2010). What makes
consumers willing to pay a price premium for national brands over private labels?,
Journal of Marketing Research, Vol. XLVII, 1011 –1024.
Steiner, R.L. (2004). The nature and benefits of national brand/private label competition.
Review of Industrial Organization, 24: 105–127.
Sudhir, K., and Taludkar, D. (2004). Does Store Brand Patronage Improve Store
Patronage? Review of Industrial Organization, 24:143–160
SymphonyIRI, retrieved on November,24th 2012: “Private Labels: Brand Positioning in
the New World
Order”,http://www.symphonyiri.com/portals/0/articlePdfs/T_T%20September%202011%
20Presentation.pdf
Thommen, B., & Wettstein, A. (2010). Culture as the Co-evolution of Psychic and Social
Systems: New Perspectives on the Person—Environment Relationship. Culture &
Psychology, 16(2), 213-241.

120
Thompson, P. (2010). Shopping optimized. The Hub, March/April 2010, 16-18.
Train, K. (2001). A comparison of hierarchical Bayes and maximum simulated likelihood
for mixed logit. University of California, Berkeley, 1-13.
Train, K. E. (2009). Discrete choice methods with simulation. Cambridge university
press.
Triandis, H., C., Suh., E., M. (2002). Cultural influences on personality. Annual Review
of Psychology, 133-160.
Tupes, E. C., & Christal, R. E. (1992). Recurrent personality factors based on trait
ratings. Journal of personality, 60(2), 225-251.
U.S Census Bureau (2012). Retrieved on July 10, 2014: http://www.census.gov/
Vahie, A., and Paswan, A. (2006). Private label brand image: its relationship with store
image and national brand. International Journal of Retail & Distribution Management,
Vol. 34, (1), 67-84.
Ward, M., Shimshack, J., Perloff, J., and Harris, J. (2002). Effects of the Private-Label
Invasion in Food Industries. American Journal of Agricultural Economics 84: 961-973.
Weinstock, D., S. (1982). Using the Herfindahl Index to measure concentration. The
Antitrust Bulletin, 285-302
Wernerfelt, B. (1988). Umbrella branding as a signal of new product quality: an example
of signaling by posting a bond. Rand Journal of Economics, 19, 458-466.
Williamson, O. (1975). Markets and Hierarchies. New York: Free Press
Wright, K. B. (2005). Researching Internet‐based populations: Advantages and
disadvantages of online survey research, online questionnaire authoring software
packages, and web survey services. Journal of Computer‐Mediated Communication,
10(3), 00-00.
Zielke, S., and Dobbelstein, T. (2007). Customers’ Willingness to Purchase New Store
Brands. Journal of Product & Brand Management 16: 112-121.

121
APPENDIX A
EXPERIMENTAL SURVEY INSTRUMENT

122
Spillover Effects of Private Label Choice
I am a graduate student under the direction of Professor Richards in the Morrison
School of Agribusiness and Resource Management at Arizona State University. The purpose of this research study is to identify the spillover effects of private label purchases on choices made
in other categories. You must be 18 years old or greater and be the primary shopper for the
household to participate.
You will be asked to participate in a choice experiment that should take about twenty minutes of your time. You will be asked to choose among several bundles of national brand and
private label products. You will be given $40 for participating in the survey. One bundle will be
chosen at random and, if you chose that bundle, you will receive a coupon for the products
included in the bundle, but will give up the total price of the bundle. Therefore, it is in your best interest to choose only the bundles that you actually want to buy. Please read each question
carefully and answer to the best of your ability.
We assure you that your identity will remain anonymous. To that end, a number will be
assigned to each participant and your name removed from the data file. Your responses will be
combined with those of other participants and only group data will be released. We also would
like to remind you that your participation is voluntary and you may stop participating at any time. You can skip questions if you wish. If you choose not to participate or to withdraw from the study
at any time, there will be no penalty. Although there is no benefit to you possible benefits of your
participation is a better understanding of the role of store brands in the food retailing industry. There are no foreseeable risks or discomforts to your participation.
If you have any questions concerning the research study, please contact the research team at: ([email protected] or [email protected]). If you have any questions about your rights as a
subject/participant in this research, or if you feel you have been placed at risk, you can contact the
Chair of the Human Subjects Institutional Review Board, through the ASU Office of Research
Integrity and Assurance, at (480) 965-6788.
Please let me know if you wish to be part of the study.
Thank you.
-Sophie Theron-

123
SECTION 1
1. Which of the following best describes you?
Male (1)
Female (2)
2. What is your ethnicity?
White/Caucasian (1)
Black/African-American (2)
Asian (3)
Hispanic (4)
Indian-American (5)
Other (6)
3. Please chose the category below that describes the total amount of money your household spends on groceries in an average month?
$0 - $200 (1)
$201 - $400 (2)
$401 - $600 (3)
$601 - $800 (4)
$801 - $1000 (5)
$1001 - $1200 (6)
$1201 - $1400 (7)
$1400 + (8)
I don't know (9)
4. How many people live in your household? Include yourself, your spouse and any dependents. Do not include your parents or roommates unless you claim them as dependents. __________ people

124
5. Please indicate the category below that describes the total amount of INCOME earned in 2009 by the people in your household (as “household” is defined in the previous question). [Consider all forms of income, including salaries, tips, interest and dividend payments, scholarship support, student loans, parental support, social security, alimony, and child support, and others.]
Under $5000 (1)
$5000-$7999 (2)
$8000-$9999 (3)
$10,000-$11,999 (4)
$12,000-$14,999 (5)
$15,000-$19,999 (6)
$20,000-$24,999 (7)
$25,000-$29,999 (8)
$30,000-$34,999 (9)
$35,000-$39,999 (10)
$40,000-$44,999 (11)
$45,000-$49,999 (12)
$50,000-$59,999 (13)
$60,000-$69,999 (14)
$70,000-$99,999 (15)
$100,000 - $124,999 (16)
$125,000 - $149,999 (17)
$150,000 - $199,999 (18)
$200,000 + (19)
6. What is your current age?
_____________ years of age
7. What is the highest level of education you attained?
Some High School (1)
High School / GED (2)
Some college (3)
Associates degree (4)
Bachelor’s degree (5)
Master’s degree (6)
Some Doctorate education (7)
PhD or MD (8)

125
8. What is your marital status? Married
Engaged
Divorced
Widowed
Partner
Separated
Never married / Single
10. What is your current employment status?
Full time employee
Part time employee
Student
Unemployed
Retired
Other (please specify)______________________________
11. How frequently do you shop at a grocery store?
About once a month
Once every other week
Once a week
Twice a week
Three times a week
More than three times a week

126
SECTION 2
1. Can you identify the brand name for Safeway 's "value" store brand?
Safeway
Private Selection
O’organics
Market Pantry
Kirkland
2. Can you identify the brand name for Safeway 's "premium" store brand?
Safeway
Private Selection
O’organics
Market Pantry
Kirkland
3. Which of the following product bundle would you choose? Please circle one.
Bundle 1 Safeway Ice cream $2.33 Kelloggs Cereal $4.99 Horizon Milk $4.79
Bundle 2 Breyers Ice cream $4.39 Kelloggs Cereal $4.99 O’organics Milk $2.24
Bundle 3 Safeway Ice cream $1.75 Kelloggs Cereal $4.99 Horizon Milk $2.40
Bundle 4 None of the above
4. Which of the following product bundle would you choose? Please circle one.
Bundle 1 Lucerne Ice cream $1.38 Safeway Cereal $3.29 Horizon Milk $2.40
Bundle 2 Lucerne Ice cream $1.38 Safeway Cereal $2.47 O’organics Milk $1.50
Bundle 3 Lucerne Ice cream $2.06 Safeway Cereal $3.29 Horizon Milk $3.59
Bundle 4 None of the above
5. Which of the following product bundle would you choose? Please circle one.
Bundle 1 Breyers Ice cream $2.20 Safeway Cereal $3.29 O’organics Milk $2.24
Bundle 2 Lucerne Ice cream $2.06 Kelloggs Cereal $2.50 O’organics Milk $2.99
Bundle 3 Lucerne Ice cream $2.75 Kelloggs Cereal $3.74 Horizon Milk $2.40
Bundle 4 None of the above

127
6. Which of the following product bundle would you choose? Please circle one.
Bundle 1 Breyers Ice cream $2.20 Kelloggs Cereal $2.50 O’organics Milk $2.99
Bundle 2 Lucerne Ice cream $2.75 Safeway Cereal $1.65 Horizon Milk $3.59
Bundle 3 Breyers Ice cream $2.20 Kelloggs Cereal $2.50 Horizon Milk $2.40
Bundle 4 None of the above
7. Which of the following product bundle would you choose? Please circle one.
Bundle 1 Breyers Ice cream $3.29 Safeway Cereal $2.47 Horizon Milk $2.40
Bundle 2 Breyers Ice cream $3.29 Safeway Cereal $2.47 O’organics Milk $2.99
Bundle 3 Breyers Ice cream $3.29 Kelloggs Cereal $3.74 Horizon Milk $3.59
Bundle 4 None of the above
8. Which of the following product bundle would you choose? Please circle one.
Bundle 1 Breyers Ice cream $2.20 Kelloggs Cereal $3.74 Horizon Milk $3.59
Bundle 2 Safeway Ice cream $2.33 Kelloggs Cereal $3.74 O’organics Milk $2.99
Bundle 3 Lucerne Ice cream $1.38 Kelloggs Cereal $3.74 Horizon Milk $4.79
Bundle 4 None of the above
9. Which of the following product bundle would you choose? Please circle one.
Bundle 1 Safeway Ice cream $1.75 Kelloggs Cereal $2.50 Horizon Milk $2.40
Bundle 2 Safeway Ice cream $2.33 Safeway Cereal $2.47 Horizon Milk $3.59
Bundle 3 Safeway Ice cream $2.33 Safeway Cereal $1.65 Horizon Milk $3.59
Bundle 4 None of the above
10. Which of the following product bundle would you choose? Please circle one.
Bundle 1 Breyers Ice cream $4.39 Safeway Cereal $3.29 O’organics Milk $1.50
Bundle 2 Safeway Ice cream $1.75 Safeway Cereal $2.47 O’organics Milk $1.50
Bundle 3 Lucerne Ice cream $2.75 Kelloggs Cereal $2.50 O’organics Milk $1.50
Bundle 4 None of the above
11. Which of the following product bundle would you choose? Please circle one.
Bundle 1 Lucerne Ice cream $2.06 Kelloggs Cereal $4.99 O’organics Milk $2.24
Bundle 2 Safeway Ice cream $1.17 Safeway Cereal $1.65 O’organics Milk$1.50
Bundle 3 Breyers Ice cream $3.29 Safeway Cereal $1.65 Horizon Milk $4.79
Bundle 4 None of the above

128
12. Which of the following product bundle would you choose? Please circle one.
Bundle 1 Safeway Ice cream $1.75 Safeway Cereal $3.29 O’organics Milk $2.99
Bundle 2 Breyers Ice cream $4.39 Safeway Cereal $1.65 Horizon Milk $4.79
Bundle 3 Lucerne Ice cream $1.38 Safeway Cereal $3.29 Horizon Milk $4.79
Bundle 4 None of the above
13. Which of the following product bundle would you choose? Please circle one.
Bundle 1 Breyers Ice cream $4.39 Kelloggs Cereal $4.99 O’organics Milk $1.50
Bundle 2 Safeway Ice cream $1.17 Safeway Cereal $1.65 O’organics Milk $2.24
Bundle 3 Safeway Ice cream $1.17 Kelloggs Cereal $4.99 Horizon Milk $4.79
Bundle 4 None of the above
14. Which of the following product bundle would you choose? Please circle one.
Bundle 1 Safeway Ice cream $1.17 Kelloggs Cereal $3.74 O’organics Milk $2.24
Bundle 2 Lucerne Ice cream $2.75 Safeway Cereal $2.47 O’organics Milk $2.99
Bundle 3 Lucerne Ice cream $2.06 Kelloggs Cereal $2.50 O’organics Milk $2.24
Bundle 4 None of the above
SECTION 3
1. How often do you consume store brand foods (foods that are branded by the store such as
Safeway Select or Lucerne at Safeway):
Often: __1__:__2__:__3__:__4__:__5__:__6__:__7__: Never
2. Store brand products are usually cheaper than national brand products:
Strongly agree: __1__:__2__:__3__:__4__:__5__:__6__:__7__: Strongly disagree.
3. Store brand products are usually of less quality than national brand products:
Strongly agree: __1__:__2__:__3__:__4__:__5__:__6__:__7__: Strongly disagree.

129
4. Store brands have a positive image with most consumers:
Strongly agree: __1__:__2__:__3__:__4__:__5__:__6__:__7__: Strongly disagree.
5. In my opinion store brand foods are a good value for money:
Strongly agree: __1__:__2__:__3__:__4__:__5__:__6__:__7__: Strongly disagree.
6. Store brand foods are reliable:
Strongly agree: __1__:__2__:__3__:__4__:__5__:__6__:__7__: Strongly disagree.
7. If a Safeway brand ice cream is good I would trust the brand enough to buy other Safeway
products:
Strongly agree: __1__:__2__:__3__:__4__:__5__:__6__:__7__: Strongly disagree.
8. Store brand food and national brand foods taste different:
Strongly agree: __1__:__2__:__3__:__4__:__5__:__6__:__7__: Strongly disagree.
9. If the price is the same, I would rather buy the national brand food than the store brand food:
Strongly agree: __1__:__2__:__3__:__4__:__5__:__6__:__7__: Strongly disagree.
10. Not all store brand foods are the same, their quality depends on the store which gives their
name:
Strongly agree: __1__:__2__:__3__:__4__:__5__:__6__:__7__: Strongly disagree.
11. If I dislike the store brand cereal after buying them for the first time I will reluctant to buy
store brand ice cream after:
Strongly agree: __1__:__2__:__3__:__4__:__5__:__6__:__7__: Strongly disagree.
12. Store brand foods are inferior to national branded foods:
Strongly agree: __1__:__2__:__3__:__4__:__5__:__6__:__7__: Strongly disagree.
13. I love it when store brand products are available for the product categories I purchase:
Strongly agree: __1__:__2__:__3__:__4__:__5__:__6__:__7__: Strongly disagree.

130
14. When I buy a store brand product I feel like I am getting a good deal:
Strongly agree: __1__:__2__:__3__:__4__:__5__:__6__:__7__: Strongly disagree.
15. Regardless of this survey, I intend to buy store brand foods in my next shopping trips:
Strongly agree: __1__:__2__:__3__:__4__:__5__:__6__:__7__: Strongly disagree.
16. I think that all store brand products (Lucerne milk and Safeway cereal) have the same level of
quality:
Strongly agree: __1__:__2__:__3__:__4__:__5__:__6__:__7__: Strongly disagree.
17. Safeway offers different store brands in many different categories of products: Safeway Select, Eating right, and O’organics. If you have shopped at Safeway in the past, then answer the question that follows: A. Have you purchased either a Safeway Select, Eating right or O’organics? - Yes - No B. If you answered yes to A, did your purchase make you more or less willing to purchase the same brand in another category? - More - Less
- Thank you for your participation -

131
APPENDIX B
PERSONALITY SCALE INSTRUMENT

132