ULI Real Estate Economic Forecast - ULI Americas Real Estate Consensus Forecast • Three‐year...
48
ULI Real Estate Economic Forecast A Survey of Leading Real Estate Economists/Analysts uli.org/economicforecast October 2017 ULI Center for Capital Markets and Real Estate
Transcript of ULI Real Estate Economic Forecast - ULI Americas Real Estate Consensus Forecast • Three‐year...
ULI Real Estate Economic Forecast A Survey of Leading Real Estate Economists/Analysts
uli.org/economicforecast
October 2017
ULI Center for Capital Markets and Real Estate
ULI Real Estate Consensus Forecast
• Three‐year forecast (‘17‐’19) for 27 economic and real estate indicators.• A consensus forecast based on the median of the forecasts from 48
economists/analysts at 34 leading real estate organizations.• Respondents represent major real estate investment, advisory, and research firms
and organizations.• This is the 12th survey; completed September 5 – September 29, 2017.• A semi‐annual survey; next release planned for April 2018.• Forecasts for:
– Broad economic indicators– Real estate capital markets– Property investment returns for four property types– Vacancy rates and rents for five property types– Housing starts and prices
ULI Real Estate Consensus Forecast
Overview
• The ULI Real Estate Consensus Forecast for October 2017 projects continued economic expansion over the three forecast years, with GDP growth near its long‐term average throughout the forecast; moderating employment growth compared to 2016; relatively high but moderating commercial real estate volumes; continued commercial price appreciation, rent growth, and positive returns but at relatively subdued and decelerating rates; better than, or at, average vacancy/occupancy rates for all but retail, but with little, if any, further improvement in all sectors; continued growth in single family housing starts but remaining at levels below the long‐term average.
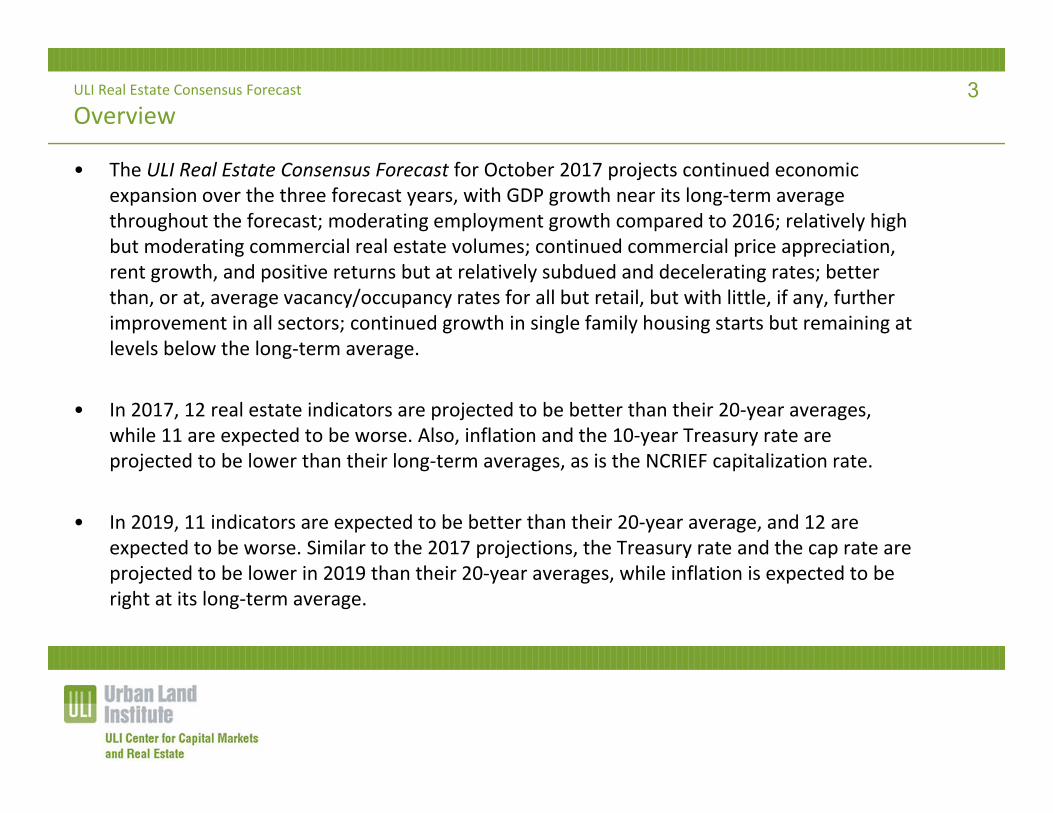
• In 2017, 12 real estate indicators are projected to be better than their 20‐year averages, while 11 are expected to be worse. Also, inflation and the 10‐year Treasury rate are projected to be lower than their long‐term averages, as is the NCRIEF capitalization rate.
• In 2019, 11 indicators are expected to be better than their 20‐year average, and 12 are expected to be worse. Similar to the 2017 projections, the Treasury rate and the cap rate are projected to be lower in 2019 than their 20‐year averages, while inflation is expected to be right at its long‐term average.
3
Forecasts vs. Long‐Term Averages
2017 Forecast 2019 ForecastBetter than long‐term
averagesWorse than long‐term
averages
Unemployment Rate GDP Growth
Employment Growth CPPI Growth
Transaction Volume NCREIF Total Returns: Apartment, Office, Retail
CMBS Issuance Availability: Retail
NCREIF Industrial Returns Rental Rate Growth: Apartment and Office
Vacancy/Occupancy: Industrial, Apartment, Office, Hotel
REIT Total Returns
Rental Rate Growth: Industrial and Retail
Hotel RevPAR Change
Home Price Growth Single‐family starts
Better than long‐term averages
Worse than long‐term averages
Unemployment Rate GDP Growth
Employment Growth CPPI Growth
Transaction Volume NCREIF Total Returns: Industrial, Apartment, Office, Retail
CMBS Issuance REIT Total Returns
Vacancy/Occupancy: Industrial, Apartment, Office, Hotel
Availability: Retail
Rental Rate Growth: Industrial and Retail
Rental Rate Growth: Apartment and Office
Home Price Growth Hotel RevPAR Change
Single‐family starts
ULI Real Estate Consensus Forecast
Key Findings
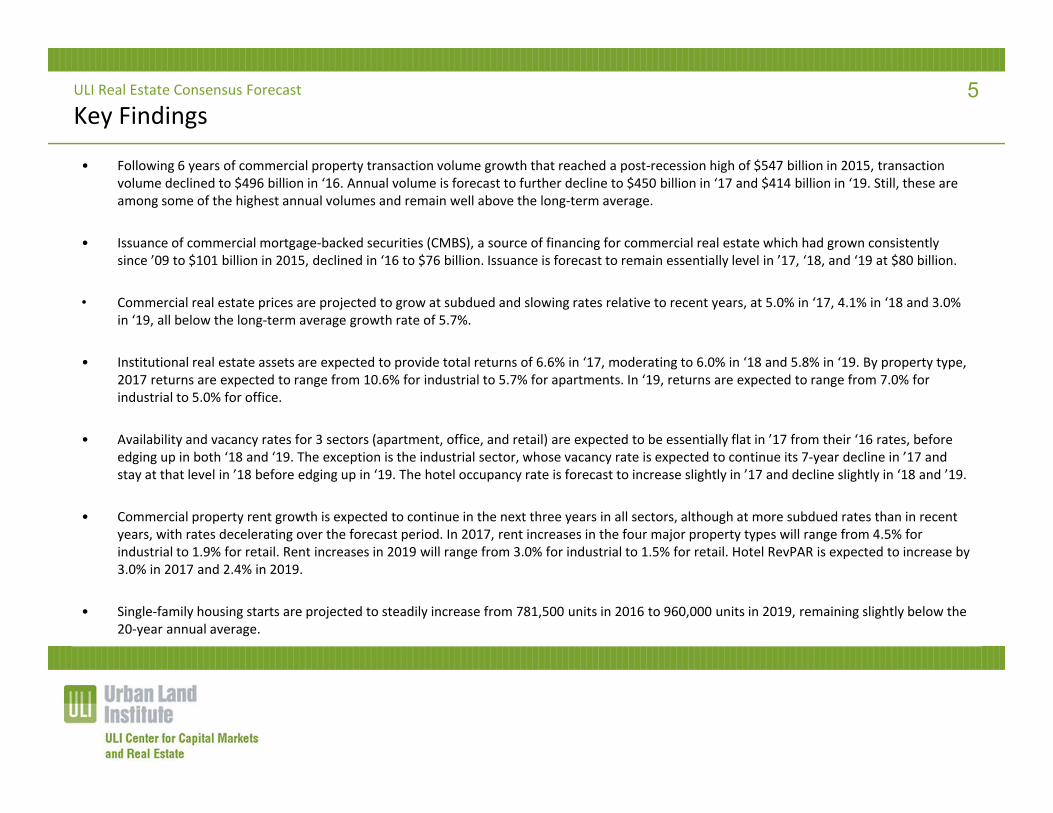
• Following 6 years of commercial property transaction volume growth that reached a post‐recession high of $547 billion in 2015, transaction volume declined to $496 billion in ‘16. Annual volume is forecast to further decline to $450 billion in ‘17 and $414 billion in ‘19. Still, these are among some of the highest annual volumes and remain well above the long‐term average.
• Issuance of commercial mortgage‐backed securities (CMBS), a source of financing for commercial real estate which had grown consistently since ’09 to $101 billion in 2015, declined in ‘16 to $76 billion. Issuance is forecast to remain essentially level in ’17, ‘18, and ‘19 at $80 billion.
• Commercial real estate prices are projected to grow at subdued and slowing rates relative to recent years, at 5.0% in ‘17, 4.1% in ‘18 and 3.0% in ‘19, all below the long‐term average growth rate of 5.7%.
• Institutional real estate assets are expected to provide total returns of 6.6% in ‘17, moderating to 6.0% in ‘18 and 5.8% in ‘19. By property type, 2017 returns are expected to range from 10.6% for industrial to 5.7% for apartments. In ‘19, returns are expected to range from 7.0% for industrial to 5.0% for office.
• Availability and vacancy rates for 3 sectors (apartment, office, and retail) are expected to be essentially flat in ’17 from their ‘16 rates, before edging up in both ‘18 and ‘19. The exception is the industrial sector, whose vacancy rate is expected to continue its 7‐year decline in ’17 and stay at that level in ’18 before edging up in ‘19. The hotel occupancy rate is forecast to increase slightly in ’17 and decline slightly in ‘18 and ’19.
• Commercial property rent growth is expected to continue in the next three years in all sectors, although at more subdued rates than in recent years, with rates decelerating over the forecast period. In 2017, rent increases in the four major property types will range from 4.5% for industrial to 1.9% for retail. Rent increases in 2019 will range from 3.0% for industrial to 1.5% for retail. Hotel RevPAR is expected to increase by 3.0% in 2017 and 2.4% in 2019.
• Single‐family housing starts are projected to steadily increase from 781,500 units in 2016 to 960,000 units in 2019, remaining slightly below the 20‐year annual average.
5
ULI Real Estate Consensus Forecast
Economy
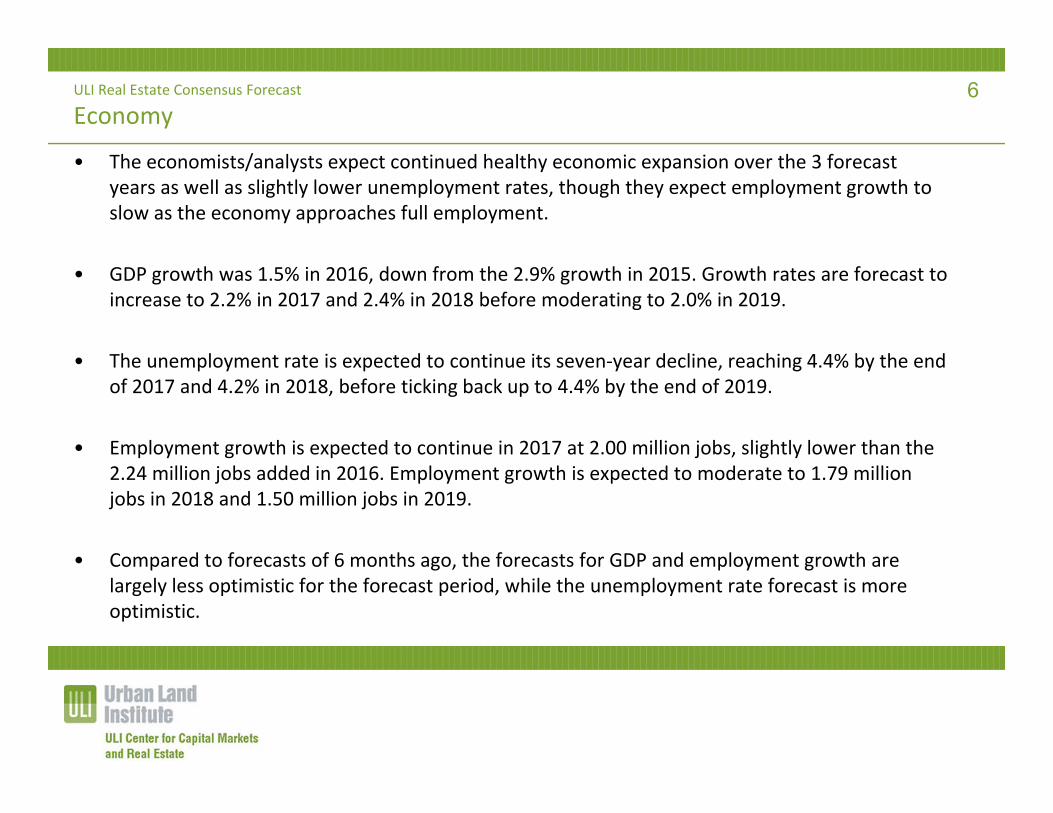
• The economists/analysts expect continued healthy economic expansion over the 3 forecast years as well as slightly lower unemployment rates, though they expect employment growth to slow as the economy approaches full employment.
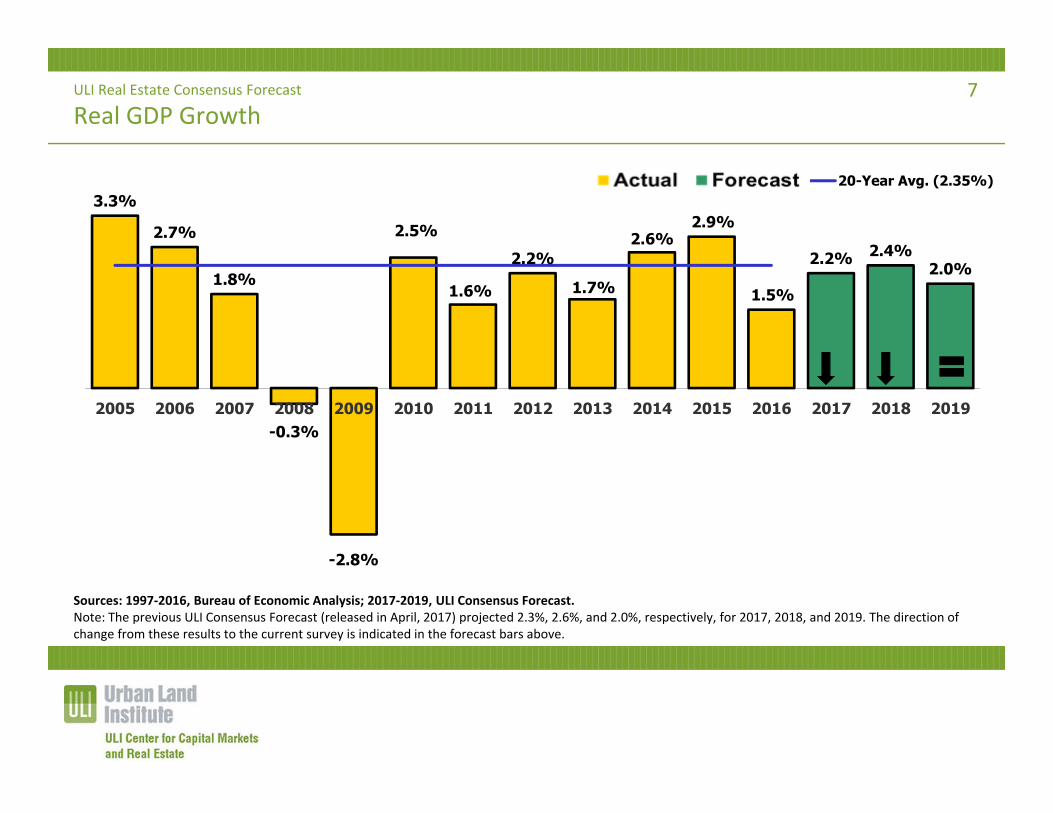
• GDP growth was 1.5% in 2016, down from the 2.9% growth in 2015. Growth rates are forecast to increase to 2.2% in 2017 and 2.4% in 2018 before moderating to 2.0% in 2019.
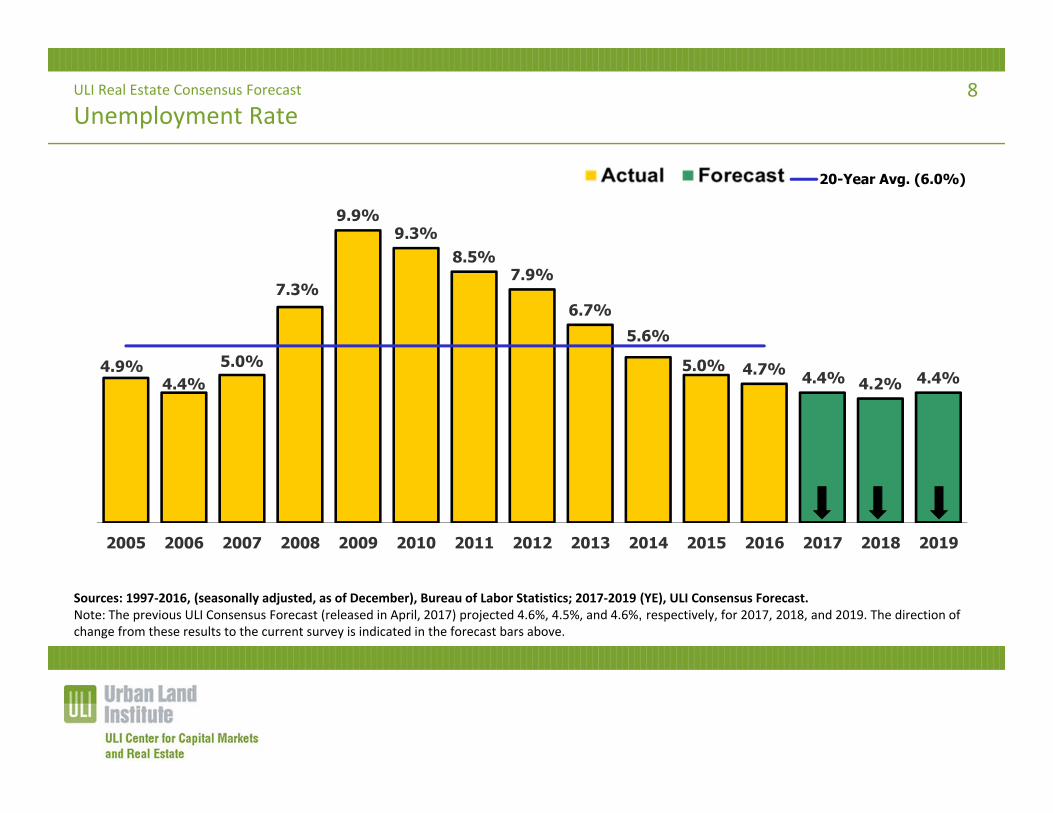
• The unemployment rate is expected to continue its seven‐year decline, reaching 4.4% by the end of 2017 and 4.2% in 2018, before ticking back up to 4.4% by the end of 2019.
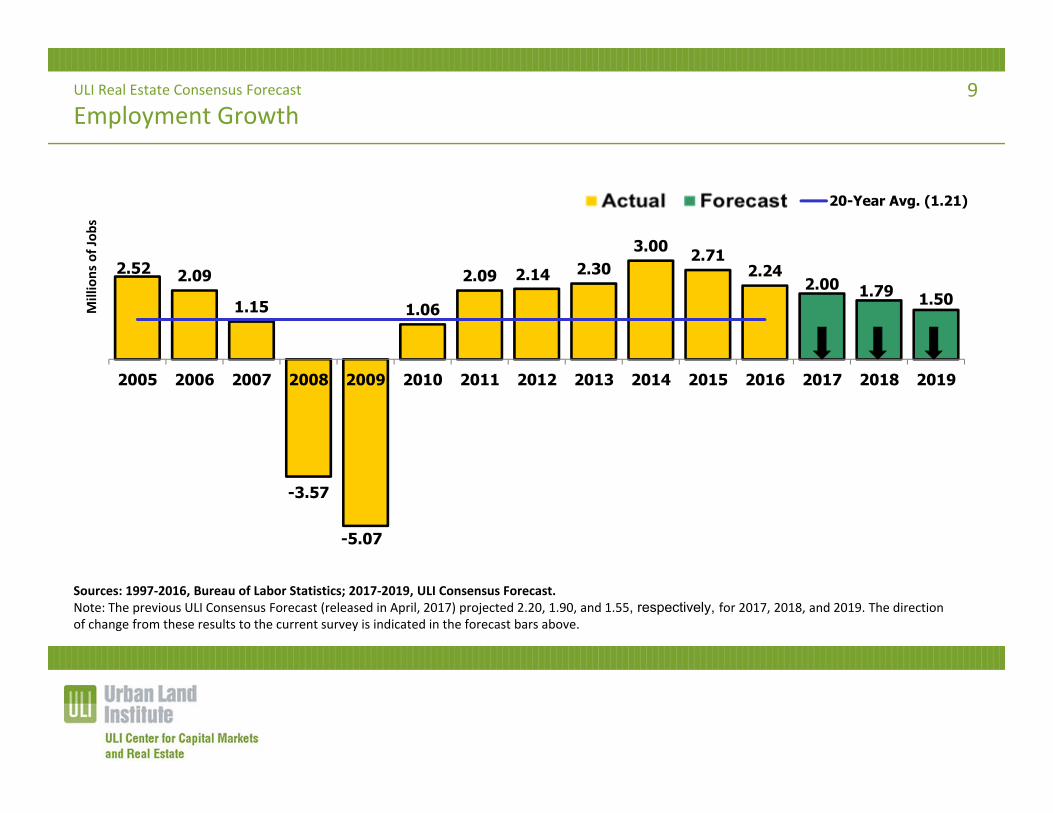
• Employment growth is expected to continue in 2017 at 2.00 million jobs, slightly lower than the 2.24 million jobs added in 2016. Employment growth is expected to moderate to 1.79 million jobs in 2018 and 1.50 million jobs in 2019.
• Compared to forecasts of 6 months ago, the forecasts for GDP and employment growth are largely less optimistic for the forecast period, while the unemployment rate forecast is more optimistic.
6
ULI Real Estate Consensus Forecast
Real GDP Growth
3.3%
2.7%
1.8%
-0.3%
-2.8%
2.5%
1.6%
2.2%
1.7%
2.6%2.9%
1.5%
2.2% 2.4%2.0%
2005 2006 2007 2008 2009 2010 2011 2012 2013 2014 2015 2016 2017 2018 2019
20-Year Avg. (2.35%)
Sources: 1997‐2016, Bureau of Economic Analysis; 2017‐2019, ULI Consensus Forecast. Note: The previous ULI Consensus Forecast (released in April, 2017) projected 2.3%, 2.6%, and 2.0%, respectively, for 2017, 2018, and 2019. The direction of change from these results to the current survey is indicated in the forecast bars above.
7
ULI Real Estate Consensus Forecast
Unemployment Rate
4.9%4.4%
5.0%
7.3%
9.9%9.3%
8.5%7.9%
6.7%5.6%
5.0% 4.7% 4.4% 4.2% 4.4%
2005 2006 2007 2008 2009 2010 2011 2012 2013 2014 2015 2016 2017 2018 2019
20-Year Avg. (6.0%)
Sources: 1997‐2016, (seasonally adjusted, as of December), Bureau of Labor Statistics; 2017‐2019 (YE), ULI Consensus Forecast. Note: The previous ULI Consensus Forecast (released in April, 2017) projected 4.6%, 4.5%, and 4.6%, respectively, for 2017, 2018, and 2019. The direction of change from these results to the current survey is indicated in the forecast bars above.
8
ULI Real Estate Consensus Forecast
Employment Growth
Sources: 1997‐2016, Bureau of Labor Statistics; 2017‐2019, ULI Consensus Forecast. Note: The previous ULI Consensus Forecast (released in April, 2017) projected 2.20, 1.90, and 1.55, respectively, for 2017, 2018, and 2019. The direction of change from these results to the current survey is indicated in the forecast bars above.
2.52 2.09
1.15
-3.57
-5.07
1.06
2.09 2.14 2.303.00 2.71
2.242.00 1.79 1.50
2005 2006 2007 2008 2009 2010 2011 2012 2013 2014 2015 2016 2017 2018 2019
Millions of Job
s
20-Year Avg. (1.21)
9
ULI Real Estate Consensus Forecast
Inflation, Interest Rates, and Cap Rates
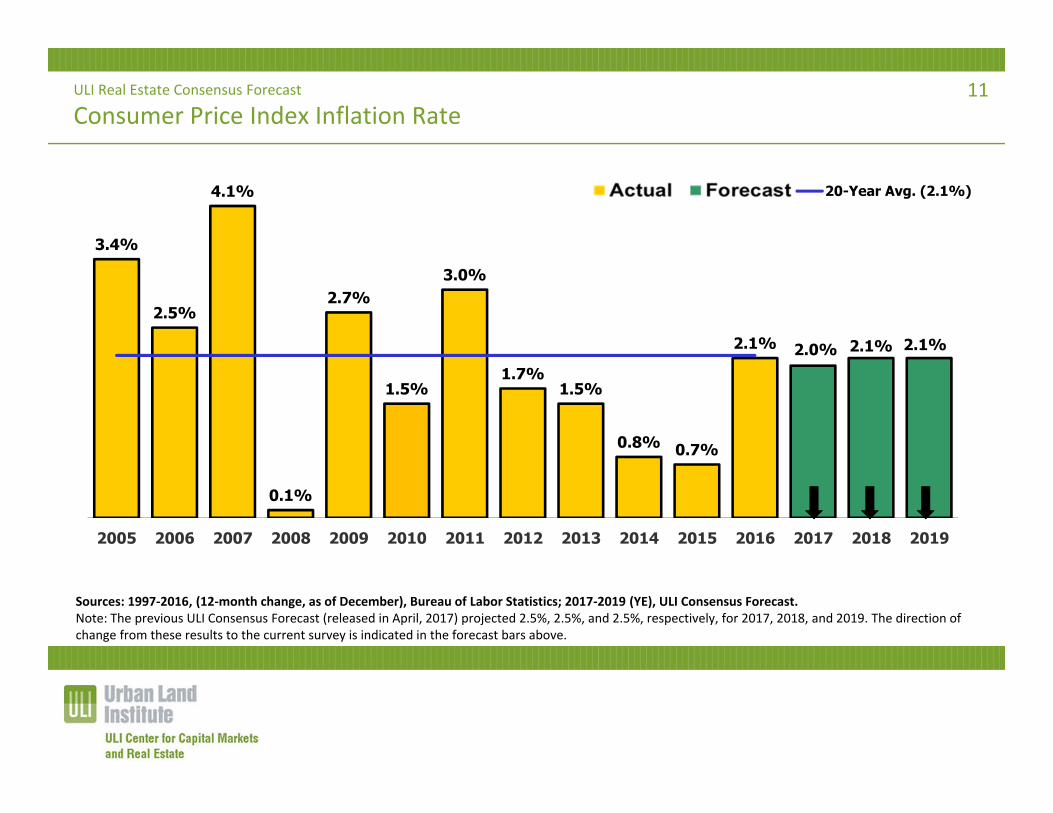
• The CPI inflation rate remained under the 20‐year average for 4 years before rebounding to the 20‐year average of 2.1% in 2016. CPI is projected to remain at about the long‐term average during the three forecast years.
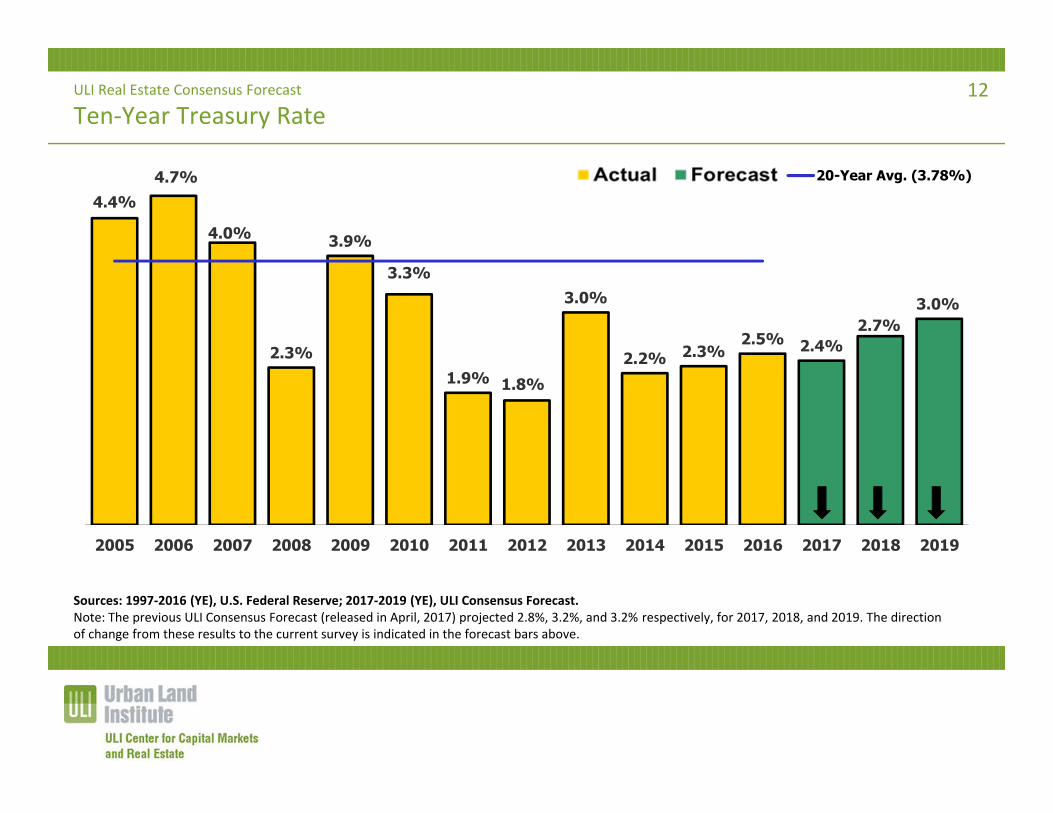
• Ten‐year treasury rates reached 2.5% by the end of 2016, but are projected to slip to 2.4% by year‐end 2017. They are then projected to rise to 2.7% in 2018 and rise again to 3.0% in 2019. These rates remain below the 20‐year average of 3.78%.
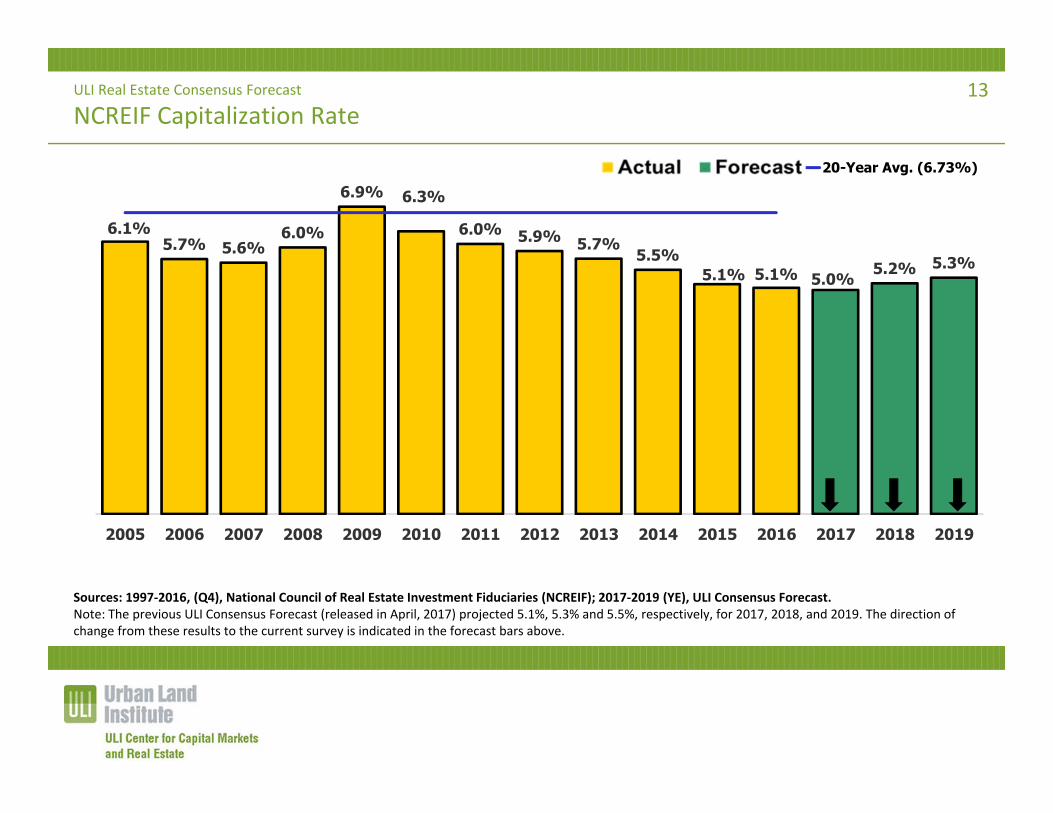
• Capitalization rates for institutional‐quality investments (NCREIF cap rates) in 2016 were 5.1%, flat from 2015. They are expected to dip to 5.0% in 2017, before inching up to 5.2% in 2018 and 5.3% in 2019.
• Compared to 6 months ago, forecasts for CPI, 10‐year treasury rates, and cap rates are lower for all three years of the forecast period.
10
ULI Real Estate Consensus Forecast
Consumer Price Index Inflation Rate
3.4%
2.5%
4.1%
0.1%
2.7%
1.5%
3.0%
1.7%1.5%
0.8% 0.7%
2.1% 2.0% 2.1% 2.1%
2005 2006 2007 2008 2009 2010 2011 2012 2013 2014 2015 2016 2017 2018 2019
20-Year Avg. (2.1%)
Sources: 1997‐2016, (12‐month change, as of December), Bureau of Labor Statistics; 2017‐2019 (YE), ULI Consensus Forecast. Note: The previous ULI Consensus Forecast (released in April, 2017) projected 2.5%, 2.5%, and 2.5%, respectively, for 2017, 2018, and 2019. The direction of change from these results to the current survey is indicated in the forecast bars above.
11
ULI Real Estate Consensus Forecast
Ten‐Year Treasury Rate
4.4%4.7%
4.0%
2.3%
3.9%
3.3%
1.9% 1.8%
3.0%
2.2% 2.3%2.5% 2.4%
2.7%3.0%
2005 2006 2007 2008 2009 2010 2011 2012 2013 2014 2015 2016 2017 2018 2019
20-Year Avg. (3.78%)
Sources: 1997‐2016 (YE), U.S. Federal Reserve; 2017‐2019 (YE), ULI Consensus Forecast. Note: The previous ULI Consensus Forecast (released in April, 2017) projected 2.8%, 3.2%, and 3.2% respectively, for 2017, 2018, and 2019. The direction of change from these results to the current survey is indicated in the forecast bars above.
12
ULI Real Estate Consensus Forecast
NCREIF Capitalization Rate
6.1%5.7% 5.6%
6.0%
6.9% 6.3%
6.0% 5.9% 5.7% 5.5%5.1% 5.1% 5.0% 5.2% 5.3%
2005 2006 2007 2008 2009 2010 2011 2012 2013 2014 2015 2016 2017 2018 2019
20-Year Avg. (6.73%)
Sources: 1997‐2016, (Q4), National Council of Real Estate Investment Fiduciaries (NCREIF); 2017‐2019 (YE), ULI Consensus Forecast. Note: The previous ULI Consensus Forecast (released in April, 2017) projected 5.1%, 5.3% and 5.5%, respectively, for 2017, 2018, and 2019. The direction of change from these results to the current survey is indicated in the forecast bars above.
13
ULI Real Estate Consensus Forecast
Real Estate Capital Markets
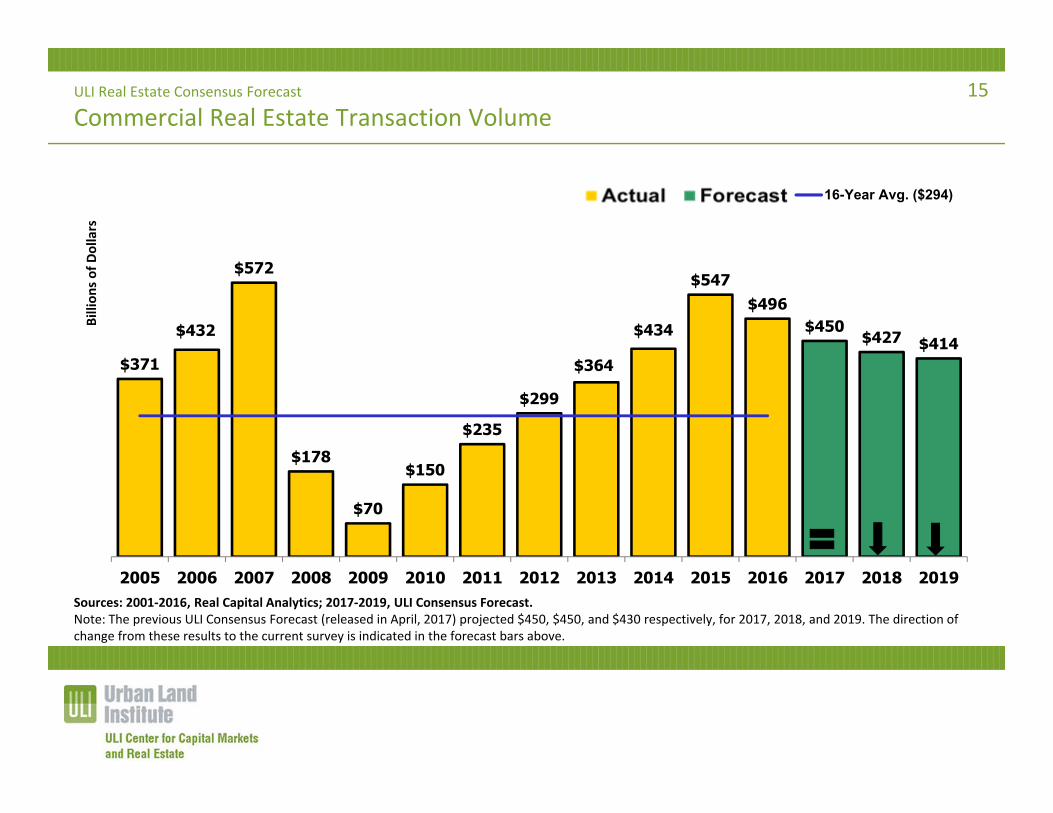
• Commercial real estate transaction volume had consistently increased for 6 years through 2015 to a post‐recession peak of $547 billion, but decreased in 2016 to $496 billion. Volume is expected to further decline in the forecast years to $450 billion in ‘17, $427 billion in ‘18, and $414 billion in ‘19. Despite these projected declines, volumes remain substantially above the 16‐year average of $294 billion, and are among some of the highest annual volumes.
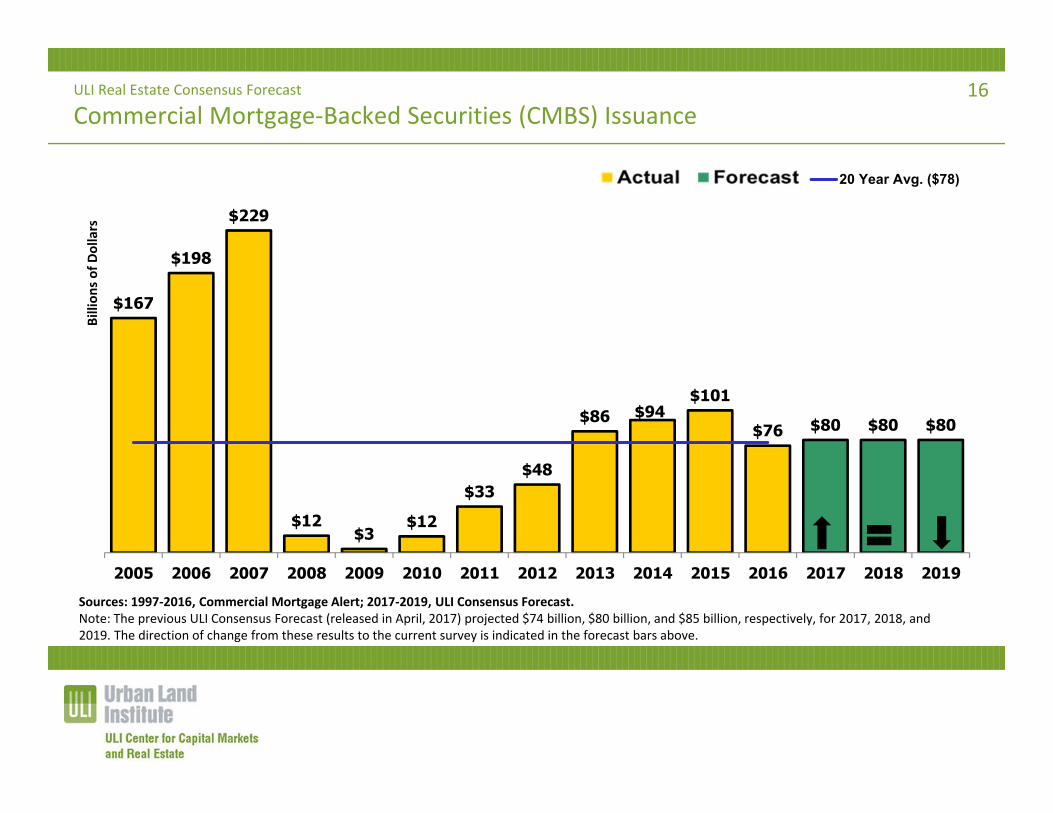
• Issuance of commercial mortgage‐backed securities (CMBS), a source of financing for commercial real estate that had rebounded consistently since ‘09, declined in 2016 to $76 billion from 2015’s $101 billion. CMBS issuance is expected to increase slightly to $80 billion in 2017, remaining at that level in both ‘18 and ‘19.
• Compared to the forecasts of 6 months ago, the current forecasts for transactions is unchanged for ‘17 but lower in ’18 and ‘19, while CMBS issuance is on average unchanged over the three forecast years.
14
ULI Real Estate Consensus Forecast
Commercial Real Estate Transaction Volume
$371
$432
$572
$178
$70
$150
$235
$299
$364
$434
$547$496
$450 $427 $414
2005 2006 2007 2008 2009 2010 2011 2012 2013 2014 2015 2016 2017 2018 2019
Billion
s of D
ollars
16-Year Avg. ($294)
Sources: 2001‐2016, Real Capital Analytics; 2017‐2019, ULI Consensus Forecast. Note: The previous ULI Consensus Forecast (released in April, 2017) projected $450, $450, and $430 respectively, for 2017, 2018, and 2019. The direction of change from these results to the current survey is indicated in the forecast bars above.
15
ULI Real Estate Consensus Forecast
Commercial Mortgage‐Backed Securities (CMBS) Issuance
Sources: 1997‐2016, Commercial Mortgage Alert; 2017‐2019, ULI Consensus Forecast. Note: The previous ULI Consensus Forecast (released in April, 2017) projected $74 billion, $80 billion, and $85 billion, respectively, for 2017, 2018, and 2019. The direction of change from these results to the current survey is indicated in the forecast bars above.
16
$167
$198
$229
$12$3
$12
$33$48
$86 $94$101
$76 $80 $80 $80
2005 2006 2007 2008 2009 2010 2011 2012 2013 2014 2015 2016 2017 2018 2019
Billion
s of D
ollars
20 Year Avg. ($78)
ULI Real Estate Consensus Forecast
Real Estate Returns and Prices
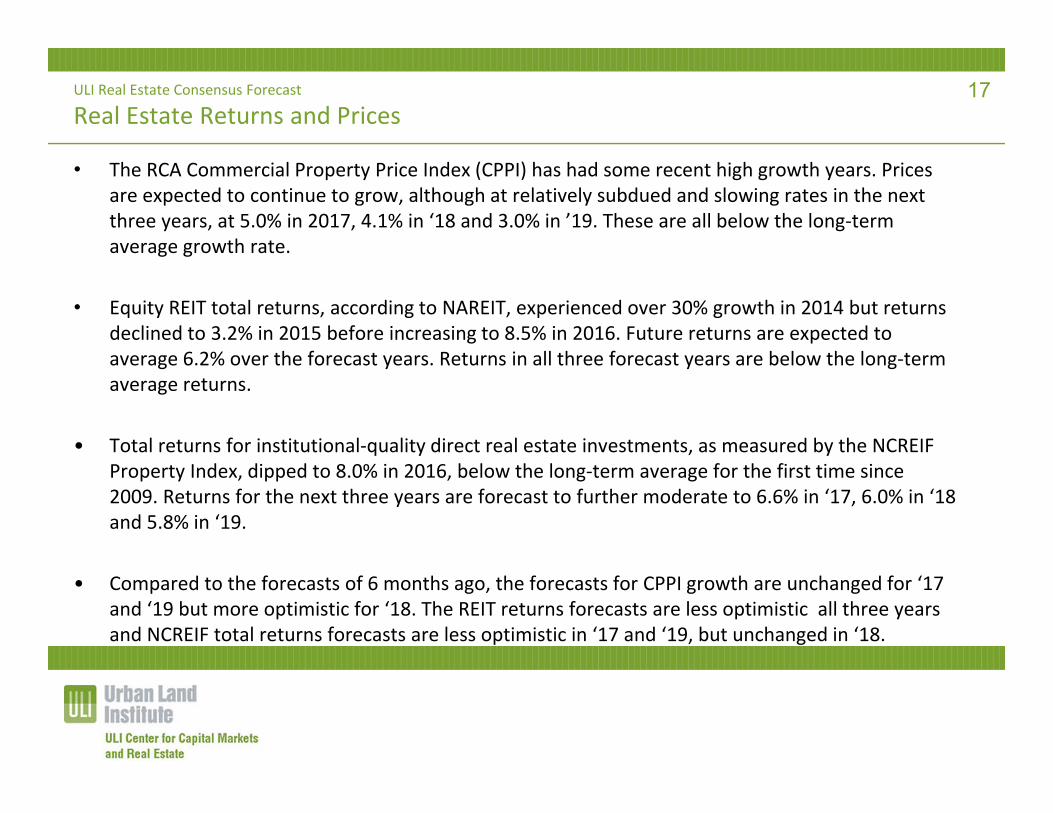
• The RCA Commercial Property Price Index (CPPI) has had some recent high growth years. Prices are expected to continue to grow, although at relatively subdued and slowing rates in the next three years, at 5.0% in 2017, 4.1% in ‘18 and 3.0% in ’19. These are all below the long‐term average growth rate.
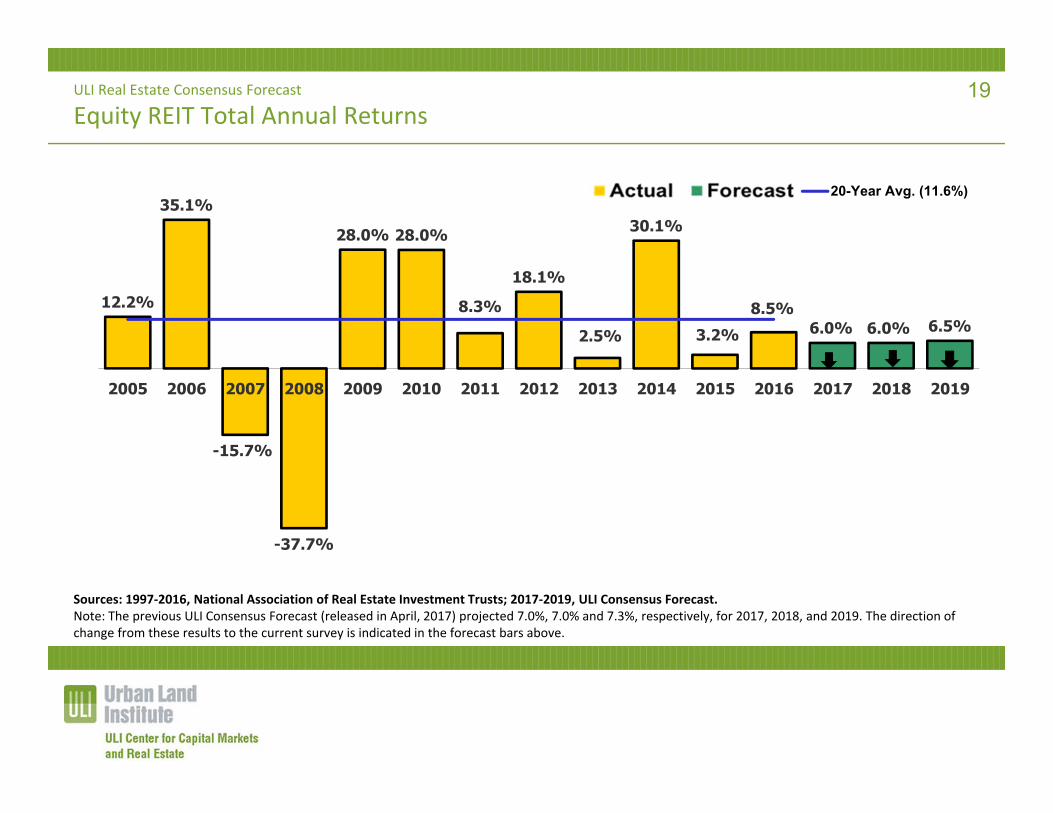
• Equity REIT total returns, according to NAREIT, experienced over 30% growth in 2014 but returns declined to 3.2% in 2015 before increasing to 8.5% in 2016. Future returns are expected to average 6.2% over the forecast years. Returns in all three forecast years are below the long‐term average returns.
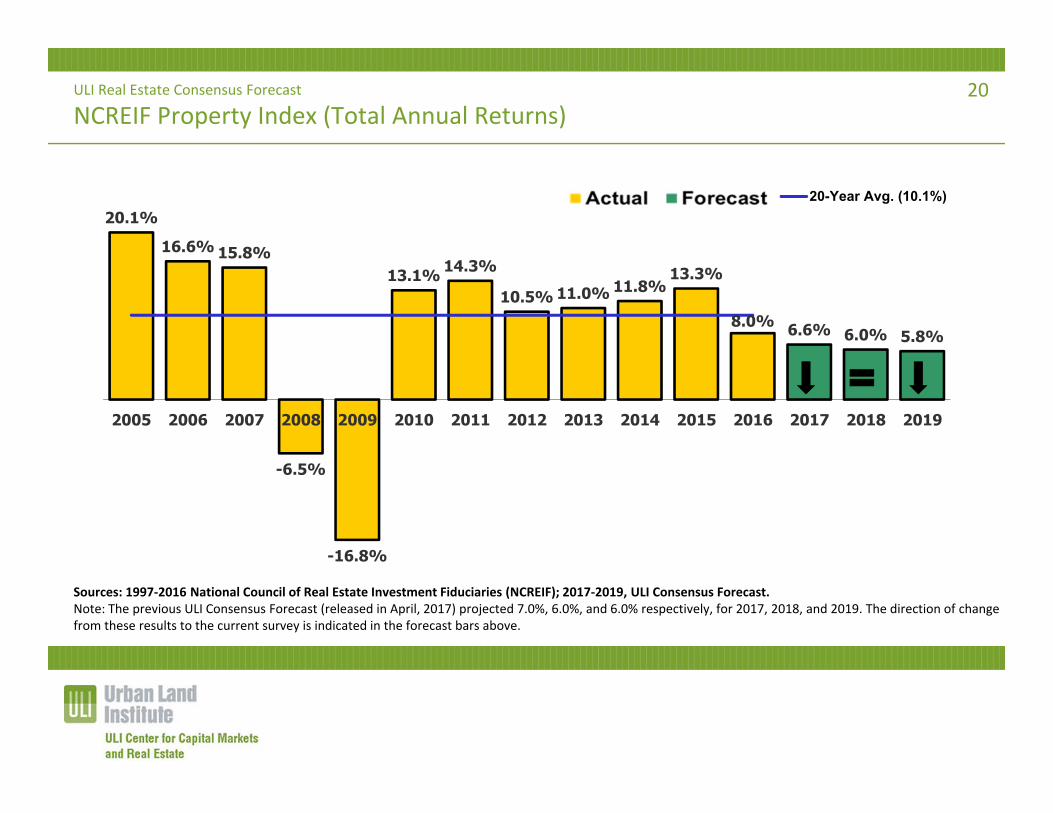
• Total returns for institutional‐quality direct real estate investments, as measured by the NCREIF Property Index, dipped to 8.0% in 2016, below the long‐term average for the first time since 2009. Returns for the next three years are forecast to further moderate to 6.6% in ‘17, 6.0% in ‘18 and 5.8% in ‘19.
• Compared to the forecasts of 6 months ago, the forecasts for CPPI growth are unchanged for ‘17 and ‘19 but more optimistic for ‘18. The REIT returns forecasts are less optimistic all three years and NCREIF total returns forecasts are less optimistic in ‘17 and ‘19, but unchanged in ‘18.
17

ULI Real Estate Consensus Forecast
RCA Commercial Property Price Index (annual change)
18.1%
6.2%8.7%
-18.4%
-25.5%
8.3% 7.9% 7.8%
14.7% 16.3%
11.1%7.7%
5.0% 4.1% 3.0%
2005 2006 2007 2008 2009 2010 2011 2012 2013 2014 2015 2016 2017 2018 2019
15-Year Avg. (5.6%)
Sources: 2001‐2016, Moody’s and Real Capital Analytics; 2017‐2019, ULI Consensus Forecast.Note: The previous ULI Consensus Forecast (released in April, 2017) projected 5.0%, 3.5%, and 3.0%, respectively, for 2017, 2018, and 2019. The direction of change from these results to the current survey is indicated in the forecast bars above.
18
ULI Real Estate Consensus Forecast
Equity REIT Total Annual Returns
12.2%
35.1%
-15.7%
-37.7%
28.0% 28.0%
8.3%
18.1%
2.5%
30.1%
3.2%8.5%
6.0% 6.0% 6.5%
2005 2006 2007 2008 2009 2010 2011 2012 2013 2014 2015 2016 2017 2018 2019
20-Year Avg. (11.6%)
Sources: 1997‐2016, National Association of Real Estate Investment Trusts; 2017‐2019, ULI Consensus Forecast. Note: The previous ULI Consensus Forecast (released in April, 2017) projected 7.0%, 7.0% and 7.3%, respectively, for 2017, 2018, and 2019. The direction of change from these results to the current survey is indicated in the forecast bars above.
19
ULI Real Estate Consensus Forecast
NCREIF Property Index (Total Annual Returns)
20.1%
16.6% 15.8%
-6.5%
-16.8%
13.1% 14.3%
10.5% 11.0% 11.8%13.3%
8.0% 6.6% 6.0% 5.8%
2005 2006 2007 2008 2009 2010 2011 2012 2013 2014 2015 2016 2017 2018 2019
20-Year Avg. (10.1%)
Sources: 1997‐2016 National Council of Real Estate Investment Fiduciaries (NCREIF); 2017‐2019, ULI Consensus Forecast. Note: The previous ULI Consensus Forecast (released in April, 2017) projected 7.0%, 6.0%, and 6.0% respectively, for 2017, 2018, and 2019. The direction of change from these results to the current survey is indicated in the forecast bars above.
20
ULI Real Estate Consensus Forecast
NCREIF Returns by Property Type
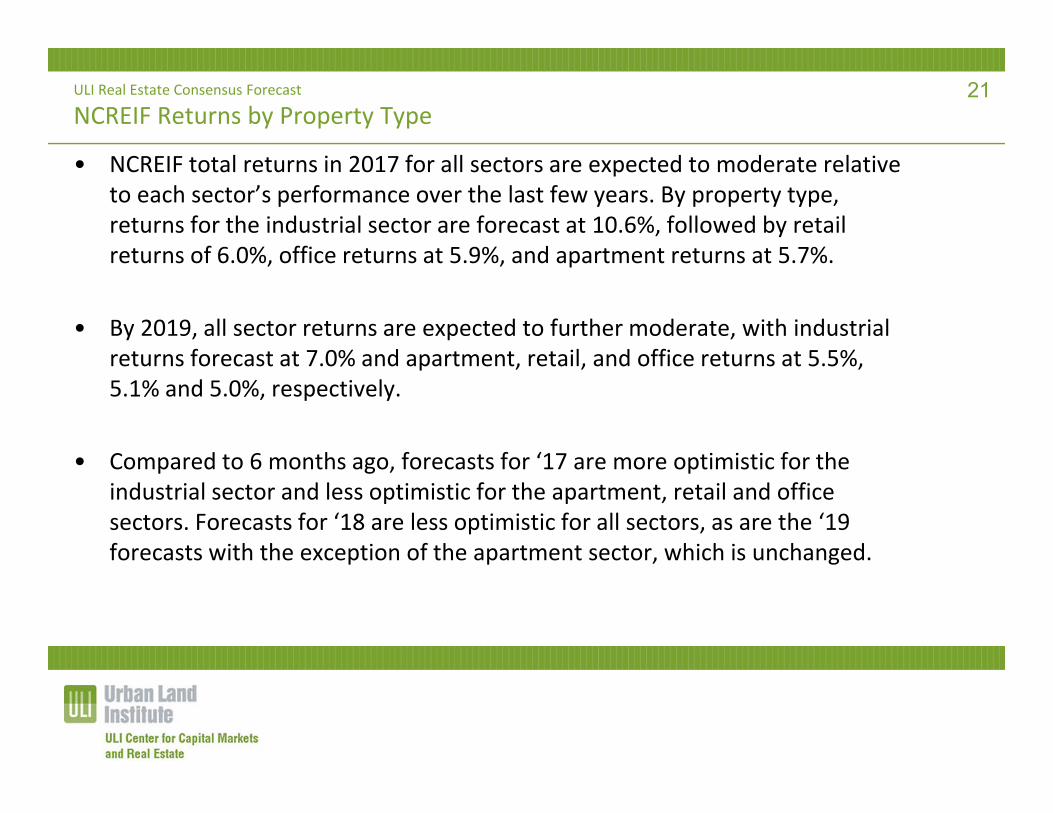
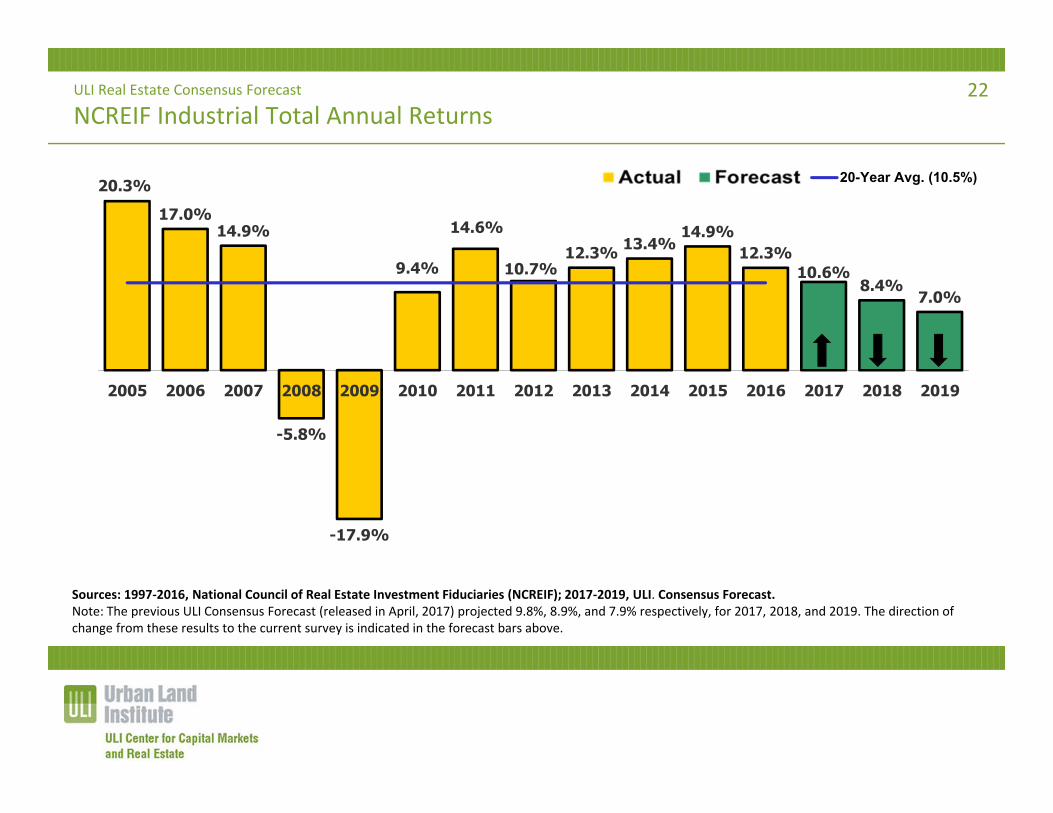
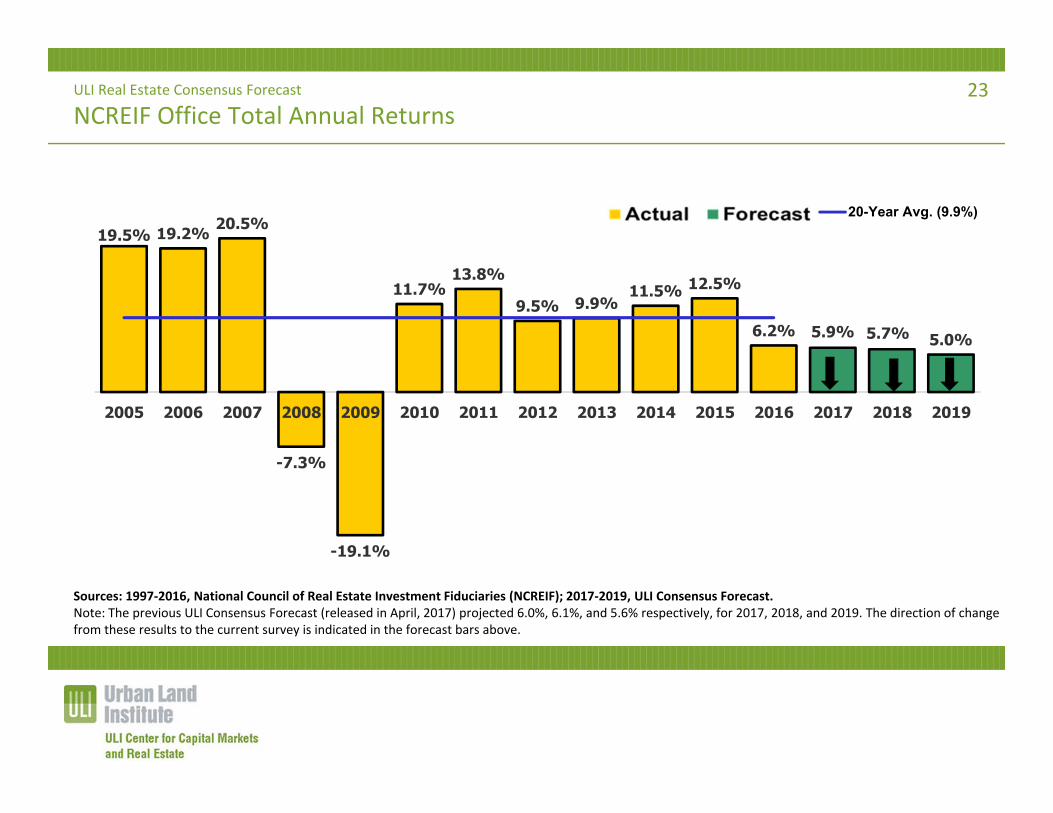
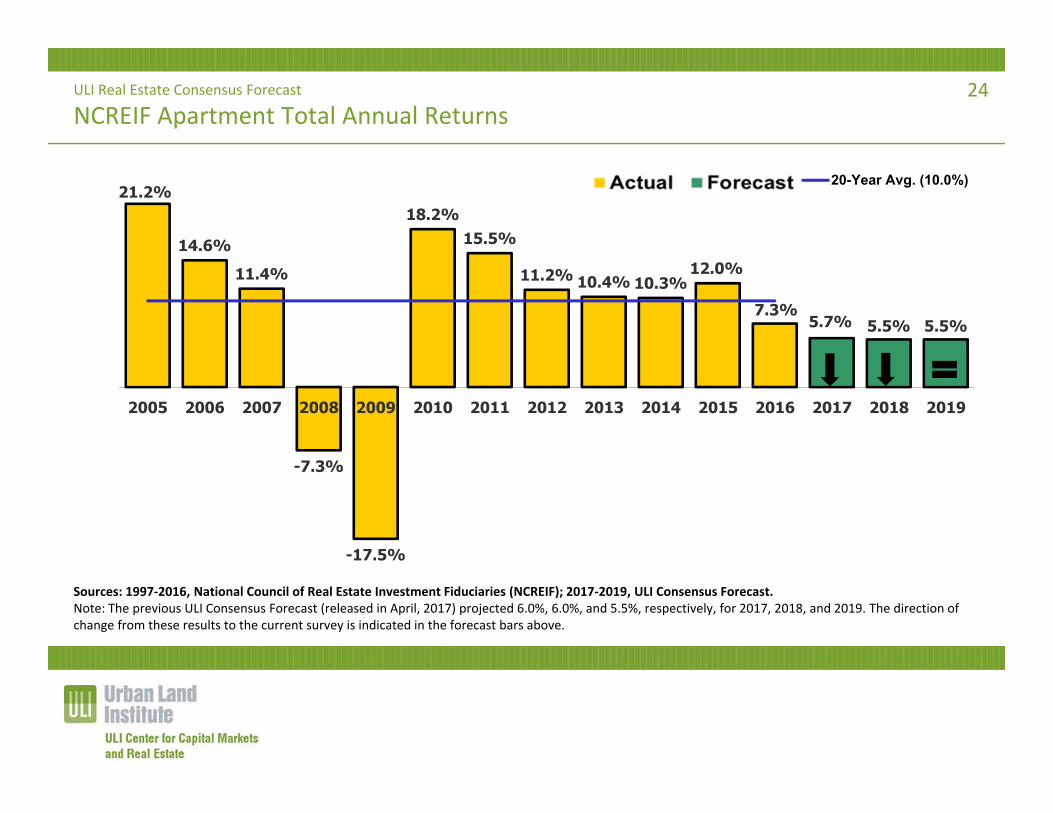
• NCREIF total returns in 2017 for all sectors are expected to moderate relative to each sector’s performance over the last few years. By property type, returns for the industrial sector are forecast at 10.6%, followed by retail returns of 6.0%, office returns at 5.9%, and apartment returns at 5.7%.
• By 2019, all sector returns are expected to further moderate, with industrial returns forecast at 7.0% and apartment, retail, and office returns at 5.5%, 5.1% and 5.0%, respectively.
• Compared to 6 months ago, forecasts for ‘17 are more optimistic for the industrial sector and less optimistic for the apartment, retail and office sectors. Forecasts for ‘18 are less optimistic for all sectors, as are the ‘19 forecasts with the exception of the apartment sector, which is unchanged.
21
ULI Real Estate Consensus Forecast
NCREIF Industrial Total Annual Returns
20.3%17.0%
14.9%
-5.8%
-17.9%
9.4%
14.6%
10.7%12.3% 13.4%
14.9%12.3%
10.6%8.4%
7.0%
2005 2006 2007 2008 2009 2010 2011 2012 2013 2014 2015 2016 2017 2018 2019
20-Year Avg. (10.5%)
Sources: 1997‐2016, National Council of Real Estate Investment Fiduciaries (NCREIF); 2017‐2019, ULI. Consensus Forecast. Note: The previous ULI Consensus Forecast (released in April, 2017) projected 9.8%, 8.9%, and 7.9% respectively, for 2017, 2018, and 2019. The direction of change from these results to the current survey is indicated in the forecast bars above.
22
ULI Real Estate Consensus Forecast
NCREIF Office Total Annual Returns
19.5% 19.2% 20.5%
-7.3%
-19.1%
11.7%13.8%
9.5% 9.9%11.5% 12.5%
6.2% 5.9% 5.7% 5.0%
2005 2006 2007 2008 2009 2010 2011 2012 2013 2014 2015 2016 2017 2018 2019
20-Year Avg. (9.9%)
Sources: 1997‐2016, National Council of Real Estate Investment Fiduciaries (NCREIF); 2017‐2019, ULI Consensus Forecast.Note: The previous ULI Consensus Forecast (released in April, 2017) projected 6.0%, 6.1%, and 5.6% respectively, for 2017, 2018, and 2019. The direction of change from these results to the current survey is indicated in the forecast bars above.
23
ULI Real Estate Consensus Forecast
NCREIF Apartment Total Annual Returns
21.2%
14.6%11.4%
-7.3%
-17.5%
18.2%15.5%
11.2% 10.4% 10.3%12.0%
7.3%5.7% 5.5% 5.5%
2005 2006 2007 2008 2009 2010 2011 2012 2013 2014 2015 2016 2017 2018 2019
20-Year Avg. (10.0%)
Sources: 1997‐2016, National Council of Real Estate Investment Fiduciaries (NCREIF); 2017‐2019, ULI Consensus Forecast. Note: The previous ULI Consensus Forecast (released in April, 2017) projected 6.0%, 6.0%, and 5.5%, respectively, for 2017, 2018, and 2019. The direction of change from these results to the current survey is indicated in the forecast bars above.
24

ULI Real Estate Consensus Forecast
NCREIF Retail Total Annual Returns
20.0%
13.4% 13.5%
-4.1%
-10.9%
12.6% 13.8%11.6%
12.9% 13.1%15.3%
9.0%6.0% 5.5% 5.1%
2005 2006 2007 2008 2009 2010 2011 2012 2013 2014 2015 2016 2017 2018 2019
20-Year Avg. (11.0%)
Sources: 1997‐2016, National Council of Real Estate Investment Fiduciaries (NCREIF); 2017‐2019, ULI Consensus Forecast. Note: The previous ULI Consensus Forecast (released in April, 2017) projected 7.0%, 6.2%, and 6.0%, respectively, for 2017, 2018, and 2019. The direction of change from these results to the current survey is indicated in the forecast bars above.
25
ULI Real Estate Consensus Forecast
Industrial/Warehouse Sector Fundamentals
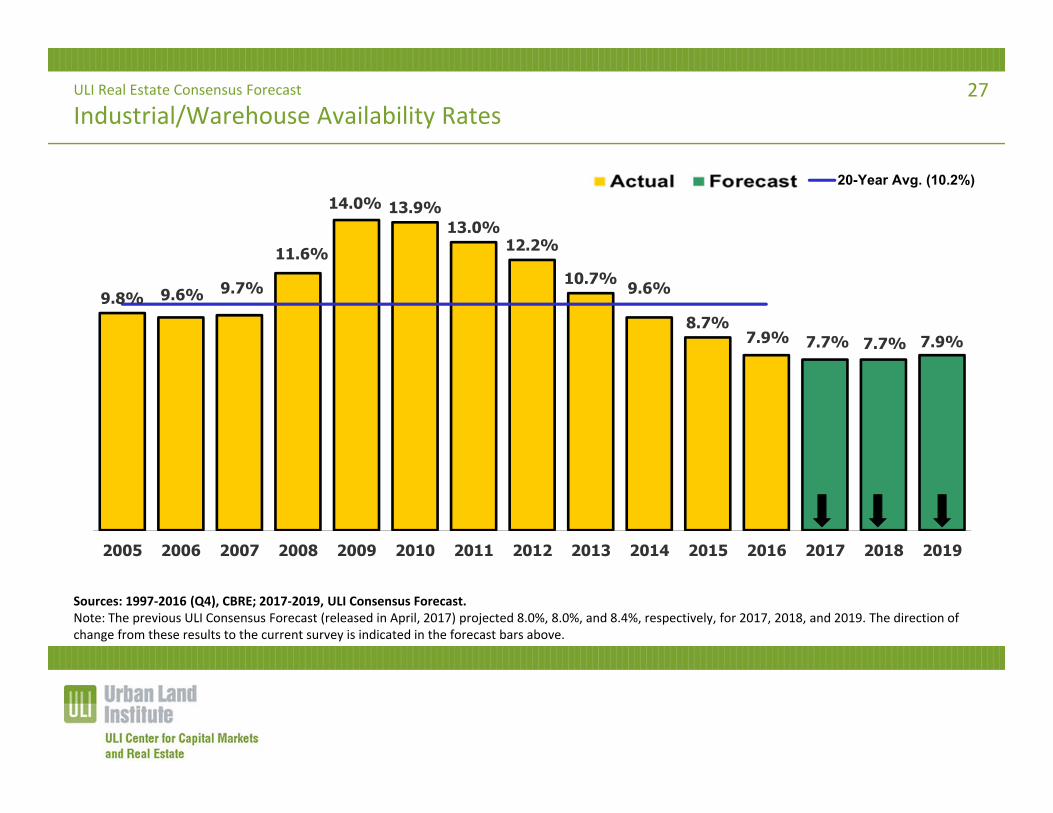
• The availability rate for the industrial/warehouse sector continued its seven‐year decline in 2016, ending at 7.9%. Availability rates are expected to further decline in 2017, with year‐end vacancy rates at 7.7%, where it will remain in ‘18 before increasing slightly back to 7.9%. Rates in all three forecast years are projected to remain well below the 20‐year average.
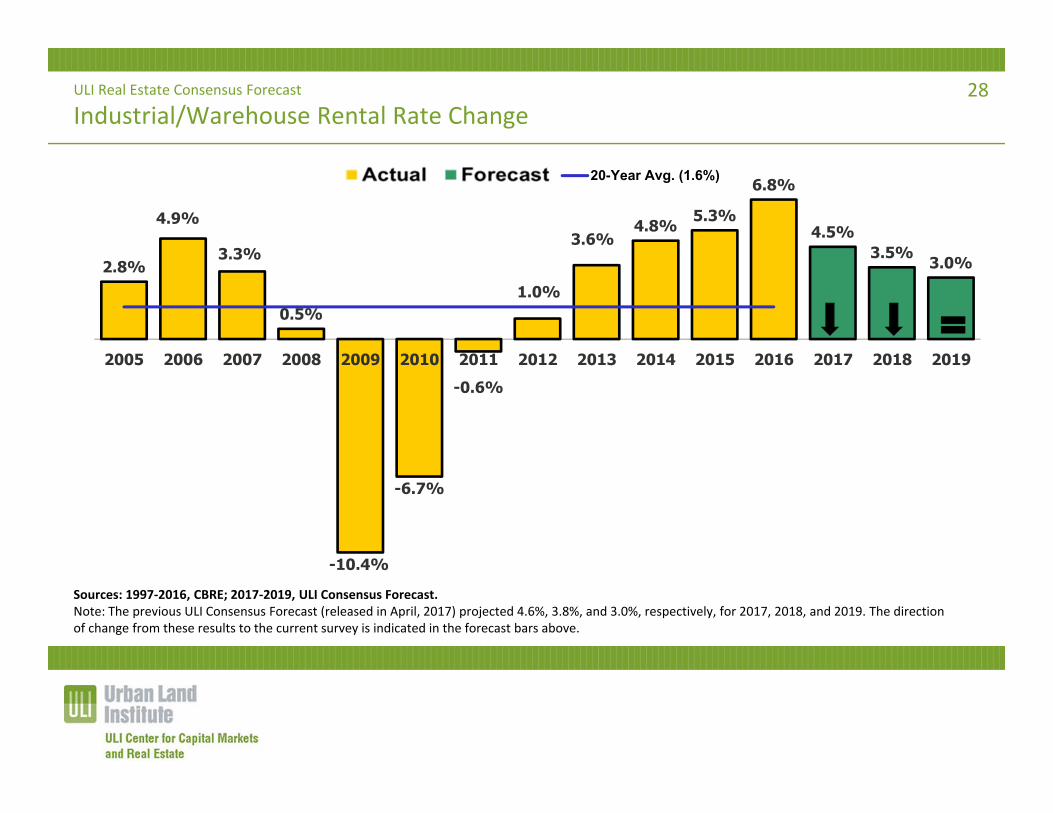
• Warehouse rental rates have shown positive growth for the past five years, with growth in the last four years substantially above the long‐term average. Forecasts are for healthy but moderating rental rate growth with increases of 4.5% in 2017, 3.5% in 2018, and 3.0% in 2019, still remaining above the 20‐year average growth rate.
• The forecasts for industrial/warehouse availability rates in ‘17, ‘18, and ‘19 are all more optimistic than the forecast from six months ago. Forecasts for rental growth rates are less optimistic in ‘17 and ’18, and unchanged for ‘19.
26
ULI Real Estate Consensus Forecast
Industrial/Warehouse Availability Rates
9.8% 9.6% 9.7%
11.6%
14.0% 13.9%13.0%
12.2%
10.7% 9.6%
8.7%7.9% 7.7% 7.7% 7.9%
2005 2006 2007 2008 2009 2010 2011 2012 2013 2014 2015 2016 2017 2018 2019
20-Year Avg. (10.2%)
Sources: 1997‐2016 (Q4), CBRE; 2017‐2019, ULI Consensus Forecast. Note: The previous ULI Consensus Forecast (released in April, 2017) projected 8.0%, 8.0%, and 8.4%, respectively, for 2017, 2018, and 2019. The direction of change from these results to the current survey is indicated in the forecast bars above.
27
ULI Real Estate Consensus Forecast
Industrial/Warehouse Rental Rate Change
2.8%
4.9%
3.3%
0.5%
-10.4%
-6.7%
-0.6%
1.0%
3.6%4.8% 5.3%
6.8%
4.5%3.5% 3.0%
2005 2006 2007 2008 2009 2010 2011 2012 2013 2014 2015 2016 2017 2018 2019
20-Year Avg. (1.6%)
Sources: 1997‐2016, CBRE; 2017‐2019, ULI Consensus Forecast. Note: The previous ULI Consensus Forecast (released in April, 2017) projected 4.6%, 3.8%, and 3.0%, respectively, for 2017, 2018, and 2019. The direction of change from these results to the current survey is indicated in the forecast bars above.
28
ULI Real Estate Consensus Forecast
Apartment Sector Fundamentals
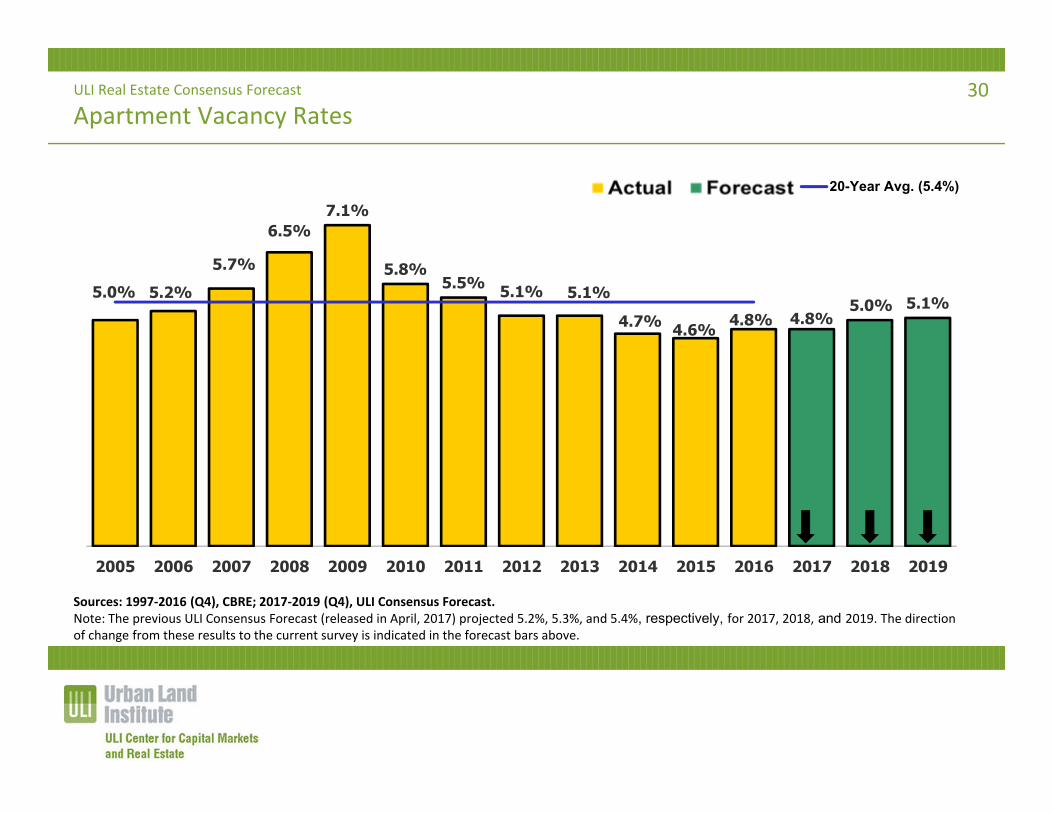
• Even with continued strong construction activity, the apartment sector has performed very well the past several years. Vacancy rates decreased from 7.1% in 2009 to 4.6% in 2015, before a slight uptick to 4.8% in 2016, still remaining below the 20‐year average. Vacancy rates are expected to remain at 4.8% in ‘17, before moving upward to 5.0% in ‘18 and 5.1% in ‘19.
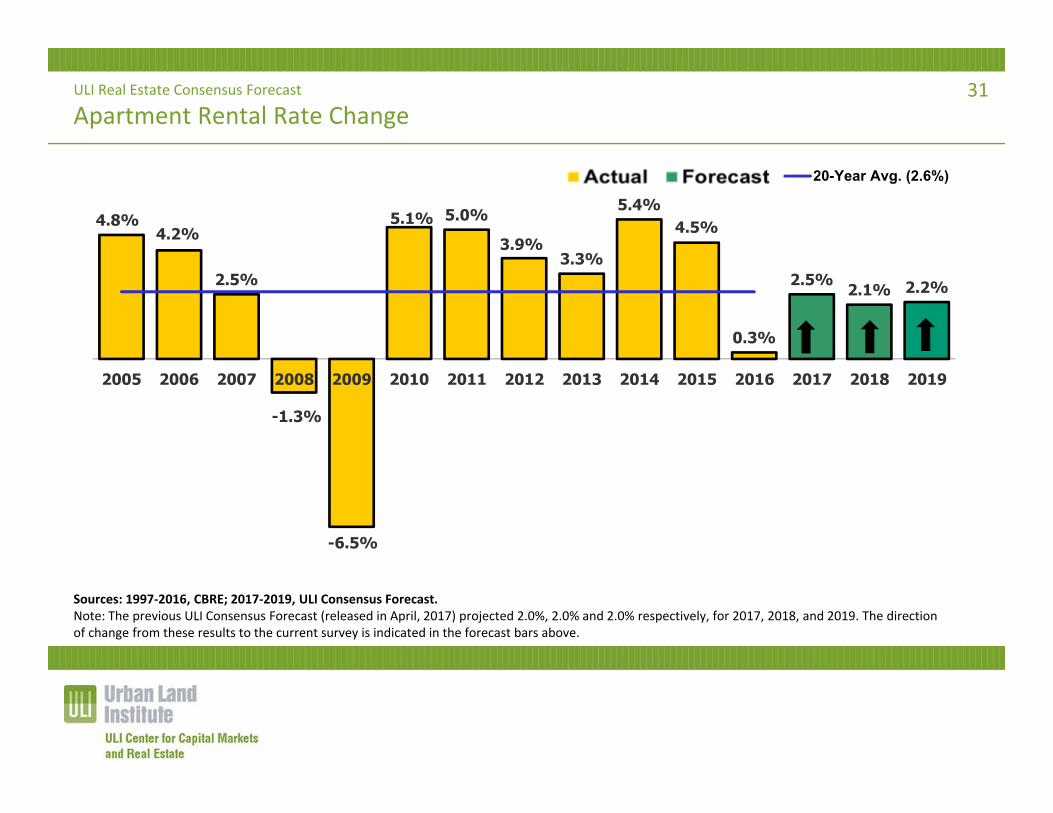
• Apartment rental rate growth slowed significantly in 2016, growing just 0.3% after 6 straight years of growth over 3%. Rental rate growth is expected to jump back up to 2.5% in ’17, before moderating to 2.1% in ‘18 and 2.2% in ‘19.
• Compared to 6 months ago, the forecasts for both vacancy rates and rental rate growth are more optimistic for all 3 years.
29
ULI Real Estate Consensus Forecast
Apartment Vacancy Rates
5.0% 5.2%5.7%
6.5%7.1%
5.8%5.5% 5.1% 5.1%
4.7% 4.6% 4.8% 4.8%5.0% 5.1%
2005 2006 2007 2008 2009 2010 2011 2012 2013 2014 2015 2016 2017 2018 2019
20-Year Avg. (5.4%)
Sources: 1997‐2016 (Q4), CBRE; 2017‐2019 (Q4), ULI Consensus Forecast. Note: The previous ULI Consensus Forecast (released in April, 2017) projected 5.2%, 5.3%, and 5.4%, respectively, for 2017, 2018, and 2019. The direction of change from these results to the current survey is indicated in the forecast bars above.
30
ULI Real Estate Consensus Forecast
Apartment Rental Rate Change
4.8%4.2%
2.5%
-1.3%
-6.5%
5.1% 5.0%
3.9%3.3%
5.4%4.5%
0.3%
2.5% 2.1% 2.2%
2005 2006 2007 2008 2009 2010 2011 2012 2013 2014 2015 2016 2017 2018 2019
20-Year Avg. (2.6%)
Sources: 1997‐2016, CBRE; 2017‐2019, ULI Consensus Forecast. Note: The previous ULI Consensus Forecast (released in April, 2017) projected 2.0%, 2.0% and 2.0% respectively, for 2017, 2018, and 2019. The direction of change from these results to the current survey is indicated in the forecast bars above.
31
ULI Real Estate Consensus Forecast
Office Sector Fundamentals
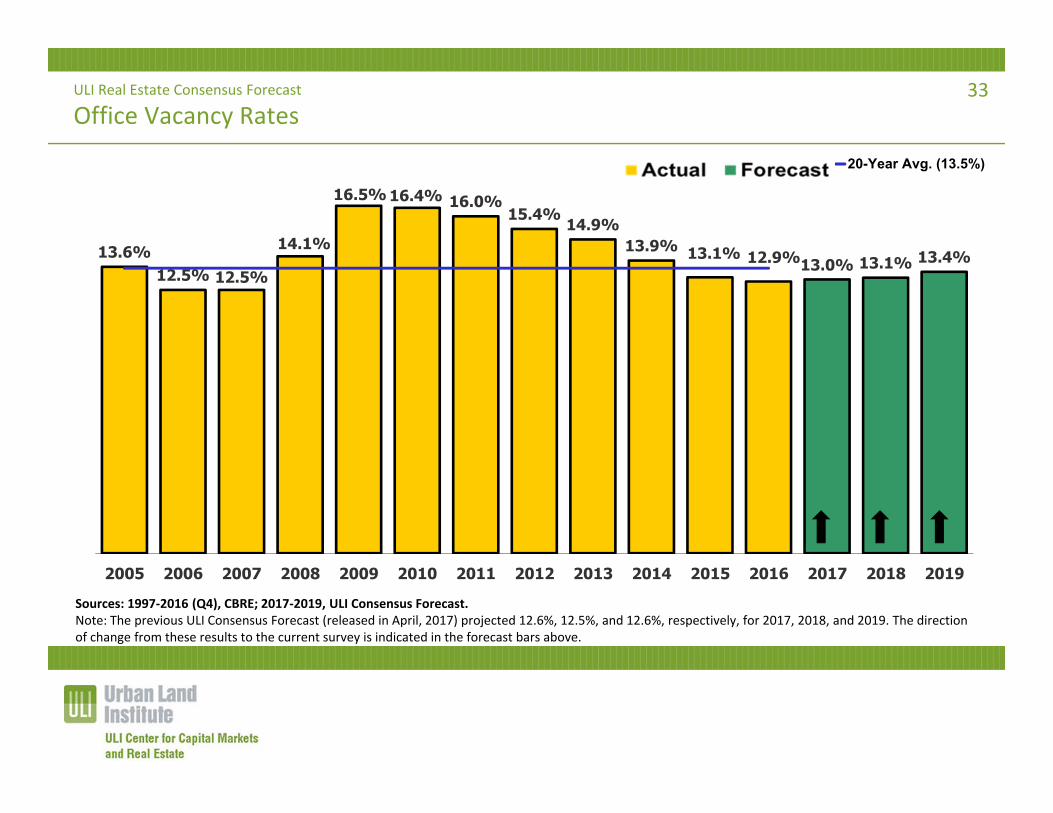
• Office vacancy rates declined for the seventh straight year in 2016 to 12.9%, the lowest they have been since 2007. Rates are forecast to tick back up to 13.0% in 2017 and then climb to 13.1% in 2018 and 13.4% in 2019.
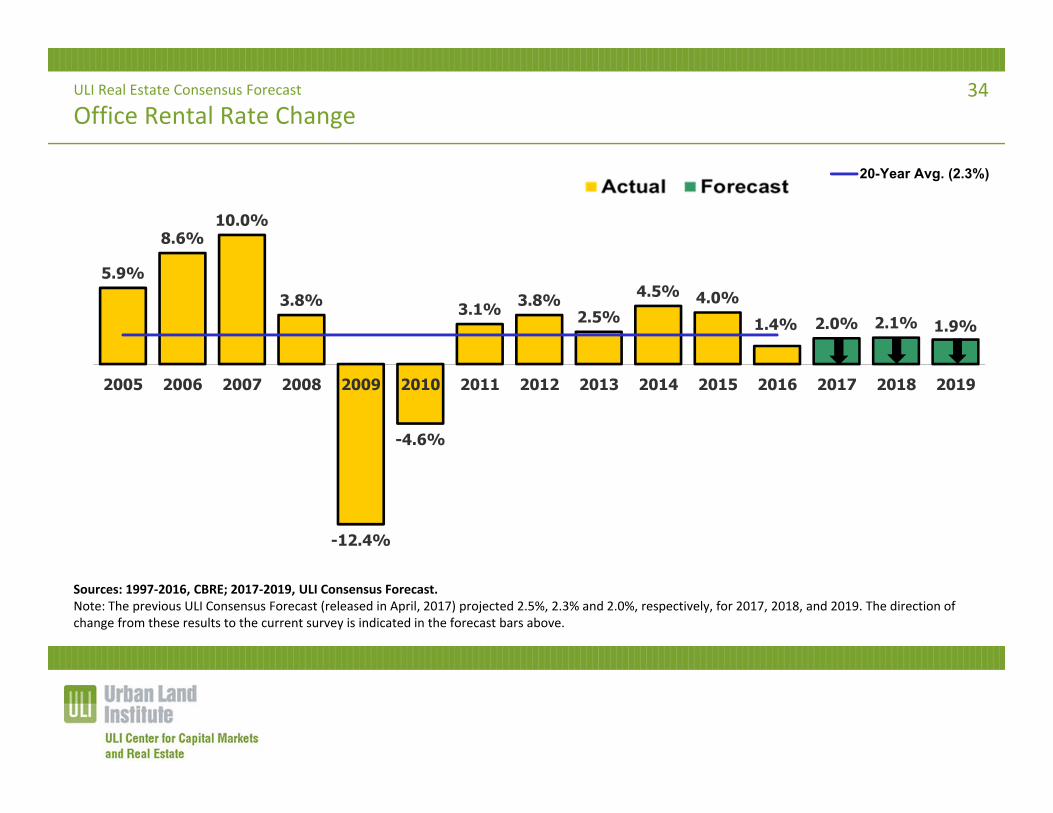
• Office rental rates increased 1.4% in 2016, a significant drop‐off from the 4.0% increase in 2015. Rental rate growth is expected to recover to 2.0% in 2017, and then hold steady at 2.1% in ’18 and 1.9% in ‘19. All three years are forecast to be below the long‐term average of 2.3% growth.
• Compared to 6 months ago, the forecasts for both office vacancy rates and office rental rate growth are less optimistic for all three years.
32
ULI Real Estate Consensus Forecast
Office Vacancy Rates
13.6%12.5% 12.5%
14.1%
16.5% 16.4% 16.0%15.4% 14.9%
13.9% 13.1% 12.9%13.0% 13.1% 13.4%
2005 2006 2007 2008 2009 2010 2011 2012 2013 2014 2015 2016 2017 2018 2019
20-Year Avg. (13.5%)
Sources: 1997‐2016 (Q4), CBRE; 2017‐2019, ULI Consensus Forecast. Note: The previous ULI Consensus Forecast (released in April, 2017) projected 12.6%, 12.5%, and 12.6%, respectively, for 2017, 2018, and 2019. The direction of change from these results to the current survey is indicated in the forecast bars above.
33
ULI Real Estate Consensus Forecast
Office Rental Rate Change
5.9%
8.6%10.0%
3.8%
-12.4%
-4.6%
3.1% 3.8%2.5%
4.5% 4.0%1.4% 2.0% 2.1% 1.9%
2005 2006 2007 2008 2009 2010 2011 2012 2013 2014 2015 2016 2017 2018 2019
20-Year Avg. (2.3%)
Sources: 1997‐2016, CBRE; 2017‐2019, ULI Consensus Forecast.Note: The previous ULI Consensus Forecast (released in April, 2017) projected 2.5%, 2.3% and 2.0%, respectively, for 2017, 2018, and 2019. The direction of change from these results to the current survey is indicated in the forecast bars above.
34
ULI Real Estate Consensus Forecast
Retail Sector Fundamentals
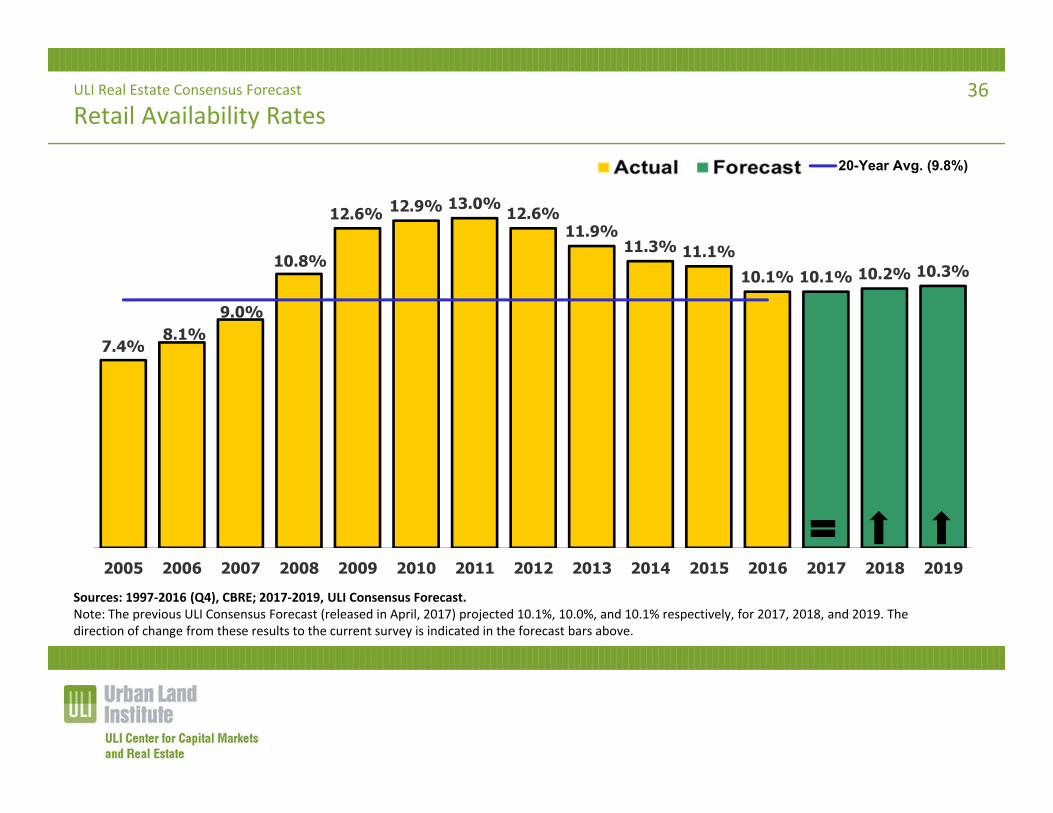
• Retail availability rates have been on a steady decline from a peak of 13.0% in 2011 to 10.1% in 2016. The forecast anticipates a plateau in ‘17 at 10.1%, before ticking up to 10.2% in ‘18 and 10.3% in ‘19. All these rates remain above the 20‐year average.
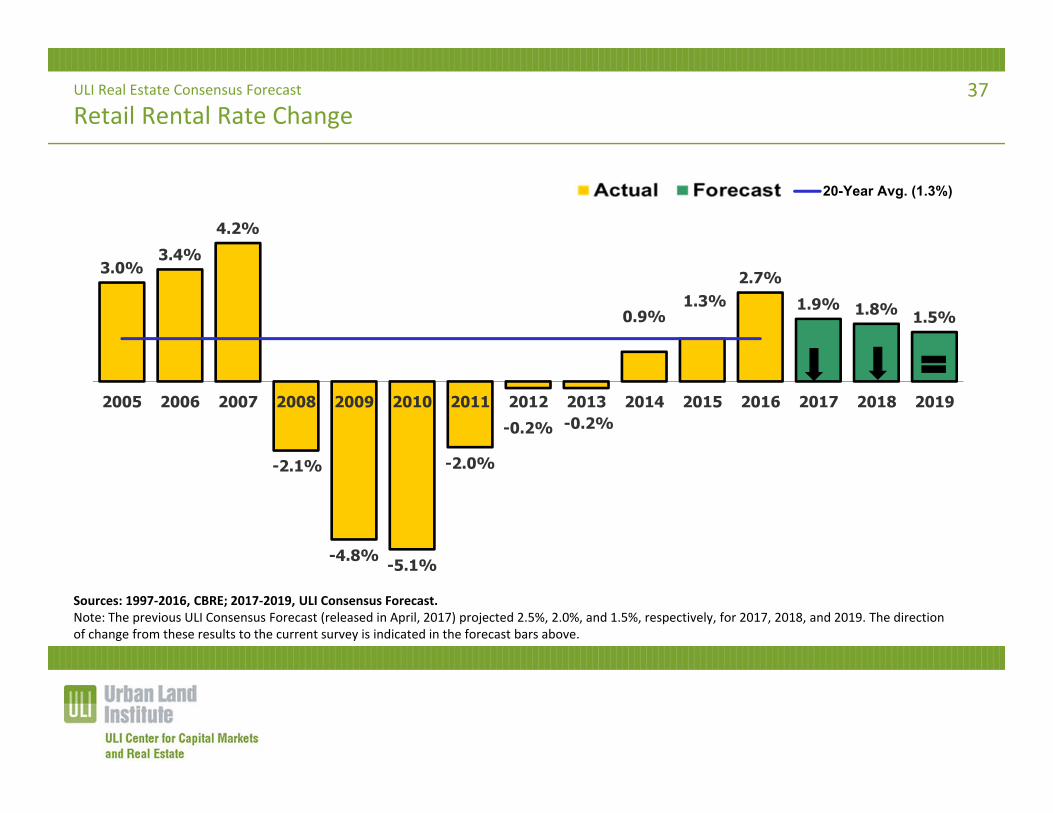
• Retail rental rate growth was positive for the first time in seven years in 2014 and continued to be positive in 2015 and 2016, when it reached 2.7%. The forecast expects growth to steadily moderate from this post‐recession peak to 1.9% in ‘17, 1.8% in ‘18, and 1.5% in ‘19.
• Compared to 6 months ago, the forecast for retail availability rates is unchanged in ’17, but slightly less optimistic for ‘18 and ‘19. The retail rental rate growth forecast is less optimistic for both 2017 and 2018, but unchanged for ‘19.
35
ULI Real Estate Consensus Forecast
Retail Availability Rates
7.4%8.1%
9.0%
10.8%
12.6% 12.9% 13.0% 12.6%11.9%
11.3% 11.1%10.1% 10.1% 10.2% 10.3%
2005 2006 2007 2008 2009 2010 2011 2012 2013 2014 2015 2016 2017 2018 2019
20-Year Avg. (9.8%)
Sources: 1997‐2016 (Q4), CBRE; 2017‐2019, ULI Consensus Forecast.Note: The previous ULI Consensus Forecast (released in April, 2017) projected 10.1%, 10.0%, and 10.1% respectively, for 2017, 2018, and 2019. The direction of change from these results to the current survey is indicated in the forecast bars above.
36
ULI Real Estate Consensus Forecast
Retail Rental Rate Change
3.0%3.4%
4.2%
-2.1%
-4.8% -5.1%
-2.0%
-0.2% -0.2%
0.9%1.3%
2.7%1.9% 1.8% 1.5%
2005 2006 2007 2008 2009 2010 2011 2012 2013 2014 2015 2016 2017 2018 2019
20-Year Avg. (1.3%)
Sources: 1997‐2016, CBRE; 2017‐2019, ULI Consensus Forecast. Note: The previous ULI Consensus Forecast (released in April, 2017) projected 2.5%, 2.0%, and 1.5%, respectively, for 2017, 2018, and 2019. The direction of change from these results to the current survey is indicated in the forecast bars above.
37
ULI Real Estate Consensus Forecast
Hotel Sector Fundamentals
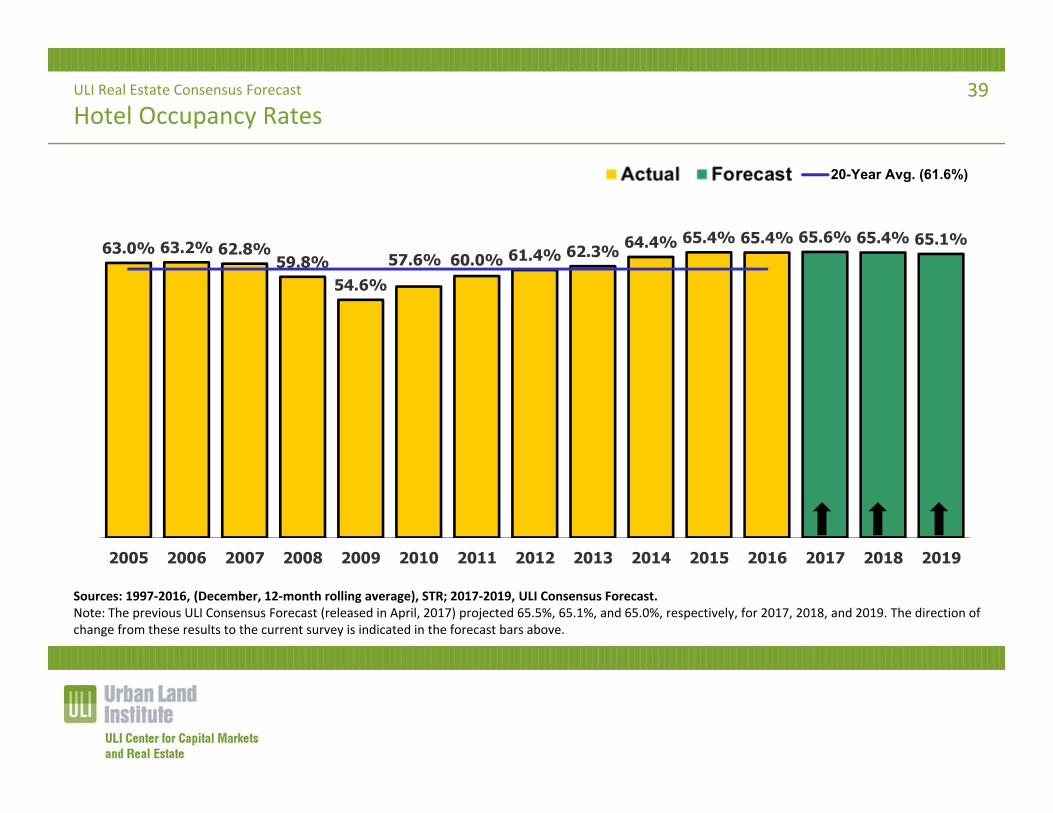
• Hotel occupancy rates, according to STR, have been steadily improving since reaching a recession low of 54.6% in 2009. Occupancy rates surpassed the twenty‐year average in 2013 at 62.3% and came in at 65.4% in 2016. Rates are forecast to remain strong over the forecast years, increasing slightly to a post‐recession high 65.6% in 2017, before returning to 65.4% in ‘18 and decreasing to 65.1% in ‘19.
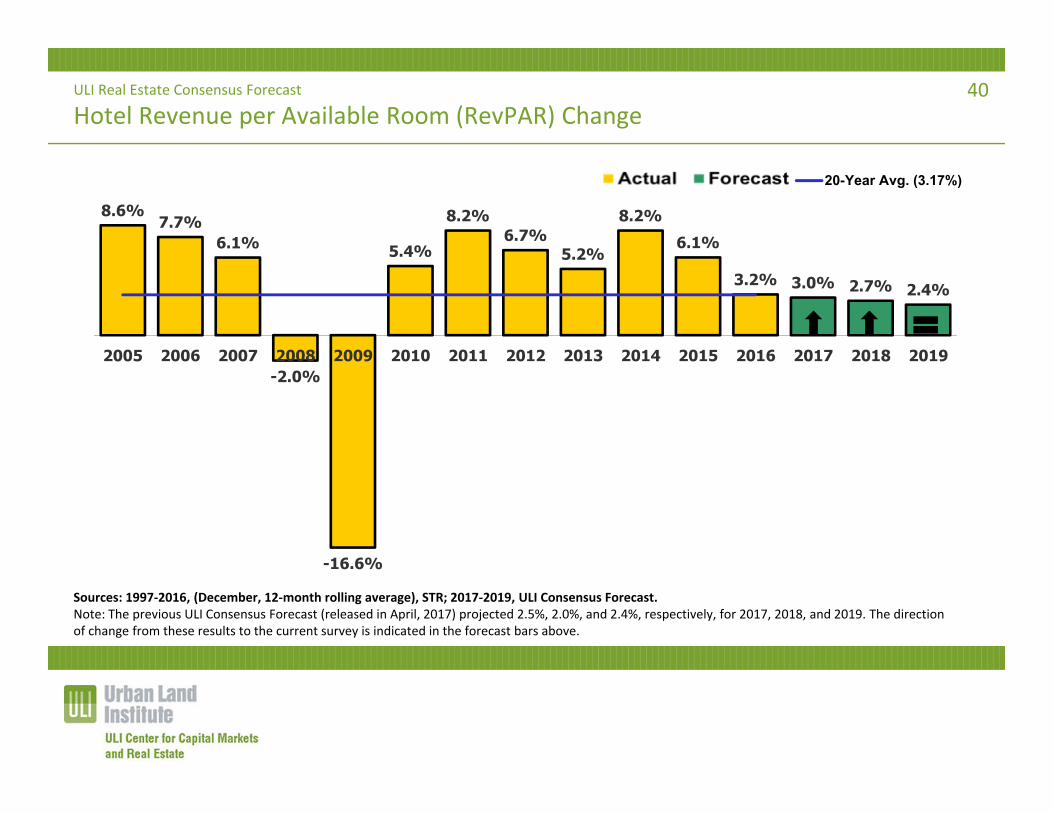
• Following six years of above‐average hotel revenue per available room (RevPAR), RevPAR growth began to moderate in 2016 and is expected to continue moderating during the forecast period, dipping below the long‐term average in 2017 to 3.0%, and decreasing further to 2.7% in 2018 and 2.4% in 2019.
• Compared to the forecast of 6 months ago, the current forecasts for occupancy rates are more optimistic for all three years. The current forecasts are also more optimistic for RevPAR growth in ‘17 and ‘18, but unchanged for ‘19.
38
ULI Real Estate Consensus Forecast
Hotel Occupancy Rates
63.0% 63.2% 62.8%59.8%
54.6%57.6% 60.0% 61.4% 62.3% 64.4% 65.4% 65.4% 65.6% 65.4% 65.1%
2005 2006 2007 2008 2009 2010 2011 2012 2013 2014 2015 2016 2017 2018 2019
20-Year Avg. (61.6%)
Sources: 1997‐2016, (December, 12‐month rolling average), STR; 2017‐2019, ULI Consensus Forecast. Note: The previous ULI Consensus Forecast (released in April, 2017) projected 65.5%, 65.1%, and 65.0%, respectively, for 2017, 2018, and 2019. The direction of change from these results to the current survey is indicated in the forecast bars above.
39
ULI Real Estate Consensus Forecast
Hotel Revenue per Available Room (RevPAR) Change
8.6%7.7%
6.1%
-2.0%
-16.6%
5.4%
8.2%6.7%
5.2%
8.2%6.1%
3.2% 3.0% 2.7% 2.4%
2005 2006 2007 2008 2009 2010 2011 2012 2013 2014 2015 2016 2017 2018 2019
20-Year Avg. (3.17%)
Sources: 1997‐2016, (December, 12‐month rolling average), STR; 2017‐2019, ULI Consensus Forecast. Note: The previous ULI Consensus Forecast (released in April, 2017) projected 2.5%, 2.0%, and 2.4%, respectively, for 2017, 2018, and 2019. The direction of change from these results to the current survey is indicated in the forecast bars above.
40
ULI Real Estate Consensus Forecast
Housing Sector
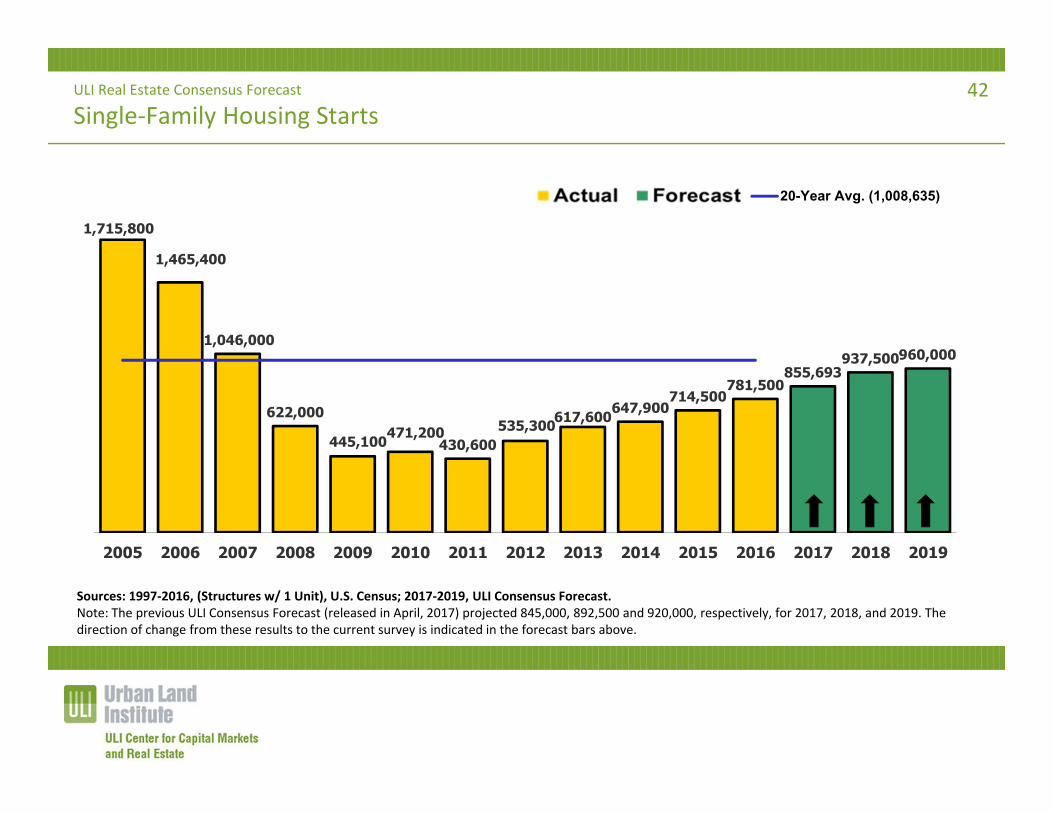
• The single‐family housing sector experienced positive growth in starts for the fifth straight year in 2016. Growth is expected to continue, increasing to 855,693 in ‘17, 937,500 in ‘18, and 960,000 in ’19. The 2019 level brings starts to within 5% of the 20‐year average.
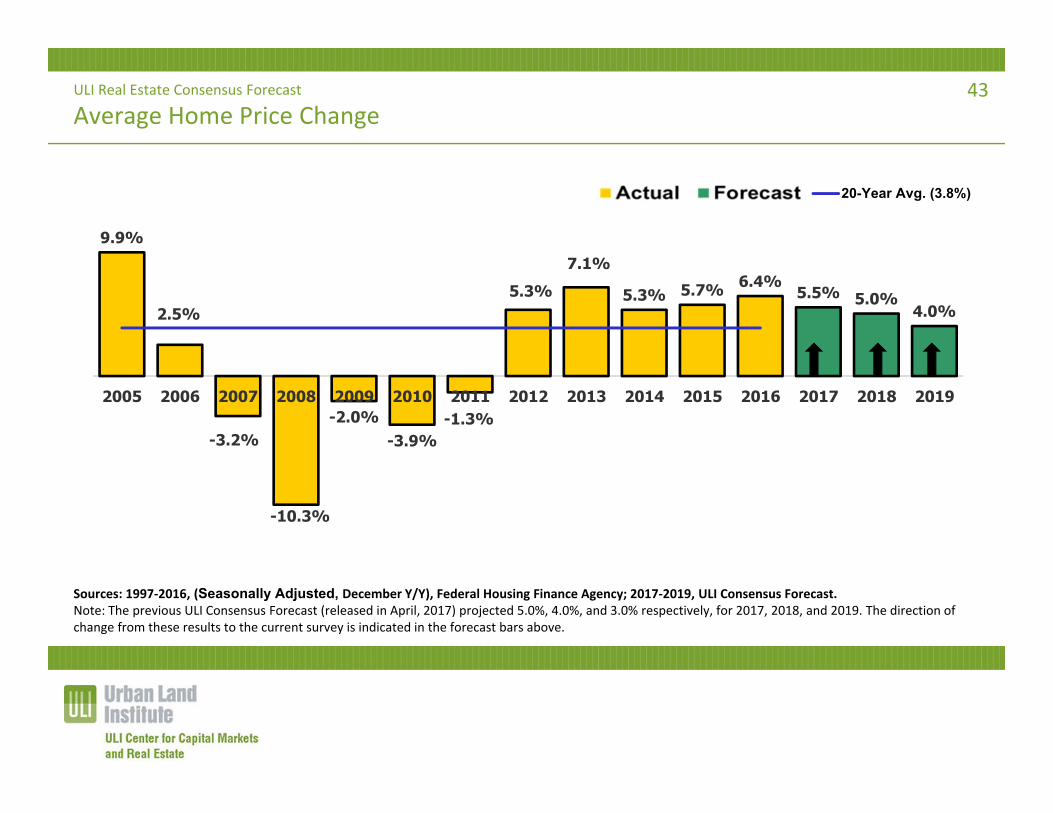
• According to the FHFA, growth in existing home prices increased on average by 6.4% in 2016. Price growth is expected to moderate to 5.5% in ‘17, 5.0% in ‘18, and 4.0% in ‘19.
• Compared to six months ago, forecasts for housing starts and existing house prices are both more optimistic for all three years of the forecast period.
41
ULI Real Estate Consensus Forecast
Single‐Family Housing Starts
1,715,800
1,465,400
1,046,000
622,000
445,100471,200430,600
535,300617,600647,900714,500
781,500855,693
937,500960,000
2005 2006 2007 2008 2009 2010 2011 2012 2013 2014 2015 2016 2017 2018 2019
20-Year Avg. (1,008,635)
Sources: 1997‐2016, (Structures w/ 1 Unit), U.S. Census; 2017‐2019, ULI Consensus Forecast.Note: The previous ULI Consensus Forecast (released in April, 2017) projected 845,000, 892,500 and 920,000, respectively, for 2017, 2018, and 2019. The direction of change from these results to the current survey is indicated in the forecast bars above.
42
ULI Real Estate Consensus Forecast
Average Home Price Change
9.9%
2.5%
-3.2%
-10.3%
-2.0%-3.9%
-1.3%
5.3%7.1%
5.3% 5.7% 6.4% 5.5% 5.0%4.0%
2005 2006 2007 2008 2009 2010 2011 2012 2013 2014 2015 2016 2017 2018 2019
20-Year Avg. (3.8%)
Sources: 1997‐2016, (Seasonally Adjusted, December Y/Y), Federal Housing Finance Agency; 2017‐2019, ULI Consensus Forecast. Note: The previous ULI Consensus Forecast (released in April, 2017) projected 5.0%, 4.0%, and 3.0% respectively, for 2017, 2018, and 2019. The direction of change from these results to the current survey is indicated in the forecast bars above.
43
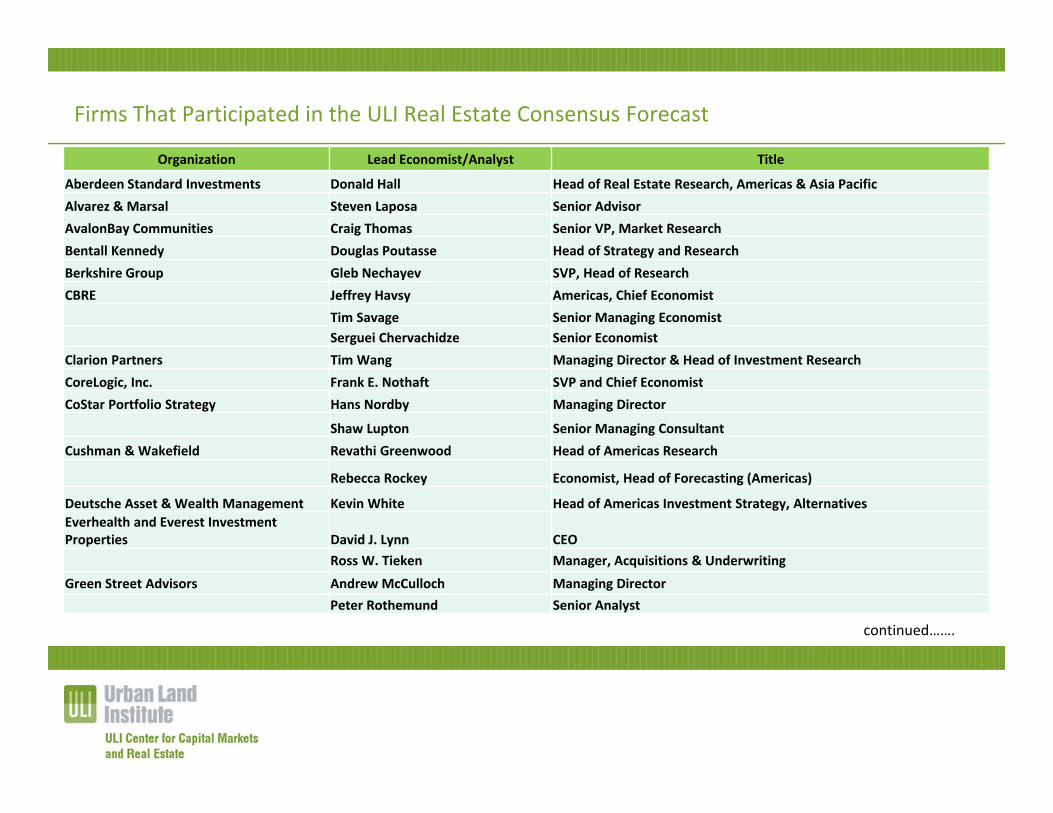
Firms That Participated in the ULI Real Estate Consensus Forecast
continued…….
Organization Lead Economist/Analyst Title
Aberdeen Standard Investments Donald Hall Head of Real Estate Research, Americas & Asia PacificAlvarez & Marsal Steven Laposa Senior AdvisorAvalonBay Communities Craig Thomas Senior VP, Market ResearchBentall Kennedy Douglas Poutasse Head of Strategy and ResearchBerkshire Group Gleb Nechayev SVP, Head of ResearchCBRE Jeffrey Havsy Americas, Chief Economist
Tim Savage Senior Managing EconomistSerguei Chervachidze Senior Economist
Clarion Partners Tim Wang Managing Director & Head of Investment ResearchCoreLogic, Inc. Frank E. Nothaft SVP and Chief EconomistCoStar Portfolio Strategy Hans Nordby Managing Director
Shaw Lupton Senior Managing ConsultantCushman & Wakefield Revathi Greenwood Head of Americas Research
Rebecca Rockey Economist, Head of Forecasting (Americas)
Deutsche Asset & Wealth Management Kevin White Head of Americas Investment Strategy, AlternativesEverhealth and Everest Investment Properties David J. Lynn CEO
Ross W. Tieken Manager, Acquisitions & Underwriting
Green Street Advisors Andrew McCulloch Managing DirectorPeter Rothemund Senior Analyst
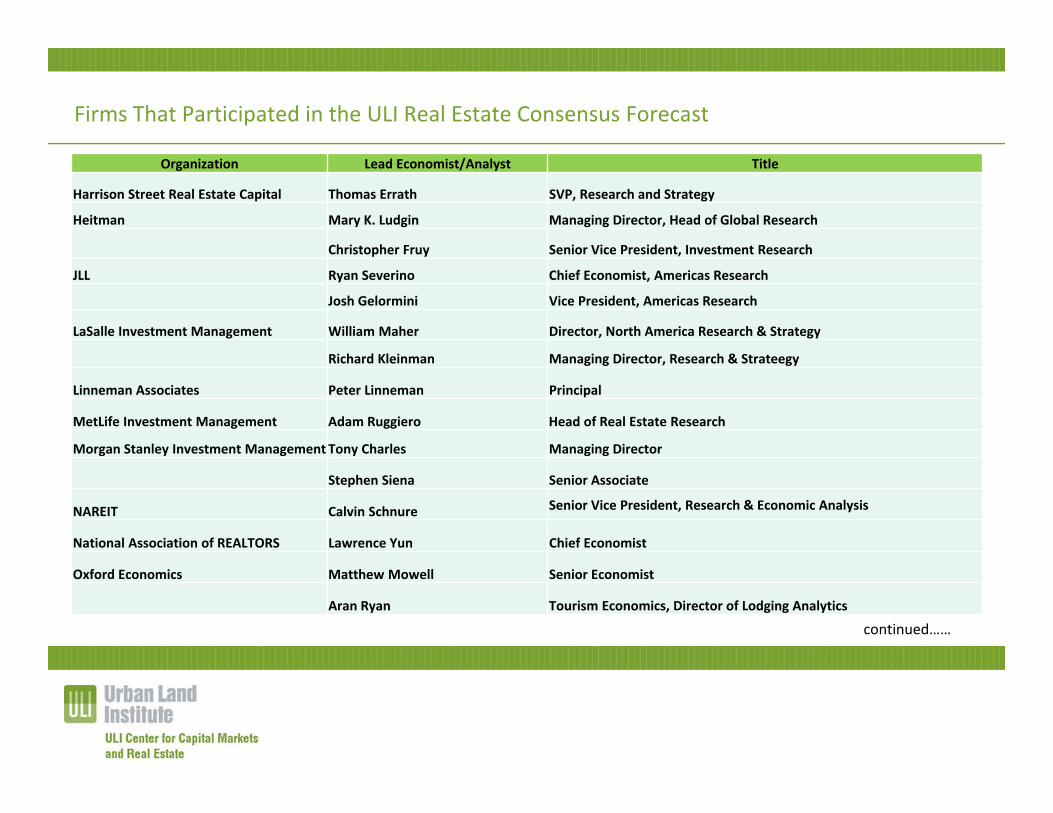
Firms That Participated in the ULI Real Estate Consensus Forecast
continued……
Organization Lead Economist/Analyst Title
Harrison Street Real Estate Capital Thomas Errath SVP, Research and Strategy
Heitman Mary K. Ludgin Managing Director, Head of Global Research
Christopher Fruy Senior Vice President, Investment Research
JLL Ryan Severino Chief Economist, Americas Research
Josh Gelormini Vice President, Americas Research
LaSalle Investment Management William Maher Director, North America Research & Strategy
Richard Kleinman Managing Director, Research & Strateegy
Linneman Associates Peter Linneman Principal
MetLife Investment Management Adam Ruggiero Head of Real Estate Research
Morgan Stanley Investment Management Tony Charles Managing Director
Stephen Siena Senior Associate
NAREIT Calvin Schnure Senior Vice President, Research & Economic Analysis
National Association of REALTORS Lawrence Yun Chief Economist
Oxford Economics Matthew Mowell Senior Economist
Aran Ryan Tourism Economics, Director of Lodging Analytics
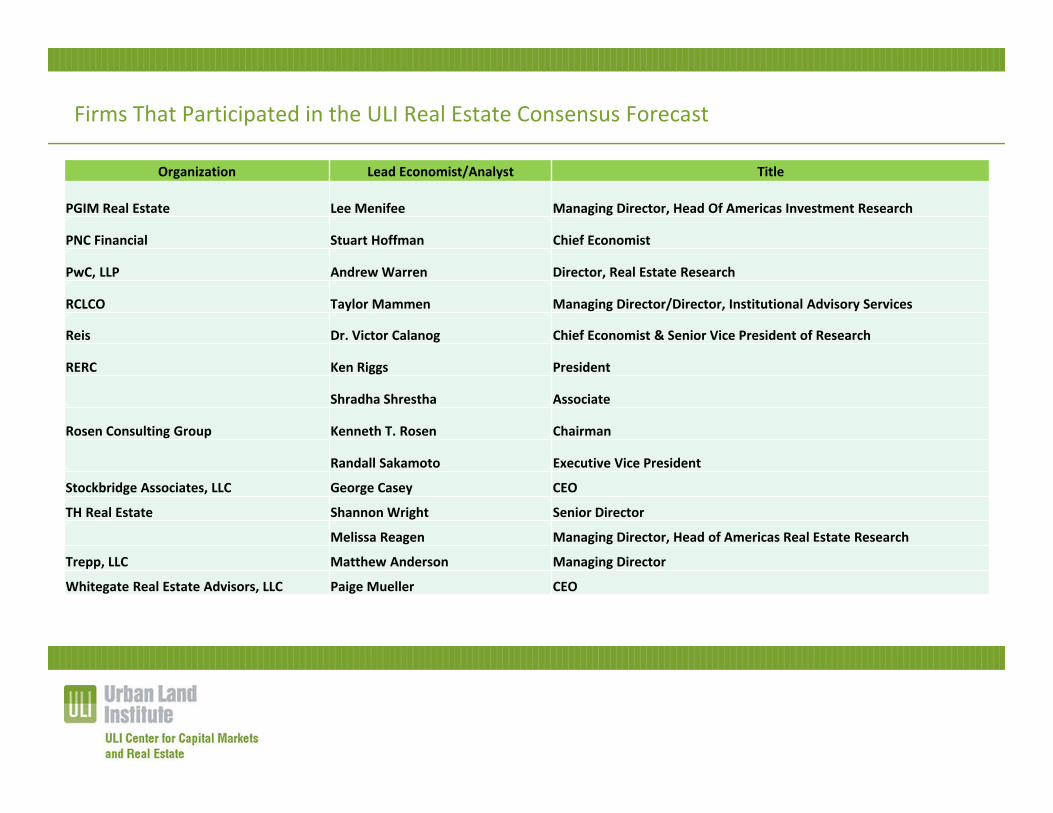
Firms That Participated in the ULI Real Estate Consensus Forecast
Organization Lead Economist/Analyst Title
PGIM Real Estate Lee Menifee Managing Director, Head Of Americas Investment Research
PNC Financial Stuart Hoffman Chief Economist
PwC, LLP Andrew Warren Director, Real Estate Research
RCLCO Taylor Mammen Managing Director/Director, Institutional Advisory Services
Reis Dr. Victor Calanog Chief Economist & Senior Vice President of Research
RERC Ken Riggs President
Shradha Shrestha Associate
Rosen Consulting Group Kenneth T. Rosen Chairman
Randall Sakamoto Executive Vice President
Stockbridge Associates, LLC George Casey CEO
TH Real Estate Shannon Wright Senior Director
Melissa Reagen Managing Director, Head of Americas Real Estate Research
Trepp, LLC Matthew Anderson Managing Director
Whitegate Real Estate Advisors, LLC Paige Mueller CEO
Urban Land Institute
About the Urban Land Institute The Urban Land Institute is a nonprofit education and research institute supported by its members. Its mission is to provide leadership in the responsible use of land and in sustaining and creating thriving communities worldwide. Established in 1936, the Institute has more than 40,000 members representing all aspects of land use and development disciplines. For more information, please visit www.uli.org.
Patrick Phillips, Global Chief Executive OfficerUrban Land Institute
© October 2017 by the Urban Land Institute.
This publication contains information in summary form and is therefore intended for general guidance only. It is not intended to be a substitute for detailed research or the exercise of professional judgment. The Urban Land Institute cannot accept any responsibility for loss occasioned to any person acting or refraining from action as a result of any material in this publication. On any specific matter, reference should be made to the appropriate advisor.
ULI Real Estate Economic Forecast A Survey of Leading Real Estate Economists/Analysts
uli.org/economicforecast
October 2017
ULI Center for Capital Markets and Real EstateAnita Kramer Owen BengeSenior Vice President Senior Associate