UK Biodiversity Indicator Forumjncc.defra.gov.uk/docs/Summary report - UK BIF7... · Web...
43
UK Biodiversity Indicator Forum Friday 5th July 2013 Summary Report Introduction A one day Biodiversity Indicators Forum was held on Friday 5th July to provide a constructive review of three sets of draft indicators – ecosystem services, awareness, business and biodiversity – developed under an existing Defra R&D contract WC1031: ‘Developing UK indicators for the Strategic Plan for Biodiversity 2011-20’. The workshop evaluated the appropriateness of the indicator options for their intended purpose, but focused more specifically on the issues relating to their implementation. The workshop aimed to answer the following questions for each of the indicator options, returning to these questions in the final session of the day: Does the indicator need more research before it can be implemented? Could an indicator be published in October 2013 or in October 2014? What data constraints exist (including access permissions that might need to be negotiated)? Can the indicator, if implemented, be updated within the next 3-5 years? Contents Page Public Awareness Summary 2 Detailed Comments 6 Ecosystem Services Summary 3 Detailed Comments 12 Business 1
Transcript of UK Biodiversity Indicator Forumjncc.defra.gov.uk/docs/Summary report - UK BIF7... · Web...

UK Biodiversity Indicator Forum
Friday 5th July 2013
Summary Report
IntroductionA one day Biodiversity Indicators Forum was held on Friday 5th July to provide a constructive review of three sets of draft indicators – ecosystem services, awareness, business and biodiversity – developed under an existing Defra R&D contract WC1031: ‘Developing UK indicators for the Strategic Plan for Biodiversity 2011-20’.
The workshop evaluated the appropriateness of the indicator options for their intended purpose, but focused more specifically on the issues relating to their implementation. The workshop aimed to answer the following questions for each of the indicator options, returning to these questions in the final session of the day:
Does the indicator need more research before it can be implemented? Could an indicator be published in October 2013 or in October 2014? What data constraints exist (including access permissions that might need to be
negotiated)? Can the indicator, if implemented, be updated within the next 3-5 years?
ContentsPage
Public AwarenessSummary 2Detailed Comments 6
Ecosystem ServicesSummary 3Detailed Comments 12
BusinessSummary 4Detailed Comments 20
Workshop Participants 25Forum Agenda 26
1

Summary of findings
Public AwarenessA. Awareness – the proportion of people who are aware of the term biodiversity and its meaningB. Connection – the proportion of people who feel connected to the biodiversity within their environmentC. Behaviour / Response – the proportion of people that are taking action to support and protect nature. This could be measured by one of five sub-options:
C1. Wildlife gardeningC2. Eco-schoolsC3. Citizen science (Biological Recording)C4. Membership of conservation organisationsC5. Behaviour / Response options bundle
- To truly address Aichi target 1, there needs to be a combined ‘multi-metric’ approach to the indicators, rather than using them in isolation.
- Concerns were raised about using data that is available rather that what is relevant i.e. making the data fit into an indicator.
- With regards to indicator C, some of the proposed data is socio-economic specific and would only give a picture of the people in that sector rather than of the wider UK population. There is a need for a more universal approach. In addition, a change in the economy or funding could change results, rather than being an indication of the willingness of people to act. E.g. membership of RSPB is arguably biased towards a particular demographic and an economic recession may affect ability to buy membership which is not a reflection of awareness levels.
- It was felt that there are problems in the semantics of the indicators. E.g. For Indicator A, do we want to know whether people know the word biodiversity or whether they understand the meaning and concepts associated with it? E.g. For Indicator B, is the indicator identifying ‘connection’ or ‘concern’? Further work is needed on how the indicator questions are framed.
- The group recommended that, in order to avoid bias, a peer review process with a social science team is needed to help crystallise the questions and ensure that the data sample is representative of the UK population.
- The group thought that the indicators could be published in 2013, but there could be a process of evolution to try and get the indicators in a more relevant position.
- There was no consensus on which indicator the participants would pick, although Indicators C and B were more favoured than Indicator A.
- Suggested improvements included: Splitting Indicator A into two to show who understands a) the term and its meaning and b) who is aware of what biodiversity issues are; replacing B with an indicator relating to concern/support; and adjusting C to deal with positive engagement.
- The group agreed that if there were no money or time constraints it would be advantageous to move towards a model similar to that identified in a multi-metric Defra tiering project1. This study tiers respondents’ answers to show how their awareness, connection and action are linked and can be mapped. Defra already has the model, and further investigation is recommended to assess whether this can be repeated to produce an indicator. This could be
1 Simon Christmas Ltd (2013) Biodiversity segmentation scoping study – Defra WC1056 [online] available at:http://randd.defra.gov.uk/Default.aspx?Menu=Menu&Module=More&Location=None&ProjectID=18411&FromSearch=Y&Publisher=1&SearchText=WC1056&SortString=ProjectCode&SortOrder=Asc&Paging=10#Description
2

done every 3-5 years and – in spite of the timeframe – would give a better picture than manipulating existing data to work on an annual basis. It was suggested that the method could entail (a) structured questioning, coupled with (b) easily complied stats that relate to individual steps, to provide cross-validation between a and b; and also that it should relate directly to what is actually being measured to highlight the UK’s/various governments’ performance.
- Other suggestions relating to indicator credibility included: 1) setting ‘target levels’ for indicators and 2) ensuring indicators are linked directly to a reporting-response-review cycle thus allowing for better targeting of action and resources, rather than adopting ‘pseudo-monitoring’ of more easily obtained statistics that do not trigger any action response (in relation to this, monitoring at a county level – where possible – would be useful).
Ecosystem ServicesA. Extent of land cover classified as urbanB. Community analysis of wild pollinators
B1: Bumblebee abundanceB2: Species richness of hoverflies and wild bees, based on presence/absence data for hoverflies and solitary/social bees
C. Carbon stock of forests in Great Britain
- Despite not scoring as high on the data and method criteria, the B1 and B2 indicators (wild pollinators) were higher on indicator characteristic scores. This was thought to represent the general consensus of the group.
- Regardless of any criteria scoring, the B indicators were considered to be the most sound and together they complement each other well. Nectar producing plants would be an additional complementary data set and another suggestion would be to record flower-rich areas
- For Indicator B, it was cautioned that some professional abundance sampling may be required and that there may be a lack of expertise to identify all wild pollinators in a meaningful way.
- Indicators A and C are very important measures but they weren’t considered to be fully developed. A lot more research is recommended especially regarding data set selection and interpretation of the indicator and its appropriateness for measuring the target.
- Indicator A was considered to be the least credible of the options presented. It was suggested that using ratio of greenspace as a crude measure of urban ES supply would be closer to the original intention of the indicator than the extent of urban land cover as an indicator for the loss of ES. The lack of a clear causal relationship between biodiversity and different land use changes was also cautioned.
- Indicator C would need to be extended to all landscape types and not restricted to forest and, whilst the forest/carbon link is strong, the link with biodiversity is not fully understood thus despite data availability it is not the preferred indicator.
- Another suggestion was that the proportion of land given over to different habitat and land use types (including marine) would be important to gain an understanding of natural capital and ecosystem services (e.g. carbon storage in peat, water filtration), with the state of waterbodies (information for which collected in relation to the Water Framework Directive) an indicator for consideration regarding wetland ecosystem services. A potential data source could be the Countryside Survey.
3

BusinessA. Expenditure on protecting biodiversityB. Policy awarenessC. Supply chain managementD. Biodiversity inclusion in Environmental Management Systems
- The group agreed with the option paper summary that identifying meaningful indicators and datasets is difficult for the business category, noting in particular that: awareness does not equal action; business size and sector requires consideration and reflection in indicator design; and that semantics and use of the word ‘biodiversity’ as part of question/survey design requires further thought in order to avoid communication issues and the capturing of misleading data. A proxy for ‘biodiversity’ and its relevance may be a necessary compromise and data ideally should disaggregate by industry sector: this would require further research to contextualise the indicator(s)2.
- There was general consensus that the indicators as currently presented with dataset options are not viable; however the group felt that it would be advantageous to combine aspects of the proposed indicators and data sets for more effective indicator options, which could be achieved with research and tweaks to indicator wording and existing data sets.
- One indicator could capture ‘awareness’ (i.e. D or B) and the other ‘action’ on that awareness (i.e. D or C), and it may be possible to use more than one dataset per indicator and/or for cross-purposes to collate this data e.g. a survey backed-up by records of certification.
- Whilst Indicator A was rejected in its current format, the dataset could be tweaked for use under another indicator header. Data already collated for the Government Survey of Environmental Protection Expenditure (GSEPE) could be used if trend data is required, but in order to be meaningful and useful it would need to be tweaked for future iterations, with the group acknowledging that this could have repercussions for trend data.
- Whilst the principle of ‘policy awareness’ would be a useful indicator to capture, Indicator B was not favoured in its proposed format: the wording of ‘policy’ should be reconsidered (particularly in relation to small businesses), and doubts were expressed as to the meaningfulness and viability of the proposed datasets. It was suggested that Indicator B could be combined with Indicator D (EMS) through an expansion on the use of the term ‘policy’.
- Indicator C on supply chains – particularly sourcing – was considered to be a useful, although imperfect, proxy of ‘action’. This could be collated in both a survey such as GSEPE, but also – with further research – as an independent dataset by creating a typology of fixed certification schemes e.g. EMS (procurement), FSC, MSC etc, which would collate more data. Caution was noted that certification can be misleading (e.g. certified companies aren’t necessarily taking action and shifts in certification membership can occur due to numerous factors unrelated to biodiversity ‘action’), but it is one of the better options available and more than one data set could strengthen the quality of such an indicator.
- It was therefore also proposed that a reworded version of Indicator D with better questions and data sets than currently proposed could incorporate elements of Indicator C and supply chains and/or present two complementary indicators on awareness and action.
- It was suggested that a tweaked GSEPE survey would provide a good dataset for the purpose of querying both awareness and action; it would provide some trend data but to be meaningful would
2 BSI offered to provide advice on data sets and question framing for a business audience
4

need alterations to be made and researched as soon as possible before it is next released.- IOD and GRI datasets were largely dismissed by the group. Whilst these could potentially be a
better source of data than GSEPE, more research is needed to establish whether this is the case and it is proposed that GSEPE is used in the interim.
- BSI BS4 2020, UKAS, the Natural Value Initiative and K-Matrix were suggested as other data sources worth researching. There was concern that some potentially useful data sources had been dismissed too quickly with limited explanation as to why; for example, the exclusion of an Indicator on Legal Non-Compliance using a dataset from the Environment Agency was queried and noted for its relevance to Aichi Target 4 in reflecting whether businesses are staying “within safe ecological limits”.
5

Public AwarenessComments on Indicator A: Awareness – the proportion of people who are aware of the term biodiversity and its meaning
- This indicator is covering two things: both awareness and understanding. Clarification is needed as to whether it is the word “biodiversity” or the concepts/issues of biodiversity that people need to be aware about
- As it stands, A relates to intellectual understanding. People either know what the term biodiversity means, they don’t, think they do but don’t, have some approximate but not wholly accurate picture of it in their mind etc. One issue is that there are various definitions of what biodiversity is, with function and interplay poorly emphasised.
- With regards to further research; there is a need to select the questions for Indicator A carefully. Need to think about the term “biodiversity” and should move away from a direct question about knowledge of the word biodiversity. Instead, ask questions framed on the concepts of awareness of biodiversity (but prevent the question from being intellectually exclusive)
- Once the questions have been established, it was agreed that an indicator could be published as early as October 2013
- For data constraints, there is a need to take in to account the Data Protection Act with regards to personal identifiable data, and to ensure that the results may be disaggregated at County level
- It was felt that the indicator can be implemented and updated in the next 3-5 years- Important to be able to get the actions taken and the level of involvement in to context. Ideally
need to show 1. Awareness 2. Understanding 3. Concern/comment 4. Engagement 5. Leadership
- To be more useful A could potentially be split into two to show a) who understands what the term means (per the dictionary definition) and b) who is aware of what biodiversity issues are
Comments on Indicator B: Connection – the proportion of people who feel connected to the biodiversity within their environment
- Is this indicator looking at ‘connection’ or ‘concern’? These are two different things and this needs to be clarified i.e. B is a continuum from “not at all” to “completely” (possibly on a logarithmic scale). It probably reflects, but is not the same as, how people are connected with biodiversity. For example, a city dweller who has little opportunity for direct personal connection might be hugely concerned about declines in UK wildlife. Conversely, a farm worker might not be at concerned about the diversity of wildlife so has no emotional connection even though they have (the potential for) a direct +ve/-ve impact every day
- If the indicator is looking at ‘concern’, it would imply a stepped continuum which – whether for an individual or organisation - runs through ignorance - awareness – understanding – concern/support – positive engagement and then advocacy/leadership (seeking to help move others from ignorance/lack of awareness through the continuum)
6

- The narrative in the background options paper is varied: “the proportion of people who feel connected to biodiversity within their environment”, then the graph on P10 calls it “proportion of people that feel biodiversity is relevant to them personally” and then it talks about the “benefits that people take from nature in the form of ecosystem services”. This indicator is bogged down in semantics
- The responses from any question on connection have some huge variables attached to them – personal, spatial, contextual
- This indicator is all about value – and the group felt “value” is important, but can come in all sorts of different guises – economic, cultural, aesthetic
- The question needs to be constructed carefully to ensure that there isn’t confusion and misrepresentation in the responses
- With regards to further research:o There needs to be clarification on the basis of the indicatoro The indicator doesn’t stand up by itself and needs to be made tightero There is a huge difference between connection and concerno Need to check how the questions are framed and questions need a social scientist input
to make sure they have rigor, and measure what is relevant- There are data available for the indicator to be published in October 2013, but this doesn’t
mean that it is relevant. There could be an evolution of the indicator questions towards 2020 if transparency is put in as part of the process
- The group was unsure as to whether data constraints exist- The indicator could be implemented and updated in the next 3-5 years- Strongly advised that a social scientist is involved to peer review the question to ensure the
indicator is measuring what it is intended to measure
Comments on Indicator C: Behaviour / Response – the proportion of people that are taking action to support and protect nature
- The group challenged the relevance of the Indicator with regards to the following:o Are the actors realistically available? o Is it a linear scale between awareness – connection/concern – action? There are
different motivations behind each stageo What have most people got as an opportunity to change behaviour? How can we
quantify direct action? o Is action a good enough proxy for value and awareness?o Is it the impact or the action on biodiversity or is it the engagement that is important?o Does the indicator only measure what is economically available to a certain sector of
the population? There needs to be an indicator that is not class specific- With regards to whether more research is required:
o It was felt that at present a “basket of actions” is being proposed and there is a need to ascertain what should be included.
o Ideally there needs to be more work done on what data is included in Co It was queried as to whether we are sufficiently confident that the actions reflect
concerno This might be ok provided any fluctuations can be explained – are they likely to be as a
result of economy/funding changes or the willingness of people to take action?o Main concern – not a representative sample
7

- Current suggestions under C are considered to be proxies for: positive engagement (C1); awareness (C2), positive engagement (C3), concern/support (C4). Problems were identified with each data set. E.g. schools do not have to include biodiversity as one of their themes to be an eco-school (C2), whereas the extent to which biodiversity is integrated within teaching as part of the national curriculum could be a more direct and useful indicator. E.g. C3 is not clear for which citizen science projects, whereas e.g. the number of Spring/Autumn Watch viewers and visitors to different website pages might be a useful/better measure. E.g. Membership of some organisations, such as the National Trust, isn't specifically related to biodiversity interests; and falling membership for others, such as the RSPB, does not necessarily reflect less interest in birds or biodiversity and could instead be a reflection of what is affordable at the time.
- Data constraints include details on what to include: more information on wildlife gardening is needed and cost issues need to be investigated
- Indicator C5 may have to wait until 2014 before publishing, because the methodology is not defined; but C1-4 could be ready for 2013
- It should be possible to update the indicator within the next 3-5 years- Other general thoughts included:
o Need clarity on the issue of what data to includeo Need demographics of data to see if unbiasedo Members vs membership needs to be noted ( family, groups etc)o Could phrase the question so that is more about “ would you” rather than “ do you”
(given the capability)- Another suggestion is for C to instead deal with positive engagement, noting a distinction
between engagement (e.g. taking part in a biodiversity activity such as a ‘bioblitz’) and making a difference (verifying impact). A measurement of advocacy/leadership could be useful and should increase the likelihood of it being encouraged, with the benefits rippling down the continuum mentioned in notes for Indicators A and B.
8

Public Awareness – Assessment against evaluation criteriaCriterion Indicator A Indicator B Indicator C
Data
Issu
es
1. Transparency and auditability
Provided that there are no confidentiality issues/ check data protection
Disagreed with the options paper and instead felt that some of the data are not as freely available as assumed
Agreed with the options paper that for C2,3,4 the data are available, but disagreed for C1 where the group felt the data are limited and for C5 whether it is unavailable without collation of publications
2. Verification More information and evidence is needed as to what checks are in place
Agreed with the options paper that detailed verification is in place and documented for C3 and C4; but disagreed for C1 where the data are felt to be unverified, for C2 where limited verification checks are in place, and for C5 the group is unsure
3. Frequency of updates Disagreed with the option paper and instead stated that data wouldn’t necessarily have to be done every year at the national level and instead every 3-5 years
Agreed with the options paper that annual or biennial data could be collated, but felt that for C1 the data are only available sporadically
4. Security It is necessary to establish for how long the data collection is secure
Disagreed with the options paper and instead the group felt that future data collection was fairly likely but not secure, and dependent on economy
Agreed with the options paper that future data collection is secure for C3 and C4, but felt that for C1 and C2 it was less certain and for C5 less secure as sections could fail
5. Spatial coverage There needs to be a check; the data sets suggest England is under represented. There is also a need to check with a social scientist about the number of respondents, and if that will give you a true representation of the population
9

Public Awareness – Assessment against evaluation criteriaCriterion Indicator A Indicator B Indicator C
6. Temporal coverage There are different starting points for the bundle, and that this would pose some issues for collating
7. Capacity for disaggregation
There was a suggestion that the indicator could/should be scaled down to County level, but this was not uniformly agreed
Agreed that the data can be disaggregated but not as easily as implied by the options paper; that there are major issues to be resolved before proceeding
There could be data quality issues and it was queried what is available for C1
Met
hodo
logy
8. Transparency and soundness
The peer evidence needs to be made available when the indicator is finalised
Agreed with the options paper, but cautioned that the UKBIF is towards a peer review process, and need to look at the difference between consultation and peer review process
Agreed with the options paper that for C2-4 the methodology is available but not peer reviewed, but disagreed for C1 and C5 where it was felt that the methodology is not available. For C5 this would present the issue of peer review of aggregation of data
9. Precision Agreed in part with the options paper, but suggested a degree of caution that it depends on the frequency of data collection
Indi
cato
r Cha
ract
eristi
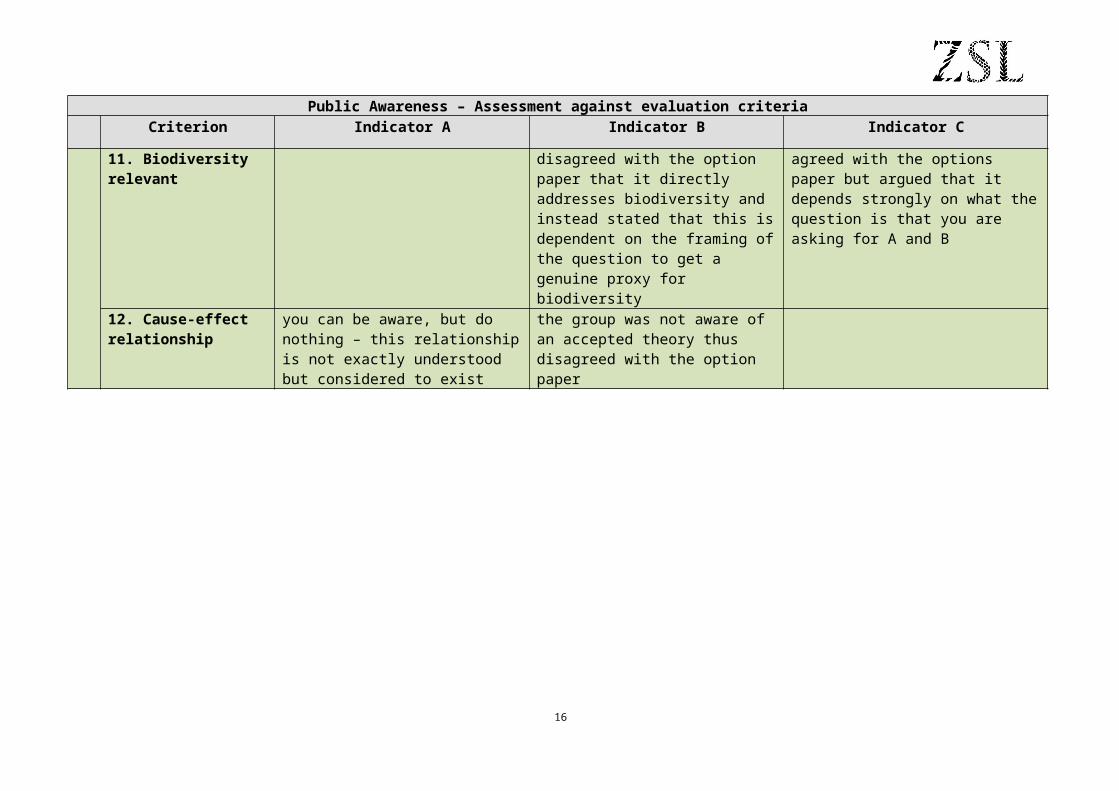
cs 10. Policy relevance: progress towards Biodiversity 2020 targets (CBD, EU, UK, country)11. Biodiversity relevant disagreed with the option paper that it
directly addresses biodiversity and instead stated that this is dependent on the framing of the question to get a genuine proxy for biodiversity
agreed with the options paper but argued that it depends strongly on what the question is that you are asking for A and B
10

Public Awareness – Assessment against evaluation criteriaCriterion Indicator A Indicator B Indicator C
12. Cause-effect relationship
you can be aware, but do nothing – this relationship is not exactly understood but considered to exist
the group was not aware of an accepted theory thus disagreed with the option paper
13. Sensitive to change depends on the data being collected this is data dependant. Bundle of C5 is better than just the individual 1-5; whereas agreed with the options paper that for C5 the indicator detects changes in systems within timeframes and spatial scales that are relevant to decision-making; disagreed for C1-4 and argued that these only detect changes in systems only within timeframes or only on spatial scales that are relevant to decision-making
14. Human-induced vs natural changes
Not applicable
15. Communication disagreed with the option paper ranking and instead felt that the indicator is complex, difficult to communicate and not accepted by all major stakeholders
it was felt as though the stakeholders had not been adequately defined hence disagreed with the options paper’s assessment that the indicator is simple, easy to communicate and accepted by all major stakeholders
as per the other indicators (A and B), it is necessary to first clarify who are the stakeholders, thus disagree with the options paper assessment
11

Ecosystem ServicesComments on Indicator A: Extent of land cover classified as urban
- It was considered to be the least credible of the options presented for ecosystem services.- General agreement with the key findings from the options paper, although It was suggested that
the original intention for an urban space indicator discussed at the December 2012 workshop was to reflect ES supply in urban areas (i.e. where most of the population live and experience ecosystem services)
- Therefore - whilst there was clear understanding of the proposed data set - it is considered to be measuring the lack of an ecosystem service and not the service itself, and a ratio of greenspace as a crude measure of urban ES supply would be more relevant than the extent of urban land cover as an indicator for the loss of ES
- In addition to this, without knowing the land use change there is a lack of a clear causal relationship, for example it might be worse (for biodiversity / ES) to build on a contaminated green space in an urban area that is possibly more biodiversity rich than agricultural area
- Also missing key aspects in order to be able to reliably measure progress towards this target- It was felt that the indicator does need more research before it can be implemented:
o Need particular development of interpretation and other datasets to support ito Missing key aspects - green spaces and fragmentation of urban space. Quality of habitat
needs to be taken into account - green/brown ratioo Green spaces combined with human population density within urban areas might be a
better alternativeo Data sources for green spaces - unsure but possibly local authorities, Google Earth, OS,
Landiso Could take in to account rural land cover e.g. Countryside Survey data
- With regards to whether an indicator could be published in October 2013 or in October 2014, this depends on the resource base available to do the above. The data are there but it seems meaningless in its current state - too crude a measure. Including the green space aspect could be done for 2014 depending on resources available to do this
- Data constraints are largely unknown – the data are freely available but there could be quite a substantial cost - information on this is not available to hand but suggested from other people's use of similar OS data. It would be very important to clarify this before indicator adoption. A potential opportunity could be to share the licence if required for other applications and thus reduce the costs of obtaining data
- The indicator could be updated within the next 3-5 years, resource permitting. It's not useful to update it annually so every 3-5 years would be suitable
Comments on Indicator B1: Community analysis of wild pollinators: Bumblebee abundance
- The two indicators B1 and B2 are important together: Pollinators provide crop services (plantations); responsible for maintaining vegetation structure and composition; can track changes in land use by showing changes in species richness among pollinator communities
- Around 30 species will soon be identified as important for crop pollination (published next year) so these indicators could track changes in these key species for pollination
12

- The indicator is not considered to need more research before it can be implemented and no data constraints were identified
- An intro and short summary could be published for October 2013; but as a baseline as it only starts from 2010
- The indicator could be updated within the next 3-5 years; but it's still a small dataset and needs to expand
- Other suggested indicators to complement this option and to include pressure and response indicators: Area of semi-natural grassland (state); level of pesticide use (pressure); number of agri-environment schemes (response)
Comments on Indicator B2: Community analysis of wild pollinators: Species richness of hoverflies and wild bees, based on presence/absence data for hoverflies and solitary/social bees
- Use in conjunction with B1 – they complement one another- The indicator needs more research before it can be implemented with regards to a peer review
of the method, but this is already in progress- Optimistic that an indicator be published in October 2013 depending on the outcome of the
peer review- Uncertainty regarding data constraints; there is a need to check the information available,
particularly for hoverfly data. They are available in Northern Ireland - data which have been publicly funded are being made available on a central database (will be linked to NBN) so will be more easily available in the future. Need to check GB availability from other organisations. Can get data from NBN but will need to go direct to recording schemes to check if data are available for hoverflies (they are available for wild bees)
- The indicator could be updated within the next 3-5 years; but it would be a 5 year update- Other suggested indicators to complement this option and to include pressure and response
indicators: Area of semi-natural grassland (state); level of pesticide use (pressure); number of agri-environment schemes (response)
- It was suggested that some professional abundance sampling is probably required; that whilst relative abundances and timed counts can be an effective means of gauging numbers, it is unlikely that there is sufficient coverage of expertise to be able to identify all wild pollinators in a meaningful way, even within hoverflies. Some sample-based, cross taxon recording of pollinators in which professional and amateur effort could be combined.
- There may also be merit in recording flower-rich areas although pesticide impacts would add noise to the signal.
Comments on Indicator C: Carbon stock of forests in Great Britain
- There was some debate on whether this indicator represents the link between forest and biodiversity (and the services it provides) or between forest and carbon storage. However, the link to carbon storage was the link discussed when assessing the indicator
- Agreement with key findings from the options paper- Notes that important aspects are missing such as carbon storage of peat lands and grasslands,
and also the understory trees and soil. The indicator should be extended to all landscape types and not restricted to forests
13

- An additional data set that could be used on soil: available from the Urban Biodiversity and Ecosystem Services and Sustainability (BESS) project (Cranfield University)
- More than one measure of carbon storage would be more appropriate- An indicator could possibly be published in October 2013 or in October 2014, but the link with
biodiversity is not clear and it depends on the resources of the National Forest Inventory (NFI)o Suggestion to split native and conifers - for different biodiversity benefitso No data for Northern Irelando Timeframe - complete cycle not published until 2015 as project is 4 years in so 2013
possible (but not with more recent data) but up to date indicator available for 2014- No data constraints identified, data are available on a 5 year cycle and – whilst this is considered
appropriate – it would depend on where the data collection is within that cycle- Forest/carbon link is strong but the link with biodiversity is not fully understood. This was seen
as the biggest issue with this indicator.
14

Ecosystem Services – Assessment against evaluation criteriaCriterion Indicator A Indicator B1 Indicator B2 Indicator C
Data
Issu
es
1. Transparency and auditability
Some doubts about availability and cost from past experience of using this type of data so clarification would be needed
Data are not available for Northern Ireland
2. Verification
3. Frequency of updates
Disagreed with the options paper and felt that, whilst it could be done annually or biennially as proposed in the options paper, this depends on frequency of OS updates, and could be every 3-5 years
4. Security If funding can be secured for the projects then data collection can be considered as secure
Data are Government funded and not necessarily secure in the long term – it is currently funded for 5 years
5. Spatial coverage Data are available in Northern Ireland but are in a different gridded format so clarification would be needed if data from NI and GB were to be combined
Disagreed with the option paper, stating that there is UK coverage with some bias (as opposed to partial UK coverage), that data are available in Northern Ireland for bumblebees and there will always be bias in the data (from where the recordings are made)
Disagreed with the option paper, stating that there is UK coverage with some bias (as opposed to full UK coverage). There will always be bias in the data
Northern Ireland information could be obtained from Richard Schaible
15
Ecosystem Services – Assessment against evaluation criteriaCriterion Indicator A Indicator B1 Indicator B2 Indicator C
6. Temporal coverage
Data are not sufficient to generate one year assessments but more data will become available and at high resolution
Data are only available every 10 years and at a lower resolution than B1
7. Capacity for disaggregation
Met
hodo
logy
8. Transparency and soundness
Disagreed with the options paper that the methodology published and peer reviewed; a peer review is in progress but this has not been published
Disagreed with the options paper and states that there are data available which has been published in the peer-reviewed literature
9. Precision
Indi
cato
r Cha
ract
eristi
cs
10. Policy relevance: progress towards Biodiversity 2020 targets (CBD, EU, UK, country)
Disagreed with the options paper that it relates directly to progress towards 2020 targets, and felt instead that there is no relationship unless green spaces are taken into account in which case there would be an indirect relationship
Indicator is an indirect measure of the service but directly measures the target delivered by the service
Indicator is an indirect measure of the service but directly measures the target delivered by the service
Disagreed with the option paper, stating there is an indirect, rather than a direct, relationship to progress towards 2020 targets. Adds that there is a lack of knowledge as to how much carbon is sequestered by different types of forests – native vs conifers or mixed vs monocultures for example; and that generally the more forest the better but the relationship needs to be fully understood
16

Ecosystem Services – Assessment against evaluation criteriaCriterion Indicator A Indicator B1 Indicator B2 Indicator C
11. Biodiversity relevant
Agreed with the options paper that the indicator is low scoring, and stressed that the indicator is “a proxy of a proxy” and a very indirect measure. This could be improved to directly address biodiversity and relate indirectly to state, pressures, benefits and/or responses
Indicator measures the state but doesn’t capture any of the pressures on this service
Indicator measures the state but doesn’t capture any of the pressures on this service
Indicator relates only indirectly to biodiversity targets
12. Cause-effect relationship
Disagreed with the options paper that there is an accepted theory of relationship between indicator and issue of concern, unless improvements are made. Added that biodiversity can be higher in urban areas
Data are likely to improve in 2014 but the information has not been published yet. Some of the groups will have a quantifiable relationship between the species group and the ecosystem service they provide
Data are likely to improve in 2014 but the information has not been published yet. Some of the groups will have a quantifiable relationship between the species group and the ecosystem service they provide
Carbon - forest link is strong but the relationship with biodiversity not clear, and that the benefits of different forest types are not well understood
17

Ecosystem Services – Assessment against evaluation criteriaCriterion Indicator A Indicator B1 Indicator B2 Indicator C
13. Sensitive to change
Disagreed with the options paper and instead felt that the Indicator does not detect changes in systems within timeframes and spatial scales that are relevant to decision-making. Whilst the indicator would be sensitive to change, it is a poor indicator because of a lack of cause-effect relationship, therefore changes are not relevant to the questions and not appropriate for decision-making
14. Human-induced vs natural changes
Indicator could potentially discriminate between human-induced and natural changes with further analysis. Possibly needs more research – more analysis on the links
Indicator could potentially discriminate between human-induced and natural changes with further analysis. Possibly needs more research – more analysis on the links
Disagreed with the options paper that the indicator cannot discriminate between human-induced and natural changes. It was felt that it is possible to distinguish changes in dieback and reforestation (i.e. changes in either direction), thus for the indicator to potentially discriminate
18

Ecosystem Services – Assessment against evaluation criteriaCriterion Indicator A Indicator B1 Indicator B2 Indicator C
15. Communication Disagreed with the options paper and instead felt that the indicator is complex, difficult to communicate and not accepted by all major stakeholders. Most people would accept that there is a link (i.e. urban area increasing is a bad thing) and the measure is important but it was agreed that the link is actually very tenuous (because of importance of fragmentation and amount of green space which is currently left out) and therefore would be difficult to communicate
Queried whether the indicator is simple, easy to communicate and accepted by all major stakeholders. There was some debate in the group about what the indicator is actually measuring and some confusion in the interpretation
19

BusinessNote: Indicators A and D share the same dataset
Note: It was considered that the Indicators may be more appropriately merged and/or datasets shared, hence discussion of data sets (criteria 1-9: data issues and methodology) took place as part of a group discussion of all the indicators
Comments on Indicator A: Expenditure on protecting biodiversity
- Indicator A in its current format was rejected as not being meaningful enough. It was proposed that the data source is useful under another Indicator header, but tweaking the data source would be required and – whilst this is possible and would make the data more meaningful – it could have an impact on trend data
- With regards to the data source (Government Survey of Environmental Protection Expenditure by Industry, GSEPE), issues include:
o Although the data are already available, the text in the Business Indicator Options paper is not entirely accurate
o The sectors listed are not all surveyed every year, some are only surveyed every four years – data are still published for these sectors but in the form of estimates
o Whilst data on landscaping could be used a proxy for biodiversity, no specific categories that cover ‘biodiversity’ directly, and a lot of interpretation is required
o Redesign of the survey would be possible but it would need to be done quickly prior to the next release
o Current response rates aren’t particularly high, which suggests this data set alone is not enough and needs to be backed up by a second dataset
- It was felt that further research is needed before this indicator could be used, including: a ‘grouping’ of the sectors in the data source; the consideration of other datasets; and the categories of expenditure
- Publishing an indicator in 2014, though theoretically possible, would be meaningless without more research and would be complex and expensive. How repeatable the data are after 3-5 years is an associated issue, particularly if the questions asked are tweaked
- Another dataset: K-Matrix, was suggested as a possibility. It has been used to estimate the size of the Green Economy in the UK – worthwhile contacting Katherine Bremner at ONS about this
Comments on Indicator B: Policy awareness
- There was some confusion as to the listing of B1 and B2 in part of the evaluation table; it was taken to mean a difference between IOD and GRI used as a dataset, but should not impact on overall feedback given on this indicator and the other indicators for business
- Indicator B could be viable but with a tweak to the wording of the indicator and potentially using another data source, such as the GSEPE proposed under Indicators A and D
- Of the two proposed data sources:o It was felt that there was not enough information available about the Institute of
Directors Survey (IoD), although it could also be tweaked as per the GSEPE to collate similar data being proposed. It was largely dismissed by the group owing to a current lack of information on the Survey e.g. return rate and business sectors covered, a
20

concern about the cost, the data security, and the legality of potential information requests
o The Global Reporting Initiative Benchmarking Tool (GRI) was largely dismissed by the group, for reasons including that it is too targeted at big businesses and ‘spread’ is not well captured; further research is warranted, but better datasets are more immediately apparent
- There is also a lack of certainty over the whether partial or full UK coverage could be achieved. The trend in data for this indicator could mean various things i.e. there is a high degree of ‘noise’ that affects the indicator criterion of ‘precision’. With regards to the questionable and largely unanswered aspects of data deficiency, it was queried whether this made the indicator a less viable option in comparison to the other options
- In its current format, Indicator B requires more research to identify whether it is viable for a 2014 publication, and serious data constraints exist given that it relies on ‘novel’ questions and data that may not be a true proxy for awareness. It would probably be cheaper than Indicator A to collate the data, but possibly less meaningful
Comments on Indicator C: Supply chain management
- The indicator is split into auditing and sourcing, with auditing more an indicator of awareness and sourcing more an indicator of action. Both aspects are considered useful to capture, although the dataset and methodology and dataset suggested for this purpose was challenged and there was general consensus that this indicator could be combined with aspects of the other indicators to reflect both ‘awareness’ and ‘action’ through the use of supply chain evidence.
- It was considered that, without defining the scope of businesses, it would be difficult to use this indicator. For example, asking multi-nationals to distinguish their global versus their UK impacts
- When looking at ‘certified’ companies, not all are certified, but some still do take the environment into consideration, and a trend for companies to leave certification schemes and work directly with suppliers could bias data. Similarly, caution is warranted that ‘being’ certified does not equate to ‘buying’ certified. Hence, looking at ‘certified’ companies is not very representative.
- UKAS – and other publicly available data e.g. FSC – could possibly be used to identify ‘certified’ companies, rather than a survey, in order to capture more data or to back-up existing data sets. This would require research, a typology of agreed certification standards and weighting by industry, used over time for the indicator
- It was felt that there was not enough information available about the Institute of Directors Survey (IoD), although it could also be tweaked as per the GSEPE to collate similar data being proposed. IOD was largely dismissed as a data set by the group owing to a current lack of information on the Survey e.g. return rate and business sectors covered, a concern about the cost, and the data security; although this could potentially be resolved with further research, other data sets appear to be more viable at this time
Comments on Indicator D: Biodiversity inclusion in Environmental Management Systems
- EMS alone can provide an immediate datasource for an Indicator and is collated in the GSEPE on an annual basis, but it would be more meaningful if it were expanded upon. Moreover, it was
21

felt that the quality of the questions currently proposed for the dataset for Indicator D needed more research
- Using EMS as currently proposed under this Indicator would make it important to know the spread/coverage of different sectors of the industry and it would miss important areas of retail. This in itself would be interesting to investigate and enable us to target future companies and sectors, whilst also looking at method consistency. In addition, EMS certification will not pick up on uncertified businesses that also act on biodiversity. Cost, for example, could be a barrier to certification, whereas the company could already be acting on biodiversity or have another form of biodiversity-relevant sustainability or environmental system in place
- It was considered that Indicator D was largely attempting to achieve the same goal as Indicator B, in that it is capturing an indication of ‘awareness’. The GSEPE dataset could be modified to better capture this, to include EMS in addition to other ‘awareness-relevant’ measures undertaken by business.
- For example, ‘certification’ itself could be expanded from just EMS to include supply chain aspects proposed under Indicator C, which could then both be an indication of ‘awareness’ and ‘action’. The GSEPE survey could provide a means for doing so.
- Potential GSEPE modifications for the purpose include:o A first question to ask whether the company takes in to account the environment e.g.
when procuring. Have you considered the environment as part of your assessment? / Do you (yourself and suppliers) consider <resource> when planning?
o Followed by a multiple choice of categories as to ‘how’ e.g. And have you acted upon this? e.g. Do you use any of the following <multiple choice>: sustainable sourcing? EMS? Policy? Sustainable procurement procedure? etc.
o Will need to differentiate between the ‘environment’ and ‘sustainability’ in the questions
o Depending on any amendments to the survey it could be possible/useful to also request retrospective data from CEOs/companies to overcome a barrier to available trend data
o Amanda Kiely (BSI) has offered to pass on further information in relation to framing of questions to capture a wider business audience
- Dataset issues include:o The survey costs £40,000/annum and the cost of restructuring the dataset would need
to be assessed.o Only 20% return rate – it may not capture as big an audience as other datasets (e.g. IOD
or an internet survey – one of the datasets rejected at an earlier phase – but this is not known for certain)
o ‘Response rate’ could fluctuate for various reasons and introduce ‘noise’; however, response rate could in itself be an interesting indicator
o People filling out the survey are not going to be experts thus can’t confuse too much with ‘biodiversity’ as a term
- A variation on a question suggested included: How much UK land are you the steward for? Do you have a Biodiversity Action Plan for this land? But this would require further research and could be revisited as a potential dataset
- BSI is bringing out a new guidance standard/ code of practice this year (BS4 2020) for planners and constructors to adopt. This looks at biodiversity and construction. Whilst not a dataset per se, it may have the repercussion of increasing the number of completed EMS sections next year
22

Business – Assessment against evaluation criteriaCriterion Indicator A Indicator B Indicator C Indicator D
Indi
cato
r Cha
ract
eristi
cs
10. Policy relevance: progress towards Biodiversity 2020 targets (CBD, EU, UK, country)
Disagreed with the option paper, stating there is a relationship with the targets, but that this is indirect. In-house costs are a proxy for reducing impacts of natural resource use
Audit is considered to be a good proxy for awareness, whereas sourcing is considered to be a proxy for change or action
11. Biodiversity relevant
None of the criterion levels were considered to be applicable
This is a proxy for awareness but not change
With the split of audit and sourcing, sourcing could be seen as a proxy biodiversity change
None of the criterion levels were considered to be applicable
12. Cause-effect relationship
Disagrees with options paper in that there will be an accepted theory of relationship between indicator and issue of concern (rather than an unknown relationship) provided in-house expenditure presented as a percentage of total operating cost
Felt that none of the criterion levels were applicable. That there is a need to tweak the wording of the indicator, because the number of companies with a policy won’t change even if the business impact does; thus either reword ‘policy’ to capture SMEs or restrict sampling to large companies (noting there is a risk that they all have a policy that may or may not be implemented for biodiversity)
Suggested a tweak to the indicator by stating ‘how much’ sourcing is taking place, in order to demonstrate a relationship. A questionnaire could capture three levels of information: Is there a policy that requires an audit? Is there a policy that requires Sourcing? Is there information about actual turnover of certified goods? A list of biodiversity-relevant standards would need to be compiled
Theoretically there is a relationship, but it can’t be quantified (unlike Indicator A), and companies may identify an issue but not necessarily be acting upon it. BSI does not have a list of certified companies, but UKAS possibly could
23

Business – Assessment against evaluation criteriaCriterion Indicator A Indicator B Indicator C Indicator D
13. Sensitive to change
Need better definition as to who the decision-makers are i.e. government or businesses
Need better definition as to who the decision-makers are i.e. government or businesses. On a temporal basis it was agreed that change is detected, but on a spatial scale it depends on who is being surveyed and the scale of business should be defined
Need better definition as to who the decision-makers are i.e. government or businesses. On a temporal basis it was agreed that change is detected, but on a spatial scale it depends on who is being surveyed and the scale of business should be defined
Need better definition as to who the decision-makers are i.e. government or businesses
14. Human-induced vs natural changes
Criterion considered irrelevant for business indicators
Criterion considered irrelevant for the business indicators
Criterion considered irrelevant for the business indicators
Criterion considered irrelevant for the business indicators
15. Communication Disagreed with the options paper, stating that the indicator is complex, difficult to communicate and not accepted by all major stakeholders, as opposed to simple, easy to communicate and accepted. If asking a CEO, it will probably be better understood, than asking someone to answer that works for the business on-the-ground or in a more junior position; this is due to understanding and interpretation of the meaning of the word biodiversity, and so the question would have to be carefully phrased and targeted
Communicating the results would be simple enough, but communicating the survey to businesses would be difficult without careful wording. It depends on the interpretation and understanding of biodiversity
Queried whether the indicator is accepted by all major stakeholders. There was some debate in the group about what the indicator is actually measuring and some confusion in the interpretation
24

25

Workshop Participants
Awareness
Sarah Thomas ZSL (Facilitator)Pippa Gibson DefraKaren Haysom Bat Conservation TrustMary Jeavans DefraSue Marrs Scottish Natural HeritageSteve Whitbread National Biodiversity NetworkJames Williams JNCC
Ecosystem Services
Louise McRae ZSL (Facilitator)Judith Annett Northern Ireland Biodiversity GroupLynn Dicks Cambridge UniversityAlistair McVittie Scottish Agricultural CollegeDiana Mortimer JNCCLisa Norton Centre for Ecology and HydrologyDeborah Proctor JNCCMark Tibbett Cranfield UniversityMegan Tierney UNEP-WCMCHelen Ward DefraDuncan Williams Defra
Business
Liz Clarke ZSL (Facilitator)Zoe Balmforth Fauna and Flora InternationalAdam Dutton RSPBAmanda Kiely BSIMarta Maireles ISEALMark Stevenson DefraMatthew Wenban-Smith OneWorldStandardsClare Winton Defra
26

Agenda
Date: Friday 5th July, 10:00-15:45
Location: Zoological Society of London (ZSL), Regent’s Park.
Agenda:
09:30-10:00 Registration, tea and coffee
10:00-10:10 Welcome – Pippa Gibson (BISG Chair)
10:10-10:30 Context / process to-date – James Williams (JNCC)
10:30-10:45 Workshop format – Liz Clarke (ZSL)
10:45-12:15 Break-out session 1: Indicator appropriateness
12:15-13:00 Lunch
13:00-14:30 Break-out session 2: Indicator implementation
14:30-14:50 Refreshment break
14:50-15:20 Break-out session 3: Recap and recommendations
15:20-15:45 Next steps and closing remarks
27