Uitnodiging Particulate matter emission from livestock houses
290
Particulate matter emission from livestock houses: measurement methods, emission levels and abatement systems Albert Winkel
Transcript of Uitnodiging Particulate matter emission from livestock houses

Particulate matter emission from livestock houses:
measurement methods, emission levels and abatement systems
Albert Winkel
Particulate matter em
ission from livestock houses:
measurem
ent methods, em
ission levels and abatement system
s Albert W
inkel 2016
41988 Winkel, Albert Cover en uitn kaart.indd 1 12-09-16 21:06
Uitnodiging
Voor het bijwonen van de openbare verdediging van het proefschrift:
Particulate matter emission
from livestock houses: measurement methods,
emission levels and abatement systems
door
Albert Winkel
Op vrijdag 21 oktober 2016 om 11:00 uur
in de Aula van Wageningen
Universiteit, Generaal Foulkesweg 1a, Wageningen
met een receptie na afloop van de
ceremonie
Albert [email protected]
0317-480491
Paranimfen
Julio Mosquera [email protected]
0317-480386
Gelein [email protected]
058-2846185
41988 Winkel, Albert Cover en uitn kaart.indd 2 12-09-16 21:06


Particulate matter emission from livestock
houses: measurement methods, emission levels
and abatement systems
Albert Winkel

Thesis committee
Promotor
Prof. Dr Peter W.G. Groot Koerkamp
Professor of Farm Technology
Wageningen University
Co-promotors
Dr Nico W.M. Ogink
Senior scientist
Wageningen UR Livestock Research
Dr André J.A. Aarnink
Senior scientist
Wageningen UR Livestock Research
Other members
Prof. Dr Maarten C. Krol, Wageningen University
Prof. Dr Hongwei Xin, Iowa State University, Ames, USA
Prof. Dr Wolfgang Büscher, Bonn University, Germany
Prof. Dr Dick J.J. Heederik, Utrecht University, the Netherlands
This research was conducted under the auspices of the Graduate School of Wageningen Institute
of Animal Sciences (WIAS).

Particulate matter emission from livestock
houses: measurement methods, emission levels
and abatement systems
Albert Winkel
Thesis
submitted in fulfilment of the requirements for the degree of doctor
at Wageningen University
by the authority of the Rector Magnificus
Prof. Dr A.P.J. Mol,
in the presence of the
Thesis Committee appointed by the Academic Board
to be defended in public
on Friday 21 October 2016
at 11 a.m. in the Aula.

Albert Winkel
Particulate matter emission from livestock houses: measurement methods, emission levels and
abatement systems, 279 pages.
PhD thesis, Wageningen University, Wageningen, NL (2016)
With references, with summary in English
ISBN: 978-94-6332-084-9
DOI: http://dx.doi.org/10.18174/390454

Contents
Chapter 1 General introduction 1
Chapter 2 Emissions of particulate matter from animal houses in the Netherlands Atmospheric Environment (2015) 111:202–212
15
Chapter 3 Abatement of particulate matter emission from experimental broiler
housings using an optimized oil spraying methodTransactions of the ASABE (2014) 57:1853–1864
51
Chapter 4 Abatement of particulate matter emission from experimental aviary housings
for laying hens by spraying rapeseed oilPoultry Science (2016), in press
77
Chapter 5 Evaluation of oil spraying systems and air ionization systems for abatement
of particulate matter emission in commercial poultry housesBiosystems Engineering (2016) 150:104–122
101
Chapter 6 Evaluation of a dry filter and an electrostatic precipitator for exhaust air
cleaning at commercial non-cage laying hen housesBiosystems Engineering (2015) 129:212–225
135
Chapter 7 Evaluation of manure drying tunnels to serve as dust filters in the exhaust
of laying hen houses: emissions of particulate matter, ammonia, and odourSubmitted for publication to Biosystems Engineering
163
Chapter 8 Equivalence testing of filter-based, beta-attenuation, TEOM, and light-
scattering devices for measurement of PM10 concentration in animal housesJournal of Aerosol Science (2015) 80:11–26
197
Chapter 9 General discussion, conclusions, and recommendations for future research 229
Summary 253
Epilogue 261
About the author 265


Chapter 1General introduction

Chapter 1
2
This first chapter serves four purposes. First, it provides a knowledge basis to the reader to
facilitate the reading of the following chapters. Second, it defines the central problem the work in
this thesis dealt with. Third, it identifies what it aimed to contribute to that problem. And finally,
it familiarizes the reader with the content and structure of the thesis.
INTRODUCTION INTO THE TOPIC
In many parts of the world important food products such as meat, eggs, and milk are produced
by animals kept in buildings. The way animals are housed in livestock farming has changed
considerably over the last decades. Animal houses have become highly specialized for specific
animal types and have grown in size and number of animal places. Nowadays, they contain many
mechanical and computerized systems, such as feeding systems, milking systems, egg collection
systems, and ventilation systems. These developments have replaced heavy duty hand work,
increased labor productivity, increased the performance of the animals, and allowed farmers to
maintain sufficient income from their farm at narrow financial margins.
Early in the emerging of modern-day animal houses, it was identified that their indoor
environment is extremely dusty. Koon et al. (1963), for instance, already studied the origin and
composition of poultry dust in 1963, more than half a century ago, and stated in the first line of
their paper that ‘dust is a major problem in poultry environmental control’.
What is dust or particulate matter? The term ‘dust’ is often used in popular language, whereas
this thesis uses the term particulate matter (PM). The latter term is used to refer to ‘fine solid or
liquid particles suspended in a gaseous medium’ and is synonymous to the term aerosol. The
term dust more specifically refers to solid particles (not liquid, and not necessarily fine) released
from mechanical processes (Cambra-López et al. 2010). Besides these three terms (dust,
particulate matter, aerosol), there are many terms used in the field of aerosol science. For clarity,
Table 1 provides an overview of twenty commonly used terms, and their particle size range,
definition, and applicable standards.
The ‘solid and liquid particles suspended in air’ are small: their diameter is usually expressed
in micrometers (µm; i.e., one thousandth of a millimeter). PM is classified according to either the
main region of deposition in the respiratory tract (terms used in the field of occupational health)
or the sampling cut-off size (terms used in the field of atmospheric science). In the latter
classification, abbreviations in the form PMxx are used where PM stands for particulate matter
and ‘xx’ denotes the upper size limit of the particles in μm (Table 1).

General introduction
3
Table 1Overview of terms, particle size ranges (fractions) and definitions, and applicable standards (Winkel et al., 2014a).
Term Fraction(PMxx)
Definition Standard Reference;First author (year)
Dust Not a fraction
‘Solid particles (settled or airborne) formed by mechanical fracture of a parental material, which can sediment under gravity forces, with diameters up to 500 or 1000 µm’
- Cambra-López (2010)
Particulate matter(= aerosol)
Not a fraction
Fine solid or liquid particles suspended in a gaseous medium
- Cambra-López (2010)
Total airborne particles
Not a fraction
Theoretical term in ISO 7708 to refer to ‘all particles surrounded by air in a given volume of air’
ISO 7708 ISO (1995)
Suspended particulate matter (SPM)
Not afraction
Theoretical term used in 40 CFR 50, EN 12341, and EN 14907: ‘notion of all particles surrounded by air in a given, undisturbed volume of air’
EN 12341EN 14907
CEN (1998)CEN (2005)
Total dust Undefined Term for airborne particles that can be collected using 37-mm filter cassettes
NIOSH method 0500
NIOSH (1994)
Total suspendedparticles (TSP)
~PM35 Archaic US-EPA term for ambient PM: particles up to 25–50 µm, depending on wind speed and direction
40 CFR 50, appendix B
US-EPA (2014)
Inhalable dust (= inspirable dust)
~PM100 ‘Mass fraction of total airborne particles which is inhaled through the nose and mouth’
ISO 7708EN 481
ISO (1995)CEN (1993)
Extrathoracic fraction
~PM100–10 ‘Mass fraction of inhaled particles that fail to penetrate beyond the larynx’
ISO 7708EN 481
ISO (1995)CEN (1993)
Thoracic fraction
~PM10 ‘Mass fraction of total airborne particles which penetrate beyond the larynx’
ISO 7708EN 481
ISO (1995)CEN (1993)
Fine dust (or: PM10) PM10 ‘Particulate matter which passes through a size-selective inlet with a 50% efficiency cut-off at 10 μm aerodynamic diameter’ *)
EN 12341 CEN (1998)
Tracheobronchialfraction
~PM10–4 ‘Mass fraction of inhaled particles which penetrate beyond the larynx, but which fail to penetrate to the unciliated airways’
ISO 7708EN 481
ISO (1995)
Coarse fraction PM10–2.5 Particles bigger than 2.5 µm and smaller than 10 µm diameter (PM10 minus PM2.5)
- US-EPA (2004)Cambra-López (2010)
‘Healthy adult’ respirable fraction‘High risk’respirable fraction
~PM4
~PM2.5
‘Mass fraction of inhaled particles which penetrate to the unciliated airways’
ISO 7708 ISO (1995)
PM2.5(or ‘fine fraction’, next to ‘coarse’)
PM2.5 ‘Particulate matter which passes through a size-selective inlet with a 50% efficiency cut-off at 2.5 μm aerodynamic diameter’
EN 14907 CEN (2005)
Submicron particles PM1 Particles smaller than 1 µm in diameter - Cambra-López (2010)Nanoparticles(= ultrafine particles)
PM0.1 Particles between 0.001 µm (1 nm) and 0.1 µm (100 nm)
- -
*) The aerodynamic diameter of an irregular particle is equal to the diameter of a sphere with a density of 1 g cm–3 that has the same terminal falling velocity as the irregular particle.
Microscopic images of airborne particles in animal houses show that they are far from
perfectly round, smooth and homogenous spheres (Cambra-Lopez et al., 2011; Nannen et al.,
2004). Instead, they can be described as ovals, pyramids or cones, cubes, cylinders or rods,
fibers, flakes, and so on. They can also be aggregates of multiple particles and have small spaces

Chapter 1
4
of air inside. Their surface layer can be smooth, rough, layered, or cracked. Therefore, it is often
not meaningful to describe the size of a particle in terms of its radius (r) or diameter (d, or 2r).
More commonly, the diameter of airborne particles larger than 0.5 µm are presented as
aerodynamic diameter. The aerodynamic diameter of an irregular particle is equal to the
diameter of a sphere with a density of 1 g cm–3 that has the same terminal falling velocity as the
irregular particle. Airborne particles can be sampled based on their aerodynamic behavior by
sucking air through an impactor or cyclone which selectively remove particles larger than a
certain aerodynamic diameter (cutpoint) from the air flow. The particles smaller than the
cutpoint of the pre-separator, remain airborne in the sample air flow for determination of their
mass (e.g., by collecting particles on filters that are weighed before and after loading). Another
way of defining the diameter of a particle is by instruments that direct single particles through a
light-scattering chamber. In this chamber, a beam of light is directed to the particle. The amount
of scattered light, as determined by a sensor, is a measure for the size of the particle. When the
instrument is calibrated with aerosols from latex spheres with a known diameter, the reading of
the irregular particle can be expressed as optical latex-equivalent diameter. Such instruments
measure particle numbers and size and calculate the mass concentration of particles in the
sample air by assuming them to be spheres with a certain density.
Where do airborne particles inside animal houses come from? Table 2 shows the results of
eight studies into this matter. The main sources of PM in poultry houses are the droppings of
laying hens and broilers (i.e., manure and uric acid) and feathers, bedding material, and feed. In
pig houses, skin flakes and hair are important additional sources. In dairy cattle kept in cubicle
houses, wood shavings, straw, and silage are important sources, next to manure and concentrate
feed. Fig. 1 shows that these sources are subject to three important processes: evaporation of
water (e.g., through the heat produced by the animals and ventilation air exchange),
disintegration into smaller particles (e.g., by scouring, trampling, or chewing) and aerosolization
into the air (e.g., by running or wing flapping of the animals).
THE PROBLEM
Due to its organic nature, PM inside animal houses contains high levels of endotoxins (i.e.,
pro-inflammatory compounds from the outer membrane of Gram-negative bacteria) and micro-
organisms (Seedorf et al., 1998; Winkel et al., 2014b). Farmers are chronically exposed to these
components during work (Fig. 1) which is associated with respiratory problems such as Organic
Dust Toxic Syndrome (ODTS; characterized by reversible flu-like symptoms), Chronic

General introduction
5
Obstructive Pulmonary Disease (COPD), asthma (i.e., recurrent episodes of inflammation and
obstruction of the lower airways), accelerated lung function decline, and general complaints,
such as wheezing and coughing (Eduard et al., 2004, 2009; Omland, 2002; Seiffert et al., 2003).
Table 2Overview of studies into sources of particulate matter in animal houses (adapted from Winkel et al., 2014b).
First author (year)
Loc. Animal species PMfraction
Sources and contributions identified
PoultryKoon (1963) USA Layers, cage Total dust Skin flakes, feed, feathersFeddes (1992) CAN Turkeys PM5 70% manure, 28% uric acid
PM10–5 70% manure, 20% uric acid, 4% feed, 1% feathers, 1% skin>PM10 43% manure, 29% skin, 12% feathers, 6% feed, 2% uric acid
Aarnink (1999) NL Broilers Total dust Feathers (>10%), uric acid (>10%), feed (<3%), micro-organisms (<3%), manure (<1%)
Aarnink (2011) ;Cambra-López (2011)
NL Turkeys PM2.5 39% feathers, 35% manure, 26% beddingPM10–2.5 52% manure, 25% feathers, 23% bedding
Broilers PM2.5 72% manure, 21% feathers, 6% bedding, 1% ambient PMPM10–2.5 96% manure, 4% feathers
Layers, floor PM2.5 54% manure, 23% feed, 17% feathers, 6% ambient PMPM10–2.5 86% manure, 15% feathers
Layers, aviary PM2.5 64% manure, 36% feathersPM10–2.5 70% manure, 30% feathers
PigsCurtis (1975) USA Fattening pigs and
sowsTotal dust Conclusion: barn PM contains more N than the feed; PM
most likely originates from feed, manure, skin, hairDonham (1986) USA Sows, piglets and
fattening pigsTotal dust Manure (bacteria, epithelial cells, undigested feed; main
source), feed (starch, grains), skin flakes, hair, fungi, seed and grain parts, insects, mineral ash
Heber (1988) USA Fattening pigs Total dust Feed (starch, grain; main source), skin flakesAarnink (1999) NL Piglets Total dust Feed (>10%), skin flakes (>10%), manure (1–3%),
crystalline PM from urine (1–3%), no micro-organismsAarnink (2003) NL Fattening pigs,
40% slatted floorInh. dust Comparable contributions of manure, feed en skin
Fattening pigs, 40% slatted floor, some bedding
Inh. dust Comparable contributions of manure, skin and straw; little contribution of feed
Fattening pigs, solid floor with straw; outdoor run
Inh. dust Comparable contributions of skin and straw; little contributions of manure; smallest contribution of feed
Aarnink (2011)en Cambra-López(2011)
NL Piglets PM2.5 95% manure, 5% skin, <1% feed, 0% ambient PMPM10–2.5 92% manure, 8% skin, 0% feed, 0% ambient PM
Fattening pigs PM2.5 93% manure, 6% skin, <1% feed, <1% ambient PMPM10–2.5 69% skin, 30% manure, 1% feed, 0% ambient PM
Sows PM2.5 79% skin, 17% manure, 4% feed, <1% ambient PMPM10–2.5 71% skin, 29% manure, 0% feed, 0% ambient PM
CattleAarnink (2011) ;Cambra-López(2011)
NL Dairy cows PM2.5 37% straw, 29% manure, 23% silage, 8% bedding, 3% ambient PM, 0% concentrate feed
PM10–2.5 27% wood shavings, 22% straw, 21% manure, 17% silage, 12% concentrate feed, 1% ambient PM

Chapter 1
6
Fig. 1Infographic that summarizes the central problem of this thesis: inside (upper picture) and outside (lower picture) the animal house.
Next to the farmers, animals are chronically exposed as well (Fig. 1). Adverse effects of PM
exposure in animals are not always established in scientific studies. This could be caused by the
fact that farming animals live relatively short (i.e., the exposure duration is limited) or are able to
maintain resilient to a single stressor in the absence of other co-challenges. Studies on PM
exposure in pigs report effects in terms of more cases of atrophic rhinitis, pneumonia, and
pleuritis, decreased feed intake, and decreased growth (Hamilton et al., 1999; Murphy and
Cargill, 2004; Wathes et al., 2004). Studies in chickens report effects in terms of lesions
throughout the trachea and air sacks, reduced growth, and increased mortality (Anderson et al.,
1968; Guarino et al., 1999; Al Homidan et al., 2003).
Skin Feed
2.Emission to
ambientenvironment
3.Dispersion
Dilution
4.Inactivation
Sedimentation
5.Exposure
6.Dose
7.Healtheffect
(response)
?
1.Sources > evaporation,
disintegration,aerosolization, and
sedimentation
Uric acid Hair BeddingFeathersManure
AerosolizationDisintegrationEvaporation
Ambientparticles
Emissionto ambientenvironment
Air velocity (m/s)Temperature (°C)Rel. humidity (%)Animal activity
Sedimentation
Chronic exposure of workers and animals
Airborne particles with micro-organisms and endotoxin
Fresh air inlet
13663.00
8056.97
8137.11
6831
.96
6796
.601
200.
00

General introduction
7
Table 3Overview of studies which determined particulate matter concentrations downwind of livestock farms (adapted from Winkel et al., 2014b). Inside and downwind concentrations that exceed upwind concentrations are presented in bold.
First author
Loc. Farm characteristics Sampling duration
PM fraction PM concentration (µg m–3)
(year) Upwind Inside and downwindPoultrySchmidt(1996)
Germ. Two laying hen farms and two broiler farms
30 min Total dust n.g. Inside: 80–2750At 3 m: circa 30–1200At 10 m: <400At 50 and 100 m: <4
Seedorf (1998)
Germ. Fattening duck house, roof outlet; 2146 animals
18.5 h Total dust 114 Inside: 1900At 25 m: 123
Visser (2006)
USA Farm with 7 broiler houses; tunnel ventilation; 193,900 animals; age: 24–35 d
24–48 h PM2.5 24.0 a Inside: 58.6 **At 30 m: 24.1 n.s.
At 91 m: 24.9 n.s.
At 152 m: 23.1 n.s.
Worley (2013)
USA Farm with 3 broiler houses; tunnel ventilation; 94,000 animals, age: 29–56 d
22 h PM2.5 Circa 31 a Inside: 71.7 *At 30 m: 45.1 *At 61 m: 36.3 n.s.
At 91 m: circa 34 n.s.
At 152 m: circa 32 n.s.
Li(2010)
USA Farm with 4 broiler houses; tunnel ventilation; 86,000animals; age: 42–49 d
4 h Total dust 290 a At 4.6 m: 3848At 31–61 m: 978
Li(2012)
USA Farm with 9 laying hen houses 24 h PM2.5 10.7 a
10.4 aAt 91 m: +0.61 *At 153 m: +0.38 *
PM10 22.3 a
18.0 aAt 91 m: +4.98 *At 153 m: +3.40 *
PigsHartung (1998)
Germ. Pig house; 1000 animals, fully slatted floor; liquid feeding
24 h Total dust 37 Inside: 600At 50 m: 80At 115 m: 37
Martin (2008)
USA Farm with 3 houses (‘deep pit’); nat. ventilation; 3750 animals
23 h PM10 37.9 a Between houses: +25.1At 39 m: +15.8At 15–50 m: +5.8
Thorne (2009)
USA Farm with 3 open houses with littered floor; 600 animals
4 h Inh. dust circa 50 b Inside: circa 1050 **At 30 m: circa 500 **At 160 m: circa 300 ns
Farm with 1 house (‘deep pit’); 1200 animals
4 h Inh. dust circa 100 b Inside: circa 1100 **At 30 m: circa 120 ns
At 160 m: circa 130 ns
a Arithmetic mean; b Geometric mean or median.ns Not significant (P ≤ 0.05), * significant (P ≤ 0.05), or ** highly significant (P ≤ 0.01); difference from upwind concentration.n.d.: not determined.
Since animal houses are ventilated, large amounts of PM are emitted into the atmosphere as
well (Fig. 1; step 2 in the lower picture). Locally, plumes of particles can be found outside
ventilation exhausts which spread out in detectable concentrations downwind of livestock farms
(Table 3). Concentrations generally decrease rapidly with distance from the exhaust, because
particles are diluted with cleaner air, sediment to the ground or impact to vegetation or other
objects (Fig. 1; step 3 in the lower picture). Furthermore, part of the micro-organisms present in

Chapter 1
8
PM becomes inactivated through factors as UV-radiation, temperature, and humidity (Zhao et
al., 2014). Eventually, neighboring residents of livestock farms may be exposed to elevated
levels of livestock-related PM (Table 3).
For some areas in the Netherlands, it was estimated that animal houses raise ambient
concentrations of PM10 by several micrograms per cubic meter (Velders et al., 2008). On a
national scale, PM10 emissions from animal houses make up approximately 17% of the total
primary PM10 emission (CBS, 2009). Studies on urban aerosols show associations between PM10
concentration and respiratory and cardiovascular disease (Brunekreef and Holgate, 2002;
Brunekreef and Forsberg, 2005; Pope and Dockery, 2006). For livestock PM, health effects of
ambient exposure (Fig. 1; step 5 through 7) are less well studied. Recent studies suggest both
protective effects (e.g., a lower prevalence of asthma) and adverse effects (e.g., a higher
prevalence of pneumonia) (e.g., Heederik et al., 2012).
Fig. 1 illustrates that the problem of this thesis lies at three main levels: PM exposure of the
farmer, PM exposure of the animals, and PM exposure of the residents living in the vicinity of
livestock farms. The primary focus of this thesis is on the cause of the latter problem, namely: on
emissions of PM from livestock farms.
RESEARCH NEEDS WITH REGARD TO THE PROBLEM
To protect the health of its residents, maximum PM limit values for ambient air were set by
the European Union (European Directives 1996/62/EC, 1999/30/EC, and 2008/50/EC). As from
January 2005, the daily average limit for PM10 is set at 50 μg m–3 with 35 exceedances allowed
per year. The annual average limits are set at 40 μg m–3 for PM10 and 25 μg m–3 for PM2.5.
Atmospheric modelling of PM concentrations in the Netherlands indicate that the daily average
PM10 limit of 50 μg m–3 is exceeded more often than the allowed 35 days per year in the vicinity
of (amongst others) a few hundred animal houses in the Netherlands (Beijk et al. 2010; Van
Zanten et al., 2012). There is, however, uncertainty about the actual PM emission rates of animal
houses, used in the aforementioned modelling. The latest extensive field survey on emissions of
airborne PM from animal houses in Europe goes back to a study in the nineties of the previous
century carried out by Takai et al. (1998). In their work, the inhalable and respirable PM
fractions, often used in occupational exposure measurements (Table 1), were determined,
equivalent to PM100 and PM4 respectively. To date, there is a need for data on the PM10 and
PM2.5 fractions applied in atmospheric air quality and related legislation.

General introduction
9
Furthermore, there is an urgent need for effective measures that enable animal farmers to
mitigate these emissions. Such measures may reduce the generation of PM or its uptake in the
air, remove PM when it has already become airborne inside the animal house, or remove PM
from the air at the ventilation exhausts (so-called end of pipe systems).
Finally, it is essential to have PM samplers available that are able to measure the high
concentrations in animal house environments, so that emission rates can actually be quantified
and PM removal performances of abatement measures can be assessed. Before the work
described in this thesis started, such a sampler was developed at Wageningen UR (Hofschreuder
et al., 2008), based on the European reference samplers for PM10 (CEN, 1998) and PM2.5 (CEN,
2005). This sampler has been used throughout this thesis. There are, however, alternative
samplers with various working principles available on the market and employed by other
institutes. Very little is known about the accuracy and comparability of these alternative
samplers that are usually designed to sample in ambient air at much lower PM concentrations.
OBJECTIVES AND OUTLINE OF THIS THESIS
In view of the problem and research needs described above, the work described in this thesis
had three main objectives.
The first objective was to increase our understanding and knowledge of concentrations and
emission rates of particulate matter in commonly applied animal housing types. This objective is
worked out in chapter 2. This chapter describes a national emission survey that covered 13
housing systems for poultry, pigs, and dairy cattle, and included 36 farm locations. The results
from this chapter can be used to develop abatement solutions, to adopt emission factors in
legislation, to estimate national emissions, ambient PM concentrations and exceedances, to
facilitate policy making, and to allow environmental permit granting to farmers.
The second objective was to develop, test, and validate technologies to mitigate PM
concentrations and emissions such that these systems will become available for use in poultry
farms, and ultimately contribute to cleaner outdoor air. This thesis specifically focused on
systems for poultry farms as these have the highest emission levels. The systems should be
effective in terms of their reduction as validated on commercial farms, affordable for farmers,
and practically implementable within common housing systems and farming practices. This
objective is worked out in chapters 3 through 7. Chapters 3 and 4 describe two experiments that
investigated the effects of spraying rapeseed oil onto the litter of poultry houses on PM
concentrations and emissions, but also on the birds. These studies were done inside small-scaled

Chapter 1
10
experimental broiler houses (chapter 3) and in small-scaled experimental aviary houses for
laying hens (chapter 4). The results from these two chapters were intended to facilitate the
effective and safe use of oil spraying systems inside commercial poultry farms. On the basis of
chapters 3 and 4, chapter 5 describes a field evaluation of four systems that mitigate PM
emissions by reducing indoor concentrations in commercial poultry farms, namely: a fixed oil
spraying system, an autonomously driving oil spraying vehicle, a negative air ionization system,
and a positive air ionization system. Chapter 6 describes another field evaluation. This evaluation
comprised two ‘end of pipe’ systems to remove PM from the exhaust air of poultry farms,
namely: a dry filter wall and an electrostatic precipitator. Chapter 7 describes an emission
survey carried out at a total of 16 commercial poultry farms with an ‘end of pipe’ manure drying
tunnel. This chapter aimed to elucidate the PM abatement potential and possible additional
emissions of ammonia and odor of these tunnels. Furthermore, this chapter aimed to elucidate
the perspective of two strategies to reduce any additional emissions from the manure drying
tunnels. The results from chapters 5 through 7, carried out at commercial farms, can be used to
adopt accurate PM removal figures in legislation.
Finally, the third objective was to determine the applicability (in terms of acceptable accuracy
and comparability) of alternative PM10 measurement methods – i.e., alternative to the sampler
developed by Hofschreuder et al. (2008) and used in chapters 2 through 7. Such alternative
samplers could then be applied in future for determination of PM10 emission rates of animal
houses. This objective has been worked out in chapter 8 as an equivalence study between the
European reference sampler for PM10 (described in EN 12341) and four different candidate
measurement methods (the ‘cyclone sampler’ developed by Hofschreuder et al. (2008), a beta-
ray attenuation sampler, and two light-scattering devices) in four different environments (a
fattening pig house, a laying hen house, a broiler house, and an office room). The results from
this chapter can be used to harmonize PM10 measurement methods across institutes and to further
increase the availability of samplers for the measurement of PM10 in animal production.
REFERENCES
Aarnink, A.J.A., Cambra-López, M., Lai, T.L.H., Ogink, N.W.M., 2011. Deeltjesgrootteverdeling en bronnen van stof in stallen [Size distribution and sources of particulate matter in animal houses]. Wageningen University and Research Centre, Livestock Research, Lelystad, the Netherlands.
Aarnink, A.J.A., Roelofs, P.F.M.M., Ellen, H.H., Gunnink, H., 1999. Dust sources in animal houses. International Symposium on Dust Control in Animal Production Facilities. Danish Institute of Animal Science Aarhus, Denmark, pp. 34-40.
Aarnink, A.J.A., Stockhofe-Zurwieden, N., 2003. Pig house dust damage. Pig progress 19, 17-19.

General introduction
11
Beijk, R., Wesseling, J., Mooibroek, D., Du Pon, B., Groot Wassink, H., Verbeek., C., 2010. Monitoringsrapportage NSL 2010 [State of affairs of the National Air Quality Cooperation Programme 2010; in Dutch, with English summary]. Report 680712002. National Institute for Public Health and the Environment (RIVM), Bilthoven, the Netherlands.
Brunekreef, B., Forsberg, B., 2005. Epidemiological evidence of effects of coarse airborne particles on health. Eur. Resp. J. 26:309–318.
Brunekreef, B., Holgate, S.T., 2002. Air pollution and health. Lancet 360:1233–1242.Cambra-López, M., Aarnink, A.J.A., Zhao, Y., Calvet, S., Torres, A.G., 2010. Airborne particulate matter from
livestock production systems: A review of an air pollution problem. Environ. Pollut. 158:1–17.Cambra-López, M., Hermosilla, T., Lai, H.T.L., Aarnink, A.J.A., Ogink, N.W.M., 2011. Particulate matter emitted
from poultry and pig houses: Source identification and quantification. Trans. ASABE 54: 629–642.CBS, PBL, WUR, 2009. Emissies van fijn stof, vluchtige organische stoffen en koolmonoxide 1990-2009
(Emissions of fine dust, volatile organic compounds and carbon monoxide 1990-2009). Centraal Bureau voor de Statistiek, Planbureau voor de Leefomgeving, Wageningen University and Research Centre. Available at: http://www.compendiumvoordeleefomgeving.nl. Accessed 1 June.
CEN, 1993. EN 481:1993. Workplace atmospheres - Size fraction definitions for measurement of airborne particles. Comité Européen de Normalisation (CEN; European Committee for Standardization), Brussels, Belgium.
CEN, 1998. EN 12341:1998. Air quality - Determination of the PM 10 fraction of suspended particulate matter -Reference method and field test procedure to demonstrate reference equivalence of measurement methods. Comité Européen de Normalisation (CEN; European Committee for Standardization), Brussels, Belgium.
CEN, 2005. EN 14907:2005. Ambient air quality - Standard gravimetric measurement method for the determination of the PM2.5 mass fraction of suspended particulate matter. Comité Européen de Normalisation (CEN; European Committee for Standardization), Brussels, Belgium.
Curtis, S.E., Drummond, J.G., Grunloh, D.J., Lynch, P.B., Jensen, A.H., 1975. Relative and qualitative aspects of aerial bacteria and dust in swine houses. J. Anim. Sci. 41:1512–1520.
Donham, K.J., Popendorf, W., Palmgren, U., Larsson, L., 1986. Characterization of dusts collected from swine confinement buildings. Am. J. Ind. Med. 10:294–297.
Eduard, W., Douwes, J., Omenaas, E., Heederik, D., 2004. Do farming exposures cause or prevent asthma? Results from a study of adult Norwegian farmers. Thorax 59:381–386.
Eduard, W., Pearce, N., Douwes, J., 2009. Chronic bronchitis, COPD, and lung function in farmers: The role of biological agents. Chest 136:716–725.
Feddes, J.J.R., Cook, H., J., Z.M., 1992. Characterization of airborne dust particles in turkey housing. Can. Agric. Eng. 34: 273–280.
Hamilton, T.D.C., Roe, J.M., Hayes, C.M., Jones, P., Pearson, G.R., Webster, A.J.F., 1999. Contributory and exacerbating roles of gaseous ammonia and organic dust in the etiology of atrophic rhinitis. Clin. Diagn. Lab. Immunol.6:199–203.
Hartung, J., Seedorf, J., Trickl, T., Gronauer, H., 1998. Emission and distribution of particulates from a piggery with a central air exhaust. Dtsch. Tierarztl. Wochenschr. 105:244–245.
Heber, A.J., Stroik, M., Faubion, J.M., Willard, L.H., 1988. Size distribution and identification of aerial dust particles in swine finishing buidlings. Trans ASAE 31:882–887.
Heederik, D.J.J., Opstal-van Winden, A.J.W., Smit, L.A.M., Wouters, I.M., Hooiveld, M., IJzermans, C.J., van der Sman-de Beer, F., Spreeuwenberg, P.P.M., de Bruin, A., van Rotterdam, B., 2011. Mogelijke effecten van intensieve-veehouderij op de gezondheid van omwonenden: onderzoek naar potentiële blootstelling en gezondheidsproblemen. Institute for Risk Assessment Sciences (IRAS), Universiteit Utrecht; Nederlands instituut voor onderzoek van de gezondheidszorg (NIVEL); Rijksinstituut voor Volksgezondheid en Milieu (RIVM), Utrecht, the Netherlands.
Hofschreuder, P., Yang, Z., Aarnink, A.J.A., Ogink, N.W.M., 2008. Measurement protocol for emissions of fine dust from animal houses: considerations, draft protocol and validation. Report 134, Animal Sciences Group, Wageningen University and Research Centre, Lelystad, the Netherlands.
ISO, 1995. ISO 7708. Air Quality – Particle size fraction definitions for health related sampling. International Organization for Standardization, Genève, Switzerland.
Koon, J., Howes, J.R., Grub, W., Rollo, C.A., 1963. Poultry dust: origin and composition. Agric. Eng. 44:608–609.Li, Q., Wang, L., Oviedo-Rondón, E., Parnell, C.B., 2010. Effect of ozonation on particulate matter in broiler
houses. Poult. Sci. 89:2052–2062.Li, Q.F., Wang-Li, L., Walker, J.T., Shah, S.B., Bloomfield, P., Jayanty, R.K.M., 2012. Particulate matter in the
vicinity of an egg production facility: Concentrations, statistical distributions, and upwind and downwind comparison. Trans. ASABE 55:1965–1973.
Martin, R.S., Silva, P.J., Moore, K., Erupe, M., Doshi, V.S., 2008. Particle composition and size distributions in and around a deep-pit swine operation, Ames, IA. J. Atmos. Chem. 59:135–150.

Chapter 1
12
Murphy, T., Cargill, C., 2004. The effects of indoor air pollutants on the health and production of growing pigs. Anim. Sci. Rev. 25:35N–44N.
Nannen, C., Schmitt-Pauksztat, G., Büscher, W., 2005. Mikroskopische Untersuchung von Staubpartikeln in Mastschweinestallen: Unterschiede zwischen Flüssig- und Trockenfütterung. Landtechnik 60:218–219.
NIOSH, 1994. Method 500: particulates not otherwise regulated (total dust or total aerosol mass). National Institute for Occupational Safety and Health (NIOSH). Available from: http://www.cdc.gov/niosh/docs/2003-154/pdfs/0500.pdf, NIOSH Manual of Analytical Methods (NMAM), 4th ed. U.S. Government Printing Office, Washington DC, USA.
Nannen, C., Schmitt-Pauksztat, G., Büscher, W., 2005. Mikroskopische Untersuchung von Staubpartikeln in Mastschweinestallen: Unterschiede zwischen Flüssig- und Trockenfütterung. Landtechnik 60, 218-219.
Omland, Ø., 2002. Exposure and respiratory health in farming in temperate zones - A review of the literature. Ann. Agric. Environ. Med. 9:119–136.
Pope, C.A., Dockery, D.W., 2006. Health effects of fine particulate air pollution: Lines that connect. J. Air Waste Manag. Assoc. 56:709–742.
Schmidt, R., Hoy, S., 1996. Investigations on dust emission from chicken and layer houses. Berl. Munch. Tierarztl. Wochenschr. 109:95–100.
Seedorf, J., Hartung, J., Schröder, M., Linkert, K.H., Phillips, V.R., Holden, M.R., Sneath, R.W., Short, J.L., White, R.P., Pedersen, S., Takai, H., Johnsen, J.O., Metz, J.H.M., Groot Koerkamp, P.W.G., Uenk, G.H., Wathes, C.M., 1998. Concentrations and emissions of airborne endotoxins and microorganisms in livestock buildings in Northern Europe. J. Agric. Eng. Res. 70:97–109.
Seedorf, J., Schröder, M., Hartung, J., 1998. Emissions and immisions of bio-aerosols from a duck fattening unit. Zentralbl. Hyg. Umweltmed. 201:387–403.
Seifert, S.A., Von Essen, S., Jacobitz, K., Crouch, R., Lintner, C.P., 2003. Organic dust toxic syndrome: A review. Clinical Toxicol. 41:185–193.
Takai, H., Pedersen, S., Johnsen, J.O., Metz, J.H.M., Groot Koerkamp, P.W.G., Uenk, G.H., Phillips, V.R., Holden, M.R., Sneath, R.W., Short, J.L., White, R.P., Hartung, J., Seedorf, J., Schröder, M., Linkert, K.H., Wathes, C.M., 1998. Concentrations and emissions of airborne dust in livestock buildings in Northern Europe. J. Agric. Eng. Res. 70:59–77.
Thorne, P.S., Ansley, A.C., Perry, S.S., 2009. Concentrations of bioaerosols, odors, and hydrogen sulfide inside and downwind from two types of swine livestock operations. J. Occup. Environ. Hyg. 6:211–220.
US-EPA, 2004. Air quality criteria for particulate matter - Volume I of II. United States Environmental Protection Agency, Research Triangle Park, Durham NC, USA.
US-EPA, 2014. Reference method for the determination of suspended particulate matter in the atmosphere (high-volume method), Electronic Code of Federal Regulations (CFR), Title 40 (Protection of Environment), Part 50 (National primary and secondary ambient air quality standards), Appendix B. Retrieved Februari 11, 2014, from: http://www.ecfr.gov.
Van Zanten, M.C., Van Alphen, A., Wesseling, J., Mooibroek, D., Nguyen, P.L., Groot Wassink, H., Verbeek, C., 2012. Monitoringsrapportage NSL 2012 [State of affairs of the National Air Quality Cooperation Programme 2012, in Dutch with English summary]. Report 680712004. National Institute for Public Health and the Environment (RIVM), Bilthoven, the Netherlands.
Velders, G.J.M., Aben, J.M.M., Blom, W.F., Van Dam, J.D., Elzenga, H.E., Geilenkirchen, G.P., Hammingh, P., Hoen, A., Jimmink, B.A., Koelemeijer, R.B.A., Matthijsen, J., Peek, C.J., Schilderman, C.B.W., van der Sluis, O.C., de Vries, W.J., 2008. Concentratiekaarten voor grootschalige luchtverontreiniging in Nederland, rapport 2008 [Large-scale air quality concentrations maps in the Netherlands, report 2008]. Milieu- en Natuurplanbureau, Bilthoven, the Netherlands.
Visser, M.C., Fairchild, B., Czarick, M., Lacy, M., Worley, J., Thompson, S., Kastner, J., Ritz, C., Naeher, L.P., 2006. Fine particle measurements inside and outside tunnel-ventilated broiler houses. J. Appl. Poult. Res.15:394–405.
Wathes, C.M., Demmers, T.G.M., Teer, N., White, R.P., Taylor, L.L., Bland, V., Jones, P., Armstrong, D., Gresham, A.C.J., Hartung, J., Chennells, D.J., Done, S.H., 2004. Production responses of weaned pigs after chronic exposure to airborne dust and ammonia. Anim. Sci. 78:87–97.
Winkel, A., Demeyer, P., Feilberg, A., Jørgensen, M., Puterflam, J., Engel, P., 2014a. Measurement of particulate matter: recommendations for the VERA test protocol on air cleaning technologies. Report 797 (produced under an ICT-AGRI project by: Wageningen University and Research Centre, Aarhus University, Danish Pig Research Centre, Institute for Agricultural and Fisheries Research (ILVO), the Technical Institute for Poultry Research (ITAVI), and the VERA Secretariat), Wageningen UR Livestock Research, Wageningen, the Netherlands.
Winkel, A., Wouters, I.M., Aarnink, A.J.A., Heederik, D.J.J., Ogink, N.W.M., 2014b. Emissies van endotoxinen uit de veehouderij: een literatuurstudie voor ontwikkeling van een toetsingskader [Emissions of endotoxins from animal production: a literature survey for development of an assessment framework; in Dutch, with English

General introduction
13
summary]. Report 773, Institute for Risk Assessment Sciences, Utrecht University and Wageningen UR Livestock Research, Wageningen, the Netherlands.
Worley, J.W., Naeher, L.P., Czarick, M., Fairchild, B.D., Ritz, C.W., Irvin-Barnwell, E., 2013. Monitoring of fine particulates downwind of broiler houses-A field study. J. Appl. Poult. Res. 22:351–360.
Zhao, Y., Aarnink, A.J.A., De Jong, M.C.M., Groot Koerkamp, P.W.G., 2014. Airborne microorganisms from livestock production systems and their relation to dust. Crit. Rev. Environ. Sci. Techn. 44:1071–1128.


Chapter 2Emissions of particulate matter from animal houses
in the Netherlands
A. Winkel a, J. Mosquera a, P.W.G. Groot Koerkamp a,b, N.W.M. Ogink a, and A.J.A. Aarnink a
a Wageningen UR Livestock Research, Wageningen, the Netherlandsb Farm Technology Group, Wageningen University, Wageningen, the Netherlands
Atmospheric Environment (2015) 111:202–212
Reprinted with permission from Elsevier Ltd
Available online at: http://dx.doi.org/10.1016/j.atmosenv.2015.03.047

Chapter 2
16
ABSTRACT
In the Netherlands, emissions from animal houses represent a major source of ambient
particulate matter (PM). The objective of the present paper was to provide accurate and up to
date concentrations and emission rates of PM10 and PM2.5 for commonly used animal housing
systems, under representative inside and outside climate conditions and ventilation rates. We set
up a national survey which covered 13 housing systems for poultry, pigs, and dairy cattle, and
included 36 farms. In total, 202 24-h measurements were carried out, which included
concentrations of inhalable PM, PM10, PM2.5, and CO2, ventilation rate, temperature, and relative
humidity. On an animal basis, geometric mean emission rates of PM10 ranged from 2.2 to 12.0
mg h–1 in poultry and from 7.3 to 22.5 mg h–1 in pigs. The mean PM10 emission rate in dairy
cattle was 8.5 mg h–1. Geometric mean emission rates of PM2.5 ranged from 0.11 to 2.41 mg h–1
in poultry and from 0.21 to 1.56 mg h–1 in pigs. The mean PM2.5 emission rate in dairy cattle was
1.65 mg h–1. Emissions are also reported per Livestock Unit and Heat Production Unit. PM
emission rates increased exponentially with increasing age in broilers and turkeys and increased
linearly with increasing age in weaners and fatteners. In laying hens, broiler breeders, sows, and
dairy cattle, emission levels were variable throughout the year.

Emissions of particulate matter from animal houses in the Netherlands
17
NOMENCLATURE
BRB Broilers BreedersBRO BroilersC The overall mean emission rate in Eq. 2, i.e., a constantCBM CO2 balance methodCO2 Carbon dioxide[CO2]exhaust Concentration of carbon dioxide in the exhaust air (ppm)[CO2]inlet Concentration of carbon dioxide in the inlet air (ppm)ΔCO2 Difference between the exhaust and inlet carbon dioxide concentration (ppm)DCH Dairy cattle in Cubicle Housingεj ~ N(0, σ2
j) Random effect of animal house j in Eq. 2; σ2j: pooled variance between houses
εij ~ N(0, σ2ij) Residual error term in Eq. 2, with σ2
ij being the pooled variance within housesFco2 Factor for conversion of total heat production to the volumetric CO2 production by the animal
and its manure (m3 h–1 kW–1)FTH Fattening pigs in Traditional HousingFLD Fattening pigs in Low NH3-emission housing and Dry feedFLL Fattening pigs in Low NH3-emission housing and Liquid feedGC Gas chromatographyHPU Heat Production Unit: a quantity of animals producing 1 kW of total heatInhalable PM The inhalable fraction of particulate matter as defined by ISO 7708 and EN 481KNMI Royal Netherlands Meteorological Institute, Bilthoven, the NetherlandsLAH Laying hens in Aviary HousingLFH Laying hens in Floor HousingLog(Yijk) Response variable in Eq. 2, i.e., the natural logarithm of the PM emission rate of measurement
i, in animal house j of housing system kLU Livestock Unit, i.e., 500 kg of live weightnanimals The number of animals present in a houseNAQM National Air Quality Monitoring network in the NetherlandsPAS Infrared photoacoustic spectroscopy (INNOVA 1312 device)PM Particulate matterPMemission Emission rate of particulate matter (mg h–1)[PM]exhaust Concentration of particulate matter in the exhaust air (mg m–3)[PM]inlet Concentration of particulate matter in the inlet air (mg m–3)PM10 Particulate matter which passes through a size-selective inlet with a 50% efficiency cut-off at
10 μm aerodynamic diameter (EN 12341)PM2.5 Particulate matter which passes through a size-selective inlet with a 50% efficiency cut-off at
2.5 μm aerodynamic diameter (EN 14907)SD Standard deviationSDBH Standard deviation between farm locations of the same housing systemSE Standard errorSIH Sows in Individual HousingSGH Sows in Group HousingSk Fixed effect of housing system k in Eq. 2TUR TurkeysQ Ventilation rate (m3 h–1)WFS Weaners on Fully Slatted floorsWPS Weaners on Partially Slatted floorsΦtotal Total heat production by the animal (Watt)

Chapter 2
18
INTRODUCTION
In recent decades, animal production in the Netherlands and many other European countries
has evolved from small-scale mixed farms to large-scale, specialized facilities. Considering that
the Netherlands is a small country (approximately 41,500 km2), it has a large number of residents
(approximately 16.8 million; 405 residents per km2) as well as a large animal production sector.
This sector consists of about 3.9 million head of cattle in 32,000 farms, 12 million pigs in 6500
farms, 45 million broilers in 640 farms, and 34 million laying hens in 1100 farms (PPE-PVE,
2012). The air inside animal houses usually contains high levels of particulate matter (PM)
(Takai et al., 1998). Mechanical and natural ventilation systems are used in these houses to
remove the heat, moisture, and carbon dioxide produced by the animals. As a result, large
quantities of PM are released into the atmosphere. Consequently, livestock PM emissions may
adversely affect the health of the general population (Brunekreef and Holgate, 2002; Pope and
Dockery, 2006), although very little is known about the specific impacts of ambient livestock
PM on the health of people in farming areas (Heederik et al., 2011). To protect the health of its
residents, the European Union has set maximum PM limit values for ambient air (European
Directives 1996/62/EC, 1999/30/EC, and 2008/50/EC). As from 1 January 2005, the daily
average limit for PM10 (PM with aerodynamic diameters smaller than 10 μm) was set at 50 μg m–
3 with 35 exceedances allowed per year. The annual average limit for PM10 was set at 40 μg m–3.
The annual average limit for PM with aerodynamic diameters smaller than 2.5 μm (PM2.5) was
set at 25 μg m–3, to be met by 2015. Currently, the PM10 limit is exceeded in some regions in the
Netherlands and a substantial part of these exceedances occur in close proximity to animal
houses (Van Zanten et al., 2012).
Data on PM emissions from animal housing systems are needed to estimate national emission
rates (kTon year–1), ambient PM concentrations, and exceedances, to facilitate policy making, to
adopt emission factors in legislation, to allow environmental permit granting to farmers, and to
effectively develop abatement solutions. The most comprehensive study yielding such data for
Northern-Europe is a field survey carried out in 329 animal houses in England, the Netherlands,
Denmark, and Germany, from September 1993 to November 1995 (Wathes et al., 1998). In this
project, the inhalable and respirable fractions were measured (described in ISO 7708 (ISO, 1995)
and EN 481 (CEN, 1993)). These are occupational health fractions corresponding with ~PM100
and ~PM4 respectively. In the current situation however, data is required on the PM10 and PM2.5
fractions defined in EN 12341 (CEN, 1998) and EN 14907 (CEN, 2005) respectively, which are
generally used in the field of atmospheric air quality (Cambra-López et al., 2010). Furthermore,

Emissions of particulate matter from animal houses in the Netherlands
19
changes in housing systems and management practices since the 1990s (such as non-cage layer
systems or dairy houses with open side walls) may have altered concentrations and emissions.
Therefore, there is a need for accurate, up to date, and housing system specific data on emissions
of PM10 and PM2.5 in the Netherlands.
The objective of the present paper was to determine concentrations and emissions of PM
(PM10 and PM2.5) under representative inside and outside climate conditions and ventilation rates
in animal houses in the Netherlands. To be able to make a comparison with the Northern-
European survey (Takai et al., 1998), inhalable PM concentrations and emissions were
determined in some housing systems as well.
METHODOLOGY
Outline of the survey
Within this study the measurement protocol for particulate matter of Ogink et al. (2011) was
followed. This protocol describes the measurement method and measurement strategy for
establishing PM emission factors of animal housing systems. In summary, 4 animal houses
(located at 4 different farms) of the same housing system must be measured to take variation
between houses into account (e.g., due to differences in animal breed or feeding). Variation
within houses (e.g., due to seasonal changes or increasing animal mass) is taken into account by
conducting 6 measurements per house over a certain time period. For animal houses with a stable
emission pattern over the production cycle (egg-laying poultry, sows, and dairy cows)
measurements must be spread over the year (one measurement per 2-month period). For growing
animals measurements must be spread over the production cycle. Broilers have an exponential
increase in PM emission (Aarnink et al., 2011) and for turkeys a similar exponential increase was
expected. To increase the accuracy of the yearly emission rate for these animal categories more
measurements were performed in the second phase of the growing period than in the first phase.
Variations within a day (e.g., due to light regime or temperature fluctuations) were taken into
account by conducting measurements over 24-h periods. This meant that establishing an
emission factor for one housing system required (4 houses × 6 =) 24 measurements. For efficient
use of the available budget within this project however, the number of farm locations was
reduced to 2 for those housing systems that were assumed to have a small impact on a national
scale, because of their relatively small number (Table 1).

Chapter 2
20
The survey covered 13 housing systems and was carried out at 36 different farm locations
throughout the Netherlands. In Table 1 a short description is provided of the layout of the
housing systems and their acronyms (which are further used in this paper). For a more extended
description of the housing systems see Supplementary information 1. At each house, 6
measurements were scheduled (except for DCH: 5). In total, this project yielded 202 successful
24-h measurements (96 in poultry, 86 in pigs, and 20 in dairy cattle) performed between August
2007 and November 2009.
Table 1Acronyms and main characteristics of the 13 housing systems in this study (h = house or houses).
Housing system: acronym and main characteristics Nr. ofhouses
LFH: laying hens in floor housing; ⅓ litter area (wood shavings, alfalfa), ⅔ elevated slatted floor above manure pit, forced drying of manure (1 h), laying nests, chain feeders and lines with nipple or round drinkers
4
LAH: laying hens in aviary housing; litter floor (wood shavings, sand), aviary systems with manure belts (forced drying: 3 h), laying nests, feeders and nipple drinkers, outdoor run (1 h)
4
BRB: broiler breeders in floor housing; ⅓ litter area (wood shavings), ⅔ elevated slatted floor with manure pit, laying nests, male feed pans, female chain feeders
2
BRO: broilers on full litter (wood shavings), lines with feed pans, lines with nipple drinkers and drip cups, hot-air blowers
4
TUR: male turkeys on full litter (wood shavings, straw), lines with feed pans, water troughs or round drinkers, hot-air blowers
2
SIH: sows in individual housing; rooms with feed alley and rows of confined gestation stalls, individual feed trough (dry feed) and drinking nipple, solid floor with slats, manure pit
2
SGH: sows in group housing; similar to SIH but free access to gestation stalls and slatted aisles 2WFS: weaners in rooms with feed alley and pens with fully slatted floor, manure pit, dry feed 2WPS: weaners; housing similar to WFS, but partially slatted floor (50%) 2FTH: fattening pigs in traditional housing; compartments with feed alley and trad. pens, partially slatted floor (43–53%), manure pit, dry feed
4
FLD: fattening pigs; compartments with feed alley and pens with partially slatted floor (40%), pit with slanted walls and vacuum system for manure removal (low NH3 emission), dry feed
2
FLL: fattening pigs; housing similar to FLD, but with liquid feed 2DCH: dairy cattle in traditional cubicle housing; cubicles in 2–4 rows, walking aisles with fully slatted concrete floors, automatic slurry scraper (2 h), slurry pit underneath slatted floor, drive through feed alley with feed fences, automatic concentrate feeders, water troughs, fan coolers (2 h)
4
Measurements
Sampling positions
Concentrations of aerial pollutants and environmental variables were determined at the air
inlet and exhaust points. Samplers for the ingoing air were positioned outside and upwind from
the building, within 2 m from an inlet opening. Here, we determined concentrations of PM10,
PM2.5, and CO2, and temperature and relative humidity. We did not determine background

Emissions of particulate matter from animal houses in the Netherlands
21
concentrations of inhalable PM. Samplers for the exhaust air were placed inside the building,
near emission points. For buildings with roof ventilators, samplers were mounted at a vertical
distance of 0.1 m under the ventilation shaft and at a horizontal distance of 0.5 m from the
ventilation shaft. For buildings with end wall ventilators, samplers were placed in front of these
walls at a horizontal distance of approximately 2–3 m. In all cases, air flow rate near inside air
samplers was <2 m s–1 to avoid non-isokinetic sampling conditions. For the naturally roof
ventilated dairy houses, sampling positions were within 1.5 m under the roof ridge opening at
three positions equally distributed along the length of the opening (length of the houses: 25 to 56
m). Inside pig and poultry houses, concentrations of PM and CO2 were determined in duplicate.
For dairy houses, singular concentration measurements were done at the aforementioned three
positions. In all houses, the inside temperature and relative humidity were determined at the
emission point. All measurements described in this paper were carried out in 24-h sampling
periods from noon to noon.
Measurement of inhalable PM
The inhalable fraction defined by ISO 7708 (ISO, 1995) and EN 481 (CEN, 1993) was
sampled using air pumps and IOM samplers (SKC Inc., Pennsylvania, USA; 50%-cut point at
100 µm) at an air flow rate of 2 L min–1. Concentrations were determined in 19 different houses
representing 6 of the 13 housing systems: 4 for LAF, 4 for BRO, 2 for SIH, 1 for WPS, 4 for
FTR, and 4 for DCH (see Table 1 for acronyms of housing systems). Those housing systems
were measured that have also been measured in the Northern-European survey (Takai et al.,
1998).
Measurement of PM10 and PM2.5
Concentrations of PM10 and PM2.5 were determined by gravimetric filtration, using cyclone
samplers (model URG-2000-30ENB for PM10 and URG-2000-30EG for PM2.5; URG Corp.,
Chapel Hill NC, USA) and stationary sampling pumps (Tecora, model Charlie HV; Ravebo
B.V., Brielle, the Netherlands) at a flow rate of 16.7 L min–1. After pre-separation inside the
cyclone, PM of the desired size fraction was collected on a glass fiber filter (type GF-3, Ø 47
mm, Macherey-Nagel, Düren, Germany). Filters were weighed before and after loading at
standard conditions (20 ± 1°C and 50 ± 5% relative humidity) as described in EN 12341 (CEN,
1998) and EN 14907 (CEN, 2005), using a precise balance (AT261 DeltaRange, Mettler,
Greifensee, Switzerland; resolution: 10 µg). Each filter was weighed four times during two
consecutive days. PM concentrations were calculated as the mass of collected PM divided by the

Chapter 2
22
volume of air drawn through the filter. For PM10, concentrations were calibrated to the EN 12341
reference sampler by the equations published by Zhao et al. (2009): y = 1.09x (when x ≤223 µg
m–3) and y = 0.83x + 57.5 (when x >223 µg m–3), where x is the cyclone concentration and y the
calibrated concentration. PM10 and PM2.5 concentrations were determined in all houses in this
project.
To determine daily patterns in PM10 concentrations, continuous measurements of PM10 were
carried out using a light-scattering device (DustTrak Aerosol Monitor, model 8520, TSI Inc.,
Shoreview, USA; air flow rate: 1.7 L min–1). PM10 concentrations were determined per second
and minute-averaged values were logged in the memory of the device. Due to limited availability
of devices, data was obtained from 159 out of a total of 202 conducted measurements at all 36
houses. These DustTrak measurements were done inside the buildings only.
Measurement of environmental variables
Temperature (ºC) and relative humidity (%) inside and outside animal houses were measured
with combined sensors (Rotronic Instrument Corp., Hauppauge NY, USA). Hourly mean values
were stored in a data-logging system (Campbell Scientific Inc., Logan UT, USA; types: CR10,
CR10X, CR23, and CR23X). In addition, meteorological data of the nearest whether station for
each animal house were obtained from the Royal Netherlands Meteorological Institute (KNMI).
Measurement of carbon dioxide
For determination of the ventilation rate by the CO2 balance method, concentrations of CO2
were determined by gas chromatography (GC) and/or by infrared photoacoustic spectroscopy
(PAS). For GC measurements, 24-h total air samples were taken using the ‘lung principle’
(vessels with 40 L Nalophan air sampling bags connected to electrical air pumps; Thomas
Industries Inc., Wabasha MN, USA; model 607CD32; critical capillary: 0.02 L min–1). The
pump sucked air from the vessel which caused the sampling bag to be filled with air taken from
the sampling position. Singular samples taken from the air inlet and exhaust points were taken to
the lab and analyzed by GC (Interscience/Carlo Erba Instruments Inc., Breda, the Netherlands,
GC 8000 Top; column Molsieve 5A; detector: HWD). Depending on availability of the
equipment, as a back-up, we measured CO2 concentration continuously at the farms by PAS as
well (INNOVA 1312, LumaSense Technologies, Ballerup, Denmark). This device was only used
at the exhaust point.

Emissions of particulate matter from animal houses in the Netherlands
23
Data preparation and analysis
Estimation of ventilation rate
In 11 of the 16 pig houses, the ventilation rate was determined by calibrated fan-wheel
anemometers with the same diameter as the ventilation shaft (these included 55 out of 86 pig
house measurements). The rotational frequency of the fan wheel (pulses per minute) was stored
in a data logging system. Calibration curves were used to calculate ventilation rates from these
pulses. For 31 pig house measurements such data could not be obtained. In the latter
measurements, and in all poultry and dairy houses, ventilation rate was determined indirectly by
the CO2 balance method (CBM), which uses the CO2 produced inside the animal house as a
tracer gas. In most poultry houses, multiple fans of varying diameters were present, making the
use of fan-wheel anemometers impractical, and in naturally ventilated dairy houses their use is
impossible. For the description of CBM to calculate the ventilation rate see Supplementary
information 2.
Calculation of PM emission rates
PM emission rates (PMemission; mg h–1) were calculated for each measurement using Eq. 1:
)]PM[-]PM([QPM inletexhaustemission ×= (1)
where Q is the ventilation rate (m3 h–1), [PM]exhaust is the concentration of inhalable PM, PM10 or
PM2.5 in the exhaust air (mg m–3), and [PM]inlet the concentration of PM10 or PM2.5 (mg m–3) in
the inlet air. For inhalable PM, no correction was made for PM in the inlet air, similar as in the
Northern-European survey (Takai et al., 1998). Emission rates were expressed in three different
units of production: per animal present during the measurement (mg h–1 animal–1), per Livestock
Unit (i.e., 500 kg live weight; mg h–1 LU–1), and per heat production unit (i.e., a quantity of
animals producing 1 kW of total heat; mg h–1 HPU–1). Emission data were expressed per hour,
while they were determined per day, to make them easy to compare with data from literature.
Emission rates were not corrected for empty periods (e.g., cleaning days between production
cycles). For DCH, the animals were kept inside during measurements (no pasture grazing).

Chapter 2
24
Statistical analysis
PM emission rates of poultry and pig houses were analyzed using the REML directive of
GenStat (VSN, 2013) by a mixed model, described by Eq. 2:
Log(Yijk) = C + Sk + εj + εij (2)
where Log(Yijk) is the response variable (i.e., the natural logarithm of the PM emission rate of
measurement i, in animal house j of housing system k), C is the overall mean emission rate (i.e.,
a constant), Sk is a fixed effect of housing system k (13 housing systems; Table 1), εj ~ N(0, σ2j)
is a random effect of animal house j (36 houses; 2 or 4 per housing system; with σ2j being the
pooled variance between animal houses), and εij ~ N(0, σ2ij) is the residual error term (with σ2
ij
being the pooled variance of measurements within houses). PM emission rates were analyzed at
log-scale because these emissions were positively skewed and the variance in the dataset was
proportional to absolute levels. We used deviance tests to determine whether including
autocorrelation (i.e., correlation between measurements in time within a house) in the model
variance structure improved the model output, but autocorrelation was not significant, and was
therefore omitted from the final model (Eq. 2). The model was run for 9 emission variables, i.e.,
each combination of the PM fractions (inhalable PM, PM10, and PM2.5) and units of production
(animal, LU, and HPU). Model-predicted mean emission rates on the natural log-scale were
computed for each housing system, which were back-transformed to yield a geometric mean
emission rate at the original scale.
RESULTS AND DISCUSSION
For the climate conditions during the measurements we refer to Supplementary information 3.
These data show that outdoor climate conditions during the measurement days closely resembled
long-term trends in the Netherlands.
Ventilation rate
Table 2 shows the ventilation rates of the housing systems, the recorded body weights of the
animals, and the inside CO2 concentrations. The overall mean (SD) inlet CO2 concentration in
our dataset was 478 (60) ppm. This is higher than the background concentration in open fields
without animal houses. This relatively high inlet CO2 concentration is most probably caused by

Emissions of particulate matter from animal houses in the Netherlands
25
CO2 emission from other animal houses on the same farm or from recirculated CO2 from the
same house. Because we also corrected for the inlet PM concentrations (except inhalable PM),
and these were also raised at the inlet as can be seen from Fig. 1, the emission calculation is not
affected by this high inlet CO2 concentration. According to Seedorf et al. (1998), the difference
between the inlet and exhaust concentration (ΔCO2) should be greater than 250 ppm for an
accurate estimation of the ventilation rate based on CO2. This condition was met in 97% of the
measurements: 95 out of 96 measurements in poultry, all 31 measurements in pigs (excluding 55
measurements where fan-wheel anemometry was used), and 16 out of 20 measurements in dairy
cattle. The overall mean (range) ΔCO2 in our dataset was 1054 (137–2792) ppm.
Table 2Ventilation rates, CO2-concentrations, and body weights (based on 24-h mean values).
Housing Ventilation rate CO2, inside Body weightsystem (m3 h–1 animal–1) (m3 h–1 LU–1) (ppm) (kg)
Mean Min–Max Mean Min–Max Mean Min–Max Mean Min–MaxLFH 3.5 1.1–9.0 949 306–2432 1327 741–2456 1.8 1.5–2.0LAH 3.0 0.8–6.3 826 233–1727 1484 844–3060 1.8 1.5–1.9BRB 4.1 1.2–8.9 641 166–1754 1762 775–3290 3.4 2.5–3.8BRO 2.1 0.1–9.6 797 367–2225 2177 917–3230 1.1 0.1–2.4TUR 12.2 6.9–22.1 681 350–1130 1430 963–2000 10.6 4.1–19.5SIH 63.5 23.8–137 140 53.6–299 1836 865–2980 227 220–240SGH 50.8 22.2–75.9 132 61.6–190 1719 1150–2980 190 180–200WFS 9.0 3.2–16.1 338 135–706 1629 896–2830 13.7 9.8–21.0WPS 10.2 6.2–19.7 306 175–529 2429 1420–4070 17.7 10.0–23.8FTH 28.0 6.6–49.3 236 71.3–483 2038 1080–3370 66.0 21.0–109FLD 26.7 9.7–46.0 227 122–365 2001 1360–2640 63.5 29.0–102FLL 25.0 9.6–36.8 185 120–338 2196 1510–3460 71.7 40.0–120DCH 862 196–2111 698 158–1688 819 553–1880 617 603–625
In this study, we calculated the volumetric CO2 production at the house level by the values
given by Pedersen et al. (2008), which are composed of the metabolic CO2-production by the
animal multiplied by a factor 1.1 for the contributions of manure and litter, provided that the
manure is removed frequently (i.e., every three weeks) and the litter is not of the deep-litter type
(i.e., <0.5 m). Recent studies in broilers where manure was replaced by fresh bedding material
between growth cycles, showed that the contribution of the litter to the total CO2-production
increased exponentially from negligible levels during the first 4 weeks to values between 8 and
20% at the end of the growth cycle (Calvet et al., 2011; Calvet et al., 2012). In a high-rise cage
house, Liang et al. (2005) measured the CO2-production from manure that had accumulated for 6
months and found that it contributed 5 to 9% to the total CO2-production. These empirically
found contributions agree reasonably well with the additional 10% incorporated in the values
recommended by Pedersen et al. (2008). Ni et al. (1999) studied the CO2 release from slurry pits

Chapter 2
26
in a mechanically ventilated fattening pig room with partially slatted floors during a 135-day
period and found a mean CO2-production from manure of 42.1 g h–1 per m2 of pit surface, which
would yield contributions of the manure to the total CO2-production in excess of 10%.
In our study, deep litter systems were not included. The issue of CO2-production from sources
other than the animal’s metabolism could however be a source of uncertainty mainly for BRO
and TUR (where propane was burned in hot air blowers during the initial phase of the growth
cycle), LAH (where manure accumulated underneath elevated slatted floors during laying cycles
of 14 months), the pig houses (where the frequency of slurry pit emptying varied from monthly
to annually, depending on the farm management), and DCH (where slurry pits were partially
emptied for slurry spreading several times between February and September). To gain insight
into the reliability of the CO2 balance method (CBM), we recently compared ventilation rates
obtained with the CBM in broilers, weaners, fattening pigs, and sows with values obtained from
simultaneous measurements by fan-wheel anemometry (Mosquera et al., 2012). This comparison
was done by linear regression analysis (with the ventilation rate from fan-wheel anemometry as
the independent variable) and was partially based on the dataset presented here. The values from
the CBM were consistent with those obtained with fan-wheel anemometers, indicated by zero
intercepts, regression coefficients not significantly different from one (between 0.91 and 0.98),
and coefficients of determination between 0.69 and 0.99. Other studies too have shown that,
when input variables are accurately determined, CBM values on a 24-h basis are generally
reliable for housing systems without prolonged manure storage, deep litter, and natural
ventilation (Blanes and Pedersen, 2005; Hinz and Linke, 1998; Li et al., 2005; Xin et al., 2009).
For naturally ventilated houses (i.e., DCH in this survey) ventilation rates determined by the
CBM are surrounded by a higher degree of uncertainty (Calvet et al., 2013).
The ventilation capacities of the animal houses given in Supplementary information 1 and the
measured ventilation rates listed in Table 2 can be compared with the guidelines of the Dutch
expert committees on poultry house ventilation (WUR, 2010) and pig house ventilation (WUR,
2006). On a 500 kg liveweight (LU) basis, these recommendations are (minimum–maximum):
350–2000 m3 h–1 for LFH, LAH, BRO, and TUR, 250–1800 m3 h–1 for BRB, 34–480 m3 h–1 for
SIH and SGH, 133–667 m3 h–1 for WFS and WPS, and 87–435 m3 h–1 for FTH, FLD, and FLL.
On a 500 kg liveweight basis, the installed ventilation capacities match the aforementioned
maxima. For 3 out of 4 broiler houses, and for 3 out of 8 houses for fattening pigs however, the
ventilation capacity was insufficient to realize the recommended maximum. The measured
ventilation rates (Table 2; m3 h–1 LU–1) match the ventilation guidelines well. Only in BRB,
ventilation rate in winter clearly dropped below the recommended minimum of 250 m3 h–1 LU–1.

Emissions of particulate matter from animal houses in the Netherlands
27
In Supplementary information 4 scatter plots are presented of the ventilation rate against the
day number in the growing period (for growing animals) or against the outside temperature or
wind speed (for non-growing animals).
Outside PM concentrations
The mean (maximum) outside PM10 concentration measured near the house inlets was 52
(187) µg m–3 for poultry farms, 27 (119) µg m–3 for pig farms, and 28 (81) µg m–3 for dairy
farms. The mean (maximum) outside PM2.5 concentration was 15 (46) µg m–3 for poultry farms,
14 (60) µg m–3 for pig farms, and 11 (20) µg m–3 for dairy farms.
Fig. 1Measured PM10 concentrations outside poultry houses, pig houses, and dairy houses, against the PM10
concentrations of the nearest National Air Quality Monitoring (NAQM) station for that day (based on 24-h mean values). Green dashed lines: y = x.
In Fig. 1 the PM10 concentrations measured near the house inlets are plotted against those
from the nearest rural National Air Quality Monitoring (NAQM) station for the same 24-h period
(the stations were within 5 to 35 km from the farms). This figure shows that concentrations
outside poultry and pig farms tended to be either comparable to or higher than the ambient
concentration in that region and on that day, but never substantially lower. Inlet PM samplers
were positioned away from the exhausts, upwind of the buildings, and away from other possible
PM sources. It is possible however, that a change in wind direction caused part of the PM
emitted to be recirculated, or that the houses were incidentally in the plume of other nearby PM
sources. In either case, PM emission rates were corrected for background concentrations (Eq. 1).
In general, the data in Fig. 1 support the recent finding that ambient PM concentrations may be
PM10
mea
sure
d(µ
g m
–3)
PM10 NAQM station (µg m–3)
Poultry houses Pig houses Dairy houses
-20
20
60
100
140
180
-20 20 60 100 140 180-20
20
60
100
140
180
-20 20 60 100 140 180-20
20
60
100
140
180
-20 20 60 100 140 180

Chapter 2
28
elevated in proximity to poultry and pig houses in the Netherlands (Heederik et al., 2011). At
dairy farms, PM10 concentrations measured near the house inlets were generally low and
reasonably similar to those from the nearest NAQM station.
Inside PM concentrations
Table 3 shows descriptive statistics of the inside concentrations of Inhalable PM, PM10, and
PM2.5. Mean PM concentrations were clearly highest in poultry houses, followed by pig houses,
and lowest in dairy houses, for each of the three PM fractions. In the Northern-European survey
(Takai et al., 1998), mean inhalable PM concentrations inside animal houses in the Netherlands
were 8780 µg m–3 for layers in percheries, 10,360 µg m–3 for broilers on litter, 1200 µg m–3 for
sows on slats, 3740 µg m–3 for weaners on slats, 2610 µg m–3 for fatteners on slats, and 140–220
µg m–3 for dairy in cubicles.
Table 3Concentrations of particulate matter in the exhaust air of the housing systems (based on 24-h mean values).Housing Inhalable PM (µg m–3) PM10 (µg m–3) PM2.5 (µg m–3)system n Mean Min–Max n Mean Min–Max n Mean Min–MaxLFH 19 8175 3633–14,307 23 3143 1216–7315 23 175 41.2–423LAH 22 3362 1198–10,951 22 217 54.3–866BRB 12 1703 913–2737 12 120 45.2–205BRO 18 4392 998–7882 24 1931 486–3784 24 137 28.4–495TUR 11 1280 483–2515 10 351 54.4–947SIH 8 1245 726–1969 11 485 187–826 10 53.5 21.9–101SGH 10 415 267–599 10 37.8 19.2–52.8WFS 11 1091 419–1836 11 51.1 19.2–98.4WPS 5 3616 2913–4674 10 988 534–1274 10 39.7 16.0–81.4FTH 20 2203 614–4623 23 662 229–1334 23 47.8 10.8–113FLD 2 3282 2402–4161 10 963 543–1458 10 52.7 32.6–65.5FLL 10 714 198–1247 10 41.5 14.8–63.0DCH 19 295 68–580 20 40.0 14.0–95.0 20 13.8 3.9–24.9
The concentrations of inhalable PM found in the present study (Table 3), are reasonably
consistent with these data from the 1990s. Only for broilers, the mean concentration in the
present study was 58% lower. This can be explained by the fact that the measurements in the
present study were spread more evenly over the growing cycle in comparison to the Northern-
European survey, where measurements were mainly done in the second half of the growth cycle
(P.W.G. Groot-Koerkamp, pers. comm.), when PM concentrations are higher (Supplementary
information 5). The PM10 and PM2.5 concentrations found here are roughly in accordance with
the concentrations from other emission studies, as summarized in Supplementary information 6.

Emissions of particulate matter from animal houses in the Netherlands
29
Inside DCH, PM10 concentrations (mean: 40 µg m–3) were only slightly higher than ambient
levels (mean: 28 µg m–3). Similar data have recently been reported by Schrade et al. (2014), who
found a mean (maximum) PM10 concentration of 26 (~70) µg m–3 inside Swiss dairy houses,
only slightly above the mean background level of 17 µg m–3.
On the basis of the DustTrak measurements, Fig. 2 provides diurnal patterns of the relative
inside PM10 concentration. In LFH, LAH, and BRB, a sharp drop in the PM10 concentration was
found in the evening when the lights went off (around 20:00), followed by a sharp rise in the
early morning when the lights were turned on again (around 04:00). In BRO and TUR, distinct
patterns were found marked by high concentrations during light periods and low concentrations
during dark periods. Since lighting schemes differed between houses, and also over the course of
a growing cycle within a house (which lead to diffuse trends when combined in one figure), Fig.
2 shows one typical measurement for BRO and TUR each. In pigs, diurnal patterns were clearly
flatter, showing low concentrations during the night and two peaks during daytime, roughly
between 05:00 and 10:00, and between 15:00 and 19:00. In DCH, the concentration profile was
below average (i.e., below 100%) and rather flat during the night, but elevated and spiked during
the day. For all housing systems, elevated concentrations were probably caused by the activity of
the animals (e.g., due to lights being switched on, feed being delivered, milking, etcetera). The
direct relationship between animal activity and PM concentration has been well demonstrated
(Calvet et al., 2009; Costa et al., 2009; Joo et al., 2013).
In Supplementary information 5, scatter plots are given of the PM10 concentration against the
day number in the growing period (for growing animals) or against the ventilation rate (for non-
growing animals).

Chapter 2
30
Fig. 2Diurnal patterns of the relative PM10 concentration in 13 housing systems. One typical 24-h measurement is presented for broilers and turkeys. For the other 11 housing systems, bold lines represent overall means and dotted lines the mean ± one standard deviation between houses.
0
100
200
300
12:00 18:00 0:00 6:00 12:00
Broiler breeders (BRB)
0
100
200
300
12:00 18:00 0:00 6:00 12:000
100
200
300
12:00 18:00 0:00 6:00 12:00
Laying hens, floor housing (LFH) Laying hens, aviary housing (LAH)
0
100
200
300
12:00 18:00 0:00 6:00 12:00
Sows, indiv. housing (SIH)
0
100
200
300
12:00 18:00 0:00 6:00 12:00
Turkeys (TUR)
0
100
200
300
12:00 18:00 0:00 6:00 12:00
Broilers (BRO)
0
100
200
300
12:00 18:00 0:00 6:00 12:00
Weaners, partially slatted floor (WPS)
0
100
200
300
12:00 18:00 0:00 6:00 12:00
Weaners, fully slatted floor (WFS)
0
100
200
300
12:00 18:00 0:00 6:00 12:00
Sows, group housing (SGH)
0
100
200
300
12:00 18:00 0:00 6:00 12:000
100
200
300
12:00 18:00 0:00 6:00 12:000
100
200
300
12:00 18:00 0:00 6:00 12:00
Fatteners, trad. housing (FTH) Fatteners, low emiss., dry feed (FLD) Fatteners, low emiss., liq. feed (FLL)
0
100
200
300
12:00 18:00 0:00 6:00 12:00
Dairy cattle, cubicle housing (DCH)
PM10
conc
entr
atio
n(%
of d
ay a
vera
ge)
Time of the day

Emissions of particulate matter from animal houses in the Netherlands
31
PM emission rates
In Table 4 the emission rates of inhalable PM, PM10, and PM2.5 (each on an animal basis) are
shown. First, arithmetic mean emission rates are presented on the original (measured; mg h–1)
scale, together with the SD between house averages. Second, the model-predicted means are
given, together with their standard error, based on the natural log-transformations of the original
data (Eq. 2). Finally, back-transformed values of these predictions are given, which then
represent geometric mean emission rates on the original scale. As noted by other authors,
measured PM emission rates were positively skewed and the variance in the dataset was
proportional to absolute levels (Joo et al., 2013; Takai et al., 1998), but after transformation a
normal distribution was obtained. Due to the positive skewness, the back-transformed
(geometric) means generally provided lower but more valid estimates of central tendency than
the arithmetic means (Table 4).
A highly significant effect was found for the housing system term (P < 0.001). On a LU and
HPU basis, as presented in Supplementary information 7, PM emission rates were clearly higher
for poultry than for pigs and dairy. This is also remarkably reflected by the finding that, on an
animal basis, the PM10 emission rate of one laying hen is of the same order of magnitude as the
emission rate of one weaner or one dairy cow. Presumably, the presence of dusty litter (i.e.,
bedding material and dry, friable manure) in all poultry housing systems investigated contributed
to this.
For DCH, no model-predicted mean emission rate is shown for PM10 and PM2.5, because 3 out
of 20 emission rates for PM10 were slightly negative (Fig. 4), as well as 6 out of 20 emission
rates for PM2.5, which hindered the use of a natural log-transformation. As noted earlier, the
concentration inside DCH was on average only 12 µg m–3 higher than outside. At such low
concentration differences, random sampling errors can result in slightly negative emissions.
Despite that these negative emissions have actually been zero or very small, setting these values
to zero would introduce a systematic bias for the lowest values only, since similar errors are
present in both negative and positive values in the dataset. Therefore, all values remained in the
dataset for the calculation of the arithmetic mean emission rate of DCH (Table 4).
PM emission rates increased exponentially with increasing age in broilers and turkeys and
increased linearly with increasing age in weaners and fatteners (Fig. 3). In non-growing animals
(laying hens, broiler breeders, sows, and dairy cattle), emission levels were variable throughout
the year (Fig. 4).

Chapter 2
32
Table 4Arithmetic mean and standard deviation between houses (SDBH) of original-scaled PM emission rates, model-estimated mean emission rates on the natural log-scale (SE: standard error), and back-transformed mean emission rates (i.e., geometric means on the original scale), expressed per animal. For data presented per Livestock Unit (LU), and per Heat Production Unit (HPU) see Supplementary information 7.Housing system Nr. of n Emission ratea (mg h–1 animal–1)
houses Mean (SDBH);original-
scaled data
Log-transformed
mean (SE)
Back-transf.mean
Inh. PMb
LFH 4 19 28.3 (15.3) 3.05 (0.20) 21.2BRO 4 18 8.47 (2.65) 1.58 (0.20) 4.87SIH 2 8 77.1 (7.41) 4.26 (0.30) 70.7WPS 1 5 34.2 (–) 3.44 (0.39) 31.2FTH 4 20 53.0 (27.5) 3.73 (0.19) 41.7FLD 1 2 96.8 (–) 4.56 (0.59) 95.9DCH 4 19 265 (32.2) 5.28 (0.20) 197
PM10
LFH 4 23 10.6 (4.09) 2.16 (0.18) 8.67LAH 4 22 7.91 (1.73) 1.96 (0.19) 7.08BRB 2 12 5.81 (0.11) 1.54 (0.26) 4.66BRO 4 24 4.13 (2.14) 0.81 (0.18) 2.24TUR 2 11 15.1 (4.51) 2.49 (0.26) 12.0SIH 2 11 22.2 (1.48) 3.05 (0.26) 21.1SGH 2 10 19.8 (9.48) 2.90 (0.27) 18.2WFS 2 11 7.60 (1.38) 1.99 (0.26) 7.29WPS 2 10 9.47 (0.36) 2.20 (0.27) 8.98FTH 4 23 16.4 (7.89) 2.66 (0.18) 14.3FLD 2 10 23.8 (4.99) 3.11 (0.27) 22.5FLL 2 10 17.5 (2.02) 2.69 (0.27) 14.7DCH 4 20 8.53 (2.83) n.d. n.d.
PM2.5
LFH 4 23 0.57 (0.24) –0.94 (0.23) 0.39LAH 4 22 0.46 (0.11) –0.94 (0.24) 0.39BRB 2 12 0.43 (0.02) –1.33 (0.33) 0.27BRO 4 24 0.31 (0.19) –2.24 (0.23) 0.11TUR 2 10 3.86 (0.27) 0.88 (0.35) 2.41SIH 2 10 1.69 (0.66) 0.44 (0.35) 1.56SGH 2 10 1.41 (0.61) 0.28 (0.35) 1.32WFS 2 11 0.26 (0.11) –1.50 (0.34) 0.22WPS 2 10 0.24 (0.05) –1.54 (0.35) 0.21FTH 4 23 0.83 (0.48) –0.41 (0.23) 0.67FLD 2 10 1.02 (0.13) –0.04 (0.35) 0.96FLL 2 10 0.77 (0.21) –0.57 (0.35) 0.56DCH 4 20 1.65 (0.62) n.d. n.d.
a Hourly values were calculated by dividing the 24-h determined data by 24.b Not corrected for inlet concentration.n.d.: not determined.

Emissions of particulate matter from animal houses in the Netherlands
33
Fig. 3Scatter plots of PM10 emission rates for housing systems with growing animals (based on 24-h mean values).
Fig. 4. Scatter plots of PM10 emission rates for housing systems with non-growing animals (based on 24-h mean
values).
y = 0.1766x + 5.0373R² = 0.4939
0
5
10
15
0 10 20 30 40
PM
10 e
mis
sion
(mg
h–1
anim
al–1
)
y = 0.2043x + 7.2081R² = 0.4472
0
10
20
30
40
0 20 40 60 80 100 120
PM
10 e
mis
sion
(mg
h–1
anim
al–1
)
y = 0.0013x2.3855
R² = 0.8883
0
5
10
15
20
0 7 14 21 28 35 42 49
PM
10 e
mis
siso
n (m
g h–
1an
imal
–1)
y = 0.0003x2.3862
R² = 0.8609
0
10
20
30
40
0 20 40 60 80 100 120 140
PM
10 e
mis
siso
n (m
g h–
1an
imal
–1)
Broilers (BRO) Turkeys (TUR)
Weaners, fully slatted floor (WFS)Weaners, partially slatted floor (WPS)
Fatteners, trad. housing (FTH)Fatteners, low emiss., dry feed (FLD)Fatteners, low emiss., liquid feed (FLL)
Day number in growing periodDay number in growing period
Day number in growing periodDay number in growing period
-5
0
5
10
15
20
25
0 60 120 180 240 300 360
PM
10 e
mis
sion
(mg
h–1
anim
al–1
)
Day number in calender year
0
10
20
30
40
0 60 120 180 240 300 360
PM
10 e
mis
sion
(mg
h–1
anim
al–1
)
Day number in calender year
0
5
10
15
20
25
0 60 120 180 240 300 360
PM
10 e
mis
sion
(mg
h–1
anim
al–1
)
Day number in calender year
Broiler breeders (BRB)
Laying hens, floor housing (LFH)Laying hens, aviary housing (LAH)
Sows, group housing (SGH)Sows, ind. housing (SIH)
Dairy cattle, cubicle housing (DCH)

Chapter 2
34
As explained earlier, measurements in broilers and turkeys focused on the middle and last
phase of the growth cycle, which may distort the emission estimates in Table 4. Furthermore,
measurements in turkeys were only carried out in two grow-out houses where male birds were
kept from approximately 5 to 20 weeks of age, but not in the rearing house. An indication of the
mean PM10 emission rate over the full growing period can be estimated by fitting the emission
curve for TUR in Fig. 3 to days 1 to 140, and dividing the sum of these fitted values by 140. This
approach yields a mean PM10 emission rate of 11.8 mg h–1 bird–1 and a mean PM2.5 emission rate
of 0.20 mg h–1 bird–1 (estimated from y = 0.00002x2.8032; R2 = 0.83) for a full 140-day cycle. In
BRO, the same approach for a 42-day growing period yields a mean PM10 emission rate of 2.98
mg h–1 bird–1 and a mean PM2.5 emission rate of 3.33 mg h–1 bird–1 (estimated from y =
0.0000003x3.5877; R2 = 0.87).
In the Northern-European survey (Takai et al., 1998), model-predicted (geometric) mean
inhalable PM emission rates for animal houses in the Netherlands (on a LU basis) were 4340 mg
h–1 for layers in percheries, 4984 mg h–1 for broilers on litter, 151 mg h–1 for sows on slats, 1309
mg h–1 for weaners on slats, 418 mg h–1 for fatteners on slats, and 216 mg h–1 for dairy in
cubicles. The mean emission rate for BRO in the present study is about 50% lower, possibly, as
mentioned earlier, because measurements were spread more evenly over the growing cycle in the
present work as compared to Takai et al. (1998). Furthermore, the mean emission rate of dairy
cattle (DCH) in the present study is about 26% lower, whereas the mean emission rates for layers
(LFH), sows (SIH) and fatteners (FTH) are within a 15% difference. It should be noted that in
this study and in the study of Takai et al. (1998) no correction was made for the inlet inhalable
PM concentrations. Preliminary results from an ongoing study show that in the outside air
inhalable PM concentrations are rather similar to PM10 concentrations, because of sedimentation
of the heavy particles. When we compare mean inlet concentrations of PM10 with mean exhaust
concentrations of inhalable PM and when we assume inhalable PM concentration to be similar as
PM10 concentration at the inlet, an overestimation is made of the emission of inhalable PM of
0.7% in poultry, 1.8% in pigs, and 12.2% in dairy cattle. So, in dairy cattle there is some
overestimation of inhalable PM emission, but in poultry and pigs the error is small.
Prior to this study, a first set of tentative PM10 emission factors was estimated from the
inhalable PM emission rates reported by Takai et al. (1998), assuming a general conversion
factor of 0.45 (Chardon and Van der Hoek, 2002; Van der Hoek, 2007). In the present dataset,
mean (SD) concentration ratios between PM10 (corrected for background concentration) and
inhalable PM, were 0.40 (0.15) for LFH, 0.44 (0.12) for BRO, 0.32 (0.06) for SIH, 0.31 (0.10)
for WPS, 0.32 (0.08) for FTH, and 0.06 (0.04) for DCH. In retrospect, concentration ratios are

Emissions of particulate matter from animal houses in the Netherlands
35
all lower than the general conversion factor of 0.45, and varied clearly between poultry, pigs, and
dairy cattle. Consequently, the tentative emission factors in legislation have been replaced by
measured emission factors that were generally lower.
In Supplementary information 6, a summary of results from earlier PM10 and PM2.5 emission
studies is provided for housing systems comparable to those studied in this work. This summary
shows that emission figures for PM2.5 are scarcer than for PM10, and that the present work in 36
animal houses represents a substantial contribution to the current state of knowledge. Despite
that differences between studies may arise from differences in sampling instruments, sampling
strategies, meteorological conditions, and so on, in general, Table 4 and Supplementary
information 6 show typical and consistently ranged values for each housing system.
In this work, a ‘multi-site approach’ was used which recognizes that quantifying livestock PM
emissions comprises systematic effects of housing systems, random effects of houses within each
housing system, and a random error term representing variation in time within houses. To
increase our understanding of relevant sources of variation, and ultimately improve the accuracy
of sampling strategies, variation between and within houses for each housing system could be
described by the variance between houses (i.e., σ2j in Eq. 2) and the variance within houses (i.e.,
σ2ij in Eq. 2). Expressed as coefficient of variation (i.e., relative standard deviation, calculated as
the square root of the variance on the natural-log scale), the pooled variation between houses for
PM10 emission rate in our dataset (pig and poultry houses) was 23%, and the pooled variation
within houses was 68%. For PM2.5, these values were 26% and 93% respectively. Ideally,
variances should be reliably estimated for each housing system. For this, however, the number of
houses per housing system in our dataset (2 or 4) was insufficient. The outside temperature
(Supplementary information 4) and the moment in the growing period (Fig. 3) are promising
candidates to serve as covariates. In the present study however, we refrained from the use of
covariates, because their effect, i.e., their slope, cannot be expected to be the same for different
housing systems, and the present data are not informative enough to account for interaction
between covariates and housing systems. In view of the aforementioned considerations, the
analysis and emission estimates in Table 4 and Supplementary information 7 are presented with
some reservation, even though the dataset presented here is presumably one of the largest in its
kind. Nevertheless, we believe that the estimates give a useful, albeit first indication of the PM10
and PM2.5 emissions from livestock production in the Netherlands.

Chapter 2
36
CONCLUSIONS
In this study, we investigated climate conditions, ventilation rates, and concentrations and
emissions of particulate matter (primarily PM10 and PM2.5, next to inhalable PM) in 36 farm
locations, which covered 13 main housing systems for poultry, pigs, and dairy cattle in the
Netherlands. Our main results and conclusions are:
• The temperature and relative humidity measured outside the animal houses were consistent
with long-term meteorological trends in the Netherlands. In pig and poultry houses, mean
inside temperatures ranged from 19.9 to 26.7 °C and mean inside relative humidities ranged
from 53.8 to 71.6%. In the open and uninsulated dairy houses, temperature ranged from 7.3
to 26.9 °C, whereas the relative humidity ranged from 50.7 to 95.2%. These results show
that emissions of PM were determined at representative climate conditions.
• On an animal basis, mean ventilation rates ranged from 2.1 to 12.2 m3 h–1 in poultry and
from 9.0 to 63.5 m3 h–1 in pigs. The mean ventilation rate in dairy cattle was 862 m3 h–1. The
mean inside concentrations of CO2 ranged from 1327 to 2177 ppm in poultry and from 1629
to 2429 ppm in pigs. In dairy cattle, the mean inside concentration of CO2 was 819 ppm.
Ventilation rate increased with increasing outside temperature and with the age of growing
animals. The ventilation capacity of mechanically ventilated buildings and the measured
ventilation rates were generally in agreement with Dutch ventilation guidelines, which
shows that concentrations and emissions of PM have been determined at representative
ventilation rates.
• Mean inside concentrations of PM10 ranged from 1280 to 3362 µg m–3 in poultry, from 415
to 1091 µg m–3 in pigs. The mean inside concentration of PM10 in dairy cattle was 40.0 µg
m–3. Mean inside concentrations of PM2.5 ranged from 120 to 351 µg m–3 in poultry and
from 37.8 to 53.5 µg m–3 in pigs. The mean inside concentration of PM2.5 in dairy cattle was
13.8 µg m–3. For growing animals, inside PM concentration increased linearly with
increasing age. For non-growing animals, PM concentration decreased with increasing
ventilation rate. Outside poultry and pig houses, PM10 concentrations were often higher than
those obtained from the nearest National Air Quality Monitoring station, whereas outside
dairy cattle houses, these concentrations were similar.
• On an animal basis, geometric mean emission rates of PM10 ranged from 2.2 to 12.0 mg h–1
in poultry and from 7.3 to 22.5 mg h–1 in pigs. The mean PM10 emission rate in dairy cattle
was 8.5 mg h–1. Geometric mean emission rates of PM2.5 ranged from 0.11 to 2.41 mg h–1 in

Emissions of particulate matter from animal houses in the Netherlands
37
poultry and from 0.21 to 1.56 mg h–1 in pigs. The mean PM2.5 emission rate in dairy cattle
was 1.65 mg h–1. PM emission rates increased exponentially with increasing age in broilers
and turkeys and increased linearly with increasing age in weaners and fatteners. In laying
hens, broiler breeders, sows, and dairy cattle, emission levels were variable throughout the
year. The emission rates found here and in literature show typical and consistently ranged
values for each housing system.
ACKNOWLEDGMENTS
This study was commissioned by the Dutch Ministry of Economic affairs, Agriculture and
Innovation, and the Dutch Ministry of Infrastructure and Environment. We thank the farmers for
their participation in this project. We acknowledge Mr. Freerk Dousma, Mr. Alfred Gerrits, Mr.
Theo van Hattum, Mrs. Annemieke Hol, Mr. Jos Huis in’t Veld, Ms. Renske Kwikkel, Mr. Guus
Nijeboer and Mr. Johan Ploegaert for carrying out the field measurements, Mr. Eef Lovink for
maintenance and calibrations, Mr. Jean Slangen and Mr. Geert Kupers for carrying out the lab
analyses, and Mr. Johan van Riel, Mr. Bas Engel, and Mr. Pieter Vereijken for fruitful
discussions on the statistical procedures.
REFERENCES
Aarnink, A.J.A., van Harn, J., van Hattum, T.G., Zhao, Y., Ogink, N.W.M., 2011. Dust reduction in broiler houses by spraying rapeseed oil. Trans. ASABE 54:1479–1489.
Blanes, V., Pedersen, S., 2005. Ventilation flow in pig houses measured and calculated by carbon dioxide, moisture and heat balance equations. Biosyst. Eng. 92:483–493.
Brunekreef, B., Holgate, S.T., 2002. Air pollution and health. Lancet 360, 1233–1242.Calvet, S., Estelles, F., Cambra-Lopez, M., Torres, A.G., van den Weghe, H.F.A., 2011. The influence of broiler
activity, growth rate, and litter on carbon dioxide balances for the determination of ventilation flow rates in broiler production. Poult. Sci. 90:2449–2458.
Calvet, S., Gates, R.S., Zhang, G., Estellés, F., Ogink, N.W.M., Pedersen, S., Berckmans, D., 2013. Measuring gas emissions from livestock buildings: A review on uncertainty analysis and error sources. Biosyst. Eng. 116:221–231.
Calvet, S., van den Weghe, H., Kosch, R., Estellés, F., 2009. The influence of the lighting program on broiler activity and dust production. Poult. Sci. 88:2504–2511.
Calvet, S.F.E., Cambra-López, M., Torres, A.G., 2012. Measuring ventilation using carbon dioxide balances: Evolution of CO 2 production from litter in two broiler cycles. In: 9th International Livestock Environment Symposium 2012, ILES 2012, Valencia, Spain, pp. 123–128.
Cambra-López, M., Aarnink, A.J.A., Zhao, Y., Calvet, S., Torres, A.G., 2010. Airborne particulate matter from livestock production systems: A review of an air pollution problem. Environ. Pollut. 158:1–17.
CEN, 1993. EN 481:1993. Workplace atmospheres - Size fraction definitions for measurement of airborne particles. European Committee for Standardization (CEN), Brussels, Belgium.
CEN, 1998. EN 12341:1998. Air quality - Determination of the PM 10 fraction of suspended particulate matter -Reference method and field test procedure to demonstrate reference equivalence of measurement methods. European Committee for Standardization (CEN), Brussels, Belgium.

Chapter 2
38
CEN, 2005. EN 14907:2005. Ambient air quality - Standard gravimetric measurement method for the determinationof the PM2.5 mass fraction of suspended particulate matter. European Committee for Standardization (CEN), Brussels, Belgium.
Chardon, W.J., Van der Hoek, K.W., 2002. Berekeningsmethode voor de emissie van fijn stof vanuit de landbouw [Calculation method for emission of fine dust from agriculture; in Dutch]. Report 682, Alterra, Wageningen, the Netherlands.
Costa, A., Borgonovo, F., Leroy, T., Berckmans, D., Guarino, M., 2009. Dust concentration variation in relation to animal activity in a pig barn. Biosyst. Eng. 104:118–124.
Heederik, D.J.J., Opstal-van Winden, A.J.W., Smit, L.A.M., Wouters, I.M., Hooiveld, M., IJzermans, C.J., van der Sman-de Beer, F., Spreeuwenberg, P.P.M., de Bruin, A., van Rotterdam, B., 2011. Mogelijke effecten van intensieve-veehouderij op de gezondheid van omwonenden: onderzoek naar potentiële blootstelling en gezondheidsproblemen. Institute for Risk Assessment Sciences (IRAS), Universiteit Utrecht, Utrecht, the Netherlands.
Hinz, T., Linke, S., 1998. A comprehensive experimental study of aerial pollutants in and emissions from livestock buildings. Part 2: Results. J. Agric. Eng. Res. 70:119–129.
ISO, 1995. ISO 7708. Air Quality – Particle size fraction definitions for health related sampling. International Organization for Standardization (ISO), Genève, Switzerland.
Joo, H.S., Ndegwa, P.M., Heber, A.J., Ni, J.Q., Bogan, B.W., Ramirez-Dorronsoro, J.C., Cortus, E.L., 2013. Particulate matter dynamics in naturally ventilated freestall dairy barns. Atmos. Environ. 69:182–190.
Li, H., Xin, H., Liang, Y., Gates, R.S., Wheeler, E.F., Heber, A.J., 2005. Comparison of direct vs. indirect ventilation rate determinations in layer barns using manure belts. Trans. ASABE 48:367–372.
Liang, Y., Xin, H., Wheeler, E.F., Gates, R.S., Li, H., Zajaczkowski, J.S., Topper, P.A., Casey, K.D., Behrends, B.R., Burnham, D.J., Zajaczkowski, F.J., 2005. Ammonia emissions from U.S. laying hen houses in Iowa and Pennsylvania. Trans. ASAE 48:1927–1941.
Mosquera, J., Groenestein, C.M., Ogink, N.W.M., Aarnink, A.J.A., 2012. Evaluation of the CO2 mass balance method to calculate ventilation rates from mechanically ventilated livestock buildings. In: 9th International Livestock Environment Symposium (ILES IX), Valencia, Spain.
Ni, J.Q., Vinckier, C., Hendriks, J., Coenegrachts, J., 1999. Production of carbon dioxide in a fattening pig house under field conditions. II. Release from the manure. Atmos. Environ. 33:3697–3703.
Ogink, N.W.M., Hofschreuder, P., Aarnink, A.J.A., 2011. Protocol for the measurement of fine dust emissions from housings in animal production 2010 [in Dutch]. Report 492, Wageningen UR Livestock Research, Lelystad, the Netherlands.
Pedersen, S., Blanes-Vidal, V., Joergensen, H., Chwalibog, A., Haeussermann, A., Heetkamp, M.J.W., Aarnink, A.J.A., 2008. Carbon dioxide production in animal houses: a literature review. Manuscript BC 08 008, Agricultural Engineering International: CIGR Ejournal X.
Pope, C.A., Dockery, D.W., 2006. Health effects of fine particulate air pollution: Lines that connect. J. Air Waste Manag. Assoc. 56:709–742.
PPE-PVE, 2012. Livestock, meat and eggs in the Netherlands: keyfacts 2011 (edition 2012). Dutch Product Board for Poultry and Eggs (PVE) and the Dutch Product Board for Livestock and Meat (PVV), Zoetermeer, the Netherlands.
Schrade, S., Keck, M., Zeyer, K., Emmenegger, L., 2014. PM10 emission measurements in six Swiss dairy cubicle housing systems with natural ventilation and an outdoor exercise area. In: International Conference of Agricultural Engineering (AgEng), Zurich, Switzerland.
Seedorf, J., Hartung, J., Schroder, M., Linkert, K.H., Pedersen, S., Takai, H., Johnsen, J.O., Metz, J.H.M., Koerkamp, P., Uenk, G.H., Phillips, V.R., Holden, M.R., Sneath, R.W., Short, J.L., White, R.P., Wathes, C.M., 1998. A survey of ventilation rates in livestock buildings in Northern Europe. J. Agric. Eng. Res. 70:39–47.
Takai, H., Pedersen, S., Johnsen, J.O., Metz, J.H.M., Groot Koerkamp, P.W.G., Uenk, G.H., Phillips, V.R., Holden, M.R., Sneath, R.W., Short, J.L., White, R.P., Hartung, J., Seedorf, J., Schröder, M., Linkert, K.H., Wathes, C.M., 1998. Concentrations and emissions of airborne dust in livestock buildings in Northern Europe. J. Agric. Eng. Res. 70:59–77.
Van der Hoek, K.W., 2007. Particulate matter emissions from animal production in the Netherlands. In: DustConf 2007 - How to improve air quality, Maastricht, the Netherlands.
Van Zanten, M.C., Van Alphen, A., Wesseling, J., Mooibroek, D., Nguyen, P.L., Groot Wassink, H., Verbeek, C., 2012. State of affairs of the national air quality cooperation programme 2012 [in Dutch, with English summary]. National Institute for Public Health and the Environment (RIVM), Bilthoven, the Netherlands.
VSN, 2013. GenStat reference manual (release 16). Ver. 16.2.0.11713, VSN-Int., Ltd, Hemel Hempstead, UK.Wathes, C.M., Phillips, V.R., Holden, M.R., Sneath, R.W., Short, J.L., White, R.P., Hartung, J., Seedorf, J.,
Schröder, M., Linkert, K.H., Pedersen, S., Takai, H., Johnsen, J.O., Groot Koerkamp, P.W.G., Uenk, G.H., Metz, J.H.M., Hinz, T., Caspary, V., Linke, S., 1998. Emissions of aerial pollutants in livestock buildings in Northern Europe: Overview of a multinational project. J. Agric. Eng. Res. 70:3–9.

Emissions of particulate matter from animal houses in the Netherlands
39
WUR, 2006. Leaflet normen klimaatinstellingen [Leaflet on standards for climate settings; in Dutch]. Wageningen UR Livestock Research, Secretariaat Klimaatplatform Pluimveehouderij, Sterksel, the Netherlands.
WUR, 2010. Leaflet maximale ventilatie in pluimveestallen [Leaflet on maximum ventilation rates in poultry houses; in Dutch]. Wageningen UR Livestock Research, Secretariaat Klimaatplatform Pluimveehouderij, Lelystad, the Netherlands.
Xin, H., Li, H., Burns, R.T., Gates, R.S., Overhults, D.G., Earnest, J.W., 2009. Use of CO 2 concentration difference or CO 2 balance to assess ventilation rate of broiler houses. Trans. ASABE 52:1353–1361.
Zhao, Y., Aarnink, A.J.A., Hofschreuder, P., Groot Koerkamp, P.W.G., 2009. Evaluation of an impaction and a cyclone pre-separator for sampling high PM10 and PM2.5 concentrations in livestock houses. J. Aerosol Sci.40:868–878.

Chapter 2
40
SUPPLEMENTARY INFORMATION 1: main characteristics and acronyms of the 13
housing systems in this study (h. = house or houses)
Housing system: acronyms and main characteristics
Nr. ofhouses
Air inlet and outlet, max. ventilation rate
Animals Productioncycle
LFH: laying hens in floor housing; ⅓ litter area (wood shavings, alfalfa), ⅔ elevated slatted floor above manure pit, forced drying of manure (1 h.), laying nests, chain feeders and lines with nipple or round drinkers
4 Side wall inletsEnd wall fans (2 h.)Roof fans (2 h.)6.7–10.9 m3 h–1 bird–1
7–9 per m2
4,300–17,500 per house
55–59 wk laying,14–24 dempty
LAH: laying hens in aviary housing; litter floor (wood shavings, sand), aviary systems with manure belts (forced drying: 3 h.), laying nests, feeders and nipple drinkers, outdoor run (1 h.)
4 Side wall inletsEnd wall fans6.5–8.7 m3 h–1 bird–1
14–18 per m2,10,900–36,900 per house
55–60 wk laying,7–14 d empty
BRB: broiler breeders in floor housing; ⅓ litter area (wood shavings), ⅔ elevated slatted floor with manure pit, laying nests, male feed pans, female chain feeders
2 Side wall inletsEnd wall fans15.3–19.5 m3 h–1 bird–1
7–8 per m2,8,121–10,253 per house,9–10% males
40 wk laying,3–4 wk empty
BRO: broilers on full litter (wood shavings), lines with feed pans, lines with nipple drinkers and drip cups, hot-air blowers
4 Side wall inletsEnd wall fans6.2–9.4 m3 h–1 bird–1
22–24 per m2
19,000–52,000 per house
42–49 d growing,7 d empty
TUR: male turkeys on full litter (wood shavings, straw), lines with feed pans, water troughs or round drinkers, hot-air blowers
2 Side wall inletsEnd wall fans99–109 m3 h–1 bird–1
3.0–3.4 per m2
4,500–5,000 per house
16–17 wk growing,10–14 d empty
SIH: sows in individual housing; rooms withfeed alley and rows of confined gestation stalls, individual feed trough (dry feed) and drinking nipple, solid floor with slats, manure pit
2 Ceiling (baffle) inletCeiling fans188–222 m3 h–1 pig–1
32–135 gestation stalls per room, 1.3 m2 sow–1
Continuous housing of pregnant gilts and sows
SGH: sows in group housing; similar to SIH but free access to gestation stalls and slatted aisles
2 Ceiling (baffle) inlet Ceiling fans154–234 m3 h–1 pig–1
39–44 gestation stalls per room,2.1–2.5 m2 sow–1
Idem
WFS: weaners in rooms with feed alley and pens with fully slatted floor, manure pit, dry feed
2 Ceiling or door inletCeiling fans34–59 m3 h–1 pig–1
75–130 pigsin 1–4 pens,0.3 m2 pig–1
6 wk growing (6 to 25 kg),2–3 d empty
WPS: weaners; housing similar to WFS, but partially slatted floor (50%)
2 Ceiling inletCeiling fans35 m3 h–1 pig–1
80 pigs in 4–8 pens per room, 0.3 m2
pig–1
Idem
FTH: fattening pigs in traditional housing; compartments with feed alley and trad. pens, partially slatted floor (43–53%), manure pit, dry feed
4 Ceiling or door inletCeiling fans67–109 m3 h–1 pig–1
55–120 pigsin 6–8 pens,0.7–0.8 m2 pig–1
120 d growing (25 to 118 kg),3–4 d empty
FLD: fattening pigs; compartments with feed alley and pens with partially slatted floor (40%), pit with slanted walls and vacuum system for manure removal (low NH3 emission), dry feed
2 Floor (feed alley) inletCeiling fans59–104 m3 h–1 pig–1
132–144 pigsin 12 pens per room,0.8–1.0 m2 pig–1
Idem
FLL: fattening pigs; housing similar to FLD, but with liquid feed
2 Floor (feed alley) inletCeiling fans80–104 m3 h–1 pig–1
144–156 pigsin 12 pens,0.75–1.0 m2 pig–1
Idem
DCH: dairy cattle in traditional cubicle housing; cubicles in 2–4 rows, walking aisles with fully slatted concrete floors, automatic slurry scraper (2 h.), slurry pit underneath slatted floor, drive through feed alley with feed fences, automatic concentrate feeders, water troughs, fan coolers (2 h.)
4 Natural: side wall inlet (eave openings or fully open with windbreak mesh/chicken wire and flexible wind curtains), outlet through ridge opening
50–170 cubicles per house, slatted aisles: 2.6–3.7 m2
cow–1
305–400 d lactation,60 d dry period; pasture grazing (daytime) from April to October (3 h.)

Emissions of particulate matter from animal houses in the Netherlands
41
SUPPLEMENTARY INFORMATION 2: estimation of ventilation rate from the CO2 balance
method (CBM)
For the CBM, we first estimated the total heat production of one animal (Φtotal; kW) based on
input variables such as the animal’s body weight, the energy content and consumption of feed,
and production figures, applying the equations given by the CIGR (CIGR, 2002) in chapter two.
For each measurement, farmers were asked to provide us with these input variables as accurate
as possible, based on latest milk and egg production records, automatic poultry weighing system
data, manual weighings of pigs, feed intake, energy content of feed, etcetera. For dairy cattle, we
estimated a weighted mean animal weight representative for a measurement at a farm location,
based on the number of pregnant heifers and lactating/dry cows present in the house, and by
assuming their weights to be 500 and 625 kg respectively (cows were of the Holstein-Friesian
breed). The calculated heat production was converted to a volumetric CO2 production at the
house level (i.e., by the animal and its manure) by the factors for various animal categories
published in Table 6 of the review paper by Pedersen et al. (2008) (Fco2; in: m3 CO2 h–1 kW–1)
and multiplied by the number of animals (nanimals) present in the house. Finally, the 24-h mean
ventilation rate (Q; m3 h–1) was calculated using Eq. 1:
6-inlet2exhaust2
animals2total
10)]CO[-]CO([
nFcoQ
×
××F= (1)
where [CO2]exhaust is the CO2-concentration measured in the exhaust air, and [CO2]inlet the CO2
concentration measured in the inlet air (ppm). If available, we used the GC concentrations (132
of 147 measurements), in the other 35 cases we used the PAS concentration. Since Q was
estimated on a 24-h basis, the diurnal variation in animal activity was not taken into account.
ReferencesCIGR, 2002. 4th Report of Working Group on Climatization of animal houses. Heat and moisture production at
animal and house levels (eds. Pedersen, S. and K. Sällvik). International Commission of Agricultural Engineering (CIGR), Section II.
Pedersen, S., Blanes-Vidal, V., Joergensen, H., Chwalibog, A., Haeussermann, A., Heetkamp, M.J.W., Aarnink, A.J.A., 2008. Carbon dioxide production in animal houses: a literature review. Manuscript BC 08 008, Agricultural Engineering International: CIGR Ejournal X.

Chapter 2
42
SUPPLEMENTARY INFORMATION 3: climate conditions
The climate conditions inside and outside the houses are listed in Table 1. The means of the
outside temperature and relative humidity were centered around the long term averages of the
Netherlands (10.2 °C for ambient temperature and 80.4% for relative humidity; 1981–2010),
which is the result of spreading the measurements over the year within each house. The overall
mean (standard deviation, SD) outside temperature in this study was 11.2 (6.0) °C, and the
overall mean (SD) outside relative humidity 81.0% (11.2%). In Fig. 1, the 24-h mean values of
outside temperature and relative humidity are shown for all 202 measurements, together with the
long-term average trends of these variables. From this figure, it is clear that the climate
conditions in our dataset closely resembled these long-term trends.
Table 1 shows that the mean temperatures are higher, and that the mean relative humidities
are lower, inside poultry and pig houses as compared to outside. Also, the ranges in temperature
and relative humidity within the housing systems are narrower inside poultry and pig houses as
compared to outside, as a result of the insulation and the ventilation systems in these buildings.
Based on 24-h values, the inside temperature (Table 1) was generally above the Lower Critical
Temperature as summarized for various animal types by Seedorf et al. (1998).
In the houses for egg-laying poultry (LFH, LAH, and BRB) the animals represented the only
inside heat source. The temperature inside these houses was controlled by adjustment of the
ventilation rate whereas the insulation of the building reduced external heat load by solar
radiation in Summer and reduced heat loss in Winter. In BRO and TUR, additional heating was
applied by hot-air blowers, and in weaners and fatteners by pen floor heating systems or heating
of inlet air in the central corridor of the building. The dairy houses in this study all had partially
open side walls with windbreak mesh or chicken wire, manually controlled and flexible wind
curtains, a roof ridge opening and uninsulated corrugated roofs. In these naturally ventilated
buildings, the inside climate very much resembled the outdoor environment (Table 1), as found
earlier by Seedorf et al. (1998) as well. The outside temperature for DCH is higher than the long-
term average, because measurements in this housing system were carried out from February to
September, and during the relatively warm summer of 2009.
The mean climate conditions (Table 1) were generally very similar to those reported for layers
in percheries, broilers on litter, sows on slats, weaners on slats, and dairy cows in cubicles
reported by Seedorf et al. (1998) from the survey in Northern-Europe in the 1990s. Only for
fattening pigs (FTH, FLD, and FLL) mean temperature in the present study is about 4°C higher,
and relative humidity is about 9 percentage points lower, compared to fatteners on slats of that

Emissions of particulate matter from animal houses in the Netherlands
43
study. In the Netherlands, the advised CO2 concentration limit in pig houses was raised in the
last decade from 2000 to 3000 ppm, causing a general decrease in ventilation levels and an
increase in temperature, which might explain this difference.
Table 1Temperature and relative humidity, inside and outside the animal houses (based on 24-h mean values).Housing system
Temperature,inside (°C)
Relative humidity,inside (%)
Temperature,outside (°C)
Relative humidity,outside (%)
Mean Min–Max Mean Min–Max Mean Min–Max Mean Min–MaxLFH 20.2 16.1–25.3 65.0 51.8–75.5 11.1 2.0–21.2 82.2 53.8–99.8LAH 21.0 16.6–25.6 63.7 51.4–92.9 9.6 -3.3–21.8 82.6 60.5–96.5BRB 21.5 20.2–22.3 68.3 48.8–90.4 10.2 -0.4–17.8 85.3 51.6–98.9BRO 24.1 17.4–29.5 66.7 50.5–86.4 10.4 2.3–19.5 82.2 54.5–96.4TUR 19.9 15.6–23.6 71.6 64.1–86.3 10.7 1.5–19.7 81.4 68.0–99.9SIH 21.3 18.1–24.0 59.6 43.3–74.3 10.0 3.5–18.7 80.7 45.1–93.5SGH 22.7 19.4–26.1 64.7 48.7–84.0 11.5 1.3–17.7 81.4 60.5–94.5WFS 26.7 25.0–29.5 53.8 41.2–69.1 13.5 6.4–23.0 77.5 65.5–92.5WPS 26.0 24.2–28.5 54.9 41.9–64.8 8.4 -0.6–18.8 84.9 74.4–93.4FTH 25.1 20.1–28.0 57.9 41.0–73.8 12.0 -0.5–19.8 81.5 64.0–92.9FLD 25.2 23.2–27.9 53.9 44.0–78.0 12.0 6.2–21.6 77.4 52.9–93.3FLL 25.1 22.3–26.7 57.2 45.1–71.4 9.3 -0.7–18.7 80.6 64.5–97.5DCH 17.5 7.3–26.9 74.3 50.7–95.2 15.0 5.7–22.5 74.8 48.6–98.6
Fig. 1Outside temperature and relative humidity during this study (based on 24-h mean values).
ReferencesSeedorf, J., Hartung, J., Schroder, M., Linkert, K.H., Pedersen, S., Takai, H., Johnsen, J.O., Metz, J.H.M.,
Koerkamp, P., Uenk, G.H., Phillips, V.R., Holden, M.R., Sneath, R.W., Short, J.L., White, R.P., Wathes, C.M., 1998. A survey of ventilation rates in livestock buildings in Northern Europe. J. Agric. Eng. Res. 70:39–47.
-5
0
5
10
15
20
25
0 40 80 120 160 200 240 280 320 360
Ambi
ent a
ir te
mpe
ratu
re (°
C)
Day number in calender year
Temperature observed at farm
Long-term average temperature (KNMI, 1981-2010)
40
50
60
70
80
90
100
0 40 80 120 160 200 240 280 320 360
Ambi
ent a
ir hu
mid
ity (%
)
Day number in calender year
Relative humidity observed at farm
Long-term average relative humidity (KNMI, 1981-2010)

Chapter 2
44
SUPPLEMENTARY INFORMATION 4: ventilation rate
In Fig. 1 and Fig. 2, scatter plots are presented of the ventilation rates against the day number
in the growing period (for growing animals; Fig. 1) or against the outside temperature (for non-
growing animals; Fig. 2). Data points were obtained from multiple farms, and from multiple
production cycles and seasons within each farm, which contributes to the heterogeneity of the
plots. Nevertheless, the scatter plots indicate that ventilation rate increased exponentially with
the age of BRO, increased linearly with the age of fattening pigs, increased exponentially with
outside temperature in egg-laying poultry, increased linearly with outside temperature in sows,
and increased with wind speed in DCH. For fattening pigs, ventilation rate clearly increased with
increasing outside temperature as well (scatter plot not given), which showed that the ventilation
rate depends on both the animal mass in the house, and the outside temperature.
Fig. 1Scatter plots of ventilation rates for housing systems with growing animals.
Broilers (BRO) Turkeys (TUR)
0
2
4
6
8
10
0 7 14 21 28 35 42 49
Vent
ilatio
n ra
te (m
3h–
1an
imal
–1)
Day number in growing period
0
5
10
15
20
25
0 20 40 60 80 100 120 140
Vent
ilatio
n ra
te (m
3h–
1an
imal
–1)
Day number in growing period
0
5
10
15
20
25
0 10 20 30 40
Vent
ilatio
n ra
te (m
3h–
1an
imal
–1)
Weaners, fully slatted floor (WFS)Weaners, partially slatted floor (WPS)
Day number in growing period
0
20
40
60
0 20 40 60 80 100 120
Vent
ilatio
n ra
te (m
3h–
1an
imal
–1)
Fatteners, trad. housing (FTH)Fatteners, low emiss., dry feed (FLD)Fatteners, low emiss., liquid feed (FLL)
Day number in growing period

Emissions of particulate matter from animal houses in the Netherlands
45
Fig. 2Scatter plots of ventilation rates for housing systems with non-growing animals.
SUPPLEMENTARY INFORMATION 5: inside PM concentrations
In Fig. 1 and Fig. 2, scatter plots are given of the PM10 concentration against the day number
in the growing period (for growing animals; Fig. 1) or against the ventilation rate (for non-
growing animals; Fig. 2). These plots show that PM10 concentration increased linearly with
increasing age in BRO, TUR, and fatteners (FTH, FLD, and FLL). When these animals grow,
increasing amounts of feed are being delivered, more manure and skin debris is produced, and
more force can be exerted on these PM sources, resulting in an increasing rate of disintegration
and aerosolization. In egg-laying poultry (LFH, LAH, and BRB), sows (SIH and SGH) and
DCH, PM10 concentration decreased with increasing ventilation rate, which presumably
represents PM dilution due to the greater air exchange rate.
0
2
4
6
8
10
-5 0 5 10 15 20 25
Vent
ilatio
n ra
te (m
3h–
1an
imal
–1)
Outside temperature (°C)
Broiler breeders (BRB)
Laying hens, floor housing (LFH)Laying hens, aviary housing (LAH)
0
25
50
75
100
125
150
-5 0 5 10 15 20 25Ve
ntila
tion
rate
(m3
h–1
anim
al–1
)
Outside temperature (°C)
Sows, group housing (SGH)Sows, ind. housing (SIH)
0
500
1000
1500
2000
2500
0 2 4 6 8
Vent
ilatio
n ra
te (m
3h–
1an
imal
–1)
Wind speed (m s–1)
Dairy cattle, cubicle housing (DCH)

Chapter 2
46
Fig. 1. Scatter plots of the PM10 concentration for housing systems with growing animals.
Fig. 2. Scatter plots of the PM10 concentration for housing systems with non-growing animals.
Broilers (BRO) Turkeys (TUR)
Fatteners, trad. housing (FTH)Fatteners, low emiss., dry feed (FLD)Fatteners, low emiss., liquid feed (FLL)
Day number in growing period
0
1
2
3
4
0 7 14 21 28 35 42 49
PM
10 c
once
ntra
tion
(mg
m–3
)
Day number in growing period
0
1
2
3
0 20 40 60 80 100 120 140
PM
10 c
once
ntra
tion
(mg
m–3
)
Day number in growing period
0.0
0.5
1.0
1.5
2.0
0 10 20 30 40
PM
10 c
once
ntra
tion
(mg
m–3
)
0.0
0.5
1.0
1.5
0 20 40 60 80 100 120
PM
10 c
once
ntra
tion
(mg
m–3
)
Weaners, fully slatted floor (WFS)Weaners, partially slatted floor (WPS)
Day number in growing period
Broiler breeders (BRB)
Laying hens, floor housing (LFH)Laying hens, aviary housing (LAH)
Sows, group housing (SGH)Sows, ind. housing (SIH)
Dairy cattle, cubicle housing (DCH)
0
2
4
6
8
0 2 4 6 8 10
PM
10 c
once
ntra
tion
(mg
m–3
)
Ventilation rate (m3 h–1 animal–1)
0.0
0.5
1.0
0 25 50 75 100 125 150
PM
10 c
once
ntra
tion
(mg
m–3
)
Ventilation rate (m3 h–1 animal–1)
0.0
0.1
0 500 1000 1500 2000 2500
PM
10 c
once
ntra
tion
(mg
m–3
)
Ventilation rate (m3 h–1 animal–1)

Emissions of particulate matter from animal houses in the Netherlands
47
SUPPLEMENTARY INFORMATION 6: overview of publications reporting livestock PM10
and PM2.5 emission rates a (all recalculated to mg h–1)
Animal type b Country c Concentration[µg m–3]; mean d
and (range)
Emission rate [mg h–1]; mean d and (range)
Source; first author (year)
Per animal Per LUPM10
Layers, floor (2) UK - 5.79 - Demmers (2010)Layers, aviary (1) IT 215 1.23 - Costa (2012)Layers, aviary (1) IT - 5.27 1700 (513–3229) Valli (2012)Layers, aviary (2) USA 2300 4.58 1229 Hayes (2013)Broilers, floor (4) USA - 1.10 536 Lacey (2003)Broilers, floor (1) CA 690 0.56 - Roumeliotis (2007)Broilers, floor (1) DE (10–5000) 1.97 (0.22–5.6) - Calvet (2009)Broilers, floor (2) UK 2990 1.32 - Demmers (2010)Broilers, floor (1) AU 365 - 981 Modini (2010)Broilers, floor (1) CA - - 246 Roumeliotis (2010)Broilers, floor (2) USA 930 (110–4768) 1.88 (max. 7.1) 1358 (max. 13,291) Lin (2012)Turkeys, floor (1) USA 720 - 727 (135–2133) Schmidt (2002)Turkeys, floor (1) USA - (2.71–25.6) (558–1200) Li (2008)Sows, slats (1) IT 310 (<10–10,600) - 29.2 (<1–750) Haeussermann (2008)Sows, slats (1) IT - - 51.3 Costa (2009)Weaners, slats (2) IT 255 (<10–16,500) - 64.4 (<1–1008) Haeussermann (2008)Weaners, slats (1) IT - - 83.3 Costa (2009)Fatteners, slats (1) USA 935 - 126 (72–242) Schmidt (2002)Fatteners, slats (2) USA 471 (135–1001) - 120 (49–192) Koziel (2004)Fatteners, slats (2) IT, DE 600 (20–5610) - 167 (22–1242) Haeussermann (2008)Fatteners, slats (1) IT - - 108 Costa (2009)Fatteners, slats (6) BE 719 (328–1746) 11.4 85.7 e Van Ransbeeck (2013)Dairy, cubicles (1) USA 60 - 33 (5–83) Schmidt (2002)Dairy, cubicles (2) USA 106 (22–240) 560 - Joo (2013)Dairy, cubicles (6) CH (<10–69) - (0.83–87.5) Schrade (2014)
PM2.5Layers, floor (2) UK - 1.52 - Demmers (2010)Layers, aviary (2) USA 250 0.33 87.5 Hayes (2013)Broilers, floor (1) CA 190 0.12 - Roumeliotis (2007)Broilers, floor (2) UK 655 0.21 - Demmers (2010)Broilers, floor (1) AU 79 - 216 Modini (2010)Broilers, floor (1) CA - - 58.3 Roumeliotis (2010)Broilers, floor (2) USA - 0.22 (max. 0.49) 70.8 (max. 129) Lin (2012)Fatteners, slats (6) BE 38 (15.2–105) 0.89 6.7 e Van Ransbeeck (2013)Dairy, cubicles (2) USA 19 (4–44) 117 - Joo (2013)
a For animal housing layouts comparable to those studied here in this work (Table 1), i.e., no cage housing for layers, deep-litter systems, sow farrowing rooms, mechanically ventilated dairy houses, or cattle feedlots.b Number of houses in parenthesis.c ISO 3166-1 country code.d Arithmetic mean.e Our calculations, based on a mean live weight of 66.5 kg (weights given in article).

Chapter 2
48
References
Calvet, S., van den Weghe, H., Kosch, R., Estellés, F., 2009. The influence of the lighting program on broiler activity and dust production. Poult. Sci. 88:2504–2511.
Costa, A., Ferrari, S., Guarino, M., 2012. Yearly emission factors of ammonia and particulate matter from three laying-hen housing systems. Anim. Prod. Sci. 52:1089–1098.
Costa, A., Guarino, M., 2009. Definition of yearly emission factor of dust and greenhouse gases through continuous measurements in swine husbandry. Atmos. Environ. 43:1548–1556.
Demmers, T.G.M., Saponja, A., Thomas, R., Phillips, G.J., McDonald, A.G., Stagg, S., Bowry, A., Nemitz, E., 2010. Dust and ammonia emissions from UK poultry houses. In: XVII-th World Congress of the International Commission of Agricultural and Biosystems Engineering (CIGR), Québec City, Canada.
Haeussermann, A., Costa, A., Aerts, J.M., Hartung, E., Jungbluth, T., Guarino, M., Berckmans, D., 2008. Development of a dynamic model to predict PM10 emissions from swine houses. J. Environ. Qual. 37:557–564.
Hayes, M.D., Xin, H., Li, H., Shepherd, T.A., Zhao, Y., Stinn, J.P., 2013. Ammonia, greenhouse gas, and particulate matter emissions of aviary layer houses in the Midwestern U.S. Trans. ASABE 56:1921–1932.
Joo, H.S., Ndegwa, P.M., Heber, A.J., Ni, J.Q., Bogan, B.W., Ramirez-Dorronsoro, J.C., Cortus, E.L., 2013. Particulate matter dynamics in naturally ventilated freestall dairy barns. Atmos. Environ. 69:182–190.
Koziel, J.A., Baek, B.H., Bush, K.J., Balota, A., Bayley, C.L., Sweeten, J.M., 2004. Emissions of particulate matter from swine finish barns in Texas. In: Proceedings of the AgEng 2004 “Engineering the Future” Conference, Leuven, Belgium.
Lacey, R.E., Redwine, J.S., Parnell Jr, C.B., 2003. Particulate matter and ammonia emission factors for tunnel-ventilated broiler production houses in the southern U.S. Trans. ASABE 46:1203–1214.
Li, H., Xin, H., Burns, R.T., Hoff, S.J., Harmon, J.D., Jacobson, L.D., Noll, S.L., 2008. Effects of bird activity, ventilation rate and humidity on concentration and emission rate of a turkey barn. In: 8th International Livestock Environment Symposium, ILES VIII, Iguassu Falls, Brasil, pp. 111–116.
Lin, X.J., Cortus, E.L., Zhang, R., Jiang, S., Heber, A.J., 2012. Air emissions from broiler houses in California. Trans. ASABE 55:1895–1908.
Modini, R.L., Agranovski, V., Meyer, N.K., Gallagher, E., Dunlop, M., Ristovski, Z.D., 2010. Dust emissions from a tunnel-ventilated broiler poultry shed with fresh and partially reused litter. Anim. Prod. Sci. 50:552–556.
Roumeliotis, T.S., Dixon, B.J., Van Heyst, B.J., 2010. Characterization of gaseous pollutant and particulate matter emission rates from a commercial broiler operation part II: Correlated emission rates. Atmos. Environ. 44:3778–3786.
Roumeliotis, T.S., Van Heyst, B.J., 2007. Size fractionated particulate matter emissions from a broiler house in Southern Ontario, Canada. Sci. Total Environ. 383:174–182.
Schmidt, D.R., Jacobson, L.D., Janni, K.A., 2002. Continuous monitoring of ammonia, hydrogen sulfide and dust emissions from swine, dairy and poultry barns. In: ASAE Annual International Meeting, ASAE Meeting Paper No. 024060, American Society of Agricultural Engineers (ASAE), Chicago, USA.
Schrade, S., Keck, M., Zeyer, K., Emmenegger, L., 2014. PM10 emission measurements in six Swiss dairy cubicle housing systems with natural ventilation and an outdoor exercise area. In: International Conference of Agricultural Engineering (AgEng), European Society of Agricultural Engineers, Zurich, Switzerland.
Valli, L., Moscatelli, G., Labartino, N., 2012. Ammonia and particulate matter emissions from an alternative housing system for laying hens. In: Emissions of Gas and Dust from Livestock (EmiLi 2012), Saint-Malo, France, pp. 103–106.
Van Ransbeeck, N., Van Langenhove, H., Demeyer, P., 2013. Indoor concentrations and emissions factors of particulate matter, ammonia and greenhouse gases for pig fattening facilities. Biosyst. Eng. 116:518–528.

Emissions of particulate matter from animal houses in the Netherlands
49
SUPPLEMENTARY INFORMATION 7: Arithmetic mean and standard deviation between
houses (SDBH) of original-scaled PM emission rates, model-estimated mean emission rates on
the natural log-scale (SE: standard error), and back-transformed mean emission rates (i.e.,
geometric means on the original scale), each expressed per Livestock Unit (LU), and per Heat
Production Unit (HPU)
Housing Nr. n Emission ratesystem of mg h–1 LU–1 mg h–1 HPU–1
houses Mean (SDBH);
original-scaled data
Log-transformed
mean (SE)
Back-transf.mean
Mean (SDBH);
original-scaled data
Log-transformed
mean (SE)
Back-transf.mean
Inh. PMLFH 4 19 7634 (4268) 8.66 (0.19) 5739 2326 (1285) 7.47 (0.19) 1746BRO 4 18 3058 (726) 7.84 (0.19) 2540 613 (158) 6.16 (0.20) 473SIH 2 8 170 (15) 5.05 (0.28) 156 246 (21.8) 5.42 (0.29) 225WPS 1 5 899 (–) 6.73 (0.36) 835 418 (–) 5.94 (0.38) 379FTH 4 20 437 (219) 5.91 (0.18) 367 264 (136) 5.39 (0.19) 219FLD 1 2 863 (–) 6.76 (0.50) 863 480 (–) 6.17 (0.52) 479DCH 4 19 215 (28) 5.07 (0.19) 159 200 (34.0) 4.99 (0.19) 146
PM10
LFH 4 23 2858 (1134) 7.76 (0.17) 2343 872 (342) 6.57 (0.17) 713LAH 4 22 2216 (499) 7.59 (0.17) 1978 666 (148) 6.39 (0.17) 595BRB 2 12 913 (9.80) 6.51 (0.23) 671 345 (7.37) 5.55 (0.24) 257BRO 4 24 1439 (621) 7.08 (0.16) 1190 289 (132) 5.40 (0.17) 221TUR 2 11 658 (124) 6.44 (0.23) 627 230 (50.5) 5.37 (0.25) 214SIH 2 11 48.9 (2.26) 3.84 (0.23) 46.7 70.6 (3.73) 4.21 (0.25) 67.3SGH 2 10 51.3 (21.2) 3.87 (0.24) 48.1 70.2 (30.5) 4.18 (0.25) 65.4WFS 2 11 278 (60.4) 5.60 (0.23) 272 164 (38.1) 5.07 (0.25) 159WPS 2 10 268 (22.4) 5.56 (0.24) 260 130 (12.4) 4.80 (0.25) 122FTH 4 23 130 (57.0) 4.77 (0.16) 118 82.1 (39.2) 4.29 (0.17) 73.3FLD 2 10 199 (39.4) 5.26 (0.24) 192 120 (22.5) 4.76 (0.25) 117FLL 2 10 117 (18.1) 4.71 (0.24) 111 84.9 (10.2) 4.31 (0.25) 74.7DCH 4 20 6.91 (2.20) n.d. n.d. 6.39 (2.07) n.d. n.d.
PM2.5
LFH 4 23 154 (67.3) 4.66 (0.22) 105 47.0 (20.4) 3.46 (0.23) 31.9LAH 4 22 128 (35.0) 4.69 (0.23) 108 38.4 (10.2) 3.48 (0.23) 32.6BRB 2 12 68.6 (3.74) 3.64 (0.31) 38.2 25.8 (1.13) 2.68 (0.32) 14.6BRO 4 24 96.7 (48.6) 4.09 (0.22) 59.7 20.1 (10.8) 2.39 (0.23) 10.9TUR 2 10 156 (17.1) 4.87 (0.33) 130 55.5 (5.46) 3.79 (0.33) 44.1SIH 2 10 4.06 (1.36) 1.23 (0.33) 3.43 5.37 (2.01) 1.60 (0.33) 4.95SGH 2 10 3.67 (1.34) 1.25 (0.33) 3.48 5.01 (1.95) 1.55 (0.33) 4.73WFS 2 11 9.39 (4.48) 2.12 (0.32) 8.31 5.50 (2.71) 1.58 (0.33) 4.85WPS 2 10 6.73 (1.16) 1.82 (0.33) 6.19 3.28 (0.53) 1.06 (0.33) 2.89FTH 4 23 6.45 (3.45) 1.70 (0.22) 5.48 4.12 (2.36) 1.23 (0.23) 3.41FLD 2 10 8.62 (1.19) 2.11 (0.33) 8.22 5.15 (0.61) 1.61 (0.33) 4.98FLL 2 10 5.01 (1.09) 1.45 (0.33) 4.25 3.67 (1.00) 1.05 (0.33) 2.87DCH 4 20 1.33 (0.49) n.d. n.d. 1.23 (0.49) n.d. n.d.
n.d.: not determined.


Chapter 3Abatement of particulate matter emission from experimental
broiler housings using an optimized oil spraying method
A. Winkel a, M. Cambra-López b, P.W.G. Groot Koerkamp a,c, N.W.M. Ogink a, and
A.J.A. Aarnink a
a Wageningen UR Livestock Research, Wageningen, the Netherlandsb Institute of Animal Science and Technology,Universidad Polytéchnica de Valencia, Valencia, Spain
c Farm Technology Group, Wageningen University, Wageningen, the Netherlands
Transactions of the ASABE (2014) 57:1853–1864
Reprinted with permission from the American Society of Agricultural and Biological Engineers
Available online at: https://dx.doi.org/10.13031/trans.57.10870

Chapter 3
52
ABSTRACT
In this follow-up study, we investigated effects of two rapeseed oil application rates (8 or 16
mL m–2 d–1) in combination with two spraying frequencies (daily or every other day) in four oil
treatments: 8 mL m–2 (24 h)–1, 16 mL m–2 (48 h)–1, 16 mL m–2 (24 h)–1, and 32 mL m–2 (48 h)–1
during two growth cycles of broilers. Oil treatments were randomly assigned to four rooms,
whereas two rooms served as control (0 mL m–2). Oil spraying started on day 21. Prior to the
second growth cycle, the spraying system was optimized to improve the distribution of oil and
reduce the generation of small oil particles. We measured concentrations of PM10, PM2.5,
ammonia, and odor, and ventilation rate. Furthermore, we recorded bird performance and birds’
exterior quality. PM10 emission was significantly reduced by 59% at 8 mL m–2 d–1 and by 64% at
16 mL m–2 d–1. For PM2.5, these values were 81% and 74% respectively. In the two ‘every other
day’ treatments, PM10 emission was 44% higher on days after spraying than on spraying days.
No significant effect of oil spraying was found on ammonia emission, odor emission, bird
performance, and birds’ exterior quality. The latter confirms that at an application rate of 16 mL
m–2 d–1 the incidence of foot-pad lesions is not increased. It is recommended to validate the
effects of oil spraying inside full-scale commercial broiler houses at a daily application of 16 mL
m–2 or less.

Abatement of PM emission from experimental broiler housings using an optimized oil spraying method
53
INTRODUCTION
In many parts of the world, broiler chickens are reared inside mechanically ventilated
buildings which house up to tens of thousands of birds on litter floors. The presence of litter (i.e.,
manure and bedding material), together with the feathers of the broilers, give rise to high
concentrations of airborne particulate matter (PM) (Cambra-López et al., 2011; Winkel et al.,
2015). The abundance of PM in the air of poultry houses is associated with an increased risk of
respiratory diseases in poultry farmers (Omland, 2002; Radon et al., 2001). In broilers, exposure
to airborne PM may devitalize the respiratory mucosa, damage bronchi, lungs and air sacs,
facilitate the invasion of micro-organisms and affect body weight gain and mortality (Al
Homidan et al., 2003; Madelin and Wathes, 1989). By their exhaust emissions, broiler houses
may raise PM concentration in the ambient environment and thereby adversely affect respiratory
and cardiovascular health of the general population (Brunekreef and Holgate, 2002). In the
Netherlands, intensive livestock farming has been identified as the third largest source of
particles with aerodynamic diameters smaller than 10 µm (PM10), responsible for approximately
17% of the primary PM10 emitted nationally (RIVM, 2014). Limit concentrations for the ambient
environment have been laid down by the European Union in EU directive 2008/50/EC (EU,
2008) for PM10 and for particles with aerodynamic diameters smaller than 2.5 µm (PM2.5).
Mitigation options for the most relevant PM sources are urgently needed to be able to comply to
these limits and protect the population. Therefore, a research program was initiated with the aim
to develop PM mitigation options for the poultry industry which were selected based on their
efficacy and economic feasibility (Ogink and Aarnink, 2011).
One of these options is spraying vegetable oil to prevent particles on surfaces (e.g., litter
floors) to become airborne. Effects of spraying oil, or oil-water mixtures, have been studied in
pig houses (Takai, 2007), but in broiler houses only few studies have been carried out (Drost et
al., 1999; Griffin and Vardaman, 1970; McGovern et al., 1999, 2000). The latter studies
investigated the perspective of oil spraying to improve indoor air quality and the performance
and health of the broilers. None of these studies however focused on the abatement of PM
emission to the ambient environment.
In a first study (Aarnink et al., 2011) we used an oil spraying system installed inside four
rooms of an experimental broiler house to investigate dose-response effects of spraying rapeseed
oil (6 to 24 mL m–2 d–1; daily spraying) on the reduction of PM and ammonia emission, on
workers’ exposure to PM, and on the performance and exterior quality of the broilers. That study
showed that PM10 concentration and emission decreased with increasing oil application rate,

Chapter 3
54
whereas no effect was found on ammonia emission and bird performance. The system however,
produced small oil particles (<10 µm; aerodynamic diameter) during spraying and the
application of 24 mL m–2 d–1 significantly increased the incidence and severity of foot-pad
lesions as compared to the control treatment (0 mL m–2). Based on this study it was advised not
to exceed a maximum application rate of 16 mL m–2 d–1.
In the present paper, we report a follow-up study from Aarnink et al. (2011) carried out in the
same broiler house. The objective of this study was to further increase our understanding of the
effects of oil application rate and application frequency on particulate and gaseous emissions,
bird performance and birds’ exterior quality. More explicitly, the main research questions within
this study were:
• What is the effect of spraying oil daily versus a double dose every other day?
• What is the effect of oil spraying on odor emission?
• What is the effect of system optimizations on the generation of small oil particles?
• What is the effect of application rates of 16 mL m–2 d–1 or less on the exterior quality of the
broilers?
MATERIAL AND METHODS
Experimental design
We investigated the effect of two oil application rates (8 or 16 mL m–2 d–1) in combination
with two spraying frequencies (daily or every other day) resulting in four oil treatments: 8 mL
m–2 (24 h)–1, 16 mL m–2 (48 h)–1, 16 mL m–2 (24 h)–1, and 32 mL m–2 (48 h)–1. Oil treatments
were randomly assigned to four broiler rooms, whereas two rooms served as control (0 mL m–2).
The experiment lasted for two consecutive growth cycles. In both cycles, oil spraying started on
day 21.
Housing and animals
The study was conducted inside the broiler house at ‘Het Spelderholt’ experimental station in
Lelystad, the Netherlands. Each room measured 8.32 × 16.06 m (133.6 m2) and contained four
feeding lines with seven feeders and eight drinking lines with 180 drinking nipples in total. The
rooms were heated by a central heating system with radiators on the side walls underneath the air

Abatement of PM emission from experimental broiler housings using an optimized oil spraying method
55
inlets. In each room 2,675 one-day-old Ross 308 broilers (Probroed en Sloot, Groenlo, the
Netherlands) were placed. The broilers were delivered at 35 days of age, at approximately 2.0 to
2.1 kg live weight. Broilers had ad libitum access to feed and drinking water. They were
vaccinated against infectious bronchitis (IB), Gumboro, and New Castle Disease (NCD). The
broilers received a pre-starter diet (crumb feed) during the first ten days, followed by a starter
diet (granules and 15% wheat; days 11 to 28) and a finisher diet (granules and 30% wheat; days
29 to 35) (Superreeks diet, ForFarmers, Lochem, the Netherlands). During the first two days the
rooms were continuously lit. During the rest of the growth cycle an intermittent light scheme was
given of 8 h light and 4 h dark (07:45 to 15:45 (light); 15:45 to 19:45 (dark); 19:45 to 03:45
(light); 03:45 to 07:45 (dark)). Light intensity was the same for all rooms (20 lux). Between
growth cycles litter was removed and feeders and drinking lines were pre-treated with a cleaning
agent (PRO-REIN, CID LINES, Ieper, Belgium; 26 kg in 400 L water). After 30 min of soaking
time, rooms were cleaned with a high-pressure cleaner using tap water. One day before the
broilers were introduced, 1 kg m-2 of fresh wood shavings was spread in the rooms as bedding
material. All rooms were heated to 33 °C 3 days before the broilers were placed in the rooms.
The target temperatures at the different ages were: 33 °C at day 1, 28 °C at day 7, 25 °C at day
14, 22 °C at day 21, and 20 °C at day 35 (the temperatures between these days were linearly
interpolated). Each room had 12 air inlets in the side walls and three exhaust fans in the roof (0.6
m dia., capacity: 7000 m3 h–1 each, variable speed; Fancom B.V., Panningen, the Netherlands):
one fan operated continuously and the other two operated when needed. Minimum ventilation
was controlled at 1 m3 h–1 per kg live weight. Based on the inside temperature, the ventilation
rate was increased automatically by the climate computer (type: FSU.4; Fancom B.V.,
Panningen, the Netherlands). The maximum ventilation rate in the room was 21,000 m3 h–1 or
7.9 m3 h–1 bird–1.
Oil spraying system
During the first growth cycle, the same oil spraying system was used as in Aarnink et al.
(2011). This system consisted of full cone nozzles (type SU26B-SSBR, Spraying Systems,
Ridderkerk, the Netherlands) installed on oil tubes (Fig. 1). Two oil tubes (PVC Kiwa tube, 32
mm dia.) were suspended across the room in parallel at a height of approximately 2.5 m. Four
nozzles were placed on each tube, pointing in opposite directions. Each tube with nozzles had to

Chapter 3
56
Fig. 1Schematic plan view (top) and photographs of the oil spraying system during spraying (bottom left) and of the extra side wall nozzles spraying towards the centre of the room (bottom right).
cover half the area of the room (8 × 8 m). Oil was sprayed by injecting oil and air into the
nozzles at the same time, both at a pressure of 3.5 bar. Compressed air was delivered through
two tubes underneath the oil tubes (PVC Kiwa tube, 32 mm dia.). Air and oil pressure was
delivered by a compressor (type CV 40, 3.0 kW, 400 VAC, 50 Hz) with an air dryer (model DE
Broiler room
Broiler room
Compressed air tube
Oil tube
Valve
Spraying nozzle
Ventilation shaft
Air dryer
Oil tank
Legend:
Air compressor
Nozzle
Compressedair tube
Oil tube
Valves
Radiatorpipes
Oil being sprayed
Compressedair tube
Oil tube
Nozzle

Abatement of PM emission from experimental broiler housings using an optimized oil spraying method
57
101, 230 VAC, 0.36 kW, max. 16 bar, min. 5 °C, max. 43 °C; Airpress, Euro series, V.R.B.
Friesland bv, Leeuwarden, the Netherlands). Oil and air delivery to the nozzles was controlled by
valves (BE 024AS, 24 VAC, 50 Hz, 10 W, Danfoss, Hasselager, Denmark). The valves were
opened for a certain time depending on how much oil needed to be sprayed in the room. The
spraying was automatically controlled by a control unit (Moeller Easy 821‐DC‐TC, F‐Central
software, Fancom, Panningen, The Netherlands). The oil was delivered from a high‐pressure
tank (24 L, model N24, Mondeo, Montecchio Maggiore, Italy). Pure, cold-pressed, and refined
rapeseed oil (density: 0.91 g mL–1) was used, suitable to be used as bio-fuel for vehicles.
To achieve a more uniform distribution of oil over the litter floor, the oil spraying system was
expanded prior to the second growth cycle, with two additional oil tubes per room, mounted on
the side walls (Fig. 1). Both additional oil tubes contained four nozzles, thereby increasing the
number of nozzles per room from eight to sixteen, and decreasing the litter floor area per oil tube
from half of the room to a quarter of the room. The side wall nozzles sprayed towards the center
of the room. To minimize the formation of small oil particles, oil pressure and air pressure were
decreased in the second growth cycle from 3.5 to 3.0 bar. At these configurations, the volume
median diameter of the oil particles was 44 µm and 49 µm respectively (Aarnink and Van
Hattum, 2009).
Treatments
The oil spraying treatments were: 8 mL m–2 (24 h) –1, 16 mL m–2 (48 h) –1, 16 mL m–2 (24 h) –
1, and 32 mL m–2 (48 h) –2. The relationship between spraying time and the amount of oil applied
found in Aarnink et al. (2011) (0.4 mL m–2 s–1) was used to determine spraying duration.
Spraying times in the first growth cycle were 20 s for application of 8 mL m–2, 40 s for
application of 16 mL m–2, and 80 s for application of 32 mL m–2. In the second growth cycle,
these spraying times were halved because twice the number of nozzles was used. No clear
change in oil application rate was found due to the reduction of oil and air pressure from 3.5 to
3.0 bar. Previous work showed that PM concentrations and emissions strongly increased only
after two to three weeks (Aarnink et al., 2011). Therefore, we started the oil spraying at day 21
of the growth cycle. On oil spraying days, oil was sprayed once, normally at 08:00. Only on the
second day of each 24 h PM sampling period, oil was sprayed at 14:00, to protect the PM
sampling equipment which sampled from noon to noon.

Chapter 3
58
Measurements
An overview of measured variables is given in Table 1.
Table 1Summary of measured variables.
Variable Measurement method/instrument
Unit Samplingduration
Timeresolution
Frequency(days in growth cycle)
PM concentrationPM10 and PM2.5 Cyclone sampler mg m–3 24 h 24 h 16, 23, 30, 33PM10 and PM2.5
during oil sprayingCyclone sampler mg m–3 2 h 2 h 25, 31 (2nd
cycle)Personal PM10
exposureDustTrak Aerosol Monitor
mg m–3 7 min 1 min 25, 32, 33 (1st
cycle); 25, 32(2nd cycle)
Ammonia concentration
NH3-converter, NOx-monitor
mg m–3 Continuous - -
Odor concentration Dynamic olfactometry OUE m–3 2 h 2 h 24, 31Ventilation rate Ventilation shaft
anemometersm–3 h–1 Continuous 1 h -
Environmental conditions
Air temperature Temperature sensor °C Continuous 1 h -Relative humidity Relative humidity sensor % Continuous 1 h -
Animal parametersBody weight Weighing g - - 0, 21, 34, 35Feed consumption Feed weighing system kg d–1 room–1 - - 21, 35Water consumption Water meter L d–1 room–1 Continuous 1 day DailyMortality Visual inspection,
counting% Continuous 1 day Daily
Foot-pad lesions Visual observation, scoring
Score - - 33
Exterior quality Visual observation, scoring
Score - - 33
Rapeseed oil use Weighing kg d–1 room–1 Continuous 1 day DailyLitter characteristics
Dry matter content Oven-drying, weighing % - - 14, 28, 35Manure cake formation
Visual observation % of litter area - - 14, 28, 35
Room cleaning time Visual observation min - - 36
Particulate matter
Measurements of PM10 and PM2.5 concentrations were done on four days spread over the
growth cycle: on day 16, when oil spraying had not yet started, and during the oil spraying phase
on days 23, 30, and 33; in both growth cycles. Duplicate PM samplers for sampling exhaust air
were placed in each room near the shaft of the ventilator that was continuously running: 0.5 m

Abatement of PM emission from experimental broiler housings using an optimized oil spraying method
59
horizontally from the border of the exhaust opening and 0.1 m vertically below the exhaust
opening. In the incoming air, single samples of PM10 and PM2.5 were taken just outside the
animal house. Sampling times were from noon to noon (24 h). These measurements were carried
out to determine concentrations and emissions of PM.
PM10 and PM2.5 concentrations were determined by gravimetric filtration, using sampling
pumps (Tecora, model Charlie HV; Ravebo B.V., Brielle, the Netherlands) and cyclone samplers
(URG, model URG-2000-30ENB for PM10 and URG-2000-30EG for PM2.5; URG Corp., Chapel
Hill, N.C.) at a sample flow rate of 16.7 L min–1. Inside the cyclones, the aimed particle size was
collected on a glass fiber filter (type GF-3, 47 mm dia., Macherey-Nagel, Düren, Germany).
Unloaded and loaded filters were weighed with a precise balance (AT261 DeltaRange, Mettler,
Greifensee, Switzerland; resolution: 10 µg) under standard conditions of 20 ± 1 °C and 50 ± 5%
relative humidity (CEN, 1998, 2005). After 48 h of stabilization, filters were weighed four times
spread over two consecutive days. The average value was recorded as the filter weight. The PM
mass concentration was calculated by dividing the mass of collected PM by the volume of air
drawn through the filter. PM10 concentrations were calibrated to the reference impaction sampler
described in EN 12341 (CEN, 1998) using the equations reported by Zhao et al. (2009): y =
1.09x (when x ≤223 µg m–3) and y = 0.83x + 57.5 (when x >223 µg m–3), where x is the
concentration measured with the cyclone sampler and y is the calibrated concentration.
To assess the generation of small oil particles of the adapted oil spraying system during the
second growth cycle, PM10 and PM2.5 concentrations were additionally measured during the time
around oil spraying on days 25 and 31. On these days, PM was sampled during 2 h (from 15 min
before until 105 min after oil spraying) following the same procedures as described above.
Personal PM10 sampling
The exposure of stock handlers to PM10 was determined on days 25, 32, and 33 in the first
growth cycle, and on days 25 and 32 in the second growth cycle, using a light-scattering device
(DustTrak aerosol monitor, model 8520, TSI, Inc., Shoreview, Minn.). The DustTrak was
attached to the stock handler's lapel, at a height of approximately 1.5 m, with the sampling inlet
facing upward. Stock handlers wore respiratory masks to prevent directly breathing into the inlet.
On a measuring day, the stock handler simulated daily animal care routine activities following a
standard procedure for 7 min per room. Concentrations of PM10 (mg m–3) close to the nose and
mouth were measured each second and logged as one-minute means in the memory of the
device.

Chapter 3
60
Ammonia
Ammonia concentrations were measured semi-continuously by continuously sampling air
from each room and by sequentially measuring concentrations in each room for 5 min with a
NOx monitor (model ML8840, Monitor Labs, Englewood, Colo.). Aerial ammonia was first
converted to NO at 775 °C by separate converters for each room. Exhaust air was sampled inside
the shaft of the ventilator that was continuously running. The monitor was calibrated weekly
with a gas of 40 ppm NO in nitrogen (N2), and the flow rate was checked. Of each 5 min
sampling period per room, only the data of the last minute were used and hourly mean ammonia
concentrations were stored in a data logger.
Odor
Odor concentrations were measured on days 24 and 31 in both growth cycles. On these days,
air samples were taken from 10:00 to 12:00 in each room using the ‘lung principle’ (vessels with
40 L Nalophan air sampling bags connected to electrical pumps; Thomas Industries Inc.,
Wabasha, Minn., model 607CD32; critical capillary: 0.5 L min–1). The pump removed air from
the vessel which caused the sampling bag to be filled with air taken from the room. The air
samples were transported and stored according to EN 13725 (CEN, 2003) and odor
concentrations (OUE; European Odor Units) were determined by olfactometry within 30 h after
sampling.
Ventilation rate, temperature, and humidity
The ventilation rate in all three ventilation shafts was measured with calibrated anemometers
(ATM.56, Fancom, Panningen, the Netherlands) of the same diameter as the ventilation shafts.
Hourly means were stored in a data logger. Temperature and relative humidity (RH) outside and
in each room, near the ventilation shaft, were continuously measured with combined
temperature/humidity sensors (HygroClip, Rotronic AG, Bassersdorf, Switzerland). The
accuracy of these sensors was ±1.0 °C and ±2% RH. Hourly means were stored in a data logger.
Animal variables
All broilers were weighed on arrival at the broiler house (day 0) and before transport to the
processing plant (day 35) by group weighing of birds in transportation crates. Furthermore, a
sample of 100 broilers per room (50 males, 50 females) was weighed on days 21 (just before oil
spraying started) and day 34. The amount of feed delivered to each room was recorded daily by
the automatic feed weighing unit of the house and the amount of water was recorded by separate

Abatement of PM emission from experimental broiler housings using an optimized oil spraying method
61
water meters. Mortality numbers were recorded daily per room. Foot pad lesions and bird
exterior quality were scored in samples of 100 broilers per room (50 males, 50 females) on day
33 of both growth cycles. Foot pad lesions were scored according to the protocol described by
Berg (1998). Within this protocol, the foot‐pads of the broilers are scored in three classes: class 0
= lesions absent or minor, class 1 = medium lesions, and class 2 = severe lesions. The final foot‐
pad score is calculated as follows: 100 × [(number of birds in class 0 × 0) + (number of birds in
class 1 × 0.5) + (number of birds in class 2 × 2)] / total number of birds scored. Bird exterior
quality was scored on breast dirtiness, breast irritations, scabby hips (thigh scratches), and hock
burns in four classes (none, mild, medium, or severe) as described by Van Harn (2009).
Oil spraying
The amount of oil sprayed was measured daily by weighing the oil storage tank before and
after spraying on a platform weighing unit (type FB 64EDE571205413; maximum capacity 64
kg, 0.4 × 0.3 m platform, Sartorius, Nieuwegein, the Netherlands). The time needed to clean the
rooms was recorded at the end of both growth cycles.
Litter
On days 14, 28, and 35 of the growth cycle, litter samples were taken at six spots in each
room (approx. 0.5 kg per room). The dry matter (DM) content of these samples was determined
by weighing before and after oven-drying for 24 h at 105 °C. On the same days, the percentage
of the litter floor being either friable or covered with solid manure cakes was scored by visual
observation.
Data preparation and analysis
Calculation of emission rates
Emission rates of PM and ammonia were calculated using Eq. 1:
Q)C-C(Emission inletexhaust ×= (1)
where:
• Emission = emission rate (mg h–1 for PM10, PM2.5, and ammonia; OUE s–1 for odor);
• Cexhaust = exhaust air concentration (mg m–3 for PM10, PM2.5, and ammonia; OUE m–3 for
odor);

Chapter 3
62
• Cinlet = inlet air concentration (mg m–3 for PM10, PM2.5, and ammonia; OUE m–3 for odor);
• Q = ventilation rate (m3 h–1 for PM10, PM2.5, and ammonia; m3 s–1 for odor).
Estimation of airborne PM10 or PM2.5 oil particles
Based on the PM10 and PM2.5 concentration measurements during the time around oil
spraying on days 25 and 31 in the second growth cycle, the proportion of oil applied measured as
airborne particles in the PM10 and PM2.5 fraction was estimated using Eq. 2:
[ ]100
A
1TE)-1(-EPM
controlkk
oil ×r×××η
= (2)
where:
• PMoil = proportion of oil applied measured as airborne PM10 or PM2.5 oil particles (%);
• Ek = emission of PM10 or PM2.5 in treatment k during oil spraying (g h–1);
• ηk = relative reduction of PM10 or PM2.5 in treatment k (0 to 1, based on the PM
measurements outside spraying times);
• Econtrol = emission of PM10 or PM2.5 of control rooms during oil spraying (g h–1);
• T = sampling duration around oil spraying (h);
• ρ = density of rapeseed oil (0.91 g mL–1);
• A = application of oil (1069 mL room–1 at 8 mL m–2, 2138 mL room–1 at 16 mL m-2, and
4275 mL room–1 at 32 mL m–2).
In Eq. 2, the emission of PM from oil spraying rooms during spraying (Ek) is assumed to
consist of oil particles and regular PM from litter and feathers. The amount of regular PM in Ek
is estimated by (1 – ηk) × Econtrol, whereas the amount of oil particles in Ek is determined by
subtracting the amount of regular PM from Ek.
Statistical analysis
Reductions in emission rates of PM10 and PM2.5 relative to the mean of control rooms were
estimated and tested for significance with a longitudinal regression model which recognizes that
repeated measurements over time were done within rooms. The treatments were split up in the
model into effects of oil application rate (0, 8, or 16 mL m–2 d–1) and effects of spraying
frequency (daily or every other day). Interaction effects between oil application rate, spraying

Abatement of PM emission from experimental broiler housings using an optimized oil spraying method
63
frequency, growth cycle, and day in the growth cycle were not statistically significant and were
therefore omitted from the final model, which is described by Eq. 3:
ijklmnmnmlkjiijklmn a)Y(Log ε+ε+ε+θ+g×+β+a= (3)
where:
• log(Yijklmn) = response variable, i.e., the natural logarithm of the PM10 or PM2.5 emission rate
of oil application rate i and spraying frequency j, on relative moment k on day l of growth
cycle m inside room n;
• ai = effect of oil application rate i (0, 8, or 16 mL m–2 d–1);
• βj = effect of spraying frequency j (daily or every other day);
• a = regression coefficient;
• gk = moment of the measurement in relation to the last oil spraying k (on the same day or on
the day after);
• θl = effect of day l in the growth cycle (23, 30, and 33);
• )σ,0(N~ε 2mm = random growth cycle effect;
• )σ,0(N~ε 2mnmn = random room effect within growth cycles;
• ∑ )φ,τ;0(N~ε tljijklmn = random day effect correlated within rooms (autoregression), variance
different between weeks.
The model described in Eq. 3 was also used to test significant differences between treatments
and control for emission rates of ammonia and odor, with the only modification that treatments
were not split into separate effects of oil application rate and spraying frequency. Bird
performance data of days 0 to 21 (before oil spraying had started) and of days 0 to 35 were both
analyzed by analysis of variance (ANOVA), with mean values per treatment and growth cycle as
the experimental units, treatment as the explanatory factor, and growth cycle as block. Foot-pad
lesions and exterior quality parameters were analyzed using the IR Class test because frequencies
were not normally distributed over the categories. All analyses were done using the GenStat
software (VSN, 2012), and probability values <0.05 were considered statistically significant.

Chapter 3
64
RESULTS
Functioning of the oil spraying system
During this study, oil leakage from the nozzles was observed, and therefore we mounted a
small bucket underneath each nozzles. Per 8 nozzles, the system applied on average 0.38 mL m-2
per second of spraying time. In the second growth cycle, when the system had two additional oil
tubes along the side walls of each room, we visually observed that oil was distributed more
uniformly over the litter floor in comparison to the configuration in the first growth cycle.
Ventilation rate, temperature, and humidity
Mean ventilation rate, indoor and outside temperature, and relative humidity in the different
treatments and growth cycles are given as descriptive statistic in Table 2. Fig. 2 shows the
patterns of the ventilation rate per treatment and growth cycle. From the overlapping lines in this
figure, it is clear that ventilation rates were very similar between rooms. Ventilation rates
increased with the age of the broilers and after the second week, ventilation rate was higher
during the day than at night, resulting in a spiked and gradually increasing pattern. Mean
ventilation rate was 1.94 m3 h–1 bird–1 in the first and 1.67 m3 h–1 bird–1 in the second growth
cycle. Indoor temperature and relative humidity were similar between treatments (Table 2).
Table 2Mean ventilation rate, indoor and outside temperature, and relative humidity in the different treatments and growth cycles.
Variable Growth cycle
Outside Control rooms
(0 ml m–2)
8 mL m–2 d–1 16 mL m–2 d–1
8 mL m–2
(24 h)–116 mL m–2
(48 h)–116 mL m–2
(24 h)–132 mL m–2
(48 h)–1
Ventilation rate(m3 h–1 bird–1)
1 - 1.88 2.02 1.93 1.94 1.922 - 1.65 1.73 1.69 1.62 1.67
Temperature(°C)
1 16.6 25.7 25.7 25.9 26.5 25.72 16.1 25.2 24.9 25.1 25.2 25.0
Relative humidity(%)
1 75.6 59.4 59.4 57.7 58.4 59.32 83.4 64.2 64.3 63.9 65.9 64.0

Abatement of PM emission from experimental broiler housings using an optimized oil spraying method
65
Fig. 2Ventilation rates during the first (a) and second (b) growth cycle. Note that the treatment lines mostly overlap.
Particulate matter concentrations and emissions
Table 3 shows mean concentrations and emission rates of PM10 and PM2.5 per growth cycle
and treatment. The mean (standard deviation; SD) concentrations at the air inlet were 0.023
(0.015) mg m–3 for PM10 and 0.016 (0.007) mg m–3 for PM2.5. On day 16 of the growth cycle,
when oil spraying had not yet started, mean (SD) PM10 concentration was 0.739 (0.215) mg m–3
in the control rooms and 0.751 (0.150) mg m–3 in the oil treatment rooms and mean (SD) PM2.5
concentration was 0.050 (0.037) mg m–3 in the control rooms and 0.053 (0.049) mg m–3 in the oil
treatment rooms.
With regard to oil application rate (αi in Eq. 3; 0, 8, or 16 mL m–2 d–1), the statistical analysis
showed that, relative to the control treatment, PM10 emission was significantly reduced by
spraying oil at 8 or 16 mL m–2 d–1 (P = 0.006). The model-estimated reductions in PM10
Vent
ilatio
n R
ate
(m3
h-1bi
rd-1
)Ve
ntila
tion
Rat
e (m
3h-1
bird
-1)
0
1
2
3
4
5
6
0 7 14 21 28 35
(a)
0 ml/m2 (control, 1) 0 ml/m2 (control, 4) 8 ml/m2 per d (615 ml/m2 per 2d (8) 15 ml/m2 per d (7) 31 ml/m2 per 2d
0
1
2
3
4
5
6
0 7 14 21 28 35
Time (day number in growth cycle)
Time (day number in growth cycle)
(b)
Control, room 1 Control, room 4 8 mL m-2 (24 h)-1
16 mL m-2 (48 h)-1 16 mL m-2 (24 h)-1 32 mL m-2 (48 h)-1

Chapter 3
66
emission were 59% for 8 mL m–2 d–1 and 64% for 16 mL m–2 d–1, but no significant difference
was found between these two oil application rates. Relative to the control treatment, PM2.5
emission was significantly reduced by oil spraying at 8 or 16 mL m–2 d–1 (P < 0.001). The
model-estimated reductions in PM2.5 emission were 81% for 8 mL m–2 d–1 and 74% for 16 mL
m–2 d–1, but no significant difference was found between these two oil application rates.
With regard to spraying frequency (βj in Eq. 3; daily or every other day), the statistical
analysis showed that neither the PM10 emission nor the PM2.5 emission differed significantly
between the 'every other day' treatment and the ‘daily’ treatment.
With regard to the moment of the measurement in relation to the last oil spraying (a×γk in Eq.
3; on the same day or on the day after), the model-estimated PM10 emission on days after
spraying was 44% higher than on spraying days, which was borderline significant (P = 0.05). For
PM2.5 emission however, no significant difference was found between days after spraying and
spraying days.
Table 3Descriptive statistics (number of data points, mean, and standard deviation in parenthesis) of PM10 and PM2.5
concentrations and emission rates in the two growth cycles for days on which oil spraying had already started (days 23, 30, and 33).Variable Growth
cyclen Control
Rooms(0 ml m–2)
8 mL m–2 d–1 16 mL m–2 d–1
8 mL m–2
(24 h)–116 mL m–2
(48 h)–116 mL m–2
(24 h)–132 mL m–2
(48 h)–1
PM10 concentration(mg m–3)
1 3 1.746 (0.797) 1.013 (0.639) 0.847 (0.241) 0.786 (0.399) 0.948 (0.449)2 3 0.989 (0.248) 0.441 (0.070) 0.360 (0.086) 0.233 (0.033) 0.492 (0.320)
PM10 emission rate(mg h–1 bird–1)
1 3 5.982 (3.041) 3.427 (2.321) 2.871 (0.861) 2.666 (1.561) 3.314 (1.843)2 3 2.753 (0.737) 1.285 (0.317) 1.072 (0.495) 0.591 (0.121) 1.197 (0.349)
PM2.5 concentration(mg m–3)
1 3 0.094 (0.038) 0.042 (0.003) 0.049 (0.026) 0.029 (0.013) 0.040 (0.017)2 3 0.058 (0.010) 0.019 (0.010) 0.017 (0.009) 0.019 (0.007) 0.028 (0.012)
PM2.5 emission rate(mg h–1 bird–1)
1 3 0.248 (0.154) 0.070 (0.014) 0.082 (0.075) 0.033 (0.029) 0.066 (0.059)2 3 0.142 (0.050) 0.027 (0.024) 0.018 (0.016) 0.023 (0.013) 0.039 (0.024)
Fig. 3 shows the measured concentrations of PM10 and PM2.5 during the time around oil
spraying (days 25 and 31 in the second growth cycle). In comparison to the control treatment,
PM10 and PM2.5 concentrations were elevated in the 32 mL m–2 (48 h)–1 treatment on both
measuring days by a mean factor of 1.8 for PM10 and 4.1 for PM2.5. For the three rooms where 8
or 16 mL m–2 was applied, concentrations were similar to the control treatment, except for one
PM2.5 concentration value on day 25 in the 16 mL m–2 (24 h)–1 room. Based on Eq. 2, the mean
(standard error of the mean; SEM) percentage of oil applied sampled as airborne oil particles was
1.84% (0.26%) for the PM10 fraction and 0.34% (0.02%) for the PM2.5 fraction.

Abatement of PM emission from experimental broiler housings using an optimized oil spraying method
67
Fig. 3Concentrations of PM10 (a) and PM2.5 (b) around the time of oil spraying on day 25 (from 07:45 to 09:45) and day 31 (from 13:00 to 15:00) in the second growth cycle. Due to a technical problem, no values were obtained on day 25 in the 16 mL m–2 (48 h) –1 room.
Fig. 4PM10 exposure (concentration at human breathing height) for the oil treatments, relative to the mean of control rooms. Error bars represent standard errors of the mean.
The mean concentrations measured during personal PM10 sampling are presented in Fig. 4.
From this figure, it is clear that, relative to the control treatment, PM10 exposure was lower in all
oil spraying treatments. Two sets of data are shown in Fig. 4. The left set of bars shows results
from days when oil was sprayed in the ‘daily’ treatments only. The right set of bars shows results
from days when oil was sprayed in all (‘daily’ and ‘every other day’) treatments. In the left set of
bars, exposure tends to be more reduced in the ‘daily’ treatments where oil had been applied
0.0
0.2
0.4
0.6
0.8
1.0
Round 2,day 25
Round 2,day 31
0
1
2
3
4
5
Round 2,day 25
Round 2,day 31
PM10
Con
cent
ratio
n(m
g m
-3)
PM2.
5C
once
ntra
tion
(mg
m-3
)
16 mL m-2 (48 h)-1
32 mL m-2 (48 h)-1
(a) (b)
Control (0 mL m-2) 8 mL m-2 (24 h)-1
16 mL m-2 (24 h)-1
Day 25 Day 31 Day 25 Day 31
8 ml m-2 (24 h)-1 16 ml m-2 (48 h)-1
16 ml m-2 (24 h)-1 32 ml m-2 (48 h)-1
8 mL m-2 (24 h)-1
16 mL m-2 (24 h)-1
16 mL m-2 (48 h)-1
32 mL m-2 (48 h)-1
PM10
Expo
sure
(rel
ativ
e to
con
trol
)
0.0
0.2
0.4
0.6
0.8
1.0
Spraying: 2 of 4 treatmentsearlier that day (n = 3)
Spraying: all treatmentsearlier that day (n = 2)

Chapter 3
68
earlier that day. In the right set of bars, exposure tends to decrease with increasing oil application
rate. The mean reduction in PM10 exposure was 60% for the 8 mL m–2 (24 h)–1 treatment, 61%
for the 16 mL m–2 (48 h)–1 treatment, 80% for the 16 mL m–2 (24 h)–1 treatment, and 63% for the
32 mL m–2 (48 h)–1 treatment.
Ammonia emission
Fig. 5 shows the emission rate of ammonia throughout the first and second growth cycle.
Emission patterns clearly differed between the two growth cycle but were similar between
treatments, as seen by the treatment lines that mostly overlap each other. No significant
differences were found in ammonia emission between any of the treatments. Mean (SD between
treatments) ammonia emission rate was 6.45 (0.50) mg h–1 bird–1 in the first growth cycle and
3.44 (0.52) mg h–1 bird–1 in the second growth cycle.
Fig. 5Ammonia emission rates during the first (a) and second (b) growth cycle. Note that treatment lines mostly overlap.
NH
3Em
issi
on(g
h-1
)N
H3
Emis
sion
(g h
-1)
0 ml/m2 (control, 1) 0 ml/m2 (control, 4) 8 ml/m2 per d (615 ml/m2 per 2d (8) 15 ml/m2 per d (7) 31 ml/m2 per 2d
Time (day number in growth cycle)
Control, room 1 Control, room 4 8 mL m-2 (24 h)-1
16 mL m-2 (48 h)-1 16 mL m-2 (24 h)-1 32 mL m-2 (48 h)-1
0
10
20
30
40
50
60
70
0 7 14 21 28 35
Time (day number in growth cycle)
0
10
20
30
40
50
60
70
0 7 14 21 28 35
(a)
(b)

Abatement of PM emission from experimental broiler housings using an optimized oil spraying method
69
Odor emission
No significant differences were found in odor emission between any of the treatments. Mean
(SD between treatments) odor emission rate was 0.78 (0.18) OUE s–1 bird–1 in the first growth
cycle and 1.30 (0.13) OUE s–1 bird–1 in the second growth cycle.
Animal variables
In Table 4 mean values of the birds’ performance variables are presented. No significant
differences were found in the performance variables between any of the treatments; neither in the
data of days 0 to 21 (before oil spraying had started), nor in the data of days 21 to 35. We found
no significant differences between the treatments for foot‐pad score, breast dirtiness, breast
irritations, scabby hips (thigh scratches), and hock burns. Mean foot-pad score was 88 for the
control treatment, 82 for the 8 mL m–2 (24 h)–1 treatment, 85 for the 16 mL m–2 (48 h)–1
treatment, 101 for the 16 mL m–2 (24 h)–1 treatment, and 96 for the 32 mL m–2 (48 h)–1 treatment.
The overall percentage of broilers falling in the classes ‘none’ or ‘mild’ was 60% for breast
dirtiness, 96% for breast irritations, 93% for scabby hips, and 91% for hock burns.
Table 4Mean values of bird performance variables over the two growth cycles (0 to 35 days). LSD: least significant difference.
Variable ControlRooms
(0 ml m–2)
8 mL m–2 d–1 16 mL m–2 d–1 LSD8 mL m–2
(24 h)–116 mL m–2
(48 h)–116 mL m–2
(24 h)–132 mL m–2
(48 h)–1
Feed intake (g d–1 bird–1) 93.0 92.5 93.2 91.8 92.3 2.8Feed conversion (g feed g–1 growth) 1.633 1.632 1.650 1.629 1.633 0.028Water intake (mL d–1 bird–1) 161.4 160.3 161.7 159.9 161.6 5.3Water/feed (g water g–1 feed) 1.74 1.74 1.74 1.74 1.75 0.04Growth rate (g d–1 bird–1) 57.0 56.7 56.6 56.4 56.5 1.6Weight at day 35 (g) 2037 2026 2022 2016 2021 55Mortality (%) 2.8 2.6 2.8 2.8 2.8 0.7
Litter
The dry matter (DM) content of the litter was similar between treatments. Mean (SEM) DM
content of the litter was 62% (3%) for the control treatment, 66% (3%) for the 8 mL m–2 (24 h)–1
treatment, 63% (4%) 16 mL m–2 (48 h)–1 treatment, 62% (3%) for the 16 mL m–2 (24 h)–1
treatment, and 63% (3%) for the 32 mL m–2 (48 h)–1 treatment. Between growth cycles, there
were differences, with the litter being damper in the second growth cycle (range in room means:

Chapter 3
70
64% to 69%) than in the first (range in room means: 57% to 63%). On day 14 of the second
growth cycle, mean DM content of the litter inside the rooms was 70%, which decreased in the
second half of the cycle to mean levels of 52% on day 28 and 58% on day 35. It was observed
that during the second half of the second growth cycle approximately 20% of the litter area in the
rooms was friable but on 75% moist manure cakes were present. During the second half of the
first growth cycle, cakes were present on approximately 45% of the litter area in the rooms.
Cleaning of the rooms
After removal of the litter by a front loader, application of the soaking agent took
approximately 9 min, followed by 30 min of soaking time for all rooms. Pressure cleaning then
took approximately 45 min for control rooms and 60 min for oil treatment rooms. The extra time
for the oil treatment rooms was mainly needed for cleaning of the three ventilator shafts in each
room.
DISCUSSION
In the present study, we found a reduction in PM10 emission of 59% at an application rate of 8
mL m–2 d–1 and a reduction of 64% at an application rate of 16 mL m–2 d–1. Aarnink et al. (2011)
found a relationship between these two parameters described by the equation y = –0.021x + 0.64
(R2 = 0.69), where y is the PM10 emission relative to the control treatment (0 to 1) and x the oil
application rate (mL m–2 d–1). The reductions found in the present study agree reasonably well
with the values that can be calculated by fitting the oil application rates in the aforementioned
equation, namely 53% for 8 mL m–2 d–1 and 70% for 16 mL m–2 d–1. Aarnink et al. (2011) found
no relationship between oil application rate and PM2.5 reduction: at 6 mL m–2 d–1 PM2.5 emission
was already reduced by 84% and this level did not increase further at higher application rates. In
the present study, PM2.5 emission was reduced by 81% at 8 mL m–2 d–1 and 74% at 16 mL m–2 d–
1. The data from the present study confirm that, at the same oil application rate, PM2.5 emission is
more reduced than PM10 emission, and that increasing the application rate from 8 to 16 mL m–2
d–1 does not increase the PM2.5 reduction any further. Earlier, we hypothesized that some of the
oil particles in the PM2.5 fraction might still be present in the air during PM sampling, cancelling
out any extra PM2.5 reduction. This phenomenon could still play a role in the present study.
In the present study, emissions of PM10 or PM2.5 did not differ significantly between the two
spraying frequencies (daily or every other day). On days after spraying however, PM10 emission

Abatement of PM emission from experimental broiler housings using an optimized oil spraying method
71
was 44% higher (P = 0.05) than on spraying days. This suggests that the PM reduction is
partially abolished on the second day after spraying. No significant difference was found for
PM2.5 emission between spraying days and days after spraying. An actual increase in PM2.5
emission on the day after spraying however, might have been masked by elevated PM2.5 oil
particle concentrations the day before.
Our findings on effects of oil spraying rate and spraying frequency can be compared with
three available studies. In experimental pens housing broilers, Griffin and Vardaman (1970)
applied 338 or 565 mL of cotton seed oil per m2 of litter floor area weekly (equivalent to 48 and
81 mL m–2 d–1 respectively) starting after the third week of the growth cycle. In that study, PM
concentration within a 7-day spraying cycle increased with time after application: it
approximately doubled from day one to day five. In our previous study, we hypothesized that the
oil forms a film on top of the litter floor that prevents particles in the litter from becoming
airborne. If this truly is the main working principle, the agitation and mixing of the top layer of
the litter by the broilers, and the ongoing deposition of fresh droppings on top of each oil film
applied, may explain the diminishing PM reduction between oil applications. In a study by Drost
et al. (1999) carried out in a broiler house, daily oil spraying using a fogging system that
generated droplets with diameters smaller than 10 µm, reduced concentrations of respirable PM
by only 12%. The authors noted that the small droplets probably not settled out to the litter floor.
These findings also point towards a working principle based on an oil film onto the litter floor
rather than for instance a washout of particles from the air. Next to the litter (i.e., manure and
wood shavings), the feathers of the broilers contribute significantly to PM10 and PM2.5 mass
concentration in broiler houses (Cambra-López et al., 2011). Since the oil droplets from the oil
spraying system settled to both the litter surface and the broilers, it is likely that the oil film acted
as a binding agent on the aerosolization of feather particles as well: in the end of the growth
cycle, the feathering of the broilers in the oil treatment rooms had a slight yellowish taint
whereas the feathers of the broilers in the control room were white. In a third study in broilers,
McGovern et al. (1999) sprayed rapeseed oil onto the litter biweekly (0.8 L m–2 over a 42-day
growth cycle, equivalent to 19 mL m–2 d–1) and reported that the reduction in particle number
concentration increased from no reduction in the first week, to 9% in the third week, 15% in the
fourth week, and 40% in the fifth week. These results suggest that when large amounts of oil are
sprayed at a time at low spraying frequencies, it may take considerable time for the oil to become
fully effective. In the present study, we found no indications for a build-up of PM reduction in
time during the second half of the growth cycle.

Chapter 3
72
In the present study, PM concentrations in the control treatment ranged between 0.439 and 2.607
mg m–3 for PM10 and between 0.025 and 0.105 mg m–3 for PM2.5. It is clear that these levels are
in excess of the exposure limits of 2.4 mg m–3 for inhalable PM (~PM100) and 0.16 mg m–3 for
respirable PM (~PM4) recommended for pig and poultry workers (Donham and Cumro, 1999),
even though size fractions are not identical. Since rooms were ventilated identically, the reported
reductions in PM emission in this study are attributable to reductions in PM concentrations. It is
noteworthy that similar or slightly higher reduction levels (60% to 80%) were found by PM10
measurements at human breathing height during simulation of daily animal care routine
activities, when broilers are stimulated to move and disperse particles into the air. These
reductions are consistent with the levels found in our previous study (approximately 67% at 8
mL m–2 d–1 and 76% at 16 mL m–2 d–1). This aspect can be regarded as an important advantage
of oil spraying in comparison to ‘end of pipe’ abatement systems.
In line with Aarnink et al. (2011), we found no effect of oil spraying on emission rate of
ammonia. Patterns in ammonia emission rate were similar between treatments, but clear
differences were present between the two growth cycles. In the first growth cycle, ammonia
emission rate increased during the first three weeks, then stabilized at a high level in the fourth
week, and finally increased again in the last week. In the second growth cycle, an increase during
the first three weeks was followed by a decline in emission rate. Probably, the higher water
content of the litter and the formation of solid manure cakes during the second half of the second
growth cycle were unfavourable conditions for ammonia production and volatilization (Chepete
et al., 2012; Liu et al., 2007). Oil spraying had no effect on the DM content of the litter, which
agrees with the findings of Griffin and Vardaman (1970). In the present study, we investigated
for the first time the effects of oil spraying on odor emission and found that odor emission rate
did not differ significantly between treatments. Apparently, the oil film is effective in
aggregating particles in the litter for a certain amount of time, but the production and release of
gaseous ammonia and odorous compounds from the litter remain unaffected. It must be noted
however, that the air samples for odor analysis were filtered during sampling. Therefore, any
reduction of odorous compounds adsorbed to particles, may have been missed.
An important side-effect noted by Aarnink et al. (2011) was a significantly higher mean foot-
pad score of the broilers in the 24 mL m–2 d–1 treatment in comparison to the control treatment.
In the present study, we tried to prevent this by starting with oil spraying only from day 21 of the
growth cycle, by limiting the oil application rate to 16 mL m–2 d–1, and by spraying the oil more
uniformly over the litter area in the second growth cycle. Using this approach, we did not find an
effect of oil spraying on the foot-pad score of the broilers. In the present study, as well as in the

Abatement of PM emission from experimental broiler housings using an optimized oil spraying method
73
previous study, we found no effect of oil spraying on bird performance parameters (feed intake,
feed conversion, water intake, water to feed ratio, growth rate, end weight, and mortality).
Earlier, McGovern et al. (2000) reported a significantly lower end weight of broilers housed on
straw that was treated biweekly with rapeseed oil (1.1 L m–2 over 6 wk, equivalent to 26 mL m–2
d–1), explained by the authors by a higher body heat loss caused by oil contamination of the
feathers or due to consumption of oiled straw. In agreement with these possible explanations,
Griffin and Vardaman (1970) observed that broilers scratched more in litter that had just been
sprayed and that their feathers became oily from contact with the litter. In contrast to McGovern
et al. (2000) however, we used a lower oil application rate and no oil was sprayed during the first
three weeks of the growth cycle. Furthermore, neither negative nor positive effects on broiler
performance were found by Griffin and Vardaman (1970) at 338 or 565 mL m–2 wk–1, starting at
three weeks of age, and by McGovern et al. (1999) at 800 mL m–2 over 6 wk.
In the present study, we experienced oil leakage from the nozzles of the oil spraying system,
which has been previously identified as well (Aarnink et al., 2011). A possible cause for this
could be that the timer-controlled valves did not shut immediately and completely after spraying
due to pollution. To rule this out, we disassembled and cleaned the valves prior to both growth
cycles and we filtered the rapeseed oil during each filling of the oil tank. This did, however, not
solve the oil leakage. The following options could solve this problem and improve the system in
general:
• The oil tank, main oil tube, and branched oil tubes could be placed below the level of the
nozzles in the room to take away the oil pressure resulting from gravity; the oil tank in this
study was positioned in a room in the attic of the building, higher than the nozzles.
• The oil and air pressure could be shut off completely in between spraying moments; in the
current system, oil and air pressure were maintained on the main tubes (up to the timer-
controlled valves) in between spraying moments.
• A timer-controlled valve could be used directly upstream of each nozzle, so that very little
oil would remain in the piece of tube between the valve and the nozzle available for oil
leakage.
• The air pressure could be applied shortly before opening the oil valves up to some time after
shutting of the oil valves, to fog any leaking drops or trickles into the air, and to clean the
nozzles after each spraying moment.
To reduce the generation of small oil particles, we brought the oil and air pressure down in the
second growth cycle from 3.5 to 3.0 bar, which reduced the spray velocity from 8.4 to 7.2 m s–1
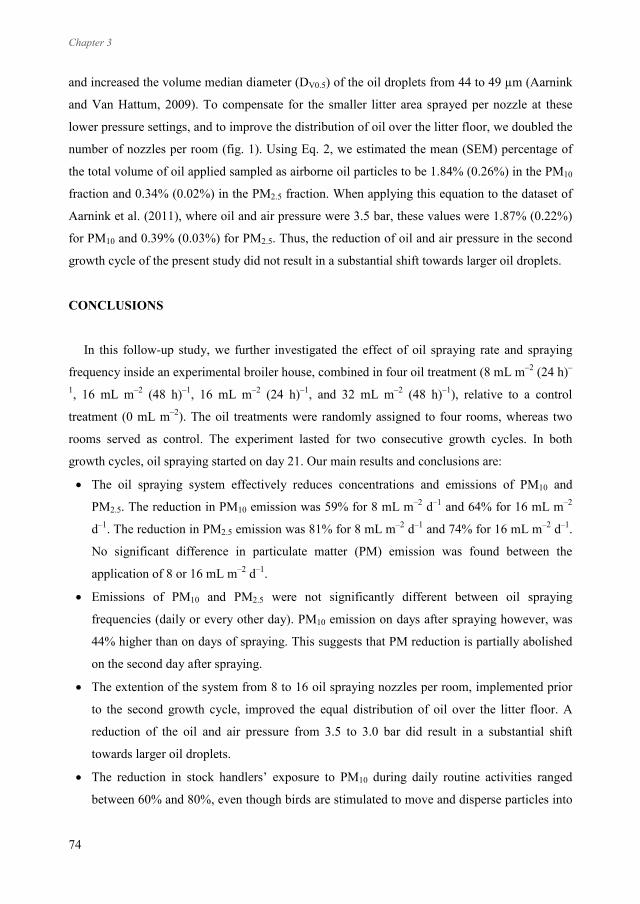
Chapter 3
74
and increased the volume median diameter (DV0.5) of the oil droplets from 44 to 49 µm (Aarnink
and Van Hattum, 2009). To compensate for the smaller litter area sprayed per nozzle at these
lower pressure settings, and to improve the distribution of oil over the litter floor, we doubled the
number of nozzles per room (fig. 1). Using Eq. 2, we estimated the mean (SEM) percentage of
the total volume of oil applied sampled as airborne oil particles to be 1.84% (0.26%) in the PM10
fraction and 0.34% (0.02%) in the PM2.5 fraction. When applying this equation to the dataset of
Aarnink et al. (2011), where oil and air pressure were 3.5 bar, these values were 1.87% (0.22%)
for PM10 and 0.39% (0.03%) for PM2.5. Thus, the reduction of oil and air pressure in the second
growth cycle of the present study did not result in a substantial shift towards larger oil droplets.
CONCLUSIONS
In this follow-up study, we further investigated the effect of oil spraying rate and spraying
frequency inside an experimental broiler house, combined in four oil treatment (8 mL m–2 (24 h)–
1, 16 mL m–2 (48 h)–1, 16 mL m–2 (24 h)–1, and 32 mL m–2 (48 h)–1), relative to a control
treatment (0 mL m–2). The oil treatments were randomly assigned to four rooms, whereas two
rooms served as control. The experiment lasted for two consecutive growth cycles. In both
growth cycles, oil spraying started on day 21. Our main results and conclusions are:
• The oil spraying system effectively reduces concentrations and emissions of PM10 and
PM2.5. The reduction in PM10 emission was 59% for 8 mL m–2 d–1 and 64% for 16 mL m–2
d–1. The reduction in PM2.5 emission was 81% for 8 mL m–2 d–1 and 74% for 16 mL m–2 d–1.
No significant difference in particulate matter (PM) emission was found between the
application of 8 or 16 mL m–2 d–1.
• Emissions of PM10 and PM2.5 were not significantly different between oil spraying
frequencies (daily or every other day). PM10 emission on days after spraying however, was
44% higher than on days of spraying. This suggests that PM reduction is partially abolished
on the second day after spraying.
• The extention of the system from 8 to 16 oil spraying nozzles per room, implemented prior
to the second growth cycle, improved the equal distribution of oil over the litter floor. A
reduction of the oil and air pressure from 3.5 to 3.0 bar did result in a substantial shift
towards larger oil droplets.
• The reduction in stock handlers’ exposure to PM10 during daily routine activities ranged
between 60% and 80%, even though birds are stimulated to move and disperse particles into

Abatement of PM emission from experimental broiler housings using an optimized oil spraying method
75
the air. Thus, oil spraying can contribute to the protection of workers inside broiler houses
against hazardous PM levels.
• Our results show that the oil treatment tested do not affect ammonia emission, odor
emission, bird performance, birds’ exterior quality, and litter dry matter content.
• This study confirms that the application of a maximum oil application rate of 16 mL m–2 d–1,
starting from day 21 of the growth cycle, incidence of foot-pad lesions is not significantly
increased.
• It is recommended to validate the effect of oil spraying inside full-scale commercial broiler
houses at a daily application of 16 mL m–2 or less starting from day 21 of the growth cycle.
ACKNOWLEDGMENTS
This study was financed by the Dutch Ministry of Economic Affairs and the Dutch Ministry
of Infrastructure and the Environment. We thank the staff of the Spelderholt experimental station
for taking care of the animals, Mr. Theo van Hattum for maintenance of the oil spraying system,
Mr. Eef Lovink for maintenance and calibration of measuring equipment, Mr. Jean Slangen for
carrying out the lab analyses, and Mr. Johan van Riel for advice on the statistical analysis.
REFERENCES
Aarnink, A.J.A., Van Hattum, T.G., 2009. Measures to reduce fine dust emission from poultry houses; Laboratorystudy: characterizing oil spraying nozzles (droplet size and velocity) [in Dutch, with English summary]. Report 229. Animal Sciences Group, Wageningen University and Research Centre, Lelystad, the Netherlands.
Aarnink, A.J.A., Van Harn, J., Van Hattum, T.G., Zhao, Y., Ogink, N.W.M., 2011. Dust reduction in broiler houses by spraying rapeseed oil. Trans. ASABE 54:1479–1489.
Al Homidan, A., Robertson, J.F., Petchey, A.M., 2003. Review of the effect of ammonia and dust concentrations on broiler performance. World's Poultry Sc. J. 59:340–349.
Berg, C., 1998. Footpad dermatitis in broilers and turkeys: Prevalence, risk factors, and prevention. PhD diss. Swedish University of Agricultural Science, Uppsala, Sweden.
Brunekreef, B., Holgate, S.T., 2002. Air pollution and health. Lancet 360:1233–1242.Cambra-López, M., Hermosilla, T., Lai, H.T.L., Aarnink, A.J.A., Ogink, N.W.M., 2011. Particulate matter emitted
from poultry and pig houses: Source identification and quantification. Trans. ASABE 54:629–642.CEN, 1998. EN 12341:1998. Air quality - Determination of the PM 10 fraction of suspended particulate matter -
Reference method and field test procedure to demonstrate reference equivalence of measurement methods. European Committee for Standardization (CEN), Brussels, Belgium.
CEN, 2003. EN 13725:2003. Air quality - Determination of odour concentration by dynamic olfactometry. European Committee for Standardization (CEN), Brussels, Belgium.
CEN, 2005. EN 14907:2005. Ambient air quality - Standard gravimetric measurement method for the determination of the PM2.5 mass fraction of suspended particulate matter. European Committee for Standardization (CEN), Brussels, Belgium.
Chepete, H.J., Xin, H., Li., H., 2012. Effect of partially covering the turkey litter surface on ammonia emission. J. Appl. Poult. Res. 21:513–521.

Chapter 3
76
Donham, K., Cumro, D., 1999. Setting maximum dust exposure levels for people and animals in livestock facilities. In International Symposium on Dust Control in Animal Production Facilities, pp. 93-110. Danish Institute of Agricultural Sciences, Aarhus, Denmark.
Drost, H., Beens, N., Dolehghs, B., Ellen, H., Oude Vrielink, H.H.E., 1999. Is fogging water or oil effective in reducing dust concentrations in poultry houses? In International Symposium on Dust Control in Animal Production Facilities, pp. 231-236. Danish Institute of Agricultural Sciences, Aarhus, Denmark.
EU, 2008. Directive 2008/50/EC of the European Parliament and of the Council of 21 May 2008 on ambient air quality and cleaner air for Europe. Offic. J. Europ. Union L152:1–44.
Griffin, J.G., Vardaman, T.H., 1970. Cottonseed oil spray for broiler houses: effects on dust control, Mycoplasma gallisepticum spread and broiler performances. Poult. Sci. 49:1664–1668.
Liu, Z., Wang, L., Beasley, D., Oviedo, E., 2007. Effect of moisture content on ammonia emissions from broiler litter: A laboratory study. J. Atmos. Chem. 58:41–53.
Madelin, T.M., Wathes, C.M., 1989. Air hygiene in a broiler house: comparison of deep litter with raised netting floors. Brit. Poult. Sci. 30:23–37.
McGovern, R.H., Feddes, J.J.R., Robinson, F.E., Hanson, J.A., 1999. Growth performance, carcass characteristics, and the incidence of ascites in broilers in response to feed restriction and litter oiling. Poult. Sci. 78:522–528.
McGovern, R.H., Feddes, J.J.R., Robinson, F.E., Hanson, J.A., 2000. Growth, carcass characteristics, and incidence of ascites in broilers exposed to environmental fluctuations and oiled litter. Poult. Sci. 79:324–330.
Ogink, N.W.M., Aarnink, A.J.A., 2011. Plan van aanpak bedrijfsoplossingen voor fijnstofreductie in de pluimveehouderij [Plan of action for particulate matter mitigation solutions in poultry; in Dutch, with English summary]. Report 113, Animal Sciences Group, Wageningen University and Research Centre, Lelystad, the Netherlands.
Omland, Ø., 2002. Exposure and respiratory health in farming in temperate zones - A review of the literature. Ann. Agric. Environ. Med. 9:119–136.
Radon, K., Danuser, B., Iversen, M., Jörres, R., Monso, E., Opravil, U., Weber, C., Donham, K.J., Nowak, D., 2001. Respiratory symptoms in European animal farmers. Eur. Respir. J. 17:747–754.
RIVM, 2014. Annual national emissions of PM10; in total and per sector/source, for 2012. Retrieved 11 February 2014, from http://www.emissieregistratie.nl. National Institute for Public Health and the Environment (RIVM),Bilthoven, the Netherlands.
Takai, H., 2007. Factors influencing dust reduction efficiency of spraying of oilwater mixtures in pig buildings. In DustConf 2007 - How to improve air quality. Maastricht, the Netherlands.
Van Harn, J., 2009. Comparison of four light schedules according to EU Directive 2007/43 for broilers [in Dutch, with English summary]. Report 172, Animal Sciences Group, Wageningen University and Research Centre,Lelystad, the Netherlands.
VSN, 2012. GenStat reference manual (release 15). Ver. 15.2.0.8821. VSN Int., Ltd, Hemel Hempstead, UK.Winkel, A., Mosquera, J., Groot-Koerkamp, P.W.G., Ogink, N.W.M., Aarnink, A.J.A., 2015. Emissions of
particulate matter from animal houses in the Netherlands. Atmos. Environ.111:202–212.Zhao, Y., Aarnink, A.J.A., Hofschreuder, P., Groot Koerkamp, P.W.G., 2009. Evaluation of an impaction and a
cyclone pre-separator for sampling high PM10 and PM2.5 concentrations in livestock houses. J. Aerosol Sci.40:868–878.

Chapter 4Abatement of particulate matter emission from experimental aviary
housings for laying hens by spraying rapeseed oil
A. Winkel a, J.W. van Riel a, R.A. van Emous a, A..J.A. Aarnink a , P.W.G. Groot Koerkamp a,b,
and N.W.M. Ogink a
a Wageningen UR Livestock Research, Wageningen, the Netherlandsb Farm Technology Group, Wageningen University, Wageningen, the Netherlands
Poultry Science (2016), in press
Available online at: http://dx.doi.org/10.3382/ps/pew261

Chapter 4
78
ABSTRACT
In alternative systems for laying hens, concentrations and emission rates of particulate matter
(PM) give reason for concern with regard to working conditions, bird health and productivity,
and health of residents living near farms. Previously, we found that spraying a film of rapeseed
oil onto the litter of broilers could substantially reduce PM concentrations and emissions. The
objective of this study was to establish dose-response effects of oil spraying in aviaries on
concentrations and emission rates of PM with aerodynamic diameters less than 10 µm (PM10)
and 2.5 µm (PM2.5), on stockmen’s exposure to PM10, on egg production, exterior quality and
behavior of the hens, and on the litter. An experiment was carried out with 4 treatments: 0
(control), 15, 30, and 45 mL/m2 per day (oil treatments). Each treatment was applied in 2 rooms
with different aviary systems (8 rooms in total). The experiment was repeated during a second
period, both lasting 35 d. From day 11 to day 35, oil was applied daily using a spraying gun.
Applying 15, 30, or 45 mL/m2 per day significantly reduced emission rates of PM10 by 27, 62,
and 82%, and emission rates of PM2.5 by 71, 83, and 94% respectively. No significant effects of
oil spraying were found on mortality, egg production, dust bathing behavior, scratching
behavior, plumage soiling, DM content of the litter, or friability of the litter. A significant
worsening of the plumage condition was only found for the body spot back/wings/tail (not for:
throat/neck, chest/breast, or legs) in the 45 mL/m2 per day treatment. Egg quality shifted
significantly towards more second class eggs in the oil treatments (1.9% versus 1.4%; P =
0.004). Remarkably, foot soiling decreased with increasing oil application. In conclusion, PM
concentrations and emission rates in aviaries can be effectively reduced by spraying 15 to 30
mL/m2 per day with minor side effects within a 25 day application period.

Abatement of PM emission from experimental aviary housings by spraying rapeseed oil
79
INTRODUCTION
Due to the European Union (EU)-wide ban on conventional cages for laying hens (EU
Directive 1999/74/EC), the use of alternative housing systems (i.e., floor systems and aviary
systems) has increased in many European countries. In the Netherlands, the ratio of eggs
produced in cage systems versus alternative systems shifted from 77% versus 23% in 2000 to
18% versus 82% in 2012 (PPE-PVV, 2012). To meet the needs of laying hens, the directive
states that alternative systems must have nests, perches, and at least 250 cm2 of littered area per
hen, the litter occupying at least one third of the ground surface. It is difficult however, to
adequately balance these welfare needs with healthy working conditions and a low
environmental impact. In practice, the litter is usually composed of the birds’ droppings (manure
and uric acid), feathers, and bedding material spread onto the floor (Cambra-López et al., 2011).
These materials deteriorate into tiny particles and become airborne through drying (i.e., by heat
production by the birds and ventilation) and the mechanical nature of bird activity, such as
scratching, dust bathing, wing-flapping, and so on (Calvet et al., 2009). Consequently,
concentrations of particulate matter (PM) with aerodynamic diameters of 4 µm and smaller
(PM4) in alternative systems are on average a factor 7 (range: 1.7 to 14) higher than in cage
systems (Takai et al., 1998). Furthermore, 24-h averaged PM concentrations in alternative
housing systems (i.e., ranges: 1198 to 10,951 µg/m3 for PM10 and 41 to 866 µg/m3 for PM2.5;
Winkel et al., 2015) are the highest of all housing systems in livestock production. They exceed
recommended health limits for workers and birds (e.g., 160 µg/m3 for PM4 and 2,400 µg/m3 for
PM100; Donham and Cumro, 1999) and are hundred folds of the levels usually found in ambient
air (i.e., <50 µg/m3 for PM10). Unlike non-organic particles from many other environments,
poultry PM has a high content of endotoxin (a pro-inflammatory bacterial compound from the
outer membrane of Gram negative bacteria) and contains micro-organisms, odorous compounds,
and gaseous ammonia (Seedorf et al., 1998; Takai, 2002; Yang et al., 2014). Occupational
exposure to PM puts poultry farmers at risk of respiratory problems, such as organic dust toxic
syndrome (ODTS), chronic obstructive pulmonary disease (COPD), asthma, and increased lung
function decline (Omland, 2002; Radon et al., 2001; Viegas et al., 2013). In chickens, the
chronic inhalation of PM may cause lesions throughout their respiratory system, promote the
invasion and pathogenic effects of micro-organisms, reduce growth, and increase mortality (Al
Homidan et al., 2003; Guarino et al., 1999). Finally, neighboring residents of poultry farms may
be exposed to elevated ambient PM concentrations that spread out from ventilation exhausts
(Heederik et al., 2011; Li et al., 2012). In the Netherlands, the poultry industry has been

Chapter 4
80
recognized as a major contributor (13%) to the national emission of primary PM10 (RIVM,
2011).
To develop effective and economically feasible PM abatement solutions for the poultry
industry, a research programme was set up at our institute (Ogink and Aarnink, 2011). One of the
solutions investigated in this programme was spraying a very thin film of pure rapeseed oil
droplets onto the litter, which prevents particles in the litter from becoming airborne, thereby
reducing both indoor concentrations (i.e., exposure of workers and birds) and emissions. In the
past, this approach has successfully been used in pig housings (Takai, 2007; and references
therin). We first developed and studied a spraying method in experimental broiler housings
(Aarnink et al., 2011; Winkel et al., 2014). These studies showed that PM10 decreased with
increasing oil application rate (from 48% at 6 mL/m2 per day to 87% at 24 mL/m2 per d), but
also that no more than 16 mL/m per day should be applied to avoid increased numbers of foot-
pad lesions. In laying hens, higher application rates may be needed because hens behave more
actively and the litter is usually friable and dry. Some work has been done on spraying 1 to 10%
rapeseed oil in water mixtures, but these were sprayed in cage houses (Ikeguchi, 2002) or above
slatted areas of aviary and floor housings to avoid wet litter (Gustafsson and Von Wachenfelt,
2006; Von Wachenfelt, 1999). To our knowledge, no work has been done on spraying pure
rapeseed oil onto the litter of alternative systems in relation to PM levels, the birds, their egg
production, and litter quality. Such information is needed to adequately develop oil spraying
systems for alternative laying hen houses, and especially for aviary houses, since the majority of
poultry farmers in Europe choose aviaries over floor housing when switching from cages to an
alternative system. Therefore, the objective of the current work was to experimentally determine
dose-response effects of the application of pure rapeseed oil onto the litter floor of aviary
housings on concentrations and emission rates of PM, on the exposure of birds and stockmen to
PM, on the birds, their egg production, and litter quality.
MATERIALS AND METHODS
This experiment was approved by the Animal Experiments Committee of Wageningen UR.
General design of the experiment
The effects of spraying rapeseed oil were investigated in 4 application rates: 0 (control
treatment), 15, 30, and 45 mL/m2 per day (oil treatments). Effects of the oil treatments, relative

Abatement of PM emission from experimental aviary housings by spraying rapeseed oil
81
to the control treatment, were determined on concentrations and emissions of PM (PM10 and
PM2.5), on stockmen’s exposure to PM10, on the bird’s egg production, mortality, scratching
behavior, dust bathing behavior, plumage condition, plumage soiling, and foot soiling, and on
the dry matter content and friability (cake formation) of the litter (Table 1).
Table 1Summary of measured variables.Variable Measurement Method Unit Days 4
Particulate matter concentration and emission
Oil use Weighing g 1 DailyPM10 and PM2.5 Cyclone sampler mg/m3 20, 27, 34CO2 (ventilation rate) 1 Air sampling, Gas
Chromatographppm 20, 27, 34
Personal PM10 exposure DustTrak Aerosol Monitor mg/m3 19, 25, 31 (EP 1)19, 25, 33 (EP 2)
Bird performanceBody weight 2 Manual weighing g Once per EPMortality Visual inspection,
counting% Daily
Egg production 2 Counting Eggs/room per d DailyEgg quality 3 Visual inspection,
countingFirst class, second class, third class, or mislaid
Daily
Bird behaviorDust bathing Visual observation,
counting% of birds 7, 19, 29 (EP 1)
7, 19, 33 (EP 2)Scratching Visual observation,
counting% of birds 7, 19, 29 (EP 1)
7, 19, 33 (EP 2)Bird exterior quality
Plumage condition Visual inspection, scoring 6-point scale (intact, ruffled, damaged, severely damaged, partly naked, naked
7, 19, 29 (EP 1)7, 19, 33 (EP 2)
Plumage soiling Visual inspection, scoring 4-point scale (clean, slightly dirty, dirty, very dirty)
7, 19, 29 (EP 1)7, 19, 33 (EP 2)
Foot soiling Visual inspection, scoring 4-point scale (clean, slightly dirty, dirty, very dirty)
7, 19, 29 (EP 1)7, 19, 33 (EP 2)
LitterDM content Oven-drying, weighing g/kg 1, 11, 21, 35Litter friability Visual inspection, scoring % of floor area with
formation of cakes or clumps7, 19, 29 (EP 1)7, 19, 33 (EP 2)
1 Recalculated to mL using a density of 0.93 g/mL.2 Input variable for the CO2 balance method.3 Mislaid eggs: floor eggs and system eggs.4 EP: experimental period. Numbers refer to measurement days in the EP, otherwise: measurement interval.
The experiment was carried out in 8 climate-separated rooms. Each of the 4 treatment was
applied in 2 rooms with different aviary systems (aviaries A and B) at the same time. The
experiment was fully repeated: the first experimental period (EP) of 35 days took place in spring,

Chapter 4
82
a second EP of 35 days took place in summer. From day 11 to day 35 of each EP, rapeseed oil
was applied onto the litter daily using a manually operated spraying gun. Treatments were
randomly allocated to the rooms prior to EP 1. This was repeated prior to EP 2 with the
exception that a treatment was not allocated to the same room twice, to avoid confounding
between treatments and rooms. To avoid interference between the EPs, ‘standard litter’ was
made and spread inside the rooms prior to both EPs.
Housing and animals
The experiment was carried out at poultry research centre ‘Het Spelderholt’ in Lelystad, the
Netherlands. The experimental house originally had 4 main rooms which each consisted of 2 sub
rooms separated by chicken wire. Sub rooms within a main room had independently functioning
aviary systems, egg collection systems, feed and water systems, lighting systems, etcetera; but
identical ventilation controlled by 1 climate computer. The chicken wire fences were closed by
sheets of plastic so that 8 climate-separated rooms (sub rooms are further called: ‘rooms’) were
created. Rooms measured 10 × 5.3 × 4.5 × 6.5 m (length × width × side wall height × ridge
height). Four rooms were equipped with a Natura Nova aviary (Big Dutchman Int. GmbH,
Vechta, Germany; referred to as system A). The other 4 rooms were equipped with a BLA aviary
(Meller Anlagenbou GmbH, Melle, Germany; referred to as system B). Details of the aviary
systems are shown in Fig. 1. The ground surface covered with litter was 41.7 m2 for aviary A and
38.8 m2 for aviary B. Each room was lit by 6 roof skylights with adjustable lamellae, 6 high-
frequency fluorescent tubes on the ceiling, and 3 LED light tubes under the aviary (Fig. 1).
Lights were on from 06:00 to 21:00 (15L:9D). Fresh air entered the rooms through the manure
belt aeration systems (Fig. 1; fixed at 1 m3/h per bird) and through 6 side wall inlets. Polluted air
was exhausted from the rooms by natural ventilation through adjustable ridge valves. The inlet
and ridge valves were controlled through a climate computer (1 for each main room; type FSU.4;
Fancom BV, Panningen, the Netherlands; room target temperature: 18 °C; connected to
temperature sensors in the room). In each room, either 620 hens (aviary A) or 604 hens (aviary
B) were placed (15 hens per m2 floor area; Breed: Lohmann Brown Lite; Age: 18 weeks;
hatchery and rearing: Het Anker BV, Ochten, the Netherlands). At the start of the first and
second EP, hens were 23 weeks and 36 weeks old, respectively. Hens were fed a commercial
mash diet (Layer 1, Superreeks; ForFarmers, Lochem, the Netherlands; crude protein content:
165 g/kg; energy content: 2775 kcal/kg) which was provided in 7 portions per day between 07:00
and 19:00. Water was provided during the light period only.

Abatement of PM emission from experimental aviary housings by spraying rapeseed oil
83
Fig. 1
Cross-sectional schematic of aviary systems A (Natura Nova, Big Dutchman Int. GmbH, Vechta, Germany) and B
(BLA, Meller Anlagenbou GmbH, Melle, Germany).
Production of standard litter
During the 5 weeks prior to the EPs, the manure belts under the tiers in the aviary frame were
run weekly and the collected manure was spread onto the floor of a drying room. Hot air
blowers, box ventilators, and the mechanical ventilation system in this room were used to further
dry the pre-dried manure to 70 to 80% of DM. The manure was mixed daily to enhance the
drying process and to homogenize it. At day 0 of each EP, the litter inside the rooms was
replaced by a mixture of dried manure (9 kg of DM per m2) and wood shavings (0.4 kg per m2).
This layer of ‘standard litter’ was friable and approximately 10 cm thick.
Legend
1.5 m 0.7 m3.0 m
2.6 m
2.1 m
0.8 m2.8 m1.6 m
3.4 m
Dimension (m)
Solid floor or wall
Metal aviary structure
Slatted or wired floor
Manure belt
Aeration duct with flow direction
Laying nest
Chain feeding system
Feed line with feed pans
Water line with nipple drinkers
Perch
Fluorescent light tube
LED light tube
Aviary A
Aviary B

Chapter 4
84
Oil spraying
Pure rapeseed oil was used, meant for use as biofuel in vehicles (Solar Oil Systems BV, Boijl,
the Netherlands; density: 0.93 g/mL). Oil was sprayed using a hand-held spraying lance (nozzle
type SU26B-SSBR; Spraying Systems, Ridderkerk, the Netherlands) connected to tubes for oil
and air which were fueled by an oil pressure vessel (12 L) and an air compressor. The oil
pressure vessel was installed on a balance (reading in g) which allowed accurate application of
the intended amount of oil (Table 1). At application rates of 15, 30, and 45 mL/m2, the target
amount of oil applied per day and per room was 626, 1251, and 1726 mL for aviary A, and 582,
1164, and 1746 mL for aviary B, respectively. The spraying rate of the lance was 260 mL/min
and the application of the oil film took approximately 7 minutes for the highest (45 mL/m2 per d)
oil treatment. The pressure for air and oil were set at 2.0 and 3.5 bar respectively, which gave a
round spray pattern of fine droplets up to 1.5 m distance without any drift of oil mist. The oil was
sprayed directly onto the litter, without soiling the aviary frame or the hens on the litter. The
hens quietly moved away from the spray without apparent anxiety.
Measurement of particulate matter concentration
Concentrations of PM10 and PM2.5 were determined on day 20, 27, and 34 of both EPs (Table
1). Sampling was done during 24 h, starting 1 h after the application of oil. PM was sampled
upwind of the aviary house, near the air inlet and at the exhaust point of each room. The exhaust
point was chosen in the centre of the room at a height of approximately 5 m (1.5 m under the
ridge exhaust). At this position, cyclone samplers (model URG-2000-30ENB for PM10 and
URG-2000-30EG for PM2.5; URG Corp., Chapel Hill) were suspended from a measuring mast.
Single PM10 and PM2.5 samples were taken at each sampling point. Air was drawn through the
cyclones by air pumps (Tecora, model Charlie HV; Ravebo B.V., Brielle, the Netherlands) at a
sampling rate of 16.7 L/min. Inside the cyclones, the aimed particle size was separated and
collected on a glass fiber filter (type GF-3, Ø 47 mm, Macherey-Nagel, Düren, Germany).
Unloaded (i.e., clean) and loaded (i.e., with PM) filters were weighed with a precise balance
(AT261 DeltaRange, Mettler, Greifensee, Switzerland; resolution: 10 µg) under standard
conditions (20 ± 1°C and 50 ± 5% relative humidity) as described in European Norm (EN)
12341 (CEN, 1998) and EN 14907 (CEN, 2005). After 48 h of stabilization, filters were weighed
4 times spread over 2 consecutive days. The average value was recorded as the filter weight. The
PM mass concentration was calculated by dividing the mass of collected PM by the volume of

Abatement of PM emission from experimental aviary housings by spraying rapeseed oil
85
air drawn through the filter, as registered by the pump flow meter. Measured PM10
concentrations were calibrated to the reference impaction sampler described in EN 12341 (CEN,
1998) using the equations reported by Zhao et al. (2009): y = 1.09x (when x ≤223 µg/m3) and y =
0.83x + 57.5 (when x >223 µg/m3), where x is the measured concentration and y is the calibrated
concentration.
Measurement of personal PM10 exposure
The exposure of stockmen to PM10 was determined on day 19, 25, and 29 in EP 1 and on day
19, 25, and 33 in EP 2 (Table 1). A light-scattering device (DustTrak™ Aerosol Monitor, model
8520, TSI Inc., Shoreview; air flow rate: 1.7 L/min) was attached to the lapel of the stockman,
who then mimicked a 10-min inspection round through each room. Concentrations of PM10 were
measured every second. Minute-averaged values were downloaded from the DustTrak’s
memory.
Measurement of carbon dioxide concentration
Concentrations of carbon dioxide (CO2) were determined at the same sampling positions and
at the same time as PM concentrations (Table 1). These were used for estimation of the
ventilation rate with the CO2 balance method. Air was sampled at a constant flow to achieve a
24-h averaged sample using the ‘lung principle’ (vessels with 40 L Nalophan air sampling bags
connected to electrical air pumps; Thomas Industries Inc., Wabasha, Minn.; model 607CD32;
critical capillary: 0.02 L/min). The pumps sucked air from the vessels, which caused the
sampling bags to be filled with air taken from the sampling position. Air samples were taken to
the lab and analyzed by gas chromatography (Interscience/Carlo Erba Instruments Inc., Breda,
the Netherlands, GC 8000 Top; column Molsieve 5A; detector: HWD).
Bird performance
Eggs were collected daily (Table 1) by running the egg conveyor belt in the aviary frame of
each room separately. Mislaid eggs (i.e., eggs laid in the aviary frame or on the litter floor) and
dead birds were collected during daily inspections rounds (Table 1). Eggs were counted and
scored per room into 4 categories (Table 1): first class eggs, second class eggs (i.e., eggs
contaminated with manure or blood, eggs with a cracked shell but intact membrane, double-

Chapter 4
86
yolked eggs, and eggs with an abnormal shape), third class eggs (i.e., eggs with a broken
membrane, shell-eggs and very small eggs), and mislaid eggs. The mean egg weight and mean
BW of the hens (input variables for the CO2 balance method) were determined once during each
EP by weighing the eggs produced on 1 day and by weighing a selection of 30 hens per room
respectively.
Bird behavior
The extent of dust bathing and scratching behavior was determined on day 7, 19, and 29 in EP
1 and on day 7, 19, and 33 in EP 2 (Table 1). On these days, observations were performed 4
times per room between 11:30 and 14:00. Within each room, observations were done at 2 litter
floor sections: in the front and rear (each section: approximately 3 × 3 m). During each
observation, we counted the total number of birds present in the section, the number of birds
displaying dust bathing behavior, and the number of birds displaying scratching behavior.
Bird exterior quality
The plumage condition, the extent of plumage soiling, and the extent of foot soiling was
determined on day 7, 19, and 29 in EP 1 and on day 7, 19, and 33 in EP 2 (Table 1). On these
days, a sample of 30 hens per room was examined and scored. The plumage condition was
examined at 4 body spots: throat/neck, chest/breast, back/wings/tail, and legs. The feathering at
each of these spots received 1 of the following 6 scores: intact, ruffled, damaged, severely
damaged, partly naked, or naked. The extent of plumage soiling was expressed in 1 of the
following 4 scores for the entire body: clean, slightly dirty, dirty, or very dirty. The soiling of the
featherless foot, including the foot pads, was scored following the same 4 scores.
Litter
Representative litter samples were taken in each room (approximately 500 g) on day 1, 11, 21,
and 35 of both EPs (Table 1). The DM content of the samples was determined by weighing
before and after oven-drying (24 h at 105 °C). On day 7, 19, and 29 in EP 1 and on day 7, 19,
and 33 in EP 2 the percentage of floor area with formation of cakes or clumps of litter (in
contrast to friable litter) was scored by visual observation (Table 1).

Abatement of PM emission from experimental aviary housings by spraying rapeseed oil
87
Estimation of ventilation rate
The ventilation rate was determined for each room on day 20, 27, and 34 of both EPs using
the CO2 balance method. The total heat production of a hen (Φtotal; kW) was calculated following
the equations by CIGR (2002), using the actual BW and the egg mass produced per hen per day
as input variables. The total heat production was multiplied by a factor (Fco2) of 0.18 m3 CO2/h
per kW as recommended by Pedersen et al. (2008) to yield the CO2 production of a hen and its
manure. The ventilation rate (Q; m3/h per bird) was calculated using Eq. 1:
6-inlet2exhaust2
2total
10)]CO[-]CO([
FcoQ
×
×F= (1)
where [CO2]exhaust is the CO2 concentration (ppm) determined near the ridge opening and
[CO2]inlet is the CO2 concentration (ppm) determined outside.
Calculation of PM emission rates
PM emission rates (PMemission; mg/h per bird) were calculated by Eq. 2:
)PM-PM(QPM inletexhaustemission ×= (2)
where Q is the ventilation rate (m3/h per bird), PMexhaust is the concentration of PM (mg/m3)
determined near the ridge opening, and PMinlet is the concentration of PM (mg/m3) determined
outside the aviary house.
Statistical analysis
All statistical analyses were performed using the GenStat software (VSN, 2013). Significance
was declared at probability levels ≤ 0.05. Rooms were the experimental units for all variables.

Chapter 4
88
Ventilation rate and particulate matter
Ventilation rate, PM concentrations, PM emission rates, and personal PM10 exposure were
analyzed by a mixed model using the REML directive, as described by Eq. 3:
klpkmpkpklmkmkpji0ijklmp DAT)Y(Log ε+ε+ε+ε+ε+ε++++β= (3)
where Log(Yijklmp) = natural logarithm of the response variable at oil application rate i in aviary
system j in EP k in room l of main room m at day p (for ventilation rate, a log-log transformation
was used); β0 = constant; Ti = fixed effect of treatment i (0, 15, 30, or 45 mL/m2 per d); Aj =
fixed effect of aviary system j (A or B); Dp = fixed effect of day p in the EP (20, 27, or 34 for
PM concentrations, ventilation rate, and PM emissions; 19, 25, 31, or 33 for personal PM10
exposure); and the ε’s are the random terms.
Bird performance: egg production, percentage of 1st class eggs, percentage of 2nd class eggs,
percentage of 3rd class eggs, and percentage of mislaid eggs
Five out of 6 bird performance variables were analyzed by a mixed model using the REML
directive, as described by Eq. 4:
)t(Splinettt)Y(Log kklpklkij2klmiklm1j1klm0j0ijklmp +ε+ε+ε+×β+ε+φ+×ε+β+ε+β= φ (4)
where Log(Yijklmp) = natural logarithm of the response variable of measurement p on day t in the
EP and on day tt of the oil spraying phase of the EP, at oil application rate i in aviary system j in
EP k in room l of main room m; β0j = constant: the response of aviary system j at the start of the
EP (t = 0);t = time: day in the EP (1 through 35); tt = treatment time: day in the oil spraying
phase (11 through 35); φi = fixed effect of treatment i (0, 15, 30, or 45 mL/m2 per d) at the first
day of oil spraying (at t = 11 and tt = 1); Spline(tl) = spline effect that models the overall trend in
EP k; the ε’s are the random terms; and the β’s are the linear regression coefficients.
Two-way and three-way interactions between the fixed model terms in Eq. 3 and 4 were also
tested (not shown in the equations) but excluded from analysis when not significant. Mean
values of model terms were estimated on the natural log-scale and back-transformed to
geometric mean values on the original scale. Pairwise t-tests were used to determine significant
differences between levels of fixed model terms.

Abatement of PM emission from experimental aviary housings by spraying rapeseed oil
89
Bird performance: mortality
The sixth bird performance variable, mortality, was analyzed by a logistic regression model
using the GLMM directive, as described by Eq. 5:
ijkkji0ijk AT)Y(Logit ε+ε+++β= (5)
where Logit(Yijk) = logit value of the response variable of measurement l in EP k, oil spraying
treatment i, and aviary system j. Because of the dichotomous nature of the response variable, the
logit function (i.e., Log[P/1–P]) was used as link function; β0 = constant; Ti = fixed effect of
treatment i (0, 15, 30, or 45 mL/m2 per d); Aj = fixed effect of aviary system j (A or B); and the
ε’s are the random terms.
Bird behavior and bird exterior quality
Bird behavior variables (dust bathing and scratching behavior) and bird exterior quality
variables (plumage condition, plumage soiling, and foot soiling) were analyzed by a model
almost identical to Eq. 4, with the exceptions that: (1) the continuous term t was replaced by a
factor term ft (with levels: 7, 19, 29, and 33; day in the EP), and (2) no spline was used.
The bird exterior quality variables were analyzed using the IRCLASS procedure which fits a
GLMM to ordinal data. For this procedure, the values of the response variable, i.e, the
frequencies in each class for each room and day, were recalculated to fractions. No log-
transformation was applied to the bird exterior quality variables.
Litter DM content
The DM content of the litter was analyzed by the model in Eq. 4 with the exceptions that no
spline was used and no log-transformation was applied to this response variable.

Chapter 4
90
RESULTS
Particulate matter concentrations and emissions
Table 2 shows the mean values of the ventilation rate, PM concentrations, PM emission rates,
and personal PM10 exposure, presented per treatment. The statistical analysis showed that the
ventilation rate was not significantly different between the treatments. The overall mean (SD)
CO2 concentration, used to calculate ventilation rate, was 970 (230) ppm inside the rooms and
453 (10) ppm outside the house. The overall mean BW of the hens, also used to calculate
ventilation rates, was 1962 g. For these response variables, no significant differences were found
between the 2 aviary systems.
Highly significant effects of the oil application rate were found on PM10 concentration (P <
0.001), PM10 emission rate (P < 0.001), PM2.5 concentration (P < 0.001), PM2.5 emission rate (P
< 0.001), and personal PM10 exposure (P < 0.001): the levels of these response variables
decreased with increasing oil application rate and most contrasts between the treatments were
significantly different (Table 2). Table 2 and Fig. 2 furthermore show that, at the same oil
application rate, reductions for PM2.5 were higher than for PM10. Since the ventilation rate did
not differ significantly between treatments, reductions in PM emission rates in Table 2 are
attributable to reductions in PM concentrations (see Eq. 2).
Table 2Model-estimated1 means2 on the measured scale for ventilation rate, particulate matter concentrations, particulate matter emission rates, and personal PM10 exposure. Model-estimated means on the natural log-scale are given in parenthesis.
Variable Treatment (mL/m2 per d)0 15 30 45 SEM3
Ventilation rate (m3/h per bird) 4.46 (0.40) 4.33 (0.38) 4.57 (0.42) 4.33 (0.38) (0.24)PM10 concentration (µg/m3) 2623 (0.96) a 1952 (0.67) a 998 (-0.002) b 544 (-0.61) c (0.15)PM10 concentration reduction (%) -- 26 62 79 --PM10 emission rate (mg/h per 12.3 (2.51) a 8.95 (2.19) a 4.73 (1.55) b 2.27 (0.82) c (0.28)PM10 emission reduction (%) -- 27 62 82 --PM2.5 concentration (µg/m3) 187 (-1.68) a 66 (-2.72) b 43 (-3.15) c 28 (-3.56) d (0.18)PM2.5 concentration reduction (%) -- 65 77 85 --PM2.5 emission rate (mg/h per 0.81 (-0.21) a 0.24 (-1.44) b 0.14 (-1.96) b 0.05 (-2.96) c (0.36)PM2.5 emission reduction (%) -- 71 83 94 --Personal PM10 exposure (mg/m3) 3.65 (1.29) a 1.54 (0.43) b 0.78 (-0.25) c 0.33 (-1.10) d (0.12)Personal PM10 exposure reduction -- 58 79 91 --
1 See Eq. 3.2 n=12 for each mean.3 Pooled standard error on the natural log-scale.a, b, c, d Means in the same row with different superscripts are significantly different (P ≤ 0.05).

Abatement of PM emission from experimental aviary housings by spraying rapeseed oil
91
Fig. 2Time trends in model-estimated mean emission rates of PM10 (A) and PM2.5 (B), and of emission reductions of PM10
(C) and PM2.5 (D). Each data point represents the mean of 4 values. Note that oil was sprayed from day 11. Legends: oil application rates in mL/m2 per day. Note that the drop in PM2.5 emission from day 20 to 27 in the 30 and 45 mL/m2 per day treatments (Fig. B) was significantly different from each other and the 0 and 15 mL/m2 per day treatments.
A significant interaction between oil application rate and day number was found for PM2.5
concentration (P = 0.038), PM2.5 emission rate (P = 0.004), and personal PM10 exposure (P =
0.003). Comparison of the differences between estimated means and the least significant
difference showed that the interaction for PM2.5 and day number was due to a significant drop in
PM2.5 from day 20 to 27 in the 30 and 45 mL/m2 per day treatments; Fig. 2B). The same analysis
of the interaction for personal PM10 exposure showed that this was caused by a total of 12
significant day to day differences within treatments. Since day number in the EP is included in
0
20
40
60
80
100
20 27 34
PM10
emis
sion
red
uctio
n (%
)
Day in exp. period
PM10 emission reduction(exp. period 1+2)
15 30 45
0
20
40
60
80
100
20 27 34
PM2.
5em
issi
on r
educ
tion
(%)
Day in exp. period
PM2.5 emission reduction(exp. period 1+2)
15 30 45
C D
0
5
10
15
20 27 34
PM10
emis
sion
rat
e (m
g/h
per
bird
)
Day in exp. period
PM10 emission(exp. period 1+2)
0 15 30 45
0.0
0.2
0.4
0.6
0.8
1.0
20 27 34
PM2.
5em
issi
on r
ate
(mg/
h pe
r bi
rd)
Day in exp. period
PM2.5 emission(exp. period 1+2)
0 15 30 45
A B

Chapter 4
92
Eq. 3 as a factor term (Dp), significant day to day differences in concentrations and emissions
within a treatment can result in a significant interaction without the presence of a general time
trend. The effect of time on the effectiveness of the oil treatments is therefore further explored in
Fig. 2 (C and D) and Fig. 3. From these figures it is clear that the reductions of PM10 and PM2.5
emission were relatively stable in time, whereas the reductions of personal PM10 exposure tended
to increase further from day 19 to 29/33 of the EP.
Fig. 3Time trends in the reduction of PM10 exposure of stockman during experimental period 1 (left) and 2 (right). Each data point represents the mean of 2 values. Note that oil was sprayed from day 11. Legends: oil treatments in mL/m2
per d.
Bird performance
Table 3 shows the mean values of the bird performance variables. The statistical analyses
showed no significant effects of the application of oil on bird mortality and eggs/birds ratio. A
significant effect of treatment time was found for the percentage of second class eggs. This
response variable increased in time in the control treatment (term t in Eq. 4; P < 0.001; from
1.3% at day 1 to 1.4% at day 35), but in the oil spraying treatments, a stronger increase was
found (term tt in Eq. 4; P = 0.004; from 1.3% at day 1 to 1.9% at day 35) which, however, was
not significantly different between the 3 oil spraying treatments. No significant effects were
found of the application of oil on the percentage of first class eggs, third class eggs, or mislaid
eggs.
A general effect of time (term t in Eq. 4; P = 0.042) was found for the percentage of mislaid
eggs. This variable decreased (in both control and oil spraying treatments) from 2.0% on day 1 to
0
20
40
60
80
100
19 25 29
PM10
expo
sure
red
uctio
n (%
)
Day in exp. period
PM10 exposure reduction(exp. period 1)
15 30 45
0
20
40
60
80
100
19 25 33
PM10
expo
sure
red
uctio
n (%
)
Day in exp. period
PM10 exposure reduction(exp. period 2)
15 30 45

Abatement of PM emission from experimental aviary housings by spraying rapeseed oil
93
1.4% on day 35 of the EP. The eggs/birds ratio was lower for aviary A (0.933) in comparison
with aviary B (0.942; P = 0.004). Furthermore, the percentage of second class eggs was higher
for aviary A (1.70%) in comparison with aviary B (1.28%; P = 0.017). Finally, the percentage of
third class eggs was higher for aviary A (0.48%) in comparison with aviary B (0.38%; P =
0.033).
Table 3Mean values of mortality, egg production, and egg quality per aviary system and treatment. Note that, relative to the control treatment, a significant shift was found towards more second class eggs in the oil spraying treatments, regardless of the aviary system.Variable Aviary A Aviary B
Treatment (mL/m2 per d) Treatment (mL/m2 per d)0 15 30 45 0 15 30 45
Mortality (%) 0.00 0.49 0.32 0.16 2.21 1.34 1.01 1.86Egg production (eggs/bird per d) 0.942 0.929 0.933 0.926 0.944 0.946 0.939 0.940Egg quality
First class eggs (%) 1 96.8 95.7 96.7 95.9 97.0 96.4 96.3 95.9Second class eggs (%) 2 1.47 1.80 1.51 2.04 1.28 1.26 1.24 1.34Third class eggs (%) 3 0.54 0.46 0.42 0.50 0.34 0.39 0.39 0.39Mislaid eggs (%) 4 1.21 2.04 1.39 1.54 1.42 1.90 2.12 2.41
1 Eggs with no imperfections.2 Eggs contaminated with manure or blood, eggs with a cracked shell but intact membrane, double-yolked eggs, and eggs with an abnormal shape.3 Eggs with broken membrane, shell-eggs, and very small eggs.4 Eggs laid outside the nest: in the aviary frame or on the litter floor.
Bird behavior
No significant effects were found of the application of oil, or any other model term, on the
percentage of birds displaying dust bathing or scratching behavior. The mean percentage of birds
displaying dust bathing behavior in the 0, 15, 30, and 45 mL/m2 per day treatments was 17%,
21%, 19%, and 20% respectively (pooled SEM: 3.8; n = 8 per treatment). The mean percentage
of birds displaying scratching behavior in the 0, 15, 30, and 45 mL/m2 per day treatments was
5.0%, 4.9%, 5.9%, and 7.0% respectively (pooled SEM: 1.8; n = 8 per treatment).
Bird exterior quality
The statistical analysis showed no significant effects of the application of oil on the plumage
condition for the body spots: throat/neck, chest/breast, and legs. A significant effect of time was
found for these 3 response variables (P = 0.006 for throat/neck; P < 0.001 for chest/breast, and P
< 0.001 for legs). The mean percentage of birds falling in the ‘intact’ class on days 7, 19, and
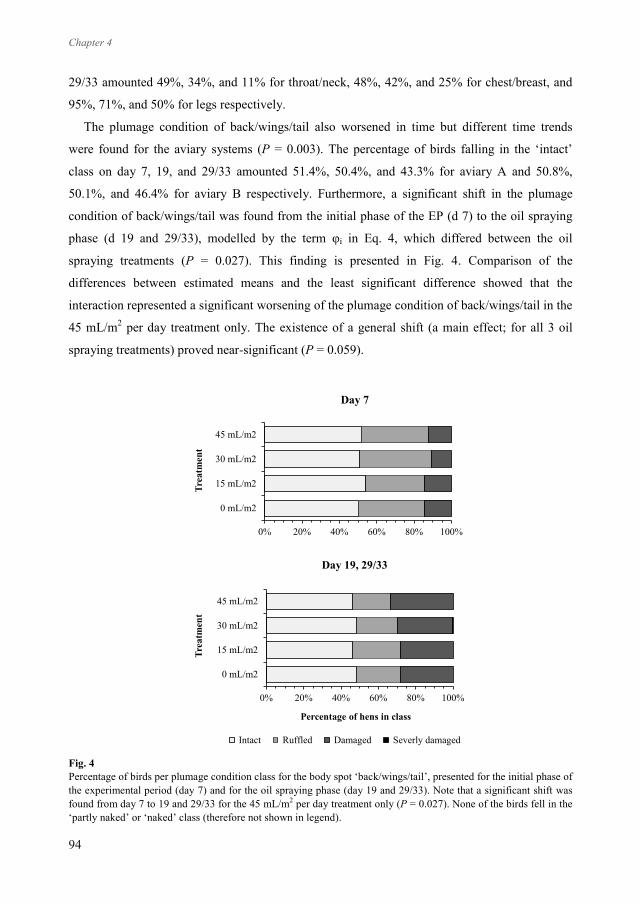
Chapter 4
94
29/33 amounted 49%, 34%, and 11% for throat/neck, 48%, 42%, and 25% for chest/breast, and
95%, 71%, and 50% for legs respectively.
The plumage condition of back/wings/tail also worsened in time but different time trends
were found for the aviary systems (P = 0.003). The percentage of birds falling in the ‘intact’
class on day 7, 19, and 29/33 amounted 51.4%, 50.4%, and 43.3% for aviary A and 50.8%,
50.1%, and 46.4% for aviary B respectively. Furthermore, a significant shift in the plumage
condition of back/wings/tail was found from the initial phase of the EP (d 7) to the oil spraying
phase (d 19 and 29/33), modelled by the term φi in Eq. 4, which differed between the oil
spraying treatments (P = 0.027). This finding is presented in Fig. 4. Comparison of the
differences between estimated means and the least significant difference showed that the
interaction represented a significant worsening of the plumage condition of back/wings/tail in the
45 mL/m2 per day treatment only. The existence of a general shift (a main effect; for all 3 oil
spraying treatments) proved near-significant (P = 0.059).
Fig. 4Percentage of birds per plumage condition class for the body spot ‘back/wings/tail’, presented for the initial phase of the experimental period (day 7) and for the oil spraying phase (day 19 and 29/33). Note that a significant shift was found from day 7 to 19 and 29/33 for the 45 mL/m2 per day treatment only (P = 0.027). None of the birds fell in the ‘partly naked’ or ‘naked’ class (therefore not shown in legend).
0% 20% 40% 60% 80% 100%
0 mL/m2
15 mL/m2
30 mL/m2
45 mL/m2
Trea
tmen
t
Day 7
0% 20% 40% 60% 80% 100%
0 mL/m2
15 mL/m2
30 mL/m2
45 mL/m2
Percentage of hens in class
Trea
tmen
t
Day 19, 29/33
Intact Ruffled Damaged Severly damaged

Abatement of PM emission from experimental aviary housings by spraying rapeseed oil
95
With regard to plumage soiling, the statistical analysis showed no significant effects of the
application of oil, nor of any other of the model terms tested. With regard to foot soiling, a
significant shift was found from the initial phase of the EP (d 7) to the oil spraying phase (d 19
and 29/33), modelled by the term φi in Eq. 4, which differed between each of the three oil
spraying treatments (P < 0.001). This finding is further presented in Fig. 5, which shows that the
extent of foot soiling decreased with increasing amounts of oil sprayed (hence, the foot became
cleaner).
Fig. 5Percentage of birds falling in each foot soiling class, presented for the initial phase of the experimental period (day 7) and for the oil spraying phase (day 19 and 29/33). Note that significant shifts were found from day 7 to 19 and 29/33, which differed significantly between the treatments (P < 0.001).
0% 20% 40% 60% 80% 100%
0 mL/m2
15 mL/m2
30 mL/m2
45 mL/m2
Trea
tmen
t
Day 7
0% 20% 40% 60% 80% 100%
0 mL/m2
15 mL/m2
30 mL/m2
45 mL/m2
Trea
tmen
t
Day 19
0% 20% 40% 60% 80% 100%
0 mL/m2
15 mL/m2
30 mL/m2
45 mL/m2
Percentage of hens in class
Trea
tmen
t
Day 29/33
Clean Slightly dirty Dirty Very dirty

Chapter 4
96
Litter
The statistical analysis showed no significant effects of the application of oil, or any other
model term, on the DM content of the litter. The mean DM content of the litter in the 0, 15, 30,
and 45 mL/m2 per day treatments was 795, 798, 808, and 807 g/kg (pooled SEM: 20; n = 8 per
treatment), respectively.
The formation of cakes or clumps of litter was not detected. The litter layer was fully friable
and crumbly in all rooms throughout the EPs. Since there was no variation between scores of this
response variable, no statistical analysis was performed.
DISCUSSION
PM concentrations and emission rates of control rooms were consistent with those reported in
a recent emission survey in commercial farms in the Netherlands (Winkel et al., 2015).
Substantially higher oil application rates were needed in the present study to reduce these PM
levels in comparison with broilers on litter floors (Aarnink et al., 2011; Winkel et al., 2014). In
the latter studies, the application of 16 mL/m2 per day reduced PM10 by 64 to 70%. In the present
study however, the application of 15 mL/m2 per day reduced PM10 by only 27%. This difference
is presumably the net result of several factors that differ between broiler housings and aviary
housings. First, the average mass of birds per m2 of litter in the aforementioned broiler studies
was 20.6 kg over a 35 day growing cycle and 39.7 kg at the end of the cycle (Aarnink et al.,
2011; Winkel et al., 2014), whereas in the present study, the average mass of birds per m2 was
only 8 kg, assuming 25% of the hens to be present on the litter floor and 75% in the aviary frame
(Carmichael et al., 1999; Channing et al., 2001; Odén et al., 2002). Since the aerosolization of
particles from the litter occurs by direct mechanical force (e.g., by dust bathing) and by air flow
induced force (e.g., by wing flapping), aerosolization increases with the mass of animals which
is able to exert such force. Hence, the lower bird mass per unit of litter area in the aviaries as
such may have required less oil to be sprayed to achieve a certain level of PM reduction. In
contrast, hens in aviaries presumably display more active behavior on the litter than broilers in
floor housing. Hens travel between litter floor and aviary frame (e.g., by jumping and flying)
(Campbell et al., 2016), whereas broilers are confined to a floor. Fast-growing broilers tend to
display behaviors in a sitting posture (Bokkers and Koene, 2003) and their locomotor activity
drastically declines with age (Bessei, 1992). Also, laying hen litter is usually more friable and
dry (750 to 850 g/kg) (Groot Koerkamp and Bleijenberg, 1998; Groot Koerkamp et al., 1998) in

Abatement of PM emission from experimental aviary housings by spraying rapeseed oil
97
comparison with broiler litter (500 to 700 g/kg) (Van Harn et al., 2012; Winkel et al., 2014). The
aforementioned three aspects each promote particle aerosolization in aviaries. Finally, in the
present study, oil was sprayed onto the litter directly, using a spraying gun, whereas in broilers,
oil was sprayed throughout the entire room, covering the equipment and the broilers as well.
Because settled dust layers in the aviary frame, the manure on the belts in the aviary frame, and
the feathering of the hens remained untreated by oil, it is likely that more oil needed to be
sprayed onto the litter only to achieve a certain level of PM reduction in the room as a whole.
In previous research in broilers (Aarnink et al., 2011; Winkel et al., 2014), we found that
PM2.5 was reduced by 81 to 84% at oil application rates of 6 to 8 mL/m2 per d, and this level did
not increase further at higher application rates (12 to 24 mL/m2 per d). It was hypothesized that
some of the oil droplets in the PM2.5 fraction might still have been present in the air during PM
sampling, cancelling out any extra PM2.5 reduction. The present study further supports this, since
PM2.5 reduction did increase with increasing oil application rate and oil droplets could not be
erroneously sampled as PM2.5 because the oil was sprayed directly onto the litter. In agreement
with the aforementioned broiler studies, results of the present study show that, at a certain oil
application rate, PM2.5 is more reduced than PM10. Earlier, we suggested that the oil film
functions as a binding agent which confines particles in the upper litter layer (Winkel et al.,
2015). Given that the oil was applied directly onto the litter, a wash out of particles from the air
can be ruled out as the working principle. More likely, the oil aggregates tiny particles in the
upper litter layer to bigger ones, which settle rapidly when dispersed in the air by movements of
the birds. This would furthermore explain why oil spraying seems to be more effective for
smaller particles.
In the present study, no significant effects were found of oil spraying on bird mortality. A
positive relationship between PM concentration and mortality in laying hens was reported by
Guarino et al. (1999). Such (long-term) effect however, may have well needed longer exposure
times than 25 days to become apparent between control and oil treatments.
Furthermore, we found no significant effects of oil spraying on the DM content and friability
of the litter. In broilers, the absence of such effects have been reported as well (Griffin and
Vardaman, 1970; Winkel et al., 2014). The percentage of the hens present on the litter floor
displaying dust bathing behavior in this work (overall mean: 19%) falls within the 14% to 22%
presented for ‘good litter’, but outside the range of 3% to 12% presented for ‘bad litter’, in a
study in 25 farms in Sweden by Odén et al. (2002; figure 7). Furthermore, the percentage of the
hens present on the litter floor displaying scratching behavior in this work (overall mean: 6%)
agrees very well with the 4% to 9% reported by Channing et al. (2001; figure 3). These results

Chapter 4
98
indicate that, at the investigated application rates and application duration, oil spraying does not
affect the litter quality or behavior of the hens.
Remarkably, the extent of foot soiling decreased with increasing oil application rate. The
working principle behind this remains unclear. Perhaps, the rapeseed oil stimulates litter to
aggregate to bigger particles which do not settle easily in the grooves of the foot pads.
Alternatively, the oil may seal off the grooves, or oil coated litter particles may not easily adhere
to the skin of the foot.
Two possible negative side-effects were found: (1) a stronger increase in the percentage of
second class eggs in time in the oil treatments versus the control treatment, and (2) a worsening
of the plumage condition of the body spot back/wings/tail in the 45 mL/m2 per day treatment
only. One of the reasons for rating eggs as second class was contamination of the shell with
manure. When this finding reflects a true effect, eggs must have been contaminated directly after
laying and before they had rolled onto the egg belt, since egg belts were clean and integrated
within the nest box. It seems unlikely however, that such contamination has been caused by
soiling of the nests, feathers or foot, since oil was not sprayed within the aviary frame (Fig. 1),
no effects of oil application were found on feather soiling, and the foot of the hens became
cleaner with increasing oil application rate. No effects of oil spraying were found on the quantity
of eggs produced.
The worsening of the plumage condition of the body spot back/wings/tail may reflect a true
negative side-effect, since this effect was only found in the highest (45 mL/m2 per d) oil
treatment and these body parts come into close contact with the top litter layer during dust
bathing. The plumage condition of throat/neck, chest/breast, and legs remained unaffected by the
application of oil.
In the present study, the oil was sprayed onto the litter manually, to ensure that an exact
amount of oil was applied, spread out equally over the entire litter surface. It took 3, 7, or 10
seconds to spray 15, 30, or 45 mL on a squared meter of litter respectively. In large-scale
commercial aviary houses, this approach may take up to an 8-h working day to complete and is
therefore impractical. An automated, technical solution is needed in future which sprays the oil
directly onto the litter without reaching the aviary or the hens, which can cover the entire litter
surface, and does not cause the oil droplets to drift. An evaluation is currently in progress of two
such solutions: a fixed system with nozzles positioned directly above the litter throughout the
aviary house and an autonomously driving oil spraying vehicle. In conclusion, this study shows
that such solutions should be able to reduce PM concentrations and emission rates in aviaries by
spraying 15 to 30 mL/m2 per day with minor side effects within 25 day of daily spraying.

Abatement of PM emission from experimental aviary housings by spraying rapeseed oil
99
ACKNOWLEDGMENTS
This study was financed by the Dutch Ministry of Economic Affairs and the Dutch Ministry
of Infrastructure and the Environment. We thank the staff of poultry research centre ‘Het
Spelderholt’ for taking care of the animals, Mr. Alfred Gerrits, Mr. Theo van Hattum, Mr. Jos
Huis in't Veld, Mr. Guus Nijeboer and Mr. Johan Ploegaert for carrying out the measurements,
Mr. Eef Lovink for maintenance and calibration of measuring equipment, and Mr. Jean Slangen
and Mr. Geert Kupers for carrying out the lab analyses.
REFERENCES
Aarnink, A.J.A., Van Harn, J., Van Hattum, T.G., Zhao, Y., Ogink, N.W.M., 2011. Dust reduction in broiler houses by spraying rapeseed oil. Trans. ASABE 54:1479–1489.
Al Homidan, A., Robertson, J.F., Petchey, A.M., 2003. Review of the effect of ammonia and dust concentrations on broiler performance. World’s Poult. Sci. J. 59:340–349
Bessei, W. 1992. The behaviour of broilers under intensive management conditions. Archiv Für Geflügelkunde 56: 1–7.
Bokkers, E.A.M., Koene, P., 2003. Behaviour of fast- and slow growing broilers to 12 weeks of age and the physical consequences. Appl. Anim. Behav. Sci. 81:59–72.
Calvet, S., van den Weghe, H., Kosch, R., Estellés, F., 2009. The influence of the lighting program on broiler activity and dust production. Poult. Sci. 88:2504–2511.
Cambra-López, M., Hermosilla, T., Lai, H.T.L., Aarnink, A.J.A., Ogink, N.W.M., 2011. Particulate matter emitted from poultry and pig houses: Source identification and quantification. Trans. ASABE 54:629–642.
Campbell, D.L.M., Makagon, M.M., Swanson, J.C., Siegford, J.M., 2016. Laying hen movement in a commercial aviary: Enclosure to floor and back again. Poult. Sci. 95:176–187.
Carmichael, N.L., Walker, A.W., Hughes, B.O., 1999. Laying hens in large flocks in a perchery system: Influence of stocking density on location, use of resources and behaviour. Brit. Poult. Sci. 40:165–176.
CEN, 1998. EN 12341:1998. Air quality - Determination of the PM 10 fraction of suspended particulate matter -Reference method and field test procedure to demonstrate reference equivalence of measurement methods. Comité Européen de Normalisation (CEN; European Committee for Standardization), Brussels, Belgium.
CEN, 2005. EN 14907:2005. Ambient air quality - Standard gravimetric measurement method for the determination of the PM2.5 mass fraction of suspended particulate matter. Comité Européen de Normalisation (CEN; European Committee for Standardization), Brussels, Belgium.
Channing, C.E., Hughes, B.O., Walker, A.W., 2001. Spatial distribution and behaviour of laying hens housed in an alternative system. Appl. Anim. Behav. Sci. 72:335–345.
CIGR, 2002. 4th Report of working group on climatization of animal houses. Heat and moisture production at animal and house levels (eds. Pedersen, S. and K. Sällvik). International Commission of Agricultural Engineering (CIGR), Section II.
Donham, K., Cumro, D., 1999. Setting maximum dust exposure levels for people and animals in livestock facilities. Pages 93–110 in Proc. Int. Symp. on Dust Contr. in Anim. Prod. Facilities, Aarhus, Denmark.
Griffin, J.G., Vardaman, T.H., 1970. Cottonseed oil spray for broiler houses: Effects on dust control, Mycoplasma gallisepticum spread, and broiler performances. Poult. Sci. 49:1664–1668.
Groot Koerkamp, P.W.G., Bleijenberg, R., 1998. Effect of type of aviary, manure and litter handling on the emission kinetics of ammonia from layer houses. Brit. Poult. Sci. 39:379–392.
Groot Koerkamp, P.W.G., Speelman, L., Metz, J.H.M., 1998. Litter composition and ammonia emission in aviary houses for laying hens. Part 1: Performance of a litter drying system. J. Agric. Eng. Res. 70:375–382.
Guarino, M., Caroli, A., Navarotto, P., 1999. Dust concentration and mortality distribution in an enclosed laying house. Trans. Asae 42:1127–1133.
Gustafsson, G., Von Wachenfelt, E., 2006. Measures against airborne dust in a floor housing system for laying hens. Agricultural Engineering International: the CIGR Ejournal Manuscript BC 06 018. Vol. VIII. December, 2006, 1–13.

Chapter 4
100
Heederik, D.J.J., Opstal-van Winden, A.J.W., Smit, L.A.M., Wouters, I.M., Hooiveld, M., IJzermans, C.J., van der Sman-de Beer, F., Spreeuwenberg, P.P.M., de Bruin, A., van Rotterdam, B., 2011. Mogelijke effecten van intensieve-veehouderij op de gezondheid van omwonenden: onderzoek naar potentiële blootstelling en gezondheidsproblemen. Institute for Risk Assessment Sciences (IRAS), Universiteit Utrecht; Nederlands instituut voor onderzoek van de gezondheidszorg (NIVEL); Rijksinstituut voor Volksgezondheid en Milieu (RIVM), Utrecht, the Netherlands.
Ikeguchi, A., 2002. Ultra sonic sprayer controlling dust in experimental poultry houses. Agricultural Engineering International: the CIGR Ejournal Manuscript BC 01 002. Vol. IV. October, 2006, 1-10.
Li, Q.F., Wang-Li, L., Walker, J.T., Shah, S.B., Bloomfield, P., Jayanty, R.K.M., 2012. Particulate matter in the vicinity of an egg production facility: Concentrations, statistical distributions, and upwind and downwind comparison. Trans. ASABE 55:1965–1973.
Odén, K., Keeling, L.J., Algers, B., 2002. Behaviour of laying hens in two types of aviary systems on 25 commercial farms in Sweden. Brit. Poult. Sci. 43:169–181.
Ogink, N.W.M., Aarnink, A.J.A., 2011. Plan van aanpak bedrijfsoplossingen voor fijnstofreductie in de pluimveehouderij [Plan of action for particulate matter mitigation solutions in poultry; in Dutch, with English summary]. Animal Sciences Group, Wageningen University and Research Centre, Lelystad, the Netherlands.
Omland, Ø., 2002. Exposure and respiratory health in farming in temperate zones - A review of the literature. Annals Agric. Environ. Med. 9:119–136.
Pedersen, S., Blanes-Vidal, V., Joergensen, H., Chwalibog, A., Haeussermann, A., Heetkamp, M.J.W., Aarnink, A.J.A., 2008. Carbon dioxide production in animal houses: a literature review. Agricultural Engineering International: CIGR Ejournal. Manuscript BC 08 008. Vol. X. December, 2008.
PPE-PVV, 2012. Livestock, meat and eggs in the Netherlands: keyfacts 2011 (edition 2012). Dutch Product Board for Poultry and Eggs (PPE) and the Dutch Product Board for Livestock and Meat (PVV), Zoetermeer, the Netherlands.
Radon, K., Danuser, B., Iversen, M., Jörres, R., Monso, E., Opravil, U., Weber, C., Donham, K.J., Nowak, D., 2001. Respiratory symptoms in European animal farmers. Eur. Respir. J. 17:747–754.
RIVM, 2011. Annual national emissions of PM10; in total and per sector/source, for 2011. Emissieregistratie, Rijksinstituut voor Volksgezondheid en Milieu (RIVM) [Pollutant Release and Transfer Register, National Institute for Public Health and the Environment (RIVM)], Bilthoven, the Netherlands.
Seedorf, J., Hartung, J., Schröder, M., Linkert, K.H., Phillips, V.R., Holden, M.R., Sneath, R.W., Short, J.L., White, R.P., Pedersen, S., Takai, H., Johnsen, J.O., Metz, J.H.M., Groot Koerkamp, P.W.G., Uenk, G.H., Wathes, C.M., 1998. Concentrations and emissions of airborne endotoxins and microorganisms in livestock buildings in Northern Europe. J. Agric. Eng. Res. 70:97–109.
Takai, H., 2002. Ammonia contents and desorption from dusts collected in livestock buildings. CIGR ejournal IV:1–11.
Takai, H., 2007. Factors influencing dust reduction efficiency of spraying of oilwater mixtures in pig buildings, DustConf 2007 - How to improve air quality, Maastricht, the Netherlands.
Takai, H., Pedersen, S., Johnsen, J.O., Metz, J.H.M., Groot Koerkamp, P.W.G., Uenk, G.H., Phillips, V.R., Holden, M.R., Sneath, R.W., Short, J.L., White, R.P., Hartung, J., Seedorf, J., Schröder, M., Linkert, K.H., Wathes, C.M., 1998. Concentrations and emissions of airborne dust in livestock buildings in Northern Europe. J. Agric. Eng. Res. 70:59–77.
Van Harn, J., A. J. A. Aarnink, J. Mosquera, J. W. Van Riel, and N. W. M. Ogink. 2012. Effect of bedding material on dust and ammonia emission from broiler houses. Trans. ASABE 55:219-226.
Viegas, S., Faísca, V.M., Dias, H., Clérigo, A., Carolino, E., Viegas, C., 2013. Occupational exposure to poultry dust and effects on the respiratory system in workers. J. Toxic. Environ. Health 76:230–239.
Von Wachenfelt, E. 1999. Dust reduction in alternative production systems for laying hens. Pages 261-264 in Proc. Int. Symp. on Dust Contr. in Anim. Prod. Facilities, Aarhus, Denmark.
VSN. 2013. GenStat reference manual (release 16), Hemel Hempstead, UK.Winkel, A., Cambra-López, M., Groot Koerkamp, P.W.G., Ogink, N.W.M., Aarnink, A.J.A., 2014. Abatement of
particulate matter emission from experimental broiler housings using an optimized oil spraying method. Trans. ASABE 57:1853–1864.
Winkel, A., Mosquera, J., Groot-Koerkamp, P.W.G., Ogink, N.W.M., Aarnink, A.J.A., 2015. Emissions of particulate matter from animal houses in the Netherlands. Atmos. Environ.111:202–212.
Yang, X., Lorjaroenphon, Y., Cadwallader, K.R., Wang, X., Zhang, Y., Lee, J., 2014. Analysis of particle-borne odorants emitted from concentrated animal feeding operations. Sci. Total Environ. 490, 322–333.
Zhao, Y., Aarnink, A.J.A., Hofschreuder, P., Groot Koerkamp, P.W.G., 2009. Evaluation of an impaction and a cyclone pre-separator for sampling high PM10 and PM2.5 concentrations in livestock houses. J. Aerosol Sci. 40: 868–878.

Chapter 5Evaluation of oil spraying systems and air ionization systems
for abatement of particulate matter emission in
commercial poultry houses
A. Winkel a, J. Mosquera a, A..J.A. Aarnink a, P.W.G. Groot Koerkamp a,b, and N.W.M. Ogink a
a Wageningen UR Livestock Research, Wageningen, the Netherlandsb Farm Technology Group, Wageningen University, Wageningen, the Netherlands
Biosystems Engineering (2016) 150:104–122
Reprinted with permission from Elsevier Ltd
Available online at: http://dx.doi.org/10.1016/j.biosystemseng.2016.07.014

Chapter 5
102
ABSTRACT
The present study evaluated the performance of four systems for abatement of particulate
matter (PM) emission inside full-scaled commercial poultry houses: a fixed oil spraying system
(OSF) inside two broiler farms and one laying hen house, an autonomously driving oil spraying
vehicle (OSV) in one laying hen house, a negative air ionization system (NAI) inside two broiler
farms, and a positive air ionization system (PAI) inside two laying hen houses. The systems were
evaluated using case-control approaches. At each farm, six 24-h measurements were scheduled
of PM10, PM2.5, ammonia, odor, and carbon dioxide concentrations (the latter for estimation of
the ventilation rate and herewith emissions). This paper presents the layout of the systems,
compares their performance in practice with that under experimental conditions, discusses
improvement possibilities, reports the baseline emission rates of the poultry houses, and
discusses the validity of the case-control approaches. The emission reductions of PM10 and PM2.5
were: 60% and 53% for the OSF in broilers (at 12 mL m–2 d–1), 21% and 31% for the OSF in
laying hens (at 15 mL m–2 d–1), 32% and 38% for the OSV in laying hens (at 30 mL m–2 d–1),
49% and 68% for the NAI in broilers, and 6% and zero for the PAI in laying hens. None of the
systems significantly reduced the emission rate of odor or ammonia. On the basis of this work,
emission reduction factors of the OSF, OSV, and NAI have been adopted in Dutch regulations.

Evaluation of oil spraying systems and air ionization systems in commercial poultry houses
103
NOMENCLATURE
B1, B2, B3, B4 Broiler farms 1, 2, 3, and 4, respectivelyCexhaust Pollutant concentration in the exhaust air flowCinlet Pollutant concentration in the inlet air flowCO2 Carbon dioxide[CO2]exhaust Concentration of carbon dioxide in the exhaust air flow (ppm)[CO2]inlet Concentration of carbon dioxide in the inlet air flow (ppm)E Emission rate of pollutant (mg h–1 bird–1)Fco2 Factor for conversion of total heat to the volumetric carbon dioxide production by the animal and
its manure (m3 h–1 kW–1)L1, L2, L3, L4 Laying hen farms 1, 2, 3, and 4, respectivelyNAI Negative air ionization systemNH3 AmmoniaOSF Fixed oil spraying system (installed in B1, B2, and L1)OSV Oil spraying vehicle (installed in L2)OUE European Odour UnitP Level of significancePAI Positive air ionization systemPM Particulate matterPM10 Particulate matter which passes through a size-selective inlet with a 50% efficiency cut-off at 10
μm aerodynamic diameter (EN 12341)PM2.5 Particulate matter which passes through a size-selective inlet with a 50% efficiency cut-off at 2.5
μm aerodynamic diameter (EN 14907)SD Standard deviationQ Total ventilation rate in the poultry house (m3 h–1 bird–1)Φtotal Total heat production by the animal (kW)

Chapter 5
104
INTRODUCTION
Houses for broilers and laying hens with littered floors show the highest concentrations of
airborne particulate matter (PM) among all housing systems for poultry, pigs, and dairy in the
livestock sector (Takai et al., 1998; Winkel et al., 2015b). These high concentrations may affect
the health and productivity of the birds (Al Homidan et al., 2003; Guarino, Caroli and Navarotto,
1999) and cause respiratory problems in workers (Omland, 2002; Radon et al., 2001). Since
poultry houses exhaust up to 10 m3 h–1 bird–1 polluted air, a large number of PM is also released
into the atmosphere and can contribute to local and regional background PM concentrations.
Very little is known about health effects of ambient PM from intensive livestock houses to
neighboring residents, but available studies suggest some effects, such as a higher incidence of
pneumonia and a lower lung function in the general population, and more exacerbations in
patients suffering from Chronic Obstructive Pulmonary Disease (COPD) (Borlée et al., 2015;
Heederik et al., 2011; Radon et al., 2007; Schinasi et al., 2011). On a national scale, poultry
houses in the Netherlands contribute 13% of the national primary emission of particles with
aerodynamic diameters smaller than 10 µm (PM10). To protect the health of its residents,
maximum PM limit values for ambient air were set by the European Union (European Directive
2008/50/EC), namely: a daily average limit for PM10 of 50 μg m–3 with 35 exceedances allowed
per year, and an annual average limit of 40 μg m–3 for PM10 and 25 μg m–3 for particles with
aerodynamic diameters smaller than 2.5 µm (PM2.5). In the Netherlands, the PM10 limit is
regularly exceeded in the vicinity of animal houses (RIVM, 2014; Van Zanten et al., 2012).
Within a plan of action (Ogink and Aarnink, 2011), PM reduction principles were developed
in the Netherlands into effective, economically feasible, and market-ready systems for the
poultry industry. Within this plan, air cleaning companies were asked to adopt, co-develop,
install, and maintain PM reduction systems inside test locations in collaboration with our
research institute. Furthermore, our institute was responsible for the scientific testing of the
principles under experimental conditions in small-scaled housings. Three of these principles
showed perspective to reduce PM emissions by reducing PM concentrations inside the house: (1)
spraying a thin film of pure rapeseed oil onto the litter, (2) negative air ionization, and (3)
positive air ionization.
With regard to principle (1), some studies related to this principle are available, but they used
1 to 10% oil in water emulsions (instead of pure rapeseed oil) in laying hen houses, and these
were not sprayed onto the litter (Gustafsson and Von Wachenfelt, 2006; Ikeguchi, 2002; Von
Wachenfelt, 1999). Other studies did spray directly onto the litter but their focus was on air

Evaluation of oil spraying systems and air ionization systems in commercial poultry houses
105
quality and bird performance, not on emission abatement (Drost et al., 1999; Griffin and
Vardaman, 1970; McGovern et al., 1999, 2000). Within the plan of action (Ogink and Aarnink,
2011), a fixed oil spraying system, consisting of air pipes and oil pipes fueling spraying nozzles,
was developed and installed inside four rooms of an experimental broiler house (Aarnink et al.,
2011). In that study, which was conducted over four growing cycles, the application of 6 to 24
mL m–2 d–1 could reduce PM10 emission by 48% to 87%, respectively. No effects were found on
ammonia emission nor on the production performance of the broilers. It was recommended that
the maximum rate should be 16 mL m–2 d–1 to prevent adverse effects on broilers' foot‐pad
quality. In a follow-up study (Winkel et al., 2014), the spraying system was extended to twice
the number of nozzles to achieve more uniform spraying. It showed that, when oil was sprayed
every other day, PM10 emission was 44% higher on days after spraying than on spraying days.
The study furthermore confirmed that oil spraying (up to 16 mL m–2 d–1) had no effect on
ammonia emission, bird production performance, nor on the incidence of foot-pad lesions. Also,
no effect on odor emission was found. A third study on oil spraying was carried out in eight
rooms of an experimental aviary house (Winkel et al., 2016). Here, oil was applied to the litter
floor using a hand-held spray gun in rates of 15, 30, or 45 mL m–2 d–1 which reduced PM10
emission with 27%, 62%, and 82%, respectively. Two small but significant negative side-effects
were found: a shift in egg quality towards second class eggs for all oil doses and a worsening of
the plumage condition of the body spot ‘back/wings/tail’ in the 45 mL m–2 d–1 treatment only.
Egg production, plumage soiling, behaviour, and litter quality remained unaffected for all oil
doses tested. From this study, it was recommended to spray oil in aviaries at 15 to 30 mL m–2 d–
1.
With regard to principle (2), two studies have shown that PM can be removed from broiler
house air by negative air ionization by about 40% (Jerez et al., 2013; Ritz et al., 2006). Within
the plan of action (Ogink and Aarnink, 2011), a negative air ionization system was installed
inside two rooms of the same experimental broiler house as used earlier (Aarnink et al., 2011;
Winkel et al., 2014) and tested during two growing cycles (Cambra-López et al., 2009). This
system reduced PM10 emission by 36%, whereas no effects were found on airborne micro-
organisms, ammonia, odor, or bird performance. From that study, it was recommended to
evaluate the results in commercial houses.
In the present study, principle (3) is introduced, which uses a positive polarity to remove PM
from the air, similarly to the principle of negative air ionization. This third principle was not
experimentally tested before.

Chapter 5
106
To establish causality between the PM reduction treatments and response variables, fully
identical rooms were used in the experimental studies into principles (1) and (2), excluding any
variation between rooms as much as possible, except for the varying treatments (according to the
scientific principle of ceteris paribus). In commercial farms, there is much variation in a broad
array of variables related to animal breed, housing design, management practices, and so on.
Hence, the performance under experimental conditions may differ from practical conditions. The
objective of the current work was to evaluate the performance of systems based on principles (1),
(2), and (3) inside full-scale commercial broiler and laying hen farms. This evaluation was a last
step of the plan of action, necessary to adopt PM abatement systems in Dutch regulations and
become officially available for poultry farmers to install them inside their houses. Overall, this
article presents the final technical design and the performance of four PM abatement systems
which were evaluated at eight poultry farms: a fixed oil spraying system (OSF) inside two broiler
farms and one laying hen house), an autonomously driving oil spraying vehicle (OSV) in one
laying hen house, a negative air ionization system (NAI) inside two broiler farms, and a positive
air ionization system (PAI) inside two laying hen houses. On the basis of this work, emission
reduction factors of the OSF, OSV, and NAI have been adopted in Dutch regulations.
METHODOLOGY
General design of the study
This study used ‘case-control’ designs, following the requirements described in the ‘test
protocol for livestock housing and management systems’ of the VERA organization (VERA,
2011) and the Dutch ‘Protocol for the measurement of fine emissions from housings in animal
production’ (Ogink et al., 2011).
The OSF and NAI systems were each installed at two broiler farms (four in total; B1 through
B4; Table 1), to include between farm variation in the design. Within each of these farms, one
broiler house served as the treatment house and a second, identical, and adjacent house, served as
the control (eight houses in total; Table 1). The treatment and the control were appointed to the
identical houses within a farm randomly. At each farm, six 24-h measurements were scheduled.
At broiler farms B1 and B2 with the OSF system (Table 1), measurements were only scheduled
between day 22 and 42 of the growing cycle, when the oil was sprayed. At broiler farms B3 and
B4 with the NAI system (Table 1), measurements were scheduled over the entire growing cycle,
but more measurements were scheduled in the second half to improve the accuracy for that

Evaluation of oil spraying systems and air ionization systems in commercial poultry houses
107
period, since a major part of the total emission from a growing cycle takes place in the last two
to three weeks (Aarnink et al., 2011; Winkel et al., 2015b).
Table 1Main layout of the poultry houses.
Farm Case-control design a
Evaluation period
Housing characteristics Length ×width; bird places b
Ventilation inlet, exhaust; ventilation capacity
Oil spraying, fixed system (OSF)Broilers 1 (B1)
T vs. C April ’09–Oct. ’09
Litter floor (wood shavings), lines with feed pans and nipple drinkers, hot air blowers
65 × 14 m; 21,500
Side wall inlets, roof and end wall fans; 8.7 m3 h–1 bird–1
Broilers 2(B2)
T vs. C Sept. ’09–Oct. ’10
Same as Broilers 1 52 × 13 m; 14,000
Side wall inlets,roof fans; 6.3 m3 h–1 bird–1
Layers 1(L1)
T Aug. ‘13–May ’14
Litter floor and aviary system with manure belts (forced drying), laying nests, feeders and nipple drinkers
51 × 16 m;12,125
Manure belt aeration (0.7 m3 h–1 bird–1) and side wall inlets, end wall fans; 10.4 m3 h–1 bird–1
Oil spraying, autonomously driving vehicle (OSV)Layers 2(L2)
T Dec. ‘11–Dec ’12
⅓ Litter area, ⅔ elevated slatted floor above manure pit, with laying nests, chain feeders and lines with nipple drinkers
40 × 20 m; 6130
Side wall inlets, end wall fans; 10.1 m3 h–1 bird–1
Negative air ionization system (NAI)Broilers 3(B3)
T vs. C April ’09–Oct. ’09 Same as Broilers 1 and additional
floor heating/cooling system
75 × 20 m; 33,000
Side wall inlets,end wall fans; 7.6 m3 h–1 bird–1
Broilers 4(B4)
T vs. C Sept. ’09–July ’10
Same as Broilers 1 and additional air mixing system (litter drying)
65 × 20 m; 30,000
Side wall inlets and pad cooling (front wall inlets), end wall fans; 10.1 m3 h–1 bird–1
Positive air ionization system (PAI)Layers 3(L3)
T May ‘12–Dec. ’12
Same as Layers 2 (floor housing) 72 × 12 m; 7420
Side wall inlets,end wall fans; 6.1 m3 h–1 bird–1
Layers 4(L4)
T May ‘12–Dec. ’12
Same as Layers 1 (aviary housing)
55 × 17 m; 15,100
Manure belt aeration (0.2 m3 h–1 bird–1) and side wall inlets, end wall fans; 11.8 m3 h–1 bird–1
a T: treatment house. C: control house. Note that at each broiler farm a system was installed inside a treatment house, whereas an identical house served as the control house. At each layer farm a system was installed inside one house and this house also served as the control house (with the system turned off).b Bird places: number of birds placed in the building following applicable legislation on stocking density.
The OSF, OSV, and PAI systems could not be tested using treatment houses and control
houses for laying hen houses, because laying hen farms with fully identical houses could not be
found. Instead, these systems were installed inside one house per farm (L1 through L4; Table 1)
and a case-control approach was created by performing a 24-h measurement with the system

Chapter 5
108
turned off (from noon on day 1 to noon on day 2), followed by a measurement with the system
turned on (from noon on day 2 to noon on day 3). The OSF and OSV were each installed in one
farm, whereas the PAI was installed in two farms. At each of the laying hen farms, six of these
three-day measurement periods were scheduled, spread over the year (about once every two
months) and the laying period of the hens.
At the exhaust points inside the buildings, approximately 2 m upstream of the ventilators in
the end walls, measurements were performed of PM10, PM2.5, ammonia, odor, and carbon
dioxide concentration, and air temperature and relative humidity. The inside air at this point was
assumed to be homogenously mixed and representative for the air leaving the building.
Concentrations of PM10, PM2.5, and ammonia were determined either in duplicate (upstream of a
central group of end wall ventilators) or as two single measurements (one sampler upstream of
each of two groups of end wall ventilators). Odor concentration, air temperature, and relative
humidity were determined by single measurements. Upwind of the buildings, within 2 m from an
inlet, single measurements were done of PM10, PM2.5, ammonia, and carbon dioxide
concentrations, and of air temperature and relative humidity. In B1, B2, B3, B4, L1, and L2 the
full set of variables was included in the sampling strategy. Since the results at these houses
showed that the NAI system did not affect air quality variables other than PM, ammonia and
odor concentrations were excluded from the sampling strategy for the PAI inside L3 and L4.
Each measurement lasted 24 h. Bird performance variables were not included in the set of
variables to be measured, because in all studies on the NAI and OSF in broilers so far (Aarnink
et al., 2011; Cambra-López et al., 2009; Winkel et al., 2014) no effects were found on these
variables, whereas for the OSF, OSV, and PAI in laying hens, effects were unlikely given the
few treatment days within the case-control approach.
Description of the systems
Oil spraying, fixed system (OSF)
The OSF has been described in earlier articles on the testing of the system under experimental
conditions (Aarnink et al., 2011; Winkel et al., 2014). A schematic of the OSF inside B2 is
presented in Fig. 1 (left). In summary, an air compressor was used to generate air pressure to
both an air pressure vessel and a pressure vessel containing pure rapeseed oil (both vessels are
meant to buffer pressure drops). These components were located outside the animal space, in a
separate room. The air and oil pressure could be set independently by pressure reducing valves
installed between compressor and vessels. From the vessels, an air pressure pipe and an oil

Evaluation of oil spraying systems and air ionization systems in commercial poultry houses
109
pressure pipe, both stainless steel pipes, ran into the animal space fueling spraying nozzles (type
SU26B-SSBR, Spraying Systems, Ridderkerk, the Netherlands). The SU26B-SSBR nozzle has 6
spray openings and produces a wide angle round spray (cone).
Fig. 1Cross-sectional schematic (top) and plane schematic (bottom) of the fixed oil spraying system (OSF) at broilers farms 1 and 2 (left) and of the negative air ionization system (NAI) at broiler farms 3 and 4 (right). Note that a similar fixed oil spraying system was installed in layer farm 1.
In B1, a central set of one air pipe and one oil pipe ran under (i.e., parallel to) the roof ridge
which had 10 nozzles facing each side wall (one pair of nozzles every 6 m; 20 in total; 46 m2 of
floor area per nozzle; air pressure: 3.0 bar, oil pressure: 3.0 bar). In this house, oil was sprayed
from the central axis of the building towards the side walls. In B2, two sets of one air pipe and
one oil pipe were used; one set mounted on each side wall, with 12 nozzles per side (one pair of
nozzles every 4 m; 24 in total; 28 m2 of floor area per nozzle; air pressure: 3.2 bar, oil pressure:
2.8 bar). In this house, oil was sprayed from the side walls to the centre of the building, as drawn

Chapter 5
110
in Fig. 1 (left). A timer was used to simultaneously open the valves in the air and oil pipes once a
day. The programmed oil application rate was 12 mL m–2 day–1 in both B1 and B2, and this was
achieved by spraying times of 45 s in B1 and 24 s in B2. Differences in spraying time were due
to differences in the surface area per nozzle and differences in the oil pressure applied to achieve
a spraying pattern of sufficient length. Oil was sprayed from day 22 to the end of each growing
cycle. Inside B1 and B2, the OSF sprayed a fog of oil droplets that filled the entire house and
settled out to the litter, the birds, and any surface. Results from a laboratory study on the SU26B-
SSBR nozzle showed that at 3.0 bar air and oil pressure, the median droplet size is 49 μm, 80%
of the droplets fall within 18 and 157 μm (i.e., the 10- and 90-percentile), and the droplet
velocity is 7.2 m s–1 (Aarnink and Van Hattum, 2009).
Fig. 2A: photo of the oil spraying pattern of the fixed oil spraying system (OSF) inside layer farm 1 (spraying nozzles installed on the vertical aviary frame are circled white). Note that hens were locked inside the aviary during spraying. Furthermore, note that the SU26B-SSBR nozzle produces a wide round spray plume with 6 knobs; individual knobs are to some extent visible in the spraying pattern. B: photo of the oil spraying pattern of the autonomously driving oil spraying vehicle (OSV) applied in layer farm 2 (the OSV is circled white). Note that spraying patterns were determined on tracks of light green paper covering the floor in both photo’s which stain darker where rapeseed oil droplets were applied.

Evaluation of oil spraying systems and air ionization systems in commercial poultry houses
111
In L1, a slightly modified OSF was used. Here, the solid stainless steel pipes were replaced by
flexible tubes for air and oil which were each installed in a loop and remained under pressure
continuously. The nozzles (76 in total) were not installed on the side walls but on the vertical
aviary frames, facing the littered walking isles (Fig. 2B). Instead of using timer-controlled valves
in the main tubes for air and oil, each nozzle had its own timer-controlled valve. Because oil was
sprayed with one nozzle at a time, the flow rates and pressure drops during spraying were very
low, which allowed the use of thinner tubes instead of pipes. The programmed oil application
rate was 15 mL m–2 day–1. The OSF in L1 was in operation during ‘treatment days’ only. Inside
L1, the OSF sprayed oil droplets directly onto the unoccupied litter floor without the fog
reaching the aviary frame or the birds. During spraying, in the early morning, the hens were
locked inside the aviary system (Fig 2B; from the time the lights went off in the evening until
10:00 the next morning), which was the standard procedure at this farm. This also prevented the
hens from being sprayed. The OSF systems were further developed, installed and maintained by
Inter Continental BV (Ysselsteyn, the Netherlands).
Oil spraying, autonomously driving vehicle (OSV)
The prototype oil spraying vehicle (OSV) was the result of a development project carried out
by JOZ BV (Westwoud, the Netherlands). A schematic of the OSV in L2 is shown in Fig. 3.This
OSV was based on an autonomously driving vehicle for slurry scraping (JOZ-Tech type JT-100)
which was transformed into a vehicle suitable for pure rapeseed oil spraying in laying hen
houses. The body of the OSV measured 1.46 m long, 0.71 m wide, and 0.59 m high, weighed
410 kg, and drove on three foam filled tires: one centrally placed front wheel for driving/steering
and two rear wheels (one at each side) for stability. The front wheel (turning radius: 180°) was
directed by a 165 W driving motor and a 90 W steering motor which were powered by two
Absorbed Glass Mat (AGM) batteries (12 V, 100 Ah), sufficient for 18 hours of operation. After
driving a route, the OSV returned to a charging station (230 V AC, 5A). The slurry scraper on
the front of the original vehicle was replaced by a v-shaped frame, designed to gently direct hens
to the sides of the vehicle if necessary. Autonomous navigation took place by means of an
antenna under the vehicle and passive transponders in the floor. The OSV could also be
controlled manually by means of a remote control. The 80 L water tanks inside the original
vehicle were removed and an 8 L oil pressure vessel was installed, next to a mini air compressor.
Filling of the oil tank was done manually. On the rear of the OSV, a horizontal oil pipe was
installed with four nozzles 0.20 m spaced apart. Oil was applied directly behind the OSV without
spraying onto the hens (Fig. 2B).

Chapter 5
112
Fig. 3Cross-sectional schematic (top) and plane schematic (bottom) of the autonomously driving oil spraying vehicle (OSV) inside layer farm 1.
After completion of a working prototype, preliminary driving tests inside the experimental
aviary house, described by Winkel et al. (2016), showed that communication between antenna
and transponders was not distorted by the presence of a litter layer up to 0.1 m. Preliminary
spraying tests showed that four instead of two nozzles were needed on the rear spraying pipe to
distribute the oil evenly across a spraying width of approximately 0.9 m. For the OSV, nozzles of

Evaluation of oil spraying systems and air ionization systems in commercial poultry houses
113
the type SU13-SSBR (Spraying Systems, Ridderkerk, the Netherlands) were chosen because
they could produce a spray of fine droplets even at low air and oil pressures (see Fig. 2B for the
spraying pattern). The oil application rate could be adjusted by means of pressure reducing
valves for air and oil pressure in steps of 0.02 bar. Inside L2, transponders were drilled in the
concrete floor and a charging station was placed inside a wooden box, accessible for the OSV
through a front opening with vertical plastic flaps to keep out the hens. Air and oil pressure were
programmed at 0.17 and 0.45 bar respectively, equivalent with an oil application rate of 30 mL
m–2 (4590 mL in total; litter area: 153 m2). On spraying days, the OSV drove a 110 m trajectory
once at a speed of 3 m min–1 (total driving time: 35 to 40 min), starting at 10:00 in the morning.
The OSV was in operation during ‘treatment days’ only.
Negative air ionization system (NAI)
The NAI has been described in an earlier article about the testing of the system under
experimental conditions (Cambra-López et al., 2009) and is also known as the Electrostatic
Space Charge System (ESCS) or the Electrostatic Particle Ionization (EPI) system (U.S. Patent
No. 6,126,722; Baumgartner Environics, Inc., Olivia, Minn., USA). This system has been
installed and maintained inside B3 and B4 throughout the present study by Inter Continental BV
(Ysselsteyn, the Netherlands). A schematic of the NAI is presented in Fig. 1 (right). In summary,
the system was composed of electrode wires with sharp pins that ran parallel to the longitudinal
axis of the building, 0.15 to 0.30 m below the ceiling. A voltage of -30 kV was applied to the
electrode wires by means of a power supply, limited to a maximum current of 2 mA. This causes
electron emission from the wires, gas ionization, and subsequent charging of particles. These
particles then travel to any grounded or oppositely charged object via the electric field lines that
are created and by air turbulence. Once particles reach the roof surface, or any other surface that
is grounded, they adhere to it and are thus removed from the air. Removal of the dust is done by
frequent wet cleaning (in between flocks). Inside the treatment house of B3 and B4, nine
electrode wires were installed, each connected to their own power supply. The total length of
electrode wire was approximately 650 m for B3 and 565 m for B4. The total surface area of the
roof was 1587 m2 for B3 and 1350 m2 for B4. The systems were in operation throughout the
growing cycles.

Chapter 5
114
Positive air ionization system (PAI)
The PAI system was developed by ENS Europe BV (Patent No. WO2013070078; Gassel, the
Netherlands). A schematic of this system is presented in Fig. 4 and pictures are shown in Fig. 7.
Fig. 4Cross-sectional schematic (top) and plane schematic (bottom) of the positive air ionization system inside layer farm 4. Note that layer farm 3 had floor housing (see Fig. 3): therefore, in layer farm 3, the dust transport pipe led to the manure pit instead of the manure belt as shown above.
The system was composed of air ionization units mounted from the ridge of the building. This
position was chosen so that the units were in the vortex-shaped longitudinal air stream pattern
through the building (generated by the end wall fans and side wall inlets) which was assumed to
increase the chance that particles in the air encountered the ionization units. In total, eight of

Evaluation of oil spraying systems and air ionization systems in commercial poultry houses
115
these units were installed in both L3 and L4. Each unit consisted of a sheet of stainless steel
(approximately 2 m long and 1 m high) which functioned as grounded collection plate. The total
surface area of the grounded collection plates was (8 units × 2 sides × 2 m in length × 1 m in
height =) 32 m2 in both L3 and L4. On both sides of the sheets, there was a horizontal electrode
connected to a power supply (+30 kV DC), which was limited to a maximum current of 2 mA.
The total length of electrodes was (8 units × 2 sides × 2 m of electrodes = ) 32 m for both L3 and
L4. The working principle of the PAI is very similar to that of the NAI with the exception that
the PAI used a positive polarity (hence, positive ions were created) and the sheets instead of the
ceiling functioned as PM collector. Below the collection plate, there was a dust collection bin
and a dust transport pipe to the manure pit under the raised slatted floor (L3) or to the manure
belt inside the aviary system (L4). The PAI was in operation during ‘treatment days’ only.
Measurements
Particulate matter concentrations
PM10 and PM2.5 concentrations were determined by a filter-based method consisting of
cyclone pre-separators (URG Corp., Chapel Hill, N.C., USA; model URG-2000-30ENB for
PM10 and URG-2000-30 EG for PM2.5), a filter holder (filter: Macherey–Nagel, Düren,
Germany; type GF-3, Ø 47 mm), and air sampling pumps (Tecora, model Charlie HV; Ravebo
B.V., Brielle, the Netherlands) at an air flow rate of 16.7 L min–1. Unloaded and loaded filters
were weighed four times during two consecutive days with a precise balance (Mettler,
Greifensee, Switzerland; AT261 DeltaRange; resolution: 10 µg) at 20 ± 1 °C and 50 ± 5%
relative humidity, following EN 12341 (CEN, 1998) and EN 14907 (CEN, 2005). PM10
concentrations were calibrated to the reference impaction sampler described in EN 12341 using
the equations reported by Zhao, Aarnink, Hofschreuder, and Groot Koerkamp (2009): y = 1.09x
(when x ≤ 223 µg m–3) and y = 0.83x + 57.5 (when x > 223 µg m–3), where x is the concentration
measured with the cyclone sampler and y is the calibrated concentration.
Ammonia concentration
Ammonia concentration was determined by the ‘wet chemical method’ with acid traps (two
impingers in series for a single measurement, with 100 mL of nitric-acid (HNO3) solution at 0.05
M) connected to air sampling pumps (Thomas Industries Inc., Wabasha, MN, USA; model
607CD32) using a critical capillary of 1 L min–1. The ammonium nitrogen content in the solution
was determined by spectrophotometry. The total amount of ammonia was determined by

Chapter 5
116
multiplying the NH4+-N concentration with the mass of the solution and the molecular weight of
ammonia. The flow rate through the impingers was verified at the start and the end of the 24-h
sampling period by an air flow meter (Defender 510-m, Bios Int. Corp, NJ, USA).
Odor and carbon dioxide concentrations
For determination of odor and carbon dioxide concentrations, air samples were taken using
the ‘lung principle’. Separate vessels for odor and carbon dioxide (with 40 L Nalophan air
sampling bags inside, for one time use only) were connected to air sampling pumps (Thomas
Industries Inc., Wabasha, MN; model 607CD32). In this principle, the pump sucks air from the
vessel which causes the sampling bag to be filled with air taken from the sampling position. The
sampling bags for odor were rinsed three times with odorless air before use and during sampling,
the air first passed a dust filter (Savillex Corp., Minnetonka, MN, USA; #1130, Ø 50 mm, 1–2
μm). The air samples for odor were taken between 10:00 and 12:00 using a critical capillary of
0.4 L min–1. The air samples for carbon dioxide were taken during the full 24-h sampling period
using a critical capillary of 0.02 L min–1. The air samples for determination of odor concentration
were transported and stored following EN 13725 (CEN, 2003). Odor concentration (in European
odor units: OUE) was determined in the lab by dynamic olfactometry following European
Standard EN 13725 (test panels with 4 to 6 participants) within 30 h after sampling. The air
samples for determination of carbon dioxide concentration were analysed by gas
chromatography (Interscience/Carlo Erba Instruments Inc., Breda, the Netherlands, GC 8000
Top; column Molsieve 5A; detector: HWD).
Environmental variables
Air temperature (°C) and relative humidity (%) were determined with combined sensors
(Rotronic Instrument Corp., Hauppauge, N.Y.; accuracy of 1,0 °C and 2% relative humidity).
Hourly mean values were stored in a data-logging system (Campbell Scientific Inc., Logan, UT,
USA; types: CR10, CR10X, CR23 and CR23X).
Data preparation and analysis
Estimation of the ventilation rate
The ventilation rate was estimated in all houses by the CO2 balance method which uses the
carbon dioxide produced by the birds as tracer gas. First, the total heat production of one bird
(Φtotal; kW) was calculated based on the body weight (in broilers and layers) and egg production

Evaluation of oil spraying systems and air ionization systems in commercial poultry houses
117
(for layers only), using the equations given by the CIGR (2002), in chapter two. Specific data on
body mass and egg production were obtained from the farmer’s records for each measurement
date. Subsequently, the total heat production was multiplied by a factor (Fco2) of 0.18 m3 CO2 h–
1 kW–1 for layers and broilers up to 500 g body weight and 0.185 m3 CO2 h–1 kW–1 for broilers
heavier than 500 g, as recommended in Table 6 of the paper by Pedersen et al. (2008). The
ventilation rate (Q; m3 h–1 bird–1) was calculated for each measurement within a house using Eq.
1:
6-inlet2exhaust2
2total
10)]CO[-]CO([FcoQ
×
×F= (1)
where [CO2]exhaust is the carbon dioxide concentration measured in the exhaust air (ppm) and
[CO2]inlet the carbon dioxide concentration measured in the inlet air (ppm). Since Q was
estimated on a 24-h basis, the diurnal variation in animal activity was not taken into account.
Calculation of emission rates
Emission rates (E) of PM10, PM2.5, and ammonia were calculated using Eq. 2:
)C-C(QE inletexhaust×= (2)
where Cexhaust is the pollutant concentration measured in the exhaust air and Cinlet the pollutant
concentration measured in the inlet air. For odor, Eq. 2 was applied without correction for
background concentration (Cinlet) because odor concentrations from different sources cannot be
added or subtracted.
Calculation of pollutant reductions
The emission reduction of a pollutant by a system was determined as the difference between
the average emission of the control houses (or the control days), and the average emission of the
treatment houses (or the treatment days), expressed as percentage of the control houses (or the
control days).
Statistical analysis
For all measured variables, differences between treatment houses and control houses, or
between treatment days and control days, were tested for statistical significance with the paired
samples t-test. Relationships between treatment and control for ventilation rate were investigated

Chapter 5
118
by regression analysis. For these procedures, the measurements carried out at one house were
assumed to be statistically independent. All analyses were done using the GenStat software
(VSN, 2014) and probability values ≤0.05 were considered statistically significant.
RESULTS AND DISCUSSION
Oil spraying in broiler houses (OSF)
Results obtained for the OSF in B1 and B2 are shown in Table 2. The statistical analysis
showed that the climate conditions, carbon dioxide concentration, and ventilation rate did not
differ significantly between treatment and control houses, indicating that the test was performed
at a valid basis of comparison. Also, the absence of a significant difference in ventilation rate
indicates that reductions of the emission rate was mainly attributable to reductions of
concentrations (see Eq. 2).
Highly significant reductions were found for emission rates of PM10 and PM2.5. Overall,
spraying 12 mL m–2 d–1 reduced PM10 emission rate by 60% and PM2.5 emission rate by 53%. In
previous work under experimental conditions (Aarnink et al., 2011), the relationship between oil
application rate and PM10 emission (relative to the control; ranging from 0 to 1) could be
described by y = -0.021x + 0.64 (R2 = 0.69), where y is the PM10 emission rate, and x the oil
application rate. Fitting this equation for x = 12 mL m–2 d–1 yields a relative PM10 emission rate
of 0.39 and a reduction of ((1 – 0.39) × 100 =) 61%. The 60% found in the present work fits that
value very well. In previous work under experimental conditions (Aarnink et al., 2011), PM2.5
emission was reduced by values in excess of 75% for all application rates tested. The 53% found
in the current work is substantially lower. There are no apparent differences between the study of
Aarnink et al. (2011) and the present work that might explain this difference; for example: all
houses used stocking densities between 20 to 24 broilers per m2, all houses used wood shavings
as litter, the same type of oil was used, and in all houses, the PM2.5/PM10 ratio was about 0.06. In
agreement to previous work (Aarnink et al., 2011; Winkel et al., 2014), emission rates of
ammonia and odor were not significantly reduced by oil spraying (Table 2).
It should be noted that the reductions in Table 2 only apply to the second half of the growing
cycle, since oil spraying started when the broilers were 22 days old. In a recent emission survey
in the Netherlands, the PM10 emission pattern over the course of a growing cycle for 4
commercial broiler houses could be adequately described by y = 0.0013x2.3855 (R2 = 0.89) where
y is the PM10 emission rate (mg h–1 bird–1) and x is the day number in the growing cycle (Winkel

Evaluation of oil spraying systems and air ionization systems in commercial poultry houses
119
et al., 2015b). When this relationship is fitted for each of the 42 days, and expressed as a
cumulative emission pattern on a relative scale, it can be calculated that 90% of the total mass of
PM10 emitted during a 42-day growing cycle emits between day 22 and 42. Thus, the reduction
of PM10 emission over an entire growing cycle is (61 × 0.90 =) 55%. Using the same method for
PM2.5 (y = 0.00002x2.8032 (R2 = 0.83); Winkel et al., 2015b), yields a reduction of PM2.5 emission
over an entire growing cycle of (53 × 0.93 =) 49%.
Table 2Results of the fixed oil spraying (OSF) system in broiler farms 1 and 2 (SD = standard deviation between measurements; n.s. = not significant). Note that these data were collected in the second half of 6-week growing cycles (oil was sprayed from day 22 to 42) and therefore only apply to that part of a cycle.Variable Broiler
farmn Control
house;Treatment
house;Difference
mean (SD) mean (SD) Mean a Sign.Air temperature (°C) B1 5 24.1 (1.3) 23.5 (1.8) –0.7
B2 5 24.2 (1.8) 25.4 (1.8) 1.2B1 and B2 10 24.2 (1.5) 24.5 (2.0) 0.3 n.s. b
Relative humidity (%) B1 6 63 (14) 67 (13) 4B2 6 66 (18) 69 (9) 3B1 and B2 12 65 (15) 68 (11) 3 n.s. b
CO2 concentration (ppm) B1 6 1488 (179) 1425 (174) –4%B2 6 2130 (745) 2370 (855) 11%B1 and B2 12 1809 (616) 1898 (768) 5% n.s. b
Ventilation rate (m3 h–1 bird–1) B1 6 2.77 (0.84) 2.97 (0.91) 7%B2 6 2.13 (1.52) 1.95 (1.60) –8%B1 and B2 12 2.45 (1.22) 2.46 (1.35) 0% n.s. b
PM10 concentration (μg m–3) B1 6 1559 (327) 423 (134) –73%B2 5 3410 (1444) 2064 (1137) –39%B1 and B2 11 2400 (1350) 1169 (1122) –51% P < 0.001 c
PM10 emission rate (mg h–1 bird–1) B1 6 4.12 (1.11) 1.16 (0.65) –72%B2 5 6.31 (2.60) 3.08 (1.20) –51%B1 and B2 11 5.12 (2.15) 2.03 (1.34) –60% P < 0.001 c
PM2.5 concentration (μg m–3) B1 5 105 (18) 37 (21) –65%B2 5 259 (189) 170 (107) –35%B1 and B2 10 182 (150) 103 (101) –43% P = 0.003 c
PM2.5 emission rate (mg h–1 bird–1) B1 5 0.27 (0.07) 0.09 (0.08) –67%B2 5 0.38 (0.15) 0.22 (0.07) –43%B1 and B2 10 0.33 (0.13) 0.15 (0.10) –53% P < 0.001 c
NH3 concentration (ppm) B1 6 2.95 (2.48) 2.25 (1.68) –24%B2 6 25.4 (13.5) 25.5 (10.6) 1%B1 and B2 12 14.2 (14.9) 13.9 (14.2) –2% n.s. c
NH3 emission rate (mg h–1 bird–1) B1 6 4.95 (3.81) 4.54 (4.43) –8%B2 6 27.0 (2.96) 26.0 (7.17) –4%B1 and B2 12 16.0 (12.0) 15.3 (12.6) –4% n.s. c
Odor concentration (OUE m–3) B1 6 869 (443) 844 (359) –3%B2 6 1109 (551) 988 (392) –11%B1 and B2 12 989 (493) 916 (366) –7% n.s. c
Odor emission rate (OUE s–1 bird–1) B1 6 0.69 (0.39) 0.75 (0.48) 9%B2 6 0.51 (0.19) 0.44 (0.24) –13%B1 and B2 12 0.60 (0.30) 0.60 (0.40) –7% n.s. c
a Reduction of a variable in the treatment house is reflected by a negative mean difference.b Determined by the two-sided paired-samples t-test.c Determined by the one-sided paired-samples t-test.

Chapter 5
120
The OSF functioned as planned throughout the evaluation period. During the first spraying
days, spraying was started manually so that the response of the broilers could be observed, and in
the case of fright reactions or bird piling, spraying could be stopped or lights could be dimmed.
The birds did react with running and vocalizations when the fog of oil droplets suddenly
appeared from the nozzles, but they calmed down again within the 45 seconds of spraying. Based
on the experiences with the OSF systems in B1 and B2, the OSF was further developed in a
number of ways. These developments, incorporated in the OSF in L1, are described in the
Methodology section.
Oil spraying in laying hen houses (OSF and OSV)
Results obtained for the OSF in L1 and the OSV in L2 are shown in Table 3. The statistical
analysis showed that climate conditions, carbon dioxide concentration, and ventilation rate did
not differ significantly between control days and treatment days, indicating that the test took
place at a valid basis of comparison. Also, the absence of a significant difference in ventilation
rate indicates that reductions of the emission rate was attributable to reductions of concentrations
(see Eq. 2).
Highly significant reductions were found for emission rates of PM10 and PM2.5. Spraying 30
mL m–2 d–1 in L1 using the OSV reduced PM10 emission rate by 32% and PM2.5 emission rate by
38%. Spraying 15 mL m–2 d–1 in L1 using the OSF reduced PM10 emission rate by 21% and
PM2.5 emission rate by 31%. These reductions are substantially lower than determined in
previous experimental work in small-scaled aviaries (Winkel et al., 2016). In that study, 30 mL
m–2 d–1 reduced PM10 emission rate with 62% and PM2.5 emission rate with 83%, and for 15 mL
m–2 d–1, these values were 27% and 71%, respectively. In agreement with previous work
(Aarnink et al., 2011; Winkel et al., 2014) and the results in Table 2, emission rates of ammonia
and odor were not significantly reduced by oil spraying.
Two factors probably played a role in the lower PM reductions. First, the OSV and OSF could
not distribute the oil over the entire litter floor area, in contrast to Winkel et al. (2016) where a
hand-held spraying gun was used. Although the OSV created a very equally distributed spraying
pattern (Fig. 2A), it could not drive within 0.8 m from the left side wall in Fig. 3, because of the
presence of rafters protruding from that wall every 2 m. This untreated area made up 20% of the
total litter floor area. A similar issue was encountered with the OSF in L1: here, a total of 78
nozzles was installed on the vertical aviary frames, facing the littered walking isles (Fig. 2B).
This was done to spray the oil directly onto the litter, without reaching the hens (which were

Evaluation of oil spraying systems and air ionization systems in commercial poultry houses
121
Table 3Results of the fixed oil spraying system (OSF) in layer farm 1 and the autonomously driving oil spraying vehicle (OSV) in layer farm 2 (SD = standard deviation between measurements; n.s. = not significant).
Variable Layer farm
n Control days;
Treatment days;
Difference
mean (SD) mean (SD) Mean a Sign.Air temperature (°C) L1 (OSF) 5 21.6 (0.6) 21.8 (0.9) 0.2
L2 (OSV) 4 19.9 (1.1) 19.7 (0.9) –0.2L1 and L2 9 20.8 (1.2) 20.8 (1.4) 0.0 n.s. b
Relative humidity (%) L1 (OSF) 5 76 (16) 64 (5) –13L2 (OSV) 3 78 (0.7) 73 (8) –5L1 and L2 8 77 (13) 68 (8) –9 n.s. b
CO2 concentration (ppm) L1 (OSF) 6 1338 (548) 1367 (476) 2%L2 (OSV) 5 1760 (434) 1933 (264) 10%L1 and L2 11 1530 (524) 1624 (478) 6% n.s. b
Ventilation rate (m3 h–1 bird–1) L1 (OSF) 6 3.73 (2.12) 3.49 (2.00) –7%L2 (OSV) 5 2.07 (0.86) 1.55 (0.35) –25%L1 and L2 11 2.98 (1.82) 2.61 (1.75) –12% n.s. b
PM10 concentration (μg m–3) L1 (OSF) 6 4060 (1065) 3640 (902) –10%L2 (OSV) 5 2860 (687) 2503 (797) –12%L1 and L2 11 3514 (1701) 3123 (1007) –11% P = 0.025 c
PM10 emission rate (mg h–1 bird–1) L1 (OSF) 6 14.3 (7.30) 11.3 (4.79) –21%L2 (OSV) 5 5.49 (1.24) 3.73 (1.16) –32%L1 and L2 11 10.3 (6.96) 7.88 (5.27) –24% P = 0.005 c
PM2.5 concentration (μg m–3) L1 (OSF) 6 261 (100) 212 (53) –19%L2 (OSV) 5 248 (190) 198 (172) –20%L1 and L2 11 255 (140) 206 (115) –19% P = 0.003 c
PM2.5 emission rate (mg h–1 bird–1) L1 (OSF) 6 0.88 (0.50) 0.61 (0.26) –31%L2 (OSV) 5 0.47 (0.40) 0.29 (0.32) –38%L1 and L2 11 0.70 (0.48) 0.46 (0.32) –33% P = 0.002 c
NH3 concentration (ppm) L1 (OSF) 6 8.04 (7.72) 6.83 (5.05) –15%L2 (OSV) 5 42.4 (12.6) 46.7 (8.79) 10%L1 and L2 11 23.7 (20.4) 25.0 (21.8) 5% n.s. c
NH3 emission rate (mg h–1 bird–1) L1 (OSF) 6 14.7 (7.27) 13.3 (8.20) –10%L2 (OSV) 5 56.6 (8.97) 49.1 (3.77) –13%L1 and L2 11 33.8 (23.2) 29.6 (19.8) –12% n.s. c
Odor concentration (OUE m–3) L1 (OSF) 6 610 (513) 743 (486) 22%L2 (OSV) 5 866 (795) 918 (557) 6%L1 and L2 11 713 (612) 813 (493) 14% n.s. c
Odor emission rate (OUE s–1 bird–1) L1 (OSF) 6 0.76 (1.13) 0.86 (0.99) 14%L2 (OSV) 5 0.38 (0.20) 0.34 (0.13) –9%L1 and L2 11 0.61 (0.87) 0.65 (0.79) 8% n.s. c
a Reduction of a variable in the treatment house is reflected by a negative mean difference.b Determined by the two-sided paired-samples t-test.c Determined by the one-sided paired-samples t-test.
temporarily locked inside the aviary frame; Fig. 2B), and to avoid soiling of the aviary frames, as
recommended by Winkel et al. (2016). The drawback of this configuration is that the oil was
applied very locally around the nozzles (Fig 2B) and a substantial part of the litter area was not
directly treated with oil (indirectly, the scratching and dust bathing of the birds may spread
treated litter to not directly treated areas). A second factor probably contributing to lower
reductions in L1 and L2, was the single treatment of the litter by oil (i.e., only on treatment
days), whereas in Winkel et al. (2016) the oil was applied every day for 25 days in a row. It is
likely that, due to the study design, a build-up in the effectivity during the first spraying days was

Chapter 5
122
missed and the reductions reported in Table 3 underestimate those with a prolonged daily
spraying regime.
Several issues were encountered with the prototype OSV that need further development. They
can be summarized as follows:
• Size: the present OSV measured 1.46 m long, 0.71 m wide, and 0.59 m high, and weighed
410 kg. A next version needs to be smaller and lighter. Such prototype would be easier to
handle, needs a smaller battery, should be able to drive under the bottom tier of aviary
frames, and migrate between separated sections or storeys of a laying hen house.
• Maneuverability: in sharp bends, the OSV needed to drive back and forth because its turning
radius was to large. A next version needs to be able to make sharper bends so that it can
change direction in small spaces.
• Grip: the present OSV drove on three foam filled tires which sometimes lacked sufficient
grip on thick (0.05 to 0.20 m) and loose litter layers, or when there were solid cakes of litter.
A next version needs to have better grip on such areas, for instance through use of
caterpillars instead of tires.
• Spraying system: a next version of the OSV may need nozzles on both sides so that oil can
also be sprayed side wards. This might increase the litter surface area that can be reached
without having to drive over that area (such as litter under low bottom tiers of the aviary
frame). Also, the OSV should be able to fill its oil tank autonomously.
Issues encountered with the OSF in L1 included the aforementioned local spraying of nozzles
and problems with soiling of the nozzles with dust and red mites. To increase the litter area
treated with oil, the number of nozzles could be further increased, but this would mean a
substantial increase of the costs for the system. The nozzles installed on metal boxes with timer-
controlled valves inside failed within weeks after installation. The interior of the boxes and
nozzles proved to be soiled with dust and red mites. To solve this problem, the 78 metal boxes
were uninstalled, disassembled, heated in an oven to kill the red mites, cleaned, and assembled
again. In addition, all openings in the metal boxes were sealed off by a sealant.
Overall, the work carried out in L1 and L2 shows that it is very difficult to apply the principle
of oil spraying in a practical, economically feasible, and effective solution. Further technical
optimisations are needed before the OSV and OSF can be used inside commercial floor houses
or aviary houses for laying hens. Once the above described optimisations have been successfully
implemented, the OSV can be an effective and practical means of reducing PM in laying hen
houses.

Evaluation of oil spraying systems and air ionization systems in commercial poultry houses
123
Negative air ionization in broiler houses (NAI)
Results obtained for the NAI in B3 and B4 are shown in Table 4. The statistical analysis
showed that the indoor temperature was significantly lower in the treatment houses. This
difference, however, was small (-0.5 °C) and a big effect of this difference on the emissions is
not expected, since relative humidity, carbon dioxide concentration, and, especially the
ventilation rate, did not differ significantly between treatment and control. The absence of a
significant difference in ventilation rate indicates that reductions of the emission rate was
attributable to reductions of concentrations (see Eq. 2).
Significant reductions were found for emission rates of PM10 (47%) and PM2.5 (63%). It
should be noted that the data in Table 4 were obtained from measurements scheduled mainly
during the second half of the cycle). The data can be balanced by calculating a mean PM
emission rate from three separate means for weeks 1+2, weeks 3+4, and weeks 5+6. This method
yields mean PM10 emission rates of 3.27 and 1.66 mg h–1 bird–1 (reduction: 49%) and mean
PM2.5 emission rates of 0.21 and 0.07 mg h–1 bird–1 (reduction: 68%) for the control houses and
treatment houses, respectively. These reductions are slightly higher than calculated from the
uncorrected data.
The concentration of odor was significantly reduced by 12%. When these odor
concentrations are multiplied with the ventilation rate (Eq. 2), the emission rate was reduced by
9%, which proved no longer significant (P = 0.172). In previous work under experimental
conditions (Cambra-López et al., 2009), PM10 emission was reduced by 36% and no significant
effect of the NAI was found on the emission rate of odor. The significant reduction of odor
concentration found in the present work may be a coincidence, or may represent a true, but small
effect of the NAI. In the case of a true effect, the removal of odor-carrying particles might be
explained by oxidation of odor compounds. The PM removal by the NAI can be ruled out as
working principle, because when sampling odorous air, the particles are filtered out, according
the standard procedure.

Chapter 5
124
Table 4Results of the negative air ionization (NAI) system in broiler farms 3 and 4 (SD = standard deviation between measurements; n.s. = not significant). Note that these data were obtained from measurements that were distributed unevenly over the growing cycle (see the text for the corrected emission rates and removal efficiencies).
Variable Broiler farm n Control house;
Treatment house;
Difference
mean (SD) mean (SD) Mean a Sign.Air temperature (°C) B3 6 25.8 (2.7) 25.3 (2.6) –0.5
B4 4 24.9 (4.0) 24.4 (4.0) –0.5B3 and B4 10 25.4 (3.1) 24.9 (3.0) –0.5 P = 0.003 b
Relative humidity (%) B3 6 70 (8) 65 (5) –4B4 2 69 (10) 67 (12) –2B3 and B4 8 69 (8) 66 (6) –4 n.s. b
CO2 concentration (ppm) B3 6 1679 (954) 1595 (782) –5%B4 6 2108 (550) 1995 (502) –5%B3 and B4 12 1893 (776) 1795 (660) –5% n.s. b
Ventilation rate (m3 h–1 bird–1) B3 6 3.09 (2.81) 2.78 (2.09) –10%B4 6 1.50 (0.96) 1.70 (1.17) 13%B3 and B4 12 2.29 (2.17) 2.24 (1.71) –2% n.s. b
PM10 concentration (μg m–3) B3 6 1274 (422) 756 (177) –41%B4 6 2004 (681) 819 (486) –59%B3 and B4 12 1639 (661) 787 (350) –52% P < 0.001 c
PM10 emission rate (mg h–1 bird–1) B3 6 4.01 (4.73) 2.16 (1.84) –46%B4 6 3.33 (2.66) 1.71 (1.83) –49%B3 and B4 12 3.67 (3.68) 1.93 (1.77) –47% P = 0.012 c
PM2.5 concentration (μg m–3) B3 6 81 (27) 47 (20) –41%B4 6 116 (62) 49 (34) –58%B3 and B4 12 99 (50) 48 (26) –51% P < 0.001 c
PM2.5 emission rate (mg h–1 bird–1) B3 6 0.27 (0.34) 0.08 (0.06) –69%B4 6 0.20 (0.19) 0.09 (0.10) –55%B3 and B4 12 0.23 (0.27) 0.09 (0.08) –63% P = 0.018 c
NH3 concentration (ppm) B3 6 5.12 (4.14) 6.72 (3.47) 31%B4 6 7.54 (4.47) 7.16 (5.40) –5%B3 and B4 12 6.33 (4.30) 6.94 (4.33) 10% n.s. c
NH3 emission rate (mg h–1 bird–1) B3 6 9.57 (8.85) 13.3 (10.6) 39%B4 6 5.87 (2.79) 5.88 (3.07) 0%B3 and B4 12 7.72 (6.55) 9.61 (8.38) 19% n.s. c
Odor concentration (OUE m–3) B3 6 985 (931) 858 (802) –13%B4 6 1521 (721) 1351 (689) –11%B3 and B4 12 1253 (841) 1104 (758) –12% P = 0.042 c
Odor emission rate (OUE s–1 bird–1) B3 6 0.47 (0.36) 0.40 (0.32) –16%B4 6 0.55 (0.34) 0.54 (0.32) –2%B3 and B4 12 0.51 (0.34) 0.47 (0.31) –9 n.s. c
a Reduction of a variable in the treatment house is reflected by a negative mean difference.b Determined by the two-sided paired-samples t-test.c Determined by the one-sided paired-samples t-test.
In agreement with previous work (Cambra-López et al., 2009), emission rate of ammonia was
not significantly reduced by the NAI. Other studies in commercial broiler houses have reported
reductions of 43% for dust (fraction not specified) and 13% for ammonia (Ritz et al., 2006) and
39% for total suspended particles and 17% for ammonia (Jerez et al., 2013). The reductions
(corrected for uneven distribution of measurements over the growing cycle) of 49% for PM10
emission rate and 68% for PM2.5 emission rate are higher than the values of 36% and 10%
respectively, found previously in our experimental work (Cambra-López et al., 2009). This may

Evaluation of oil spraying systems and air ionization systems in commercial poultry houses
125
be due to (1) the electrode wires being closer to the ceiling in the present work, and (2) a better
type of collection area in the commercial broiler houses. The roof of both B3 and B4 was
constructed from roof panels consisting of (from outside to inside): corrugated sheets, insulation
material, and an aluminum coating. In both houses, the sheets of aluminum coatings were extra
grounded to maximize dust collection ability. This may explain why reductions are generally
higher than in previous research, but it does not explain why the PM2.5 reduction was higher than
the PM10 reduction in both B3 and B4 (Table 4). As reported and discussed by Cambra-López et
al. (2009) for indoor air ionization systems, and by Winkel et al. (2015a) for end of pipe
ionization systems, the removal efficiency of ionisers usually increases with increasing particle
size. It is unclear why this seems to be vice versa for the NAI in these commercial broiler farms.
Fig. 5A and C: photos of the ceiling and a feed hopper of the control house of broiler farm 3 on day 32 of the growing cycle. B and D: photos of dust accumulation onto the ceiling and a feed hopper of the treatment house (Negative Air Ionization system; NAI) of the same farm, taken on the same day. Number [1] in photo B marks a small part of the feed hopper where dust was wiped off. Number [2] in photo D marks an electrode wire.

Chapter 5
126
The NAI functioned as planned throughout the evaluation period. PM accumulation to the
ceiling and feed hoppers in the treatment houses was clearly visible (Fig. 5, B and D). The
amperage of the NAI gradually decreased with the build-up of PM on the ceiling because it acted
as an insulating layer. This was counteracted by bringing the electrode wires closer to the ceiling.
Overall, the NAI proved very suitable for reduction of PM emission from broiler houses and no
aspects for further optimization became apparent.
Positive air ionization in laying hen houses
Results obtained for the PAI in L3 and L4 are shown in Table 5. The statistical analysis
showed that the inside relative humidity was significantly lower (5 percentage points) on
treatment days. An additional analysis of the outside relative humidity however, showed no
significant differences (81% relative humidity for control days and 80% relative humidity for
treatment days; P = 0.163). The average carbon dioxide concentrations and ventilation rates also
differed very little (5% or less; not significant). Overall, the test situation can be regarded as a
sufficiently valid basis for comparison. The absence of a significant difference in ventilation rate
indicates that reductions of the emission rate is attributable to reductions of concentrations (see
Eq. 2).
Fig. 6A: photo of the positive air ionization (PAI) system after installation inside layer house 3. B: photo of dust accumulation onto the grounded collection plate and ceiling, running off into the collection bin. Meaning of numbers: [1] = positive electrode wire, [2] = grounded metal collection plate (note clean spots where some of the PM has fallen into the collection bin), [3] = dust collection bin, [4] dust transport pipe to the manure pit under the raised slatted floor.

Evaluation of oil spraying systems and air ionization systems in commercial poultry houses
127
Table 5Results of the positive air ionization (PAI) system in layer farms 3 and 4 (SD = standard deviation between measurements; n.s. = not significant).
Variable Layerfarm
n Control day;
Treatment day;
Difference
mean (SD) mean (SD) Mean a Sign.Air temperature (°C) L3 5 22.7 (2.8) 23.4 (2.0) 0.6
L4 6 24.0 (1.6) 24.1 (1.3) 0.1L3 and L4 11 23.4 (2.2) 23.7 (1.6) 0.3 n.s. b
Relative humidity (%) L3 5 73 (7) 68 (9) –4L4 6 66 (6) 61 (8) –5L3 and L4 11 69 (7) 64 (9) –5 P = 0.007 b
CO2 concentration (ppm) L3 5 1484 (374) 1453 (222) –2%L4 6 1303 (299) 1279 (207) –2%L3 and L4 11 1385 (331) 1358 (222) –2% n.s. b
Ventilation rate (m3 h–1 bird–1) L3 5 2.36 (0.74) 2.35 (0.54) –1%L4 6 3.03 (1.16) 2.87 (0.67) –5%L3 and L4 11 2.73 (1.01) 2.63 (0.65) –4% n.s. b
PM10 concentration (μg m–3) L3 5 3258 (506) 2816 (160) –14%L4 6 5003 (1127) 4865 (331) –3%L3 and L4 11 4210 (1252) 3934 (1100) –7% n.s. c
PM10 emission rate (mg h–1 bird–1) L3 5 7.44 (1.93) 6.54 (1.67) –12%L4 6 14.3 (3.26) 13.7 (2.56) –4%L3 and L4 11 11.2 (4.43) 10.5 (4.31) –6% P = 0.03
PM2.5 concentration (μg m–3) L3 5 247 (88) 197 (60) –20%L4 6 380 (114) 387 (97) 2%L3 and L4 11 320 (120) 300 (126) –6% n.s. c
PM2.5 emission rate (mg h–1 bird–1) L3 5 0.53 (0.13) 0.44 (0.15) –17%L4 6 1.05 (0.36) 1.09 (0.39) 4%L3 and L4 11 0.81 (0.38) 0.79 (0.45) –3% n.s. c
a Reduction of a variable in the treatment house is reflected by a negative mean difference.b Determined by the two-sided paired-samples t-test.c Determined by the one-sided paired-samples t-test.
A small (6%), but significant reduction of the PM10 emission rate was found. PM2.5 emission
rate was not significantly reduced. The system did remove PM from the air, as can be seen from
the PM that adhered to the grounded collection plate and ceiling, and ran off into the collection
bin (Fig. 6). Further analysis showed that, during the first 4 measurements in the first two months
of the evaluation period, the PM10 emission reduction decreased from 27% to 13% in L3 and
from 18% to 4% in L4. After these two months, the PM emission reductions fluctuated around
the 0% level (± 10 percentage points). These results indicate that the system achieved a modest
reduction which faded out after two months.
This modest reduction level might be due to the small size of the system relative to the size of
the houses (only 32 m2 of grounded collection area and 32 m of electrode length per house of
2525 m3 and 7240 birds in L3 and of 3720 m3 and 15,100 birds in L4) and the high PM
concentrations in layers (Table 5). The fading out of the reduction level during the first two
month of testing might be due to pollution of the interior of the laying hen houses with PM. This
pollution may function as an insulating layer which builds up over the course of a production

Chapter 5
128
cycle. In broilers (e.g., B3 and B4), such build up is removed after each cycle of 42 growing
days. Production cycles of laying hens however, last for about 15 months. In conclusion, the
current configuration of the PAI system proved ineffective for PM abatement in laying hen
houses and the issues discussed need optimization for the system to become effective.
Baseline emission rates in control houses
Mean (SD) background concentrations, measured near the inlet of the eight houses of B1
through B4 were: 468 (40) ppm carbon dioxide, 32 (23) µg m–3 PM10, 15 (9) µg m–3 PM2.5, and
0.17 (0.11) ppm ammonia. At L1 through L4, these values were: 511 (44) ppm carbon dioxide,
37 (36) µg m–3 PM10, 11 (10) µg m–3 PM2.5, and 0.25 (0.15) ppm ammonia.
Mean (SD) emission rates from the four control houses of B1 through B4 (corrected for the
unequal distribution of measurements over the growing cycle; by calculating a mean emission
rate from three separate means for weeks 1+2, weeks 3+4, and weeks 5+6) were: 3.23 (3.07) mg
PM10 h–1 bird–1 (equivalent to 28.3 g year–1 bird–1), 0.20 (0.22) mg PM2.5 h–1 bird–1 (equivalent to
1.73 g year–1 bird–1), 9.00 (10.4) mg ammonia h–1 bird–1 (equivalent to 78.8 g year–1 bird–1), and
0.44 (0.32) OUE s–1 bird–1.
Mean (SD) emission rates from L2 and L3 with floor housing (on control days) were 6.47
(1.84) mg PM10 h–1 bird–1 (equivalent to 56.6 g year–1 bird–1), 0.50 (0.28) mg PM2.5 h–1 bird–1
(equivalent to 4.40 g year–1 bird–1), 56.6 (9.0) mg ammonia h–1 bird–1 (equivalent to 496 g year–1
bird–1), and 0.38 (0.20) OUE s–1 bird–1.
Mean (SD) emission rates from L1 and L4 with aviary housing (on control days) were 14.3
(5.39) mg PM10 h–1 bird–1 (equivalent to 125 g year–1 bird–1), 0.97 (0.42) mg PM2.5 h–1 bird–1
(equivalent to 8.46 g year–1 bird–1), 14.7 (7.3) mg ammonia h–1 bird–1 (equivalent to 129 g year–1
bird–1), and 0.76 (1.13) OUE s–1 bird–1.
Comparison of the emission levels above to European emission studies (Groot Koerkamp et
al., 1998; Hayes, Curran, and Dodd, 2006; Ogink and Groot Koerkamp, 2001; Winkel et al.,
2015b) shows that they agree well with earlier reported values. Thus, the evaluation of the four
systems has been carried out at representative emission levels.
The study design: considerations
In this study, two case-control designs were used. The first one, applied in broilers houses,
consisted of using two identical houses within a farm, one with the applied system (treatment

Evaluation of oil spraying systems and air ionization systems in commercial poultry houses
129
house), and one without it (control house). In the second control-case design, applied in laying
hen houses, the system was applied only in one house, and control and treatment days were
measured after each other. Ideally, all circumstances (variables) other than those directly related
to the treatment, should be identical between control and treatment. This generally was the case
for important variables as air temperature, relative humidity, carbon dioxide concentration, and
ventilation rate (Tables 2, 3, 4, and 5). In two cases (air temperature for B3 and B4, Table 4; and
relative humidity for L3 and L4, Table 5), statistically significant but small differences were
found.
Of the aforementioned four variables, the ventilation rate can be regarded as the most
important variable not to be different between control and treatment. In Fig. 7, the values for
ventilation rate of all farms in this study are presented for both control and treatment. Linear
regression analysis of the data in Fig 7B showed that the regression coefficient of 1.0577 was not
significantly different from 1 and the intercept of -0.0323 not significantly different from 0.
Hence, the ventilation rate of control and treatment houses closely followed a 1:1 relationship,
which underlines the validity of the study design for the OSF and NAI in broilers. The same
analysis of the data in Fig 7D shows that the regression coefficient of 0.7681 was significantly
different from one (P = 0.036) but the intercept of 0.4282 not significantly different from zero.
Furthermore, the R2 is clearly lower for laying hens than for broilers (Fig. 7, B and D). These
findings indicate that measuring at the same days in separate control and treatments houses
provides a more valid basis for comparison than measuring control and treatment at different
periods within the same house. In addition, the OSF and OSV were evaluated in only one house,
whereas the NAI in broilers, the OSF in broilers, and the PAI in layers, were each evaluated in
two farm locations. This further adds uncertainty to the results obtained in this paper for the OSF
and OSV in laying hens.
In the present study, the OSF and NAI were installed inside one of two houses of a farm and
this treatment was not varied between the houses. This means that systematic house effects were
not estimated and corrected for. From a methodological point of view, however, it would have
been most valid to install the systems inside both houses, so that measurements of control and
treatment could not only be done at the same time, but also that the control and treatment could
be exchanged between the houses. In our study, however, the houses were quite identical, so
systematic differences between houses are expected to be low.

Chapter 5
130
Fig. 7A: ventilation rates of control and treatment broiler houses as a function of animal age. B: relationship between ventilation rates of treatment and control houses of broiler farms. C: ventilation rates of layer houses on control and treatments days as a function of the ambient air temperature. D: relationship between ventilation rates on treatment and control days in layer houses.
y = 0.0028x1.9542
R² = 0.7106
0
1
2
3
4
5
0 7 14 21 28 35 42
Vent
ilatio
n ra
te (m
3h–
1bi
rd–1
)
Day in growing cycle
B1 (OSF) - Treatment B1 (OSF) - Control
B2 (OSF) - Treatment B2 (OSF) - Control
B3 (NAI) - Treatment B3 (NAI) - Control
B4 (NAI) - Treatment B4 (NAI) - Control
y = 1.0557x - 0.0323R² = 0.9539
0
1
2
3
4
5
0 1 2 3 4 5
Vent
ilatio
n ra
te, t
reat
men
t hou
se (m
3h–
1bi
rd–1
)
Ventilation rate, control house (m3 h–1 bird–1)
B1 (OSP) B2 (OSP)
B3 (NAI) B4 (NAI)
y = x
A B
y = 1.1586e0.0693x
R² = 0.6711
0
2
4
6
8
-5 0 5 10 15 20
Vent
ilatio
n ra
te (m
3h–
1bi
rd–1
)
Ambient temperature (°C)
L1 (OSF) - Treatment L1 (OSF) - Control
L2 (OSV) - Treatment L2 (OSV) - Control
L3 (PAI) - Treatment L3 (PAI) - Control
L4 (PAI) - Treatment L4 (PAI) - Control
C
y = 0.7681x + 0.4282R² = 0.7354
0
2
4
6
8
0 2 4 6 8
Vent
ilatio
n ra
te, t
reat
men
t day
(m3
h–1
bird
–1)
Ventilation rate, control day (m3 h–1 bird–1)
L1 (OSF) L2 (OSV)
L3 (PAI) L4 (PAI)
y = x
D

Evaluation of oil spraying systems and air ionization systems in commercial poultry houses
131
CONCLUSIONS
In this study, we evaluated the performance of four systems for abatement of particulate
emission inside commercial poultry houses: a fixed oil spraying system (OSF) inside two broiler
farms and one laying hen house, an autonomously driving oil spraying vehicle (OSV) in one
laying hen house, a negative air ionization system (NAI) inside two broiler farms, and a positive
air ionization system (PAI) inside two laying hen houses. Our main results and conclusions are:
• In commercial broiler farms, spraying 12 mL m–2 d–1 using the OSF reduced PM10 emission
rate by 60% and PM2.5 emission rate by 53%. The reduction of PM10 is similar to previous
experimental work, the reduction of PM2.5 lower (i.e., >75% in previous experimental work).
In broiler houses, the OSF functioned well and effectively reduced PM concentrations and
emissions.
• In commercial laying hen houses, spraying 30 mL m–2 d–1 using the OSV reduced PM10
emission rate by 32% and PM2.5 emission rate by 38%. Spraying 15 mL m–2 d–1 using the
OSF reduced PM10 emission rate by 21% and PM2.5 emission rate by 31%. These reductions
are substantially lower than in previous experimental work, probably because both systems
could not distribute the oil over the entire litter floor area and oil was not sprayed daily for
prolonged periods as done in experimental work.
• Before the OSF and OSV can be used inside commercial aviary houses or floor houses for
laying hens, further technical optimisations are needed. The OSF should be able to spray
more litter surface area and the system should be sealed off to prevent penetration by red
mites. The OSV should be smaller and lighter, have a smaller turning radius, have more grip
on loose litter and on litter cakes (e.g., caterpillars), have nozzles on multiple sides, and be
able to fill its oil tank autonomously.
• This study confirms the results of previous experimental work that oil spraying has no effect
on emission rates of ammonia or odor.
• In commercial broiler farms, the NAI reduced PM10 emission rate by 49% and PM2.5
emission rate by 68%. These reductions are higher than in previous experimental work,
possibly because the ceilings of the commercial houses were better PM collectors. This
study confirms results of previous experimental work that the NAI has no effect on emission
rates of ammonia or odor. The NAI functioned well and effectively reduced PM
concentrations and emissions in broiler houses.
• In commercial laying hen houses, the PAI reduced PM10 emission rate by 6% but did not

Chapter 5
132
reduce PM2.5 emission rate. This low level of reduction was probably caused by the
relatively small size of the system and pollution of the interior of the buildings. At the
current configuration and dimensioning, the NAI is not effective.
ACKNOWLEDGMENTS
This study was financed by the Dutch Ministry of Economic Affairs and the Dutch Ministry
of Infrastructure and the Environment. We are grateful to the participating poultry farmers for
allowing the use of their farms as test sites. The companies Inter Continental, JOZ, and ENS
Europe are acknowledged for providing the PM reduction systems. Finally, we thank our
colleagues Mr. Sjoerd Bokma en Mr. Klaas Blanken for their contribution to the development of
the OSV, Mr. Theo van Hattum, Mr. Guus Nijeboer and Mr. Henk Schilder for carrying out the
measurements, Mr. Eef Lovink for maintenance and calibration of measuring equipment, and
Mr. Jean Slangen and Mr. Geert Kupers for carrying out the lab analyses.
REFERENCES
Aarnink, A.J.A., Van Harn, J., Van Hattum, T.G., Zhao, Y., Ogink, N.W.M., 2011. Dust reduction in broiler houses by spraying rapeseed oil. Trans. ASABE 54:1479–1489.
Aarnink, A.J.A., Van Hattum, T.G., 2009. Maatregelen ter vermindering van fijnstofemissie uit de pluimveehouderij. Laproef: karakterisering van olievernevelaars [Measures to reduce fine dust emission from poultry houses. Laboratory study: characterizing oil spraying nozzles; in Dutch, with English summary]. Report 229. Animal Sciences Group, Wageningen University and Research Centre. Lelystad, the Netherlands.
Al Homidan, A., Robertson, J.F., Petchey, A. M., 2003. Review of the effect of ammonia and dust concentrations on broiler performance. World's Poult. Sci. J. 59:340–349.
Borlée, F., Yzermans, C.J., Van Dijk, C.E., Heederik, D.J.J., Smit, L.A.M., 2015. Increased respiratory symptoms in COPD patients living in the vicinity of livestock farms. Eur. Resp. J. 46:1605–1614.
Cambra-López, M., Winkel, A., Van Harn, J., Ogink, N.W.M., Aarnink, A.J.A., 2009. Ionization for reducing particulate matter emissions from poultry houses. Trans. ASABE 52:1757–1771.
CEN, 1998. EN 12341:1998. Air quality - Determination of the PM 10 fraction of suspended particulate matter -Reference method and field test procedure to demonstrate reference equivalence of measurement methods. Comité Européen de Normalisation (CEN; European Committee for Standardization), Brussels, Belgium.
CEN, 2003. EN 13725:2003. Air quality - Determination of odour concentration by dynamic olfactometry. Comité Européen de Normalisation (CEN; European Committee for Standardization), Brussels, Belgium.
CEN., 2005. EN 14907:2005. Ambient air quality - Standard gravimetric measurement method for the determination of the PM2.5 mass fraction of suspended particulate matter. Comité Européen de Normalisation (CEN; European Committee for Standardization), Brussels, Belgium.
CIGR, 2002. 4th Report of working group on climatization of animal houses. Heat and moisture production at animal and house levels (Eds.: S. Pedersen, & K. Sällvik). International Commission of Agricultural Engineering (CIGR), section II.
Drost, H., Beens, N., Dolehghs, B., Ellen, H., Oude Vrielink, H.H.E., 1999. Is fogging water or oil effective in reducing dust concentrations in poultry houses? In: proceedings of the international symposium on dust control in animal production facilities, Aarhus, Denmark, pp. 231–236.
Griffin, J.G., Vardaman, T.H., 1970. Cottonseed oil spray for broiler houses: effects on dust control, Mycoplasma gallisepticum spread and broiler performances. Poult. Sci. 49:1664–1668.
Groot Koerkamp, P.W.G., Metz, J.H.M., Uenk, G.H., Phillips, V.R., Holden, M.R., Sneath, R.W., Short, J.L., White, R.P., Hartung, J., Seedorf, J., Schröder, M., Linkert, K.H., Pedersen, S., Takai, H., Johnsen, J.O., Wathes,

Evaluation of oil spraying systems and air ionization systems in commercial poultry houses
133
C.M., 1998. Concentrations and emissions of ammonia in livestock buildings in Northern Europe. J. Agric. Eng.Res. 70:79–95.
Guarino, M., Caroli, A., Navarotto, P., 1999. Dust concentration and mortality distribution in an enclosed laying house. Trans. ASAE 42:1127–1133.
Gustafsson, G., Von Wachenfelt, E., 2006. Measures against airborne dust in a floor housing system for laying hens. Agricultural Engineering International: the CIGR Ejournal, Vol. VIII, December 2006. Manuscript BC 06 018.
Hayes, E.T., Curran, T.P., Dodd, V.A., 2006. Odour and ammonia emissions from intensive poultry units in Ireland. Biores. Techn. 97:933–939.
Heederik, D.J.J., Opstal-van Winden, A.J.W., Smit, L.A.M., Wouters, I.M., Hooiveld, M., IJzermans, C.J., Van der Sman-de Beer, F., Spreeuwenberg, P.P.M., De Bruin, A., Van Rotterdam, B., 2011. Mogelijke effecten van intensieve-veehouderij op de gezondheid van omwonenden: onderzoek naar potentiële blootstelling en gezondheidsproblemen [Possible effects of intensive livestock production on health of residents: research into possible exposure and health problems; in Dutch]. Institute for Risk Assessment Sciences (IRAS), Utrecht University; Netherlands institute for health services research (NIVEL); National Institute for Public Health and the Environment (RIVM), Utrecht, the Netherlands.
Ikeguchi, A., 2002. Ultra sonic sprayer controlling dust in experimental poultry houses. Agricultural Engineering International: the CIGR Ejournal, Vol. IV, October 2006. Manuscript BC 01 002.
Jerez, S.B., Mukhtar, S., Faulkner, W., Casey, K.D., Borhan, M.S., Smith, R.A., 2013. Evaluation of electrostatic particle ionization and BioCurtain™ technologies to reduce air pollutants from broiler houses. Appl. Eng. Agric.29:975–984.
McGovern, R.H., Feddes, J.J.R., Robinson, F.E., Hanson, J.A., 1999. Growth performance, carcass characteristics, and the incidence of ascites in broilers in response to feed restriction and litter oiling. Poult. Sci. 78:522–528.
McGovern, R.H., Feddes, J.J.R., Robinson, F.E., Hanson, J.A., 2000. Growth, carcass characteristics, and incidence of ascites in broilers exposed to environmental fluctuations and oiled litter. Poult. Sci. 79:324–330.
Ogink, N.W.M., Aarnink, A.J.A., 2011. Plan van aanpak bedrijfsoplossingen voor fijnstofreductie in de pluimveehouderij [Plan of action for particulate matter mitigation solutions in poultry; in Dutch, with English summary]. Report 113. Animal Sciences Group, Wageningen University and Research Centre, Lelystad, the Netherlands.
Ogink, N.W.M., Groot Koerkamp, P.W.G., 2001. Comparison of odour emissions from animal housing systems with low ammonia emission Water Sci. Techn. 44:245–252.
Ogink, N.W.M., Hofschreuder, P., Aarnink, A.J.A., 2011. Protocol voor meting van fijnstofemissie uit huisvestingssystemen in de veehouderij 2010 [Protocol for the measurement of fine emissions from housings in animal production 2010; in Dutch, with English summary]. Report 492. Wageningen University and Research Centre, Livestock Research, Lelystad, the Netherlands.
Omland, Ø., 2002. Exposure and respiratory health in farming in temperate zones - A review of the literature. Ann.Agric. Environ. Med. 9:119–136.
Pedersen, S., Blanes-Vidal, V., Joergensen, H., Chwalibog, A., Haeussermann, A., Heetkamp, M.J.W., Aarnink, A.J.A., 2008. Carbon dioxide production in animal houses: a literature review. Agricultural Engineering International: CIGR Ejournal, Vol. X, December 2008. Manuscript BC 08 008.
Radon, K., Danuser, B., Iversen, M., Jörres, R., Monso, E., Opravil, U., Weber, C., Donham, K.J., Nowak, D., 2001. Respiratory symptoms in European animal farmers. Eur. Respir. J. 17:747–754.
Radon, K., Schulze, A., Ehrenstein, V., van Strien, R.T., Praml, G., Nowak, D., 2007,. Environmental exposure to confined animal feeding operations and respiratory health of neighboring residents. Epidemiology 18:300–308.
Ritz, C.W., Mitchell, B.W., Fairchild, B.D., Czarick Iii, M., Worley, J.W., 2006. Improving in-house air quality in broiler production facilities using an electrostatic space charge system. J. Appl. Poult. Res. 15:333–340.
RIVM, 2014. Annual national emissions of PM10; in total and per sector/source, for 2012. Retrieved February 2014, from http://www.emissieregistratie.nl.
Schinasi, L., Horton, R.A., Guidry, V.T., Wing, S., Marshall, S.W., Morland, K.B., 2011. Air pollution, lung function, and physical symptoms in communities near concentrated swine feeding operations. Epidemiology22:208–215.
Takai, H., Pedersen, S., Johnsen, J.O., Metz, J.H.M., Groot Koerkamp, P.W.G., Uenk, G.H., Phillips, V.R., Holden, M.R., Sneath, R.W., Short, J.L., White, R.P., Hartung, J., Seedorf, J., Schröder, M., Linkert, K.H., Wathes, C. M., 1998. Concentrations and emissions of airborne dust in livestock buildings in Northern Europe. J. Agric.Eng. Res. 70:59–77.
Van Zanten, M.C., Van Alphen, A., Wesseling, J., Mooibroek, D., Nguyen, P.L., Groot Wassink, H., Verbeek, C.,2012. Monitoringsrapportage NSL 2012 [State of affairs of the National Air Quality Cooperation Programme 2012; in Dutch, with English summary]. National Institute for Public Health and the Environment (RIVM),Bilthoven, the Netherlands.
Von Wachenfelt, E. (1999). Dust reduction in alternative production systems for laying hens. In: proceedings of the international symposium on dust control in animal production facilities, Aarhus, Denmark, pp. 261–264.

Chapter 5
134
VERA. (2011). Test protocol for livestock housing and management systems, version 2 / 2011-29-08.Available at: http://www.vera-verification.eu (accessed June 2016).
VSN. (2014). GenStat reference manual (release 17) (Version 17.1.0.14713). Hemel Hempstead, UK. Winkel, A., Cambra-López, M., Groot Koerkamp, P.W.G., Ogink, N.W.M., Aarnink, A.J.A., 2014. Abatement of
particulate matter emission from experimental broiler housings using an optimized oil spraying method. Trans.ASABE 57:1853–1864.
Winkel, A., Mosquera, J., Aarnink, A.J.A., Groot Koerkamp, P.W.G., Ogink, N.W.M., 2015a. Evaluation of a dry filter and an electrostatic precipitator for exhaust air cleaning at commercial non-cage laying hen houses. Biosyst.Eng. 129:212–225.
Winkel, A., Mosquera, J., Groot Koerkamp, P.W.G., Ogink, N.W.M., Aarnink, A.J.A., 2015b. Emissions of particulate matter from animal houses in the Netherlands. Atmos. Environ. 111:202–212.
Winkel, A., Van Riel, J.W., Van Emous, R.A., Aarnink, A.J.A., Groot Koerkamp, P.W.G., Ogink, N.W.M., 2016. Abatement of particulate matter emission from experimental aviary housings for laying hens by spraying rapeseed oil. Poult. Sci, accepted for publication.
Zhao, Y., Aarnink, A.J.A., Hofschreuder, P., Groot Koerkamp, P.W.G., 2009. Evaluation of an impaction and a cyclone pre-separator for sampling high PM10 and PM2.5 concentrations in livestock houses. J. Aerosol Sci.40:868–878.

Chapter 6Evaluation of a dry filter and an electrostatic precipitator for
exhaust air cleaning at commercial non-cage laying hen houses
A. Winkel a, J. Mosquera a, A..J.A. Aarnink a , P.W.G. Groot Koerkamp a,b, and N.W.M. Ogink a
a Wageningen UR Livestock Research, Wageningen, the Netherlandsb Farm Technology Group, Wageningen University, Wageningen, the Netherlands
Biosystems Engineering (2015) 129:212–225
Reprinted with permission from Elsevier Ltd
Available online at: http://dx.doi.org/10.1016/j.biosystemseng.2014.10.006

Chapter 6
136
ABSTRACT
We evaluated the removal performance of two exhaust air cleaning systems for abatement of
particulate matter (PM) emission in poultry houses: a commercially available dry filter (DF) and
a full-scale prototype electrostatic precipitator (ESP). Each system was connected to two
commercial, non-cage laying hen houses: one with aviary housing, the other with floor housing.
At each house, six to nine 24-h measurements were carried out, spread over the year and the
laying cycle. Upstream and downstream of the systems, we measured PM10, PM2.5, and carbon
dioxide concentrations, temperature, and relative humidity. Additional measurements of particle
size distribution only were carried out at the DF of another poultry house. The latter showed that
removal of PM by the DF increased with increasing particle diameter. Mean removal efficiency
of the DF for PM10 was 40.1%, whereas PM2.5 was not significantly removed. The ESP reduced
concentrations of PM10 by an average of 57.0% and concentrations of PM2.5 by an average of
45.3%. For neither of the two systems an effect of upstream PM concentration on removal
performance was found. Results of this study are compared with the available literature and
possibilities to improve removal performance are discussed. The mean (SD between houses)
untreated emissions rate from the non-cage layer houses was 7.81 (4.12) mg PM10 h–1 bird–1 and
0.44 (0.28) mg PM2.5 h–1 bird–1. In conclusion, the evaluated systems show potential to reduce
PM emissions from poultry houses.

Evaluation of a dry filter and an electrostatic precipitator at commercial non-cage laying hen houses
137
NOMENCLATURE
Ca Concentration in the air flow Qa
Ce Pollutant concentration in the air flow Qe
Ct Pollutant concentration in the airflow Qt
CCD Corona Current Density of an electrostatic precipitator (μA m–2 of collection area)CO2 Carbon dioxide[CO2]a Ambient concentration of carbon dioxide (ppm)[CO2]d Concentration of carbon dioxide downstream of the electrostatic precipitator (ppm)[CO2]u Concentration of carbon dioxide upstream of the electrostatic precipitator (ppm)DF Dry filter (also called: impaction curtain)DC Direct currentE PM emission rate (mg h–1 bird–1)EU European UnionESP Electrostatic precipitatorFco2 Factor for conversion of total heat to the volumetric CO2 production by the animal and its manure
(m3 h–1 kW–1)η Particulate matter removal efficiency (%)LU Livestock Unit: 500 kg of live weightn Number of data pointsP Level of significancePa Proportion of ambient air leaked into the downstream air flowPh Proportion of poultry house air in the downstream air flowPM Particulate matterPM10 Particulate matter which passes through a size-selective inlet with a 50% efficiency cut-off at 10 μm
aerodynamic diameter (EN 12341)PM2.5 Particulate matter which passes through a size-selective inlet with a 50% efficiency cut-off at 2.5
μm aerodynamic diameter (EN 14907)PMa Ambient particulate matter concentration (µg m–3)PMdc Corrected particulate matter concentration downstream of the electrostatic precipitator (µg m–3)PMdm Particulate matter concentration measured downstream of the electrostatic precipitator (µg m–3)PMu Particulate matter concentration upstream of the dry filter or electrostatic precipitator (µg m–3)Qa Air flow from the ambient environment mixing with Qe to form Qt
Qe Airflow from the electrostatic precipitator entering the sampling ductQt Total airflow leaving the sampling duct downstream of the electrostatic precipitatorSCA Specific collection area of an electrostatic precipitator (m2 per 1000 m3 h–1)SCP Specific corona power of an electrostatic precipitator (W per 1000 m–3 h–1)SD Standard deviationTotal PM All particles that can be collected using filter cassettes (NIOSH method 0500)V Total ventilation rate in the poultry house (m3 h–1 bird–1)Φtotal Total heat production by the animal (kW)

Chapter 6
138
INTRODUCTION
Particulate Matter (PM) can be defined as a complex mixture of tiny solid and liquid particles
suspended in the air (Cambra-López et al., 2010). Upon inhalation, PM can penetrate into the
respiratory system and cause adverse effects on respiratory and cardiovascular health
(Brunekreef and Holgate, 2002). To protect the health of its residents, the European Union has
set daily and annual concentration limits (EU, 2008) for ambient PM with aerodynamic
diameters less than 10 μm (PM10) and 2.5 μm (PM2.5). These limits are exceeded in certain areas
in the Netherlands, including areas with large numbers of livestock farms (RIVM, 2013; Van
Zanten et al., 2012). In the Netherlands, poultry houses are estimated to be responsible for 13%
of the total, primary PM10 emission (RIVM, 2011). Outside the exhausts of poultry houses,
plumes of PM can be found which spread out in detectable concentrations downwind of these
farms (Heederik et al., 2011; Li et al., 2012). In view of this, a research programme was set up in
the Netherlands to develop and evaluate PM mitigation options for the poultry industry (Ogink
and Aarnink, 2011). One of the possible approaches to reduce PM emissions from poultry houses
is to treat the exhaust air by so-called ‘end of pipe’ systems. In several European countries, air
scrubbing (i.e., washing pollutants from the air stream) and biofiltration (i.e., beds or walls filled
with moist organic packing material) are widely used for odor, ammonia and PM mitigation.
Their application in poultry houses, however, can be problematic, because high PM
concentrations cause clogging of these systems (Melse et al., 2012). In recent years, two
alternative end of pipe systems have been introduced into the livestock sector: a dry filter (DF; in
some publications: ‘impaction curtain’) and electrostatic precipitators (ESPs).
The DF is placed as a filter wall between the animal space and the exhaust ventilators and
removes PM by inertial impaction and gravitational settling. The first investigation into the
potential of the DF was published by Lim et al. (2007), who evaluated the system in a cage layer
house. In the following years, more data became available (Demmers et al., 2010; LUFA, 2009;
Mostafa and Buescher, 2011; Ogink et al., 2009). The studies of LUFA (2009) and of Ogink et
al., (2009) however, only consisted of a single measurement in an aviary house for layers,
whereas the study of Mostafa and Buescher (2011) was carried out in a wind tunnel.
Furthermore, the aforementioned studies show a rather high variation in removal efficiency (e.g.,
19.9% to 82% for PM10). Consequently, there is a need to further evaluate the efficacy of the DF
in multiple non-cage laying hen houses over a prolonged period of time.

Evaluation of a dry filter and an electrostatic precipitator at commercial non-cage laying hen houses
139
ESP systems are used in various industrial processes to remove PM from flue gas streams by
electrostatic force. The working principle of ESPs includes five main steps: gas ionization,
particle charging, particle migration, particle collection and PM removal. In ESPs, exhaust air is
forced through a duct containing charging electrodes (usually wires, barbed plates or sharp pins)
and a collection electrode (usually a grounded plate or a cylinder), with a high negative or
positive voltage applied between the two. Close to the charging electrodes, gaseous ions are
created that migrate to the collection electrode by ion wind along the electric field lines and by
turbulent dispersion, thereby transferring their charge to particles they encounter. When charged
particles reach the collection electrode, they are bound to form a PM cake which is removed
periodically by a cleaning step, like washing or rapping (Jaworek et al., 2007; Mizuno, 2000).
Inside animal houses, much research has been done on negative air ionization, e.g., by Cambra-
López et al. (2009). Only few studies have been published on electrostatic treatment of exhaust
air of pig houses (Lau et al. 1996; St. George and Feddes, 1995a, 1995b) or poultry houses (Chai
et al., 2009; Manuzon and Zhao, 2009). The removal efficiencies of the ESPs tested in these
studies varied from 18.6% to over 90%. In four of these studies (Chai et al., 2009; Manuzon and
Zhao, 2009; St. George and Feddes, 1995a, 1995b) a small-scale ESP was tested in a laboratory
setting using several types of dust (e.g., corn starch dust, poultry house dust, pig house dust),
whereas Lau et al. (1996) tested an ESP in combination with internal recirculation inside a pig
house. To our knowledge, no work has been done on full-scale ESPs connected to the exhaust of
commercial poultry houses.
The objective of the present study was to gather insight into the PM removal performance of
the DF and of a recently developed full-scale ESP prototype by evaluating these systems
connected to commercial non-cage layer houses.
METHODOLOGY
General design of the study
The DF and ESP were each connected to two different layer houses. Each system was
investigated at a house with aviary housing and at a house with floor housing. The DF was
evaluated at houses 1 and 2, the ESP at houses 3 and 4. An overview of the main characteristics
of each house is given in Table 1. Houses were large and modern buildings, representative for
the European poultry sector. At these four houses, we performed 24-h measurements of PM10,
PM2.5 and carbon dioxide (CO2) concentrations, temperature, and relative humidity; both

Chapter 6
140
upstream and downstream of the systems. After completion of this evaluation, additional
measurements of particle number concentration in several size ranges were performed upstream
and downstream of a DF at a fifth house for egg-laying broiler breeders (Table 1). At this time,
houses 1 and 2 were no longer available for such measurements. In total, six measurements of
particle size distribution were carried out at house 5 between August and October 2013. These
measurements were carried out during the late morning and afternoon.
The evaluation at houses 1 through 4 was set up in line with the Dutch measurement protocol
for determination of PM emissions from livestock houses (Ogink et al. 2011). For ‘end of pipe’
systems (air scrubbers), this protocol prescribes six measurements per house at two different
locations, spread over the calendar year (in the case of laying hens), to include any between-
house and within-house sources of variation on removal performance. At least 10 out of 12
measurements must be successful, yielding reliable data. An overview of the measuring periods
and the number of measurements for each house are shown in Table 1.
Table 1Main layout of the 5 commercial poultry houses in this study.
House Systemevaluated
Evaluation period and number of measurements
Housing type
Houselength ×width
Number of bird places
Ventilation inlet, exhaust; ventilation capacity; light scheme
1 Dry filter April ‘10–Febr. ‘11 (6)
3-Storey building,floor housing
106 × 23 m 60,000 Side wall inlets and manure belt aeration, end wall fans; 609,600 m3 h–1; lights on from 06:00 to 21:00 (15L:9D)
2 Dry filter May ‘10–Febr. ‘11 (6)
Aviary housing 158 × 12 m 38,860 Side wall inlets and manure belt aeration, side wall fans; 446,400 m3 h–1; lights on from 06:00 to 21:00 (15L:9D)
3 Electrostatic precipitator
Sept. ‘10–Aug. ’11 (10)
2-Storey building,aviary housing
115 × 24 m 93,000 Side wall and ceiling inlets, end wall fans; 437,550 m3 h–1; lights on from 04:30 to 20:00 (15.5L:8.5D)
4 Electrostatic precipitator
Oct. ‘10–Febr. ’11 (6)
Floor housing 100 × 25 m 21,800 Side wall inlets, end wall fans; 177,000 m3 h–1; lights on from 05:00 to 20:00 (15L:9D)
5 Dry filter Aug. ‘13–Oct. ’13 (6)
Floor housing 115 × 25 m 20,000 Side wall and ceiling inlets, side and end wall fans; 404,320 m3 h–
1; lights on from 04:00 to 19:00 (15L:9D)

Evaluation of a dry filter and an electrostatic precipitator at commercial non-cage laying hen houses
141
Description of the dry filter
The DF is a commercially available system of the company Big Dutchman (Vechta,
Germany), named StuffNix. The system is composed of several filter screens, which are
connected to form a filter wall between the dusty animal space and the exhaust ventilators. The
DF material consists of two polyethylene/polypropylene foils connected and folded in such a
way that v-shaped vertical canals exist between the front and rear foils (Fig. 1A). Both foils
contain 25-mm holes; inlet holes in the front foil (Fig. 1A, nr. 2) and outlet holes in the rear foil
(Fig. 1A, nr. 4). These holes are arranged in such a way that the air flow inside the DF is forced
to make a sharp bend, both horizontally and vertically (Fig. 1A, nr. 3). The surface area of the
screens and the volume of air drawn through them by the fans are set to create air velocities near
the screens of approximately 0.5 to 1.5 m s–1 at a pressure difference across the DF of
approximately 30 Pa. Inside the DF, air velocity increases further due to the narrowing of inlet
and outlet holes. As a result of centrifugal force, especially the larger particles are expected to be
removed from the air flow by inertial impaction, whereas small particles tend to behave like
gaseous components, crossing the DF freely (Perry and Green, 1984). Upon impaction, particles
adhere to the DF foils and aggregate (Fig. 1, nr. 3 and 5), fall down inside the canals between the
foils, or sediment to the floor of the rooms. Eventually, PM is removed by frequent (e.g.,
monthly) cleaning of the screens and floors with an industrial vacuum cleaner.
Fig. 1Cross-sectional schematic diagram (a) of a part of the dry filter screen. Photograph (b) of a heavily polluted dry filter screen (view on the downstream side). Meaning of numbers: [1] = upstream air flow polluted with particulate matter; [2] = circular inlet hole in the front foil; [3] = impaction of particles inside the vertical canal of the dry filter;[4] = circular outlet hole in the rear foil; [5] = impaction of particles to the downstream foil; [6] = downstream, cleaned air flow from the dry filter to the ventilator(s).
50 mm
25m
mUpstream
Downstream
(a)
25 mm
[1]
[2]
[3]
[4]
[5]
[6]
[4][5]
(b)

Chapter 6
142
At house 1, a cargo container was installed with a full-scale DF system inside (Fig. 2, left).
This stand-alone functioning container was equipped with two DF screens (3 × 1.3 m each, width
× height; total surface area: 7.8 m2), a roof fan (92 cm diameter; frequency-controlled;
ventilation capacity: 29,000 m3 h–1), a climate computer, and electricity supply. The fan was
programmed at 72% of its ventilation capacity, creating an air velocity near the screens of
approximately 0.7 m s–1. The cargo container was connected to a door in the side wall of the
house, where it took over part of the minimum required ventilation rate normally realized by the
fans present in the house.
Fig. 2Left: schematic plan view of the dry filter system inside a cargo container connected to house 1. Right: one of the two sections with the dry filter system in the side wall of house 2. Note that at house 2, measurements were done in room 2.
House 2 had the DF system since its construction. Halfway the length of each side wall, a
section of the building was equipped with eight DF screens (3 × 2.3 m each, width × height;
surface area: 13.8 m2 per room), setup in such a way that four triangular rooms were present
(Fig. 2, right). The exterior wall of each room contained two pressure fans (91 cm diameter; one
on/off-controlled; ventilation capacity: 19,150 m3 h–1 each). Measurements were only done in
room 2. This room was programmed to ventilate at its maximum capacity. At this dimensioning,
air velocity near the DF screens was approximately 0.8 m s–1. In the exterior wall outside the
rooms, a total of four bypass fans were present (1.3 m diameter, on/off-controlled, v-belt type,
ventilation capacity: 35,000 m3 h–1 each). When ventilation need exceeded the capacity of room
Inside
Out
side
52°
3.0m
Upstream sampling position Downstream sampling position
Side wall ventilator
Dry filter screen
Chicken wirefence
3.0 m
4.0m
Inside
44°
Layer house 2Layer house 1
Outside
2.4 m
5.9m
Roofventilator
Room 1 Room 2 Room 3 Room 4
Legend
Bypasschannel
Bypasschannel
Solid wall Door
Bypassventilator
Bypassventilator

Evaluation of a dry filter and an electrostatic precipitator at commercial non-cage laying hen houses
143
2, the other rooms switched on in subsequent steps. Bypass fans were used incidentally at high
ventilation needs during summer days.
House 5 was equipped with the DF system since its construction as well. The setup of the DF
at this location was very similar to the situation at house 2. At house 5 however, a total of 12
screens (3 × 2.8 m each, width × height; surface area: 16.8 m2 per room) and six downstream
rooms were present (instead of eight screens and four rooms in house 2; Fig. 2, right). Air was
drawn through the DF by a total of 12 pressure fans (92 cm diameter, frequency-controlled,
ventilation capacity: 21,660 m3 h–1 each). At this dimensioning, air velocity near the DF screens
was approximately 0.7 m s–1. In the exterior walls outside the DF rooms, a total of four bypass
fans were present (130 cm diameter, on/off-controlled, v-belt type, ventilation capacity: 36,100
m3 h–1 each) for extra ventilation capacity in summer.
Description of the electrostatic precipitator
A single-stage and wire-to-belt type ESP prototype, recently developed for PM abatement in
fan ventilated poultry houses, was provided by the manufacturer (ENS Europe B.V., Gassel, the
Netherlands). The ESP worked as a stand-alone air cleaning unit and was equipped with (from
inlet tot outlet): a mesh filter with an automatic scraper (Fig. 3, nr. 1) to a collection bin (nr. 2), a
pressure fan (nr. 3; frequency-controlled; ventilation capacity: 27,000 m3 h–1), and one ionization
section (internal dimensions: 3.0 × 0.8 × 0.8 m; length × width × height). Because of the on-
board fan, the ESP could be evaluated at any available poultry house, independently from the
ventilation system present. The mesh filter with scraper was used to prevent the ESP from
overloading by feathers and large particles. Inside the ionization section, particles were
electrically and positively charged by a high voltage unit (Fig. 3, nr. 4; +30 kV DC, 0.2 to 1.0
mA) connected to a rectangular circuit of thin electrode wires (Fig. 3, nr. 5; 0.25 mm diameter,
total length: 6 m), spaced 15 cm above a grounded collecting surface (Fig. 3, nr. 6; a mesh
conveyor belt; 2.4 m2) at the bottom of the ESP duct. The mesh belt was automatically and
regularly cleaned by moving it along a brush mounted above a PM collection bin underneath the
ESP (Fig. 3, nr. 7). The fan was programmed to operate at approximately 20,000 m3 h–1, at which
air velocity was approximately 9 m s–1 and the residence time approximately 0.33 s. The ESP
was connected to layer houses 3 and 4 where it took over part of the ventilation of the fans
present in the house.

Chapter 6
144
Fig. 3Schematic side view of the electrostatic precipitator and the downstream measuring duct which were connected to layer houses 3 and 4. Meaning of numbers: [1] = mesh filter with scraper; [2] = PM collection bin; [3] = ventilator; [4] = power supply; [5] = discharge wire; [6] = grounded collection electrode (conveyor belt); [7] = brush mounted above a PM collection bin; [8] = downstream measuring duct outlet; [9] = upstream sampling position; [10] = downstream sampling position.
Measurements
Following the Dutch measurement protocol (Ogink et al., 2011), 24-h measurements were
carried out at houses 1 through 4, usually from noon to noon. Sampling positions were upstream
and downstream of the systems (Fig. 2 and 3). At these positions, we measured concentrations of
PM10 and PM2.5 in duplicate, next to air temperature and relative humidity (both single
measurements). To be able to measure downstream of the ESP outside layer houses 3 and 4, a
measuring duct was used (Fig. 3). Inside the duct, air velocity was reduced to <2 m s–1 so that
PM could be sampled under isokinetic conditions. We further measured concentrations of CO2 in
duplicate, both upstream and downstream of the systems, for two purposes: to monitor any
leakage of ambient air (with low concentrations of PM and CO2) into the downstream measuring
position, and to estimate the total ventilation rate of the building using the CO2 balance method
(CIGR, 2002; Pedersen et al., 2008). Finally, we measured air temperature and relative humidity
outside the houses (both single measurements).
Inside Outside
ESP
5.0 m
3.0 m
5.0 m
1.8 m
2.5 m
0.9 m
[1] [3]
[2]
[2]
[4]
[5]
[6]
[7]
[7][8]
[9]
[10]
Downstream measuring duct

Evaluation of a dry filter and an electrostatic precipitator at commercial non-cage laying hen houses
145
Particulate matter concentrations
PM10 and PM2.5 concentrations were determined at houses 1 through 4 by gravimetric
filtration, using sampling pumps (Tecora, model Charlie HV; Ravebo B.V., Brielle, the
Netherlands) and cyclone samplers (URG, model URG-2000-30ENB for PM10 and URG-2000-
30EG for PM2.5; URG Corp., Chapel Hill, N.C.) at a sample flow rate of 16.7 L min–1. Inside the
cyclones, the aimed particle size was collected on a glass fiber filter (type GF-3, 47 mm
diameter, Macherey-Nagel, Düren, Germany). Unloaded and loaded filters were weighed with a
precise balance (AT261 DeltaRange, Mettler, Greifensee, Switzerland) under standard
conditions (20 ± 1°C and 50 ± 5% relative humidity; (CEN, 1998, 2005). After 48 h of
stabilization, filters were weighed four times spread over two consecutive days. The average
value was recorded as the filter weight. The PM mass concentration was calculated by dividing
the mass of collected PM by the volume of air drawn through the filter. PM10 concentrations
were calibrated to the reference impaction sampler described in EN 12341 (CEN, 1998) using
the equations reported by Zhao et al. (2009): y = 1.09x (when x ≤223 µg m–3) and y = 0.83x +
57.5 (when x >223 µg m–3), where x is the concentration measured with the cyclone sampler and
y is the calibrated concentration.
Continuous measurements of PM10 concentration upstream and downstream of the DF and
ESP systems were carried out using light-scattering devices (DustTrak aerosol monitor, model
8520, TSI, Inc., Shoreview, Minn.). These data were used to identify time patterns in PM10
concentration and removal performance. Logging interval was set at 1 min and the data were
stored in the memory of the device.
Particle size distribution
To gain insight into the removal efficiency of the DF for different particle sizes, additional
measurements were performed upstream and downstream of a DF at house 5 using a light-
scattering device (Portable Aerosol Spectrometer, model 1.109, GRIMM Aerosol Technique
GmbH & Co. KG, Ainring, Germany). This device yields particle number concentrations for 31
size channels with diameters between 0.25 and >32 µm. One device was used and its position
(downstream or upstream of the DF) was changed every 20 minutes for a total sampling duration
of approximately 3 h per measurement day.
Carbon dioxide concentration
For the measurement of CO2, air was sampled at a constant flow to achieve a 24-h mean
sample using the ‘lung principle’ (vessels with 40 L Nalophan air sampling bags connected to

Chapter 6
146
electrical air pumps; Thomas Industries Inc., Wabasha, Minn.; model 607CD32; critical
capillary: 0.02 L min–1). The pump sucked air from the vessel which caused the sampling bag to
be filled with air taken from the sampling position. Air samples were taken to the lab and
analysed by gas chromatography (Interscience/Carlo Erba Instruments Inc., Breda, the
Netherlands, GC 8000 Top; column Molsieve 5A; detector: HWD).
Environmental variables
Air temperature (T; °C) and relative humidity (RH; %) were measured at houses 1 through 4
with combined sensors for T and RH (Rotronic Instrument Corp., Hauppauge, N.Y.). Hourly
mean values were stored in a data-logging system (Campbell Scientific Inc., Logan, Utah; types:
CR10, CR10X, CR23 and CR23X).
Data preparation and analysis
Estimation of ventilation rate
The total ventilation rate of the building was estimated at houses 1 through 4 using the CO2
balance method. The total heat production of the birds (Φtotal; kW) was calculated based on their
body weight and egg production, as given by CIGR (2002). Specific figures on body mass and
egg production were obtained from the farmer’s records for each measurement. The total heat
production was multiplied by a factor (Fco2) of 0.18 m3 CO2 h–1 kW–1 to yield the CO2
production per hen (including manure), as recommended by (Pedersen et al., 2008). The
ventilation rate (V; m3 h–1 bird–1) was calculated using Eq. 1:
6-a2u2
2total
10)]CO[-]CO([
FcoV
×
×F= (1)
where [CO2]u is the measured concentration of CO2 upstream of the system (ppm), and [CO2]a is
a fixed ambient CO2 concentration as found outside eight layer farms in a recent emission survey
(482 ppm) (Winkel et al., 2015).
Calculation of removal efficiency
Comparison of downstream versus upstream CO2 concentrations of the ESP at houses 3 and 4
showed significantly lower downstream concentrations (Table 2), as a result of ambient air

Evaluation of a dry filter and an electrostatic precipitator at commercial non-cage laying hen houses
147
leaking into the downstream measuring duct through its exhaust opening (Fig. 3, nr. 8). This
situation can be described by Eq. 2:
)CQ()CQ(CQ aaeett ×+×=× (2)
where Qt is the total air flow leaving the exhaust opening of the downstream sampling duct, Ct is
the pollutant concentration in the air flow Qt, Qe is the air flow from the ESP entering the
sampling duct, Ce is the pollutant concentration in the air flow Qe, Qa is the air flow from the
ambient environment mixing with Qe to form Qt, and Ca is the pollutant concentration in the air
flow Qa. Given this situation, and assuming homogenous mixing of Qe and Qa at the downstream
sampling position, we corrected downstream PM concentrations for dilution using the upstream
and downstream CO2 concentrations and the ambient CO2 and PM concentrations. The derived
correction method is described in Eq. 3.1 and Eq. 3.2:
h
aadmdc P
)PMP(-PMPM ×= (3.1)
where PMdc is the corrected downstream PM concentration (µg m–3), PMdm is the measured
downstream PM concentration (µg m–3), PMa is a fixed ambient PM concentration as found
outside eight layer farms in a recent emission survey (55 µg m–3 PM10 and 15 µg m–3 PM2.5)
(Winkel et al., 2015), Pa is the proportion of ambient air leaked into the downstream air flow
(calculated as: Pa = 1 – Ph), and Ph is the proportion of poultry house air in the downstream air
flow. Ph is calculated using Eq. 3.2:
a2u2
a2d2h ]CO[-]CO[
]CO[-]CO[P = (3.2)
where: [CO2]d is the measured downstream CO2 concentration (ppm), [CO2]a is a fixed ambient
CO2 concentration as found outside eight layer farms in a recent emission survey (482 ppm)
(Winkel et al., 2015), and [CO2]u is the measured upstream CO2 concentration (ppm). For the
ESP, PM removal efficiencies were calculated for each measurement as shown in Eq. 4:
100PMPM1
u
dc ×
−=η (4)

Chapter 6
148
where: η is the removal efficiency (%) of a measurement, PMu is the upstream PM concentration
(µg m–3), and PMdc is the corrected downstream PM concentration (µg m–3; see Eq. 2, 3.1, and
3.2). For the DF, PM removal efficiencies were calculated in the same manner, but the measured
downstream concentration was used (i.e., PMdm instead of PMdc in Eq. 4). The overall PM
removal efficiency of a system was calculated as the mean of the individual removal efficiencies
for that system.
Calculation of PM emission rates
Untreated PM emission rates of the houses (E; mg h–1 bird–1; without the application of any
system) were estimated by Eq. 5:
1000)PM-PM(VE au ××= (5)
Furthermore, emission rates were expressed per Livestock Unit (LU; i.e., 500 kg live weight),
using the recorded body weight of the hens.
Statistical analysis
For all measured variables at houses 1 through 4, differences between upstream and
downstream daily mean values were tested for statistical significance with the one-tailed paired
samples t-test. Relationships between removal efficiency and upstream PM concentrations were
investigated by linear regression analysis. For the statistical procedures, we assumed the
measurements carried out at one house to be statistically independent. All analyses were done
using the GenStat software (VSN, 2012) and probability values ≤0.05 were considered
statistically significant.
RESULTS AND DISCUSSION
The dry filter
Measurement conditions
Fig. 4 shows the meteorological conditions and the distribution of measurements over the year
at houses 1 and 2. Ambient air temperature and relative humidity during measurements roughly
followed the long-term trends for the Netherlands, indicating that the DF was evaluated under a
representative range of ambient climate conditions. For one measurement at house 2, no

Evaluation of a dry filter and an electrostatic precipitator at commercial non-cage laying hen houses
149
downstream PM concentrations were available due to a technical problem in PM sampling. In
total, 11 out of 12 scheduled measurements were successful, fulfilling the requirements set in the
PM measurement protocol (Ogink et al., 2011). At both houses, the DF system functioned
according to the pre-set specifications throughout the evaluation period.
Fig. 4Outdoor air temperature (a), outdoor relative humidity (b), distribution of measurements over the year (a and b), and mean ventilation rates (c) (total of bypass/house fans and DF or ESP fans) during the measurements in this study. Blue lines in (a) and (b) represent the trends in long-term daily means for the Netherlands (1981–2010; Royal Netherlands Meteorological Institute).
Table 2Results of measurements carried out upstream and downstream of the dry filter (SD = standard deviation between measurements; n.s. = not significant).
Variable House n Upstream; Downstream; Differencemean (SD) mean (SD) Mean Sign.
Air temperature (°C) 1 5 19.6 (1.1) 19.2 (1.2) -0.32 4 17.6 (3.5) 15.6 (4.9) -2.01 and 2 9 18.7 (2.4) 17.7 (3.5) -1.0 P = 0.041
Relative humidity (%) 1 5 69 (5) 78 (8) 92 4 60 (9) 64 (6) 41 and 2 9 65 (8) 72 (10) 7 P = 0.029
CO2 concentration (ppm) 1 3 1780 (252) 1817 (240) 2.1%2 4 1234 (180) 1360 (278) 10.3%1 and 2 7 1468 (350) 1556 (342) 6.0% n.s.
PM10 concentration (μg m–3) 1 6 2860 (536) 1718 (583) 40.7% a
2 5 2915 (1156) 1767 (854) 39.4% a
1 and 2 11 2885 (824) 1741 (680) 40.1% a P < 0.001PM2.5 concentration (μg m–3) 1 6 147 (42) 147 (36) -4.6% a
2 5 188 (105) 172 (90) 7.1% a
1 and 2 11 166 (75) 158 (64) 0.7% a n.s.a Mean removal efficiencies based on the values obtained from Eq. 4.
Table 2 shows the mean values of variables measured upstream and downstream of the DF.
On passing the DF, the air temperature dropped with 1°C on average, accompanied by a rise in
humidity of on average 7 percentage points. This small change in air characteristics most likely
-10
0
10
20
30
0 50 100 150 200 250 300 350
Ambi
etnt
Air
Tem
pera
ture
(°C
)
Day Number in Calender Year
60
70
80
90
100
0 50 100 150 200 250 300 350
Ambi
etnt
Rel
ativ
e H
umid
ity (%
)
Day Number in Calender Year
y = 1.2652e0.0708x
R² = 0.6193
0
2
4
6
8
10
-10 0 10 20 30
Vent
ilatio
n R
ate
(m3
h-1
hen-
1 )
Ambient Air Temperature (°C)
(a) (b) (c)
DF - Layer house 1 ESP - Layer house 3
DF - Layer house 2 ESP - Layer house 4

Chapter 6
150
represents the normal heat loss of the exhaust air during its way from the core of the building to
the outside environment, where air temperature was usually lower than 19°C to 20°C inside (Fig.
4). Neither in the cargo container setup at house 1, nor in house 2, indications of undesirable
mixing of exhaust and ambient air were detected, as shown by similar upstream and downstream
CO2 concentrations (Table 2).
PM removal performance
Upstream concentrations of PM10 and PM2.5 were about 100-fold of those typically found in
ambient air and representative for layer houses with litter floors (Takai et al., 1998; Winkel et al.,
2015). The mean upstream PM10 concentration amounted 2885 μg m–3 (Table 2) with individual
24-h mean values ranging between 1762 and 4485 μg m–3 (Fig. 5A and 5B).
Fig. 5Removal efficiencies of the dry filter at houses 1 and 2 (a and b) and of the electrostatic precipitator at houses 3 and 4 (c and d) for PM10 and PM2.5 as a function of upstream PM concentration.
y = -2.0038x + 45.876R² = 0.0251
0
20
40
60
80
100
0 1 2 3 4 5
Rem
oval
Effi
cien
cy P
M10
(%)
PM10 Upstream (mg m-3)
y = -1.3738x + 60.773R² = 0.0079
0
20
40
60
80
100
0 1 2 3 4 5 6
PM10 Upstream (mg m-3)
(a) (c)
y = 122.45x - 19.557R² = 0.1978
-40
-20
0
20
40
60
80
100
0.0 0.1 0.2 0.3 0.4
Rem
oval
Effi
cien
cy P
M2.
5 (%
)
PM2.5 Upstream (mg m-3)
(b) y = 83.002x + 30.439R² = 0.0961
0
20
40
60
80
100
0.0 0.1 0.2 0.3
PM2.5 Upstream (mg m-3)
(d)
DF - Layer house 1 ESP - Layer house 3
DF - Layer house 2 ESP - Layer house 4

Evaluation of a dry filter and an electrostatic precipitator at commercial non-cage laying hen houses
151
At these concentrations, mean PM10 removal efficiency was 40.1% (range: 26% to 55%).
Mean PM10 removal efficiencies per house were 40.7% (Standard Deviation (SD): 11.1%) for
house 1 and 39.4% (SD: 10.7%) for house 2. For PM2.5, the mean upstream concentration
amounted 166 μg m–3 with individual 24-h mean values ranging between 93 and 354 μg m–3. The
paired samples t-test on the 11 data pairs showed no significant removal of PM2.5. At house 2,
PM2.5 removal efficiencies were in a narrow range between 2 and 15% (mean: 7.1%, SD: 5.4%),
whereas for house 1 this range was -35% (increase) to 46% (mean: -4.6%; SD: 27.7%). Linear
regression analysis of the data points available in this evaluation study, showed no significant
effect (i.e., regression coefficient) of upstream PM concentration on removal efficiency (Fig. 5A
and 5B).
In Fig. 6, continuous PM10 concentrations and removal efficiencies obtained from DustTrak
measurement are shown as a function of time for two typical 24-h measurements: one
measurement at house 1 (Fig. 6a) and one measurement at house 2 (Fig. 6b). At both houses,
downstream PM10 concentrations were consistently lower than upstream concentrations and a
sharp decline in upstream concentration was found in the evening, when lights were switched
off. For most measurements, removal efficiency dropped during this dark period too at both
houses (Fig. 6a and 6b). This cannot have been caused by a drop in ventilation rate (and air
velocity) since ventilators were operated at a fixed ventilation rate at both houses. Particle re-
entrainment from screens (Fig. 1B) and floors might have compensated the removal of the DF at
low upstream concentrations during dark periods. Alternatively, reduced animal activity during
dark hours might have shifted the particle size distribution towards smaller particles which are
less susceptible to removal by impaction. The lower removal during dark hours will however
hardly affect the 24-h mean mass removal, since this figure is mainly determined by the removal
performance during light periods at high concentrations.
In Table 3, the results of this work are compared with those from previous studies into the
removal efficiency of the DF for poultry PM. From this table, it becomes clear that the mean
PM10 removal of 40.1% found in the present study is in close agreement with the mean removal
levels (33.7% to 46%) found by Lim et al. (2007) in a caged layer house. LUFA (2009) and
Ogink et al. (2009) each carried out a single measurement (during two days and several hours
respectively) in house 2 of the present study. The removal efficiencies of 57.6% reported by
LUFA (2009) and 19.9% reported by Ogink et al. (2009) are only just outside the range of
individual daily mean values in this work (26% to 55%; Fig. 5). Since the DF is based on the
working principle of inertial impaction, particle removal is expected to increase with air velocity

Chapter 6
152
Fig. 6Continuous DustTrak PM10 data of two typical 24-h measurements at the dry filter of house 1 (a) and house 2 (b). Note that no downstream concentration was recorded during approximately 1.5 h in graph (a).
and the diameter (mass) of particles (Perry and Green, 1984). In agreement to this, four out of six
studies summarized in Table 3 show higher removal efficiencies for Total PM than for PM10
(Lim et al., 2007; LUFA, 2009) or for PM10 than for PM2.5 (Demmers et al., 2010). In a study
using a wind tunnel setup, removal efficiencies based on particle number concentrations reached
levels over 80% (Mostafa and Buescher, 2011) and decreased with increasing particle diameter,
as determined in 15 size ranges (Mostafa, 2008). In the study of Demmers et al. (2010) however,
removal efficiency of a DF at a broiler house increased with particle size from ~20% at 1 µm
particle diameter to a maximum of ~78% at 8 µm particle diameter (RVC, 2009). Results of the
PM10 Upstream of the Dry Filter PM10 Downstream of the Dry FilterRemoval efficiency
0
10
20
30
40
50
60
0
1
2
3
4
5
12:00 15:00 18:00 21:00 0:00 3:00 6:00 9:00 12:00R
emov
al E
ffici
ency
(%)
Con
cent
ratio
n PM
10 (m
g m
-3)
Time of the Day
(b)
0
10
20
30
40
50
60
0
1
2
3
4
5
12:00 15:00 18:00 21:00 0:00 3:00 6:00 9:00 12:00
Rem
oval
Effi
cien
cy (%
)
Con
cent
ratio
n PM
10 (m
g m
-3)
Time of the Day
(a)

Evaluation of a dry filter and an electrostatic precipitator at commercial non-cage laying hen houses
153
wind tunnel experiments reported by Mostafa (2008) and Mostafa and Buescher (2011)
therefore, seem to differ from the full-scale tests summarized in Table 3.
Table 3Summary of studies into the PM removal efficiency of the dry filter (n.g.: not given in publication).
First author (year) Country Test situation PM10
upstream(μg m–3)
Airvelocity(m s–1)
PM removalefficiency (%)
Total PM PM10 PM2.5
Lim (2007) USA Layer house, cages;pilot test
655 0.50 66.5 33.7 a -656 0.73 65.5 46.0 a -
Full scale test 500 0.80 - 41.0 b -LUFA (2009) Germany Layer house, aviary 3308 1.59 65.1 57.6 a -Ogink (2009) Germany Layer house, aviary 3309 - - 19.9 a -Demmers (2010) UK Broiler house - - - 64 41Mostafa (2008, 2011) Germany Wind tunnel tests,
layer PMn.g. 0.75 ~28 c ~65 c ~66 c
1.00 65 c ~82 c ~83 c
1.25 ~37 c ~70 c ~76 c
This work Netherlands Layer house, floor 2915 0.65 - 40.7 a 7.1 a
Germany Layer house, aviary 2860 0.65 - 39.4 a 0.1 aa Based on downstream versus upstream mass concentrations.b Based on emission reduction.c Based on downstream versus upstream particle number concentrations.
Possibilities for optimization
Screens and floors were cleaned every four to eight weeks using an industrial vacuum cleaner.
To avoid peak emissions, ventilators were switched off during cleaning. Within a few days after
cleaning however, clear PM accumulation could be seen. The mountain-shaped PM depositions
onto the downstream side of the DF screens in Fig. 1B indicate that part of the PM was
intercepted after these particles had already passed the vertical canals of the DF. Another part of
the PM accumulated on the floor by gravitational settling in layers of millimeters to centimeters
thick. Additional long-term continuous PM measurements may be useful to gain insight into the
removal efficiency of the DF as a function of the degree of dirtiness in time, to determine the
optimal cleaning moment. Cleaning could be further improved trough addition of an automated,
programmable system, such as an industrial vacuum cleaning system. Another approach to
reduce particle resuspension from floors could be the use of slatted floors and PM collection pits
in the rooms between DF screens and ventilators.

Chapter 6
154
Particle Size distribution
Additional measurements of particle number concentrations in several size ranges were
performed upstream and downstream of a DF at house 5. During measurements, air velocity
ranged between 0.5 and 1.6 m s–1. Results of the measurements are shown in Fig. 7. Consistent
with the general principles of impaction (Perry and Green, 1984), removal efficiency increased
with increasing particle diameter between 3 and 20 µm, up to a mean level of approximately
45%. Remarkably, a second peak in removal up to a level of approximately 20% was found for
particles of approximately 1 µm in size. When these particles are truly removed from the air
flow, their impact on the reduction of PM10 will be very small, since these particles have very
little mass. An alternative explanation is that inside the DF multiple ~1 µm particles aggregate to
form few bigger particles. Since particle number concentration was measured, this would lead to
a peak in removal efficiency at ~1 µm, but only in a comparatively smaller drop of the removal
efficiency at larger particle sizes, due to the few extra particles that are generated after
aggregation. In this case, the observed peak might represent a shift in particle size distribution
upon crossing the DF rather than actual particle removal and mass concentration rather than
number concentration should be used for accurate determination of removal efficiency. As
indicated by the standard deviation, the trend in Fig. 7 was reproducible in successive
measurements for particles up to 10 µm. For larger particles, removal was more variable. The
general trend in Fig. 7 is roughly in agreement with the trend of increasing removal efficiency
with increasing particle diameter presented by RVC (2009). In the latter work, however, this
trend was found at a higher level of removal and no peak for ~1 µm particles was found.
Fig. 7Mean removal efficiency of the dry filter at house 5 as a function of particle diameter (bold red line). Black thin lines: mean ± one standard deviation between measurements (n = 6).
-10
0
10
20
30
40
50
60
70
0.1 1.0 10.0
Part
icle
Rem
oval
(%)
Particle Diameter (µm)

Evaluation of a dry filter and an electrostatic precipitator at commercial non-cage laying hen houses
155
The electrostatic precipitator
Measurement conditions
Fig. 4 shows the meteorological conditions and the distribution of measurements over the year
at houses 3 and 4. Ambient temperature and relative humidity during measurements roughly
followed the long-term trends for the Netherlands, indicating that the ESP was evaluated under a
representative range of ambient climate conditions. One measurement at house 3 did not yield a
valid PM10 data pair, whereas one measurement at house 4 did not yield a valid PM2.5 data pair.
Both missing values were a result of technical problems in PM sampling. In total, we collected
15 data pairs for both PM10 and PM2.5 out of 16 scheduled measurements, fulfilling the
requirements set in the PM measurement protocol (Ogink et al., 2011). At both houses, the ESP
system functioned according to the pre-set specifications throughout the evaluation period.
Table 4 shows the mean values of variables measured upstream and downstream of the ESP.
Upon crossing the ESP, CO2 concentration and air temperature decreased, and relative humidity
increased, significantly. Smoke tests revealed that smoke released at the outlet of the duct (Fig.
3, nr. 8) partially re-entered the sampling duct and any breakdown of CO2 by the ESP seems
unlikely. Therefore, leaking of ambient air into the downstream measuring duct can be identified
as the cause for the observed differences between sampling positions. This phenomenon was
reduced as much as possible by applying a long measuring duct (to achieve a laminar flow) and
by using a wind shield, with the exhaust opening facing the ground (preventing wind flow to
enter the duct). All downstream PM concentrations were corrected for ambient air leaking (Eq.
3.1 and Eq. 3.2).
PM removal performance
Upstream of the ESP, mean PM10 concentration amounted 2775 μg m–3 (Table 4) with
individual 24-h mean values ranging between 1565 and 4966 μg m–3 (Fig. 5C and 5D). The mean
upstream PM2.5 concentration amounted 179 μg m–3, and ranged between 98 and 288 μg m–3. At
these concentrations, we found mean removal efficiencies of 57.0% for PM10 and 45.3% for
PM2.5. Mean PM10 removal efficiencies per house were 48.3% (SD: 14.1%) for house 3 and
70.0% (SD: 11.0%) for house 4. For PM2.5, these values were 42.1% (SD: 19.3%) for house 3
and 51.8% (SD: 11.3%) for house 4. Precipitation of PM was visible as a yellowish dust layer on
the collector belt. PM aggregated to coherent sheets onto the collector belt. Although air velocity
and discharge voltage were kept constant, removal efficiencies of individual 24-h measurements
ranged between 28 and 82% for PM10 and between 7 and 75% for PM2.5 (Fig. 5C and 5D). By

Chapter 6
156
linear regression analysis on the data points in this evaluation study, none of this variation could
be explained by a significant effect (i.e., regression coefficient) of upstream PM concentration
(Fig. 5C and 5D). Manuzon and Zhao (2009) also found no effect of poultry house PM
concentrations ranging from 2500 to 5000 µg m–3 on removal efficiency of a commercial ESP in
a laboratory study.
Table 4Results of measurements carried out upstream and downstream of the dry filter (SD = standard deviation between measurements; n.s. = not significant).
Variable House n Upstream; Downstream; Differencemean (SD) mean (SD) Mean Sign.
Air temperature (°C) 3 9 22.4 (1.3) 18.6 (4.7) -3.84 5 20.3 (1.8) 14.7 (3.7) -5.73 and 4 14 21.6 (1.8) 17.1 (4.6) -4.5 P = 0.003
Relative humidity (%) 3 9 67 (2) 77 (10) 10.14 5 71 (5) 83 (15) 11.63 and 4 14 69 (4) 79 (12) 10.7 P < 0.001
CO2 concentration (ppm) 3 10 1361 (512) 1072 (254) -21.2%4 6 2367 (470) 1763 (369) -25.5%3 and 4 16 1738 (695) 1331 (451) -23.4% P < 0.001
PM10 concentration (μg m–3) 3 9 3279 (1107) 1606 (440) a 48.3% b
4 6 2019 (385) 614 (273) a 70.0% b
1 and 2 11 2885 (824) 1741 (680) 40.1% a P < 0.001PM2.5 concentration (μg m–3) 1 6 147 (42) 147 (36) -4.6% a
2 5 188 (105) 172 (90) 7.1% a
1 and 2 11 166 (75) 158 (64) 0.7% a n.s.a Mean removal efficiencies based on the values obtained from Eq. 4.
The finding of this work that the ESP is able to remove layer house PM from exhaust air, is in
agreement with studies which indicate that poultry PM is probably well collectable by ESPs. For
pig house particles, St. George and Feddes (1995a) showed that they can be classified within the
‘medium’ electrical resistivity range (105 to 1011 Ω mm–1), which is considered the ideal range
for electrostatic precipitation. Considering that poultry and pig house particles originate from
comparable organic sources (e.g., feces, skin, feed) (Cambra-López et al., 2011), this is also
likely to be true for poultry PM. Furthermore, ESP systems applied in industry are known to be
least effective for particles with aerodynamic diameters of 0.1 to 1.0 μm, but highly effective for
particles larger than 3 μm (Jaworek et al., 2007; Mizuno, 2000; Perry and Green, 1984), which
represent the main part of particle mass in poultry house air (Cambra-López et al., 2011). In
comparison with several types of PM, poultry house PM was collected more efficiently by an
ESP than inorganic standard road dust (Manuzon and Zhao, 2009), and pig house PM was
collected more efficiently than PM from icing sugar and milk powder, comparable to PM from

Evaluation of a dry filter and an electrostatic precipitator at commercial non-cage laying hen houses
157
corn starch, but less efficient than PM from flour (St. George and Feddes, 1995a). In Table 5, a
summary is provided of the design and results of four studies conducted so far. This table
furthermore describes the design parameters, air flow characteristics, and electrical properties of
the ESPs employed in these studies. From this table it is clear that ESPs with various designs are
able to remove pig and poultry house PM from exhaust air, with efficiencies ranging from 19%
to more than 90%.
Table 5Summary of studies investigating PM removal by electrostatic precipitators for animal house exhaust cleaning (n.g.: not given in publication).
Variable First author (year) Typical valuesindustrialESPs a
St. George (1995b)
Lau (1996)
Chai (2009)
Manuzon (2009)
ThisWork
Study detailsSetup Laboratory Pig house Laboratory Laboratory Layer houses -Type of PM Pig PM Pig PM Corn starch Poultry PM Layer PM VariousPM loading (mg m–3) n.g. 0.6–3.6 6.7–24.5 2.5 / 5.0 2.775
(PM10)1–50g Nm–3
Removal performanceTotal PM (%) 18.6–96.4 b 20–66 c 23–95 d >90% b - >90%PM10 (%) - - - - 57.0 d >90%PM2.5 (%) - - - - 45.3 d >85%ESP design parametersGeneral type Wire-to-plate;
1-stagePlate;2-stage
Wire-to-plate;2-stage
Wire-to-plate;2-stage
Wire-to-belt;1-stage
Various
Discharge electrodes 11 Wires n.g. 10 Wires 9 Wires 2 Wires VariousWire length (m) 0.4 n.g. 0.61 n.g. 3 <9Wire radius (mm) 0.78 n.g. 5 n.g. 0.25 -Collection electrodes 12 Plates Plate 44 Plates 71 Plates Moving belt VariousWire positions to plate Between n.g. Upstream Upstream Above VariousWire-wire spacing (cm) 3 n.g. 5.08 n.g. 27 -Wire-plate spacing (cm) 1.25 n.g. Ca. 50–60 e 15 15 -Plate-plate spacing (cm) 3 n.g. 1.27 0.36 – 20–30Collection surface (m2) 5.28 e n.g. 1.332 n.g. 2.4 500–7500SCA (m2 per 1000 m3 h–1) 1.1–5.4 e n.g. 3.33 e n.g. 0.12 11–45Cleaning principle n.g. Washing Manually n.g. Brushing VariousAir flow characteristicsAir velocity (m s–1) 0.55–0.95 n.g. 1.7 1.25 / 2.5 ~9 0.5–3Air flow rate (m3 h–1) 976–4602 5700 e 400 n.g. 20,000 104–106
Residence time (s) n.g. n.g. 0.0015 n.g. 0.33 1–30Electrical propertiesDischarge voltage (kV) -10.3 to -12.1 13 DC -60 to +60 7 / 10 DC +30 4–100Current (mA) 0.11–3 1.9 n.g. n.g. 0.2–1 -Power (W) 1–36 e 25 e <12 n.g. 6–30 -SCP (W per 1000 m–3 h–1) 0.3–37.2 e 4.3 e 0.2–4.5 e n.g. 0.3–1.5 59–530CCD (μA m–2) 21–568 e n.g 28–140 n.g. 83–417 100–1000
a Values from: Coulson, Richardson, Backhurst, and Harker (1991), Jaworek et al. (2007), Perry and Green (1984),and White (1977).b Based on particle number concentrations.c ESP applied in a recirculation setup inside a finishing pig house; removal efficiency determined as the relative difference between ESP and control room.d Based on particle mass concentrations.e Estimated from information in publication.
Chapter 6
158
Possibilities for optimization
Besides particle characteristics, ESP performance is affected by gas properties and ESP
design parameters. For the ESP evaluated in this work, and for ESPs from previous studies, such
parameters are listed in Table 5, and compared with typical settings of industrial ESPs. From this
table it becomes clear that the ESP evaluated in this work has a conventional discharge wiring,
voltage level and Corona Current Density. Despite that negative voltages may yield higher PM
collection efficiencies at 30 kV (Chai et al., 2009), a positive electrical polarity was chosen by
the manufacturer, because this is believed to cause less undesirable formation of ozone (Chen
and Davidson, 2003; Perry and Green, 1984). The ESP was designed to be connected to fans
already present in the end wall of poultry houses (without the on-board fan, which was only
installed to allow stand-alone functioning). Fans in European poultry houses are mostly of the
on-off controlled type with a constant ventilation rate up to 30,000 m3 h–1. Therefore, in this
study, the ESP fan was evaluated at a constant ventilation rate of 20,000 m3 h–1. Potential
drawbacks of this design approach are that the ESP has a high air velocity (~9 m s–1; which may
cause particle re-entrainment from the collection belt), a low residence time (0.33 s; which may
impede particles to become fully loaded with elementary charges and reach the collection
electrode) and a low Specific Collection Area (0.12 m2 of collector belt area per 1000 m3 h–1).
These aspects might explain why the mean removal of 57.0% for PM10 and 45.3% for PM2.5 is
rather low in comparison to industrial ESPs (Table 5). Performance of the ESP evaluated may be
improved by reducing air velocity, increasing residence time (e.g., by extending the ESP length
or enlarging its cross-sectional area) and by increasing its Specific Collection Area (e.g., by
installing multiple vertical collection belts instead of one horizontal belt). The collection belt in
the ESP was cleaned every 24 h. Manuzon and Zhao (2009) however found that removal of 5 to
10 μm particles dropped from 90% to 85% within 45 minutes after cleaning and removal of
>10μm particles dropped from 90% to 80% in 30 minutes. Therefore, increasing the cleaning
frequency may be a parameter for further study and improvement of removal performance as
well. Finally, when the ESP and the DF are connected to large poultry buildings, they will collect
hundreds of kilograms of PM per year. Consequently, it needs to be determined how the
collected PM can be safely handled and disposed.
PM emissions of layer houses
Total ventilation rates of the houses are shown in Fig. 4C. Ventilation rate increased with
increasing ambient air temperature. Based on the total ventilation rates and PM concentrations

Evaluation of a dry filter and an electrostatic precipitator at commercial non-cage laying hen houses
159
upstream of the systems (Tables 2 and 4), mean (SD between houses) untreated PM10 emission
rate for the non-cage layer houses was 7.81 (4.12) mg h–1 bird–1 (n = 26), equivalent to 2282
(1125) mg h–1 LU–1. Mean (SD between houses) untreated PM2.5 emission rate amounted 0.44
(0.28) mg h–1 bird–1 (n = 26), equivalent to 124 (70) mg h–1 LU–1. The emission rates found here
agree well with those found in eight non-cage layer houses in a recent PM emission survey in the
Netherlands (Winkel et al., 2015).
CONCLUSIONS
In this study, we evaluated the removal performance of a dry filter (DF) and an electrostatic
precipitator (ESP) for end of pipe abatement of particulate matter (PM) emissions by performing
measurements upstream and downstream of these systems installed at commercial non-cage
poultry houses. Our main results and conclusions are:
• The DF effectively reduced concentrations of PM10 in the exhaust air by an average of
40.1%, whereas particles in the PM2.5 fraction were not significantly removed. Mean PM10
removal by the DF was similar between houses: 40.7% (SD: 11.1%) at house 1 and 39.4%
(SD: 10.7%) at house 2. Removal efficiency was not affected by upstream PM
concentration.
• Removal efficiency of the DF increased with increasing particle diameter, as shown by
additional measurements of particle size distribution upstream and downstream of a DF.
This finding is consistant with the first conclusion, the majority of available studies, and the
underlying working principle of inertial impaction.
• The ESP effectively reduced concentrations of PM10 in the exhaust air by an average of
57.0%, and concentrations of PM2.5 by an average of 45.3%. Mean PM10 removal by the
ESP was 48.3 (SD: 14.1%) for house 3 and 70.0% (SD: 11.0%) for house 4. For PM2.5, these
values were 42.1% (SD: 19.3%) for house 3 and 51.8% (SD: 11.3%) for house 4. Removal
efficiency was not affected by upstream PM concentration.
• Removal performance of both the DF and the ESP may be further improved by increasing
the cleaning frequency. The use of slatted floors and dust collection pits downstream of the
DF may prevent emission from particle resuspension. Implementation of industrial ESP
design standards may further improve removal performance of the prototype evaluated.
• The mean (SD between houses) untreated emission rate from the four non-cage laying hen
houses was 7.81 (4.12) mg PM10 h–1 bird–1 and 0.44 (0.28) mg PM2.5 h–1 bird–1. This study

Chapter 6
160
shows that the evaluated systems have potential to reduce these PM emissions.
ACKNOWLEDGMENTS
This study was financed by the Dutch Ministry of Economic Affairs and the Dutch Ministry
of Infrastructure and the Environment. We thank the participating poultry farmers for allowing
the use of their farms as test sites. The companies Big Dutchman and ENS Europe are
acknowledged for providing the DF and EPS systems. We thank our co-workers Mr Theo van
Hattum, Mr Jos Huis in’t Veld, Mr Jorge Jorens Rubio, and Mr Guus Nijeboer for carrying out
the measurements, Mr Eef Lovink for maintenance and calibration of equipment, and Mr Jean
Slangen and Mr Geert Kupers for carrying out the lab analyses.
REFERENCES
Brunekreef, B., Holgate, S.T., 2002. Air pollution and health. Lancet 360:1233–1242.Cambra-López, M., Aarnink, A.J.A., Zhao, Y., Calvet, S., Torres, A.G., 2010. Airborne particulate matter from
livestock production systems: A review of an air pollution problem. Environ. Pollut. 158:1–17.Cambra-López, M., Hermosilla, T., Lai, H.T.L., Aarnink, A.J.A., Ogink, N.W.M., 2011. Particulate matter emitted
from poultry and pig houses: Source identification and quantification. Trans. ASABE 54:629–642. Cambra-López, M., Winkel, A., Van Harn, J., Ogink, N.W. M., Aarnink, A.J.A., 2009. Ionization for reducing
particulate matter emissions from poultry houses. Trans. ASABE 52:1757–1771. CEN, 1998. EN 12341:1998. Air quality - Determination of the PM 10 fraction of suspended particulate matter -
Reference method and field test procedure to demonstrate reference equivalence of measurement methods. European Committee for Standardization (CEN), Brussels, Belgium.
CEN, 2005. EN 14907:2005. Ambient air quality - Standard gravimetric measurement method for the determination of the PM2.5 mass fraction of suspended particulate matter. European Committee for Standardization (CEN),Brussels, Belgium.
Chai, M., Lu, M.M., Keener, T., Khang, S.J., Chaiwatpongsakorn, C., Tisch, J., 2009. Using an improved electrostatic precipitator for poultry dust removal. J. Electrostat. 67:870–875.
Chen, J.H., Davidson, J.H., 2003. Ozone production in the negative DC corona: The dependence of discharge polarity. Plasma Chem. Plasma Process. 23:501–518.
CIGR., 2002. 4th Report of Working Group on Climatization of animal houses. Heat and moisture production at animal and house levels (eds. Pedersen, S. and Sällvik, K.). Int. Commission of Agric. Eng. (CIGR), Section II.
Coulson, J.M., Richardson, J.F., Backhurst, J.R., Harker, J.H., 1991. Coulson & Richardson's Chemical Engineering, Vol. 2: Particle Technology & Separation Processes, 4th ed. Butterworth-Heinemann, Oxford, UK.
Demmers, T.G.M., Saponja, A., Thomas, R., Phillips, G.J., McDonald, A.G., Stagg, S., Bowry, A., Nemitz, E.,2010. Dust and ammonia emissions from UK poultry houses. In: XVII-th World Congress of the Int.Commission of Agric. and Biosyst. Eng. (CIGR), Québec City, Canada.
EU, 2008. Directive 2008/50/EC of the European Parliament and of the Council of 21 May 2008 on ambient air quality and cleaner air for Europe. Offic. J. Europ. Union L152:1–44.
Heederik, D.J.J., Opstal-van Winden, A.J.W., Smit, L.A.M., Wouters, I.M., Hooiveld, M., IJzermans, C.J., van der Sman-de Beer, F., Spreeuwenberg, P.P.M., de Bruin, A., van Rotterdam, B., 2011. Mogelijke effecten van intensieve-veehouderij op de gezondheid van omwonenden: onderzoek naar potentiële blootstelling en gezondheidsproblemen. Institute for Risk Assessment Sciences (IRAS), Universiteit Utrecht; Nederlands instituut voor onderzoek van de gezondheidszorg (NIVEL); Rijksinstituut voor Volksgezondheid en Milieu (RIVM), Utrecht, the Netherlands.
Jaworek, A., Krupa, A., Czech, T., 2007. Modern electrostatic devices and methods for exhaust gas cleaning: A brief review. J. Electrostat. 65:133–155.

Evaluation of a dry filter and an electrostatic precipitator at commercial non-cage laying hen houses
161
Lau, A.K., Vizcarra, A.T., Lo, K.V., Luymes, J., 1996. Recirculation of filtered air in pig barns. Can. Agric. Eng.38:297–304.
Li, Q.F., Wang-Li, L., Walker, J.T., Shah, S.B., Bloomfield, P., Jayanty, R.K.M., 2012. Particulate matter in the vicinity of an egg production facility: Concentrations, statistical distributions, and upwind and downwind comparison. Trans. ASABE 55:1965–1973.
Lim, T.T., Sun, H., Ni, J.Q., Zhao, L., Diehl, C.A., Heber, A.J., Hanni, S.M., 2007. Field tests of a particulate impaction curtain on emissions from a high-rise layer barn. Trans. ASABE 50:1795–1805.
LUFA, 2009. Messbericht über die durchführung von emissionsmessungen [Measurement report on the execution of emission measurements; in German]. LUFA Nord-West, Institut für Boden und Umwelt, Oldenburg, Germany.
Manuzon, R.B., Zhao, L.Y., 2009. Laboratory evaluation and modeling of electrostatic precipitation of PM emissions from poultry buildings. Ashrae Trans. 115: 831–849.
Melse, R.W., Hofschreuder, P., Ogink, N.W.M., 2012. Removal of particulate matter (PM10) by air scrubbers at livestock facilities: results of an on-farm monitoring program. Trans. ASABE 55:689–698.
Mizuno, A., 2000. Electrostatic precipitation. Ieee Trans. Dielectrics Electr. Insul. 7:615–624.Mostafa, E., 2008. Improvement of air quality in laying hens barn using different particle separation techniques.
PhD thesis. Rheinischen Friedrich-Wilhelms-Universität Bonn, Bonn, Germany.Mostafa, E., Buescher, W., 2011. Indoor air quality improvement from particle matters for laying hen poultry
houses. Biosyst. Eng. 109:22–36.Ogink, N.W.M., Aarnink, A.J.A., 2011. Plan van aanpak bedrijfsoplossingen voor fijnstofreductie in de
pluimveehouderij [Plan of action for particulate matter mitigation solutions in poultry; in Dutch, with English summary]. Report 113, Animal Sciences Group, Wageningen University and Research Centre, Lelystad, the Netherlands.
Ogink, N.W.M., Hofschreuder, P., Aarnink, A.J.A., 2011. Protocol for the measurement of fine dust emissions from housings in animal production 2010 [in Dutch]. Report 492, Wageningen UR Livestock Research, . Lelystad, the Netherlands.
Ogink, N.W.M., Van Hattum, T.G., Winkel, A., 2009. Measures to reduce fine dust emission from poultry facilities: indicative evaluation of the Stuffnix system of Big Dutchman [in Dutch, with English summary]. Report 203,Animal Sciences Group, Wageningen University and Research Centre, Lelystad, the Netherlands.
Pedersen, S., Blanes-Vidal, V., Joergensen, H., Chwalibog, A., Haeussermann, A., Heetkamp, M.J.W., Aarnink, A.J.A., 2008. Carbon dioxide production in animal houses: a literature review (Manuscript BC 08 008). Agric.Eng. Int.: CIGR Ejournal X.
Perry, R.H., Green, D., 1984. Perry’s Chemical Engineers’ Handbook (6th ed.). MacGraw-Hill, New York, USA.RIVM, 2011. Annual national emissions of PM10; in total and per sector/source, for 2011 (website). Retrieved 18
June 2013, from http://www.emissieregistratie.nl.RIVM, 2013. Online records of days with a daily mean PM10 concentration exceeding the limit value of 50 µg/m3,
per sampling site in the Dutch National Air Quality Monitoring Network (website). Retrieved 10 July 2013, from http://www.lml.rivm.nl/data/overschrijding/overschrijdingpm10.html.
RVC, 2009. Characterising poultry dust properties, assessing the human health implications, quantifying emission levels and assessing the potential for abatement. Project report, Royal Veterinary College (RVC), Hatfield, Hertfordshire, UK.
St. George, S.D., Feddes, J.J.R., 1995a. Electrical properties of organic and respirable swine dusts. Can. Agric. Eng.37:97–102.
St. George, S.D., Feddes, J.J.R., 1995b. Removal of airborne swine dust by electrostatic precipitation. Can. Agric.Eng. 37:103–107.
Takai, H., Pedersen, S., Johnsen, J.O., Metz, J.H.M., Groot Koerkamp, P.W.G., Uenk, G.H., Phillips, V.R., Holden, M.R., Sneath, R.W., Short, J.L., White, R.P., Hartung, J., Seedorf, J., Schröder, M., Linkert, K.H., Wathes, C.M.,1998. Concentrations and emissions of airborne dust in livestock buildings in Northern Europe. J. Agric. Eng.Res. 70:59–77.
Van Zanten, M.C., Van Alphen, A., Wesseling, J., Mooibroek, D., Nguyen, P.L., Groot Wassink, H., Verbeek, C.,2012. State of affairs of the National Air Quality Cooperation Programme 2012 [in Dutch, with English summary]. National Institute for Public Health and the Environment (RIVM), Bilthoven, the Netherlands.
VSN, 2012. GenStat reference manual (release 15). Version 15.2.0.8821. VSN-Int., Ltd, Hemel Hempstead, UK.White, H.J., 1977. Electrostatic precipitation of fly ash. APCA Reprint Series, Parts I, II, II, and IV. J. Air Pollut.
Contr. Assoc. 27.Winkel, A., Mosquera, J., Groot-Koerkamp, P.W.G., Ogink, N.W.M., Aarnink, A.J.A., 2015. Emissions of
particulate matter from animal houses in the Netherlands. Atmos. Environ.111:202–212.Zhao, Y., Aarnink, A.J.A., Hofschreuder, P., Groot Koerkamp, P.W.G., 2009. Evaluation of an impaction and a
cyclone pre-separator for sampling high PM10 and PM2.5 concentrations in livestock houses. J. Aerosol Sci.40:868–878.


Chapter 7Evaluation of manure drying tunnels to serve as dust filters
in the exhaust of laying hen houses: emissions of
particulate matter, ammonia, and odor
A. Winkel a, J. Mosquera a, A..J.A. Aarnink a, P.W.G. Groot Koerkamp a,b, and N.W.M. Ogink a
a Wageningen UR Livestock Research, Wageningen, the Netherlandsb Farm Technology Group, Wageningen University, Wageningen, the Netherlands
Manuscript submitted to Biosystems Engineering

Chapter 7
164
ABSTRACT
Poultry houses are important emission sources of ammonia, odor, and particulate matter (PM).
Manure drying tunnels (MDTs) might act as ‘end of pipe’ PM filters, but might also emit
additional ammonia and odor. This study aimed to gain insight into this matter (part A and B)
and into the perspective of two strategies to reduce additional emissions: (1) by pre-drying the
manure on the belts inside the house (part C), and (2) by reducing manure accumulation time
(MAT) in the house to 24-h followed by rapid drying inside the MDT (part D). This study was
set up as an emission survey at 16 laying hen farms with a MDT. Results from parts A through C
showed that PM10 removal efficiency of the MDTs increases linearly with manure layer
thickness: from about 35% at 4 cm to 84% at 17 cm. Ammonia and odor concentrations in the
drying air increased substantially upon passing the manure layers, from on average 5.5 to 13.9
ppm ammonia and from 822 to 1178 OUE m–3. In part C, ammonia emission decreased with
increasing DM content of the manure, but even at DM content levels beyond 50%, substantial
ammonia emission remained. In part D, the emission rates of houses and MDTs together were
44% lower for PM10, 20% higher for ammonia, and 40% higher for odor compared with the
theoretical situation of the houses without MDT. Further shortening MAT to 18, 12, or 6 h might
be needed to reduce emissions from MDTs.

Evaluation of manure drying tunnels to serve as dust filters in the exhaust of laying hen houses
165
NOMENCLATURE
CO2 Carbon dioxideCOPD Chronic Obstructive Pulmonary DiseaseDSA Drying surface area of the manure drying tunnel (cm2 bird–1)DT Drying time inside the manure drying tunnel (days or hours)E Emission rate of pollutant (mg h–1 bird–1 or OUE s–1 bird–1)EF Emission factor for ammonia in Dutch regulation (g year–1 bird place–1)Fco2 Factor for conversion of total heat to the volumetric carbon dioxide production by the
animal and its manure (m3 h-1 kW-1)MAT Manure accumulation time: time between a full running cycle of the belts inside the
housing system. Note that at a MAT of 24 hours, the manure has a manure residence time (MRT) of 12 hours
MBA Manure belt aeration; inside the housing systemMDT Manure drying tunnelMLT Manure layer thickness inside the manure drying tunnel (cm)MRT Manure residence time: the time a dropping resides on average on the manure belt inside
the housing systemNH3 AmmoniaOUE European odour unit (EN 17025)P Level of significancePM Particulate matterPM10 Particulate matter which passes through a size-selective inlet with a 50% efficiency cut-off
at 10 μm aerodynamic diameter (EN 12341)PM2.5 Particulate matter which passes through a size-selective inlet with a 50% efficiency cut-off
at 2.5 μm aerodynamic diameter (EN 14907)SD Standard deviationSE Standard errorQdrying Ventilation rate through the MDT (m3 h–1 bird–1)Qbypass Ventilation rate from the poultry house not directed through the MDT (m3 h–1 bird–1):
Qbypass_during_drying + Qbypass_during_loading
Qbypass_during_drying Ventilation rate from the poultry house during drying of the MDT (m3 h–1 bird–1)
Qbypass_during_loading Ventilation rate from the poultry house during loading of the MDT (m3 h–1 bird–1)
Qtotal_during_drying Total ventilation rate of MDT and house during drying (m3 h–1 bird–1): Qdrying +Qbypass_during_drying
Qtotal Total ventilation rate (m3 h–1 bird–1): Qdrying + Qbypass
Φtotal Total heat production by the animal (kW)

Chapter 7
166
INTRODUCTION
In areas with high densities of livestock houses, emissions from poultry houses represent an
important source of airborne pollutants, such as malodorous compounds (Mielcarek and Rzeźnik,
2015; Ogink and Groot Koerkamp, 2001), gaseous ammonia (Groot Koerkamp et al., 1998;
Wood et al., 2015), and particulate matter (PM) (Takai et al., 1998; Winkel et al., 2015b). These
pollutants are associated with adverse effects on the environment and on the health and
wellbeing of residents in these areas. The chronic exposure of residents to odors from nearby
livestock houses may cause an array of physical and emotional complaints, either directly by
exposure to irritant odorants, or indirectly, through mechanisms related to annoyance,
sensitization, stress, and conditioning (Hooiveld et al., 2015; Nimmermark, 2004). Gaseous
ammonia causes acidification and eutrophication of soils and surface waters (ApSimon et al.,
1987), but is also an important precursor of secondary PM (i.e., inorganic, fine, and solid
ammonium nitrate and ammonium sulfate) that is formed through chemical reactions in the
atmosphere (Erisman and Schaap, 2004). The association between secondary PM and adverse
health outcomes has been well established in epidemiological studies, although clinical exposure
studies find no toxicity of ambient levels and causal mechanisms are not well understood
(Brunekreef et al., 2015; Schlesinger, 2007). In contrast to secondary PM, primary PM is emitted
as particles from livestock houses which mainly fall in the size range larger than 2.5 µm (Lai et
al., 2014). It originates from mechanical processes and organic sources inside the house, such as
manure, feathers, and skin debris (Cambra-López et al., 2011), and contains micro-organisms
and pro-inflammatory endotoxins (Seedorf et al., 1998; Zhao et al., 2014). Concentrations of
these particles decrease with increasing distance from the emission point of livestock houses
(Heederik et al., 2011; Li et al., 2012) because they settle out to the ground and impact to
vegetation, but also because they disperse and their concentration becomes diluted with cleaner
air. Fine and course primary particles that remain airborne contribute to background levels of PM
and may cause adverse health effects in residents (Brunekreef and Forsberg, 2005), although
little is known about direct associations between indicators of PM exposure (e.g., number and
distance of farms or a modelled PM exposure) and health of residents. In recent years, a limited
number of studies has been published on this matter, which, so far, suggest both protective and
adverse effects, such as a higher prevalence of pneumonia and more exacerbations in patients
suffering from Chronic Obstructive Pulmonary Disease (COPD) (Borlée et al., 2015; Hooiveld et
al., 2016; O'Connor et al., 2010; Schinasi et al., 2011; Smit et al., 2014).

Evaluation of manure drying tunnels to serve as dust filters in the exhaust of laying hen houses
167
Although ambient PM concentrations in the Netherlands as a whole have decreased in recent
years, exceedances of the European limit values for PM with aerodynamic diameters smaller
than 10 µm (PM10), laid down in EU Directive 2008/50/EC (EU, 2008), are persistent in specific
areas. In addition, PM10 levels in many other areas are only just below the limit values, making
those areas vulnerable for future exceedances (Van Zanten et al., 2014). These two situations
occur in several typical intensive livestock farming areas in the centre and southeast of the
Netherlands where a substantial part of airborne PM10 comes from agriculture in general and
livestock houses in particular (Hendriks et al., 2013; Velders et al., 2008). In the Netherlands as a
whole, about 13% of the national yearly emission of primary PM10 is attributable to poultry
houses (RIVM, 2014).
To facilitate the mitigation of primary PM emissions from poultry farms, an action plan was
set up for the Netherlands (Ogink and Aarnink, 2011). Within the framework of this plan, PM
reduction principles were developed in cooperation with air cleaning companies into effective,
economically feasible, and market-ready systems for the poultry industry. One of the systems
studied was the so called manure drying tunnel (MDT), which could be applied for both manure
drying and filtration of primary PM from the exhaust air of poultry houses. In Dutch regulation
on ammonia emissions from livestock houses, MDTs are allowed only for use in hen-rearing and
hen-laying houses under the requirements that the manure must be pre-dried by manure belt
aeration (MBA) inside the housing system to a dry matter (DM) content of at least 45%, and that
the manure inside the MDT must reach a DM content of at least 80% within 72 hours. The
MDTs have an emission factor (EF) of 2 g year–1 bird place–1 (additional to the housing system;
no EF for odor). The use of a MDT is attractive for poultry farmers because it reduces the
volume and mass of manure to be transported (e.g., to arable farms) and makes the manure more
suitable for burning in biomass power plants or processing into organic fertilizer. This can cut
the costs of manure disposal or even create revenues for poultry farmers.
Inside MDTs, drying takes place by forcing the exhaust air (~20 °C) through layers of pre-
dried droppings spread onto perforated conveyor belts composed of polyethylene/polypropylene
sheets or metal plates/panels. Emission studies on MDTs in the 1990s in the Netherlands (Table
1) suggest that MDTs can substantially reduce PM concentrations in the drying air. Presumably,
dust particles are filtered out by impaction and subsequent adherence to the moist, sticky
droppings when the drying air makes its way through the pores between the droppings. The
studies in Table 1, however, further suggest that this is accompanied with the undesirable release
of gaseous ammonia and odorous compounds.

Chapter 7
168
Table 1Overview of emission studies on manure drying tunnels in the 1990s in the Netherlands (n.d.: not determined or reported).Reference; first author (year)
Housing system; number of birds
Manure beltaeration a
Drying / bypass vent. capacity
Emission, manure drying tunnel b
NH3 Odor PM(m3 h–1 bird–1); manure accumulation time
(m3 h–1 bird–1); drying time
(mg h–1
bird–1)
Demmers (1992)
Battery cages; 33,000 hens
Off; MAT: 2 days 0.9–1.8 / n.d.; DT: 28 h
0.97–2.91 50% increase
70% red.
Uenk (1994)
Battery cages; 33,000 hens
Off; MAT: 5, 18, or 24 h
0.9–1.8 / n.d.;DT: 28–44 h
1.14–5.71 c 100% increase
70% red.
Kroodsma (1996)
Battery cages; 10,525 hens
Yes (unknown); MAT: 4.5 days
1.2 / n.d.;DT: 3.5 days
1.14–1.83 100% increase
n.d.
Groot Koerkamp (1999)
Battery cages; 13,410 hens
No; MAT: 6 h 3.1 / 4.0;DT: 18 h
1.24 n.d. n.d.
Huis in’t Veld (1999)
Aviary; 16,500 hens, 1320 cocks
0.58d; MAT: 3.5 days
0.14 / 9.3;DT: 3.5 days
0.24 e n.d. n.d.
a Manure belt aeration inside the housing system for reduction of ammonia formation; capacity or absence/presence.b As determined by comparison of downstream/upstream concentrations (for odor and PM) or by multiplying downstream/upstream concentration difference with the drying ventilation rate (for ammonia). Ammonia concentrations in mg h–
1 bird–1 are our recalculations.c The highest reported ammonia emission rate of 5.71 mg h–1 bird–1 in this table is equivalent with 50 g year–1 bird–1.d The capacity of the manure belt aeration system was 0.82 m3 h–1 bird–1, but was used during 17 hours a day.e The lowest reported ammonia emission rate of 0.24 mg h–1 bird–1 in this table is equivalent with 2 g year–1 bird–1.
In order for MDTs to serve as dust filtration systems in future, both the potential dust filtering
effect and the potential additional emissions need to be elucidated in modern MDTs.
Furthermore, when the expectations from older studies prove valid, the question arises how the
additional emissions can be minimized. To our knowledge, studies on these issues in MDTs are
not available in literature. Therefore, the aim of the work described in this paper was first to gain
insight into the filtration and emission aspects for current MDTs applied at poultry farms in the
Netherlands (part A and B of this work).
Two strategies may effectively reduce emissions of ammonia and odor from MDTs. Results
from the study by Uenk et al. (1994) suggest that the emission of ammonia from the MDT is
strongly dependent of the time between manure production and the end of the drying process in
the MDT. When this period lasted about 70 hours, ammonia emission rates up to 50 g year–1
bird–1 were found. When the manure accumulation time (MAT; time between a full running
cycle of the belts inside the housing system) was set to <24 or even <12 hours, ammonia
emission rates were only 5–10 and <5 g year–1 bird–1, respectively. The authors hypothesize that
after this short MAT microbial multiplication and activity has not yet or only partially developed
around the time the drying process starts. Such explanation agrees with the findings of Chepete
et al. (2011) that ammonia emission from laying hen manure increases progressively with MAT
from day 1 to 5. A second strategy might be to pre-dry the manure on the belts in the housing

Evaluation of manure drying tunnels to serve as dust filters in the exhaust of laying hen houses
169
system by manure belt aeration (MBA) beyond a (possible) critical DM content which inhibits
most of the microbial multiplication and microbial degradation of uric acid and proteins into
volatile ammonia, as shown in Fig. 7 in a review paper by Groot Koerkamp (1994).
The second aim of this study was to elucidate the perspective of the above described strategies
to reduce ammonia and odor emissions from MDTs, namely (1) by pre-drying the manure by
manure belt aeration (MBA) systems inside the house (part C of this work), and (2) by
shortening MAT to 24 hours followed by rapid drying (beyond 55% DM within another 24
hours) inside the MDT (part D of this work).
METHODOLOGY
General description of manure drying tunnels
This study was performed at a total of 16 poultry farms with a MDT. The main characteristics
of these farms and MDTs are given in Table 2. Fig. 1 shows a simplified schematic of the
general structure and working principle of MDTs. MDTs are installed inside a separate room or
shed, outside the animal room (Fig. 1A). Between the animal room and the MDT, a pressure
chamber is constructed (Fig. 1A and C). Drying fans (usually axial-type pressure fans,
sometimes v-belt type fans) are used to create overpressure inside the pressure chamber so that
the drying air is forced through the perforated belts and the manure layer, and through an exhaust
opening in the room or shed, into the outside environment (Fig. 1A and C). The drying fans
always realize the minimum required ventilation rate (up to 2 to 3 m3 h–1 bird–1) and, for some
farms, more (Table 2). When the required ventilation rate exceeds the drying ventilation capacity
(e.g., on summer days), so called ‘bypass fans’ are switched on which exhaust additional air
directly to the outside environment, bypassing the MDT (Fig. 1A). MDTs can only be used in
combination with housing systems with manure belts which, in Dutch regulation, must have
manure belt aeration (MBA; so-called pre-drying). These manure belts run frequently and deliver
the pre-dried manure to a central belt that runs towards the MDT. A loader above the top drying
level of the MDT spreads the manure evenly across the width of the top (first) drying belt.
During loading, all belts inside the house and inside the MDT are running. When manure inside
the MDT reaches the end of a belt, it falls down onto the next belt below. During loading of one
batch of manure, the previous batches drop down to underlying belts whereas the oldest (fully
dried) batches are removed from the MDT and transported to a storage room or container (Fig.
1B). Two main types of MDTs are used in the Netherlands: a belt-type MDT which has flexible

Chapter 7
170
polyethylene/polypropylene belts, and a type MDT which has belts composed from metal plates
or hingeable metal panels. The latter type MDT usually can handle thicker manure layers (Table
2).
Table 2Overview of the poultry farms with the housing system, number of birds and manure belt aeration, and of the characteristics of the manure drying tunnels.Farm Part Housing system a;
manure accumulation time; number of hens
Manure belt aeration b
(m3 h–1 bird–1)
Characteristics of the manure drying tunnel c Drying / bypassvent. capacity (m3 h–1 bird–1)
1 A Aviary; MAT: 2 days; 65,000
Yes (unknown)
Plate-type; 4 levels; DSA: 22 cm2 bird–1; MLT: 11–17 cm; DT: 4 days
2.1 / 3.9
2 A Cage; MAT: 4–5days; 76,800
0.7 Belt-type; 10 levels; DSA: 78 cm2 bird–1; MLT: 10 cm; DT: 5 days
2.0 / 4.6
3 B Aviary; MAT: 4 days; 27,000
No Plate-type; 2 levels; DSA: 24 cm2 bird–1; MLT: 13–20 cm; DT: 4 days
1.9 / 4.4
4 B Aviary; MAT: 3 days; 22,500
No Belt-type; 5 levels; DSA: 84 cm2 bird–1; MLT: 12 cm; DT: 3 days
3.9 / 5.3
5 B, C Cage; MAT: 3 days; 47,000
0.7 Belt-type; 10 levels; DSA: 103 cm2 bird–1;MLT: 7 cm; DT: 3 days
2.6 / 7.7
6 B, C Cage; MAT: 2 days; 65,300
0.5 Belt-type; 10 levels; DSA: 99 cm2 bird–1; MLT: 4 cm; DT: 2 days
3.7 / 6.1
7 B Floor; MAT: 3 days; 24,000
No Belt-type; 12 levels; DSA: 90 cm2 bird–1; MLT: 6 cm; DT: 3 days
3.3 / 11.6
8 B Aviary; MAT: 3–4days; 22,500
No Belt-type; 8 levels; DSA: 73 cm2 bird–1; MLT: 10 cm; DT: 3.5 days
4.0 / 2.4
9 C Aviary; MAT: 1 day; 93,600
0.7 Belt-type; 12 levels; DSA: 34 cm2 bird–1; MLT: 6 cm; DT: 4 days
2.7 / 4.0
10 C Aviary/cage; MAT: 1 day; 172,500
0.7 Belt-type; 2 systems of 12 levels each; DSA: 83 cm2 bird–1; MLT: 6 cm; DT: 4 days
1.8 / 6.7
11 C Aviary; MAT: 1 day; 20,000
0.1 d Belt-type; 6 levels; DSA: 172 cm2 bird–1; MLT: 10 cm; DT: 7 days
5.5 / 4.0
12 C Cage; MAT: 33 hours; 100,000
0.35 e Plate-type; 6 levels; DSA: 23 cm2 bird–1; MLT: 14 cm; DT: 2 days
2.5 / 3.8
13 C Aviary; MAT: 56 hours; 78,000
0.4 Plate-type; 4 levels; DSA: 20 cm2 bird–1; MLT: 13 cm; DT: 2,5 days
2.5 / 4.6
14 C Aviary; MAT: 1.5 day; 64,240
0.7 Plate-type; 4 levels; DSA: 29 cm2 bird–1; MLT: 10 cm; DT: 3 days
3.1 / 4.4
15 D Floor; MAT: set to 1 day; 60,000
0.3 Plate-type; 4 levels; DSA: 31 cm2 bird–1; MLT: 10 cm; DT: 2 days
1.9 / 9.9
16 D Aviary; MAT: set to 1 day; 69,000
No Belt-type; 4 (originally 9) levels; DSA: 26 cm2
bird–1; MLT: 9 cm; DT: 27 hours2.6 / 5.1
a At farms 2, 10, 11, and 12, the MDT was supplied with manure and exhaust air from multiple houses.b Manure belt aeration inside the housing system for reduction of ammonia formation; capacity or absence/presence.c DSA = drying surface area; MLT = manure layer thickness; DT = drying time.d The capacity of this manure belt aeration system was 1.1 m3 h–1 bird–1, but was used at 50% of its capacity for 4 hours per day, equivalent with 0.1 m3 h–1 bird–1 on a 24-h basis.e The capacity of this manure belt aeration system was 0.7 m3 h–1 bird–1, but was used at 50% of its capacity.

Evaluation of manure drying tunnels to serve as dust filters in the exhaust of laying hen houses
171
Fig. 1Schematic describing the general structure, application and working principle of manure drying tunnels (MDTs).
Loader: spreads fresh or pre-dried manurefrom the belts inside the house onto the
top level of the MDT
Dry manure to storage
Insidelaying hen
house
Pressurechamber
Manure drying tunnel (MDT)
Downstreamwalking isle or
room
Outside
C. Side view onto the MDT (interior of the system)B. Front view onto the MDT (interior of the system)
Legend
Conveyor belt to / from MDT (closed)
Conveyor belt or plate inside MDT (perforated)
Manure on belt or plate inside MDT
Particulate matter suspended in air
Upstream and downstream sampling points
Moving directions of manure inside MDT
Ventilator in wall
Warm (red) air flow before passing the manure
Colder (blue) air flow after passing the manure
A. Plan view onto the MDT and laying hen house
Laying hen house
Manure drying tunnel (MDT)
Bypass fansBypass fans Drying fans
Outside
Fresh air inlet
Fresh air inlet
Pressurechamber
Downstreamwalking isle
Door in wall

Chapter 7
172
General design of the study: parts A, B, C, and D
The present study was designed as an emission survey in four parts (A through D) and was
performed at a total of 16 MDTs (Table 2).
Part A of the survey was intended to gain a first impression of the PM abatement potential and
possible extra emissions of current MDTs under worst-case (winter) conditions for drying. This
part took place at farms 1 and 2 (Table 2). Series of six 24-h measurements were carried out per
farm (12 in total) between December 2008 and February 2009. Measurements were performed
upstream and downstream of the MDTs and included concentrations of PM10, PM2.5, ammonia,
odor, and carbon dioxide, and of air temperature and relative humidity (Table 3).
Part B of the survey was intended to reproduce the first impression from part A under summer
conditions and for a larger number of MDTs. This part took place at farms 1 and 2 (repetitions),
and to farms 3 through 8 (Table 2) in July and August 2009. One visit was made to each farm
and 2-h measurements were performed upstream and downstream of the MDT. Measurement
included PM10 and ammonia concentrations, air temperature and relative humidity, and manure
temperature. In addition, manure samples were taken throughout the MDT for determination of
the DM content (Table 3).
Since parts A and B indeed showed that the MDTs reduced PM but emitted additional
ammonia and odor, part C of the survey was intended to determine the relationship between DM
content of the ingoing and drying manure and the release of ammonia from the MDT. This
relationship could clarify the perspective of pre-drying the manure beyond a (possible) critical
DM content which inhibits most of the microbial multiplication and microbial degradation of
uric acid and proteins into volatile ammonia. This part took place at farms 5, 6, and 9 through 14
(Table 2) between October 2011 en August 2012. These eight farms were selected because they
all had some kind of MBA (pre-drying) inside their housing system (as demanded in Dutch
legislation for houses with a MDT). A series of five visits were made to each farm (39 visits in
total; about once every 2 months per farm) and 2-h measurements were performed upstream and
downstream of the MDT. Measurements included PM10 and ammonia concentrations, air
temperature and relative humidity, and manure temperature (Table 3). Manure samples were
taken from three spots in the MDT (the wettest, middle, and driest belt/plate) inside the MDT,
from the pre-dried manure inside the house, and from the storage (dried manure), for
determination of the DM content. Except for PM10 concentration, all other variables were
measured at the same location inside the MDT as where manure was sampled, so that the

Evaluation of manure drying tunnels to serve as dust filters in the exhaust of laying hen houses
173
association between measurement results (e.g., ammonia concentrations) and DM contents of the
manure could be studied.
Finally, part D of the survey was intended to explore the perspective of applying a MAT of 24
hours followed by rapid drying inside the MDT. This part took place at farms 15 and 16 (Table
2) from December 2011 to November 2012. The general idea behind this strategy was first to
shorten the manure residence time during accumulation inside the house to an average of 12
hours (minimum of ~0 hours for manure excreted just before the current removal; maximum of
24 hours for manure excreted directly after the previous removal), so that at the start of the
drying process inside the MDT the microbial multiplication and activity in the manure, would
not or only partly have developed. Second, we adapted the MDTs in such a way that drying took
place rapidly (see next section; aim: ≥ 55% DM content within another 12 hours). The
measurement strategy in Part D was identical to that of part A (Table 3), except that, besides the
MDT emissions, we also determined the ‘bypass’ emissions directly from the house.
Modifications to the MDTs in part D
The MDTs at farms 15 and 16 were adapted in comparison to conventional MDTs in four
ways. First, the MBA system inside house 15 was turned off because MBA is rather useless
when all manure is removed from the house daily and turning off the MBA cut electricity costs
substantially. House 16 lacked a MBA system. Second, the speed and running time of the
manure belts inside the housing system were programmed such that all manure present in the
building was removed every 24 hours. Running of the belts (i.e., manure removal from the house
and loading of the MDT) took place twice a day for farm 15 and eight times a day for farm 16.
Third, the climate computers of the houses were programmed such that the bypass fans
automatically took over the required ventilation from the drying fans during loading of the MDT.
This prevented peak emissions of PM from the MDTs due to the dust generated during falling of
the manure onto the next level (Fig. 1B). In addition, the exhaust opening of the drying shed of
farm 15 was automatically closed by a computerized system because in this shed the manure was
not only dried but also dumped afterwards into heaps onto the floor of the shed by means of
auger transport pipes. Furthermore, closing the shed exhaust further prevented excessive
emission peaks (during these two daily periods of 2.5 hours each, PM was not sampled
gravimetrically). Fourth, drying was enhanced at farm 15 by using an over-dimensioned MDT
with a manure layer thickness of only 10 cm. At farm 16, drying was enhanced by directing two-
third of the total drying ventilation rate (max. 2.6 m3 h–1 bird–1) through the youngest (wettest)

Chapter 7
174
manure on the upper two belts and by limiting the manure layer thickness to 7 cm for those two
belts (belts 3 and 4: 10 cm). The inlet openings between belts 5 through 9 ( Fig. 1C) were closed
from the drying air flow, making belts 5 through 9 redundant.
Measurements: part A and D
Measurement strategy
An overview of measured variables in part A through D of this study is given in Table 3. Note
that, apart from manure temperature and manure DM content, in part A and D, the same
variables were measured. Concentrations of PM10, PM2.5, ammonia, odor, and carbon dioxide
were determined by single measurements at two different positions upstream of the MDTs and at
two different positions downstream of the MDTs. Upstream samplers were placed either within 2
m from the drying fans (inside the house) or inside the pressure chamber. In the pressure
chamber, and downstream of the MDTs, samplers were placed at about one-third and two-third
of the path of manure through the MDT. Air temperature and relative humidity comprised single
measurements, upstream and downstream of the MDT. The measurement duration amounted 24
hours (from noon to noon) for all variables except odor concentration. Air for odor analysis was
sampled from 10:00 to 12:00 in the morning.
Measurement of PM10 and PM2.5 concentration
PM10 and PM2.5 concentrations were determined by a filter-based method consisting of
cyclone pre-separators (URG Corp., Chapel Hill, N.C., USA; model URG-2000-30ENB for
PM10 and URG-2000-30 EG for PM2.5), a filter holder (filter: Macherey–Nagel, Düren,
Germany; type GF-3, Ø 47 mm), and air sampling pumps (Tecora, model Charlie HV; Ravebo
B.V., Brielle, the Netherlands) at an air flow rate of 16.7 L min–1. Unloaded and loaded filters
were weighed four times during two consecutive days with a precise balance (Mettler,
Greifensee, Switzerland; AT261 DeltaRange; resolution: 10 µg) at 20 ± 1 °C and 50 ± 5%
relative humidity, following EN 12341 (CEN, 1998) and EN 14907 (CEN, 2005). PM10
concentrations were calibrated to the reference impaction sampler described in EN 12341 using
the equations reported by Zhao, Aarnink, Hofschreuder, and Groot Koerkamp (2009): y = 1.09x
(when x ≤ 223 µg m–3) and y = 0.83x + 57.5 (when x > 223 µg m–3), where x is the concentration
measured with the cyclone sampler and y is the calibrated concentration.

Evaluation of manure drying tunnels to serve as dust filters in the exhaust of laying hen houses
175
In addition, PM10 concentration was measured using the DustTrak light scattering device.
Concentrations were determined each second and minute-averaged values were stored in the
memory of the DustTrak. Since this device systematically underestimates true concentrations, all
measured values where calibrated by a factor 2.1 based on the equivalence studies of Cambra-
López et al. (2015) and Winkel et al. (2015a).
Table 3Summary of measured variables, methods, and standards used in part A, B, C, and D of this study.Variable (unit) Measurement method Applicable standard or
protocol followedPart of this study
A B C DAirborne pollutants
PM10 (mg m–3) Filter-based cyclone sampler and air pump; filter weighing
EN 12341 (CEN, 1998);Ogink et al. (2011)
× - - ×
PM10 (mg m–3) TSI DustTrak light-scattering device, model 8520
- - × × ×
PM2.5 (mg m–3) Filter-based cyclone sampler and air pump; filter weighing
EN 14907 (CEN, 2005);Ogink et al. (2011)
× - - -
Ammonia (ppm) Acid traps and air pumps; photometry
Ogink et al. (2011) × - - ×
Ammonia (ppm) Kitagawa gas detection tubes (types: 105SD, 105SC)
- - × × -
Odor (OUE m–3) Sampling vessel and air pump; dynamic olfactometry
EN 13725 (CEN, 2003);Ogink (2011)
× - - ×
Carbon dioxide (ppm) Sampling vessel and air pump; gas chromatography
× - - ×
Air characteristicsAir temperature (°C) Rotronic combined sensor
for T and RH and data storage
- × - - ×
Air temperature (°C) Testo device, model 435-4with combined T/RH sensor
- - × × -
Rel. humidity (%) Rotronic combined sensor for T and RH and data storage
- × - - ×
Rel. humidity (%) Testo device, model 435-4with combined T/RH sensor
- - × × -
Air velocity (m s–1) Testo device, model 435-4with hot wire anemometer
- - × × ×
Ventilation rate CO2 balance method; fan capacities and functioning
CIGR (2002);Pedersen et al. (2008)
× - - ×
ManureManure temperature (°C) Rod thermometer - - - × ×Manure DM content (%) Oven-drying, weighing - - - × ×

Chapter 7
176
Measurement of ammonia concentration
Ammonia concentration was determined by the ‘wet chemical method’ with acid traps (two
impingers in series for a single measurement, with 100 mL of nitric-acid (HNO3) solution at 0.05
M) connected to air sampling pumps (Thomas Industries Inc., Wabasha, MN, USA; model
607CD32) using a critical capillary of 1 L min–1. The ammonium nitrogen content in the solution
was determined by spectrophotometry. The total amount of ammonia was determined by
multiplying the ammonium nitrogen with the mass of the solution and the molecular weight of
ammonia. The flow rate through the impingers was verified at the start and the end of the 24-h
sampling period by an air flow meter (Defender 510-m, Bios Int. Corp, NJ, USA).
Odor and carbon dioxide concentrations
For determination of odor and carbon dioxide concentrations, air samples were taken using
the ‘lung principle’. Separate vessels for odor and carbon dioxide (with 40 L Nalophan air
sampling bags inside, for one time use only) were connected to air sampling pumps (Thomas
Industries Inc., Wabasha, MN; model 607CD32). In this principle, the pump sucks air from the
vessel which causes the sampling bag to be filled with air taken from the sampling position. The
sampling bags for odor were rinsed three times with odorless air before use and during sampling,
the air first passed a dust filter (Savillex Corp., Minnetonka, MN, USA; #1130, Ø 50 mm, 1–2
μm). The air samples for odor were taken between 10:00 and 12:00 using a critical capillary of
0.4 L min–1. The air samples for carbon dioxide were taken during the full 24-h sampling period
using a critical capillary of 0.02 L min–1. The air samples for determination of odor concentration
were transported and stored following EN 13725 (CEN, 2003). Odor concentration (in European
odor units: OUE) was determined in the lab by dynamic olfactometry following European
Standard EN 13725 (test panels with 4 to 6 participants) within 30 h after sampling. The air
samples for determination of carbon dioxide concentration were analysed by gas
chromatography (Interscience/Carlo Erba Instruments Inc., Breda, the Netherlands, GC 8000
Top; column Molsieve 5A; detector: HWD).
Environmental variables
Air temperature (°C) and relative humidity (%) were determined with combined sensors
(Rotronic Instrument Corp., Hauppauge, N.Y.; accuracy of 1,0 °C and 2% relative humidity).
Hourly mean values were stored in a data-logging system (Campbell Scientific Inc., Logan, UT,
USA; types: CR10, CR10X, CR23 and CR23X).

Evaluation of manure drying tunnels to serve as dust filters in the exhaust of laying hen houses
177
Measurements: part B and C
An overview of measured variables in part B and C of this study is given in Table 3. In both
parts, short farm visits were made and measurements were performed for two hours. For PM10
concentration, ammonia concentration, air temperature, and relative humidity, single instruments
were used which were intermittently changed from position (upstream or downstream of the
MDT) every 15 minutes to avoid instrument bias. Ammonia concentration was determined
upstream and downstream of the MDTs by writing down the average value of two consecutive
strokes with a hand pump (Kitagawa gas detection tubes; type 105SD, measuring range: 0.2 to
20 ppm; type 105SC, measuring range: 10 to 260 ppm; Komyo Rikagaku Kogyo, Japan) every
15 minutes. In part B, ammonia concentration was measured in the total air flows upstream and
downstream of the MDTs (i.e., mixed air from the house entering the MDT or mixed air from the
MDT leaving the drying room). In part C, however, measurements were performed at the
individual drying belt level (i.e., at the inlet or outlet opening of a belt; Fig. 1C). The enthalpy of
the drying air was calculated using the equations given by Albright (1990).
Data preparation and analysis
Estimation of ventilation rate: part A and D
The total ventilation rate (Qtotal; i.e., the sum of the drying ventilation rate, Qdrying, and the
bypass ventilation rate, Qbypass) was estimated in houses 1, 2 (part A), 15, and 16 (part D) by the
CO2 balance method. This method uses the CO2 produced by the birds as a tracer gas. First, the
total heat production of one bird (Φtotal; kW) was calculated based on the body weight and egg
production, using the equations given by the CIGR (2002), in chapter two. Specific data on body
mass and egg production were obtained from the farmer’s records for each measurement.
Subsequently, the total heat production was multiplied by a factor (Fco2) of 0.18 m3 CO2 h–1 kW–
1 as recommended in Table 6 of the paper by Pedersen et al. (2008). Qtotal (m3 h–1 bird–1) was
calculated using Eq. 1:
6-ambient2upstream2
2totaltotal
10)]CO[-]CO([FcoQ
×
×F= (1)
where [CO2]upstream is the CO2-concentration measured upstream of the MDT (ppm) and
[CO2]ambient a fixed CO2 concentration (505 ppm), as found for laying hen houses in a recent

Chapter 7
178
emission survey by Winkel et al. (2015b). Since Qtotal was estimated on a 24-h basis, as were
pollutant concentrations, the diurnal variation in animal activity was not taken into account. This
approach yields reliable estimates of the ‘true’ 24-h averaged ventilation rate as determined with
fan wheel anemometry (Mosquera, Groenestein, Ogink, & Aarnink, 2012).
In part A, which was conducted in winter, the ventilation requirement never exceeded the
drying ventilation rate, therefore no bypass ventilation occurred (Qtotal = Qdrying). In part D,
however, bypass ventilation did take place, therefore, Qtotal needed to be differentiated into Qdrying
and Qbypass to be able to estimate emission rates from both air flows (through the MDT versus
and from the house directly). It should be noted that Qbypass can be further differentiated into
bypass ventilation during loading of the MDT (Qbypass_during_loading) and bypass ventilation during
drying (Qbypass_during_drying) when the ventilation requirement exceeded the drying capacity.
Consequently, Qtotal_during_drying is the sum of Qdrying and Qbypass_during_drying. We differentiated Qtotal
into Qdrying and Qbypass in three steps.
First, we determined the total daily loading time of the MDT during which the bypass fans
took over the drying ventilation. This duration amounted 5 h (two daily periods of 2.5 hour each)
in farm 15 and 0.8 h (eight daily periods of 6 min each) in farm 16. Using these durations, we
estimated the part of Qtotal attributable to loading periods (Qbypass_during_loading) for each
measurement by Eq. 2:
totalloading_during_bypass Q24
time_LoadingQ ×= (2)
Second, we estimated the part of Qtotal attributable to drying periods (Qtotal_during_drying), which
lasted (24 – 5 =) 19 hours in farm 15 and (24 – 0.8 = ) 23.2 hours in farm 16, for each
measurement by Eq. 3:
totaldrying_during_total Q24
time_DryingQ ×= (3)
Third, this figure needed to be further differentiated into the drying ventilation flow (Qdrying)
and the bypass ventilation flow during drying (Qbypass_during_drying) which together make up
Qtotal_during_drying. To be able to enable this differentiation before each measurement the drying
ventilation was set to a fixed level (Qdrying_capacity) by putting a number of ventilators on at
maximum capacity and others were shut off. The number of ventilators turned on was depending

Evaluation of manure drying tunnels to serve as dust filters in the exhaust of laying hen houses
179
on the expected ventilation requirement at that moment. We then estimated Qdrying,
Qbypass_during_drying, and Qbypass by Eq. 4, Eq. 5, and Eq. 6, respectively:
capacity_dryingdrying Q24
time_DryingQ ×= (4)
dryingdrying_during_totaldrying_during_bypass Q-QQ = (5)
drying_during_bypassloading_during_bypassbypass QQQ += (6)
Calculation of emission rates: part A and D
Four different emission rates were calculated for each measurement and pollutant (PM10,
PM2.5, NH3, and odor): the actual emission rate through the MDT (Edrying), the actual emission
rate directly from the house (Ebypass), the actual total emission rate (Etotal) and the emission rate
for a theoretical situation as if there would be a poultry house with 24-h manure removal but no
MDT (E24h_manure_removal), as described in Eq. 7, Eq. 8, Eq. 9, and Eq. 10, respectively:
)C-C(QE ambientdownstreamdryingdrying ×= (7)
)C-C(QE ambientupstreambypassbypass ×= (8)
bypassdryingtotal EEE += (9)
)C-C(QE ambientupstreamtotalremoval_manure_h24 ×= (10)
where Cdownstream is the pollutant concentration measured downstream of the MDT, Cambient a
fixed outside pollutant concentration as found for laying hen houses in a recent emission survey
by Winkel et al. (2015b), and Cupstream the pollutant concentration measured upstream of the
MDT. The fixed outside pollutant concentrations were 0.056 mg m–3 for PM10, 0.015 mg m–3 for
PM2.5, and 0.13 mg m–3 for ammonia. In the equations, pollutant concentrations of PM10, PM2.5,
and ammonia were expressed in mg m–3 and ventilation rates (Q) in m–3 h–1 bird–1, yielding
emission rates in mg h–1 bird–1. The odor concentration was expressed in OUE m–3 and the
emission rate in OUE s–1 bird–1. For odor, no correction for outside concentration was applied
because concentrations of odor from (potentially) different sources cannot be subtracted from
each other.

Chapter 7
180
Statistical analysis
In part A and D, differences between upstream versus downstream pollutant concentrations
were tested for statistical significance with the paired samples t-test. The relationships between
numeric variables (i.e., manure temperature as a function of manure DM content; removal
efficiency of PM10 as a function of MLT) were investigated by linear regression analysis. All
analyses were done using the GenStat software (VSN, 2014). Probability values ≤0.05 were
considered statistically significant.
RESULTS AND DISCUSSION
Part A: particulate matter abatement and extra emissions
Part A of this study aimed to gain a first impression of the PM abatement potential and
possible extra emissions of current MDTs and was carried out at farms 1 and 2 (Table 2) in
winter. On measurement days, the maximum temperature ranged from 0.8 to 10.4 °C, the
minimum temperature ranged from -7.3 to 3.7 °C, and the daily mean relative humidity ranged
from 71 to 95%. The results of part A are shown in Table 4.
Upon passing the manure layer, the temperature of the drying air flow decreased significantly
with an average of 3.4 °C whereas the relative humidity increased significantly with an average
of 26% percentage points to levels beyond 90% (Table 4). These changes represent the
evaporation of water from the manure which requires the input of thermal energy from the
drying air and manure. Concentrations of carbon dioxide were not significantly different between
upstream and downstream sampling positions (Table 4). In agreement with the studies of
Demmers et al. (1992) and Uenk et al. (1994), concentrations of PM were significantly reduced
by an average of 77% for PM10 and an average of 56% for PM2.5 (Table 4). In agreement with all
five studies performed in the 1990s in the Netherlands (Table 1), concentrations of ammonia
increased significantly by an average of 26.7 ppm. In agreement with the studies by Demmers et
al. (1992), Uenk et al. (1994), and Kroodsma et al. (1996), concentration of odor increased
significantly with an average of 356 OUE m–3.

Evaluation of manure drying tunnels to serve as dust filters in the exhaust of laying hen houses
181
Table 4Results of part A at farms 1 and 2: man (SD) temperature, relative humidity, and concentrations of carbon dioxide, particulate matter, ammonia, and odor in the upstream and downstream air of the manure drying tunnel, and their difference (mean and significance).
Variable Farm n Upstream of the MDT;
Downstream of the MDT;
Difference
mean (SD) mean (SD) Mean Sign.Air temperature (°C) 1 5 17.0 (0.6) 12.8 (1.0) –4.2
2 6 20.4 (1.4) 17.6 (0.8) –2.81 and 2 11 18.8 (2.0) 15.4 (2.6) –3.4 P < 0.001 a
Relative humidity (%) 1 6 65 (3) 98 (4) 332 6 71 (7) 91 (6) 201 and 2 11 68 (6) 94 (6) 26 P < 0.001 a
CO2 concentration (ppm) 1 6 1881 (487) 1595 (442) –2862 6 2155 (597) 2536 (1203) 3811 and 2 12 2018 (539) 2066 (994) 48 n.s. b
PM10 concentration (μg m–3) 1 6 2580 (371) 416 (74) –21642 6 422 (36) 281 (17) –1411 and 2 12 1501 (1155) 348 (87) –1153 c P = 0.002 a
PM2.5 concentration (μg m–3) 1 6 174 (50) 70 (23) –1042 6 33 (10) 22 (7) –111 and 2 12 104 (82) 46 (30) –58 d P = 0.006 a
NH3 concentration (ppm) 1 6 4.3 (0.9) 23.8 (15.7) 19.42 6 14.6 (3.5) 48.7 (5.4) 34.11 and 2 12 9.5 (5.9) 36.2 (17.2) 26.7 P < 0.001 a
Odor concentration (OUE m–3) 1 6 658 (211) 963 (420) 3052 6 986 (182) 1393 (252) 4071 and 2 12 822 (254) 1178 (400) 356 P < 0.001 a
a Determined by the one-sided paired-samples t-test.b Determined by the two-sided paired-samples t-test.c Mean reduction of PM10 concentration: 77%.d Mean reduction of PM2.5 concentration: 56%.
Table 5 shows the emission rate of the theoretical situation as if there were no MDTs (based
on upstream concentrations) and of the actual situation with MDTs (based on downstream
concentrations). During the measurements at farms 1 and 2 in winter all ventilation air was
exhausted through the MDT. The emission rates of the theoretical situation fall within normal
ranges for these housing systems (Costa et al., 2012; Demmers et al., 2010; Groot Koerkamp et
al., 1998; Ogink and Groot Koerkamp, 2001; Winkel et al., 2015b). The reductions of PM10 and
PM2.5 emission of 77% and 56% respectively, are accompanied by an additional emission of
ammonia from the MDTs of 28.8 mg h–1 bird–1, equivalent with 252 g year–1 bird–1 (Table 5) or
about a factor 4 relative to that of the houses. The additional emission of odor was 0.14 OUE s–1
bird–1 or about a factor 1.4 relative to that of the houses. It should be noted that these emissions
only apply to the winter period and are not representative for year-averaged rates.
Overall, part A of this study shows that MDT are indeed capable of reducing PM emissions,
but also emit substantial amounts of extra ammonia and odor.

Chapter 7
182
Table 5Results of part A at farms 1 and 2: emission rates of a theoretical situation as if there were no manure drying tunnels (MDTs) and all air was exhausted directly from the houses (based on upstream concentrations) and of the actual situation with MDT (based on downstream concentrations).
Variable Farm n Theoretical situation:
without MDT;
Actual situation:
with MDT;
Difference
Mean (SD) Mean (SD) Mean Sign.Ventilation rate (m3 h–1 bird–1) 1 6 1.7 (0.6) - -
2 6 1.4 (0.6) - -1 and 2 12 1.5 (0.6) - -
PM10 emission rate (mg h–1 bird–1) 1 6 4.14 (1.44) 0.59 (0.20) –3.562 6 0.53 (0.26) 0.32 (0.15) –0.201 and 2 12 2.34 (2.13) 0.46 (0.22) –1.88 a P = 0.003 b
PM2.5 emission rate (mg h–1 bird–1) 1 6 0.27 (0.13) 0.08 (0.03) –0.182 6 0.03 (0.02) 0.01 (0.01) –0.021 and 2 12 0.15 (0.15) 0.05 (0.04) –0.10 c P = 0.010 b
NH3 emission rate (mg h–1 bird–1) 1 6 4.91 (2.17) 27.7 (18.4) 22.72 6 13.5 (4.34) 48.3 (22.3) 34.81 and 2 12 9.20 (5.54) 38.0 (22.3) 28.8 d P < 0.001 b
Odor emission rate (OUE s–1 bird–1) 1 6 0.29 (0.12) 0.42 (0.19) 0.132 6 0.40 (0.24) 0.55 (0.27) 0.151 and 2 12 0.34 (0.19) 0.49 (0.23) 0.14 P = 0.001 b
a Mean reduction of PM10 emission: 80%.b Determined by the one-sided paired-samples t-test.c Mean reduction of PM2.5 emission: 67%.d Equivalent with 252 g year–1 bird–1.
Part B: verification of part A
Part B of this study aimed to reproduce the results from part A, but then under summer
conditions and for a larger number of MDTs, namely on farms 1 through 8 (Table 2). During
these visits, the drying fans were operated at their maximum capacity (Table 2). The outside
temperature / relative humidity during the visits was 19–22°C / 60–85% for farms 1 through 4,
25–26°C / 60–65% for farms 5 and 6, and 30–36°C / 30–60% for farms 7 and 8. The drying air
temperature and relative humidity upstream of the MDTs ranged from 21 to 34 °C and 50 to
67%, respectively. The air temperature and relative humidity downstream of the MDTs ranged
from 20 to 33 °C and 52 to 82%, respectively. Furthermore, the DM content of the oldest batch
of manure inside the MDTs ranged from 73 to 90%. The manure temperature was 1 to 4 °C
lower than the upstream drying air temperature. These variables show that drying conditions
were favorable. The results from 2-h measurements of PM10 and ammonia concentrations are
shown in Table 6. In agreement with part A, all MDTs reduced PM10 concentration (by 57% on
average), but added extra ammonia to the drying air (4.9 ppm on average).

Evaluation of manure drying tunnels to serve as dust filters in the exhaust of laying hen houses
183
Table 6Results of part B of this study at farms 1 through 8: mean concentrations of PM10 and ammonia; upstream and downstream of the manure drying tunnel, and their difference.
Farm PM10 concentration NH3 concentrationUpstream of the MDT;
mean (µg m–3)
Downstream of the MDT;
mean (µg m–3)
Difference(%)
Upstream of the MDT;
mean (ppm)
Downstream of the MDT; mean (ppm)
Difference(ppm)
1 2446 685 –72 2.3 8.8 6.62 652 433 –34 2.1 4.4 2.33 4154 778 –81 6.5 20.6 14.14 3635 1393 –62 6.3 13.0 6.75 792 428 –46 2.1 9.0 6.96 976 569 –42 1.0 3.0 2.07 10,834 5274 –51 3.0 3.6 0.68 8914 4440 –50 4.8 4.9 0.1a
Average 4050 1750 –57 3.5 8.4 4.9a In contrast to the other seven farms, farm 8 used an all-in/all-out manure loading scheme with only one batch of manure inside the MDT. During the measurement, the drying time of 3.5 days was nearly completed, which may explain the minimal extra release of ammonia. Farms 1 through 7 practiced daily loading (comprising 20, 25, 33, or 50% of the manure belts inside the house per loading).
Part C: ammonia and manure DM content
Part C of this study aimed to determine the relationship between the DM content of the
manure and the release of ammonia at farms 5, 6, and 9 through 14 (Table 2). This relationship
could clarify the perspective of pre-drying the manure beyond a (possible) critical DM content
which inhibits most of the microbial multiplication and microbial degradation of uric acid and
proteins into volatile ammonia.
On the days on which the 39 farm visits were made, the outside air temperature (24-h basis)
was on average 10.8 °C and the outside relative humidity 81%, which closely resemble long-
term averages for the Netherlands (10.2 °C and 80.4%; 1981–2010). The mean (range)
temperature of the drying air was 22.1 °C (18.7 to 27.2 °C) upstream of the MDTs and 19.8 °C
(12.5 to 24.9 °C) downstream of the MDTs. The mean (range) manure temperature was 20.6 °C
(7.0 to 27.5 °C) and manure temperatures were consistently between the upstream and
downstream air temperatures. The mean (±SE) enthalpy of the drying air upstream of the MDTs
(48.2 ± 1.0 kJ kg–1) was not significantly different from the air downstream of the MDTs (48.3 ±
1.3 kJ kg–1), which suggests that no heat was released from the manure due to aerobic
composting. The mean (range) relative humidity of the drying air was 65% (37 to 84%) upstream
of the MDTs and 83% (41 to 100%) downstream of the MDTs. The mean (range) ammonia
concentration was 5.5 ppm (0.8 to 22.5 ppm) upstream of the MDTs and 13.9 ppm (1.9 to 70
ppm) downstream of the MDTs.

Chapter 7
184
The increase of ammonia concentration was considerably higher in belt-type MDTs (10.2
ppm; range: 0 to 38 ppm; n = 25, from farms 5, 6, 9, 10, and 11) than in plate-type MDTs (2.9
ppm; range 0.6 to 6.6 ppm; n = 14, from farms 12, 13, and 14). This difference does not seem to
be caused by differences in how the manure was handled inside the house, since the mean MAT
(38 h for the belt-type MDTs versus 42 h for the plate-type MDTs) and the mean MBA capacity
(0.54 m3 h–1 bird–1 for the belt-type MDTs versus 0.48 m3 h–1 bird–1 for the plate-type MDTs)
seem reasonably similar. The most striking differences between the two types of MDTs were
their MLT (on average: 7 cm for the belt-type MDTs versus 12 cm for the plate-type MDTs), the
amount of manure they contain (on average: 708 cm3 bird–1 for the belt-type MDTs versus 291
cm3 bird–1 for the plate-type MDTs; calculated from the data in Table 1), their drying intensity
(on average: 6599 m3 air per m3 manure per h for the belt-type MDTs versus 9356 m3 air per m3
manure per h for the plate-type MDTs; calculated from the data in Table 1), and their DT (on
average: 4 days for the belt-type MDTs versus 2.5 days for the plate-type MDTs). Possibly, the
more rapid drying inside plate-type MDTs could soon raise the DM content of the manure
beyond a critical DM content (i.e., a DM content which inhibits most of the microbial
multiplication and microbial degradation of uric acid and proteins into volatile ammonia).
Fig. 2Mean increase of the ammonia concentration in the drying air upon passing the manure drying tunnel (MDT) at farms 5, 6, and 9 through 14 (part C of this study), for A: four classes of dry matter (DM) content of the pre-dried manure from the house entering the MDT (n = 32, from eight farms), and B: six classes of DM content of the drying manure inside the MDT (part C; n = 107, from eight farms). Error bars represent standard errors.
14.2 13.6
10.9
6.9
0
5
10
15
20
25
20-30 30-40 40-50 50-60
Incr
ease
in N
H3
conc
entr
atio
n (p
pm)
DM content pre-dried manure in house (%)
21.0
11.0
7.8
5.5 4.63.3
0
5
10
15
20
25
30-40 40-50 50-60 60-70 70-80 >80
Incr
ease
in N
H3
conc
entr
atio
n (p
pm)
DM content manure inside the MDT (%)
BA

Evaluation of manure drying tunnels to serve as dust filters in the exhaust of laying hen houses
185
The relationship between the DM content of the pre-dried manure inside the house and the
increase of the ammonia concentration inside the MDT at the same moment, is shown in Fig. 2A.
The relationship between the DM content of the manure inside the MDT and the release of
ammonia from that particular batch is shown in Fig. 2B. Both figures show that the release of
ammonia decreases with increasing DM content of the manure. Relative to the increase of
ammonia concentration in the 20 to 30 % DM class in Fig. 2A, the reductions are 5% for the 30
to 40% DM class, 23% for the 40 to 50% DM class, and 51% for the 50 to 60% DM class.
Relative to the increase of ammonia concentration in the 30 to 40 % DM class in Fig. 2B, the
reductions are 48% for the 40 to 50% DM class, 63% for the 50 to 60% DM class, 74% for the
60 to 70% DM class, 78% for the 70 to 80% DM class, and 84% for the >80% DM class.
It must be noted, however, that the data in Fig. 2 were obtained from momentaneous
measurements of ammonia concentration and manure DM content at three spots in the MDT (the
wettest, middle, and driest belt/plate). This means that the measurement at a certain spot in the
MDT at a certain moment in the drying process does not take into account what happened to that
manure prior to the measurement. Presumably, the DM content (as the inhibitor of microbial
activity and ammonia formation) is confounded with other factors that change in time along with
manure DM content, such as a gradual decrease in nitrogen content due to ammonia
volatilization. To exclude such confounding and focus on the single effect of water availability,
it is advisable for future studies to determine nitrogen content in the samples as well.
Alternatively, future studies can use batches of manure of known and varying DM contents and
ages (MAT) to be subjected to drying in a lab setting, similar to the situation in MDTs. Other
confounding factors may have been MLT, air flow rate and velocity through the manure layer,
manure temperature, and pH. Indeed, the manure volume gradually decreased during drying
which may have promoted the air flow rate and extent of ammonia dilution in the course of the
drying process, but in most MDTs the MLT was kept fairly constant throughout the MDT.
Furthermore, the inlet/outlet openings of MDTs were the same size for each drying level (Fig. 1)
and air velocity was similar for different drying levels within MDTs (overall range: 0.5 to 4.8 m
s–1). Fig. 3 shows that manure temperature (presented as absolute difference to the upstream air
temperature, assuming air temperature upstream from the house to be fairly constant) increased
with increasing DM content through the MDT which may have promoted microbial activity and
ammonia volatilization in the course of the drying process. The drop in air temperature when the
drying air passes the manure layer is caused by the evaporation of water from the manure. This
process requires input of thermal energy which is subtracted from the manure and the drying air.
In the course of the drying process, the water content decreases (i.e., DM content increases)

Chapter 7
186
which results in a gradual reduction of the water vapor pressure between manure and drying air,
and herewith the required thermal energy for evaporation. This is reflected by a decreasing
temperature difference between the ingoing air versus manure and outgoing air (Fig. 3).
Fig. 3The temperature difference between the manure and the drying air upstream of the MDT, as a function of the dry matter (DM) content of that manure (part C of this study; n = 100, from eight farms). Both the regression coefficient (0.048) and the intercept (–5.4228) are significantly different from zero (P < 0.001).
Fig. 4Mean dry matter (DM) content of the manure samples from the pre-dried manure inside houses 5, 6, and 9 through 14 (part C of this study), from the youngest batch of manure inside the manure drying tunnels, and from the fully dried manure in the storages. The dashed line represents the level of 25% DM as approximate value for freshly excreted manure. Error bars represent standard errors.
y = 0.048x - 5.4228R² = 0.1988
-7
-6
-5
-4
-3
-2
-1
0
1
2
30 50 70 90
[T_m
anur
e] –
[T_u
pstr
eam
_air]
(°C
)
DM content manure inside the MDT (%)
0
20
40
60
80
100
5 6 9 10 11 12 13 14
DM
con
tent
(%)
Farm number
Pre-dried manure to MDT (from belts inside the house)
Youngest batch of manure inside the MDT (from top belt/plate)
Fully dried manure (from the storage)

Evaluation of manure drying tunnels to serve as dust filters in the exhaust of laying hen houses
187
In the Dutch regulation on ammonia emissions from livestock housings, MDTs are allowed
only under the requirement that the manure is pre-dried (by MBA, incorporated in the housing
system) to a DM content of at least 45% to avoid excessive ammonia emissions from the MDT.
Fig 4, however, shows that, at the pre-drying capacities installed (range: 0.1 to 0.7 m3 h–1 bird–1;
Table 2), this level is usually not reached in six out of eight farms, presumably resulting in
substantial emissions of ammonia from the MDT (Fig. 2).
A rough impression of the magnitude of actual emission levels can be obtained by converting
the mean increase in ammonia concentrations (10.2 ppm for belt-type MDTs; 2.9 ppm for plate-
type MDTs) to mass concentrations, and by multiplying those with an assumed drying ventilation
rate. A (conservative) drying ventilation rate of 1.5 m3 h–1 bird–1 hereby results in an emission
estimate of 10.8 mg h–1 bird–1 (equivalent with 95 g year–1 bird–1) for belt-type MDTs and an
emission estimate of 3.0 mg h–1 bird–1 (equivalent with 27 g year–1 bird–1) for plate-type MDTs.
Even though these are very rough estimates, it is clear that, in reality, emissions of MDTs are
considerably higher than the EF of 2 g year–1 bird place–1 in the Netherlands. This EF was based
on the very low (~2.1 g year–1 animal place–1) emission rate reported by Huis in 't Veld et al.
(1999). Two reasons may explain why that study found such low ammonia emissions from the
MDT: (1) the MAT was 3.5 days during which the manure was aerated with 0.82 m3 h–1 bird–1
during 17 hours a day, resulting in a mean DM content of the ingoing manure of 60%; and (2) the
drying ventilation rate was only 0.14 m3 h–1 bird–1.
Table 2, in contrast, shows that current farms with MDTs often don’t use MBA inside their
housing system. This means that manure accumulates in those houses during 3 to 4 days (MAT)
during which ammonia formation is not limited by pre-drying and ammonia generation can take
place undisturbedly. Subsequently, the manure is brought into the MDT where drying ventilation
rates of 1.8 to 5.5 m3 h–1 bird–1 are forced through the droppings. This presumably leads to the
stripping of ammonia, already formed in the house, from the manure, and thus much higher
ammonia emissions than reported by Huis in 't Veld et al. (1999).
Part D: 24-h manure removal and rapid drying
Part D of this study explored the perspective of applying a 24-h manure accumulation time
(MAT) followed by rapid drying inside the MDT. In the farms of part A to C MAT amounted 1
to 5 days (Table 2). As described earlier, the Dutch regulation on ammonia emissions from
livestock housings only allows the use of MDTs under the requirement that the manure is pre-
dried to a DM content of at least 45%. In practice, however, part of the poultry farmers that

Chapter 7
188
operate a MDT have no MBA inside their housing system, turn the MBA off, or use it only
under weather conditions unfavourable for drying (Table 2). Three reasons argue for not using
MBA systems in combination with a MDT: (1) the ventilator of a MBA system consumes much
electricity (~0.2 kW 1000 m–3 of air; e.g., yielding a yearly consumption of ~49,000 kWh for a
modern 40,000 bird laying hen house at 0.7 m3 h–1 bird–1), whereas (2) the manure becomes
sufficiently dry in the MDT regardless of the use of MBA, which makes a MBA-MDT
combination energetically and economically inefficient. And, (3) To effectively pre-dry the
manure by MBA to DM contents beyond 45% requires several days of pre-drying. During this
MAT, ammonia may be generated which may subsequently be stripped from the manure inside
the MDT.
Fig. 5Dry matter content of the manure from the hen house, at consecutive stages in the MDT, on either plate 1 through 4 at farm 15 (A) or belts 1, 5, and 9 at farm 16 (B), and in the storage.
The MDTs at farms 15 and 16 were adapted as described in section 2.2 to achieve rapid
drying (≥ 55% DM content within 12 hours of drying). Fig. 5 shows the actual drying
performance of the adapted MDTs. This figure shows that the aimed level of 55% DM content
was reached in little less than 16 hours of drying at farm 15, whereas at farm 16, a DM content
of almost 70% was reached within 24 hours.
30
40
50
60
70
80
90
Hou
sing
(0)
Pla
te 1
(4)
Pla
te 2
(16)
Pla
te 3
(28)
Pla
te 4
(40)
Sto
rage
(48)
Man
ure
DM
con
tent
(%)
Position (drying time; h) of the manure
Mean Mean ± one SD
30
40
50
60
70
80
90
Hou
sing
(0)
Bel
t 1 (3
)
Bel
t 5 (2
7)
Bel
t 9 (2
7)
Sto
rage
(27)
Man
ure
DM
con
tent
(%)
Position (drying time; h) of the manure
Mean Mean ± one SD
A B
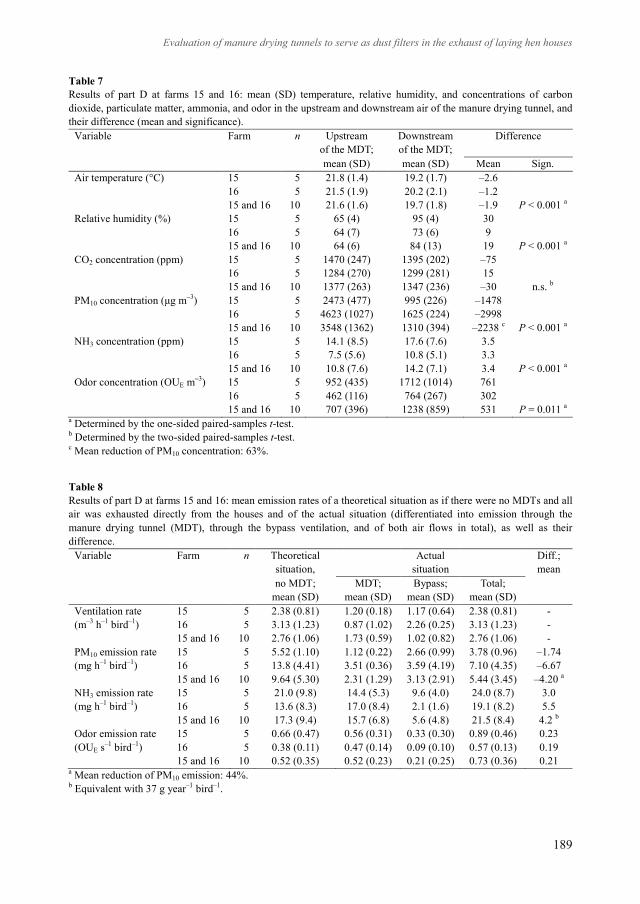
Evaluation of manure drying tunnels to serve as dust filters in the exhaust of laying hen houses
189
Table 7Results of part D at farms 15 and 16: mean (SD) temperature, relative humidity, and concentrations of carbon dioxide, particulate matter, ammonia, and odor in the upstream and downstream air of the manure drying tunnel, and their difference (mean and significance).
Variable Farm n Upstream of the MDT;
Downstream of the MDT;
Difference
mean (SD) mean (SD) Mean Sign.Air temperature (°C) 15 5 21.8 (1.4) 19.2 (1.7) –2.6
16 5 21.5 (1.9) 20.2 (2.1) –1.215 and 16 10 21.6 (1.6) 19.7 (1.8) –1.9 P < 0.001 a
Relative humidity (%) 15 5 65 (4) 95 (4) 3016 5 64 (7) 73 (6) 915 and 16 10 64 (6) 84 (13) 19 P < 0.001 a
CO2 concentration (ppm) 15 5 1470 (247) 1395 (202) –7516 5 1284 (270) 1299 (281) 1515 and 16 10 1377 (263) 1347 (236) –30 n.s. b
PM10 concentration (μg m–3) 15 5 2473 (477) 995 (226) –147816 5 4623 (1027) 1625 (224) –299815 and 16 10 3548 (1362) 1310 (394) –2238 c P < 0.001 a
NH3 concentration (ppm) 15 5 14.1 (8.5) 17.6 (7.6) 3.516 5 7.5 (5.6) 10.8 (5.1) 3.315 and 16 10 10.8 (7.6) 14.2 (7.1) 3.4 P < 0.001 a
Odor concentration (OUE m–3) 15 5 952 (435) 1712 (1014) 76116 5 462 (116) 764 (267) 30215 and 16 10 707 (396) 1238 (859) 531 P = 0.011 a
a Determined by the one-sided paired-samples t-test.b Determined by the two-sided paired-samples t-test.c Mean reduction of PM10 concentration: 63%.
Table 8Results of part D at farms 15 and 16: mean emission rates of a theoretical situation as if there were no MDTs and all air was exhausted directly from the houses and of the actual situation (differentiated into emission through the manure drying tunnel (MDT), through the bypass ventilation, and of both air flows in total), as well as their difference.
Variable Farm n Theoretical situation,
Actual situation
Diff.; mean
no MDT;mean (SD)
MDT; mean (SD)
Bypass; mean (SD)
Total;mean (SD)
Ventilation rate 15 5 2.38 (0.81) 1.20 (0.18) 1.17 (0.64) 2.38 (0.81) -(m–3 h–1 bird–1) 16 5 3.13 (1.23) 0.87 (1.02) 2.26 (0.25) 3.13 (1.23) -
15 and 16 10 2.76 (1.06) 1.73 (0.59) 1.02 (0.82) 2.76 (1.06) -PM10 emission rate 15 5 5.52 (1.10) 1.12 (0.22) 2.66 (0.99) 3.78 (0.96) –1.74(mg h–1 bird–1) 16 5 13.8 (4.41) 3.51 (0.36) 3.59 (4.19) 7.10 (4.35) –6.67
15 and 16 10 9.64 (5.30) 2.31 (1.29) 3.13 (2.91) 5.44 (3.45) –4.20 a
NH3 emission rate 15 5 21.0 (9.8) 14.4 (5.3) 9.6 (4.0) 24.0 (8.7) 3.0(mg h–1 bird–1) 16 5 13.6 (8.3) 17.0 (8.4) 2.1 (1.6) 19.1 (8.2) 5.5
15 and 16 10 17.3 (9.4) 15.7 (6.8) 5.6 (4.8) 21.5 (8.4) 4.2 b
Odor emission rate 15 5 0.66 (0.47) 0.56 (0.31) 0.33 (0.30) 0.89 (0.46) 0.23(OUE s–1 bird–1) 16 5 0.38 (0.11) 0.47 (0.14) 0.09 (0.10) 0.57 (0.13) 0.19
15 and 16 10 0.52 (0.35) 0.52 (0.23) 0.21 (0.25) 0.73 (0.36) 0.21a Mean reduction of PM10 emission: 44%.b Equivalent with 37 g year–1 bird–1.

Chapter 7
190
The results of variables measured upstream and downstream of the MDT at farms 15 and 16
are shown in Table 7. Upon passing the manure layer, the temperature of the drying air
decreased significantly with an average of 1.9 °C whereas the relative humidity increased
significantly with an average of 19% percentage points. Furthermore, PM10 concentration was
reduced significantly with an average of 63%, whereas concentrations of ammonia and odor
increased significantly with 3.4 ppm and 531 OUE m–3, respectively.
Table 8 shows the emission rates of a theoretical situation as if there were no MDTs and all
air was exhausted directly from the houses and of the actual situation with the MDT in place.
From this table, it becomes clear that, compared to the theoretical situation, the actual emission
rate of house and MDT together is 44% lower for PM10 but 24% higher for ammonia and 40%
higher for odor. Thus, the adapted drying strategy at farms 15 and 16 cannot fully prohibit the
release of extra ammonia and odor from the MDTs. Based on the findings of Uenk et al. (1994),
shortening MAT to 18, 12, or 6 hours may further reduce the additional emissions from MDTs.
Part D: PM concentrations during loading
In Fig. 6, two examples are shown of continuous DustTrak measurements of the PM10
concentration upstream and downstream of the MDTs at farms 15 and 16. In these figures,
typical concentration profiles are visible of upstream concentrations that are higher than
downstream concentrations (i.e., PM reductions) and of concentration peaks when the belts
inside the MDTs are running. The excessive peaks in Fig. 6A are caused by the dry manure that
is removed from the MDT and dumped into heaps onto the floor inside the manure drying shed
by means of auger transport pipes. It should be noted that during these two periods (of 2.5 hours
each), PM was not sampled gravimetrically, the exhaust opening of the drying shed was
automatically closed off by a computerized system, and the required ventilation rate was taken
over by the bypass fans of the house. The latter two measures were aimed to prevent peak
emissions from the drying shed. At farm 16, the dry manure from the MDT was transported
through an underground channel to a nearby storage shed. Therefore, the peaks in Fig. 6B
represent the PM release from the running of the MDT only. Since this MDT was positioned in
an open shed which was not closed during running of the MDT, these peaks could emit by wind
dispersion. Overall, the concentration profiles in Fig. 6 emphasize the importance of taking
adequate emission abatement measures during manure drying, transport, handling, and storage.

Evaluation of manure drying tunnels to serve as dust filters in the exhaust of laying hen houses
191
Fig. 6Two typical concentration profiles of PM10 upstream and downstream of the manure drying tunnels (MDTs) at farms 15 (A) and 16 (B) in part D of this study. Arrows indicate loading/running periods of the MDTs: two times 2.5 hours in farm 15 and eight times 6 minutes in farm 16.
Part A through D: PM reduction and MLT
Presumably, the PM reduction by MDTs is achieved by impaction and subsequent adherence
of dust particles to the moist, sticky droppings when the drying air makes its way through the
pores between the droppings. In Fig. 7, this presumption is further examined by plotting the
mean PM10 removal efficiency for each of the 16 MDTs in this study as a function of their mean
MLT. As should be the case under this assumption, the PM10 removal efficiency significantly
increased with increasing MLT.
0
5
10
15
20
13:30 16:30 19:30 22:30 1:30 4:30 7:30 10:30 13:30
PM10
conc
entr
atio
n (m
g m
–3)
Time
Upstream of the MDT Downstream of the MDT
B
0
10
20
30
40
50
13:00 16:00 19:00 22:00 1:00 4:00 7:00 10:00 13:00
PM10
conc
entr
atio
n (m
g m
–3)
Time
Upstream of the MDT Downstream of the MDT
A

Chapter 7
192
Fig. 7Removal efficiency of the manure drying tunnels in this study as a function of their manure layer thickness (part A through D of this study; n = 16). Both the regression coefficient (3.7871; P < 0.001) and the intercept (19.86; P =0.04) are significantly different from zero.
CONCLUSIONS
In this study, we aimed to gain insight into the PM abatement potential and possible extra
emissions of ammonia and odor of manure drying tunnels (MDTs) applied at poultry farms in the
Netherlands (part A and B of this work). In addition, we aimed to elucidate the perspective of
two strategies to reduce ammonia and odor emissions from MDTs: (1) by pre-drying the manure
by manure belt aeration (MBA) systems inside the house (part C of this work), and (2) by
applying a manure accumulation time (MAT) of 24 hours followed by rapid drying inside the
MDT (part D of this work). Our main results and conclusions are:
• MDTs are able to remove particulate matter from the exhaust air of poultry houses. PM10
removal efficiency increases linearly with manure layer thickness: from approximately 35%
at 4 cm to approximately 84% at 17 cm;
• during loading/unloading of the MDT, downstream particulate matter concentrations may
peak excessively. Adequate measures, such as temperarily transferring the ventilation
requirement from drying fans to bypass fans and temperarily closure of the drying shed, are
needed to prevent that emission reductions during drying periods are compensated by
emission peaks during loading periods;
• upon passing the MDT, the concentration of ammonia in the drying air increases
y = 3.7871x + 19.86R² = 0.5954
0
20
40
60
80
100
0 5 10 15 20
Rem
oval
effi
cien
cy fo
r PM
10(%
)
Manure layer thickness (cm)
Belt-type MDT Plate-type MDT

Evaluation of manure drying tunnels to serve as dust filters in the exhaust of laying hen houses
193
substantially; from an average of 5.5 ppm (range: 0.8 to 22.5 ppm) upstream to an average
of 13.9 ppm (range: 1.9 to 70 ppm) downstream the MDT in part C of this study. The
increase of ammonia concentration was considerably higher for belt-type MDTs (mean: 10.2
ppm; range 0 to 38 ppm) than for plate-type MDTs (mean: 2.9 ppm; range: 0.6 to 6.6 ppm),
possibly due to more rapid drying. Estimations based on the aforementioned ammonia
concentrations indicate that actual ammonia emission rates in MDT’s may easily be ten to
fifty times higher than the official EF of 2 g year–1 bird place–1 in the Netherlands;
• upon passing the MDT, the concentration of odor in the drying air increases substantially;
from an average of 822 OUE m–3 to 1178 OUE m–3 (approximately a factor 1.4) in part A of
this study;
• the extra emission of ammonia from the drying manure decreases with increasing dry matter
(DM) content of the manure. Pre-drying the manure inside the housing system probably
prohibits excessive ammonia release from the MDT later on, but even at DM content levels
beyond 50%, substantial ammonia emission remains;
• at a MAT of 24 hours followed by rapid drying inside the MDT, the emission rates of house
and MDT together were 44% lower for PM10, 24% higher for ammonia, and 40% higher for
odor, as compared to emissions from the house alone. Thus, this adapted drying strategy
cannot fully prohibit the release of extra ammonia and odor from the MDTs. Further
research is needed to determine whether shortening MAT to 18, 12, or 6 hours further
reduces the additional emissions from MDTs.
ACKNOWLEDGMENTS
This study was commissioned by the Dutch Ministry of Economic Affairs and the Dutch
Ministry of Infrastructure and Environment. We thank all poultry farmers for allowing us the
conduct of measurements at their farms and for their kind assistance in many occasions. This
study included MDTs of the companies Big Dutchman (Vechta, Germany), Dorset (Aalten, the
Netherlands), Farmer Nederland (Nunspeet, the Netherlands), Jansen Poultry Equipment
(Barneveld, the Netherlands), Rijvers (Ulicoten, the Netherlands), and Salmet (Zonne-Ei-Farm,
Terschuur, the Netherlands). We thank all companies for their participation in this project.
Furthermore, we thank Jansen Poultry Equipment for adapting the MDT at farm 16, and Mr.
Arjan Gussinklo and Mr. Harrie Beekmans for sharing their practical expertise on manure
drying. We thank our colleagues Mr. Klaas Blanken, Mr. Jos Huis in’t Veld, Mrs. Annemieke
Hol, Mr. Geert Kupers, Mr. Eef Lovink, Mr. Guus Nijeboer, Mr. Johan Ploegaert, and Mr. Jean

Chapter 7
194
Slangen for data collection, maintenance and calibration of instruments, and conducting lab
analyses.
REFERENCES
Albright, L.D., 1990. Algorithms for determining the Psychrometric conditions of humid air. Environment control for animals and plants. ASAE, St. Joseph, Michigan, USA.
ApSimon, H.M., Kruse, M., Bell, J.N.B., 1987. Ammonia emissions and their role in acid deposition. Atmos.Environ. 21:1939–1946.
Borlée, F., Yzermans, C.J., Van Dijk, C.E., Heederik, D., Smit, L.A.M., 2015. Increased respiratory symptoms in COPD patients living in the vicinity of livestock farms. Eur. Respir. J. 46:1605–1614.
Brunekreef, B., Forsberg, B., 2005. Epidemiological evidence of effects of coarse airborne particles on health. Eur.Respir. J. 26:309–318.
Brunekreef, B., Harrison, R.M., Künzli, N., Querol, X., Sutton, M.A., Heederik, D.J.J., Sigsgaard, T., 2015. Reducing the health effect of particles from agriculture. Lancet Respir. Med. 3:831–832.
Cambra-López, M., Hermosilla, T., Lai, H.T.L., Aarnink, A.J.A., Ogink, N.W.M., 2011. Particulate matter emitted from poultry and pig houses: Source identification and quantification. Trans. ASABE 54:629–642.
Cambra-López, M., Winkel, A., Mosquera, J., Ogink, N.W.M., Aarnink, A.J.A., 2015. Comparison between light scattering and gravimetric samplers for PM10 mass concentration in poultry and pig houses. Atmos. Environ.111:20–27.
CEN, 1998. EN 12341:1998. Air quality - Determination of the PM 10 fraction of suspended particulate matter -Reference method and field test procedure to demonstrate reference equivalence of measurement methods. Comité Européen de Normalisation (CEN; European Committee for Standardization), Brussels, Belgium.
CEN, 2003. EN 13725:2003. Air quality - Determination of odour concentration by dynamic olfactometry. Comité Européen de Normalisation (CEN; European Committee for Standardization), Brussels, Belgium.
CEN, 2005. EN 14907:2005. Ambient air quality - Standard gravimetric measurement method for the determination of the PM2.5 mass fraction of suspended particulate matter. Comité Européen de Normalisation (CEN; European Committee for Standardization), Brussels, Belgium.
Chepete, J.H., Xin, H., Li, H. (2011). Ammonia emissions of laying-hen manure as affected by accumulation time. J. Poult. Sci. 48:133–138.
CIGR, 2002. 4th Report of Working Group on Climatization of animal houses. Heat and moisture production at animal and house levels (eds. Pedersen, S. and K. Sällvik). International Commission of Agricultural Engineering (CIGR), Section II.
Costa, A., Ferrari, S., Guarino, M., 2012. Yearly emission factors of ammonia and particulate matter from three laying-hen housing systems. Animal Prod. Sci. 52:1089–1098.
Demmers, T.G.M., Hissink, M.G., Uenk, G.H., 1992. Het drogen van pluimveemest in een droogtunnel en het effect hiervan op de ammoniakemissie [The drying of poultry manure in a drying tunnel and the effect on ammonia emission; in Dutch, with English summary]. Report 92-6. IMAG-DLO, Wageningen, the Netherlands.
Demmers, T. G. M., Saponja, A., Thomas, R., Phillips, G. J., McDonald, A. G., Stagg, S., Bowry, A., Nemitz, E. (2010). Dust and ammonia emissions from UK poultry houses. In: XVII-th World Congress of the International Commission of Agricultural and Biosystems Engineering (CIGR), June 13–17, 2010, Québec City, Canada.
Erisman, J. W., Schaap, M. (2004). The need for ammonia abatement with respect to secondary PM reductions in Europe. Environmental Pollution, 129(1), 159–163.
EU, 2008. Directive 2008/50/EC of the European Parliament and of the Council of 21 May 2008 on ambient air quality and cleaner air for Europe. Official J. Eur. Union L152:1–44.
Groot Koerkamp, P.W.G., 1994. Review on emissions of ammonia from housing systems for laying hens in relation to sources, processes, building design and manure handling. J. Agric. Eng. Res. 59:73–87.
Groot Koerkamp, P.W.G., Metz, J.H.M., Uenk, G.H., Phillips, V.R., Holden, M.R., Sneath, R.W., Short, J.L., White, R.P., Hartung, J., Seedorf, J., Schröder, M., Linkert, K.H., Pedersen, S., Takai, H., Johnsen, J.O., Wathes, C.M., 1998. Concentrations and emissions of ammonia in livestock buildings in Northern Europe. J. Agric. Eng.Res. 70:79–95.
Groot Koerkamp, P.W.G., Wever, A.C., Huis in 't Veld, J.W.H., Hol, J.M.G., 1999. Ammoniakemissie uit een batterijstal voor leghennen met droging van de mest in droogtunnels boven de kooien in de stal [Ammonia

Evaluation of manure drying tunnels to serve as dust filters in the exhaust of laying hen houses
195
emission from a battery house for laying hens with manure drying in tunnels above the cages in the house; in Dutch]. Report P 99-06. IMAG-DLO, Wageningen, the Netherlands.
Heederik, D.J.J., Opstal-van Winden, A.J.W., Smit, L.A.M., Wouters, I.M., Hooiveld, M., IJzermans, C.J., Van der Sman-de Beer, F., Spreeuwenberg, P.P.M., De Bruin, A., Van Rotterdam, B., 2011. Mogelijke effecten van intensieve-veehouderij op de gezondheid van omwonenden: onderzoek naar potentiële blootstelling en gezondheidsproblemen [Possible effects of intensive livestock production on health of residents: research into possible exposure and health problems; in Dutch]. Institute for Risk Assessment Sciences (IRAS), Utrecht University; Netherlands institute for health services research (NIVEL); National Institute for Public Health and the Environment (RIVM), Utrecht, the Netherlands.
Hendriks, C., Kranenburg, R., Kuenen, J., van Gijlswijk, R., Wichink Kruit, R., Segers, A., Denier van der Gon, H., Schaap, M., 2013. The origin of ambient particulate matter concentrations in the Netherlands. Atmos. Environ.69:289–303.
Hooiveld, M., Smit, L.A.M., Van Der Sman-De Beer, F., Wouters, I.M., Van Dijk, C.E., Spreeuwenberg, P., Heederik, D.J.J., Yzermans, C.J., 2016. Doctor-diagnosed health problems in a region with a high density of concentrated animal feeding operations: A cross-sectional study. Environ. Health 15:24, 9 pp.
Hooiveld, M., van Dijk, C.E., van der Sman-De Beer, F., Smit, L.A.M., Vogelaar, M., Wouters, I.M., Heederik, D.J.J., Yzermans, C.J., 2015. Odour annoyance in the neighbourhood of livestock farming – Perceived health and health care seeking behaviour. Ann. Agric. Environ. Med. 22:55–61.
Huis in 't Veld, J.W.H., Groot Koerkamp, P.W.G., Scholtens, R., 1999. Voletage volièresysteem voor legouderdieren en een droogtunnel met geperforeerde mestbanden [Aviary housing system for layer breeders and drying tunnel for manure; in Dutch, with English abstract]. Report 99-10. IMAG, Wageningen, the Netherlands.
Kroodsma, W., Bleijenberg, R., Ogink, N.W.M., Wintjens, Y., 1996. Nadroging van voorgedroogde leghennenmest volgens het HELI-systeem en de laagsgewijze composteermethode [Drying of pre-dried layer droppings with the HELI-system and the in layers compost method; in Dutch, with English abstract]. Report 96-08. IMAG-DLO,Wageningen, the Netherlands.
Lai, H.T.L., Aarnink, A.J.A., Cambra-López, M., Huynh, T.T.T., Parmentier, H.K., Groot Koerkamp, P.W.G., 2014. Size distribution of airborne particles in animal houses. Agricultural Engineering International: CIGR Journal, 16:28–42.
Li, Q.F., Wang-Li, L., Walker, J.T., Shah, S.B., Bloomfield, P., Jayanty, R.K.M., 2012. Particulate matter in the vicinity of an egg production facility: Concentrations, statistical distributions, and upwind and downwind comparison. Trans. ASABE 55:1965–1973.
Mielcarek, P., Rzeźnik, W., 2015. Odor emission factors from livestock production. Polish J. Environ. Studies 24:27–35.
Mosquera, J., Groenestein, C.M., Ogink, N.W.M., Aarnink, A.J.A., 2012. Evaluation of the CO2 mass balance method to calculate ventilation rates from mechanically ventilated livestock buildings. In: 9th International Livestock Environment Symposium (ILES), July 8–12, 2012, Valencia, Spain.
Nimmermark, S., 2004. Odour influence on well-being and health with specific focus on animal production emissions. Ann. Agric. Environ. Med. 11:163–173.
O'Connor, A.M., Auvermann, B., Bickett-Weddle, D., Kirkhorn, S., Sargeant, J.M., Ramirez, A., Von Essen, S.G.,2010. The association between proximity to animal feeding operations and community health: A systematic review. PLoS ONE 5(3), 13 pp.
Ogink, N.W.M., 2011. Protocol voor meting van geuremissie uit huisvestingssystemen in de veehouderij 2010 [Protocol for the measurement of odour emissions from housings in animal production 2010; in Dutch]. Report 491. Wageningen University and Research Centre, Livestock Research, Lelystad, the Netherlands.
Ogink, N.W.M., Aarnink, A.J.A., 2011. Plan van aanpak bedrijfsoplossingen voor fijnstofreductie in de pluimveehouderij [Plan of action for particulate matter mitigation solutions in poultry; in Dutch, with English summary]. Report 113. Animal Sciences Group, Wageningen University and Research Centre, Lelystad, the Netherlands.
Ogink, N.W.M., Groot Koerkamp, P.W.G., 2001. Comparison of odour emissions from animal housing systems with low ammonia emission. Water Sci. Techn. 44:245–252.
Ogink, N.W.M., Hofschreuder, P., Aarnink, A.J.A., 2011. Protocol voor meting van fijnstofemissie uit huisvestingssystemen in de veehouderij 2010 [Protocol for the measurement of fine emissions from housings in animal production 2010; in Dutch]. Report 492. Wageningen University and Research Centre, Livestock Research, Lelystad, the Netherlands.
Ogink, N.W.M., Mosquera, J., Hol, J.M.G., 2011. Protocol voor meting van ammoniakemissie uit huisvestingssystemen in de veehouderij 2010 [Measurement protocol for ammonia emission from housing systems in livestock production 2010; in Dutch]. Report 454. Wageningen University and Research Centre, Livestock Research, Lelystad, the Netherlands.

Chapter 7
196
Pedersen, S., Blanes-Vidal, V., Joergensen, H., Chwalibog, A., Haeussermann, A., Heetkamp, M.J.W., Aarnink, A.J.A., 2008. Carbon dioxide production in animal houses: a literature review. Agricultural Engineering International: CIGR Ejournal, Vol. X, December 2008. Manuscript BC 08 008.
RIVM (2014). Annual national emissions of PM10; in total and per sector/source, for 2012. Retrieved 11 February 2014, from http://www.emissieregistratie.nl.
Schinasi, L., Horton, R.A., Guidry, V.T., Wing, S., Marshall, S.W., Morland, K.B., 2011. Air pollution, lung function, and physical symptoms in communities near concentrated swine feeding operations. Epidemiology 22:208–215.
Schlesinger, R.B., 2007. The health impact of common inorganic components of fine particulate matter (PM2.5) in ambient air: A critical review. Inhal. Toxic. 19:811–832.
Seedorf, J., Hartung, J., Schröder, M., Linkert, K.H., Phillips, V.R., Holden, M.R., Sneath; R.W., Short, J.L., White, R.P., Pedersen, S., Takai, H., Johnsen, J.O., Metz, J.H.M., Groot Koerkamp, P.W.G., Uenk, G.H., Wathes, C.M.,1998. Concentrations and emissions of airborne endotoxins and microorganisms in livestock buildings in Northern Europe. J. Agric. Eng. Res. 70: 97–109.
Smit, L.A.M., Hooiveld, M., Van Der Sman-de Beer, F., Opstal-van Winden, A.W.J., Beekhuizen, J., Wouters, I.M.,Yzermans, C.J., Heederik, D., 2014. Air pollution from livestock farms, and asthma, allergic rhinitis and COPD among neighbouring residents. Occup. Environ. Med. 71:134–140.
Takai, H., Pedersen, S., Johnsen, J.O., Metz, J.H.M., Groot Koerkamp, P.W.G., Uenk, G.H., Phillips, V.R., Holden, M.R., Sneath, R.W., Short, J.L., White, R.P., Hartung, J., Seedorf, J., Schröder, M., Linkert, K.H., Wathes, C.M.,1998. Concentrations and emissions of airborne dust in livestock buildings in Northern Europe. J. Agric. Eng.Res. 70:59–77.
Uenk, G.H., Monteny, G.J., Demmers, T.G.M., Hissink, M.G., 1994. Praktijkonderzoek naar het drogen van leghennenmest in een droogtunnel en het effect op de ammoniak-, geur, en stofemissie [Drying of poultry manure in a tunnel and the effect on the emission of ammonia, odour and dust; in Dutch, with English summary]. Report 94-21. IMAG-DLO, Wageningen, the Netherlands.
Van Zanten, M.C., Van Alphen, A., Wesseling, J., Mooibroek, D., Nguyen, P.L., Groot Wassink, H., Verbeek, C.,2014. Monitoringsrapportage NSL 2014 [State of affairs of the National Air Quality Cooperation Programme 2014; in Dutch with English summary]. National Institute for Public Health and the Environment (RIVM),Bilthoven, the Netherlands.
Velders, G.J.M., Aben, J.M.M., Blom, W.F., Van Dam, J.D., Elzenga, H.E., Geilenkirchen, G.P., Hammingh, P., Hoen, A., Jimmink, B.A., Koelemeijer, R.B.A., Matthijsen, J., Peek, C.J., Schilderman, C.B.W., Van der Sluis, O.C., De Vries, W.J., 2008. Concentratiekaarten voor grootschalige luchtverontreiniging in Nederland, rapport2008 [Large-scale air quality concentrations maps in the Netherlands, report 2008; in Dutch with English abstract]. Report 500088002. Milieu- en Natuurplanbureau, Bilthoven, the Netherlands.
VSN, 2014. GenStat reference manual (release 17). Version 17.1.0.14713. Hemel Hempstead, UK.Winkel, A., Llorens Rubio, J., Huis in't Veld, J.W.H., Vonk, J., Ogink, N.W.M., 2015a. Equivalence testing of filter-
based, beta-attenuation, TEOM, and light-scattering devices for measurement of PM10 concentration in animal houses. J. Aerosol Sci. 80:11–26.
Winkel, A., Mosquera, J., Groot Koerkamp, P.W.G., Ogink, N.W.M., Aarnink, A.J.A., 2015b. Emissions of particulate matter from animal houses in the Netherlands. Atmos. Environ. 111:202–212.
Wood, D., Cowherd, S., Van Heyst, B., 2015. A summary of ammonia emission factors and quality criteria for commercial poultry production in North America. Atmos. Environ. 115:236–245.
Zhao, Y., Aarnink, A.J.A., De Jong, M.C.M., Groot Koerkamp, P.W.G., 2014. Airborne microorganisms from livestock production systems and their relation to dust. Crit. Rev. Environ. Sci. Techn. 44:1071–1128.
Zhao, Y., Aarnink, A.J.A., Hofschreuder, P., Groot Koerkamp, P.W.G., 2009. Evaluation of an impaction and a cyclone pre-separator for sampling high PM10 and PM2.5 concentrations in livestock houses. J. Aerosol Sci.40:868–878.

Chapter 8Equivalence testing of filter-based, beta-attenuation, TEOM, and
light-scattering devices for measurement of PM10 concentration
in animal houses
A. Winkel a, J. Llorens Rubio b, J. W.H. Huis in’t Veld a, J. Vonk c and N.W.M. Ogink a
a Wageningen UR Livestock Research, Wageningen, the Netherlandsb Institute of Animal Science and Technology,Universidad Politécnica de Valencia, Valencia, Spain
c National Institute for Public Health and the Environment, Bilthoven, the Netherlands
Journal of Aerosol Science (2015) 80:11–26
Reprinted with permission from Elsevier Ltd
Available online at: http://dx.doi.org/10.1016/j.jaerosci.2014.10.009

Chapter 8
198
ABSTRACT
Emissions of particulate matter (PM) from poultry and pig houses may contribute
significantly to ambient concentrations. Yet, our knowledge on the accuracy and comparability
of samplers available for measuring the high PM10 concentrations (>100 μg m–3) in the inside air
directly upstream of the ventilation exhausts of these buildings is very limited. The aim of this
study was to provide insight into this matter for five candidate samplers: a filter-based cyclone
sampler (CYS), the Thermo Scientific FH 62 I-R beta-attenuation sampler (BAS), the Thermo
Scientific Tapered Element Oscillating Microbalance, model 1400ab (TEOM), the TSI DustTrak
model 8520 (DT), and the GRIMM Portable Aerosol Spectrometer model 1.109 (PAS).
Equivalence tests were carried out following European Standard EN 12341 using two devices for
each candidate sampler (CAS) and four filter-based low-volume reference samplers (RES).
Measurements were performed inside three major animal housings (a fattening pig house, a
laying hen house, and a broiler house) and inside an office room. Our key results and
conclusions are: (1) neither one of the five CASs, nor the RES itself, met the EN 12341
requirement for comparability between devices of the same sampler type. Using a less strict
boundary for this aspect – in concert with performing duplicate sampling – may be appropriate.
(2) The CYS met the EN 12341 accuracy requirements in pigs and layers, but overestimated the
RES concentration in broilers. The BAS, TEOM, and DT underestimated, and the PAS
overestimated, RES concentrations in a systematic manner. The use of correction factors seems
to be a promising method to calibrate measured values to RES concentrations. (3) The BAS,
TEOM, DT, and PAS started to show scattered regression after 432–500 h of sampling, which
stresses the need for shortened time intervals between full services. In conclusion, some of the
samplers tested could be regarded acceptable when appropriate measures (such as duplicate
sampling, correction factors, and more frequent servicing) are applied.

Equivalence testing of devices for measurement of PM10 concentration in animal houses
199
NOMENCLATURE
95%-CIa The two-sided 95% confidence interval for Yi on the original scale (μg m–3)95%-CIr The two-sided 95% confidence interval for Yi on a relative scale (%)CAS Candidate samplerCYS Cyclone samplerDi = Yi1 – Yi2 The difference between the ith concentration values measured by candidate samplers 1 and
2DT DustTrak, model 8520BAS FH 62 I-R beta-attenuation samplerN The number of performed measurementsn The number of valid data pairs in the comparability or accuracy analysisPAS Portable Aerosol Spectrometer, model 1.109PM10 Particulate matter which passes through a size-selective inlet with a 50% efficiency cut-off
at 10 μm aerodynamic diameter (EN 12341)PM2.5 Particulate matter which passes through a size-selective inlet with a 50% efficiency cut-off
at 2.5 μm aerodynamic diameter (EN 14907)RES Reference sampler, described in standard EN 12341, annex B.1RIVM Rijksinstituut voor Volksgezondheid en Milieu (National Institute for Public Health and
the Environment)Sa Absolute standard deviationSr Relative standard deviationt(0.975;n–2) Value from the Student’s t distribution at the 0.975-quantile and n–2 degrees of freedomTEOM Tapered Element Oscillating Microbalance, model 1400abWLR Wageningen University and Research Centre, Livestock ResearchYi = (Yi1 + Yi2) / 2 The average of the ith measured concentration values of candidate samplers 1 and 2Yi1 The ith concentration value measured by candidate sampler 1Yi2 The ith concentration value measured by candidate sampler 2

Chapter 8
200
INTRODUCTION
Ambient particulate matter (PM) concentrations are associated with respiratory and
cardiovascular morbidity, may shorten life expectancy, and are linked to variations in public
health indicators, such as hospital admissions and mortality figures (Brunekreef and Holgate,
2002; Pope and Dockery, 2006). In areas with high numbers of poultry and pig houses, a relevant
portion of the PM present in the atmosphere is expected to originate from the ventilation
exhausts of these houses. In the Netherlands, in 2011, the total primary PM10 emission was
estimated at 32.6 kTon with contributions of 4.2 kTon (or 13%) for poultry houses, 1.2 kTon (or
4%) for pig houses and 0.3 kTon (or 1%) for cattle houses (RIVM, 2011). In order to determine
emissions of PM10 and PM2.5 from animal houses, it is essential to have samplers available that
yield concentrations that are consistent with the ‘true’ concentration (referred to in this paper as
accuracy) and comparable between devices when tested simultaneously and side by side
(referred to in this paper as comparability).
The development of such a sampler was described by Hofschreuder et al. (2007) who used the
low volume filter-based reference samplers (RESs) described in Annex B1 of European standard
EN 12341 for PM10 (CEN, 1998) and in par. 5.1.2.2 of European standard EN 14907 for PM2.5
(CEN, 2005) as basic systems. These systems were adapted in a number of ways, including
substitution of the impaction pre-separators by cyclonic pre-separators. Equivalence tests were
performed by Zhao et al. (2009) who showed that both cyclone samplers (CYSs) achieved good
comparability between samplers and accuracy to the RES at low concentrations. For high poultry
and pig house PM10 concentrations, correction equations were published to calibrate measured
CYS values to RES values. Since 2007, these CYSs have been used in a national survey
quantifying PM10 and PM2.5 emissions from 13 types of animal houses in the Netherlands
(Winkel et al., 2014).
Several other samplers have been used to determine PM10 and PM2.5 emissions from animal
houses that may be portable, battery-powered and yielding continuous data, almost instantly
available in digital format. In recent years, the Thermo Fisher Scientific Tapered Element
Oscillating Microbalance (TEOM) has been used by research groups in Spain (Adell et al., 2012;
Calvet et al., 2009), the UK (Demmers et al., 2010), and the USA (Hayes et al., 2013; Joo et al.,
2013; Koziel et al., 2004; S. Li et al., 2011; Lin et al., 2012; Ni et al., 2012). Joo et al. (2013) and
Lin et al. (2012) furthermore used the Thermo Scientific FH 62 C14 beta-attenuation monitor to
measure inlet concentrations. Others groups have used light-scattering devices, such as the TSI
DustTrak model 8520 by researchers in Canada (Morgan et al., 2014; Roumeliotis et al., 2010a,

Equivalence testing of devices for measurement of PM10 concentration in animal houses
201
2010b; Roumeliotis and Van Heyst, 2007) and the USA (Modini et al., 2010; Visser et al., 2006),
the SKC EPAM-5000 by researchers in Italy and Germany (Costa et al., 2012; Costa and
Guarino, 2009; Fabbri et al., 2007; Haeussermann et al., 2008), and the GRIMM Portable
Aerosol Spectrometer model 1.109 by researchers in Belgium (Van Ransbeeck et al., 2012; Van
Ransbeeck et al., 2013a).
When choosing a sampler for PM measurement in animal houses, it is important to consider
that each sampler has its specific sensitivities and potential sources of bias (McMurry, 2000) that
may lead to under- or overestimation of ‘true’ concentrations and emissions. At the high
concentrations usually found in the inside air directly upstream of ventilation exhausts, pre-
separation methods of samplers (e.g., greased impactors) may be sensitive to overloading.
Particles outside the target size fraction then travel further into the measuring section of the
sampler, resulting in overestimations (Van Ransbeeck et al., 2013b; Zhao et al., 2009). Filter-
based systems that require manual weighing are sensitive to agitation and loss of PM during
filter transport, storage, and handling, especially when filters are heavily loaded. Furthermore,
compounds in the gas phase might be adsorbed to the filter material or absorbed into the PM and
erroneously weighed as PM (Andersen et al., 2014). When light-scattering devices are used that
have been factory-calibrated with a standard type of aerosol, they are likely to show substantial
bias (Cambra-López et al., 2014; Costa et al., 2012; Costa and Guarino, 2009; Post et al., 2010;
Van Ransbeeck et al., 2013b) due to differences in refractive index, density, size, and shape
between the calibration aerosol and the actual aerosol sampled (Görner et al., 1995). For the
standard configured TEOM, heating of the sample stream to 50°C may drive off part of the
volatile components of PM, such as particle-bound water, ammonium nitrate, and (semi-)volatile
organic compounds. This artifact plays a role in ambient PM (Allen et al., 1997), but also in
livestock PM (Q. F. Li et al., 2012), and is more pronounced for the smaller fractions (e.g.,
PM2.5) than for larger fractions. Next to desorption, water vapor in the sample stream may also
adsorb to the PM present on the TEOM filter, especially when the filter load exceeds ~50% of its
capacity, as demonstrated by Heber et al. (2006) for laying hen PM. It is evident that PM
volatilization is also likely when loaded filters are conditioned by oven-drying prior to weighing
(as can be found in literature incidentally), which is therefore not allowed when following the
procedures described in EN 12341 (Annex C).
Measures to control the aforementioned error sources may include intensified schedules for
servicing, cleaning and calibration (Heber et al., 2006; Zhao et al., 2009), decreasing the sample
flow rate to avoid high PM loadings (Heber et al., 2006), technical modifications to standard
samplers (Heber et al., 2006; Hofschreuder et al., 2007), lowering the sample stream heating

Chapter 8
202
temperature (Li et al., 2012), re-calibration of light-scattering samplers using the aerosol of
interest, programming correction factors in the samplers’ operating software, or to apply such
corrections to datasets produced (Costa et al., 2012; Costa and Guarino, 2009; Morgan et al.,
2014; Roumeliotis et al., 2010a, 2010b). Most papers on livestock PM emissions however, do
not or very briefly, describe how samplers were configured and error sources controlled.
Despite that some studies found that data from co-located samplers varied significantly
(Cambra-López et al., 2014; Post et al., 2010), studies focusing on the accuracy of samplers to
reference methods, their comparability and applicability, or adequate measures to ensure their
proper functioning, are still scarce (Heber et al., 2006; Li et al., 2012; Van Ransbeeck et al.,
2013b; Zhao et al., 2009). Consequently, a review on PM from livestock production systems
identified the validation and harmonization of PM sampling devices as one of the major
priorities for future research (Cambra-López et al., 2010).
The aim of the work presented here was to gain insight into the accuracy and comparability of
five commonly used samplers when measuring high PM10 concentrations (>100 μg m–3) inside a
fattening pig house, a laying hen house, and a broiler house, following the main principles
described in EN 12341 (CEN, 1998).
METHODOLOGY
Outline of the study
Emissions of PM from animal houses are often determined from concentration measurements
in the inside air within 3 m upstream of exhaust fans or shafts. This approach has the advantages
that air velocity is below 1 m s–1 (avoiding non-isokinetic conditions inside shafts due to varying
ventilation rates) and that the air can be assumed to be homogenously mixed and representative
for that emitted from the building. The sampling conditions directly upstream of exhausts (e.g.,
air velocity, air flow patterns, air temperature, and air humidity) show similarities to the
conditions in ambient air. For the latter situation, European Standard EN 12341 (CEN, 1998)
prescribes PM10 reference samplers, procedures and statistical tests to be used to demonstrate
reference equivalence of candidate samplers. For animal house environments however, such
reference samplers or standards do not exist. In view of these considerations, we followed the
main principles of EN 12341 to perform equivalence tests inside animal houses.
In this study, tests were carried out inside three animal houses (a fattening pig house, a laying
hen house, and a broiler house), and inside an office room, using four devices of the European

Equivalence testing of devices for measurement of PM10 concentration in animal houses
203
reference sampler (RES) and two devices of five candidate samplers (CASs; referred to in this
work as devices A and B). CASs included the aforementioned Cyclone Sampler (CYS), the FH
62 I-R beta-attenuation sampler (BAS), the TEOM 1400ab (TEOM), the DustTrak model 8520
(DT), and the Portable Aerosol Spectrometer model 1.109 (PAS). Prior to the start of the project,
all samplers were serviced, cleaned, and calibrated extensively, to assure their proper functioning
(details of these procedures repeated during the project are given in Table 2). Between October
2012 and February 2013, we subsequently performed 30 measurements in pigs, 24 in layers, and
46 in broilers (the latter referred to in this work as ‘broilers-1’), which were all 3-h
measurements. In comparison to the pig house and layer house data, broiler-1 data of BAS,
TEOM, DT, and PAS showed poor regression to the RES concentration, which we believed to be
the result of pollution of these devices. Therefore, all devices were again serviced, cleaned, and
calibrated extensively to bring them back into their condition at the beginning of the project.
Then, we performed fifteen 24-h office measurements and a second series of nineteen 3-h broiler
house measurements (the latter referred to in this work as ‘broilers-2’) between February and
April 2013. In total, 134 successful measurements were included in this work.
Sampling devices and their operation
Samplers were operated by either Wageningen UR Livestock Research (WLR) or the
National Institute for Public Health and the Environment (RIVM). An overview of the samplers
used in this study is given in Table 1. Table 2 lists the service schedule adopted for each sampler
in this work. A description of their working principle, settings, and operation is given in the
following sections.

Chapter 8
204
Table 1Overview of main characteristics of the reference sampler and the five candidate samplers evaluated in this work.
Sampler Operatedby
In use since
Sample flow rate(L min–1)
Sampleflowheating
Pre-separationsystem
Measuringprinciple
Measuringrange (μg m–3)
RES WLR 2012 38.3 None Impactor (EN 12341, Annex B.1)
Filterweighing
Not specified
CYS WLR 2012 16.7 None Cyclone (model URG-2000-30ENB)
Filterweighing
Not specified
BAS RIVM 2007 16.7 Ambient+ <5°C
Impactor (EN 12341, Annex B.1)
Beta-rayattenuation
4 to 10,000
TEOM RIVM 2004 16.7 a
3.0 b50°C Impactor (US-EPA 40
CFR 50, App. L)Micro-balance
5 to >10,000
DT WLR 2008 1.7 None TSI PM10 impactioninlet nozzle
Light-scattering
1 to 100,000
PAS WLR 2009 1.2 None None Light-scattering
0.1 to 100,000
a Total sample flow pulled through impactor.b Sample flow to measuring chamber after passing a flow splitter.
Table 2Service schedule adopted in this study.
Sampler Service point Frequencyin this work
Service intervaloperating manual
RES/CYS Cleaning (and greasing) of pre-separator Every 1–3 measurements -Disassembly and wet cleaning Every 5–10 measurements -Calibration of temperature sensor Between sampling locations -Calibration of gas meter inside the pump Between sampling locations -
BAS Inspection of filter tape (breaks, tension) Prior to each measurement 3 monthsCleaning (and greasing) of pre-separator Every 1–3 measurements 2 monthsCheck on heating system, cleaning of sampling
tube, calibration of temperature, pressure, and flow rate, offset check, mass calibration
Between sampling locations 3–6 months
Full internal cleaning After broilers-1 AnnuallyTEOM Cleaning of pre-separator Every 1–3 measurements 1–3 months
Cleaning of air inlet system Between sampling locations AnnuallyLeak check, calibration of flow rate Between sampling locations AnnuallyReplacement of inline filters After broilers-1 6 monthsFull internal cleaning After broilers-1 Annually
DT Cleaning of inlet nozzle Every 1–3 measurements 350 h at 1 mg m–3
Zero-check and re-zeroing Every 1–3 measurements DailyFlow check and adjustment Every 5–10 measurements Each sampleReplacement of internal filters Between sampling locations 700 h at 1 mg m–3
Internal cleaning and mass calibration After broilers-1 AnnuallyPAS Cleaning of inlet piece Every 1–3 measurements Not specified
Replacement of PTFE filter, cleaning chamber Every 5–10 measurements <20 mg loadingCleaning of optical chamber by air blowing Between sampling locations Not specifiedInternal cleaning and mass calibration After broilers-1 Annually

Equivalence testing of devices for measurement of PM10 concentration in animal houses
205
Reference sampler (RES)
The low-volume PM10 RES described in annex B.1 of EN 12341 (CEN, 1998) was used for
determination of the ‘true’ PM10 concentration. The RES consisted of an air inlet head with a
circumferential slit, an impaction pre-separator composed of eight impaction nozzles and a
greased impaction plate, and a filter holder. Photographs of these RES components are given by
Zhao et al. (2009). RESs were assembled from newly purchased components. Air was drawn
through the RES using sampling pumps (Tecora, model Charlie HV; Ravebo B.V., Brielle, the
Netherlands). These pumps use the temperature measured by a sensor near the inlet head of the
RES and the temperature, pressure, and airflow of the gas meter inside the pump to automatically
adjust the air flow rate to the programmed value. Hereby, pumps are able to maintain a constant
air flow rate (nominal value ± 2%) when filter load and pressure difference across the filter
increases.
After pre-separation, the PM10 fraction was collected on glass fiber filters (type GF-3, Ø 47
mm, Macherey-Nagel, Düren, Germany) inside the filter holder. Unloaded and loaded filters
were weighed in a weighing room under standard conditions (20 ± 1°C and 50 ± 5% relative
humidity), as described in EN 12341 (CEN, 1998). After 48 h of stabilization, each filter was
weighed four times spread over two consecutive days using a balance with a resolution of 10 µg
(AT261 DeltaRange, Mettler, Greifensee, Switzerland). The average value was recorded as the
filter weight and the mass difference between loaded and unloaded filters equaled the mass of
collected PM10. PM10 concentrations were calculated by dividing the mass of collected PM10 by
the volume of air drawn through the filter. During transport, filter cassettes were put in Petri
dishes and kept in a small barrel.
Cyclone Sampler (CYS)
The CYS developed by WLR (Hofschreuder et al., 2007) is very similar to the RES described
above, but has three main differences. First, the inlet head has been modified: the eight
impaction nozzles are replaced by eight short tubular screws that fit the holes for the impaction
nozzles and the impaction body of the inlet is replaced by a cylinder with a hollow cone frustum.
Second, a PM10 cyclone (model URG-2000-30ENB; URG Corp., Chapel Hill NC, USA) is used
for particle pre-separation which requires a flow rate of 16.7 L min–1 (1 m3 h–1). Third, the inlet
head, cyclone, and filter holder are applied as separate components, connected by one U-shaped
and one J-shaped air pipe, air-sealed with locknuts. The adapted inlet body, tubular screws, air
pipes, and locknuts were custom made in the central workshop of WLR, since they are not

Chapter 8
206
commercially available. Photographs of CYS components are given by Zhao et al. (2009). For
the CYS, air sampling and filter weighing was carried out as described for the RES.
FH 62 I-R beta-attenuation sampler (BAS)
The BASs were two FH 62 I-R devices (Thermo Fisher Scientific, Breda, the Netherlands).
The FH 62 models have been approved as equivalent method for ambient PM10 monitoring in
Europe (according to EN 12341) (Thermo, 2004) and in the USA (models FH 62 I-N and FH 62
C14; Designation Numbers EQPM-0990-076 and EQPM-1102-150) (US-EPA, 2013). The BASs
are currently used by the RIVM as PM10 samplers in the National Air Quality Monitoring
Network of the Netherlands. Air is drawn through their inlet head, a greased impactor (described
in EN 12341, Annex B.1), and a vertical sampling pipe by a rotary vane pump outside the BAS.
The sampling pipe was equipped with an ‘automatic sample condition system’ which slightly
heats the sample stream flow (with <5°C) to prevent condensation of water vapor inside the BAS
without severe loss of volatile compounds. Inside the device, PM10 is collected on a glass fiber
filter tape (filter nr. 10, 40 mm width; Schleicher and Schuell Bioscience, Dassel, Germany). A
dual beam of beta-radiation, originating from a gaseous Krypton-85 source, is directed upwards
through the filter tape and subsequently measured in an ionization chamber. The weakening of
the beam intensity upon crossing the filter tape is a measure for the mass of PM collected
(Thermo, 2004). A filter tape replacement was initiated automatically by the BAS at the start of
each measurement and at maximum filter load (2400 μg). Each filter tape replacement was
followed by an automatic zero-calibration. Since the BAS needs about 1 h to reach stable
concentrations, BASs (and TEOMs) were started 2 h earlier than the other samplers, which data
were excluded from analyses.
Tapered Element Oscillating Microbalance (TEOM)
The TEOMs (1400ab; Thermo Fisher Scientific, Breda, the Netherlands) have been used by
the RIVM for PM2.5 sampling (using the Sample Equilibrium System) in the National Air
Quality Monitoring Network of the Netherlands from 2004 to 2009. The Sample Equilibrium
Systems were removed prior to this study so that the TEOMs were in their standard
configuration. The TEOM 1400ab has been approved as equivalent method for ambient PM10
monitoring in Europe (according to EN 12341) (Rupprecht and Patashnick, 2004) and in the
USA (Designation No. EQPM-1090-079) (US-EPA, 2013). TEOMs were equipped with the
impactor described in US-EPA 40 CFR 50, App. L. Inside the sensor unit of the TEOM, a filter
cartridge is placed over a hollow tapered glass element that oscillates when air is drawn through
Equivalence testing of devices for measurement of PM10 concentration in animal houses
207
the filter. The mass of PM that accumulates is determined from the decrease in oscillation
frequency it causes. In order to obtain a constant baseline oscillation frequency, the sample
stream is heated to a fixed temperature of 50°C having a low and stable humidity (Rupprecht and
Patashnick, 2004). As recommended by Heber et al. (2006), we replaced filters at PM loadings
of approximately 50% to avoid large amplitudes in concentration readings due to adsorption and
desorption of moisture from the collected PM. The TEOMs were operated without the default
adjustment equation given in the operating manual; values for the slope and offset were set at
1.00 and 0 μg respectively. Since the TEOM needs about 1 h to reach its target temperature,
TEOMs (and BASs) were started 2 h earlier than the other samplers, which data were excluded
from analyses.
DustTrak light scattering device (DT)
The battery-powered and portable DT (DustTrak aerosol monitor, model 8520, TSI Inc.,
Shoreview MN, USA) is designed for exposure sampling, but is used by WLR to determine
time-patterns or relative differences in PM10 concentrations in animal houses. The internal pump
of the DT pulls air at 1.7 L min–1 through a PM10 inlet nozzle into a sensing chamber where it is
illuminated by a beam of light (780 nm wavelength) from a laser diode. A lens at 90° to both the
air stream and the laser beam collects light scattered by the particles and focuses it onto a
photodetector, which converts the amount of captured light into a proportional voltage. The
voltage is multiplied by a calibration constant to yield a mass concentration. This relationship
between voltage and mass concentration is pre-set in the factory by a calibration to the respirable
fraction of standard ISO 12103-1 A1 test dust. Part of the air stream is directed through a filter
and used to create a sheet of clean air which confines the sample stream and protects the optics
against particle deposition (TSI, 2010).
Portable Aerosol Spectrometer (PAS)
The battery-powered PAS (Portable Aerosol Spectrometer, model 1.109, GRIMM Aerosol
Technique GmbH & Co. KG, Ainring, Germany) is designed as size-specific particle counter for
various fields of application. The PAS is used by WLR to determine particle-size distributions in
animal houses. Its working principle has many similarities to the DT. The sample flow generated
by the internal pump (1.2 L min–1) is fully analyzed, and subsequently cleaned by an internal
filter, after which 0.3 L min–1 is recirculated to form a sheet of clean air in the sensing chamber.
Laser beams (655 nm wavelength) scattered by the particles are captured by a wide angle mirror
positioned 90° to both the air stream and the laser beam and reflected to a photodetector.

Chapter 8
208
Particles are not only counted by their individual light impulses, but also attributed to one of 31
particle size channels based on the intensity of the beam (GRIMM, 2010). Besides particle
number concentrations, mass concentrations of a number of size fractions are determined,
including the PM10 fraction.
Description of sampling locations
To minimize bias associated with transport of samplers and filters, animal houses were
selected within a 5 km radius from the WLR institute in Wageningen, the Netherlands.
The fattening pig house consisted of a central corridor with five rooms at each side of the
corridor. Each room was divided into a central feeding alley with four pens at each side of the
feeding alley. Pens measured 3.2 m long and 2.4 m wide and had partially slatted floors with
manure pits. No bedding material was used. Liquid feed was delivered to a trough in each pen by
an automatic feeding system twice per day. Fresh air entered the room through a ceiling baffle
over the feeding alley. Polluted air was drawn from the room through two ceiling shafts with
throttling valves to a central air duct by mechanical ventilation. Samplers were placed in one of
the pens which was kept unoccupied for the purpose of this study. The other seven pens in the
room each housed 11 or 12 pigs of the same age. The age of the pigs during the measurements
was 12 to 17 weeks. Air pumps of the RESs and CYSs were placed in the central corridor to
reduce recirculation of cleaned sample air inside the room.
The layer house consisted of an entrance hall and a single animal space. The animal space
measured 72 m long and 14.8 m wide, housed 18,000 laying hens, and was equipped with so-
called aviary systems (loose housing). The concrete floor was covered with a bedding layer
composed of dry and friable manure and feathers. Fresh air entered the house through inlets
distributed along the length of both side walls and polluted air was removed by fans in the end
wall of the building. Samplers were placed inside a sampling area separated from the hens by
concrete wire mesh from floor to ceiling, whereas the air pumps of the RESs and CYSs were
placed in the entrance hall.
The broiler house consisted of a single animal space that measured 24 m long and 9 m wide.
On day one of the growing cycle, 2650 one-day old broiler chicks were placed onto a concrete
floor with wood shavings. Broilers were processed at 9 weeks of age. The age of the broilers was
4 to 9 weeks for broilers-1 and 2 to 5 weeks for broilers-2. The house was equipped with lines
with feed pans and drinking nipples, a hot air blower, side wall air inlets and roof fans. Samplers

Equivalence testing of devices for measurement of PM10 concentration in animal houses
209
(including their air pumps) were placed inside a sampling area separated from the broilers by a
0.5 m high mesh wire fence.
The office location was a room inside the WLR institute of 7.2 m long and 7 m wide. The
room is mainly used for maintenance of measuring devices and storage of equipment. The room
has a concrete floor, side wall windows, radiator heaters, a mechanical ventilation system and
several work desks and storage cabinets.
Sampling strategy and quality assurance
We performed simultaneous measurements with a set of co-located samplers, consisting of
five CASs (each in duplicate) and the RES (in fourfold); 14 devices in total. Samplers were set
up in a 2 by 2 m sampling area with each sampler inlet positioned approximately 1.7 m above the
floor and spaced 0.4 m apart. Within each location, sampling areas were chosen away from
sources that might create local gradients, such as air inlets or feeding systems. To verify the
presence of a flat spatial concentration profile, we performed grid measurements in the 2 by 2 m
horizontal measuring plane at each sampling location. PM10 concentrations were measured with
four DustTraks mounted 1.7 m above the floor to the corners of a 2 by 2 m horizontal square
wooden beam structure. The structure was rotated 90° every 15 minutes to compensate for
systematic differences between instruments and measurements were done during 2 h. This
procedure was repeated two or three times at each sampling location. The mean relative standard
deviation of grid point means was 6.6%, indicating the presence of a flat spatial concentration
profile and thus a valid basis of comparison.
In addition, we used four RES devices (instead of two, prescribed by EN 12341) to determine
the ‘true’ PM10 concentration (as their mean). Furthermore, to avoid potential bias in the
reference measurements, we randomly placed samplers within the 2 by 2 m sampling area prior
to each measurement. CASs were positioned side-by-side, whereas RESs were spread over the
sampling area. At all sampling locations, air velocity was less than 1 m s–1, to avoid non-
isokinetic sampling conditions.
In previous work on the RES, Zhao et al. (2009) showed that 0, 1, 2, or 3 impaction plate
replacements within a 24-h sampling period (equivalent to 24, 12, 8, and 6 h of sampling with
one impaction plate) did not influence PM10 concentration of the RES at high concentrations.
Based on this finding, impaction plates were cleaned and re-greased every 2 to 3 measurements
(equivalent to 6–9 h of sampling) to avoid particle bouncing from the impaction plate to the
filter.

Chapter 8
210
To ascertain the unbiasedness of our procedures for the CYS and RES, filter blanks
underwent the procedures for weighing, transport, and sampling during every tenth measurement
(but no sample air was drawn through them). The mass difference of filter blanks weighing 90
mg remained <0.06 mg throughout this study. A paired-samples t-test by the GenStat software
(VSN, 2012) on the data pairs (n=16) showed no significant difference (P > 0.05) between filter
mass before and after sampling.
To achieve accurate weighing, we set the sampling duration for animal houses to 3 h, based
on the sample flow rates of the CYS and RES (1 and 2.3 m3 h–1 respectively), the resolution of
the balance (10 μg), and the expected PM10 concentrations (0.2 to 5 mg m–3). The actual mass of
PM10 collected on the filters ranged from 380 to 14,110 μg for the CYS and from 840 to 29,030
μg for the RES. For the office location, we set the sampling duration to 24 h. At 3 h of sampling,
each measurement yielded one PM10 concentration value for both the RES and CYS, 6 values for
the BAS (logging interval: 30 min), 18 values for the TEOM (logging interval: 10 min), 180
values for the DT (logging interval: 1 min), and 18 values for the PAS (logging interval: 10 min).
The mean of values collected within one measurement was used as the PM10 concentration for
that measurement. All mass concentrations were recorded at the actual (non-standardized)
conditions for air temperature and barometric pressure. No correction factors were programmed
in the operating software of TEOM, BAS, DT, or PAS.
To be able to compare CASs to the RES over the full range of PM10 concentrations and
climate conditions normally encountered in animal house air, we distributed the measurements
over the growing cycle of pigs and broilers as much as possible, since PM10 concentrations
usually increases and air temperature decreases with the age of these animals. In addition, we
planned measurements both during the night (when lights are off, animals are inactive, and
concentrations are low) and during the day (when concentrations are high; e.g., around feeding
time).
Along with PM10 concentration, we monitored air temperature (T; °C) and relative humidity
(RH; %) with combined sensors for T and RH (Rotronic Instrument Corp., Hauppauge NY,
USA). Hourly mean T and RH values were stored in a data-logging system (Campbell Scientific
Inc., Logan UT, USA).
Data checking, preparation, and analysis
In total, 139 measurements were carried out. Two measurements in pigs and one measurement
in layers were excluded from this work because RES concentrations were below the EN 12341

Equivalence testing of devices for measurement of PM10 concentration in animal houses
211
breakpoint of 100 μg m–3. Two measurements were excluded because no RES concentration was
obtained. In total, 134 measurements were included in the dataset (Table 3). Data were checked
for aberrant values which were excluded from the dataset only when they could be attributed to
procedural or technical errors. All data collected with PAS device A in pigs and layers were
excluded from the dataset, because a defect was discovered inside the inlet piece during layer
house measurements. No statistical outlier test was performed. All analyses described in this
paper were carried out using the GenStat software (VSN, 2012) and probability values <0.05
were considered statistically significant.
Table 3Overview of measurements carried out per sampling location and summary statistics of PM10 concentration, indoor temperature and relative humidity.
Sampling location
Samplingperiod
N PM10 (μg m–3) a Temperature (°C) Relative humidity (%)Min Max Mean Min Max Mean Min Max Mean
Pigs Oct–Nov, ‘12 30 159 1402 511 24.6 27.0 25.5 51.1 66.4 58.7Layers Nov–Dec, ‘12 24 199 4100 2660 17.5 19.6 18.8 58.9 75.5 69.1Broilers-1 Jan–Feb, ‘13 34 (46) b 857 3402 1881 18.3 24.8 22.5 57.0 76.0 65.4Broilers-2 Apr, ‘13 19 497 2256 1543 19.5 29.2 25.0 43.6 80.1 63.5Office Feb–Mar, ‘13 15 4.1 21.3 10.4 21.6 24.0 22.6 17.9 31.8 24.3
a EN 12341 reference sampler concentration.b For the CYS versus RES comparison only, an additional series of 12 measurements was carried out in broilers-1.
Comparability between devices A and B of the same sampler
A comparability analysis was performed to assess the degree to which two devices of the
same sampler yield the same concentration values (Yi1 and Yi2) when tested simultaneously and
side by side. The analysis was performed as prescribed in paragraph 5.2.3 of EN 12341 (CEN,
1998). Ideally, devices yield identical concentration values (Di = Yi1 – Yi2 = 0). For each
combination of sampling location and sampler type, the absolute and relative standard deviation
(Sa and Sr) were calculated (Eq. 1 and Eq. 3). Parameters Sa and Sr were multiplied by a
Student’s t factor to yield a two-sided confidence interval for the average concentration values
(Yi) at both the absolute and relative scale (Eq. 2 and Eq. 4):
∑= n2/)D(S 2ia (1)
95%-CIa )2-n;975.0(a tS ×= (2)
n2/)Y/D(S 2iir ∑= (3)
95%-CIr )2-n;975.0(r tS ×= (4)

Chapter 8
212
For data pairs with mean concentration values <100 μg m–3 (i.e., data from the office
sampling) the CAS meets the EN 12341 requirement for comparability when 95%-CIa ≤ 5 μg m–
3. For data pairs with mean concentration values >100 μg m–3, (i.e., data from pigs, layers, and
broilers), the CAS meets the requirement for comparability when 95%-CIr ≤ 0.05 (i.e., 5%
relative to Yi).
For the RES however, Eq. 1 and Eq. 3 could not be used, because Di cannot be determined for
four samplers. Therefore, we used a nested model with RES concentration as dependent variable
and measurement number as a single random term to estimate the variance within measurements
for each sampling location. The square root of this variance was used as Sa to perform Eq. 2. The
same procedure was carried out on the natural log scale to yield the Sr for Eq. 4.
Accuracy of candidate samplers with respect to the reference sampler
An accuracy analysis was performed to assess the degree to which CAS concentrations are
consistent with RES concentrations. The analysis was carried out as prescribed in paragraph
5.2.4 of EN 12341 (CEN, 1998). Linear regression analysis was performed using the REML
directive of GenStat, with the CAS concentration as the dependent variable, and the RES
concentration and an intercept as model terms. We used deviance tests to determine whether
location-specific model variances or a general (pooled) model variance could be used. In all
cases, location-specific variances were used for the random part of the model. Ideally, in this
linear model, the CAS yields concentrations identical to the RES, yielding a slope of 1 (y=x) and
a zero intercept. In case of a zero intercept, a slope >1 reflects overestimation and a slope <1
reflects underestimation of the PM10 concentration by the CAS. An interaction term (RES
concentration × sampling location) was used to test the null-hypothesis that slopes were identical
between sampling locations. Pairwise t-tests were used to determine the significance of pairwise
differences between slopes of sampling locations and of pairwise differences between intercepts
of sampling locations. Data of a CAS obtained at different sampling locations were pooled when
both slopes and intercepts were not significantly different and concentration ranges overlapped.
The CAS meets the EN 12341 accuracy requirements when: a) the R2 is greater than 0.95, and b)
the computed regression falls within the two-sided acceptance envelop described by y = x ± 10
μg m–3 for RES concentrations <100 μg m–3, and (y = 0.9x | y = 1.1x) for RES concentrations
>100 μg m–3. Correction equations were determined by simple linear regression analysis, using
the RES as dependent and the CAS as independent variable. Slope and intercept were included in
the correction equation only when they were significantly different from 1 and zero respectively.

Equivalence testing of devices for measurement of PM10 concentration in animal houses
213
RESULTS AND DISCUSSION
An overview of performed measurements, RES concentrations, and climate conditions is
given in Table 3.
Comparability between devices A and B of the same sampler
Results of the comparability analyses are given in Table 4. The comparability between
devices A and B of samplers is also shown by differential symbols in Fig. 1. For concentrations
greater than 100 μg m–3, standard EN 12341 states that the relative 95%-confidence interval
(95%-CIr) must be smaller than 5% (relating here to the data from pigs, layers, and broilers).
From Table 4 it is clear that none of the CASs met this requirement in any of the animal houses.
Devices were best comparable for the TEOM in layers (6.6%), the CYS (9.4–14.4%; all animal
houses), and the BAS in pigs (11.1%). For BAS, TEOM, and DT, 95%-CIr values were highest
in broilers-1 (39.2%, 37.1%, and 30.8% respectively). These values coincided with poor
regression (Table 5), and were probably caused by pollution of these devices. When data of
broilers-1 are disregarded, 11 of the remaining 13 values from pigs, layers, and broilers-2 range
from 6.6 to 19.0%, whereas the BAS in layers (26.9%) and the PAS in broilers-2 (33.0%) are
less comparable. For the CYS, the 95%-CIr values found in this work (9.4–14.4%) are higher
than the 6.0% found by Zhao et al. (2009). As mentioned earlier by Zhao et al. (2009), the 5%
boundary in EN 12341 for ambient field tests may be too strict for animal house PM sampling.
For the latter environments, a higher boundary seems appropriate for three reasons. First, even
when devices were used that had recently been serviced, cleaned, and calibrated (i.e., in pigs and
broilers-2), none of the CASs met this requirement. Second, Table 4 shows that, although
comparability of the RES is better than for most CASs, its 95%-CIr values exceeded the
boundary too at all locations (range: 7.5–9.8%). Third, where the CYS, BAS, TEOM, and PAS
did not meet the boundary for 95%-CIr, they did meet the boundary of 5 μg m–3 for the 95%-CIa
at low office concentrations. Only the DT did not meet the 95%-CIa boundary (Table 4). The
uncertainty introduced by using a less strict 95%-CIr boundary for animal houses may be
compensated by using an average concentration value obtained from duplicate sampling
(Hofschreuder et al., 2007). This approach is currently prescribed in the Dutch measurement
protocol for determination of livestock PM emissions (Ogink et al., 2011).

Chapter 8
214
Table 4Results of the comparability analysis between devices A and B of the same sampler.
Sampler Sampling location
n PM10 (μg m–3) 95%-CIa
(μg m–3)95%-CIr
(%)Min Max MeanRES Pigs 30 159 1402 511 62.3 9.5
Layers 24 199 4100 2660 245.6 7.9Broilers-1 46 857 3402 1881 186.1 9.8Broilers-2 19 497 2256 1543 126.0 7.5Office 15 4.1 21.3 10.4 2.3 20.8
CYS Pigs 28 156 1302 457 40.4 12.9Layers 23 179 4425 2782 287.5 9.4Broilers-1 42 1010 4923 2701 252.2 10.7Broilers-2 19 500 2675 1702 199.8 14.4Office 15 2.9 20.7 9.9 2.1 30.1
BAS Pigs 21 108 786 308 38.9 11.1Layers 18 207 2573 1752 445.2 26.9Broilers-1 30 282 1309 707 275.3 39.2Broilers-2 19 276 1233 817 160.9 18.1Office 14 2.4 18.9 7.7 1.8 16.6
TEOM Pigs 20 116 962 423 82.6 19.0Layers 24 111 3022 1993 115.4 6.6Broilers-1 34 384 1860 1079 319.6 37.1Broilers-2 19 296 1529 1023 159.2 15.4Office 15 2.1 18.6 7.0 0.5 11.1
DT Pigs 28 108 933 331 72.1 17.9Layers 23 107 2048 1445 287.9 18.9Broilers-1 29 553 1985 1261 377.9 30.8Broilers-2 19 277 1428 958 169.3 15.6Office 15 1.8 52.5 22.2 10.3 38.6
PAS Broilers-1 32 1394 4449 2199 786.8 39.5Broilers-2 19 562 3632 2208 634.1 33.0Office 7 4.5 15.3 8.9 1.2 14.6
Accuracy of candidate samplers with respect to the reference sampler
Cyclone Sampler (CYS)
Results of the accuracy analysis for the CYS are given in Fig. 1A through 1E, Fig. 2, and
Table 5. The CYS yielded concentrations very similar to the RES in layers and in the office
environment, gave a small underestimation in pigs, and a small overestimation in broilers. For
pigs, layers, and the office, CYS results are equivalent to the RES, since computed regression
lines fall within the two-sided acceptance envelope (Figs. 1A, 1B, 1E) and R2 values are greater
than 0.95 (Table 5). For the broiler location, R2 values were satisfactory too, but the regression
lines slightly exceeded the upper boundary (Figs. 1C and 1D). The second measurements series
at the broiler location (broilers-2) yielded a slope statistically identical to the slope of broilers-1.
The tendency of the CYS to exceed the upper boundary in broilers is in accordance with the data

Equivalence testing of devices for measurement of PM10 concentration in animal houses
215
of Zhao et al. (2009) obtained at three fattening pig houses and one broiler house, but in the latter
study the overestimation was more pronounced (slope: 1.20; intercept: -68 μg m–3; R2 = 0.99; n =
20). The correction equation computed from that data for CYS values greater than 223 μg m–3
was y = 0.83x + 57.5 μg m–3. Based on the data presented here, however, a correction equation (y
= 0.85x + 89.5 μg m–3) would only be necessary for broilers, but not for pigs and layers. Pooling
valid data from all animal houses (Fig. 2) resulted in equivalency to the RES, i.e., a regression
within the two-sided acceptance envelope and a R2 value of 0.98 (Table 5).
FH 62 I-R beta-attenuation sampler (BAS)
Results of the accuracy analysis for the BAS are given in Fig. 1F through 1J, Fig. 2, and Table
5. The BAS underestimated the RES concentration at all four sampling locations, with mean
underestimations ranging from 16% for the office to 52% in pigs. For pigs and broilers-2, the
underestimation was similar, as shown by their statistically undistinguishable slopes (Table 5).
For these sampling locations, a correction factor of 1.88 would be appropriate (Table 6). The
underestimation in layers (mean: 40%) is statistically different from those of pigs and broilers-2
and would require a different correction factor of 1.56 (Table 6). Pooling data from pigs, layers,
and broilers-2 (Table 5 and Fig. 2) still yields a regression with a high fit (R2 = 0.94), but it just
fails the 0.95 requirement of EN 12341. It is possible however, that the differential regression in
layers has been caused by a higher degree of pollution in comparison to pigs and broilers-2. We
feel that these results need further confirmation, since to our knowledge only one study has been
published on the comparison of a beta-attenuation sampler to a reference method in animal
houses (Van Ransbeeck et al., 2013b). In the latter study, a limited number of data pairs obtained
inside a pig house pointed towards an underestimation as well. In National Air Quality
Monitoring Networks of European countries, correction factors ranging between 0.84 and 1.37
are used to adjust PM10 concentrations measured by beta-attenuation samplers (Gebicki and
Szymańska, 2011). Thus, our data suggest that, compared to ambient aerosol sampling,
underestimations are greater when sampling animal house PM.

Chapter 8
216
Fig. 1PM10 concentrations of candidate samplers (y-axes) as a function of the EN 12341 reference sampler concentration (x-axes), for five candidate samplers (one sampler in each row), tested at four sampling locations (one location in each column), presented following the procedure described in paragraph 5.2.4 of EN 12341. Dashed green lines represent the ideal reference equivalence function y = x. Solid black lines adjacent to the y = x function represent the two-sided acceptance envelopes for concentrations >100 μg m–3 (y = 0.9x | y = 1.1x; shown for pigs, layers, and broilers), and for concentrations <100 μg m–3 (y = x ± 10; shown for the office). Differential symbols are used for devices A (round symbols) and B (square symbols). Regression lines are given by solid red lines through the observations (see Table 5 for regression coefficients and statistical tests).
Layers Broilers-1 Broilers-2 Office
CY
S(m
g m
-3)
BA
S(m
g m
-3)
TEO
M(m
g m
-3)
DT
(mg
m-3
)P
AS
(mg
m-3
)
EN 12341 Reference sampler (mg m-3)
0.0
0.5
1.0
1.5
0.0 0.5 1.0 1.5
APigs
0
1
2
3
4
0 1 2 3 4
B
0.00
0.01
0.02
0.00 0.01 0.02
E
0.0
0.5
1.0
1.5
0.0 0.5 1.0 1.5
F
0
1
2
3
4
0 1 2 3 4
G
0
1
2
3
0 1 2 3
H
0 1 2 3
I
0.00
0.01
0.02
0.00 0.01 0.02
J
0.0
0.5
1.0
1.5
0.0 0.5 1.0 1.5
K
0
1
2
3
4
0 1 2 3 4
L
0 1 2 30
1
2
3
0 1 2 3
M N
0.00
0.01
0.02
0.00 0.01 0.02
O
0.0
0.5
1.0
1.5
0.0 0.5 1.0 1.5
P
0
1
2
3
4
0 1 2 3 4
Q
0 1 2 30
1
2
3
0 1 2 3
R S
0.00
0.02
0.04
0.06
0.00 0.02 0.04 0.06
0.0
0.5
1.0
1.5
2.0
2.5
0.0 0.5 1.0 1.5 2.0 2.5
U
T
0
2
4
6
0 2 4 6
V
0
1
2
3
4
5
0 1 2 3 4 50 1 2 3 4 5
W X
0.00
0.01
0.02
0.00 0.01 0.02
Y
0
1
2
3
4
5
0 1 2 3 4 50 1 2 3 4 5
C D

Equivalence testing of devices for measurement of PM10 concentration in animal houses
217
Table 5Results of the linear regression analysis on PM10 concentration of candidate samplers as a function of EN 12341 reference sampler concentration. Each slope was tested against the null-hypothesis that it equals one (representing a y = x relationship when the intercept is zero) and each intercept was tested against the null-hypothesis that it equals zero. Slopes or intercepts followed by n.s. are not significantly different from one and zero respectively, whereas star symbols indicate rejection of the null-hypothesis at a significance level of 0.05 (*), 0.01 (**), or 0.001 (***). Slopes or intercepts followed by different letters in parenthesis within the same column are significantly different (P < 0.05) between sampling locations. Intercepts in μg m–3.Sampler Sampling location Device n Slope (se) Intercept (se) R2
CYS 1. Pigs A and B 58 0.92 (0.01) *** [a] -3.5 (5.6) n.s. [a] 0.9952. Layers A and B 47 1.04 (0.02) * [b] -81.2 (63.2) n.s. [a] 0.9813. Broilers-1 A and B 87 1.15 (0.02) *** [c] -47.0 (44.5) n.s. [a] 0.9804. Broilers-2 A and B 38 1.12 (0.04) ** [b, c] -28.6 (67.7) n.s. [a] 0.9525. Office (<100 μg m–3) A and B 30 1.03 (0.04) n.s. [b] 0.8 (0.5) n.s. [a] 0.960Pooled: 2 and 4 A and B 85 1.01 (0.02) n.s. 70.5 (42.3) n.s. 0.976Pooled: 3 and 4 A and B 125 1.15 (0.01) *** -58.2 (33.2) n.s. 0.981Pooled: 1, 2, 3, and 4 A and B 230 1.10 (0.01) *** -46.6 (22.0) * 0.981
BAS 1. Pigs A and B 47 0.48 (0.02) *** [a] 16.4 (10.2) n.s. [a] 0.9562. Layers A and B 41 0.60 (0.04) *** [b] 106 (113) n.s. [a] 0.8563. Broilers-1 A and B 63 0.12 (0.06) *** [c] 470 (120) *** [b] 0.0434. Broilers-2 A and B 38 0.50 (0.04) *** [a, b] 51.8 (66.4) n.s. [a] 0.8005. Office (<100 μg m–3) A and B 29 0.84 (0.05) ** [d] 0.8 (0.6) n.s. [a] 0.907Pooled: 1 and 4 A and B 85 0.52 (0.02) *** 6.0 (18.2) n.s. 0.932Pooled: 2 and 4 A and B 79 0.65 (0.03) *** -102 (59.2) n.s. 0.898Pooled: 1, 2, and 4 A and B 126 0.63 (0.01) *** -70.0 (27.3) * 0.942
TEOM 1. Pigs A and B 49 0.67 (0.02) *** [a] -7.8 (11.5) n.s. [a] 0.9702. Layers A and B 48 0.76 (0.01) *** [b] -15.0 (36.3) n.s. [a] 0.9873. Broilers-1 A and B 68 0.37 (0.05) *** [c] 385 (102) *** [b] 0.426
A 34 0.41 (0.05) *** 330 (91.2) *** 0.701B 34 0.33 (0.09) *** 441 (185) * 0.255
4. Broilers-2 A and B 38 0.73 (0.03) *** [a, b] -98.4 (48.6) n.s. [a] 0.9415. Office (<100 μg m–3) A and B 30 0.79 (0.05) *** [b] -1.2 (0.6) * [c] 0.903Pooled: 1 and 4 A and B 87 0.68 (0.01) *** -22.0 (14.2) n.s. 0.974Pooled: 2 and 4 A and B 86 0.78 (0.01) *** -130 (27.3) *** 0.983Pooled: 1, 2, and 4 A and B 135 0.76 (0.01) *** -76.7 (14.1) *** 0.988
DT 1. Pigs A and B 59 0.65 (0.02) *** [a] -16.5 (10.7) n.s. [a] 0.9612. Layers A and B 47 0.50 (0.02) *** [b] 85.5 (47.3) n.s. [b] 0.9543. Broilers-1 A and B 59 0.62 (0.05) *** [a] 74.9 (99.1) n.s. [a, b] 0.730
A 29 0.54 (0.09) *** 254 (185) n.s. 0.542B 30 0.71 (0.03) *** -103.5 (69.7) n.s. 0.934
4. Broilers-2 A and B 38 0.60 (0.04) *** [a] 29.5 (68.5) n.s. [a, b] 0.8465. Office (<100 μg m–3) A and B 30 2.63 (0.24) *** [c] -5.2 (2.8) n.s. [a, b] 0.801Pooled: 1 and 4 A and B 97 0.62 (0.01) *** -1.2 (16.0) n.s. 0.953Pooled: 1, 2, 3(B), and 4 A and B 174 0.53 (0.01) *** 79.6 (18.9) *** 0.945
PAS 1. Pigs A 30 1.76 (0.04) *** [a] -8.8 (26.5) n.s. [a] 0.9832. Layers A 21 1.48 (0.14) ** [a] 53.0 (405) n.s. [a] 0.8493. Broilers-1 A and B 66 0.55 (0.14) ** [b] 1142 (284) *** [b] 0.1754. Broilers-2 A and B 38 1.47 (0.15) ** [a] -66.0 (247) n.s. [a] 0.7175. Office (<100 μg m–3) A and B 22 0.86 (0.06) * [c] 1.0 (0.7) n.s. [a] 0.908Pooled: 1, 2, and 4 A and B 89 1.46 (0.05) *** 55.5 (84.5) n.s. 0.917

Chapter 8
218
Fig. 2PM10 concentrations of candidate samplers (y-axes) as a function of the EN 12341 reference sampler concentration (x-axes), pooled for pigs (white symbols), layers (grey symbols), and broilers (black symbols). Broiler data points are based on the broiler-2 measurements for the BAS, TEOM, and PAS. For the CYS, broiler data points are based on broilers-1 and broilers-2. For the DT, broiler data points are based on device B of broiler-1 and all data from broilers-2. Dashed green line: the ideal reference equivalence function y = x. Solid black lines adjacent to the y = xfunction represent the two-sided acceptance envelope for concentrations >100 μg m–3 (y = 0.9x | y = 1.1x). Regression lines are given by solid red lines through the observations (see the lowest row of each sampler in Table 5 for regression coefficients and statistical tests of the pooled data).
Table 6Equations for calibration of candidate sampler PM10 concentrations (x) to EN 12341 reference sampler concentrations (y).
Sampler Animal categoryPigs Layers Broilers All data
CYS y = 1.09x a y = 0.96x a, b y = 0.85x + 89.5 c y = 0.89x + 76.1 a, d
BAS y = 1.88x e y = 1.56x y = 1.88x e y = 1.49x + 195 f
TEOM y = 1.42x + 56.4 e y = 1.26x + 201 b y = 1.30x + 216 y = 1.30x + 118 f
DT y = 1.58x e y = 1.89x y = 1.58x e y = 1.73x g
PAS y = 0.66x f y = 0.66x f y = 0.66x f y = 0.66x f
a Equivalent to the RES, i.e., regression falls within the two-sided acceptance envelope and R2>0.95.b Based on the pooled data of layers and broilers-2.c Based on the pooled data of broilers-1 and broilers-2.d Based on the pooled data of pigs, layers, broilers-1, and broilers-2.e Based on the pooled data of pigs and broilers-2.f Based on the pooled data of pigs, layers, and broilers-2.g Based on the pooled data of pigs, layers, broilers-1A, and broilers-2.
EN 12341 Reference sampler (mg m-3)
Can
dida
te s
ampl
er (m
g m
-3)
0
1
2
3
4
5
0 1 2 3 4 50
1
2
3
4
0 1 2 3 4
0
1
2
3
4
0 1 2 3 40
1
2
3
4
0 1 2 3 40
1
2
3
4
5
6
7
0 1 2 3 4 5 6 7
BAS
TEOM
CYS
DT PAS

Equivalence testing of devices for measurement of PM10 concentration in animal houses
219
Tapered Element Oscillating Microbalance (TEOM)
Results of the accuracy analysis for the TEOM are given in Fig. 1K through 1O, Fig. 2, and
Table 5. The TEOM underestimated the RES concentration at all four sampling locations, with
mean underestimations ranging from 21% for the office to 33% in pigs. The slope in pigs (0.67)
was lower than in layers (0.76), but the slopes of pigs versus broilers-2, and the slopes of layers
versus broilers-2 were undistinguishable (Table 5). Pooling data from all three animal houses
(Table 5 and Fig. 2) resulted in a regression with a very good fit (R2 = 0.99), meeting the 0.95
requirement of standard EN 12341. Therefore, one might consider to use a single, overall
correction equation (y = 1.30x + 118; Table 6) for the TEOM. The underestimations in our work
are in agreement with Q. F. Li et al. (2012), who found that a standard configured TEOM
underestimated PM10 concentrations in a caged layer house too, as compared to a filter-based
PM10 Federal Reference Method (slope: 0.858; intercept: 71.3 μg m–3; R2 = 0.86; n = 15).
However, in the latter study, a US PM10 impactor (US-EPA, 2014) was used for both the TEOM
and RES, whereas in our work, a European impactor was used for the RES. Furthermore, our
results are in agreement with ambient field tests which generally show that the TEOM
underestimates the RES concentration (e.g., Charron et al., 2004, and references therein).
Consequently, correction factors ranging between 1 and 1.47 are used in National Air Quality
Monitoring Networks of European countries (Gebicki and Szymańska, 2011). Several studies on
ambient aerosols have shown that TEOM to RES differences vary between sampling sites and
between seasons as a result of differences in aerosol composition and meteorological conditions.
Generally, differences increase with increasing aerosol fractions of volatile compounds (e.g.,
ammonium nitrate), decreasing air temperature, and increasing air humidity (Allen et al., 1997;
Charron et al., 2004; Hauck et al., 2004). Consequently, Green et al. (2001) showed that the use
of a single TEOM correction factor is not sufficient to adequately adjust these effects. Two
reasons however, may explain why in this work a single correction factor does seem to be a
satisfactory solution. First, the composition of animal house PM may be more homogeneous and
relatively low in ammonium nitrate content in comparison with ambient PM. Animal house PM
consists mainly of primary particles from fecal material, feathers, and skin debris, generated by
drying and the mechanical forces exerted on these materials by the animals. These sources show
similarities between animal categories (Cambra-López et al., 2011). Q. F. Li et al. (2012)
recently showed that ammonium nitrate made up a negligible part of the PM2.5 mass
concentration in a caged layer house. This suggests that underestimations related to the
volatilization of ammonium nitrate play a minor role in animal houses. Second, in many
countries, pig and poultry houses are insulated and equipped with mechanical ventilation systems

Chapter 8
220
to keep indoor temperature and relative humidity within optimal boundaries (Table 3). In
contrast to the ambient environment, indoor temperatures in these houses usually remain above
15°C and relative humidity usually remains between approximately 40 and 85% (Winkel et al.,
2014), conditions under which volatilization is less present in ambient air studies.
DustTrak light scattering device (DT)
Results of the accuracy analysis for the DT are given in Fig. 1P through 1T, Fig. 2, and Table
5. The DT underestimated the RES concentration at all animal houses, with mean
underestimations of 35% in pigs, 40% in broilers-2, and 50% in layers. The statistical analysis
showed that the underestimation was identical for pigs and broilers-2, whereas the
underestimation was greater in layers (Table 5). For the DT, pooling of animal house data (Table
5 and Fig. 2) resulted in a regression with a good fit (R2 = 0.95), equal to the requirement of EN
12341. Therefore, the use of a single, overall correction factor (y = 1.73x; Table 6) may be a
reasonable procedure for the DT too.
Recently, Cambra-López et al. (2014) compared the DT to the CYS as a filter-based reference
and found a relationship of y = 0.61x + 50 μg m–3 for pig houses (16 houses; n = 64; R2 = 0.84)
and y = 0.41x + 160 μg m–3 for poultry houses (16 houses; n = 55; R2 = 0.91), where y is the
PM10 concentration of the DT and x the CYS concentration. In the present dataset, computed DT
to CYS relationships were y = 0.73x – 3 μg m–3 for the pig house (n = 49; R2 = 0.98) and y =
0.76x – 144 μg m–3 for layers and broilers-2 (n = 86; R2 = 0.96). Post et al. (2010) reported that
the DT gave lower concentrations than the TEOM in a broiler house (mean difference: 600 μg
m–3). In the present dataset, however, DT and TEOM underestimated the RES concentration in a
very similar manner, yielding a y = x relationship between the two (R2 = 0.998; n = 128). Hence,
the underestimation of the DT to the CYS reported by Cambra-López et al. (2014) can be found
in the present dataset too, but the DT seems to approach both the CYS and TEOM more closely
than reported in other studies.
In contrast to animal houses, the DT overestimated RES concentrations in the office by a
factor 2.63 (Fig. 1 and Table 5). Overestimation of the DT model 8520 to a filter-based PM10
reference method was also reported by Cheng (2008) in an iron foundry (slope: 1.37; intercept: -
98.82 μg m–3; R2 = 0.91; approximate PM10 range: 120–710 μg m–3), and by Heal et al. (2000) in
an urban indoor environment (slope: 2.2; intercept: -12 μg m–3; r=0.95; approximate PM10 range:
5–33 μg m–3). Our results and those presented in the papers discussed illustrate that DT to RES
differences may vary significantly between sampling environments and stress the necessity of

Equivalence testing of devices for measurement of PM10 concentration in animal houses
221
either recalibrating DTs with the aerosol of interest or using specific correction factors for
standard-calibrated DTs in animal houses.
Portable Aerosol Spectrometer (PAS)
Results of the accuracy analysis for the PAS are given in Fig. 1U through 1Y, Fig. 2, and
Table 5. The PAS overestimated the RES concentration at all animal houses. The statistical
analysis showed that this underestimation was statistically undistinguishable between pigs,
layers, and broilers-2 (Table 5). Therefore, a single, overall correction factor y = 0.66x (Table 6)
would be appropriate when using the PAS in animal houses. The regression of the pooled data of
pigs, layers, and broilers-2, underlying this correction factor, showed a fit of 0.92, which is
however, below the 0.95 requirement of EN 12341. Recently, Van Ransbeeck et al. (2013b)
investigated the equivalence of two PAS devices to a filter-based PM10 reference method in a pig
house and found PAS to RES relationships of y = 1.28x – 5 μg m–3 for device 1 and y = 1.67x –
112 μg m–3 for device 2. The relationship found in the pig house in this work (based on one
device; y = 1.76x – 8.8 μg m–3 ; Table 5), agrees reasonably well with these previously found
relationships.
Estimation of non-routine service intervals
In Fig. 1 the CAS to RES concentration values obtained at the pig house, layer house, and
broilers-1 are presented in chronological order from left to right. From Fig. 1 it is clear that the
accuracy of BAS, TEOM, DT, and PAS in broilers-1 was substantially worse as compared to
pigs and layers. This impression is more precisely reflected by slopes significantly different from
other sampling locations, by the finding of substantial intercepts significantly different from
zero, and by relatively low R2 values for broilers-1 (Table 5). For the TEOM, aberrant values
were mainly produced by device B, and for the DT by device A, whereas TEOM device A and
DT device B showed somewhat better results (Table 5). The poor regressions in broilers-1 are
also visible from the high 95%-CIr values obtained from the comparability analysis (Table 3).
This poor CASs performance has probably been caused by a too long time interval between
full service events (e.g., non-routine cleaning of the interior of the sampler and mass calibration),
in addition to frequent service points, like cleaning inlets and replacing internal filters (Table 2).
Pollution of the interior of the samplers may have been a main cause for three reasons. First,
good regression was still found in broilers-1 for the CYS (Fig. 1 and Table 5) which was not
sensitive to pollution because it was fully disassembled and wet cleaned every 15–30 h of
operation. Second, during a full service of the BAS, TEOM, DT, and PAS after broilers-1, the

Chapter 8
222
interior of these devices proved to be clearly polluted by dust, despite our intensive care to
minimize this (Table 2). Pollution of devices became apparent by a brown discoloration of
internal filters, by thin layers or clots of PM inside tubes and chambers, and by PM deposited
onto the optics of the DT and the PAS. Third, after samplers had been fully cleaned and
calibrated, results obtained in the office and during the second measurement series in broilers
(broilers-2) were again satisfactory.
Our results suggest that CAS performance deteriorated quite rapidly after it had reached a
critical operating time during the broilers-1 phase of this study. By the end of the layer house
measurements, BAS, TEOM, DT, and PAS had been operated for 432, 453, 500, and 469 h
respectively (equivalent to 18–21 sampling days) at a mean PM10 concentration of 1466 μg m–3.
Assuming that internal pollution was the main cause of the poor CAS performances in broilers-1,
the total load of PM10 drawn through each CAS might be a better indicator to obtain ‘safe’ time
intervals between non-routine (full) services. This loading can be determined by accumulating
the multiplication products of sampling duration, samplers’ flow rate (Table 1) and RES
concentration, for each measurement. After the measurement series in pigs and layers, these
loadings amounted 557 mg for the BAS, 116 mg for the TEOM, 66 mg for the DT, and 43 mg
for the PAS. Safe time intervals between full services may then be estimated by dividing these
loadings by the sampling flow applied and a (mean) PM10 concentration expected. For a number
of concentration levels, time intervals are calculated and given in Table 7. From this table it is
clear that the time intervals obtained from this approach for concentrations less than 100 μg m–3
agree well with those prescribed in operating manuals (i.e., 6 to 12 months; Table 2). At high
concentrations in animal houses however, samplers should be serviced more frequently, as
reported by Heber et al. (2006) as well.
Table 7Computed ‘safe’ time intervals (sampling days) between non-routine services.
Sampler Mean PM10 concentration level (μg m–3)25 100 500 1000 2500 5000
BAS 928 232 46 23 9 5TEOM 1074 269 54 27 11 5DT 1078 270 54 27 11 5PAS 995 249 50 25 10 5
Advantages, limitations and implications of this study
Rather than performing an in-depth study into the artifacts associated with one specific
sampler, this study attempted to provide a broad knowledge basis on the accuracy and

Equivalence testing of devices for measurement of PM10 concentration in animal houses
223
comparability of multiple samplers with various working principles in three main animal
housings. An advantage of this approach is that a solid impression could be obtained for many
samplers on a valid basis of comparison. At the same time, this approach makes it difficult to
elucidate to what extent a CAS to RES relationship varies over prolonged periods of time within
a house, varies between houses of a housing system, between housing systems within an animal
category, or between animal categories. Some insight into the reproducibility of the CYS
performance can be obtained from comparing results from broilers-1 and broilers-2 (Table 5).
Despite that broilers-2 was carried out two months later in a next flock of broilers, both the slope
and intercept of this series were statistically undistinguishable from broilers-1, indicating that the
CYS to RES relationship was reproducible in time within this specific farm location. Variation in
a CAS to RES relationship, both within and between houses, could arise from differences in in
air humidity, particle size distribution, particle shape, chemical composition, and so on. Such
variables might interact with the sampler’s pre-separation or measuring principle to yield varying
relationships. This reasoning might explain why in a previous comparison in three pig houses
and one broiler house (Zhao et al., 2009), the CYS overestimated the RES concentration,
whereas in the present study, an overestimation was found for broilers but only slightly for layers
and not for pigs. With regard to these variations, it seems promising that: (1) air temperature and
relative humidity in most housing systems for poultry and pigs are kept within limits that are
narrower than the meteorological conditions outdoors (Winkel et al., 2015), (2) sources of PM
show similarities between animal categories (Cambra-López et al., 2011), (3) relationships
between CASs and the RES were reasonably consistent between the three animal categories (Fig.
2 and Table 5), and (4) relationships are reasonably consistent with those reported in literature so
far.
In summary, this study implies that, for the present, duplicate sampling can be applied to
reduce random errors related to differences between samplers, whereas correction factors
(specific to the level of animal categories or animal housing systems) can be determined and
applied to reduce systematic deviations from a reference sampler. Furthermore, shortened time
intervals between full servicing of samplers can be adopted to avoid malfunctioning due to
pollution. When such measures are applied, some of the samplers tested could be regarded
acceptable. In future, in-depth studies are needed to further increase our understanding of
specific artifacts of samplers, of their comparability and their accuracy to reference samplers,
and of adequate measures to ensure their proper functioning.

Chapter 8
224
CONCLUSIONS
In this study we investigated the accuracy and comparability of five candidate samplers when
measuring high PM10 concentrations (>100 μg m–3) inside a fattening pig house, a laying hen
house, and a broiler house, following the main principles of European standard EN 12341. Our
key results and conclusions can be summarized as follows:
1. Neither one of the five candidate samplers, nor the reference sampler itself, met the EN
12341 requirement for comparability between devices of the same sampler type. Using a
less strict boundary for animal house environments may be appropriate. The uncertainty
from using a less strict boundary may subsequently be compensated by using an average
concentration value obtained from duplicate sampling.
2. The CYS met the EN 12341 accuracy requirements in pigs and layers, but overestimated
RES concentrations in broilers. When pooling data of all three houses, the CYS fulfilled the
accuracy requirements. The BAS, TEOM, and DT underestimated, and the PAS
overestimated, RES concentrations in a very systematic manner. The use of correction
factors seem to be a promising method to calibrate measured values to RES concentrations.
3. The BAS, TEOM, DT, and PAS started to show scattered regression with regard to the RES
after 432–500 h of sampling, which was probably caused by pollution of the interior of these
devices. Shortened time intervals between non-routine (full) services should be adopted
when using these samplers inside animal houses.
4. Some of the samplers tested could be regarded acceptable when appropriate measures (such
as duplicate sampling, correction factors, and frequent servicing) are applied.
ACKNOWLEDGMENTS
This work was financed by the Dutch Ministry of Economic Affairs and the Dutch Ministry of
Infrastructure and Environment. We would like to express our gratitude to the participating
farmers for allowing our presence in their buildings for many weeks. We thank Mr. Eef Lovink
for carefully servicing the equipment, Mr. Jean Slangen for weighing the filters, Mr. Peter
Hofschreuder for stimulating discussions, and Mr. Johan van Riel for advice on the Genstat
procedures.

Equivalence testing of devices for measurement of PM10 concentration in animal houses
225
REFERENCES
Adell, E., Calvet, S., Torres, A.G., Cambra-López, M.M., 2012. Particulate matter concentrations and emissions in rabbit farms. World Rabbit Sci. 20:1–11.
Allen, G., Sioutas, C., Koutrakis, P., Reiss, R., Lurmann, F.W., Roberts, P.T., 1997. Evaluation of the TEOM(R) method for measurement of ambient particulate mass in urban areas. J. Air Waste Manag. Assoc. 47:682–689.
Andersen, K.B., Glasius, M., Feilberg, A., 2014. Gas-particle partitioning of odorants in a pig house measured by thermal desorption GC/MS. Environ. Sci. Process. Impacts 16:1059–1068.
Brunekreef, B., Holgate, S.T., 2002. Air pollution and health. Lancet 360:1233–1242.Calvet, S., van den Weghe, H., Kosch, R., Estellés, F., 2009. The influence of the lighting program on broiler
activity and dust production. Poult. Sci. 88:2504–2511.Cambra-López, M., Aarnink, A.J.A., Zhao, Y., Calvet, S., Torres, A.G., 2010. Airborne particulate matter from
livestock production systems: A review of an air pollution problem. Environ. Pollut. 158:1–17.Cambra-López, M., Hermosilla, T., Lai, H.T.L., Aarnink, A.J.A., Ogink, N.W.M., 2011. Particulate matter emitted
from poultry and pig houses: Source identification and quantification. Trans. ASABE 54:629–642.Cambra-López, M., Winkel, A., Mosquera, J., Ogink, N.W.M., Aarnink, A.J.A., 2014. Comparison of light
scattering devices and gravimetric samplers for PM10 mass concentration in livestock houses. Atm. Environ111:20–27.
CEN, 1998. EN 12341:1998. Air quality - Determination of the PM 10 fraction of suspended particulate matter -Reference method and field test procedure to demonstrate reference equivalence of measurement methods. European Committee for Standardization (CEN), Brussels, Belgium.
CEN, 2005. EN 14907:2005. Ambient air quality - Standard gravimetric measurement method for the determination of the PM2.5 mass fraction of suspended particulate matter. European Committee for Standardization (CEN), Brussels, Belgium.
Charron, A., Harrison, R.M., Moorcroft, S., Booker, J., 2004. Quantitative interpretation of divergence between PM10 and PM2.5 mass measurement by TEOM and gravimetric (Partisol) instruments. Atm. Environ. 38:415–423.
Cheng, Y.H., 2008. Comparison of the TSI model 8520 and Grimm Series 1.108 portable aerosol instruments used to monitor particulate matter in an iron foundry. J. Occup. Environ. Hyg. 5:157–168.
Costa, A., Ferrari, S., Guarino, M., 2012. Yearly emission factors of ammonia and particulate matter from three laying-hen housing systems. Anim. Prod. Sci. 52:1089–1098.
Costa, A., Guarino, M., 2009. Definition of yearly emission factor of dust and greenhouse gases through continuous measurements in swine husbandry. Atm. Environ. 43:1548–1556.
Demmers, T.G.M., Saponja, A., Thomas, R., Phillips, G.J., McDonald, A.G., Stagg, S., Bowry, A., Nemitz, E.,2010. Dust and ammonia emissions from UK poultry houses. In: XVII-th World Congress of the Int. Comm. of Agric. and Biosyst. Eng. (CIGR). Québec city, Canada.
Fabbri, C., Valli, L., Guarino, M., Costa, A., Mazzotta, V., 2007. Ammonia, methane, nitrous oxide and particulate matter emissions from two different buildings for laying hens. Biosyst. Eng. 97:441–455.
Gebicki, J., Szymańska, K., 2011. Comparison of tests for equivalence of methods for measuring PM10 dust in ambient air. Polish J. Environ. Stud. 20:1465–1472.
Görner, P., Bemer, D., Fabries, J.F., 1995. Photometer measurement of polydisperse aerosols. J. Aerosol Sci. 26:1281–1302.
Green, D., Fuller, G., Barratt, B., 2001. Evaluation of TEOM (TM) 'correction factors' for assessing the EU Stage 1 limit values for PM10. Atm. Environ. 35:2589–2593.
GRIMM. (2010). Portable laser aerosolspectrometer and dust monitor model 1.108/1.109. Ooperating manual,GRIMM Aerosol Technique GmbH & Co. KG, Ainring, Germany.
Haeussermann, A., Costa, A., Aerts, J.M., Hartung, E., Jungbluth, T., Guarino, M., Berckmans, D., 2008. Development of a dynamic model to predict PM10 emissions from swine houses. J. Environ. Qual. 37:557–564.
Hauck, H., Berner, A., Gomiscek, B., Stopper, S., Puxbaum, H., Kundi, M., Preining, O., 2004. On the equivalence of gravimetric PM data with TEOM and beta-attenuation measurements. J. Aerosol Sci. 35:1135–1149.
Hayes, M.D., Xin, H., Li, H., Shepherd, T.A., Zhao, Y., Stinn, J.P., 2013. Ammonia, greenhouse gas, and particulate matter emissions of aviary layer houses in the Midwestern U.S. Trans. ASABE 56:1921–1932.
Heal, M.R., Beverland, I.J., McCabe, M., Hepburn, W., Agius, R.M., 2000. Intercomparison of five PM10 monitoring devices and the implications for exposure measurement in epidemiological research. J. Environ.Monit. 2:455–461.
Heber, A.J., Lim, T.T., Ni, J.Q., Tao, P.C., Schmidt, A.M., Koziel, J.A., Hoff, S.J., Jacobson, L.D., Zhang, Y.H., Baughman, G.B., 2006. Quality-assured measurements of animal building emissions: Particulate matter concentrations. J. Air Waste Manag. Assoc. 56:1642–1648.

Chapter 8
226
Hofschreuder, P., Aarnink, A.J.A., Zhao, Y., Ogink, N.W.M., 2007. Measurement protocol for determining fine dust emission factors of animal housing systems. In: DustConf 2007, How to improve air quality, Maastricht, the Netherlands.
Joo, H.S., Ndegwa, P.M., Heber, A.J., Ni, J.Q., Bogan, B.W., Ramirez-Dorronsoro, J.C., Cortus, E.L., 2013. Particulate matter dynamics in naturally ventilated freestall dairy barns. Atm. Environ. 69:182–190.
Koziel, J.A., Baek, B.H., Bush, K.J., Balota, A., Bayley, C.L., Sweeten, J.M., 2004. Emissions of particulate matter from swine finish barns in Texas. In: Proceedings of the AgEng 2004 “Engineering the Future” Conference,Europ. Soc. of Agric. Eng. (EurAgEng), Leuven, Belgium.
Li, Q.F., Lingjuan, W.L., Liu, Z.F., Heber, A.J., 2012. Field evaluation of particulate matter measurements using tapered element oscillating microbalance in a layer house. J. Air Waste Manag. Assoc. 62:322–335.
Li, S., Li, H., Xin, H., Burns, R.T., 2011. Particulate matter concentrations and emissions of a high-rise layer house in Iowa. Trans. ASABE 54:1093–1101.
Lin, X.J., Cortus, E.L., Zhang, R., Jiang, S., Heber, A.J., 2012. Air emissions from broiler houses in California. Trans. ASABE 55:1895–1908.
McMurry, P.H., 2000. A review of atmospheric aerosol measurements. Atm. Environ. 34:1959–1999.Modini, R.L., Agranovski, V., Meyer, N.K., Gallagher, E., Dunlop, M., Ristovski, Z.D., 2010. Dust emissions from
a tunnel-ventilated broiler poultry shed with fresh and partially reused litter. Anim. Prod. Sci. 50:552–556.Morgan, R.J., Wood, D.J., Van Heyst, B.J., 2014. The development of seasonal emission factors from a Canadian
commercial laying hen facility. Atm. Environ. 86:1–8.Ni, J.Q., Chai, L., Chen, L., Bogan, B.W., Wang, K., Cortus, E.L., Heber, A.J., Lim, T.T., Diehl, C.A., 2012.
Characteristics of ammonia, hydrogen sulfide, carbon dioxide, and particulate matter concentrations in high-rise and manure-belt layer hen houses. Atm. Environ. 57:165–174.
Ogink, N.W.M., Hofschreuder, P., Aarnink, A.J.A., 2011. Protocol for the measurement of fine dust emissions from housings in animal production 2010 [in Dutch, with English summary]. Report 492, Wageningen University and Research Centre, Livestock Research, Lelystad, the Netherlands.
Pope, C.A., Dockery, D.W., 2006. Health effects of fine particulate air pollution: Lines that connect. J. Air Waste Manag. Assoc. 56:709–742.
Post, J.P., Bajwa, S.G., Liang, Y., Costello, T.A., 2010. A comparison of particulate matter concentration measured by TEOM and DustTrak. ASABE publication number 711P0510cd. In: International Symposium on Air Quality and Manure Management for Agriculture. American Society of Agricultaral and Biological Engineers (ASABE),Dallas, TX, USA.
RIVM, 2011. Annual national emissions of PM10; in total and per sector/source, for 2011 (website of the Pollutant Release and Transfer Register). http://www.emissieregistratie.nl (Last accessed: 18 June 2013). National Institute for Public Health and the Environment (RIVM), Bilthoven, the Netherlands.
Roumeliotis, T.S., Dixon, B.J., Van Heyst, B.J., 2010a. Characterization of gaseous pollutant and particulate matter emission rates from a commercial broiler operation part I: Observed trends in emissions. Atm. Environ. 44:3770–3777.
Roumeliotis, T.S., Dixon, B.J., Van Heyst, B.J., 2010b. Characterization of gaseous pollutant and particulate matter emission rates from a commercial broiler operation part II: Correlated emission rates. Atm. Environ. 44: 3778–3786.
Roumeliotis, T.S., Van Heyst, B.J., 2007. Size fractionated particulate matter emissions from a broiler house in Southern Ontario, Canada. Sci. Total Environ. 383:174–182.
Rupprecht, Patashnick., 2004. Operating manual TEOM series 1400a. Edition: June 2004. Rupprecht & Patashnick Co., Inc.
Thermo, 2004. FH 62 I-R operating instructions. Edition: February 11, 2004. Thermo Electron Corp., Erlangen, Germany.
TSI, 2010. Operation and service manual, DustTrak aerosol monitor, model 8520. Edition: June 2010. TSI Inc.,Shoreview, USA.
US-EPA, 2013. List of designated reference and equivalent methods. Edition: 27 June 2013. Available from: http://www.epa.gov/ttn/amtic/criteria.html. Environmental Protection Agency (EPA).
US-EPA., 2014. Reference method for the determination of fine particulate matter as PM2.5 in the atmosphere. Environmental Protection Agency (EPA).
Van Ransbeeck, N., Van Langenhove, H., Demeyer, P., 2013a. Indoor concentrations and emissions factors of particulate matter, ammonia and greenhouse gases for pig fattening facilities. Biosyst. Eng. 116:518–528.
Van Ransbeeck, N., Van Langenhove, H., Van Weyenberg, S., Maes, D., Demeyer, P., 2012. Typical indoor concentrations and emission rates of particulate matter at building level: A case study to setup a measuring strategy for pig fattening facilities. Biosyst. Eng. 111:280–289.
Van Ransbeeck, N., Van Weyenberg, S., Van Langenhove, H., Demeyer, P. (2013b). Indoor concentration measurements of particulate matter at a pig fattening facility: Comparison and equivalence tests with different sampling instruments and measuring techniques. Biosystems Engineering, 115, 453–462.

Equivalence testing of devices for measurement of PM10 concentration in animal houses
227
Visser, M.C., Fairchild, B., Czarick, M., Lacy, M., Worley, J., Thompson, S., Kastner, J., Ritz, C., Naeher, L.P.,2006. Fine particle measurements inside and outside tunnel-ventilated broiler houses. J. Appl. Poult. Res. 15:394–405.
VSN, 2012. GenStat reference manual (release 15). Edition 15.2.0.8821. VSN-Int., Ltd, Hemel Hempstead, UK.Winkel, A., Mosquera, J., Groot-Koerkamp, P.W.G., Ogink, N.W.M., Aarnink, A.J.A., 2015. Emissions of
particulate matter from animal houses in the Netherlands. Atmos. Environ.111:202–212.Zhao, Y., Aarnink, A.J.A., Hofschreuder, P., Groot Koerkamp, P.W.G., 2009. Evaluation of an impaction and a
cyclone pre-separator for sampling high PM10 and PM2.5 concentrations in livestock houses. J. Aerosol Sci 40:868–878.


Chapter 9General discussion, conclusions, and
recommendations for future research

Chapter 9
230
INTRODUCTION
This thesis had three main objectives. The first objective was to increase our understanding
and knowledge of concentration and emission levels of particulate matter in commonly applied
animal housing systems in the Netherlands. This objective has been worked out in chapter 2. The
second objective was to develop, test, and validate PM abatement systems so that these
technologies would become available for use in poultry farms to reduce their contribution to
ambient PM concentrations. These abatement systems should be effective in terms of their
reduction as validated on commercial farms, be economically feasible, and be practically
implementable within common housing systems and farming practices. Within chapters 3
through 7, a total of seven abatement technologies have been tested under experimental
conditions and/or validated on commercial farms, namely: a fixed oil spraying system (OSF), an
autonomously driving oil spraying vehicle (OSV), a negative air ionization system (NAI), a
positive air ionization system (PAI), an end of pipe dry filter wall (DF), an end of pipe
electrostatic precipitator (ESP), and end of pipe manure drying tunnels (MDTs). Finally, the
third objective was to determine the applicability in terms of accuracy and comparability of
alternative methods – i.e., alternative to the sampler developed by Hofschreuder et al. (2008) –
for measurement of PM10 concentrations in the airflow directly upstream of animal house
exhausts. This objective has been worked out in chapter 8.
This final chapter now contains three main elements. First, the main part of this chapter deals
with the discussion of the main findings from chapters 2 through 8. Rather than discussing these
findings on a detailed level (which has already been done in the Discussion sections of the actual
chapters), this chapter discusses the findings on a meta-level, i.e., in the light of the main
objectives of this thesis and within the broad context of the overall problem. Second, this chapter
states the main conclusions from this thesis as a whole. Finally, this chapter identifies
recommendations for future research.
DISCUSSION
1. The impact of updated PM emission figures on national PM10 emission estimates
Chapter 2 of this thesis describes a PM emission survey which covered 13 housing systems
for poultry, pigs, and dairy cattle, and included 36 farms. This survey was needed to fill a
concrete knowledge gap, namely, the lack of accurate, up to date, and housing system specific

General discussion, conclusions, and recommendations for future research
231
data on emissions of PM10 and PM2.5 from animal houses in the Netherlands. These data were
primarily needed in the Netherlands for three reasons: (1) to estimate total national emission
rates of PM, and the contribution of the livestock sector therein, (2) to allow dispersion
modelling of PM, as assessment tool for permit granting to specific farms or for computing
larger-scale concentration maps, and (3) to calculate the number of exceedance days of the daily
PM10 limit value of 50 µg m–3 laid down in EU Directive 2008/50/EC.
Prior to the emission survey described in chapter 2, tentative emission factors (EFs) for PM10
and PM2.5 were estimated by Chardon and Van der Hoek (2002) on the basis of the Northern-
European emission survey by Takai et al. (1998). That survey yielded emission data from 329
animal houses in England, Denmark, Germany, and the Netherlands, collected from September
1993 to November 1995, and included the inhalable PM fraction (~PM100; see Table 1 of the
Introduction). PM10 and PM2.5 emission figures were estimated from the inhalable PM data from
animal houses in the Netherlands by conversion factors of 0.45 (PM10/PM100) and 0.08
(PM2.5/PM100) (Chardon and Van der Hoek, 2002; Appendix 2), which were obtained by these
authors from literature (Louhelainen et al., 1987; Aarnink et al., 1999).
So far, in this thesis, the term emission rate has been used to refer to the mass of a pollutant
emitted per unit of time, and expressed per animal present in an animal house during a
measurement. In Dutch legislation on PM10 emissions of animal houses (Dutch Government,
2015), emission factors are laid down, expressed in g year–1 animal place–1. The EFs based on
the calculations of Chardon and Van der Hoek (2002) are shown in Table 1. Table 1 also shows
the updated EFs calculated from the results of chapter 2 of this thesis, and the difference between
the two. For regulatory use by the Dutch Government, the emission rates in chapter 2 (in mg h–1
animal–1) were converted to EFs by multiplying these with 0.001 (mg to g), 24 (hours to days),
365 (days to year), the ratio between the number of animals present and the number of animal
places, and a correction factor for empty periods between production cycles when no emissions
occurs (e.g., 0.90 for piglets or 0.95 for laying hens).
Table 1 clearly shows that, except for laying hens, the updated EFs based on the data of
chapter 2 were considerably lower than the tentative EFs estimated by Chardon and Van der
Hoek (2002). As discussed in chapter 2, two reasons can explain this. First, in retrospect, the
general PM10/PM100 conversion factor of 0.45 by Chardon and Van der Hoek (2002) for all
animal types and housing systems was somewhat too high for LFH (0.40), about accurate for
BRO (0.44), but clearly too high for pigs (0.32 for SIH, 0.31 for WPS, and 0.32 for FTH) and
DCH (0.08). Second, the emission data of Takai et al. (1998) was mainly gathered in the second
stage of the growth cycle of growing animal categories (P.W.G. Groot Koerkamp, pers. comm.)

Chapter 9
232
when emission rates are high (chapter 2; Fig. 3). The updated EFs were based on measurements
that were balanced over the production cycle.
Table 1Overview of the tentative emission factors (EFs) calculated by Chardon and Van der Hoek (2002) on the basis of the data from Takai et al. (1998) and of the updated EFs calculated from the results of chapter 2 of this thesis (aplc = animal place).Housing system a PM10 EF PM2.5 EF b
Tentative Updated Diff. Tentative Updated Diff.(g year–1
aplc–1)(g year–1
aplc–1)(%) (g year–1
aplc–1)(g year–1
aplc–1)(%)
PoultryLFH: laying hens in floor housing 58 84 +45 10.3 4.0 –61LAH: laying hens in aviary housing 58 65 +12 10.3 3.9 –62BRB: broiler breeders in floor housing 86 43 –50 15.3 3.3 –78BRO: broilers on full litter 53 22 –58 9.4 1.6 –83TUR: male turkeys on full litter 203 86 –58 36.0 40.2 +12PigsSIH: sows in individual housing 221 181 c –18 39.2 15.5 –60SGH: sows in group housing 221 169 c –24 39.2 11.8 –70WFS: weaners, fully slatted floor 133 56 –58 23.5 1.9 –92WPS: weaners, partially slatted floor 133 74 –44 23.5 1.8 –92FTH: fattening pigs in traditional housing 275 144 d –48 48.4 7.0 –86FLD: fatt. pigs, low NH3 emission, dry feed 275 195 d –29 48.4 8.3 –83FLL: fatt. pigs, low NH3 emission, liq. feed 275 136 d –51 48.4 6.1 –87Dairy cattleDCH: Dairy cattle, cubicle housing 306 148 –52 54.0 40.6 –25
a See chapter 2 and supplementary information 1 to that chapter for more details on housing systems.b Dutch regulation does not contain EFs for PM2.5 for animal houses: figures are shown for comparison.c In Dutch regulation, one general EF for PM10 is used for sows of 175 g year–1 animal place–1.d In Dutch regulation, one general EF for PM10 is used for fattening pigs of 153 g year–1 animal place–1.
Up to the year 2009, the tentative EFs of Chardon and Van der Hoek (2002) were used by the
Institute for Public Health and the Environment (RIVM; Bilthoven, the Netherlands) to calculate
national primary PM10 emissions in the Netherlands (reported at the website of the Pollutant
Release and Transfer Register: http://www.emissieregistratie.nl). As from 2010, the updated EFs
have been used in this register (J. Vonk, Centre for Environmental Studies, RIVM, Bilthoven,
the Netherlands; personal comm.). Fig. 1 shows these PM10 emissions in the Netherlands for
1995 to 2014 for the five largest groups of sources (based on the calculation year 2014). It must
be noted that this figure does not show the aforementioned drop in the emissions from
Agriculture from 2005 to 2010/2012 because emissions from previous years are recalculated
each year based on any relevant updates of input data: when the updated (lower) EFs were first
used in 2010, the emission estimates for agriculture were recalculated and thus reduced for the
previous years as well.

General discussion, conclusions, and recommendations for future research
233
From Fig. 1 it is clear that the total national primary emission of PM10 in the Netherlands has
decreased considerably, from 58,040 kTon in 1995 to 30,830 kTon in 2014. In 2014, the total
emission of the agricultural sector amounted 6641 kTon; a contribution of 22%. This 6641 kTon
can be further differentiated into (amongst others) 4337 kTon (or 14%) from the poultry sector,
1186 kTon (or 3.8%) from the pig sector, 407 kTon (or 1.3%) from soils and crops, and 323
kTon (or 1.0%) from the dairy sector.
The impact of using the updated EFs from chapter 2 of this thesis since 2010 can be estimated
by looking at the total emission of agriculture calculated by Chardon and Van der Hoek (2002),
which amounted 9322 kTon for the year 1998. The Pollutant Release and Transfer Register,
however, currently (2014) contains a total emission from agriculture for the year 2000 (the year
nearest to 1998) of 5199 kTon (Fig. 1). The difference between those two equals (9322 – 5199 =)
4123 kTon. This adjustment of –44% can to a large extent be attributed to the updated EFs based
on chapter 2 of this thesis. The latter illustrates the importance of accurate emission rates in
national PM10 emission calculations.
Fig. 1
National primary PM10 emissions (×1000 kg) in the Netherlands from 1995 to 2014. Source data: Pollutant Release
and Transfer Register (RIVM, Bilthoven, the Netherlands): http://www.emissieregistratie.nl. Note that the years on
the x-axis are not continuous.
0
10,000
20,000
30,000
40,000
50,000
60,000
1995 2000 2005 2010 2012 2013 2014
Nat
iona
l prim
ary
PM10
em
issi
on (×
1000
kg)
Year
5. Other
4. Consumers/households
3. Agriculture
2. Industry
1. Traffic and transport

Chapter 9
234
2. The impact of updated PM emission figures in atmospheric modelling and
environmental permit granting to farmers
Besides their use in nation emission calculations (section 1), the updated EFs (Table 1) have
been used by the Institute for Public Health and the Environment (RIVM; Bilthoven, the
Netherlands) to compute large-scale pollutant concentration maps (including PM10) for the
Netherlands, as reported annually by Velders et al. (2012; 2013; 2014; 2015). Third, the EFs
have been used in the RIVM monitoring reports of Van Zanten et al. (2012; 2013; 2014; 2015),
which annually evaluate the state of affairs of the National Air Quality Cooperation Programme
in the Netherlands (Nationaal Samenwerkingsprogramma Luchtkwaliteit; NSL).
Fourth, the updated EFs function as inputs in a model named ISL3a (abbreviation for
‘Implementatie Standaardrekenmethode Luchtkwaliteit 3’ in Dutch, or ‘Implementation Standard
calculation method Air quality 3’ in English) which was developed in the Netherlands to
estimate the local dispersion of (amongst others) PM10 in the local vicinity of surface sources and
point sources (i.e., flue gas stacks, vertical chimneys) such as industrial plants and livestock
farms. Other inputs are, for instance, the number of animals housed, datasets containing 10 years
of meteorological data, the terrain roughness (i.e., reflecting the amount of vegetation), but also
location-specific ambient (background) concentrations of PM10. The latter, in turn, originate
from the large-scale pollutant concentration maps (as mentioned above). The core of the ISL3a
model is equipped with a user interface and is freely available (from: www.infomil.nl). The
ISL3a model is used in environmental permit granting to assess whether the settlement of a new
farm, or renovation or enlargement of an existing farm, at a specific site (geographical
coordinate) will result in exceedances of the PM10 limits of Directive 2008/50/EC at so-called
receptor sites in the vicinity (i.e., immission coordinates of, for instance, houses or schools).
Thus, the updated EFs based on chapter 2 of this thesis, together with the ISL3a model and the
2008/50/EC limit values, currently function as assessment framework to protect residents in the
vicinity of livestock farms against exposure to excessive PM10 concentrations from these farms.
In the ISL3a model, the EFs for PM10 are included as year-averaged values, specific to the
level of housing systems within animal types (e.g., aviary housing for laying hens or floor
housing for broiler breeders). The appropriate EF is multiplied by the planned number of animal
places in the animal house for which the model is run and a permit is requested. The model,
however, does not take time variation in the emission rate into account. The results in chapter 2
suggest that this calculation method may be too simplistic, at least in growing animals where the
emission rate increases exponentially (e.g., in broilers) or linearly (e.g., in fattening pigs)

General discussion, conclusions, and recommendations for future research
235
throughout the growing period. The common practice in fattening pig farms in the Netherlands is
to house multiple age groups of pigs at the same time. On the farm level, this practice probably
flattens out any general increase in emission. In broiler farms on the other hand, the common
practice is the ‘all-in, all-out’ system which means that all houses at a farm are occupied by birds
of the same age. Therefore, the emission rate on the farm level can be expected to increase
exponentially as well. Accurately modelling these time variations in the ISL3a model might be
of importance to more accurately predict the occurrence of exceedance days in the vicinity of
farms during time periods of high emission rates as the European limit for PM10 in the ambient
air allows a maximum of 35 exceedances of the day-average limit concentration of 50 μg m–3.
3. The role of animal houses in long-term PM emission trends in the Netherlands
Fig. 1 shows the national primary PM10 emission in the Netherlands from 1995 to 2014 for
five main groups of emission sources. From this figure it is clear that PM10 emissions have been
mitigated substantially in these years, namely by 54% from traffic/transport (24,390 kTon in
1995 to 11,330 kTon in 2014), by 59% by industries (from 16,545 kTon in 1995 to 6843 kTon in
2014), and by 25% from consumers/households (from 4370 kTon in 1995 to 3297 kTon in
2014). For the agricultural sector however, Fig. 1 shows an increase of PM emissions by 38%
(from 4824 kTon in 1995 to 6641 kTon in 2014).
The increase for agriculture in Fig. 1 is further examined in Fig. 2. This figure shows how the
national primary PM10 emission from agriculture can be further differentiated. From this figure,
it is clear that the increase is mainly caused by laying hen houses, whereas emissions from
broiler houses and dairy cattle houses remained relatively stable. The emission from pig houses
decreased, presumably by the introduction and wide-spread use of air scrubbers in this sector
since the 1990s (Melse et al., 2015). The increase for laying hen houses reflects the transition in
this sector from cage housing to alternative housing systems in these years (i.e., aviary and floor
housing systems with littered floors; in relation to the EU-wide ban on conventional cages; EU
Directive 1999/74/EC). The number of hens kept in the Netherlands has remained relatively
stable during this period (i.e, around 33 to 35 million).
Chapter 2 of this thesis has shown that in alternative housing systems for laying hens PM
concentrations are the highest of all animal categories and housing systems studied. The data
published by Takai et al. (1998) show that concentrations of inhalable PM in alternative housing
systems are on average a factor 7 (range: 1.4 to 14) higher than in cage housing systems. With
the information currently available, it can be concluded that, in hindsight, the transition from

Chapter 9
236
cage housings to floor and (mainly) aviary housings has substantially increased PM emissions
from agriculture during a period in which other main sectors were able to substantially mitigate
emissions.
Fig. 2
National primary PM10 emissions (×1000 kg) in the Netherlands from 1995 to 2014 for six subgroups of sources
within the main Agriculture group. Source data: Pollutant Release and Transfer Register (RIVM, Bilthoven, the
Netherlands): http://www.emissieregistratie.nl. Note that the years on the x-axis are not continuous.
4. Potential environmental impact of PM abatement systems
In previous sections of this chapter, it was shown that poultry houses have become a major
emission source of PM10 in the Netherlands in the last two decades, responsible for about 14% of
the national annual emission of primary PM10 in 2014. For this reason, this thesis focused on
abatement systems for this specific sector. In chapters 3 through 7 of this thesis, seven abatement
systems were further developed, tested, and validated on commercial farms. The reduction
performance of these systems ranged from 6% (positive air ionization system, PAI) and 15%
(fixed oil spraying system in laying hen houses, OSF) to 57% (electrostatic precipitator, ESP)
(see Table 2 for all systems and reduction percentages). An important question is to what extent
these systems can lower ambient PM concentrations. The answer to this question requires
knowledge on the origins of the mix of particles in the atmosphere and the contribution of
livestock houses within this mix. Three notions are important in this respect.
0
1000
2000
3000
4000
5000
6000
7000
1995 2000 2005 2010 2012 2013 2014
Nat
iona
l prim
ary
PM10
em
issi
on (×
1000
kg)
Year
6. Other
5. Dairy cattle houses
4. Soils and crops
3. Pig houses
2. Broiler houses
1. Laying hen houses

General discussion, conclusions, and recommendations for future research
237
First, it must be realized that about 40% of the PM10 in the atmosphere in the Netherlands
cannot be attributed to known sources and probably originates from natural sources (such as: sea
spray, dry soils, and wildfires), from yet unknown emissions processes, and from underestimated
(known) emission processes. Second, from the ‘attributable fraction’ of about 60%, about half
originates from foreign countries and is ‘imported’ by (uncontrollable) atmospheric air flows.
However, PM from Dutch sources (or: ‘domestic PM’) also passes national borders, and the
Netherlands is a net exporter of PM10 (Buijsman et al., 2005; Hendriks et al., 2013; Weijers et
al., 2011). Third, PM does not only comprise primary particles from natural and anthropogenic
emissions, but also secondary particles that are formed by chemical reactions in the atmosphere
from precursor gasses such as ammonia. It is estimated that secondary PM contributes about
50% or more to PM2.5 in Europe (Erisman et al., 2004). Overall, the results from the modelling
study by Hendriks et al. (2013) indicate that 6% of the PM10 in the atmosphere in the
Netherlands comes from Dutch agriculture and another 5% from foreign agriculture.
These notions suggest that reducing PM emissions from poultry farms may not reduce
ambient PM levels that much. Averaged out on a national level, this may be the case, but the
situation for specific areas may be very different because the origin of ambient PM differs
substantially across the Netherlands (e.g. higher sea salt contributions near the shores or higher
foreign contributions in border areas). Results from Hendriks et al. (2013) indicate that in the
city of Rotterdam (having the largest sea port of Europe, a large harbor, and many activities
related to the petro-chemical industry, cargo transshipments and transport), about two-third of
the domestic PM10 originates from traffic and transport. In contrast to Rotterdam, little over half
of the domestic PM10 in the Vredepeel originates from agriculture, a rural area in the south-east
of the Netherlands with a high density of livestock farms. The report by Buijsman et al. (2005)
illustrates in figure 1.2 on p. 14 that, on top of European, national, and regional contributions to
the background concentrations, local concentration peaks occur around highways, busy city
roads, and other sources. This illustration is consistent with the studies summarized in Table 3 of
chapter 1 (Introduction), which show that downwind of livestock farms plumes of particles can
be measured that spread out from ventilation exhausts. Concentrations in these plumes decrease
with the distance travelled due to sedimentation, impaction to objects, and dilution with cleaner
air. But also the results of this thesis (Fig. 1 of chapter 2) show that in the direct vicinity of
poultry and pig farms concentrations of PM10 are often substantially higher than those measured
at the nearest rural National Air Quality Monitoring (NAQM) station for the same time period.
Despite that, at a certain downwind distance, PM concentrations have fallen to levels that can no
longer be distinguished from upwind concentrations, part of the emitted PM will still be airborne
Chapter 9
238
and contribute to the mix of background particles in that region. Furthermore, concentrations of
multiple farms in a region may have overlapping areas of elevated concentrations creating a
spatial plateau of elevated PM concentrations.
In conclusion, the question ‘to what extent the PM abatement systems for poultry houses
evaluated in this thesis can lower ambient PM concentrations’ cannot be answered quantitatively
based on the work in this thesis or the literature discussed. On the national scale, the reduction
can be expected limited. But on a local and regional scale, i.e., in rural farming areas, the
reductions may well be substantial.
5. Economic impact of PM abatement systems for poultry farms
The second objective of this thesis was to develop, test, and validate PM abatement systems
for use in poultry farms to reduce their contribution to ambient PM concentrations. Such systems
should, amongst others, have acceptable costs for poultry farmers. Prior to the start of the
projects related to this objective (chapters 3 through 7) a literature study (Aarnink and Ellen,
2016) and a plan of action (Ogink and Aarnink, 2011) was produced, commissioned by the
Dutch Ministry of Economic Affairs. In these two reports, the costs of possible options were
estimated to ensure that the options included in the programme would be acceptable for farmers
in the end.
Table 2 shows the costs of the systems on the basis of realistic financial figures provided by
the suppliers that currently bring the systems to the market. Table 2 also includes a number of
other systems for abatement of PM or ammonia. The costs are calculated for a standard laying
hen house with 40,000 birds and a standard broiler farm with 2 houses with 45,000 birds each.
These two situations are used as standard farms in the KWIN economic handbook for the
livestock sector in the Netherlands, as published each year by Wageningen UR (Vermeij et al.,
2014).

General discussion, conclusions, and recommendations for future research
239
Table 2Cost analysis of seven PM abatement systems in this thesis, and of eight other systems. Investment costs = price of the system divided by the depreciation period (10 years) + price for any construction adjustments divided by the depreciation period (20years) + interest (4.5% yearly) + yearly maintenance costs. Exploitation costs = yearly costs for use of oil, water, and/or electricity + costs for labor associated with the system. Abbreviations: aplc = animal place(s); n.a. = system not applicable in that farm type. Source data from: Ellen et al. (2010), Ellen and Vermeij (2014), Vermeij et al. (2014), and Winkel et al. (2016).
PM abatement system PM10 Laying hen farm, 40,000 aplc Broiler farm, 90,000 aplcred.(%)
aInvest.costs
bExpl.costs
a + bTotalcosts
a + bTotalcosts
aInvest.costs
bExpl.costs
a + bTotalcosts
a + bTotalcosts
(€ yr–1
aplc–1)(€ yr–1
aplc–1)(€ yr–1
aplc–1)(per 10%
red.)(€ yr–1
aplc–1)(€ yr–1
aplc–1)(€ yr–1
aplc–1)(per10%red.)
Basic situationAnimal house: building and inventory
- 3.00 0.35 3.35 - 1.20 0.50 1.70 -
Additional: systems in this thesisFixed oil spr. syst. (OSF) 15 | 54 a 0.18 0.43 0.60 0.40 0.09 0.11 0.20 0.04Oil spr. vehicle (OSV) 30 0.09 0.82 0.91 0.30 n.a. n.a. n.a. n.a.Neg. air ionization (NAI) 49 n.a. n.a. n.a. n.a. 0.09 0.007 0.10 0.02Pos. air ionization (PAI) 6 0.65 0.18 0.83 1.38 0.35 0.10 0.45 0.75Dry filter (DF) 40 0.07 0.05 0.12 0.03 0.06 0.06 0.13 0.03Electrost. Precip. (ESP) 57 0.34 0.001 0.34 0.06 0.34 0.001 0.34 0.06Man. dr. tunnels (MDTs) 30 | 55 b 0.37 0.009 c 0.38 c 0.13 | 0.07 n.a. n.a. n.a. n.a.
Additional: other systemsLitter scraper 25 0.08 0.005 0.08 0.03 n.a. n.a. n.a. n.a.Simple water scrubber 30 0.41 0.53 0.94 0.31 0.45 0.49 0.95 0.32Acid scrubber 35 0.41 0.52 0.93 0.27 0.44 0.46 0.98 0.28Bioscrubber 60 | 75 d 0.49 0.73 1.22 0.20 | 0.16 0.54 0.67 1.21 0.20 | 0.16Multi-stage scrubber 80 n.a. n.a. n.a. n.a. n.a. n.a. n.a. n.a.Biobed 80 0.46 0.54 1.00 0.12 0.52 0.61 1.12 0.14Heat exchanger, type a 13 0.15 0.13 0.28 0.21 0.10 –0.08 0.02 0.01Heat exchanger, type b 31 0.26 0.13 0.39 0.13 0.23 –0.11 0.12 0.04
a 15% for the OSF in laying hens, 54% for the OSF in broilers.b 30% for the belt-type MDT, 55% for the plate-type MDT.c Reduction of manure disposal costs not taken into account.d 60 or 75% depending on the air residence time inside the scrubber.
The yearly investment costs of the systems (Columns ‘a’ in Table 2), the yearly exploitation
costs (Columns ‘b’ in Table 2), and the total of those two (Columns ‘a + b’ in Table 2) can be
compared with those from the basic situation of the building and the inventory alone, as reported
by Vermeij et al. (2014). This comparison shows that the total yearly costs of applying PM
abatement systems raises the total yearly costs related to the building and the inventory with
values between 4% (DF) and 27% (OSV) for the standard laying hen house, and between 6%
(NAI) and 26% (PAI) for the standard broiler farm.
For laying hens, the three cheapest solutions from this thesis (in absolute € animal place–1
year–1) are the DF (40% PM10 reduction) with € 0.12, the ESP (57% PM10 reduction) with € 0.34,
and the MDTs (30 or 55% PM10 reduction) with € 0.38. For broilers, the three cheapest solutions

Chapter 9
240
are the NAI (49% PM10 reduction) with € 0.10, the DF (40% PM10 reduction) with € 0.13, and
the OSF (54% PM10 reduction) with € 0.20.
If the costs are expressed per ten percentage points of PM10 reduction (Table 2), these figures
are generally more favorable for the PM abatement systems from this thesis in comparison to the
other abatement systems listed in the lower part of Table 2. Overall, the cost analysis in Table 2
indicates that the PM abatement systems from this thesis are reasonably affordable in relation to
other investments for the house and the inventory. On the other hand, gross margins (i.e.,
revenues from eggs/meat minus variable costs for young birds, feed, energy, etcetera) are only
about € 2.90 hen place–1 year–1 and € 1.30 broiler place–1 year–1 (Vermeij et al., 2014). The
additional costs for a PM abatement system have to be paid from these gross margins, together
with the investment and exploitation costs for the animal house, and the farmer’s income.
Therefore, it is still financially difficult for poultry farmers to apply PM abatement systems in
their houses. In relation to this, it would be very welcome if PM abatement systems would
improve bird productivity so that applying a PM abatement system would pay for itself. The
experiments with spraying oil in broilers (chapter 3) and laying hens (chapter 4), and an earlier
experiment with negative air ionization in broilers (Cambra-Lopez et al., 2009), however,
showed no significant differences in production performances between birds in treatment (i.e.,
low PM) and control (i.e., high PM) groups.
To stimulate the application of PM abatement systems, several subsidy programs have been
launched by the Dutch Ministry of Economic Affairs in recent years. In the latest PM subsidiary
programs of 2013 and 2014, a total budget of € 15 million was available. Farmers could apply
for a refund of their investment in a PM abatement system consisting of 55% of the eligible costs
up to a limit of € 100,000 per farm. In 2013 and 2014, a total of 382 subsidy applications were
granted (Dutch Government, 2016).
6. PM abatement by redesign of animal housing systems
Within this thesis, a total of seven systems for PM abatement have been worked out (Table 2).
Each of these systems can be ‘plugged in’ to the totality of systems/constructions that together
form the animal house: either inside the house or connected to the ventilation exhaust. The main
advantage of this approach is that the systems can be used inside existing poultry farms, for
instance in farms that currently cause local exceedances of the limits for PM in the ambient air.
On the other hand, the addition of these systems could be regarded as compensatory measure for

General discussion, conclusions, and recommendations for future research
241
shortcomings of current housing system designs that inadequately meet the key requirements of
main actors involved, such as the farmer (e.g., working comfort, safety, and health), the birds
(e.g., air quality), the environment (e.g., low ambient PM concentration), and the consumer (e.g.,
food safety). In this line of reasoning, the abatement systems from this thesis can mainly be seen
as temporary add-on solutions to bridge a period in which the poultry industry and engineering
science could go back to the drawing table to design, develop, and implement housing systems
for poultry that better take into account indoor air quality, occupational exposure, and PM
emissions.
The work described in this thesis did not aim to produce such designs. It has, however,
delivered insights that might act as inspiration for such designs. Chapters 3 and 4 have shown
that when particles in the litter of poultry houses are confined by applying a film of rapeseed oil
droplets to the litter surface, PM concentrations and emissions can be reduced by more than 80
percent. This means that the litter floor, essentially dry and crumbly manure from the birds, is the
main source of PM in litter floor housings. This finding is in agreement with the study of
Cambra-Lopez et al. (2011) who identified manure as the main source of airborne particles in
poultry houses. Furthermore, chapter 2 of this thesis has showed that, when lights are turned off
and birds are resting/perching, PM concentrations rapidly fall by more than 90 percent: this
yields very distinct light/dark patterns in continuous PM concentration data (see Chapter 2; Fig.
2). These findings show that the high PM emissions from poultry houses are caused by a
combination of three aspects: (1) the presence of a layer of litter (essentially dry and crumbly
manure from the birds) on the floor, (2) the behavioral activity of the birds on and in this litter
layer through which particles become airborne, and (3) the ventilation air flow through poultry
house that exhausts particles into the environment. These aspects are the core of the PM
emission problem as illustrated in the infographic in Fig. 1 of chapter 1. Aspects (1) and (2)
explain why cage housing systems for laying hens show relatively low PM concentrations and
emissions: they lack a litter floor and the birds are confined to cages, unable to (fully) display
their behavioral needs, such as dust bathing and scratching. Future housing design should thus
focus on these three aspects.
Not offering a litter substrate, confining birds to batteries, or keeping birds in the dark, are no
options in design approaches that aims to fulfill the needs of all actors involved (Bos, 2003; Bos
et al., 2009; Van Weeghel et al., 2016). Light, freedom of movement, and the presence of a
substrate for dustbathing and scratching are inherent elements in designs following the
aforementioned approach. What can be a way forward?

Chapter 9
242
Fig. 3 shows an example of how the presence of a litter substrate and natural bird activity
could be combined in a housing design that is low in PM concentration and emission, namely, by
separating the litter rooms for dustbathing and scratching from the main room of the animal
house where feeding, drinking, laying and resting/perching takes place. The main room can be
regarded as a ‘cage-like environment’ in the sense that the environment is relatively clean: the
manure does not accumulate into litter layers here, but is removed frequently from this room,
either by belts under the tiers of the aviary frames (in the case of hens), and/or by belts
underneath slatted floors (e.g., in the case of broilers). Since a litter layer is absent in this room,
and the presence of manure on belts is reduced to the minimum, concentrations of PM, ammonia,
and odor can be expected to be much lower than in conventional housings.
Fig. 3Example of a housing design (cross-sectional view) for laying hens with incorporation of principles that may result in a low-emission system with regard to particulate matter (PM).
The presence of litter, and the natural behavior of the birds, can be organized in separate litter
rooms (Fig. 3), which will probably be more prone to pollution than the main room. Technical
solutions will be needed to prevent air from the litter rooms to flow to the main room. The litter
rooms could be further designed to be as clean as possible. This could include the application of
a low-dust litter substrate, keeping the litter substrate layer to a minimum required by the birds
(e.g., by litter scrapers, autonomous scraping vehicles, or auger channels embedded in the floor),
and/or frequent addition of fresh litter substrate (possibly followed by a cleaning step and re-use
Litter room- Functions: dustbathingand scratching- Minimal ventilation rate required for the birds and litter quality- Use of further low-PMdesign principles and abatement systems inside and/or at exhaust
Main room with slatted floors and aviary frames (no litter)- Functions: feeding, drinking,laying, and resting- Low PM concentration- Main ventilation rate- No abatement of PM needed
Exhausts
Fresh air inlet

General discussion, conclusions, and recommendations for future research
243
of the substrate). These examples should prevent that the air becomes polluted with particles in
the first place. In addition, a PM abatement system from this thesis could be useful to remove
particles from the air in the litter rooms that are generated and aerosolized despite the design
measures taken, such as an air ionization system (chapter 5). In relation to aspect (3) described
above, it may be worthwhile to reduce the ventilation rate through the litter rooms to a minimum
so that emission rates from these rooms are further mitigated, in addition to reducing particle
concentrations in this volume. If needed, this ventilation flow may be treated further by a small-
scale end of pipe system, such as an electrostatic precipitator, dry filter, or air scrubber. These
end of pipe systems, however, should (on the long term) preferably be used as backup system
that removes a remainder of pollutants still present in the ventilation air of future (low-emission)
housing designs.
7. A retrospective view on the cyclone samplers developed and used in this thesis
This thesis established PM10 and PM2.5 emission rates of animal houses (chapter 2) and
determined PM reductions of abatement systems (chapters 3 through 7) using a PM measurement
method that was specially developed for this task, namely the cyclone sampler (CYS) described
by Hofschreuder et al. (2008). Prior to the start of the work described in this thesis (in 2007), a
choice needed to be made for a measurement method that would be able to accurately quantify
the mass concentrations of PM10 and PM2.5 under difficult circumstances, such as high PM
concentrations (>104 μg PM10 m–3), short stacks that contain ventilators which can run at varying
speeds, or no stacks at all (e.g., in the case of naturally ventilated buildings or wall ventilators).
At that time, a first decision was to adhere to measurement methods for ambient air and stay
away from stack-sampling. This was decided because the air upstream of exhausts shows
similarities to calm ambient air in terms of air velocity, temperature, and relative humidity,
whereas isokinetic stack-sampling is complicated when air velocity varies in time during
sampling. A second decision was to (initially) use straightforward filter-based systems instead of
systems that are based on the principles of the oscillating micro-balance (TEOM), beta-ray
attenuation, or light-scattering, since very little was known at that time about the functioning of
these mechanisms when sampling animal house PM. Of the principles mentioned, the filter-
based method was thought to be least sensitive to any (not yet known) sources of bias.
In essence, filter-based methods include an air sampling pump that sucks air (with airborne
particles) through a filter. The filter is weighed before and after the measurement (under strict
conditions and using a precise balance) to determine the mass of collected PM. The mass

Chapter 9
244
concentration can then be determined by dividing the mass of collected PM by the known total
flow of the pump. If a specific size fraction needs to be collected (see Table 1 of chapter 1), a
pre-separator must be applied upstream of the filter which removes particles larger than the
aimed cutpoint diameter from the sampling flow. As described in detail in chapter 8, the
measurement method used in this thesis contained cyclone pre-separators instead of greased
impactors, because of the risk of overloading the impactor plates of the latter system. An
equivalence study by Zhao et al. (2009) showed that the developed CYS functioned acceptable in
comparison to the European reference samplers for PM10 (EN 12341; CEN, 1998) and PM2.5 (EN
14907; CEN, 2005), albeit that correction equations were needed to calibrate measured PM10
concentrations to the European reference sampler. The CYSs and the correction equations of
Zhao et al. (2009) have been used throughout this thesis. In general, this approach has functioned
satisfactory. We encountered the following drawbacks:
• in poultry houses, filters were sometimes heavily loaded making the PM layer on the filter
sensitive to cracks and loss of PM. This may happen during handling and transport, but also
during weighing since prior to weighing, filters have to be removed from the filter holder by
thumb forceps. We therefore maximized the safety of filter handling and transportation
procedures (e.g., by transporting filters in Petri-dishes and in metal containers). In future,
this could be improved by reducing the sampling duration or by reducing the air flow
through the filter (e.g., by using a cyclone designed for a smaller air flow rate);
• the presence of red mites (Dermanyssus gallinae) in laying hen houses, or insects (such as
flies) in all houses, sometimes was a problem in the sense that incidentally, an insect was
found on the filter which had disturbed the PM layer by movements of wings/feet. Such
filter weights were excluded from datasets. When DustTrak samplers were used in laying
hen houses, they would sometimes contain red mites crawling behind the glass of displays or
inside the device. Because of the presence of insects, high PM concentrations, and the risk
of spreading parasites/pathogens from one farm to the next, we spent much time and effort
on cleaning, disinfection, inspection, maintenance, and calibration.
• with regard to the CYS itself, drawbacks of the method are that it only yields time-averaged
mass concentrations (e.g., over 24 hours) instead of time-resolved concentrations (e.g.,
hourly values). Furthermore, the method requires manual filter weighing, which is time-
consuming and requires a special weighing lab that is able to keep climate conditions within
very strict margins. Third, the method is not battery-powered. It requires the presence of
electricity sockets that can supply about 2 to 3 A for one unit.

General discussion, conclusions, and recommendations for future research
245
8. Other samplers to be used for PM measurement in animal houses
As described above, the developed CYS also has drawbacks. Therefore, the third objective of
this thesis was to determine the applicability (in terms of acceptable accuracy and comparability)
of alternative PM10 measurement methods – i.e., alternative to the CYS – to be applied in future,
so that PM10 measurement methods can be harmonized across institutes and more types of
samplers could become available for PM10 measurement in animal houses. This objective has
been worked out in chapter 8 as equivalence study between the European reference sampler for
PM10 (RES; described in EN 12341) and five different candidate samplers: the CYS, FH-62-IR
beta-ray attenuation sampler (BAS), TEOM 1400ab, DustTrak model 8520 light-scattering
device (DT), and Portable aerosol spectrometer model 1.109 (PAS). The main findings from
chapter 8 were that all methods showed a systematic deviation from ‘true’ values obtained by
the RES, that between-device variation was relatively high, and that these methods started to
dysfunction after about 432 to 500 h of operation (since the last full service).
The conclusion from chapter 8 was that some of the samplers tested could be regarded
acceptable when appropriate measures (such as duplicate sampling, correction factors, and more
frequent servicing) are applied. More concrete, acceptable methods could be the CYS, TEOM,
and DT. Chapter 8 shows that these three methods best meet the EN 12341 criteria on accuracy
and comparability between instruments. These methods could be chosen, provided that they are
used in duplicate (to be combined in one mean value), their systematic error is calibrated to
‘true’ concentrations (for instance by using the correction equations in Table 6 of chapter 8), and
they are serviced frequently (for instance within the maximum operating time reported in Table 7
in chapter 8). Thus, chapter 8 contributed to the availability of more samplers being applicable
for PM10 measurement in animal houses.
Chapter 8 also aimed to contribute to the harmonization of measurement methods across
institutes. In chapter 8, we determined systematic errors of methods to ‘true’ values as produced
by the European reference sampler for ambient sampling described in EN 12341. We also
followed the procedures and statistical tests of this standard because a standard on how to assess
equivalence within the context of animal house measurements is lacking. Chapter 8 has shown at
least that, in order for data on PM emissions to be compatible between institutes and countries,
there is an urgent need for institutes to relate their methods to a (shared) reference. We have
chosen to relate to the reference sampler for ambient PM10 so that PM10 concentrations measured
upstream of animal house exhaust are as compatible as possible with PM10 concentrations
measured elsewhere, such as at National Air Quality Monitoring Stations. Ideally, institutes

Chapter 9
246
within (for instance) Europe should all relate their methods to one common standard. Chapter 8
not only shows the need for that, but also provides a knowledge basis to start the development of
such a standard.
GENERAL CONCLUSIONS
The main important conclusions from chapters 2 through 8 can be summarized as follows:
• Chapter 2: PM emission rates increase exponentially with increasing age in broilers and
turkeys and increase linearly with increasing age in weaners and fatteners. In laying hens,
broiler breeders, sows, and dairy cattle, emission levels are variable throughout the year. The
mean emission rate of PM10 ranges from 2.2 to 12.0 mg h–1 animal–1 in poultry, ranges from
7.3 to 22.5 mg h–1 animal–1 in pigs, and amounts 8.5 mg h–1 animal–1 in dairy cattle. Mean
emission rate of PM2.5 ranges from 0.11 to 2.41 mg h–1 animal–1 in poultry, ranges from 0.21
to 1.56 mg h–1 animal–1 in pigs, and amounts 1.65 mg h–1 animal–1 in dairy cattle.
• Chapter 3: oil spraying for PM abatement in broiler houses should be done by daily
application of 16 mL m–2 or less starting from day 21 of the growth cycle. This can reduce
PM emission rates from the last 3 weeks of the growing cycle up to 70% without effects on
ammonia emission, odor emission, bird performance, birds’ exterior quality, and litter dry
matter content.
• Chapter 4: oil spraying for PM abatement in aviary housings for laying hens at application
rates of 15, 30, or 45 mL m–2 day–1 reduces emission rates of PM10 by 27, 62, and 82%, and
emission rates of PM2.5 by 71, 83, and 94%, respectively. It is advised to use application
rates of 15 to 30 mL m–2 day–1 at which no or minor side effects are found in terms of
mortality, egg production, dust bathing behavior, scratching behavior, plumage soiling, DM
content of the litter, or friability of the litter.
• Chapter 5: the PM10 and PM2.5 emission reductions of the four PM abatement systems
evaluated are: 60% and 53% for the fixed oil spraying system in broilers (at 12 mL m–2 day–
1), 21% and 31% for the fixed oil spraying system in laying hens (at 15 mL m–2 day–1), 32%
and 38% for the autonomously driving oil spraying vehicle in laying hens (at 30 mL m–2
day–1), 49% and 68% for the negative air ionization system in broilers, and 6% and zero for
the positive air ionization system in laying hens. None of the systems reduces odor or

General discussion, conclusions, and recommendations for future research
247
ammonia emission. On the basis of this work, emission reduction factors of the OSF, OSV,
and NAI were adopted in Dutch regulations.
• Chapter 6: the PM removal efficiency of the dry filter increases with increasing particle
diameter. It can reduce PM10 by 40%, but does not remove PM2.5 from the exhaust air. The
removal efficiency of the electrostatic precipitator amounts 57% for PM10 and 45% for
PM2.5. The performance of both systems can be further improved. On the basis of this work,
emission reduction factors of both systems were adopted in Dutch regulations.
• Chapter 7: manure drying tunnels can act as dust filters: they are able to filter out PM from
the drying air flow when it passes the manure layer in these tunnels. The PM10 removal
efficiency increases linearly with increasing manure layer thickness: from approximately
35% at 4 cm to approximately 84% at 17 cm. This PM reduction is accompanied by extra
emissions of ammonia and odor from the drying manure. Intensive pre-drying inside the
house or shortening manure accumulation time in the house to 24 h (without pre-drying) can
only partly prevent extra ammonia emission from the manure drying tunnel later on. Even
shorter manure accumulation times (e.g., 18, 12, or 6 h) may be needed to further reduce the
ammonia emission from manure drying tunnels.
• Chapter 8: the five PM10 samplers tested show systematic deviations from the European
reference sampler. Furthermore, their between-device variation is relatively high, and they
start to dysfunction after 432 to 500 h of operation (since the last full service). Duplicate
sampling, application of correction factors, and an adequate frequency of servicing are
necessary measures when using these samplers to determine PM10 concentrations in animal
houses.
Further conclusions from the discussion of these main findings on a meta-level are:
• Societal impact of PM emission rates: since 2010, the emission rates from chapter 2 play
an important role in dealing with the problem of particulate air pollution in the Netherlands.
They: (1) have been adopted as emission factors in Dutch regulation on PM emissions from
livestock houses; (2) substantially altered the national PM10 emission estimates of the
livestock sector since 2010, and herewith the contribution of the livestock sector to the total
national PM10 emissions; (3) are used to compute large-scale pollutant concentration maps
(including PM10) for the Netherlands; (4) are used in annual evaluations of the state of
affairs of the National Air Quality Cooperation Programme in the Netherlands; and (5) are

Chapter 9
248
used in the ISL3a dispersion model which is used in the environmental permit granting
procedure in the Netherlands to protect residents in the vicinity of livestock farms against
exposure to excessive PM10 concentrations from farm emissions.
• Environmental impact of PM abatement systems: despite the fact that PM abatement
systems for poultry houses as evaluated in this thesis may contribute only little to the
reduction of ambient PM concentrations on the national scale, their contribution on a local
and regional scale (i.e., in rural farming areas) is likely to be significant.
• Economic impact of PM abatement systems: the PM abatement systems evaluated in this
thesis have yearly costs that are generally affordable for laying hen and broiler farms in
comparison to other investments for the house and inventory. Gross margins in these sectors
are, however, small, and the systems probably do not increase bird performance and
revenues.
• Design of low-PM housing systems for poultry: the substantial increase in the national
emission of PM10 from agriculture due to the transition from cage housings to alternative
housings for laying hens could on the long term be reduced again by new housing designs
that more adequately meet the requirements of the farmer, the animal, the consumer, and the
environment.
SUGGESTIONS FOR FUTURE RESEARCH
On the basis of this thesis, the following recommendations are given for future research:
• Chapter 2 of this thesis presents separate emission rates for different housing categories
within an animal category (e.g., laying hens in aviary housing versus laying hens in floor
housing). The question is whether the emission rates from those housing systems are truly
different. Statistically, the dataset of chapter 2 (with two or four houses per housing system)
was insufficient with respect to the number of observations to determine the significance of
such differences. Merging the dataset from chapter 2 with emission data from control houses
in this thesis (i.e., chapters 5 through 7), and other projects carried out at our institute in
recent years, can result in a dataset two or three times the original size. Such a dataset can
improve the accuracy of the emission estimates of housing systems and allows
determination of significant differences between housing systems. If there is no statistical

General discussion, conclusions, and recommendations for future research
249
basis for maintaining separate emission factors for housing systems within animal
categories, emission factors could be harmonized into one figure.
• A dataset as mentioned above could further be used to determine the contribution of
variance components (i.e., between sampler variation within duplicates, within-house
variation in time, and between-house variation) to the total variance of an emission estimate
for a housing system. Such analysis can give important insights that may further shape the
measurement strategy (e.g., number of houses and number of measurements per house to be
performed) for accurate determination of PM emission factors of housing systems.
Furthermore, information on within-house variation in time, combined with identification of
systematic time-patterns could improve the accuracy of percentile-estimates from dispersion
modelling of PM10. Inclusion of this information in the current model used in license
procedures (ISL3a) could avoid the risk of bias in estimated percentiles.
• In this thesis, we found similar production performances between birds in treatment (i.e.,
low PM) and control (i.e., high PM) groups in semi-practical housings. The literature is
inconclusive about the extent to which the poor air quality reported in chapter 2 leads to
adverse effects on the health, wellbeing and production performance of animals. More
scientific information is needed on this matter, because clean air may well improve both the
living conditions for the animals and their production performance.
• To facilitate the design of low-PM housing systems for poultry, more insight is needed in
the efficacy of key design elements for the prevention of high PM concentrations, such as
litter substrates, frequent replacement of litter, or the separation of behaviors in different
parts of the building.
• In chapter 8 of this thesis, we found that the cyclone sampler for PM10 as used throughout
the work in this thesis, was equivalent to the European reference sampler (described in EN
12341) in pigs and layers, but overestimated ‘true’ concentrations in broilers. An earlier
equivalence study by Zhao et al. (2009) found more pronounced overestimations. In chapter
8, we discussed that this might be due to between-farm variation in the cyclone/reference
sampler relationship. A future study with side by side measurements of PM10 with both
samplers in multiple farms is needed to clarify this between-farm variation. Based on the
study of Zhao et al. (2009), we used a correction equation of 0.83 (and an intercept of 223
μg m–3) to all PM10 concentrations. The recommended study can clarify whether emission
data should be corrected with factors closer to 1.

Chapter 9
250
REFERENCES
Aarnink, A.J.A., Ellen, H.H., 2006. Processen en factoren bij fijn stofemissie in de veehouderij [Processes and factors influencing fine dust emissions from livestock production; in Dutch, with English summary]. Report 11. Wageningen University and Research Centre, Animal Sciences Group, Lelystad, the Netherlands.
Aarnink, A.J.A., Roelofs, P.F.M.M., Ellen, H.H., Gunnink, H., 1999. Dust sources in animal houses. In: International Symposium on Dust Control in Animal Production Facilities. Danish Institute of Animal Science Aarhus, Denmark, pp. 34–40.
Bos, A.P., Groot Koerkamp, P.W.G., Gosselink, J.M.J., Bokma, S., 2009. Reflexive interactive design and its application in a project on sustainable dairy husbandry systems. Outlook Agric. 38:137–145.
Bos, A.P., Groot Koerkamp, P.W. G., Groenestein, K., 2003. A novel design approach based on recursive control. Livest. Prod. Sci. 84:157–170.
Buijsman, E., Beck, J.P., Cassee, F.R., Koelemeijer, R.B.A., Matthijsen, J., Thomas, R., Wieringa, K., 2005. Fijn stof nader bekeken – De stand van zaken in het dossier fijn stof [A closer look on particulate matter – The state of affairs in the particulate matter dossier; in Dutch]. Milieu- en Natuurplanbureau Rapport 500037008. Milieu-en Natuurplanureau en sector Milieu en Veiligheid, National Institute for Pulic Health and the Environment, Bilthoven, the Netherlands.
Cambra-López, M., Hermosilla, T., Lai, H.T.L., Aarnink, A.J.A., Ogink, N.W.M., 2011. Particulate matter emitted from poultry and pig houses: Source identification and quantification. Trans. ASABE 54: 629–642.
Chardon, W.J., Van der Hoek, K.W., 2002. Berekeningsmethode voor de emissie van fijn stof vanuit de landbouw [Calculation method for emission of fine dust from agriculture; in Dutch]. Alterra-report 682 / RIVM-report 773004014. Wageningen University and Research Centre, Alterra and the National Institute for Public Health and the Environment (RIVM), Wageningen, the Netherlands.
Ellen, H., Vermeij, I., 2014. Update berekening van kosten voor fijnstofreductiesystemen [Update of cost estimates of particulate matter reduction systems]. Unpublished data. Wageningen University and Research Centre, Livestock Research.
Ellen, H., Vermeij, I., Winkel, A., van Emous, R., 2011. BBT fijn stof: beschrijving systemen en kosten [Best available techniques for particulate matter: description of systems and costs; in Dutch]. Report 476. Wageningen University and Research Centre, Livestock Research, Lelystad, the Netherlands.
Erisman, J.W., Schaap, M., 2004. The need for ammonia abatement with respect to secondary PM reductions in Europe. Environ. Pollut. 129:159–163.
Hendriks, C., Kranenburg, R., Kuenen, J., van Gijlswijk, R., Wichink Kruit, R., Segers, A., Denier van der Gon, H., Schaap, M., 2013. The origin of ambient particulate matter concentrations in the Netherlands. Atmos. Environ.69:289–303.
Louhelainen, K., Vilhunen, P., Kangas, J., Terho, E.O., 1987. Dust exposure in piggeries. European Journal of Respirat. Dis. 71:80–90.
Melse, R.W., Schalk, J.A.C., Bartels, A.A., 2015. Onderzoek naar aanwezigheid van legionella in biologische luchtwassers bij stallen [Research into the presence of Legionella in bioscrubbers at livestock farms; in Dutch, with English summary]. Report 891. Wageningen University and Research Centre, Livestock Research, Wageningen, the Netherlands.
Ogink, N.W.M., Aarnink, A.J.A., 2011. Plan van aanpak bedrijfsoplossingen voor fijnstofreductie in de pluimveehouderij [Plan of action for particulate matter mitigation solutions in poultry; in Dutch, with English summary]. Report 113. Animal Sciences Group, Wageningen University and Research Centre, Lelystad, the Netherlands.
Dutch Government, 2015. Emissiefactoren fijn stof voor veehouderij 2015 [Fine dust emission factors for the livestock sector 2015]. Ministry of Infrastructure and the Environment, Den Haag, the Netherlands.
Dutch Government, 2016. Fijnstofmaatregelen 2015 [Fine dust measures 2014]. http://www.rvo.nl/subsidies-regelingen/fijnstofmaatregelen-2013. Accessed: June 2016. Ministry of Infrastructure and the Environment, Den Haag, the Netherlands.
Takai, H., Pedersen, S., Johnsen, J.O., Metz, J.H.M., Groot Koerkamp, P.W.G., Uenk, G.H., Phillips, V.R., Holden, M.R., Sneath, R.W., Short, J.L., White, R.P., Hartung, J., Seedorf, J., Schröder, M., Linkert, K.H., Wathes, C.M., 1998. Concentrations and emissions of airborne dust in livestock buildings in Northern Europe. J. Agric. Eng. Res. 70:59–77.
Van Weeghel, H.J., Bos, A.P., Spoelstra, S.F., Groot Koerkamp. P.W.G., 2016. Involving the animal as a contributor in design to overcome animal welfare related trade-offs: The dust bath unit as an example. Biosyst. Eng. 145:76–92.
Van Zanten, M.C., Berkhout, J.P.J., Wesseling, J., Mooibroek, D., Nguyen, P.L., Groot Wassink, H., Sanders, A., 2015. Monitoringsrapportage NSL 2015 [State of affairs of the National Air Quality Cooperation Programme

General discussion, conclusions, and recommendations for future research
251
2015, in Dutch, with English summary]. Report 2015-0166. National Institute for Public Health and the Environment (RIVM), Bilthoven, the Netherlands.
Van Zanten, M.C., Van Alphen, A., Wesseling, J., Mooibroek, D., Nguyen, P.L., Groot Wassink, H., Verbeek, C., 2012. Monitoringsrapportage NSL 2012 [State of affairs of the National Air Quality Cooperation Programme 2012, in Dutch, with English summary]. Report 680712004/2012. National Institute for Public Health and the Environment (RIVM), Bilthoven, the Netherlands.
Van Zanten, M.C., Van Alphen, A., Wesseling, J., Mooibroek, D., Nguyen, P.L., Groot Wassink, H., Verbeek, C., 2013. Monitoringsrapportage NSL 2013 [State of affairs of the National Air Quality Cooperation Programme 2013, in Dutch, with English summary]. Report 680712005/2013. National Institute for Public Health and the Environment (RIVM), Bilthoven, the Netherlands.
Van Zanten, M.C., Van Alphen, A., Wesseling, J., Mooibroek, D., Nguyen, P.L., Groot Wassink, H., Verbeek, C., 2014. Monitoringsrapportage NSL 2014 [State of affairs of the National Air Quality Cooperation Programme 2014, in Dutch, with English summary]. Report 2014-0092. National Institute for Public Health and the Environment (RIVM), Bilthoven, the Netherlands.
Velders, G.J.M., Aben, J.M.M., Geilenkirchen, G.P., Den Hollander, H.A., Jimmink, B.A., Van der Swaluw, E., De Vries, W.J., Wesseling, J., Van Zanten, M.C., 2013. Grootschalige concentratie- en depositiekaarten Nederland 2013 [Large-scale concentration and deposition maps for the Netherlands 2013; in Dutch]. Report 680362003/2013. National Institute for Public Health and the Environment (RIVM), Bilthoven, the Netherlands.
Velders, G.J.M., Aben, J.M.M., Geilenkirchen, G.P., Den Hollander, H.A., Noordijk, H., Van der Swaluw, E., De Vries, W.J., Wesseling, J., Van Zanten, M.C., 2014. Grootschalige concentratie- en depositiekaarten Nederland 2014 [Large-scale concentration and deposition maps for the Netherlands 2014; in Dutch]. Report 680363002/2014. National Institute for Public Health and the Environment (RIVM), Bilthoven, the Netherlands.
Velders, G.J.M., Aben, J.M.M., Geilenkirchen, G.P., Den Hollander, H.A., Van der Swaluw, E., De Vries, W.J., Van Zanten, M.C., 2015. Grootschalige concentratie- en depositiekaarten Nederland 2015 [Large-scale concentration and deposition maps for the Netherlands 2015; in Dutch]. Report 2015-119. National Institute for Public Health and the Environment (RIVM), Bilthoven, the Netherlands.
Velders, G.J.M., Aben, J.M.M., Jimmink, B.A., Geilenkirchen, G.P., Van der Swaluw, E., De Vries, W.J., Wesseling, J., Van Zanten, M.C., 2012. Grootschalige concentratie- en depositiekaarten Nederland 2012 [Large-scale concentration and deposition maps for the Netherlands 2012; in Dutch]. Report 680362002/2012. National Institute for Public Health and the Environment (RIVM), Bilthoven, the Netherlands.
Vermij, I. (editor), 2014. Kwantitatieve Informatie Veehouderij (KWIN) 2014-2015 [Quantitative information about the livestock sector 2014-2015]. Handbook 28. Wageningen University and Research Centre, Livestock Research, Wageningen, the Netherlands.
Weijers, E.P., Schaap, M., Nguyen, L., Matthijsen, J., Denier Van Der Gon, H.A.C., Ten Brink, H.M., Hoogerbrugge, R., 2011. Anthropogenic and natural constituents in particulate matter in the Netherlands. Atmos. Chem. Phys. 11:2281–2294.
Winkel, A., Wouters, I.M. (editors), 2016. Additionele maatregelen ter vermindering van emissies van bioaerosolen uit stallen: verkenning van opties, kosten en effecten op de gezondheidslast van omwonenden. [Additional measures to reduce emissions of bioaerosols from animal houses: exploration of options, costs, and effects on health of neighboring residents; in Dutch]. Report 949 (in press), Institute for Risk Assessment Sciences (IRAS), Utrecht University (authors: Wouters, I.M., Heederik, D.J.J.), Wageningen UR, Central Veterinary Institute (author: Hagenaars, T.J.), Wageningen UR Livestock Research (Ogink, N.W.M., Vermeij, I., Winkel, A.), Wageningen, the Netherlands.


Summary

Summary
254
In many parts of the world important food products such as meat, eggs, and milk are produced
by animals kept in specialized houses equipped with mechanical and computerized systems, such
as feeding systems and ventilation systems. These animal houses are extremely dusty
environments. The term ‘dust’ is often used in popular language, whereas this thesis uses the
term particulate matter (PM) to refer to ‘fine solid or liquid particles suspended in a gaseous
medium’. PM inside animal houses mainly originates from manure, feathers, skin flakes, hair,
bedding material, and feed. These sources dry, deteriorate into small particles, and become
aerosolized by the activity of the animals or by ventilation air flows. Due to its organic nature,
animal house PM contains high levels of endotoxins (i.e., pro-inflammatory compounds from the
outer membrane of Gram-negative bacteria) and micro-organisms. Farmers are chronically
exposed to high concentrations of PM which negatively impacts their respiratory health. Adverse
effects of PM have also been found on the health and productivity of the animals. Since animal
houses are ventilated, large amounts of PM are emitted into the atmosphere, contributing to local
and regional ambient PM concentrations. In many livestock farming areas, PM10 concentrations
are only just below the limits laid down in European directive 2008/50/EC to protect its residents
against air pollution, and in several other regions these limits are exceeded. Studies on urban
aerosols show associations between PM10 concentration and respiratory and cardiovascular
disease, but health effects of livestock PM have are less well studied. Recent studies suggest both
protective effects (e.g., a lower prevalence of asthma) and adverse effects (e.g., a higher
prevalence of pneumonia). Thus, livestock PM poses a threat to the farmer, the animals, and
residents living in livestock farming areas, but the primary focus of this thesis is on the cause of
the latter problem, namely on emissions of PM from livestock houses.
In relation to this problem, the objectives of this thesis were threefold. The first objective was
to increase our understanding and knowledge of concentrations and emission rates of particulate
matter in commonly applied animal housing systems. This can be used to develop abatement
solutions, to adopt emission factors in legislation, to estimate national emissions, ambient PM
concentrations and exceedances, to facilitate policy making, and to allow environmental permit
granting to farmers. The second objective was to develop, test, and validate technologies to
mitigate PM concentrations and emissions such that these systems will become available for use
in poultry farms, and ultimately contribute to cleaner outdoor air. The third objective was to
determine the applicability (in terms of acceptable accuracy and comparability) of alternative
PM10 measurement methods to the method used in chapters 2 through 7 of this thesis. This can
be used to harmonize PM10 measurement methods across institutes and to further increase the
availability of samplers for the measurement of PM10 in animal production.

Summary
255
In relation to the first objective, chapter 2 presents a national emission survey into the
concentrations and emissions of particulate matter from animal houses in the Netherlands. This
survey covered 13 housing systems for poultry, pigs, and dairy cattle, and included 36 farms. In
total, 202 24-h measurements were carried out, which included concentrations of inhalable PM,
PM10, PM2.5, and CO2, ventilation rate, temperature, and relative humidity. On an animal basis,
geometric mean emission rates of PM10 ranged from 2.2 to 12.0 mg h–1 in poultry and from 7.3
to 22.5 mg h–1 in pigs. The mean PM10 emission rate in dairy cattle was 8.5 mg h–1. Geometric
mean emission rates of PM2.5 ranged from 0.11 to 2.41 mg h–1 in poultry and from 0.21 to 1.56
mg h–1 in pigs. The mean PM2.5 emission rate in dairy cattle was 1.65 mg h–1. Emissions are also
reported per Livestock Unit and Heat Production Unit. PM emission rates increased
exponentially with increasing age in broilers and turkeys and increased linearly with increasing
age in weaners and fatteners. In laying hens, broiler breeders, sows, and dairy cattle, emission
levels were variable throughout the year.
In relation to the second objective, chapter 3 presents an experiment into the application of a
thin film of rapeseed oil onto the litter of broiler houses, which prevents particles in the litter
from becoming airborne. Effects were investigated of two rapeseed oil application rates (8 or 16
mL m–2 d–1) in combination with two spraying frequencies (daily or every other day) in four oil
treatments: 8 mL m–2 (24 h)–1, 16 mL m–2 (48 h)–1, 16 mL m–2 (24 h)–1, and 32 mL m–2 (48 h)–1
during two growth cycles of broilers. Oil treatments were randomly assigned to four rooms,
whereas two rooms served as control (0 mL m–2). Oil spraying started on day 21. Prior to the
second growth cycle, the spraying system was optimized to improve the distribution of oil and
reduce the generation of small oil particles. We measured concentrations of PM10, PM2.5,
ammonia, and odor, and ventilation rate. Furthermore, we recorded bird performance and birds’
exterior quality. PM10 emission was significantly reduced by 59% at 8 mL m–2 d–1 and by 64% at
16 mL m–2 d–1. For PM2.5, these values were 81% and 74% respectively. In the two ‘every other
day’ treatments, PM10 emission was 44% higher on days after spraying than on spraying days.
No significant effect of oil spraying was found on ammonia emission, odor emission, bird
performance, and birds’ exterior quality. The latter confirms results from an earlier experiment
that at an application rate of 16 mL m–2 d–1 the incidence of foot-pad lesions is not increased. It
is recommended to validate the effects of oil spraying inside full-scale commercial broiler houses
at a daily application of 16 mL m–2 or less.
In relation to the second objective, chapter 4 presents an experiment into dose-response
effects of oil spraying in aviaries for laying hens on concentrations and emission rates of PM10
and PM2.5, on stockmen’s exposure to PM10, on egg production, exterior quality and behavior of

Summary
256
the hens, and on the litter. The experiment was carried out with 4 treatments: 0 (control), 15, 30,
and 45 mL/m2 per day (oil treatments). Each treatment was applied in 2 rooms with different
aviary systems (8 rooms in total). The experiment was repeated during a second period, both
lasting 35 d. From day 11 to day 35, oil was applied daily using a spraying gun. Applying 15, 30,
or 45 mL/m2 per day significantly reduced emission rates of PM10 by 27, 62, and 82%, and
emission rates of PM2.5 by 71, 83, and 94% respectively. No significant effects of oil spraying
were found on mortality, egg production, dust bathing behavior, scratching behavior, plumage
soiling, DM content of the litter, or friability of the litter. A significant worsening of the plumage
condition was only found for the body spot back/wings/tail (not for: throat/neck, chest/breast, or
legs) in the 45 mL/m2 per day treatment. Egg quality shifted significantly towards more second
class eggs in the oil treatments (1.9% versus 1.4). Remarkably, foot soiling decreased with
increasing oil application. It was concluded that PM concentrations and emission rates in aviaries
can be effectively reduced by spraying 15 to 30 mL/m2 per day with minor side effects within a
25 day application period.
In relation to the second objective, chapter 5 presents a field evaluation of the performance of
four systems for abatement of particulate matter (PM) emission inside full-scaled commercial
poultry houses: a fixed oil spraying system (OSF) inside two broiler farms and one laying hen
house), an autonomously driving oil spraying vehicle (OSV) in one laying hen house, a negative
air ionization system (NAI) inside two broiler farms, and a positive air ionization system (PAI)
inside two laying hen houses. The systems were evaluated using case-control approaches. At
each farm, six 24-h measurements were scheduled of PM10, PM2.5, ammonia, odor, and carbon
dioxide concentrations (the latter for estimation of the ventilation rate and herewith emissions).
This chapter presents the layout of the systems, compares their performance in practice with that
under experimental conditions, discusses improvement possibilities, reports the baseline
emission rates of the poultry houses, and discusses the validity of the case-control approaches.
The emission reductions of PM10 and PM2.5 were: 60% and 53% for the OSF in broilers (at 12
mL m–2 d–1), 21% and 31% for the OSF in laying hens (at 15 mL m–2 d–1), 32% and 38% for the
OSV in laying hens (at 30 mL m–2 d–1), 49% and 68% for the NAI in broilers, and 6% and zero
for the PAI in laying hens. None of the systems significantly reduced the emission rate of odor or
ammonia. On the basis of this work, emission reduction factors of the OSF, OSV, and NAI have
been adopted in Dutch regulations.
In relation to the second objective, chapter 6 presents a field evaluation of the removal
performance of two exhaust air cleaning systems for abatement of PM emission in poultry
houses: a commercially available dry filter (DF) and a full-scale prototype electrostatic
Summary
257
precipitator (ESP). Each system was connected to two commercial, non-cage laying hen houses:
one with aviary housing, the other with floor housing. At each house, six to nine 24-h
measurements were carried out, spread over the year and the laying cycle. Upstream and
downstream of the systems, we measured PM10, PM2.5, and carbon dioxide concentrations,
temperature, and relative humidity. Additional measurements of particle size distribution only
were carried out at the DF of another poultry house. The latter showed that removal of PM by the
DF increased with increasing particle diameter. Mean removal efficiency of the DF for PM10 was
40.1%, whereas PM2.5 was not significantly removed. The ESP reduced concentrations of PM10
by an average of 57.0% and concentrations of PM2.5 by an average of 45.3%. For neither of the
two systems an effect of upstream PM concentration on removal performance was found. Results
of this study are compared with the available literature and possibilities to improve removal
performance are discussed. The mean (SD between houses) untreated emissions rate from the
non-cage layer houses was 7.81 (4.12) mg PM10 h–1 bird–1 and 0.44 (0.28) mg PM2.5 h–1 bird–1.
On the basis of this work, emission reduction factors of the DF and ESP have been adopted in
Dutch regulations.
In relation to the second objective, chapter 7 presents a study on the efficacy of manure
drying tunnels (MDTs) to serve as ‘end of pipe’ PM filters, and on possible additional emissions
of ammonia and odor from these MDTs. This study aimed to determine the PM abatement
potential of the MDTs, their additional emissions of ammonia and odor, and the perspective of
two strategies to reduce additional emissions: (1) by pre-drying the manure on the belts inside
the house, and (2) by reducing manure accumulation time (MAT) in the house to 24-h followed
by rapid drying inside the MDT. This study was set up as an emission survey at 16 laying hen
farms with a MDT. The results showed that PM10 removal efficiency of the MDTs increases
linearly with manure layer thickness: from about 35% at 4 cm to 84% at 17 cm. Ammonia and
odor concentrations in the drying air increased substantially upon passing the manure layers,
from on average 5.5 to 13.9 ppm ammonia and from 822 to 1178 OUE m–3. With regard to
strategy (1), ammonia emission decreased with increasing DM content of the manure, but even at
DM content levels beyond 50%, substantial ammonia emission remained. With regard to strategy
(2), the emission rates of houses and MDTs together were 44% lower for PM10, 20% higher for
ammonia, and 40% higher for odor compared with the theoretical situation of the houses without
MDT. From this chapter it is concluded that the strategies are not sufficient in preventing the
additional emissions. Further shortening MAT to 18, 12, or 6 h might be needed to reduce
emissions from MDTs.

Summary
258
In relation to the third objective, chapter 8 presents an equivalence study on the accuracy and
comparability of samplers available for measuring the high PM10 concentrations (>100 μg m–3)
in the inside air directly upstream of the ventilation exhausts. This chapter provides insight into
this matter for five candidate samplers: a filter-based cyclone sampler (CYS), the Thermo
Scientific FH 62 I-R beta-attenuation sampler (BAS), the Thermo Scientific Tapered Element
Oscillating Microbalance, model 1400ab (TEOM), the TSI DustTrak model 8520 (DT), and the
GRIMM Portable Aerosol Spectrometer model 1.109 (PAS). Equivalence tests were carried out
following European Standard EN 12341 using two devices for each candidate sampler (CAS)
and four filter-based low-volume reference samplers (RES). Measurements were performed
inside three major animal housings (a fattening pig house, a laying hen house, and a broiler
house) and inside an office room. The key results and conclusions are: (1) neither one of the five
CASs, nor the RES itself, met the EN 12341 requirement for comparability between devices of
the same sampler type. Using a less strict boundary for this aspect – in concert with performing
duplicate sampling – may be appropriate. (2) The CYS met the EN 12341 accuracy requirements
in pigs and layers, but overestimated the RES concentration in broilers. The BAS, TEOM, and
DT underestimated, and the PAS overestimated, RES concentrations in a systematic manner. The
use of correction factors seems to be a promising method to calibrate measured values to RES
concentrations. (3) The BAS, TEOM, DT, and PAS started to show scattered regression after
432–500 h of sampling, which stresses the need for shortened time intervals between full
services. In conclusion, some of the samplers tested could be regarded acceptable when
appropriate measures (such as duplicate sampling, correction factors, and more frequent
servicing) are applied.
In chapter 9, the main findings from chapters 2 through 8 are discussed on a meta-level, i.e.,
in the light of the main objectives of this thesis and within the broad context of the overall
problem. This chapter shows that the emission rates from chapter 2 currently play an important
role in dealing with the problem of particulate air pollution in the Netherlands. They (1) have
been adopted as emission factors in Dutch regulation on PM emissions from livestock houses;
(2) substantially altered the national PM10 emission estimates of the livestock sector since 2010,
and herewith the contribution of the livestock sector to the total national PM10 emissions; (3) are
used to compute large-scale pollutant concentration maps (including PM10) for the Netherlands;
(4) are used in annual evaluations of the state of affairs of the National Air Quality Cooperation
Programme in the Netherlands; and (5) are used in the ISL3a dispersion model which is used in
the environmental permit granting procedure in the Netherlands to protect residents in the
vicinity of livestock farms against exposure to excessive PM10 concentrations from farm

Summary
259
emissions. With regard to the abatement systems, the discussion shows that, despite that they
may contribute only little to the reduction of ambient PM concentrations on the national scale,
their contribution on a local and regional scale (i.e., in rural farming areas) is likely to be
significant. The PM abatement systems evaluated in this thesis have yearly costs that are
generally affordable for laying hen and broiler farms in comparison to other investments for the
house and inventory. Gross margins in these sectors are, however, small, and these systems
probably do not increase bird performance and revenues. This chapter furthermore illustrates that
the national emission of PM10 from agriculture due to the transition from cage housings to
alternative housings for laying hens could on the long term be reduced again by new housing
designs that more adequately meet the requirements of the farmer, the animal, the consumer, and
the environment. Finally, this chapter gives recommendations for future research.


Epilogue

Epilogue
262
This PhD adventure started in the summer of 2008. After an open application and two job
interviews, I was offered a position as junior researcher and project leader with a focus on
‘particulate matter emission from livestock houses’. In previous years, livestock houses had been
identified as an important source of airborne particulate matter in some regions in the
Netherlands and much work needed to be done to increase our understanding of this subject.
Initially, it was not my intention to start a PhD project. I knew little about the subject, so my
focus was on gaining expertise, setting up and leading projects, and getting all the work done;
not so much on obtaining a degree of doctor based on that work. It was Peter Groot Koerkamp
who first came up to me and raised the idea to use completed and running projects to write a
series of papers within a PhD setting. This idea gradually developed and about four years ago, a
committee was set up with Peter Groot Koerkamp as promotor and Nico Ogink and André
Aarnink as co-promotors. From then on, things accelerated. Our ideas were transformed into a
concrete PhD plan and a Training and Supervision Plan, all formal arrangements were made, I
started re-analyzing datasets from completed projects that had been published in research reports,
and started writing English manuscripts for scientific journals. Thanks to a pile of available
research results and great supervisors, everything went rather smoothly and I never really had to
doubt whether the PhD project would succeed. Peter, Nico, and André; it was a pleasure to be
supervised by you during this process. Our meetings, conversations, and discussions, and your
often raiser-sharp comments to drafts, felt like intellectual training sessions which allowed me to
grow in knowledge, insight, and competence. Thanks for your ongoing collegiality, humor, and
energy! My thanks also goes to Nico Verdoes for putting trust in me during the first years of my
job, for offering me a permanent position thereafter, and for stimulating me to start this PhD
project. Bastiaan Meerburg, as Nico’s successor you always stimulated me to further this PhD
project and helped in any way you could. Your no-nonsense, constructive and energetic attitude
created the right setting for me to prosper in.
Chapters 2, 5, 6, 7, and 8 of this thesis are based on data obtained from measurements at about
60 commercial farms. It is thanks to the hospitality of each of these dairy, pig, and poultry
farmers that these chapters could be written. I have refrained from writing down each of their
names because it would probably cover half a page, but it can’t be emphasized enough how
important their voluntary and kind assistance has been for this thesis. My thanks also goes to
Johan Pikstra, Hans Kooijman, Fred Pouls, and Gerrit Vunderink, animal caretakers at the
former poultry research center ‘Het Spelderholt’ in Lelystad. Their practical but professionally
conducted work underlies chapters 3 and 4 of this thesis.

Epilogue
263
The data in this thesis were mainly gathered by our research assistants and lab technicians.
Klaas Blanken, Freerk Dousma, Theo van Hattum, Jos Huis in’t Veld, Annemieke Hol,
Renske Kwikkel, Guus Nijboer, and Henk Schilder carried out most of the practical field
work, Eef Lovink and Johan Ploegaert meticulously nourished all measurement instruments,
and Geert Kupers and Jean Slangen weighed hundreds and hundreds of dust filters, next to all
other lab analyses. The expression ‘Measuring is knowing’ sounds so simple, but you all know it
is far from that. Thanks guys!
An important ‘partner in crime’ during my first dust projects has been Julio Mosquera
Losada, who introduced me into efficient data processing, sophisticated Excel formulas (that
took ages to grasp ;-), and straightforward report writing. Thanks for your hard work and
collegiality. Your co-authorship of several chapters in this thesis is definitely not without reason.
Johan van Riel, we have spent many hours on statistical modelling which furthered my
knowledge on statistics and GenStat programming. Your expertise as both animal scientist and
mathematician has been very valuable and resulted in a co-authorship of chapter 4.
Since air pollution by particulate matter is an important issue in especially the poultry sector,
colleagues Hilko Ellen, Rick van Emous, and Jan van Harn introduced me into the world of
poultry farming. Aware of my passion for the mysterious homing pigeon, you successfully set
the trap and got me interested in this other feathered species too.
María Cambra-López, as former PhD student on the same subject, you and I worked
together in three settings which resulted in an equal number of scientific papers. Thanks for your
kindness and the warm connection with Valencia. Both you and Yang Zhao critically reviewed
my PhD plan and helped to shape my ideas for the Discussion chapter. Jorge Llorens Rubio,
the field work within your MSc thesis was an important contribution to chapter 8. I much
enjoyed it supervising your work. Jan Vonk, thanks to you, we could successfully include the
TEOM and beta-attenuation instruments of the RIVM institute in the study of chapter 8. Thanks
for sharing your expertise on measuring airborne particulate matter in ambient air.
I want to thank my family and friends for regularly showing interest into my PhD project and
for their mental support. From now on, there is no more need to refer to me as ‘doctorandus fine
dust’, demonstratively cough when I enter a room, or give me a pack of dust masks as Santa-
Claus surprise. The dust era is over ;-).
Dear Marjon, thanks for your ongoing love, support and encouragement in so many ways.
We did it.
Last but not least, my gratitude goes to God who has inspired me most to try and make this
scientific team work flourish.


About the author
Curriculum vitae
List of publications
Training and Supervision Plan

About the author
266
CURRICULUM VITAE
Albert Winkel was born on 12 March 1980 in Leeuwarden, the Netherlands. After graduating
from high school Gomarus College in Groningen in 1997, he started a Bachelor study in
Agriculture at the Van Hall Larenstein University of Applied Sciences in Leeuwarden
(specialization: animal health care and food chain management). In 2001, he completed his
graduation thesis on effects of light on the performance, physiology, and behavior of cows,
which received a mark 9 and was later issued as research report by Wageningen UR.
Subsequently, he moved to Wageningen to start an MSc study in Animal Sciences at
Wageningen University. He completed his curriculum with a major thesis at the Adaptation
Physiology Group and a minor thesis at the Cell Biology and Immunology Group. In both theses,
he studied whether antigen presenting immune cells of chickens can be skewed in vitro towards
specific immune responses by administering (probiotic) bacteria or bacterial compounds. After
his graduation, he found a first job as project officer at the former Ministry of Agriculture,
Nature and Food Quality. In 2008, he became researcher/project leader at the Livestock Research
institute of Wageningen UR. In the following years, he mainly worked on two extensive research
programs on the measurement of particulate matter emissions from livestock houses and the
development of abatement technologies. It is a selection of projects from these programs that
now form chapters two to eight of this doctoral thesis. Besides his work, he is passionate admirer
of the homing pigeon (Columba livia) and its puzzling ability to navigate to its home from
distant and unfamiliar release sites. Since 2001, he is a member of the scientific advisory
committee on animal welfare of the NPO, the Dutch association for about 20,000 pigeon
keepers. Since 2012, he frequently combines his work as researcher with that of lecturer at the
Van Hall Larenstein University of Applied Sciences and the Farm Technology Group of
Wageningen University. His main position to date, still is that of researcher/project leader at
Wageningen UR Livestock Research.

About the author
267
LIST OF PUBLICATIONS
Scientific articles in peer-reviewed journals
(in chronological order)
Cambra-López, M., Winkel, A., Van Harn, J., Ogink, N.W.M., Aarnink, A.J.A., 2009.
Ionization for reducing particulate matter emissions from poultry houses. Trans. ASABE
52:1757–1771.
Winkel, A., Cambra-López, M., Groot Koerkamp, P.W.G., Ogink, N.W.M., Aarnink, A.J.A.,
2014. Abatement of particulate matter emission from experimental broiler housings using an
optimized oil spraying method. Trans. ASABE 57:1853–1864.
Cambra-López, M., Winkel, A., Mosquera, J., Ogink, N.W.M., Aarnink, A.J.A., 2015.
Comparison between light scattering and gravimetric samplers for PM10 mass concentration
in poultry and pig houses. Atmos. Environ. 111:20–27.
Winkel, A., Mosquera, J., Groot Koerkamp, P.W.G., Ogink, N.W.M., Aarnink, A.J.A., 2015.
Emissions of particulate matter from animal houses in the Netherlands. Atmos. Environ.
111:202–212.
Winkel, A., Llorens Rubio, J., Huis in't Veld, J.W.H., Vonk, J., Ogink, N.W.M., 2015.
Equivalence testing of filter-based, beta-attenuation, TEOM, and light-scattering devices for
measurement of PM10 concentration in animal houses. J. Aerosol Sci. 80:11–26.
Winkel, A., Mosquera, J., Aarnink, A.J.A., Groot Koerkamp, P.W.G., Ogink, N.W.M., 2015.
Evaluation of a dry filter and an electrostatic precipitator for exhaust air cleaning at
commercial non-cage laying hen houses. Biosyst. Eng. 129:212–225.
Winkel, A., Mosquera, J., Aarnink, A.J.A., Groot Koerkamp, P.W.G., Ogink, N.W.M., 2016.
Evaluation of oil spraying systems and air ionisation systems for abatement of particulate
matter emission in commercial poultry houses. Biosyst. Eng. 150:104–122.
Winkel, A., Van Riel, J.W., Van Emous, R.A., Aarnink, A.J.A., Groot Koerkamp, P.W.G.,
Ogink, N.W.M., 2016. Abatement of particulate matter emission from experimental aviary
housings for laying hens by spraying rapeseed oil. Poult. Sci., in press.
Winkel, A., Mosquera, J., Aarnink, A.J.A., Groot Koerkamp, P.W.G., Ogink, N.W.M., 2016.
Evaluation of manure drying tunnels to serve as dust filters in the exhaust of laying hen
houses: emissions of particulate matter, ammonia, and odour. Manuscript submitted to:
Biosystems Engineering.

About the author
268
Articles and abstracts presented at conferences
(in chronological order)
Aarnink, A.J.A., Harn, J. van, Winkel, A., de Buisonjé, F.E., van Hattum, T.G., Ogink, N.W.M.,
2009. Dust reduction in poultry houses by spraying rapeseed oil. In: Joint International
Agricultural Conference (JIAC 2009), July 6–8, 2009, Wageningen Academic Publishers,
Wageningen, the Netherlands, pp. 73–79.
Aarnink, A.J.A., Mosquera, J., Winkel, A., Cambra-López, M., van Harn, J., de Buisonjé, F.E.,
Ogink, N.W.M., 2009. Options for dust reduction from poultry houses. In: CIGR International
Symposium on 'Agricultural Technologies in a Changing Climate', September 13–16, 2009,
International Commission of Agricultural and Biosystems Engineering (CIGR), Brisbane,
Australia.
Ogink, N.W.M., Aarnink, A.J.A., Mosquera, J., Winkel, A., 2010. Development and testing of
technical measures for the abatement of PM10 emissions from poultry housings. In: XVIIth
World Congress of the International Commission of Agricultural and Biosystems Engineering
(CIGR), June 13–17, 2010, Canadian Society for Bioengineering (CSBE/SCGAB), Québec
City, Canada.
Ellen, H.H., Aarnink, A.J.A., Mosquera Losada, J., Winkel, A., Cambra-Lopez, M., van Harn,
J., Ogink, N.W.M., 2010. Dust reduction options for poultry houses. In: XIIIth European
Poultry Conference, August 23–27, 2010, French Branch of the World's Poultry Science
Association (WPSA), Tours, France, pp. 282-282.
Aarnink, A.J.A., Winkel, A., Mosquera Losada, J., Ogink, N.W.M., 2010. Emissions of aerial
pollutants from poultry houses. In: International Symposium on Air Quality and Manure
Management for Agriculture, September 13–16, 2010, American Society of Agricultural and
Biological Engineers (ASABE), Dallas, Texas USA.
Winkel, A., Van Emous, R.A., van Hattum, T.G., Ogink, N.W.M., Aarnink, A.J.A., 2010. Dust
reduction from aviary housing for laying hens by ionization and oil spraying. In: International
Conference on Agricultural Engineering (AgEng 2010), September 6–8, 2010, European
Society of Agricultural Engineers (EurAgEng), Clermont-Ferrand, France.
Winkel, A., Mosquera Losada, J., Ogink, N.W.M., 2011. Removal efficiency of a dry filter for
abatement of particulate matter emissions from poultry houses. In: AAAR 30th Annual
Conference, October 3–7, 2011, American Association for Aerosol Research (AAAR),
Orlando, Florida, USA.

About the author
269
Winkel, A., Mosquera Losada, J., Ellen, H.H., Aarnink, A.J.A., Ogink, N.W.M., 2012. Dust
filtering properties and ammonia emission of on-farm drying systems for poultry manure. In:
International Symposium on Emissions of Gas and Dust from Livestock (EmiLi 2012), June
10–13, 2012, Saint-Malo, France.
Winkel, A., Mosquera, J., Ogink, N.W.M., 2012. Removal efficiency of a wire-to-plate . In:
Ninth International Livestock Environment Symposium (ILES IX), July 8–12, 2012,
American Society of Agricultural and Biological Engineers (ASABE), Valancia, Spain.
Cambra-Lopez, M., Winkel, A., Mosquera, J., Ogink, N.W.M., Aarnink, A.J.A., 2012.
Comparison between light scattering and gravimetric devices for sampling PM10 mass
concentration in livestock houses. In: Ninth International Livestock Environment Symposium
(ILES IX), July 8–12, 2012, American Society of Agricultural and Biological Engineers
(ASABE), Valancia, Spain.
Winkel, A., Vermeij, I., Ellen, H.H., 2014. Testing of various techniques for dust reduction in an
experimental pig house. In: International Conference of Agricultural Engineering (AgEng),
Zurich, July 6–10, 2014, European Society of Agricultural Engineers (EurAgEng), Zurich,
Switzerland.
Research reports
(listed per year and alphabetic order of the authors)
2003
Biewenga, G., Winkel, A., 2003. Licht nader belicht: effecten van licht op dierprestaties en
gedrag van melkvee [Shedding more light on light: the effects of light on the performance and
behaviour of dairy cows; in Dutch, with English summary]. Praktijkrapport Rundvee 34,
Animal Sciences Group, Wageningen UR, Lelystad, the Netherlands.
2009
Cambra-López, M., Winkel, A., van Harn, J., Hannink, N., Aarnink, A.J.A., 2009. Measures to
reduce fine dust emission from poultry houses: reduction from broiler houses by ionization.
Report 215, Animal Sciences Group, Wageningen UR, Lelystad, the Netherlands.
Mosquera, J., van Emous, R.A., Winkel, A., Dousma, F., Lovink, E., Ogink, N.W.M., Aarnink,
A.J.A., 2009. Fijnstofemissie uit stallen: (groot)ouderdieren van vleeskuikens [Dust emission

About the author
270
from animal houses: broiler breeders; in Dutch, with English summary]. Report 276,
Wageningen UR Livestock Research, Lelystad, the Netherlands.
Mosquera, J., Winkel, A., Dousma, F., Lovink, E., Ogink, N.W.M., Aarnink, A.J.A., 2009.
Fijnstofemissie uit stallen: leghennen in scharrelhuisvesting [Dust emission from animal
houses: layer hens in floor housing; in Dutch, with English summary]. Report 279,
Wageningen UR Livestock Research, Lelystad, the Netherlands.
Mosquera, J., Winkel, A., Kwikkel, R.K., Gerrits, F.A., Ogink, N.W.M., Aarnink, A.J.A., 2009.
Fijnstofemissie uit stallen: vleeskalkoenen [Dust emission from animal houses: turkeys; in
Dutch, with English summary]. Report 277, Wageningen UR Livestock Research, Lelystad,
the Netherlands.
Ogink, N.W.M., van Hattum, T.G., Winkel, A., 2009. Maatregelen ter vermindering van
fijnstofemissie uit de pluimveehouderij: indicatieve evaluatie van het droogfiltersysteem
StuffNix van Big Dutchman [Measures to reduce fine dust emission from poultry facilities:
indicative evaluation of the Stuffnix system of Big Dutchman; in Dutch, with English
summary]. Report 203, Animal Sciences Group, Wageningen UR, Lelystad, the Netherlands.
Van Emous, R.A., Winkel, A., Ogink, N.W.M., 2009. Maatregelen ter vermindering van
fijnstofemissie uit de pluimveehouderij: indicatieve evaluatie van het scharrelsysteem met
gescheiden strooiselruimte [Measures to reduce fine dust emission from poultry houses:
indicative evaluation of the housing system with separated floor bedding; in Dutch, with
English summary]. Report 298, Animal Sciences Group, Wageningen UR, Lelystad, the
Netherlands.
Winkel, A., Aarnink, A.J.A., 2009. Blootstelling aan fijnstof in de biologische varkenshouderij
[Exposure to fine dust in organic pig farming; in Dutch, with English summary]. Report 284,
Wageningen UR Livestock Research, Lelystad, the Netherlands.
Winkel, A., Cambra-López, M., van Harn, J., van Hattum, T.G., Aarnink, A.J.A., 2009.
Maatregelen ter vermindering van fijnstofemissie uit de pluimveehouderij: optimalisatie van
een oliefilmsysteem bij vleeskuikens [Measures to reduce fine dust emission from poultry:
optimization of an oil spraying system for broilers; in Dutch, with English summary]. Report
204, Animal Sciences Group, Wageningen UR, Lelystad, the Netherlands.
Winkel, A., Mosquera, J., Hol, J.M.G., Nijeboer, G.M., Ogink, N.W.M., Aarnink, A.J.A., 2009.
Fijnstofemissie uit stallen: leghennen in volièrehuisvesting [Dust emission from animal
houses: layer hens in aviary systems; in Dutch, with English summary]. Report 278,
Wageningen UR Livestock Research, Lelystad, the Netherlands.

About the author
271
Winkel, A., Mosquera, J., Kwikkel, R.K., Gerrits, F.A., Ogink, N.W.M., Aarnink, A.J.A., 2009.
Fijnstofemissie uit stallen: vleeskuikens [Dust emission from animal houses: broilers; in
Dutch, with English summary]. Report 275, Wageningen UR Livestock Research, Lelystad,
the Netherlands.
Winkel, A., van Emous, R.A., Kwikkel, R.K., Ogink, N.W.M., Aarnink, A.J.A., 2009.
Maatregelen ter vermindering van fijnstofemissie uit de pluimveehouderij: ionisatie bij
leghennen in volièrehuisvesting [Measures to reduce fine dust emission from poultry houses:
ionization in aviary housing for layers; in Dutch, with English summary]. Report
285,Wageningen UR Livestock Research, Lelystad, the Netherlands.
Winkel, A., van Hattum, T.G., Aarnink, A.J.A., 2009. Maatregelen ter vermindering van
fijnstofemissie uit de pluimveehouderij: ontwikkeling van een oliefilmsysteem voor
leghennen in volièrehuisvesting [Measures to reduce fine dust emission from poultry houses:
development of an oil spraying system for layers in aviary housing; in Dutch, with English
summary]. Report 286, Wageningen UR Livestock Research, Lelystad, the Netherlands.
2010
De Vries, J.W., Radersma, S., Winkel, A., de Buisonjé, F.E., 2010. Verkenning van
milieuemissies en verbruiken van schaarse hulpbronnen in de sectoren: konijnen,
vleeskalveren, eenden en kalkoenen [Exploring environmental emissions and depletion of
resources of rabbit, veal calf, duck, and turkey production chains in the Netherlands; in Dutch,
with English summary]. Report 383, Wageningen UR Livestock Research, Lelystad, the
Netherlands.
Mosquera, J., Hol, J.M.G., Winkel, A., Huis, in’t Veld, J.W.H., Gerrits, F.A., Ogink, N.W.M.,
Aarnink, A.J.A., 2010. Fijnstofemissie uit stallen: melkvee [Dust emission from animal
houses: dairy cattle; in Dutch, with English summary]. Report 296, Wageningen UR
Livestock Research, Lelystad, the Netherlands.
Mosquera, J., Hol, J.M.G., Winkel, A., Lovink, E., Ogink, N.W.M., Aarnink, A.J.A., 2010.
Fijnstofemissie uit stallen: vleesvarkens [Dust emission from animal houses: growing and
finishing pigs; in Dutch, with English summary]. Report 292, Wageningen UR Livestock
Research, Lelystad, the Netherlands.
Mosquera, J., Hol, J.M.G., Winkel, A., Nijeboer, G.M., Ogink, N.W.M., Aarnink, A.J.A., 2010.
Fijnstofemissie uit stallen: dragende zeugen [Dust emission from animal houses: pregnant

About the author
272
sows; in Dutch, with English summary]. Report 294, Wageningen UR Livestock Research,
Lelystad, the Netherlands.
Van Emous, R.A., Ogink, N.W.M., Winkel, A., 2010. Maatregelen ter vermindering van
fijnstofemissie uit de pluimveehouderij: gescheiden bedekte strooiselruimten bij legkippen
[Measures to reduce fine dust emission from poultry houses: separated covered floor bedding
for laying hens; in Dutch, with English summary]. Report 299, Wageningen UR Livestock
Research, Lelystad, the Netherlands.
Winkel, A., Blanken, K., Bokma, S., 2010. Beoordeling van de FSC 2000 als vervanger van de
Leroux-meter voor het bepalen van de stroefheid van betonnen stalvloeren [Evaluation of the
FSC 2000 as substitute for the Leroux apparatus for determination of skid resistance of
concrete floors of animal houses; in Dutch, with English summary]. Report 315, Wageningen
UR Livestock Research, Lelystad, the Netherlands.
Winkel, A., Hol, J.M.G., Ogink, N.W.M., 2010. Maatregelen ter vermindering van
fijnstofemissie uit de pluimveehouderij: indicatieve evaluatie van biofiltratie als potentiële
fijnstofreductietechniek [Measures to reduce fine dust emission from poultry: indicative
evaluation of biofiltration as potential fine dust reduction technique; in Dutch, with English
summary]. Report 313, Wageningen UR Livestock Research, Lelystad, the Netherlands.
Winkel, A., Mosquera, J., Hol, J.M.G., van Hattum, T.G., Lovink, E., Ogink, N.W.M., Aarnink,
A.J.A., 2010. Fijnstofemissie uit stallen: biggen [Dust emission from animal houses: piglets;
in Dutch, with English summary]. Report 293, Wageningen UR Livestock Research,
Lelystad, the Netherlands.
Winkel, A., Ogink, N.W.M., 2010. Maatregelen ter vermindering van fijnstofemissie uit de
pluimveehouderij: indicatieve evaluatie van positieve ionisatie van uitgaande ventilatielucht
[Measures to reduce fine dust emission from poultry: indicative evaluation of positive
ionization of exhaust air; in Dutch, with English summary]. Report 314, Wageningen UR
Livestock Research, Lelystad, the Netherlands.
2011
Ellen, H., Vermeij, I., Winkel, A., van Emous, R., 2011. BBT fijn stof: beschrijving systemen en
kosten [Best available techniques for particulate matter: description of systems and costs; in
Dutch]. Report 476, Wageningen UR Livestock Research, Lelystad, the Netherlands.
Mosquera, J., Hol, J.M.G., Melse, R.W., Winkel, A., Nijeboer, G.M., Ploegaert, J.P.M., Ogink,
N.W.M., Aarnink, A.J.A., 2011. Fijnstofemissie uit stallen: luchtwassers [Dust emission from

About the author
273
animal houses: air scrubbing techniques; in Dutch, with English summary]. Report 295,
Wageningen UR Livestock Research, Lelystad, the Netherlands.
Mosquera, J., Hol, J.M.G., Winkel, A., Huis in 't Veld, J.W.H., Dousma, F., Ogink, N.W.M.,
Groenestein, C.M., 2011. Fijnstofemissie uit stallen: nertsen [Dust emission from animal
houses: minks; in Dutch, with English summary]. Report 340, Wageningen UR Livestock
Research, Lelystad, the Netherlands.
Van Emous, R.A., Winkel, A., Ellen, H.H., Ogink, N.W.M., 2011. Maatregelen ter vermindering
van fijnstofemissie uit de pluimveehouderij: ontwerp van stallen met integratie van
fijnstofarme technieken en nieuwe inrichtingsconcepten [Measures to reduce fine dust
emission from poultry facilities: design of poultry houses with integration of fine dust
measurements and new layout concepts; in Dutch, with English summary]. Report 444,
Wageningen UR Livestock Research, Lelystad, the Netherlands.
Van Emous, R.A., Winkel, A., Ogink, N.W.M., 2011. Maatregelen ter vermindering van
fijnstofemissie uit de pluimveehouderij: indicatieve evaluatie van een recirculatiesysteem met
ionisatiefilter [Measures to reduce fine dust emission from poultry facilities: indicative
evaluation of a recirculation system with ionization filter; in Dutch, with English summary].
Report 504, Wageningen UR Livestock Research, Lelystad, the Netherlands.
Winkel, A., 2011. Lichtbehoeften van koe en melkveehouder [Lighting needs of cow and dairy
farmer; in Dutch]. In: Adviesdocument voor agrariërs en overheid: optimale verlichting van
melkveestallen (bijlage 2), LTO Noord, Drachten, the Netherlands, p. 23–26.
Winkel, A., Mosquera, J., Ellen, H.H., Van Emous, R.A., Hol, J.M.G., Nijeboer, G.M., Ogink,
N.W.M., Aarnink, A.J.A., 2011. Fijnstofemissie uit stallen: leghennen in stallen met een
droogtunnel [Dust emission from animal houses: laying hens in houses with a tunnel drying
system; in Dutch, with English summary]. Report 280, Wageningen UR Livestock Research,
Lelystad, the Netherlands.
Winkel, A., Mosquera, J., Huis in't Veld, J.W.H., Nijeboer, G.M., Ogink, N.W.M., 2011.
Maatregelen ter vermindering van fijnstofemissie uit de pluimveehouderij: validatie van een
droogfilterwand op leghennenbedrijven [Measures to reduce fine dust emission from poultry
houses: validation of a dry filter wall on layer farms; in Dutch, with English summary].
Report 394, Wageningen UR Livestock Research, Lelystad, the Netherlands.
Winkel, A., Mosquera, J., Huis in't Veld, J.W.H., Ogink, N.W.M., Aarnink, A.J.A., 2011.
Maatregelen ter vermindering van fijnstofemissie uit de pluimveehouderij: validatie van een
ionisatiesysteem op vleeskuikenbedrijven [Measures to reduce fine dust emission from

About the author
274
poultry: validation of an ionization system on broiler farms; in Dutch, with English summary].
Report 462, Wageningen UR Livestock Research, Lelystad, the Netherlands.
Winkel, A., Mosquera, J., van Harn, J., Nijeboer, G.M., Ogink, N.W.M., Aarnink, A.J.A., 2011.
Maatregelen ter vermindering van fijnstofemissie uit de pluimveehouderij: validatie van een
oliefilmsysteem op vleeskuikenbedrijven [Measures to reduce fine dust emission from poultry
houses: validation of an oil spraying system on broiler farms; in Dutch, with English
summary]. Report 392, Wageningen UR Livestock Research, Lelystad, the Netherlands.
Winkel, A., Smolders, M.M.A.H.H., Aarnink, A.J.A., Ogink, N.W.M., 2011. Plan van aanpak
voor ontwikkeling van fijnstofreductiemethoden in varkensstallen [Plan of action for
development of dust reduction principles inside pig houses; in Dutch, with English summary].
Report 395, Wageningen UR Livestock Research, Lelystad, the Netherlands.
2012
Van Dooren, H.J.C., Sleurink, D., Biewenga, G., Kasper, G.J., Winkel, A., Blanken, K.,
Wemmenhove, H., Meerburg, B.G., Sapounas, A., Overbeek, J., Elling, G., Sloff, J., Versluis,
H., 2012. Dakmagazine: meer licht, lucht en ruimte, voor minder [Roof magazine: more light,
air, and space, for less; in Dutch]. Report, AgriMedia, Wageningen, the Netherlands.
Van Oosterhout, F., Biewenga, G., Winkel, A., Ouweltjes, W., Meijer, J.H., 2012. Het effect van
lichtkleur en lichtduur op melkproductie en gedrag van melkvee [The effect of light colour
and photoperiod on milk production and behaviour of dairy cows; in Dutch]. Report, Leiden
University Medical Center and Wageningen UR Livestock Research, Lelystad, the
Netherlands.
Winkel, A., Belgers, J.D.M., Peters, B., Vermeij, I., Ellen, H.H., 2012. Ontwikkeling en
evaluatie van technieken ter verlaging van stofconcentraties in varkensstallen [Development
and evaluation of techniques to mitigate dust concentrations in pig houses; in Dutch, with
English summary]. Report 654, Wageningen UR Livestock Research, Lelystad, the
Netherlands.
Winkel, A., Mosquera, J., van Hattum, T.G., Huis in't Veld, J.W.H., Nijeboer, G.M., Ogink,
N.W.M., 2012. Maatregelen ter vermindering van fijnstofemissie uit de pluimveehouderij:
validatie van een ionisatiefilter op leghennenbedrijven [Measures to reduce fine dust emission
from poultry houses: validation of an ionisation filter on layer farms houses; in Dutch, with
English summary]. Report 440, Wageningen UR Livestock Research, Lelystad, the
Netherlands.

About the author
275
Winkel, A., van Emous, R.A., Mosquera Losada, J., Nijeboer, G.M., van Hattum, T.G., van Riel,
J.W., Aarnink, A.J.A., Ogink, N.W.M., 2012. Maatregelen ter vermindering van
fijnstofemissie uit de pluimveehouderij: optimalisatie aanbrengen oliefilm op strooisel bij
leghennen in volièrehuisvesting [Measures to reduce fine dust emission from poultry:
optimization of oil application on litter of aviary housing for layers houses; in Dutch, with
English summary]. Report 597, Wageningen UR Livestock Research, Lelystad, the
Netherlands.
2013
Mosquera, J., Groenestein, C.M., Timmerman, M., Aarnink, A.J.A., Winkel, A., Ploegaert,
J.P.M., Ogink, N.W.M., 2013. Deskstudie naar maatregelen ter vermindering van
broeikasgasemissies uit varkens- en pluimveestallen [Desk study on measures to reduce
greenhouse gas emissions from pig and poultry houses; in Dutch]. Report 750, Wageningen
UR Livestock Research, Lelystad, the Netherlands.
Winkel, A., Huis in't Veld, J.W.H., Nijeboer, G.M., Blanken, K., Schilder, H., van Hattum, T.G.,
Ogink, N.W.M., 2013. Maatregelen ter vermindering van fijnstofemissie uit de
pluimveehouderij: validatie van een oliefilmrobot op een leghennenbedrijf [Measures to
reduce fine dust emission from poultry: validation of an oil spraying robot on a layer farm; in
Dutch, with English summary]. Report 686, Wageningen UR Livestock Research, Lelystad,
the Netherlands.
Winkel, A., Nijeboer, G.M., Huis in't Veld, J.W.H., Ogink, N.W.M., 2013. Maatregelen ter
vermindering van fijnstofemissie uit de pluimveehouderij: validatie van een ionisatiesysteem
op leghennenbedrijven [Measures to reduce fine dust emission from poultry houses:
validation of an ionisation system on layer farms; in Dutch, with English summary]. Report
685, Wageningen UR Livestock Research, Lelystad, the Netherlands.
2014
Winkel, A., Blanken, K., Ellen, H.H., Ogink, N.W.M., 2014. Ammoniakvorming in
mestdroogsystemen op legpluimveebedrijven met mestbandbeluchting [Ammonia production
in manure drying systems at layer farms with manure belt aeration; in Dutch, with English
summary]. Report 730, Wageningen UR Livestock Research, Lelystad, the Netherlands.

About the author
276
Winkel, A., Demeyer, P., Feilberg, A., Jørgensen, M., Puterflam, J., Engel, P., 2014.
Measurement of particulate matter: recommendations for the VERA test protocol on air
cleaning technologies. Report 797 (produced under an ICT-AGRI project by: Wageningen
University and Research Centre, Aarhus University, Danish Pig Research Centre, Institute for
Agricultural and Fisheries Research (ILVO), the Technical Institute for Poultry Research
(ITAVI), and the VERA Secretariat), Wageningen UR Livestock Research, Wageningen, the
Netherlands.
Winkel, A., Ellen, H.H., Ogink, N.W.M., 2014. Mogelijkheden voor het vaststellen van emissies
van leghennenstallen met een nageschakeld mestdroogsysteem [Possibilities for determining
emissions of laying hen houses connected to a manure drying system; in Dutch, with English
summary]. Report 803, Wageningen UR Livestock Research, Lelystad, the Netherlands.
Winkel, A., Huis in't Veld, J.W.H., Nijeboer, G.M., Ogink, N.W.M., 2014. Maatregelen ter
vermindering van fijnstofemissie uit de pluimveehouderij: validatie van een oliefilmsysteem
op een leghennenbedrijf [Measures to reduce fine dust emission from poultry houses:
validation of an oil spraying system on a layer farm; in Dutch, with English summary]. Report
801, Wageningen UR Livestock Research, Lelystad, the Netherlands.
Winkel, A., Huis in't Veld, J.W.H., Nijeboer, G.M., Schilder, H., van Hattum, T.G., Ellen, H.H.,
Ogink, N.W.M., 2014. Emissies uit mestdroogsystemen op leghennenbedrijven bij
dagontmesting en versneld drogen [Emissions from manure drying systems on layer farms
using 24-h manure removal and rapid drying; in Dutch, with English summary]. Report 731,
Wageningen UR Livestock Research, Lelystad, the Netherlands.
Winkel, A., Wouters, I.M., Aarnink, A.J.A., Heederik, D.J.J., Ogink, N.W.M., 2014. Emissies
van endotoxinen uit de veehouderij: een literatuurstudie voor ontwikkeling van een
toetsingskader [Emissions of endotoxins from animal production: a literature survey for
development of an assessment framework; in Dutch, with English summary]. Report 773,
Institute for Risk Assessment Sciences, Utrecht University and Wageningen UR Livestock
Research, Wageningen, the Netherlands.
2015
Van Niekerk, T.G.C.M., Ellen, H.H., Winkel, A., 2015. Licht en verlichting in de
pluimveehouderij in relatie tot beschadigend pikgedrag [Light and lighting in the poultry
industry in relation to damaging pecking behaviour; in Dutch]. Report 992, Wageningen UR
Livestock Research, Wageningen, the Netherlands.

About the author
277
2016
Ogink, N.W.M., Erbrink, H. (editors), 2016. Emissies van endotoxinen uit de veehouderij:
emissiemetingen en verspreidingsmodellering [Emissions of endotoxins from animal
production: emission measurements and dispersion modelling; in Dutch, with English
summary]. Report 959, Institute for Risk Assessment Sciences (IRAS), Utrecht University
(authors: Wouters, I.M., Heederik, D.J.J.), Erbrink Stacks Consult (author: Erbrink, H.),
Wageningen UR Livestock Research (Ogink, N.W.M., Winkel, A.), Wageningen, the
Netherlands.
Winkel, A., Wouters, I.M. (editors), 2016. Additionele maatregelen ter vermindering van
emissies van bioaerosolen uit stallen: verkenning van opties, kosten en effecten op de
gezondheidslast van omwonenden. [Additional measures to reduce emissions of bioaerosols
from animal houses: exploration of options, costs, and effects on health of neighboring
residents; in Dutch]. Report 949, Institute for Risk Assessment Sciences (IRAS), Utrecht
University (authors: Wouters, I.M., Heederik, D.J.J.), Wageningen UR, Central Veterinary
Institute (author: Hagenaars, T.J.), Wageningen UR Livestock Research (Ogink, N.W.M.,
Vermeij, I., Winkel, A.), Wageningen, the Netherlands.
Articles in magazines aimed at a professional audience
(in chronological order)
Biewenga, G., Winkel, A., 2003. Melken van licht: belang van goed lichtregime op productie
'onderbelicht'. Veeteelt 20(4), februari-2 2003, p. 71.
Biewenga, G., Winkel, A., 2003. Betere verlichting geen sprong in het duister. PraktijkKompas
Rundvee 17(1), februari 2003, p. 4–5.
Biewenga, G., Winkel, A., 2005. Melkkoeien goed belicht? AgriConstruct 8(3), p. 6–7.
Biewenga, G., Winkel, A., 2008. Voldoende licht voor een productieve en weerbare koe.
Veehouder & Dierenarts 22(1), januari 2008, p. 21–22.
Winkel, A., Aarnink, A.J.A., 2009. Stofniveau biologische varkensstal onveilig hoog. V-focus,
december 2009, p. 34–36.
Winkel, A., Van Dooren, H.J.C., 2010. Innovatieve en goedkope daken voor melkveestallen. V-
focus, februari 2010, p. 20–21.
Winkel, A., 2010. Bescherm je longen tegen stof. BioKennisbericht Varkensvlees nr. 12, maart
2010, Wageningen UR, Communication Services, Wageningen, the Netherlands, 4 pp.

About the author
278
Van Harn, J., Aarnink, A.J.A., Winkel, A., 2010. Slim Plakwerk. De Pluimveehouderij 40(4),
maart 2010, p. 54–55.
Winkel, A., Bokma, S., 2011. Adviezen voor daglicht in varkensstallen. V-focus, juni 2011, p.
36–37.
Van Weeghel, H.J.E., Groot Koerkamp, P.W.G., Winkel, A., 2011. Stofbad van hennen doet stof
opwaaien. V-focus, oktober 2011, p. 44–45.
Winkel, A., Swinkels, G.L.A.M., Biewenga, G., Van Oosterhout, F., 2011. Mag het licht uit?
Koe en omgeving willen 's nachts duisternis. V-focus, december 2011, p. 24–25.
Winkel, A., 2012. Negative air ionisation strongly decrease fine dust. World Poultry 28, March
2012, p. 24–25.
Winkel, A., Ellen, H.H., Swinkels, G.L.A.M., 2014. Energiebesparende verlichting in de stal. V-
focus, februari 2014, p. 32–33.
Winkel, A., Ellen, H.H., Swinkels, G.L.A.M., 2014. Nieuwe waardering voor daglicht in de stal.
V-focus, april 2014, p. 36–37.

About the author
279
TRAINING AND SUPERVISION PLAN (TSP)
The basic package (0 credits)WIAS Introduction day ExemptionEthics and Philosophy in Life Sciences Exemption
Disciplinary Competences (8 credits)Course Introduction to GenStat, Biometris, Wageningen, the Netherlands 2010Course Measurement of aerial emissions, VVM, Amersfoort, the Netherlands 2010Course Measurement of nanoparticles, Ravebo, Brielle, the Netherlands 2011Course Introduction to aerosol mechanics I and II, AAAR, Orlando, USA 2014Member int. working group on 'Harmonization of the measurement of particulate matter in
animal houses', VERA, Copenhagen, Denmark2014
Writing of PhD research proposal 2014
Professional Competences (13 credits)Personal profile assessment, Discovery Insights, Wageningen, the Netherlands 2009Course Project management, P2 Managers, Lelystad, the Netherlands 2009Course Writing for academic publication, McPhee Consulting, Lelystad, the Netherlands 2012Course Expert in sales I and II, Kenneth Smith Training, Lelystad, the Netherlands 2012Talents and Topics training programme 2012, WIAS, Wageningen, the Netherlands 2012
Presentation skills (4 credits)EurAgEng, Clermont-Ferrand, France, September 6–8 (paper + oral presentation) 2010AAAR 30th Annual Conference, Orlando, USA, Oct. 3–7 (abstract + oral present.) 2011CIGR-EurAgEng, Valencia, Spain, July 8–12 (paper + oral presentation) 2012EmiLi 2012 conference, St. Malo, France, June 10–13 (paper + oral presentation) 2012EurAgEng, Zürich, Switzerland, June 6–10 (paper + oral presentation) 2014
Teaching competences (6 credits)Lectures course Livestock Technology (FTE-30306), Wageningen University ‘12–‘16Lectures course Quant. Anal. of Innov. Biosystems (FTE-34306), Wageningen University ‘14–‘16Lectures course Research Methods Biosyst. Eng. (FTE-25806), Wageningen University ‘14–‘16Supervising MSc student Jorge Llorens Rubio (12 months), Wageningen University ‘13–‘14
Total: 31 credits (one ECTS credit equals a study load of approximately 28 hours)

COLOPHON
FundingThe research described in this thesis was funded by:Ministry of Economic AffairsMinistry of Infrastructure and the EnvironmentProvince of GelderlandProvince of Noord-Brabant
Cover designFerdinand van Nispen tot Pannerden (www.citroenvlinder-dtp.nl)Petra Siebelink (Wageningen UR, Communication Services)Albert Winkel
LayoutAlbert Winkel
PrintingGVO drukkers & vormgevers, Ede, the Netherlands


Particulate matter emission from livestock houses:
measurement methods, emission levels and abatement systems
Albert Winkel
Particulate matter em
ission from livestock houses:
measurem
ent methods, em
ission levels and abatement system
s Albert W
inkel 2016
41988 Winkel, Albert Cover en uitn kaart.indd 1 12-09-16 21:06
Uitnodiging
Voor het bijwonen van de openbare verdediging van het proefschrift:
Particulate matter emission
from livestock houses: measurement methods,
emission levels and abatement systems
door
Albert Winkel
Op vrijdag 21 oktober 2016 om 11:00 uur
in de Aula van Wageningen
Universiteit, Generaal Foulkesweg 1a, Wageningen
met een receptie na afloop van de
ceremonie
Albert [email protected]
0317-480491
Paranimfen
Julio Mosquera [email protected]
0317-480386
Gelein [email protected]
058-2846185
41988 Winkel, Albert Cover en uitn kaart.indd 2 12-09-16 21:06