diagnostic study on small and medium forest enterprises in uganda

UGANDA LIVELIHOODS AND
ENTERPRISES FOR AGRICULTURAL DEVELOPMENT
(LEAD)
Mid Term Evaluation
Final Report
April 2011 This document was produced for review by the United States Agency for International Development (USAID/Uganda). It was prepared by i-TEC.

UGANDA LIVELIHOODS AND ENTERPRISES FOR AGRICULTURAL
DEVELOPMENT (LEAD)
Contract Number: EDH-I-09-05-00006-00
MID-TERM EVALUATION
Final Report
April 18th, 2011
Submitted by ITEC Plot 19, Ntinda View Cresent – Upper Naguru
P.O. Box 918, Kampala

Page i
TABLE OF CONTENTS
ACKNOWLEDGEMENTS ................................................................................................. ii
The i-TEC Evaluation Team ......................................................................................... ii
LIST OF ACRONYMS: ..................................................................................................... iii
EXECUTIVE SUMMARY .................................................................................................. v
1.0 INTRODUCTION ........................................................................................................ 1
a) Importance of Agriculture and Sector Performance ................................................. 1 b) LEAD Project Summary ........................................................................................... 2 i. USAID/LEAD Project Background and Objectives ................................................................. 2 ii. The LEAD Project Design and Implementation Mechanisms .................................................... 3 iii. Evaluation Purpose ........................................................................................................ 3 iv. Evaluation Scope of Work (SOW) ..................................................................................... 3
2.0 EVALUATION DESIGN AND METHODOLOGY ............................................... 5
a) Approach and Methodology for Addressing the Key Evaluation Questions .................................. 5 b) The Survey Design ........................................................................................................ 5 a) Data Analysis Used in Getting to the Answers ...................................................................... 7 b) Evaluation Data Management Plan .................................................................................... 7 c) Inherent Evaluation Data Limitation/Study Constraints ........................................................... 8
3.0 MIDTERM EVALUATION FINDINGS .................................................................... 9
a) Assessment of Progress Toward Achievement of Project Results ............................................. 9 b) The Contribution of Specific LEAD Interventions to its Planned Results ................................... 16 c) Performance of Intermediate Result 2: Increased Agricultural Productivity ................................ 16 d) Performance on Intermediate Result 3: Enhancing Competitiveness ....................................... 24 e) Performance of Intermediate Result 1: Improved Trade Capacity in Targeted Value Chains ......... 29 f) Comparison of LEAD and Non-LEAD Households .............................................................. 32 g) Cross-Cutting Issues .................................................................................................... 34
4.0 EFFECTIVENESS OF THE LEAD STRATEGIC ACTIVITY FUND (SAF) ... 40
5.0 COORDINATION WITH OTHER USG AND DONOR EFFORTS ................... 44
6.0 EFFECTIVENESS OF LEAD’S MANAGEMENT STRUCTURE AND STAFF COMPOSITION ................................................................................................................ 48
7.0 CHALLENGES FOR LEAD IMPLEMENTATION ......................................... 53
8.0 LESSONS LEARNED ............................................................................................ 55
9.0 CONCLUSIONS ........................................................................................................ 56
10. 0 RECOMMENDATIONS ........................................................................................ 59

Page ii
11.0 ANNEXES: ............................................................................................................... 62
Annex A: LEAD PMP/RF Mapping Based on Year Two Target ........................................ 62 Annex B: LEAD PMP/RF Mapping Based on LOP Targets .............................................. 67 Annex C: LEAD Stakeholder Analysis Matrix For Mapping Interests Versus Synergies .. 73 Annex D: List of Respondents .......................................................................................... 78 Annex E: Map of Uganda Showing MTE LEAD Districts .................................................. 83 Annex F: LEAD Midterm Evaluation Scope Of Work ....................................................... 84 References: ....................................................................................................................... 88
LIST OF TABLES Table 1: Overall LEAD Project Progress Toward Objectives .......................................................................................... 10
Table 2: Costs of Production, Gross Values and Gross Margins ..................................................................................... 18
Table 3: Perceptions by Agro-Input Dealers on Trends in Purchases, 2010 - Eastern and Northern Uganda ............................ 20
Table 4: Number of MTE Agro-Input Dealers reporting receiving training In North And Eastern Regions ................................... 23
Table 5: Challenges faced by POs .......................................................................................................................... 26
Table 6: Construction of Market Infrastructures .......................................................................................................... 31
Table 7: Services Accessed by Category of Beneficiary ............................................................................................... 36
Table 8:Post-Conflict Status Influenced LEADS Results ............................................................................................... 38
Table 9: Resources leveraged through Grantees ........................................................................................................ 41
Table 10: Assessment on LEAD Linkages with Other Development Initiatives ................................................................... 45
Table 11: Common Challenges .............................................................................................................................. 53

Page i
LIST OF FIGURES Figure 1: LEAD Result Framework-Performance Based on Year 2 Targets .................................................................... 14
Figure 2: LEAD Result Framework-Performance Based On Life of Project (LOP) Targets ..................................................... 15
Figure 3: Production Sequence .............................................................................................................................. 16
Figure 4: Comparison Of Yields In Kg/Acre From National Agriculture Census Data, LEAD Baseline And Midterm LEAD Evaluation Data ................................................................................................................................................................ 17
Figure 5: Various Training and Support Reported Received as per MTE Respondents ......................................................... 19
Figure 6: Number and % of MTE Respondents Reporting Use Of Agro Inputs, Pesticides, Insecticides And Fungicides ............... 19
Figure 7: Value of Exports in Selected Value Chains ................................................................................................... 29
Figure 8: Comparison of Income For LEAD And Non-Lead Farmers (Control) .................................................................... 33
Figure 9: Yield Comparisons between LEAD and Non-LEAD Farmers ............................................................................. 34
Figure 10: Female Percentage of Total PO Members per Value Chain ............................................................................. 36
Figure 11: Amount of Private Sector Resources Leveraged ........................................................................................... 40
Figure 12: LEAD MANAGEMENT STRUCTURE ........................................................................................................ 52
LIST OF BOXES
Box 1: Perceived Effects of FFS training on promoting farming as business ...................................................................... 11
Box 2: Extension Services by LEAD and Some Benefits To Farmers ............................................................................... 21
Box 3 : EXAMPLES OF BULK PURCHASES OF AGRO INPUTS MADE BY PRODUCER ORGANIZATION ............................. 23
Box 4: Case Study-Bugaya Area Cooperative Enterprise .............................................................................................. 28
Box 5: SAF Support toward Trade Competitiveness .................................................................................................... 42

Page ii
ACKNOWLEDGEMENTS
i-TEC team would like to express its deep appreciation for the guidance and accessibility provided by the USAID/Uganda Mission, to various relevant stakeholders who were involved in LEAD project implementation. These included but were not limited to the government departments, Implementing Partners, Strategic Activities Fund (SAF) grantees, Producer Organizations (POs) and LEAD senior project management and staff.
Specifically, our special thanks go to USAID/Uganda Mission Director, Mr. Dave Eckerson; the LEAD Activity Managers (Ms. Gaudensia Kenyangi & Mr. Brian Conklin); and Ms Jackie Wakhweya, who provided us with technical feedback right from the design stage, the review of our evaluation instruments, and responses to some of our evaluation questions as key informers, to providing comments and observations on the report debrief as well as the draft report.
Special thanks also go to LEAD staff both at Headquarters and in the field, without whose unwavering support, it would not have been possible to conduct and complete this evaluation exercise successfully. They were also instrumental in providing the program overview, reviewing and harmonisation of the program’s secondary data, and in following up with the logistics required in locating the farmers included in this evaluation field exercise.
Our sincere thanks also go to all the stakeholders listed in Annex D, led by Farmer Field School facilitators in the fourteen districts covered during this evaluation exercise for their valuable time and support. Many thanks also go to the Producer Organizations, SAF grantees and farmers who participated in the consultations.
The i-TEC Evaluation Team
USAID/UGANDA commissioned i-TEC (i-Train & Evaluate Center), a recognized Performance-based Evaluation Consulting Firm in East & Southern Africa (ESA) Region, based in Kampala, Uganda to design and conduct the external Midterm Evaluation (MTE) of the LEAD project (July 2008 – July 2013). A multidisciplinary team comprising of experienced Evaluators drawn from Malawi and Uganda conducted the evaluation, with overall coordination and technical guidance provided by Dr. Rosern Rwampororo, i-TEC’s President, together with Mr. Polly Mugisha, i-TEC Director. Mr. Murphy Kajumi, from Malawi, a Senior Associate with i-TEC was the overall Team Leader for the entire evaluation exercise.
The rest of the team members were from Uganda and included the following: 1) Mr. Allen Kebba, a Senior Associate with i-TEC, who doubled as both the Alternate overall Team Leader and Team Leader for the Northern Region; 2) Mr. Jonathan Katarikawe; and 3) Mrs. Agnes Kayondo, also i-TEC Associates, as Team Leaders for Western and Eastern Uganda Regions respectively. The Team was supported by a group of 9 experienced Research Assistants, drawn from various Universities and other local consulting firms in Uganda. However, i-TEC takes full responsibility of the final product.

Page iii
LIST OF ACRONYMS: ACDI/VOCA Agricultural Cooperative Development International/Volunteers in
Overseas Cooperative Assistance ACP, Africa, Caribbean Pact ACPCU Ankole Coffee Producers Cooperative Union AESA Agro Environment System Analysis AGOA Africa Growth and Opportunity Act AU African Union BDS Business Development Services CCI Cross-Cutting Issues COMESA, Common Market for East and South Africa DANIDA Danish Development Agency DAP Di Ammonium Phosphate DCA Development Credit Agency DRC Democratic Republic of Congo DSIP Development Strategy and Investment Plan EAC, East African Community FFS Farmer Field School FGD Focus Group Discussion FO Field Officer FY Financial Years GDP Gross Domestic Product GoU Government of Uganda HIV Human Immunodeficiency Virus/Acquired Immune Deficiency Syndrome IDP Internally Displaced People IFPRI International Food Policy Research Institute IGAD, Inter-Governmental Authority on Development IITA International Institute for Tropical Agriculture IPM Integrated Pest Management IR Intermediate Result i-TEC I Train and Evaluate Center KCL Kilo Calories LEAD Livelihoods and Enterprises for Agricultural Development LOP Life Of Program M&E Monitoring and Evaluation MAAIF Ministry of Agriculture, Animal Industries and Fisheries MDG Millennium Development Goals MLI Market Linkages Initiative MoFPED Ministry of Finance, Planning and Economic Development MTE Mid Term Evaluation NAADS National Agricultural Advisory Services NDP National Development Plan NES National Export Strategy NUSAF Northern Uganda Social Action Fund OVC Orphans and Vulnerable Children PEAP Poverty Eradication Action Plan PHH Post-Harvest Handling PLWA People Living With Aids

Page iv
PO Producer Organization PPP Public-Private Partnerships SACCO Savings and Credit Cooperative Organizations SAF Strategic Activities Fund SME Small and Medium scale Enterprises SON Source of the Nile SOW Scope of Work Sub IR Sub Intermediate Result Sub PIR Sub Program Intermediate Result TOP Technology Observation Plots/Ponds UBOS Uganda Bureau of Standards UGACOF Uganda Coffee UGX Uganda Shillings UN United Nations USAID United States Agency for International Development USG United States Government VC Value Chain VSLA Village Savings and Loan Associations WENIPS West Nile Private Sector Investment Promotion Center Limited WTO World Trade Organization

Page v
EXECUTIVE SUMMARY
This report provides the findings from the midterm evaluation (MTE) of the Uganda Livelihoods and Enterprises for Agricultural Development (LEAD) project, which was conducted between January and February 2011. The midterm evaluation was commissioned by USAID/Uganda Mission and was aimed at documenting evidence on progress made thus far not only toward LEAD project objectives, but also to assess the effectiveness of strategies used in its implementation, the likelihood of attaining project results by the end of the project, and lessons learned. The MTE was guided by five key evaluation questions outlined in the scope of work (SOW), detailed in Annex F.
The report is organized into 11 sections. Section 1 is the introduction that summarizes the importance of the agricultural sector in Uganda and provides the project background, objectives, and its relevance in contributing to addressing the development problems associated with the agricultural sector. In addition, this section outlines the purpose of the evaluation and a summary of the SOW. Section 2 summarizes the approach and methods used in generating the answers to the evaluation questions. Section 3 is a presentation of findings, covering progress toward project objectives and presents an assessment of the role of cross-cutting issues in shaping design and achievement of LEAD objectives. Section 4 assesses the effectiveness of the Strategic Activities Fund (SAF). Section 5 reviews the extent to which the LEAD project was able to coordinate with other USG-funded projects and other donors and build synergies with other initiatives supporting the strengthening of the agricultural sector in Uganda. Section 6 presents an assessment of the effectiveness of the LEAD project management structure in contributing to the achievement of project objectives. Section 7 highlights challenges faced during the course of implementation, while Section 8 is a presentation of lessons learned. Section 9 and 10 cover the conclusions and recommendations respectively based on the MTE findings by the evaluation team. Annexes that provide more detail to various components of this report have been attached.
The Survey Design and Methodology
To arrive at the answers to the evaluation questions, i-TEC’s Team used a mixed methods approach that entailed both quantitative and qualitative data collection techniques. In order to collect relevant information and ensure that the evaluation findings fully responded to the purpose of the evaluation, the Team also used triangulation of data generated from the various methods. The latter included the following: i) Document reviews; ii) Key informant interviews; iii) Focus group discussions (FGDs); iv) Surveys of beneficiaries/implementers such as LEAD staff. Gender & Youth components were integrated within the Survey Questionnaires; v) Stakeholder Analysis; and vi) Observations at service delivery and technology sites. For the household surveys, the Team used a three-stage sampling procedure to select a sample of 489 households (comprising of 391 LEAD-supported and 98 Non-LEAD) from a purposeful selected sample of 14 out of the 35 districts where LEAD is operating.
Findings
Progress toward Achievement of Project Objectives
The evaluation team found substantive evidence of progress in almost all the key result areas of the LEAD project. Based on the project’s data regarding progress toward achievement of the project intermediate result (IR) targets, the MTE findings indicate that the IR on increasing agricultural productivity has made the most progress, while the one related to increased trade capacity has lagged behind. The team established that out of the three intermediate results, IR 1 on increased trade capacity is unlikely to be achieved by July 2013, the Life of Project (LOP), if the efforts being applied on the stated market infrastructure development interventions remain at the current levels.

Page vi
Regarding achievement of results, the critical issues of quality, traction with regard to the achieved results, as well as connectedness with the other initiatives funded by the USG, were receiving increasing attention from the USAID Mission. These issues were also widely acknowledged by other project stakeholders during the midterm evaluation and were critical, especially due to the fact that the LEAD project design aims to contribute to a system-wide impact in the modernization of the agricultural sector in Uganda.
The Role of Cross-Cutting Issues in the Project
The evaluation found that cross-cutting issues shaped both the design and extent of achievement of LEAD results. The design actively integrated cross-cutting issues such as gender, conflict, youth, orphans and other vulnerable children (OVC) into the project. The quick return to stability in Northern Uganda, although an external factor, positively impacted the project in terms of the need to increase the pace of implementation as more and more people returning from camps were mobilized into joining Producer Organizations (POs). In view of the high presence of OVC in the North due to the war, the design and implementation of interventions for the LEAD OVC component was deliberately intentioned to address their needs. However, the provision of free inputs (seed and ox ploughs) to OVC households has generated an unintended effect of dependency. LEAD OVC beneficiaries now expect LEAD to provide additional assistance in the form of free inputs. In addition, where OVC sub-POs are created within existing POs, there is some tension due to what is seen as preferential treatment by members who do not receive free inputs.
The Effectiveness of the Strategic Activities Fund (SAF)
The MTE findings indicate that the SAF component has been effective in leveraging private sector resources to reach more farmers and business entities with a view of strengthening the targeted value chains (VCs). For every $1 committed by LEAD, $1.50 in private sector resources was leveraged. In order of their ranking from highest to lowest in US $ millions, the amount of private sector resources leveraged were highest for cereals, pulses, root and oil crops (about $5.026), coffee ($3.388), aquaculture ($1.585), and finance ($1.174). The SAF was also effective in facilitating various services across and within the value chains, including support for dialogue sessions, skills and equipment to improve business capacity and competitiveness. Finally, the evaluation team’s opinion of the SAF governance procedures is that they are well within the approved LEAD framework and, in the team‘s assessment, represent a fair framework for SAF management and implementation.. Coordination with Other USG-funded and Other Donor Projects
There has been a fair attempt by the project to coordinate with other USG-funded projects, in particular those operating in the North of the country. These include monthly coordination meetings held with these partners where they have focused on information sharing. Coordination was observed to be weakest with government agencies, especially at the local level. To the extent that the LEAD project was doing almost similar activities with some of the USG-funded projects in some value chains, views from other USG-funded projects were that the project should try to focus strategically since it is doing almost everything.
Appropriateness of the Management Structure
The MTE found that the LEAD project management structure was appropriate and relevant. The functional units within the management structure directly provided the necessary expertise required to achieve the intermediate results of the project as well as the competencies for addressing the inherent Value Chain approach underlying the project strategy. For instance, the MTE found that the structure had been dynamic in responding to emerging needs, ensuring that achievement of results was not adversely affected by contextual conditions such as weaknesses in the SMEs to deliver essential services. In addition, functional subsystems (such as those relating to monitoring evaluation and grant management) were found to have been established

Page vii
and were operational. However, in some respects data quality issues (such as the achievements reported under POs) needed to be addressed which according to the MTE findings indicate contributions by other agencies that are counted as part of overall LEAD achievements. Further, while the PMP specifies gender disaggregation of some indicators, the progress reports reviewed by the MTE team only had aggregate figures.
Key Lessons Learned
There were a number of lessons learned as detailed under Section 8, which can inform future designs with similar operations. Below is a summary of some key lessons: 1. The Producer Organization approach and the Farmer Field School (FFS) methodology have both been and
still are instrumental in enhancing stakeholder interventions by reaching households through groups that facilitated joint learning directly from each other;
2. The LEAD activities directed at the strengthening and development of POs through the approach of addressing gaps and bringing various actors along the value chain together has demonstrated immense potential for creating a sustainable environment toward reaching the program goal and objective;
3. Planned implementation of all targeted interventions does not always translate into expected aggregate results achievement, as evidenced under LEAD Intermediate Result (IR) 1 on increased trade capacity and sub-IR 1.3 on increasing investments in market infrastructure. Identifying strategic gaps along the value chain with the most potential for impact presents a better opportunity for achieving the desired results rather than trying to address all the gaps along the value chain;
4. Addressing bulk marketing does not always imply the need for sophisticated storage infrastructure as long as quality is ensured and aggregation of produce at collection centers on pre-determined days can serve a similar purpose, especially in the short term. This is the concept used by some of the POs consulted; however, as volumes increase, storage infrastructure will definitely become critical;
5. Having a USAID/LEAD principle to facilitate increased self-sustenance is commendable and should be strongly promoted. However, the key lesson established is that targeted provision of subsidies for inputs to be used for demonstration in the short to medium term has greater potential for building capacity toward self-sustainability. Where they have been applied in the short-term, they generated a more positive response from farmers and POs;
6. Grantees with produce buying interventions that pay cash on delivery for produce tend to attract more POs into the marketing system. Consequently, as long as arrangements are such that farmers wait for a long time before they can get payment, POs may see no value in adhering to frameworks that do not provide them with cash within a relatively short period of time (i.e. on delivery or within a week);
7. Limited interaction with central and local governments by LEAD Project management at all levels means that LEAD interventions will not be sustainable after the Life of Project (LOP). Leaving district, field, and grantee staff to determine the nature of interaction with local governments (LGs) is a manifestation of inconsistent implementation and management approaches. The key lesson is that LGs are critical to future sustainability of LEAD interventions.
Major Conclusions:
a) Effectiveness of Interventions in Contributing to Achievement of LEAD’s Planned Results.
1. The LEAD approach of targeting households through POs as the vehicle to transfer knowledge and skills (building on the APEP PO achievements) has without a doubt led to increased awareness and understanding of improved technologies and practices by PO households. The numbers of POs targeted were significant, although there were sustainability issues with regard to the age at which they should be weaned off assistance to stand on their own.

Page viii
2. The FFS concept has been unanimously endorsed by farmers interviewed as an effective and practical way of transferring knowledge and technology.
3. There has been wide adoption of low-cost/non-monetized (farmers do not cost or pay for their own labor) management practices such as row planting, timely planting and spacing for all crops, use of improved seeds for maize, groundnuts and rice and coffee seedlings as well as fish fry for aquaculture. Conversely, there is limited adoption of high-cost technologies like fertilizers, pesticides, insecticides and herbicides as well as adoption of post-harvest handling (PHH) practices due to lack of resources.
4. Yields per unit area have increased but are still lower than expected due to limited input usage and selective adoption of the spectrum of management practices in all value chains resulting in low totality of input use or management practices. This is because of various factors that include partial use of improved seed, limited ability to purchase the total requirement of seeds and fertilizers, climate change problems, weeds, disease and pest management.
5. The MTE Team assessment is that LEAD interventions have contributed to the achievement of planned results; however, there is a disclaimer. The performance has been largely quantitative in nature with an emphasis on achievement of numbers rather than quality. Furthermore, some of the good performance is being eroded by failure to achieve some activities, which have not been implemented such as the construction of market infrastructures on a wide scale.
b) The Role of Cross-Cutting Issues Especially Gender, Conflict, Youth Including OVC Have Played in Shaping LEAD Interventions and Influencing Achievement of LEAD Results. 1. Cross-cutting issues have definitely played a role in shaping LEAD interventions and have influenced
achievement of LEAD results in different ways. For example, LEAD data indicates that gender issues have been optimally mainstreamed into the design of the intervention and implementation with specific affirmative action activities to influence the female time poverty (reduction of time spent by women on efforts that entail drudgery efforts ) reported by some SAF grantees such as Victoria Seeds. The inclusion in the LEAD design of an OVC component in the North is also evidence of the manner that the post-conflict situation influenced LEAD PO interventions;
2. The unanticipated fast pace at which peace returned to the North caused a reconfiguration of the initial LEAD design and influenced subsequent activities by accelerating the speed at which the project had planned to transition returnees from resettlement and relief activities to commercially oriented production. In essence, post-conflict and non-conflict per se shaped LEAD activities and positively influenced LEAD achievement of planned results;
3. The OVC intervention activities (such as animal traction and caregiver training) that targeted orphans and vulnerable members of the households such as people living with aids (PLWA), nutrition promotion through household gardening, and provision of enrollment guidance and formation of groups for children and youth, were determined by the evaluation team to have been very effective in facilitating the quick return to stability of households.
c) The Effectiveness of the SAF as a Tool for Leveraging Private Sector Resources to Improve Service Outreach 1. Grantees have increased PO coverage using both LEAD resources and their own. In some cases they had
increased their core businesses in volume and quality as well as provided critical services along the value chains like input supply and produce buying;
2. Governance procedures are well within the approved LEAD framework and represent a fair framework for SAF management and implementation. The evaluation also noted that whereas collaboration with grantees

Page ix
based on formal agreements (such as the LEAD contract with Kyagalanyi) worked very well, other partnerships remained ad hoc and tentative in the absence of formal agreements;
3. Finally, the evaluation team’s conclusion is that the SAF grants have been an effective tool in leveraging resources in that for every LEAD USD 1$, it leveraged USD 1.5$. Households/farmers have benefited from training in areas of practical learning, investigation, problem solving, and information sharing. There is no doubt that the approach has resulted in greatly increasing farmers’ knowledge and awareness about imparted technologies and better management practices. As a result, an estimated additional 200,000 farmers across targeted value chains are expected to be reached by end of project through the SAF activity.
d) How LEAD’s Implementation Has Been Coordinated/Synchronized
1. The USAID/LEAD Project is regarded as one of the key actors in the agriculture sector. However, there is still room for effective coordination with other actors/stakeholders;
2. LEAD interaction with the LG staff at district and lower levels is limited or absent and will affect sustainability of interventions after the project ends;
3. Cases of duplication of effort especially between LEAD and NAADS activities have been reported as well as between some other USG efforts in the field. The weak collaboration and synergies between LEAD and other agencies therefore not only lead to wastage of limited resources that could otherwise have been used elsewhere but also weaken the attribution of the end results solely to LEAD interventions.
e) Effectiveness of LEAD Management Structure in Achieving Results
1. The LEAD management structure was deliberately designed to respond to the value chain approach, as well as the three project intermediate results? of increasing trade capacity, increased productivity, and increased competitiveness. This has contributed to ensuring a focus on the achievement of project results per the LEAD contract scope of work. The fact that the project efforts have been effective in the mobilization and harnessing various resources toward achievement of targets under each IR and sub-IRs is in itself evidence of their overall focus.
2. The adaptation of the structure to changing needs has enabled the project to avoid disruption in efforts toward achievement of Project results. Adding a layer of extension workers to the project delivery framework ensured that there was a mechanism to reach POs and farmers with project services;
3. Various management functional subsystems such as M&E and grants management are operational. Cross-
functional interactions between sub-functional units (e.g., the SAF and various value chains) have facilitated the achievement of various project results. Further, a monitoring and evaluation framework is in place to inform management decisions, although data quality issues and low feedback to stakeholders and those at the lower levels of management need to be addressed;
4. The USAID Mission/LEAD interaction was found to have been effective in ensuring the project was
implemented according to the contract between the client and the contractor. Advice was provided by COTRs whenever it was needed and they were generally perceived to be responsive. This has assisted in ensuring that both process and production of project results were in line with the expected standards and timely except in a few instances when the cost reimbursement was not processed in good time.

Page x
f) Overall Performance Management Issues:
i) Design Issues 1. In several respects, while LEAD has achieved considerable success in the range of activities assessed, the
design was over ambitious; 2. LEAD is focusing on too many value chains and interventions along the value chains, some of which are
already supported by other USG agencies such as the Market Linkages Initiative; 3. Based on farmers’ value chain ranking, the top five ranked value chains across all the supported districts
include: i) Maize; iii) Coffee; iii) Ground Nuts; iv) Sesame; v) Upland rice and vi) Beans.
ii) Implementation Issues
1. LEAD has performed poorly on delivery of the activities for market infrastructure;
2. The evaluation team assessed SAF governance and the guidelines and observed that the process of its delivery demonstrated rigor.
iii) Results Performance
1. With the caveat that the LEAD project has contributed to (rather than caused) the results achieved to date, the evaluation team’s view is that most results have been achieved, with the exception of one intermediate result regarding the improvement of trade capacity. Findings have also indicated that that this intermediate result is unlikely to be achieved even by the Life of Project (LOP).
Major Recommendations
The following are key recommendations per SOW question as suggested from the midterm evaluation:
Recommendations Responsible Entity (ies)
Extent of achievement of Results a) In view of the relatively high number of POs currently being supported, there is need to halt inclusion of additional POs as this has
overextend project capacity; b) Attention needs to be paid to activities under improving trade capacity, especially marketing infrastructure, as this outcome area has
lagged behind. Alternatively, the project should review the merit of continuing with some of the activities under this intermediate result so that efforts are devoted to aspects that contribute the most to attainment of project objectives;
c) Identify a mix of fewer chains and key gaps along the value chain that will maximize quantitative and qualitative impact, provide
effective lesson learning and build a larger degree of PO sustainability. The proposed value chains, based on respondents ranking (criteria included, food security, income, labor, ease of production among others) and the evaluation team assessment (criteria included return to investment, agro ecological zone priority, contribution to exports and food security), also informed by comparison with enterprises selected in the Strategic Enterprise interventions detailed in the agriculture sector Development Strategy and Investment Plan (DSIP) are:
Northern Region-Maize, Sesame, Ground Nuts Eastern Region- Maize, Upland rice and Ground Nuts Central Region- Maize, Coffee and Beans Western Region-Maize, Coffee and Upland Rice
LEAD Project Management & USAID COTRs LEAD Project Management

Page xi
Recommendations Responsible Entity (ies)
d) The PO adoption behavior requires closer scrutiny with a view to identifying effective strategies that can address low adoption and
increased consistence for high adoption.
e) A prioritization of the project indicators into a set of core indicators may be useful given that the current long list of indicators is difficult to update on a regular basis and in a cost efficient way. Further, the range of over achieved indicators (200%) and under achievement (10-12%) for some indicators strongly suggests over or under targeting e.g. for indicators like “number of PPPs forged or number of women organizations receiving USG support”
Role of Cross-cutting Issues a) Since POs are the main vehicle for reaching farmers, and hence women, PO formation or mobilization activities should consciously
include gender issues as a key consideration;
LEAD Project Management & POs.
Effectiveness of the Strategic Activities Fund a) The project should consider including external stakeholders such as USG sister project staff (two at most) at the grantee application
review and evaluation committee to assist in removing perceptions that administration of the SAF is less than transparent; b) Compliance to the contracts signed with grantees need to be closely monitored and enforced in view of observations that some
grantees did not fully adhere to them
LEAD Project Management & USAID COTRs
Coordination with other USG and Donor Project a) Undertake deliberate efforts to coordinate with central (MAAIF and Agencies like NAADS through the ASWG) and both District and
Subcounty local government agencies;
b) Collaboration with partners needs to be based on complementarities, and hence for future operations, thorough niche analysis may be required to avoid duplication
LEAD Project Management & USAID COTRs
Appropriateness of the Management Structure and Resource Planning
a) Review the policy on contracting and use of temporary staff such as volunteers/Field Facilitators with regard to ensuring transparency and terms of employment.
b) Adopt a staggered approach to the proposed FF phase-out process (MTE was told this is in the pipeline) to retain a measure of quality support for POs to project end
LEAD Project Management
MTE Findings Informing Feed The Future Programming
a) Bearing in mind the fact that a summative evaluation of LEAD will be conducted at the end of project, the team is of the view that the following key issues will require close attention especially in as far as the extent to which they will inform FTF programming. These include; PO development, spread of VC interventions, market infrastructure, access to inputs and finally increased adoption.
b) In line with USAID priorities under Feed the Future (FTF) strategy, which provides a comprehensive coverage of issues in the agriculture sector and indicates that future interventions show clear linkage with ongoing and past USG activities. The team is in full agreement with the FTF value chain strategic focus on maize, coffee and beans, which coincidentally represents 50% of the proposed value chains (listed under recommendation c above) that the team suggests LEAD focus on in its remaining period.
USAID Management

Page 1
1.0 INTRODUCTION
This report provides the findings of the midterm evaluation (MTE) of the Uganda Livelihoods and Enterprises for Agricultural Development (LEAD) Project, which was conducted between January and February 2011. The midterm evaluation was commissioned by USAID/Uganda Mission and was aimed at documenting evidence on progress made thus far not only toward LEAD project objectives but also to assess the effectiveness of strategies used in its implementation, the likelihood of attaining project results by end of project, and lessons learned. The MTE was guided by five key evaluation questions outlined in the scope of work (SOW), detailed in Annex G.
The report is organized into 11 sections. Section 1 is the introduction that summarizes the importance of the agricultural sector in Uganda and provides the project background, objectives, and its relevance in contributing to the addressing of the development problems associated with the agricultural sector. In addition, this section outlines the purpose of the evaluation and a summary of the SOW. Section 2 summarizes the approach and methods used in generating the answers to the evaluation questions. Section 3 is a presentation of findings, covering progress toward project objectives and presents an assessment of the role of cross-cutting issues in shaping design and achievement of LEAD objectives. Section 4 assesses the effectiveness of the Strategic Activities Fund. Section 5 reviews the extent to which the LEAD project was able to build synergies with other initiatives supporting the strengthening of the agricultural sector. Section 6 presents an assessment of the effectiveness of the LEAD project management structure in contributing to the achievement of project objectives. Section 7 highlights challenges faced during the course of implementation, while Section 8 is a presentation of lessons learned. Section 9 and 10 covers the conclusions and recommendations respectively based on the MTE findings by the evaluation team. Section 11 consists of the annexes that provide more details to the various components of this report.
a) Importance of Agriculture and Sector Performance The contribution of the agricultural sector to Uganda’s national economy, poverty reduction, food security, and export performance over the last three decades has been significant. Clearly, the sector has been and still is one of the major critical determinants for the improvement of people’s livelihoods and the socioeconomic transformation of the country (NDP, 2010). Its importance is evident in the fact that the agriculture sector contributes approximately 20% toward Uganda’s gross domestic product (GDP), accounts for 48% of exports (UBOS, 2010), and employs over 73% of the population (UBOS, 2010). Furthermore, due to the high annual population growth rate at 3.2%, total food production levels need to satisfy the nutritional requirements of a fast growing population.
Agriculture sector performance measured in terms of outcomes over the last two decades as well as outputs portrays a mixed picture. While real growth in agricultural output grew at an average of about 4% between 1987 and 2002, which was even higher than the population growth rate, it declined precipitously from 7.9% in 2000/01 to 0.1% in 2006/07 before recovering to 1.3% and 2.6% in 2007/08 and 2008/09, respectively (UBOS, 2010). This rate of growth was below the population growth rate of 3.2%, implying that per capita agricultural GDP has been declining.
The UBOS (2010) household surveys indicate that the food security situation has improved only marginally since 1992, although the trends indicate positive movement. The recommended caloric intake is still far from satisfactory and the proportion of the food-insecure population continues to oscillate periodically. The indicators of nutritional status, unsatisfactory as they are, have also improved a little. This situation is especially significant in the Northern and Eastern Regions of the country.
The share of the agriculture sector contribution to total export performance has been on the decline over the last two decades. However the sector is still the biggest earner of export revenues, and projections indicate

Page 2
that if informal trade was factored in, the revenue contribution is definitely higher. Furthermore, the agriculture sector is still the largest employer in Uganda.
The subsectors’ performance with regard to outputs also shows a mixed picture. Production trends of major crops manifest both substantial yield reductions and increases, while productivity trends indicate that farm level situations were and in most cases still are far below the attainable potential yields, essentially farm-level productivity is still far below research station yield levels. The situation with regard to the livestock and fisheries sector is only slightly different from the crop situation, with substantial increases in the national herd for almost every animal species (increased beef, poultry, and dairy production) and significant increases in annual fish catch but with increasing declines over the last decade.
Overall, Ugandan economic performance with regard to poverty reduction indicates that there has been a progressive decline in the number of people living below the poverty line from 38% in 2003 to 23.1% in 2010. While poverty rates remained the same in the urban areas, declines have been observed for the rural areas from 42.7% to 34.2%. However, despite these positive achievements, Northern Uganda registered only negligible reductions in the poverty headcount index. The northern poverty situation has been mostly on account of the prolonged conflict over two decades leading to internal displacement of people but which has since ended.
It is against this background that the importance of agriculture to the national economy and its impact on growth, poverty reduction, export performance, food security, nutrition status, and return of peace in the Northern Region have been critical and are still key to informing the context in which USAID has defined its interventions in the sector. The USAID strategy for agriculture is linked to national policy, planning and institutional frameworks namely the National Development Plan (NDP) 2010-2015, National Agriculture Policy (NAP), the National Trade Policy, National Export Strategy and Development Strategy, and Investment Plan (DSIP). In particular, the USAID LEAD interventions contribute to three of the four DSIP program components namely the following: i) enhancing production and productivity; ii) increasing access to sustainable markets; and iii) providing a favorable policy and legal environment for increased private sector involvement in the sector.
b) LEAD Project Summary
i. USAID/LEAD Project Background and Objectives The Livelihoods and Enterprises for Agricultural Development (LEAD) project, implemented by ARD, Incorporated from July 2008 to July 2013, has activities and resultant objectives which fall under three broad categories namely the following: a) improving agricultural productivity; b) increasing trade capacity; and c) enhancing competitiveness of selected agricultural value chains. LEAD is expected to optimize results in the target regions through a combination of private/public sector partnerships as well as working through partners who have long standing relationships especially with war-affected populations including the internally displaced persons (IDPs) and other vulnerable groups.
The aim of the LEAD program is to help integrate farmers and related micro- and small and medium enterprises (SMEs) into commodity value chains so that they gain improved access to markets, and more empowered relationships with suppliers, processors and traders. The overall objective of LEAD is to improve rural livelihoods and increase transformation of the rural agricultural economy through the aforementioned three key intermediate results.

Page 3
ii. The LEAD Project Design and Implementation Mechanisms
The design of the LEAD project was informed by lessons learned from the implementation of precursor projects such as the APEP, IDEA, Rural SPEED, and others. It aimed at consolidating gains made at the time of these previous interventions. The design combined many of the elements from the previous operations, aiming to reduce transaction costs and improve accountability for results. This was in contrast to the option of implementing the various elements currently under LEAD as standalone projects. Furthermore, the overall LEAD implementation utilizes the value chain approach1 as a vehicle toward achievement of the various project outcomes. It was anticipated that the implementation of LEAD would lead to system-wide effects, through harnessing and consolidating gains made from previous operations, as well as the creation of effective linkages with other USG-funded ongoing initiatives such as the food for peace projects.
iii. Evaluation Purpose The overriding purpose of this midterm evaluation was to gain an independent opinion of the performance of LEAD in order to help guide the Mission with regard to future project designs under the Feed the Future program. It is also envisaged that the results of this evaluation will assist the Mission in determining whether a change in strategic emphasis of LEAD is worthwhile. Therefore, based on the implementation of the LEAD project, the Mission is interested in learning more about what works and what does not and why, in terms of increasing agricultural sector productivity, competiveness, and trade capacity in targeted value chains.
The specific objectives of the midterm evaluation were as follows: 1) Asses the project’s approach and methodology to achieve project objectives; 2) Assess the effectiveness and impact of the technical assistance, training, and grant activities; 3) Assess project accomplishments as per outputs established in PMP and contract with USAID; 4) Validate the accuracy of achieved results as reported to USAID;
Identify lessons learned and make recommendations for future USAID/Uganda programming for agricultural development.
iv. Evaluation Scope of Work (SOW)
The key Principal Evaluation Questions outlined in the Scope of Work (Annex F) entailed the following: 1. To what extent (quantity and quality) have specific interventions been effective in contributing to achieving
LEAD’s planned results?; 2. What role, if any, have cross-cutting issues, specifically conflict, gender, and youth including OVCs, played
in shaping LEAD’s interventions and influencing progress toward achieving planned results?; 3. How effective is the LEAD Strategic Activities Fund (SAF) as a tool for leveraging private sector resources
to improve service outreach to end users of the program?; 4. How is LEAD’s implementation coordinated/ synchronized with other USG efforts and other donor activities
aimed at improving agricultural productivity in Uganda?; 5. How effective is LEAD’s management structure and staff composition?
i-TEC, an independent consulting firm that comprises of a multidisciplinary team of experts from Eastern and Southern Africa, was therefore commissioned by USAID/Uganda to conduct LEAD’s external midterm project evaluation. The role of the evaluation team was to provide substantive evidence necessary to respond to the 1 Value chain approach is defined as the full range of activities that are required to bring an agricultural commodity through the different phases of production to delivery to final consumers and disposal after use. Further, a value chain exists when all of the actors in the chain operate in a way that maximizes the generation of value along the chain.

Page 4
above questions in the SOW by assessing the extent to which the above three broad categories of results and their specific outputs have been achieved. In addition, the team assessed the effectiveness of the SAF and LEAD management structures and the extent to which they have led to the attainment of the intermediate results and/or have played a key role in moving the project toward attainment of its the overall project goal.

Page 5
2.0 EVALUATION DESIGN AND METHODOLOGY
a) Approach and Methodology for Addressing the Key Evaluation Questions In line with the above questions outlined in the SOW, the methodology used to conduct the midterm evaluation (MTE) entailed not only the review of the extent to which the project has so far contributed to achieving the overall goal through the review of project progress data, but also used findings obtained from an independent review of the performance of LEAD in the field by the i-TEC evaluation team.
To arrive at the answers to the evaluation questions, i-TEC’s evaluation approach is based on using mixed methods and triangulation of data in order to ensure that the evaluation findings fully respond to the purpose of the evaluation. The methods included the following:
Document Reviews of not only selected documents/items listed in the SOW but also materials assembled by other reviewers (particularly of the performance monitoring plan baseline data),, targets and performance reports (which was useful to build on baseline conditions to assess progress as reported by LEAD since its inception to date among other things).
Conducted Key Informant Interviews with LEAD Activity Senior Managers & staff, financial
institutions such as Opportunity Bank, FINA, and Centenary Bank. Agro-input suppliers (e.g., Victoria Seeds and Mukwano), affiliated with LEAD, USAID Activity Managers and other USAID partners in Northern Uganda (e.g. ACDI/VOCA and MLI) and others that operate nationally, or in other specific areas in LEAD project districts; key government ministries and agencies, District Extension Officers & other Development Partners (DANIDA, IITA & IFPRI).
Focus Group Discussions (FGDs), with mainly Producer Organizations and OVC groups. Conducted Survey of Beneficiary/Implementers covering not only the ultimate recipients of the
project services (the farmers & OVC households), but also intermediate beneficiaries such as Producer Organizations (POs) and for implementers a sample from the 350 LEAD field staff operating in selected 35 LEAD districts. Note: Gender & youth components were integrated within the survey questionnaires.
Stakeholder Analysis was used to determine the effectiveness of partnerships and collaborations
forged with not only other USAID Implementing Partners in Northern Uganda but also other areas of focus/development partners in the region in the implementation of various LEAD interventions;
Observation at service delivery and technology sites such as the Farmer Field Schools (FFS), farmer
plots, fish ponds, and drip irrigation for coffee respectively.
b) The Survey Design The Team employed a mixed-methods approach that entailed both quantitative and qualitative methods in order to collect relevant information. The evaluation assessed all aspects of project design, implementation, and reporting. The evaluation methods included desk studies, briefings of evaluators, project field visits to beneficiary farmers, Producer Organizations and other project farmer field school sites, program review, and debriefings. Focus group discussions were conducted to elicit information on perceptions of project effects, with the emerging findings complementing the quantitative data gathered through household surveys. A household survey of PO members was conducted in order to get insights into benefits from the LEAD project as well as key constraints faced by beneficiaries. This was done via administration of household questionnaires.
Page 6
The evaluation team assessed progress toward expected Life of Project (LOP) targets to determine the likelihood of which intermediate results will be achieved and which ones would not by the end of the project. The evaluation team used the established baseline conditions as benchmarks for assessing progress achieved toward the set results. The status of each parameter per result (in line with the evaluation questions) was assessed i.e. what LEAD’s intervention contributed to, any challenges, the achievement level and an explanation where results were not achieved as planned. Methods for collecting and analyzing data that emerged from the field were consolidated to develop the Team’s conclusions and recommendations and a solid basis for subsequent LEAD project actions pursuant to the evaluation.
Sampling Procedure:
For the household survey, the Team used a three-stage sampling procedure as follows:
1st Stage: Purposeful Sampling of 14 districts out of the 35 covered by LEAD based on the following criteria: Predominance of the supported value chains; majority of districts where the value chain did not collapse coupled with a few where it failed; OVCs activity; concentration of SAF grantees; a minimum of one district from each subregion, and a mix of Year 1 and Year 2 Supported Districts. To maintain regional representation, district selection was as follows:
Northern: 6 out of the 12 covered by the LEAD project. Eastern: 4 out of the 12 covered by the LEAD project. Central & Western: 4 districts out of the 11 covered by the LEAD project. Note that at least one district was selected from each subregion. The 14 districts covered during the midterm evaluation are displayed in Annex E of this document. 2nd Stage: Random Sampling of the following:
Used a mix of both purposive and random sampling of LEAD supported villages/POs/grantees, etc
3rd Stage: Selected a final sample size of 489 households (HHs) from the original sample size range of 385 -600 households (HHs) for farmers and about 100 for OVCs in the 14 selected districts.
Note: The sample size was determined using the following Cochran Equation (Cochran, 1963) detailed below, which provides a representative sample for proportions of large populations.
Where:
No = the sample size, Z = the area that represents the desired level of precision, P= is the estimated proportion of an attribute that is present in the population, e.g. Estimated beneficiaries from LEAD activities q= is 1-p represents the population that did not benefit from the intervention.
The actual sample size of households (HHs) covered by each Team was as follows:
i) Northern Team: The range was between 165 - 258 HHs and the team covered 193 HHs

Page 7
ii) For the Eastern Western and Central: The range was between110 – 172 HHs, the team covered 296 HHs
iii) Total sample size ranged from 385 – 600 HHs; in the end the actual covered was 489.
In addition, the Team used purposeful sampling to select 70 LEAD staff at different ranks also from the 14 selected districts. a) Data Analysis Used in Getting to the Answers Data analysis to generate the answers to specific evaluation questions as stipulated in the SOW entailed several approaches that included the following:
i) Performed content analysis of data gathered from both key informant interviews & focus group discussions.
ii) Conducted data analysis in SPSS to generate summary tables on the various variables being tracked by LEAD, as well as key questions included in the MTE questionnaire.
iii) Finally, the Team used “Triangulation” of data from all the different sources to answer each evaluation question. The “triangulation” process in and of itself to get findings entailed the following approaches:-
Results Chain Analysis based on the project’s results framework positing two scenarios: a. Performance based on Year 2 targets; b. Performance based on the likelihood of LEAD achieving LOP targets
Use of Midterm Evaluation findings to confirm or refute progress gleaned from LEAD project progress reports or documents
iv) Project-specific progress report data v) Use of secondary data to reconfirm and establish contextual information vi) Value chain analysis within each IR vii) Emerging issues relating to the Project (Design, Implementation, Results & Lessons Learned) The mixed methodology used provides important information on the following scenarios, which has been used to get to answers to the key evaluation questions: i) Performance against Year 2 targets by IR; ii) Performance toward LOP Results; iii) Influence of cross-cutting issues; iv) SAF effectiveness; v) Partnerships/synergies; vi) Management issues; vii) Specific outcomes in the North. i-TEC evaluation team specifically analysed not only the level of progress achieved thus far toward achieving the Year 2 targets, the Life of Project targets in the stated key results, and LEAD’s overall objective but also examined the performance of the targeted value chains within specific intermediate results. The other key elements of the evaluation such as cross-cutting issues, SAF grants, effectiveness of synergies, and management issues were also critically assessed in relation to their impact on LEAD program performance. As a result of this holistic approach, the Team has provided recommendations for reprogramming/redirecting and monitoring around LEAD’s main objectives.
b) Evaluation Data Management Plan In addition, the MTE findings generated have been used to shed more light on the following: Project Effectiveness: Performance vis-à-vis the reality on the ground/performance targets Partnerships: Stakeholder analysis, connectedness, and adequacy Integration of cross-cutting issues such as gender, conflict & OVCs: The extent of involvement of
LEAD effects on these cross-cutting issues at all levels, and vice versa Management structure & staff composition--Its adequacy in delivering LEAD activities as
envisioned in its work plan

Page 8
Lessons Learned: Learning opportunities to extend to either the redesign of the remainder of the program or new programs under the Feed the Future (FTF) program.
c) Inherent Evaluation Data Limitation/Study Constraints The evaluation team believes that the findings of this report are appropriate based on the evidence gained through the above methodology. However, we would like to acknowledge the following data limitation. Some of the data is based on recall, and as such they should be treated as estimations of the real situations:
Effects and/or results achieved may not be solely attributable to LEAD because of the presence of other similar initiatives such as NAADS and other USG–supported activities drawn upon by the same farmers.

Page 9
3.0 MIDTERM EVALUATION FINDINGS
a) Assessment of Progress Toward Achievement of Project Results
This section presents the findings of the midterm evaluation with respect to the first question of the midterm evaluation: “To what extent (quantity and quality) to which the project specific interventions have been effective in contributing to the achievement of LEAD’s planned results.” The observations and conclusions in this section are based on analysis of the project self-reported data (supported by additional information drawn from the MTE survey data from the 14 sample districts), stakeholder consultations at national and local levels, and research carried out by UBOS and other agencies. For ease of reference, the presentation of progress toward project results is organized around the project objectives and intermediate results, which are discussed in turn.
Question 1: To What Extent (Quantity and Quality) Have Specific Interventions Been Effective in Contributing to Achievement of LEAD’s Planned Results?
The LEAD results framework presents the goal of the program as expanded sustainable economic opportunities for improved livelihoods. The project sub-objective focuses on increasing transformation of the rural agricultural economy. Progress toward the sub-objective is tracked by the following indicators that monitor changes in: i) percentage and numbers of LEAD supported beneficiaries that have transitioned from subsistence to more commercially oriented farming; ii) jobs created as a result of interventions; iii) agricultural related firms directly benefitting from USG interventions; and iv) USAID assisted Small and Medium Enterprises (SME) that are manifesting sustainability.
LEAD interventions are tailored to achieve the goal and sub-objective through interventions that focus on three intermediate results (IR) areas: (a) Improved trade capacity, (b) Increased agricultural productivity, and (c) Enhanced competitiveness of targeted value chains.
The evaluation team used a results chain analysis, based on the LEAD program change theory, which entailed a review of key project performance indicators crafted to measure achievement of each intermediate result at design. Essentially, these represented the standards by which performance of the project was assessed and hence offered the basis for determining the project effectiveness in reaching its objectives midway through the life of the project. The consistency of both the internal (cause and effect) as well as external (project critical assumptions/risks) logic was also assessed. Emerging issues are also discussed in relation to overall project cycle performance (design, implementation, results, and lessons learned).
For instance, the evaluation team noted that the value chain approach and the Farmer Field School (FFS)2 methodology were both appropriate for delivering the project results. The value chain approach afforded the opportunity to identify actors and issues along the value chains, and forge critical links as well as address issues within the value chain. In addition, the FFS methodology was a practical and effective extension mechanism and was useful in delivering the project. Stakeholders and staff acknowledged that the FFS was an effective methodology for reaching farmers with support and technology promotion services, notwithstanding the sustainability implications of the methodology.
The MTE evaluation team noted that while the project design was in sync with the project’s theory of change in order to address the primary objectives specified at the time of the design, complexity was inevitably introduced during implementation. This was in terms of both crafting an adequate institutional framework to deliver the
2 Farmer Field School (FFS) is a group-based learning process combining agro ecological, experiential learning and community development concepts. FFS activities involve simple experiments, regular field observations and group analysis. The knowledge gained from these activities enables participants to make their own locally-specific decisions about crop management practices

Page 10
project, as well as managing the various components in an effective manner. The MTE found that the design at MTE was significantly different from the one available in the first year of the project. LEAD management confirmed that the management structure had been modified over time to address these complexities.
The LEAD Project Change Theory In regard to the program change theory, the evaluation team found that overall, the design was appropriate. Based on the project results framework, the internal logic of the project was largely sound following a cause and effect hierarchical relationship between the different levels of results. However, lapses regarding the rate of change from implementation of some key areas necessary to achieve some of the results were observed. First, the project was expected to identify and strengthen Business Development Service (BDS) providers to support POs in various aspects. The MTE found that despite attempts by the LEAD project to strengthen this component, only limited results were realized given the structural nature of the problem. A high dropout rate of SMEs was experienced, implying that the vehicle envisaged for delivering these services to end users continued to be weak. Consequently, the thrust of the project in reaching farmers with the various services intended by the project (e.g., access to agro inputs) was weak. Second, although a number of other USG-funded projects doing similar initiatives existed; the expected synergy with LEAD was not fully realized in practice. The project had to recruit a total of 350 field facilitators when it realized that implementation of the project via the envisaged FFS would be near impossible without the extension staff.
Progress toward LEAD Project Objectives
Thee cumulative progress toward the project objectives is summarized in Table 1 below.
Table 1: Overall LEAD Project Progress Toward Objectives
# OBJECTIVE/RESULTS PERFORMANCE ON TARGETS
# of Targets
Exceeded >110%
Met (=>90-110% on target )
Not Achieved ( <89% of target)
Unable to Assess (no data)
1 Project Objective 6 1 3 1 1 2 Subproject Objective 4 4 0 0 0
3 Project Intermediate Result 1: Increased trade capacity
20 6 2 12 0
4 Project Intermediate Result 2: Increased agricultural productivity
23 13 4 6 0
5 Project Intermediate Result 3: Increased competitiveness
16 9 2 5 0
TOTAL 69 33 11 24 1
Key on indicator Performance Rating:: Exceeded = 110% or higher of achievement on target; Met = 90% to 110% Achievement of target; Not Achieved = target less than 90% on target Source MTE 2011
As can be seen from the Table 1 above, over 63% (44 out of 69) of targets set for the LEAD performance indicators were either exceeded or met. This category includes those with progress of over 110% and those with 90% to 110% of their targets respectively. However, 35% of the targets (24 out of 69) were not achieved, which includes those with 89% or less on their targets.
The data indicates that the LE AD project IR 2 had 74% of its targets either met or exceeded, suggesting that it is likely to be achieved by LOP. Similarly, 69% of IR 3 targets were achieved by project midterm, indicating this IR is also likely to be met by LOP. However, IR 1 on increased trade capacity performed the worst, with only 40% of its targets achieved and 60% not achieved. There is need to note that aggregate performance is influenced by the magnitude of both the positive and negative achievements of the sub-IRs (i.e. performance of

Page 11
the sub-IRs) may have been exceeded but may be negated by the poor performance of other sub-IRs leading to the IR not being met.
As detailed under Annex A, the performance of various indicators specified for the project at goal and sub-objective levels based on project performance data on progress against Year 2 targets, three of the indicators were either met or exceeded. These relate to the number of rural households benefiting directly from USG interventions, the number of vulnerable households benefiting directly from USG assistance, and the percent change in income of targeted rural population. However, achievement on the number of very poor households benefiting directly from USG assistance was below target by 25 percentage points as of the midterm evaluation period.
Performance on one of the indicators on emissions could not be assessed as there were no data. The project has not collected data on this indicator and hence not tracked it. The reasons for not collecting the data on the indicator are not clear, although the lack of a strategy to collect data on emissions may be one reason. Consequently, there is need either to drop it from the listing of project key performance indicators or specify in the PMP that this indicator will be tracked via specialized surveys.
At sub-objective level, available data shows all the indicators were exceeded. In three out of the four indicators, targets were exceeded by margins of over 120 percent on Year 2 targets. However, these achievements need to be interpreted with caution as they imply that technically, the project has already achieved its objectives with the current achievements. Critically, there are two issues to be considered. First, the performance targets may have been set too low, and/or second, the changes in the indicators can also be attributed to the result of other exogenous factors such as assistance from other USG-funded projects or other agencies. The latter reason is supported by the MTE findings from focus group discussions where some members of the POs supported by LEAD indicated they also received assistance from other agencies.
Perceived Effects of the LEAD Project Results from key informant interviews involving LEAD beneficiaries indicate that the LEAD project is contributing toward creating critical awareness among farmers of how they can use farming not only as a means for subsistence but also as a viable commercial activity. Farmers interviewed consistently indicated that the training and information they got from interacting with LEAD FFs was useful in changing their perceptions about farming as a source of livelihood. This interaction was particularly crucial in some geographical areas more than others. While some areas had access to extension services from more than one agency, other areas indicated they had ‘never seen’ an extension worker in their area apart from the ones from LEAD. Thus, the LEAD project has been effective in improving geographical coverage of extension services where there are none. In this connection, the experience of one farmer in Apac district was instructive- see Box 1.
Box 1: Perceived Effects of FFS training on promoting farming as business Mr. Godfrey Okello used to farm as he had always done for several years and reported that he had never seen any extension worker in his area, whether from Government or other agencies. His farming did not yield him much, although he kept on working hard. In March 2009, a Field Facilitator from LEAD conducted sensitization meetings which he attended and subsequently led to his joining a Producer Organization where he received LEAD training in the famer field school. He says the training and information opened his eyes to doing farming as a business or full time occupation that generates money for the household.
This represented a turning point in his farming occupation. Two main changes have since happened in his life over the last two years. First, whereas he used to farm without following the appropriate agricultural practices such as spacing, and only used traditional low yielding varieties, he is now able to consistently use good farming practices and uses improved seed. This included the use of seed planter that had been lying idle in his house for several years. He also follows mixed cropping including maize, sweet potatoes and horticultural crops such as tomato and onions. This has enabled him to increase his yield significantly which is able to sell. Second, and as a result of increased income, he has been able to renovate his house by roofing it with corrugated iron sheets. He has also constructed an additional house. All of this has happened between 2009 and 2010.
A major challenge that he faces is the availability of market for his goods. While he has been able to increase production, markets are not readily available and at times he has to travel long distances to sell his produce or sell at very low prices for fear
Page 12
of the produce such as tomato getting spoiled. Godfrey’s experience with markets highlighted the need for continued facilitation of linkages to market by POs that are supported.
Source: LEAD MTE Key Informant Interview
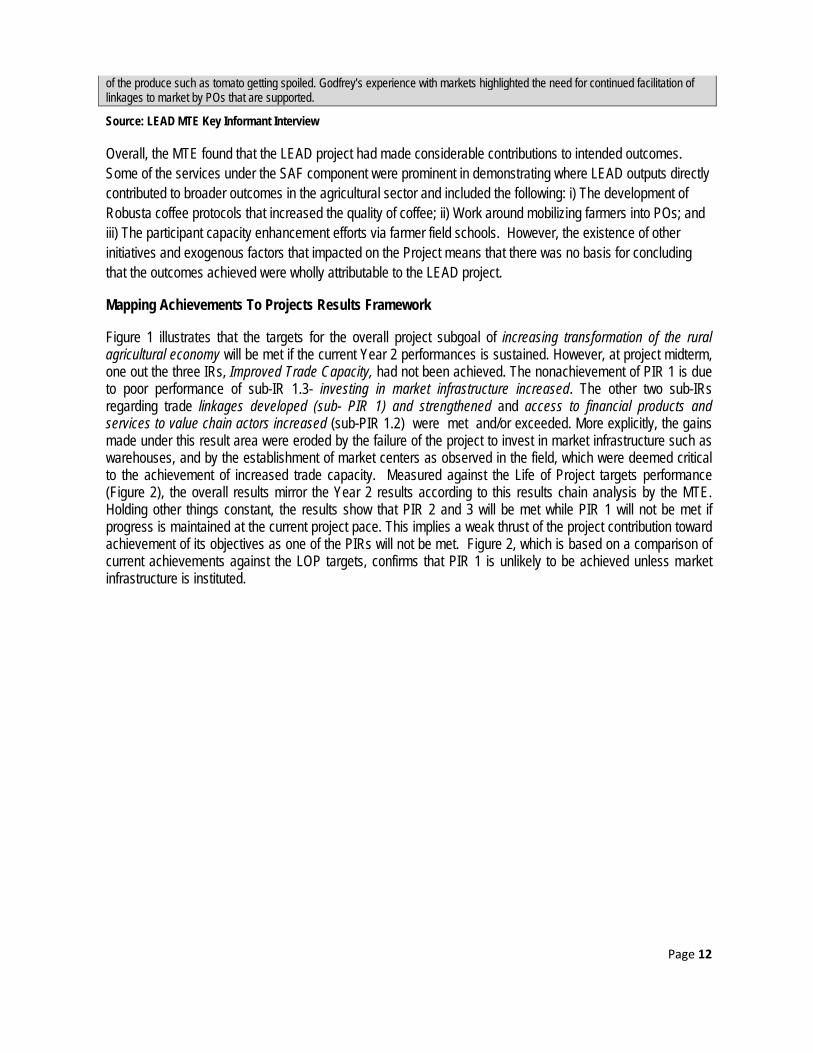
Overall, the MTE found that the LEAD project had made considerable contributions to intended outcomes. Some of the services under the SAF component were prominent in demonstrating where LEAD outputs directly contributed to broader outcomes in the agricultural sector and included the following: i) The development of Robusta coffee protocols that increased the quality of coffee; ii) Work around mobilizing farmers into POs; and iii) The participant capacity enhancement efforts via farmer field schools. However, the existence of other initiatives and exogenous factors that impacted on the Project means that there was no basis for concluding that the outcomes achieved were wholly attributable to the LEAD project.
Mapping Achievements To Projects Results Framework
Figure 1 illustrates that the targets for the overall project subgoal of increasing transformation of the rural agricultural economy will be met if the current Year 2 performances is sustained. However, at project midterm, one out the three IRs, Improved Trade Capacity, had not been achieved. The nonachievement of PIR 1 is due to poor performance of sub-IR 1.3- investing in market infrastructure increased. The other two sub-IRs regarding trade linkages developed (sub- PIR 1) and strengthened and access to financial products and services to value chain actors increased (sub-PIR 1.2) were met and/or exceeded. More explicitly, the gains made under this result area were eroded by the failure of the project to invest in market infrastructure such as warehouses, and by the establishment of market centers as observed in the field, which were deemed critical to the achievement of increased trade capacity. Measured against the Life of Project targets performance (Figure 2), the overall results mirror the Year 2 results according to this results chain analysis by the MTE. Holding other things constant, the results show that PIR 2 and 3 will be met while PIR 1 will not be met if progress is maintained at the current project pace. This implies a weak thrust of the project contribution toward achievement of its objectives as one of the PIRs will not be met. Figure 2, which is based on a comparison of current achievements against the LOP targets, confirms that PIR 1 is unlikely to be achieved unless market infrastructure is instituted.

Page 13

Page 14
Figure 1: LEAD Result Framework-Performance Based on Year 2 Targets

Page 15
Figure 2: LEAD Result Framework-Performance Based On Life of Project (LOP) Targets
Source: MTE 2011

Page 16
b) The Contribution of Specific LEAD Interventions to its Planned Results
The evaluation team’s assessment of results is presented for each of the intermediate results (IR), complementary evidence from respondents’ testimony, field survey data, and LEAD project monitoring data. To facilitate analysis, the presentation on the performance of the three IRs has been rearranged to follow the production sequence presented in Figure 3 below. As such, presentation of progress toward IRs starts with IR2, followed by that on IR 3 and ending with IR 1:
Figure 3: Production Sequence
Source: LEAD MTE 2011
c) Performance of Intermediate Result 2: Increased Agricultural Productivity
USAID/LEAD activities under this IR cut across multiple value chains that include coffee, aquaculture as well as cereals, pulses, root, oil, and horticulture/vegetable crops. The list established by the evaluation team is presented below. 1. Aquaculture2. Coffee 3. Maize 4. Millet 5. Rice 6. Sorghum 7. Cassava
8. Sweet potatoes 9. Beans 10. Soya beans 11. Ground nuts 12. Cotton 13. Sesame
14. Sunflower 15. Onions 16. Tomatoes 17. Vegetables
The extent to which interventions have contributed to increased productivity are tracked by monitoring changes in volume and percentages of the various value chains. Overall, the IR target at MTE had been exceeded by 155%. All the MTE targets for the five indicators under this main IR had been exceeded-See annex A. The indicator of Percent change in dollar value of targeted commodities produced by USAID assisted projects has not been included in the estimation of the IR performance, because it skews overall performance as it raises a red flag because of its overachievement of 987% against its Year 2 target. This unrealistic performance may be attributed to either under targeting, data quality issues, or external factors such as an increase in world coffee prices. It therefore requires further investigation, which is beyond the scope of this MTE.

Page 17
The sub-IR is assessed to determine the extent to which Business Development Services (BDS) have been developed and strengthened; levels of adoption of agricultural technologies; development and strengthening of POs; and finally the extent to which the private sector input supply systems have improved because of LEAD’s contributory interventions. Key areas under this intervention were the following: empowerment of farmers with appropriate knowledge and skills that would ensure that productivity and overall production increased, and strengthening POs and private sector inputs supply systems to ensure that farmers got access to quality inputs. Training included the following: land preparation, row planting, weed control, IPM, harvesting, post-harvesting handling (PHH), marketing, savings culture, credit access, input product knowledge, and linkages.
The evidence from the MTE household survey confirms the positive trend of some indicators monitored as part of this sub-IR. For the indicator volume of targeted agricultural commodities increased, the trend of yields of selected commodities is depicted in Figure 4 as follows:
Figure 4: Comparison Of Yields In Kg/Acre From National Agriculture Census Data, LEAD Baseline And Midterm LEAD Evaluation Data
Source: MTE 2011 (Computed) As can be noted from Figure 4, all the value chains indicate an increase in yield since the baseline except for sorghum. However, it is important to note that these results may not be directly comparable to the agriculture census and/or the baseline itself due to differences in methodology. The MTE data obtained from respondents indicated that overall, there had been both modest increases and declines in yields for the various commodities in the five regions visited during the evaluation and gave the main reason for the mixed performance as decline in weather. However, respondents in the Eastern, Central and Western Regions reported consistent yield increases for coffee and rice over the last two years since the start of LEAD project interventions.
Table 2 presents estimates of gross margins for some of the value chains supported by LEAD. They are based on respondent recall of costs of production and returns on some targeted value chains— coffee, maize, fish, and rice. The results show an overall increase in the gross margins for all of the value chains considered. An analysis of gross margins undertaken by the PMA (2010) also confirms the positive gross margins for crops such as coffee, maize, and rice.

Page 18
Table 2: Costs of Production, Gross Values and Gross Margins Selected Value Chains Costs of Production UGX Gross Values UGX Gross Margins UGX Coffee (labor and inputs) 408,000 2,210,000 1,802,000 Maize 317,500 540,000 222,500 Fish (Feeding and labor) 1,750,000 - - Rice 684,000 520,000 -164,210
Source: MTE 2011 Focus Group Discussions, Central and Western Uganda Note: Fish data on sales to compute gross margins were not available because at the time of the evaluation, the fish stock supported by LEAD program was not yet mature. Sub-IR 2.1: Business Development Services Developed and Strengthened
Overall cumulative weighted IR performance on Business Development Services developed and strengthened exceeded targets for Year Two by 123% (refer to Annex A). The biggest achievement was due to number of BDS strengthened and average percent change in volume of new businesses, which was 114 and 170% achievement of target respectively. However, data on percent change in dollar value by BDS was not available. The cumulative performance data to date for this sub-IR indicates that the LOP target for the overall result is likely to be met (refer to Annex B).
The MTE field data on the IR indicators on BDS also confirms the positive performance as follows: The team established that LEAD has linked POs and national, regional and international buyers including sesame, sunflower, and coffee exporters. These include:
a. Ankole Coffee Producers Cooperative Union (ACPCU), which LEAD linked to POs and international buyers. ACPCU is also a participant of the Fair Trading System modality, involving fair trade buyers pre-financing producers at fair negotiated interest rates based on the producers’ ability to deliver coffee;
b. Farmers were linked to UGACOF in Iganga, and in Kamuli there is a new linkage with NUCAFE being fostered;
c. In another case, NUCAFE has trained six key farmers but the exact nature of partnership or collaboration was not defined;
d. In Kamuli district, LEAD is working with POs that have been working with KULIKA Uganda Project, which is linking farmers to markets;
e. In the North, POs have been linked to Mukwano for sunflower and Victoria Seed for production of certified seed.
Furthermore, the team established that under the LEAD BDS provider strengthening activities, BDS providers as listed in Annex 3 of the LEAD 2010 progress report have also benefitted from capacity building activities including training on various aspects of business management as well as financial and product management. However, the evaluation team was not able to confirm whether there was any average percentage change in the volumes of new businesses acquired by targeted Business Service providers and the percent change in dollar value of business investment by BDS. Further, while strides had been made under this IR, the demand for BDS remained overwhelming. Cases of dropout for the local traders (e.g., agro-input suppliers) were reported, and these affected access to inputs by farmers.
Sub-IR 2.2 Agricultural Technology Adoption Increased Overall, the cumulative weighted sub-IR performance on agricultural adoption technologies exceeded targets for Year Two by 115% (Annex A). The highest achievement was recorded for the percent of trained farmers adopting new technology and/or management practices and additional hectares under improved technologies or management practices because of USG assistance, which was 170% and 132% respectively. Out of the six indicators, only 1 indicator on number of new technologies or management practices under field testing as a result of USG assistance did not meet its MTE target (71% achievement). However, the evaluation team

Page 19
concluded that this sub IR would be met by end of the LOP as considerable progress has already been made provided current trends are maintained. On the other hand, the MTE data available on the IR indicators on agricultural technology adoption also confirm the positive performance. The evaluation team established that LEAD had provided training to respondents in a number of areas on various new technologies as well as better management practices and record keeping. According to respondents from all of the districts, the main type of support received from LEAD was in the form of Farmer Field School (FFS) Training. Out of 391 respondents (LEAD-supported), 77% received support in form of FFS training, 32% received support in form of provision of market information, and 16 % received support in form of linkage to Input suppliers. In addition, 13% farmers got support in form of market linkages, 12% in form of establishment of post-harvest infrastructure, and 8% received support in form of linkage to financial services. The areas of training are indicated in Figure 5.
Figure 5: Various Training and Support Reported Received as per MTE Respondents
Source: MTE Data 2011 and LEAD PMP Baseline Data 2009 With regard to adoption, especially for input utilization, MTE data indicate that 45% of the respondents had used an agro input such as improved seed, fertilizer, pesticide, or herbicide over the last two years. The most commonly used agro input is improved seed followed by fertilizers. The least used agro inputs are pesticides reported by 15% of households overall, insecticides 7% and fungicides that were used by only 6% over the past two years. This is depicted in the following Figure 6. Figure 6: Number and % of MTE Respondents Reporting Use Of Agro Inputs, Pesticides, Insecticides and Fungicides

Page 20
Source: MTE Data 2011 and LEAD PMP Baseline Data 2009 As can be seen from Figure 6, the percentage of farmers reporting use of agro inputs is still low at 45% and from the analysis of household data, most of the farmers in this category reported high use of low-cost inputs, especially improved seed. The reasons given were the comparatively lower cost of improved seed and lack of resources to procure high-cost inputs like pesticides, fungicides and insecticides. Interaction with field staff also revealed that there was still scepticism on the benefits of fertilizers relative to the required investments, and also that there was wide occurrence of combined use of improved and local seed in field plots. This happened even when output consistently revealed the difference. Farmers who utilized improved seed, other technologies, or better management practices gave training from LEAD as the reason for their change in practice or behavior. LEAD facilitators and field officers also reported increases in numbers of farmers who are planting in rows, using timely planting, using improved seeds, and having increased knowledge of sources of reliable agro inputs. The source of this data is the statements collected from ballot box exercises, which are conducted at the start and end of the FFS every season. Observations are also made during field monitoring visits.
Other sources of data also confirmed increasing trends in the purchase of agro inputs. Both LEAD staff and agro-input dealers interviewed by the evaluation team confirmed an increase in the number of farmers using improved seeds, fertilizers, herbicides and pesticides, although they could not quantify the magnitude of the increase. When asked about the changes observed in the last two years in the kinds of agro inputs that farmers’ purchase, 92% of the dealers said more farmers were purchasing seed, 36% said that more fertilizer was being purchased by more farmers; while 40% indicated more farmers were purchasing pesticides, and 20% indicated herbicides. See Table 3.
This change was reported by agro-input dealers to be due to the training farmers were getting from ‘various’ development actors, and the packaging of agro inputs into smaller and more affordable packs e.g. packing of fertilizer in 5kg and 2kg packs instead of 50 kilogram’s as was previously done. Farmers also reported earning better incomes because of increased yields.
Table 3: Perceptions by Agro-Input Dealers on Trends in Purchases, 2010 - Eastern and Northern Uganda Observed change Agro-input dealers reporting the change (n=25)
Number Percentage % More farmers are purchasing seeds 23 92 More farmers purchasing fertilizers 9 36 More farmers purchasing pesticides 10 40 More farmers purchasing herbicides 5 20
Source: LEAD MTE 2011 With regard to post-harvest handling (PHH), farmers report training on use of tarpaulins for drying and how to correctly store produce. Use of tarpaulins is still limited in the North and East but is widespread in the West and in Central Uganda. The evaluation team also found that storage of produce is mostly in the house. Shelling maize is still largely by beating – especially in Iganga and Kiboga, but other farmers also pay for maize shelling services in trading centers. Rice is sold either milled or not. Groundnuts in the North and East are sold in unshelled form or are shelled using machines, cleaned, and then sold. In general transfer of knowledge on PHH has been acquired, but adoption is still limited reportedly because of limited capacity of households to procure.

Page 21
Box 2: Extension Services by LEAD and Some Benefits To Farmers Source: LEAD MTE 2011 Under the sub-intermediate result 2.2 indicators, respondents were severely challenged when asked to recall or produce records on the additional acreage that was put under improved technologies and management practices. The respondents reported that they had received training on record keeping but that they had not had prior information to bring their records to the meetings. However, they reckoned that allocation of land to particular crops was influenced by a number of factors such as: labor, financial, resources, and the prevailing market prices in the previous season. The evaluation team concluded that either there were no records or it was just general reluctance to produce these records due to several reasons that included fear of taxation, culture (records for public scrutiny taboo), possible disenfranchisement, or exclusion from future support. In summary, technology adoption is still low and features higher adoption levels for low-cost technologies or management practices with limited financial resource requirements. Increases in production and productivity will be more significant if PO adoption covers the totality of technology and management practice package. Sub-IR 2.3 Producer Organization Development and Strengthening
All the four indicators tracked under this sub-IR were met. The overall cumulative weighted performance on targets for the sub-IR on Producer Organization developed and strengthened exceeded targets for Year Two by 246% (refer to Annex A). The highest achievement was in number of women’s organizations receiving USG assistance and dollar value of sales of agricultural commodities produced by USAID-supported Producer Organizations. The high achievement in the number of POs is in part also accounted for by those supported by other USG Agencies and thus the rapid increase in POs for the period under review. However, this has also given rise to the challenge of quality, as the support framework in place to ensure that the POs are adequately served, was overextended. Performance of the indicators indicates that the development of POs and other associations in
LEAD has utilized the Farmer Field Schools (FFS) approach and Technology Observation Plots (TOP) for joint learning by LEAD and Grantee POs as well as OVC groups. The project has promoted the use of improved technologies and practices with all household members reporting learning and acquiring skills about improved maize, sorghum, bean, groundnut seed and fertilizer use like DAP and UREA, in the Technology Observation Plots/Ponds (TOP). Farmers in Dokolo district in the North received training on Agro Ecological Environmental Analysis (AESA). To ensure sustainability in terms of provision of extension services, each PO has two Key Farmers trained to ensure that in the absence of FFs or when POs are graduated, they can still be able to identify and solve production, harvesting, post‐harvest handling and marketing issues. In the MTE districts of Gulu, Mukono and Bushenyi, POs were trained in aquaculture best practices such as feeding, pond management and post‐harvest handling. Furthermore, grantees like ‘Pokure’ in Gulu as well as Source of the Nile (SON) in Central and Kabihura Fish Farmers in Bushenyi districts established TOPs to demonstrate fish pond construction, feeding techniques and appropriate stocking rates based on pond carrying capacity . The same grantees also supplied fish fry or fingerlings to POs, although a number of LEAD and non‐LEAD farmers have invested in fish fry production in the central and western regions. LEAD support to aquaculture farming through training of POs has created an avenue for marketing of fingerlings; most farmers now have well‐constructed/rehabilitated ponds, have improved their feeding methods with good quality feeds due to training. Farmers have increased production due to participatory assessments of constraints and getting solutions from their own ponds and exchange visits.

Page 22
relation to the LOP target will be met as 77% had been achieved by midterm. In addition, the target for value of sales for commodities over the last two years have exceeded targets for the LOP by USD 13.36 Million.
According to the MTE data on the PO indicators, project activities under PO development and strengthening included the mobilization and formation of new farmer groups to enable expansion of LEAD activities in targeted districts. This involved POs registration at subcounty, district, and national levels in the case of multiple POs and was done to ensure that they are recognized as entities that can access services and resources to enhance their production related activities. An issue raised by POs in Kumi district in the Eastern Region was the high registration charges; other issues included the fact that a number of POs are already registered with NAADS and therefore saw no need for additional registration exercises. LEAD engaged in a number of activities with POs that included encouraging exchange visits to increase awareness among farmers; increasing management capacity for other crops that are not the primary targets (horticulture crops) of the program; and the deliberate recruitment of Field Facilitators who work and reside within the targeted communities to monitor activities and give farmers advice on daily basis. Furthermore, LEAD fostered linkages between some POs with local and international produce buyers including World Food Programme for maize and Mukwano in the North for sunflower. LEAD strategies for ensuring sustainability of POs include supporting institutional development of POs, capacity building of key farmers, linking POs to organizations to support farming and business activities of POs beyond LEAD (e.g., the grantees) for produce buying and Build Africa or WINIP (Nebbi) for promoting VSLA. With regard to ensuring that POs had a gender balance at the time of group formation, it was reported in the Northern Region that Field Officers and Field Facilitators put this into consideration. However, the evaluation team established from LEAD Headquarters that there was absence of definitive affirmative gender action especially at the PO mobilization activity level, suggesting that the district field staff (FO and FF) may have acted proactively but not necessarily according to design. PO FORMATION AND AGE The MTE found that LEAD was working with two sets of POs, namely, those formed by other agencies and those that had been mobilized by LEAD. The total number of POs formed by LEAD accounted for 45% of the total number of POs in 13 out of the 14 sampled districts, while those formed by other agencies accounted for 55%. The POs formed by other agencies have been inherited from previous programs or are part of initiatives that are currently running as some were formed as late as 2010. The main agencies associated with formation of POs were the APEP project, Mukwano, NAADS, UGACOF, and LEAD itself. In terms of age, 32% of the POs that LEAD works with in the 13 districts were formed before 2008 (or before LEAD). In some districts, the oldest POs go as far back as 1997. Sub IR 2.4 Private Sector Input Supply Systems Strengthened
Overall cumulative weighted sub-IR performance on private sector input supply systems strengthened met targets for Year Two by 109% (refer to Annex A ). The biggest achievement was due to the number of agro-input dealers trained in product knowledge and business skills at 203%. However, the rest of the sub-IR indicators did not meet their targets and were significantly below expected targets by the time of the MTE, and was hence rated unlikely to be achieved by the LOP. The nonachievement of the three indicators is attributed to the reported dropout rates, and switching focus (i.e. from selling agro-input to non-agro-input products). Consultations with LEAD staff both at the district and Headquarters confirmed this to be the case. In regard to the value of input purchased by USG-supported

Page 23
clients, the team found that underachievement is likely to be associated with the steady decline in the US dollar to Uganda Shilling exchange rate in Year Two that may have led to decreased procurement because of higher price levels.
The following MTE data available on the IR indicators on agricultural technology adoption confirms the overall positive performance under this sub-IR as follows: LEAD District FOs in the four districts in the East reported that 69 agro-input dealers were trained on marketing and product knowledge, whereas 15 dealers interviewed in the 6 districts in the North were also trained in the same areas. Input dealers in the Western and Central Region also reported receiving training. While the training for agro-input suppliers in and of itself cannot guarantee a strengthened input supply system, it does have a bearing in increasing the knowledge of the players in the private sector that are more likely to participate in the input supply system. See Table 4.
Table 4: Number of MTE Agro-Input Dealers reporting receiving training In North And Eastern Regions District IGANGA KAMULI BUKEDIA KUMI GULU LIRA NEBBI APAC DOKOLO PADER
Reported by FOs in Eastern Uganda 24 23 12 10 Reported by Agro-Input Traders/Dealers interviewed in Northern Uganda
3 3 2 3 1 1
Source: MTE 2011 However, in the Eastern Region, no agro-input dealer respondent has been linked to financial institutions by the LEAD project, and the reasons given by the dealers themselves was their preference to use available profits and/or own savings, support from family, friends and relatives, or income earned from other businesses to avoid borrowing from financial institutions. MTE data analysis, however, indicated that investments resulting from these sources was not always assured and sometimes or usually (depending on the location) ended up in disputes over stock/inventory, ownership and land, or other collateral that could even span generations. Out of fourteen key informant interviews conducted with such agro-input suppliers, four confirmed accessing loans from a bank or microfinance facility only once. In the North, input dealers interviewed in Lira and Gulu had been linked to financial institutions but had not accessed any loans yet. They reported that they had expectations that LEAD would act as a guarantor and/or or supplier of the loans. The MTE learned that while LEAD will not guarantee individual loans, an arrangement had been made with the participating banks (i.e. Opportunity and Centenary) to undertake agriculture financing to famers or POs, which would constitute a form of guarantee. The exception to the rule was with PO coffee farmers in the Western and Central Regions who were supported to access inputs such as improved coffee seedlings and few tarpaulins through the LEAD grantees but not directly from LEAD. Box 3 illustrates some agro inputs purchased by POs from agro-input dealers.
Box 3 : EXAMPLES OF BULK PURCHASES OF AGRO-INPUTS MADE BY PRODUCER ORGANIZATION
Source: LEAD MTE data 2011
i. Tugezeku PO in Waibuga Sub County, Iganga district purchased 300KG of maize seed and fertilizer from Redcon;
ii. Ten farmers from Mukisa PO in Balawoli Sub County, Kamuli district purchased 100KG of maize seed from Kamuli Farmers Center in 2010;
iii. Farmers from Ndimugezi PO in Kamuli district also purchased 80 KGs of maize seed from Nawantale Farmer Center in 2010, while others from Kyebatobona PO purchased 100kgs of seed and 75 KGs of rice from Kamuli Farmer Center;
iv. In Kumi District, farmers and POs purchased improved maize seed from Ongodia Agro input Dealers in the first season of 2010;
v. Other bulk purchases have been made from CAII Seed Company and NASECO in Iganga and Akuku Farm Supplies in Kumi District.

Page 24
The grantee approach of identifying input suppliers followed by training and linking them to farmers along the value chain has been quite effective because farmers now report getting access to quality inputs. However, only coffee farmers have reported receiving improved coffee seedlings and few tarpaulins; this has not happened with nongrantee farmers. It is important to point out that LEAD grantee POs have a definitive edge over LEAD POs because the grantees are already active or have interests in specific areas of the value chain like providing inputs on credit, certification for quality and produce buying while LEAD nongrantee POs are essentially targeted with technical assistance (training and linkage). So while it is true that all POs are all LEAD beneficiaries, the relationships are not necessarily the same, although the MTE did establish some areas of overlap in training and produce buying.
It was reported that because of the LEAD activities, farmers are now motivated to plant coffee and have learned to improve on their farming methods (i.e., spacing, pruning, and how to plant improved coffee varieties). This has led to increases in coffee production, and levels are likely to be sustained due to the incentives associated with increased income.
The team noted that some respondents in the districts visited did not appreciate the benefits of LEAD linking them to input suppliers because they were reportedly very expensive, and yet the farmers’ purchasing power is reported to be still low. The evaluation team established that this was because linked LEAD input suppliers took it upon themselves to supply certified inputs, which were definitely more expensive. Farmers also complained about the presence of cheap, counterfeit, or adulterated inputs in markets and that in certain instances dealers did not always have sufficient volumes to cater for existing demand. It was also reported in Central and Western Uganda that initially some input dealers thought that they would get access to credit through the LEAD financial services linkages activity, but when they learned that credit was to be obtained through financial institutions such as banks, they gradually lost interest in the program.
d) Performance on Intermediate Result 3: Enhancing Competitiveness The overall weighted performance of the PIR has exceeded Year Two targets by 185%. The PIR is tracked by two indicators, both of which exceeded the set targets. The highest on the PIR achievement was on the number of firms receiving USG assistance to improve their management practices (125%), followed by the number of firms achieving international standards because of USG interventions at 60%. The cumulative performance on this IR at MTE indicates that the LOP target for the overall result is likely to be met (refer to Annex A).
From the field observations, the evaluation team established that LEAD support had a bearing on the performance toward many of the targets under this IR. These included a number of capacity-building activities at the organization level and holding of a regional agriculture trade show in Gulu: fostering of linkages between POs, multi- POs and SMEs to large domestic and regional traders such as Mukwano and Nile Breweries, BUSIA Grain Traders, AgroWays, and Jinja Upland Rice Millers. The team also found that LEAD organized training of project and grantee PO members in agribusiness management, finance, and marketing using similar curricula. Following these initiatives, it was reported that subgrantee Kyagalanyi Coffee developed protocols for use in Mukono, while UGACOF is training farmers on recommended coffee management practices and standards to enable acquisition of certification. It was also established that Ankole Coffee Producers Cooperative Union (ACPCU) has trained PO through FFS to grade premium coffees to enable penetration of international high value markets. LEAD has also supported coffee stakeholders through the coffee breakfast meetings, to discuss challenges in the industry in Mukono through Kyagalanyi. All these had an effect in improving yields and processing of the coffee product.

Page 25
In regard to the fish value chain, the team established that fish farmers in Bugongi subcounty in Bushenyi district now sell their fish to exporters, in addition to domestic consumers. They are thus able to get higher prices for their produce, which has had an effect on their household incomes and food security. As a result, exports of fish products have been initiated to Zaire through a grantee Kabihura Fish Farmers.
The evaluation team’s assessment is that the quality of the results has also been high with respect to this IR, especially with regard to the coffee value chain, where a series of activities have led to improvements in the quality of coffee, and the removal of certification bottlenecks to allow farmers access international markets. Additional MTE data is presented along the sub-IRs indicators in the following sections.
Sub-IR 1: Increased market access Key informant interviews confirmed the effect of LEAD assistance in facilitating certification for coffee and good agronomic practices. A case in point was the assistance provided to ACPCU and Kyagalanyi. The three certification categories are UTZ, organic, and 4C. Interaction with these grantees also revealed that LEAD’s main contribution has been increasing the number of farmers trained to produce coffee according to the required certification standards. Further, in the Eastern Region, the acquisition of market and PHH infrastructure has improved the competitiveness of Marsenne and KUDFA as buyers of farmer produce and marketing entities. Marsenne is now able to by-pass agents and make direct sales of Epuripuri (sorghum) to Nile Breweries. The processing equipment procured by Marsenne can also process maize. This has enabled the company to penetrate new markets by entering the maize produce business and is presently exploring opportunities for supplying large regional companies such as UNGA. . Sub-IR 2: Enabling environment for value chains improved The team established that LEAD project supports the organization of a quarterly coffee breakfast through the Ministry of Finance, Planning and Economic Development (MoFPED). The coffee breakfast provides a platform for identification of issues and discussion of possible solutions. Constraints such as challenges with certification and financial services (agricultural lending) are some of the issues that are discussed at these fora. In the Northern Region, it was established that LEAD also organized a stakeholder conference bringing together MAAIF, USTA, UNADA, and Victoria Seed (among others) to discuss challenges associated with the agro- input industry. Furthermore, the team also heard that research findings on improved technologies through IITA have contributed to improvement of the enabling environment and have been useful in demonstrating increased production for various crops and under differing cropping patterns and practices Sub-IR 3: Human and institutional capacity developed Through interaction with key informants, the team established that LEAD Project has conducted extensive training for staff, POs, grantees, produce buyers, agro-input dealers, and financial institution staff and partners such as Build Africa, Victoria Seed, and Kyagalanyi. The MTE found that LEAD had supported firms in all regions of the country through capacity building to export produce. It has also provided resources for certification in order to meet the requirements for the Fair Trading System for UGACOF and ACPCU.
Sustainability of Producer Organizations
Institutional capacity development will, to a large extent, depend on the sustainability of POs to continue functioning beyond LEAD support. Therefore, ensuring that POs receive the right support is key. The main current aspects of LEAD project design and implementation in this regard includes the following: i) Supporting institutional development of Pos; ii) Capacity building of key farmers; iii), Linking POs to organizations with a permanent structure to support farming; , iv) Business activities of POs beyond LEAD (e.g., the grantees) for

Page 26
produce buying; and v) Build Africa for promoting Village Savings and Loan Associations (VSLA). Districts have had targets for establishment of POs every year. Although close to 4,500 were indicated as being due for graduation, the need for support of the new PO would mean less time to interact with older ones, except for occasional monitoring visits by the field facilitator, officers, and TAs as well as the training of key farmers.
Discussions with some of the grantees revealed the fragility of POs, especially with regard to sustaining their ability to bulk and sale produce as group. The case of Mukwano (AK Fats and Oils) in the North regarding sunflower is a case in point. The evaluation team learned that the agreement between LEAD and Mukwano had come to an end eight months before the MTE, and that farmers had reverted to individual sales as opposed to honoring the contracts with Mukwano for the initial bulking arrangement promoted via the LEAD Mukwano (AK Fats and Oils) Agreement. Indications are that the bulking arrangement did not even last three months after the expiry of the LEAD/Mukwano agreement. On the other hand, LEAD project staff at the district level estimated a PO survival rate post-LEAD support of between 50% and 60% in the North and East. The main threats to sustainability of POs include: i)The required number of POs to be handled by field facilitators and officers; ii) The envisaged limited back stopping services after POs graduation; and iii) Lack of transparency and/ or poor communication within PO management. The evaluation team observed that due to the large number of POs, one FF was responsible for facilitating between 20 and 30 POs. This implies limited interaction with farmers, as revealed by the FOs and FFs interviewed.
Some of the institutional challenges faced by POs are summarised in table 5. Table 5: Challenges faced by POs Challenge Associated Value
chain Suggested Solutions
Failure of farmers to follow recommended coffee management standards Certification of farmers and linkage to specialty markets requires strict adherence to recommended management practices, however many farmers fail to do so and are deregistered
Coffee Strict monitoring, involvement in farmer training Signing of agreements
Uncoordinated activities of buyers: Activities of many buyers are uncoordinated and unregulated. There are no common agreed standards on the quality that buyers are prepared to buy. This compromises farmers’ adherence to standards because there is no limit to buyers who will take anything regardless of quality
Coffee Continued training and monitoring of farmers
Breach of contracts: Some traders make contracts with farmers. In the contract the buyers commit to training, monitoring, assisting with certification process (in the case of coffee), buying produce and paying for it in cash. Some provide farm tools. The contract obligates farmers to attend meetings and trainings and in the case of coffee to follow given standards, accept to be inspected and sell coffee to the organization. Choice of how much the farmer will sell is not determined but projections of average amount of coffee expected from a farmer’s garden in a season are made. Most times farmers sell only a very small amount of coffee to the organizations with which agreements are made and sell the larger proportion to other middlemen.
Coffee, Epuripuri Sorghum
None. Most have stopped providing farmers with seed on credit
Weak and Unstable prices: Maize Poorly dried produce: Sometimes done intentionally by farmers to make produce seem
Maize, coffee Farmer training

Page 27
Challenge Associated Value chain
Suggested Solutions
heavier at the weighing scales Competition from other produce buyers Coffee, Sorghum,
Rice Earning good will of farmers by i) maintaining close contact and good relationships with farmers throughout the year through farmer training and monitoring visits; and ii) provision of some inputs such as tarpaulins and simple farm tools Sending out agents to purchase at farm gate Guaranteeing a purchase price and topping it up with a premium if sold at better prices
Poor quality of produce due to poor PHH Rice, Sorghum Farmer training, set up of PHH demonstrations at milling place (Jinja Upland Rice Millers)
Source: LEAD MTE 2011 Other challenges reported by small traders not associated to POs include having poor business skills, low operation capital, low prices offered by buyers that they sell to, and high interest rates that deter them from accessing credit. In terms of institutional development and strengthening of POs, the case study in Box 4 below highlights a number of factors affecting PO functionality and sustainability.

Page 28
The experience of the Bugaya Area Cooperative Enterprise (Bugaya ACE) in Kamuli district and currently supported by the LEAD Project is an example of the promises and opportunities for the sustainability of Producer organizations. The Bugaya Area Cooperative Enterprise was formed in 2005. It comprised of farmers that were in the savings group and the APEP study circles. Its roles include marketing PO members’ bulked produce, selling agro inputs, advocacy for getting loans and being an entry point for partners who wish to work with the POs. The ACE now has 839 member farmers. By the start of the LEAD project the Bugaya Area Cooperative Enterprise (Multi PO) had already been formed. LEAD’s support is seen as strengthening the capacity of ACE through provision of advice to ACE leadership, as well as training to farmers in their individual POs through PO development. It has maintained links with the Buyamba United Savings and Credit Cooperation (SACCO), an organization out of which the Bugaya ACE developed. POs register with the ACE and buy shares in it and then open accounts with the SACCO. All payments to POs are made onto their accounts and the PO Key farmers then make payments to individual farmers according to the amount of produce they supplied. Leadership structure and Benefits To Members Each member PO selects two people to represent them in the Depot committees. Other committees such as marketing committee, finance committee etc are drawn from the Depot Committee. In addition to accessing loans from SACCO, selling produce at good prices and obtaining inputs at good prices, farmers also get advance payments for produce some times. For example In 2010 Bugaya ACE borrowed 30,000,000/= from National Housing Finance Bank using over 144mtns of maize in they had in Agro Ways as collateral. The money was used to make advance payments to farmers Challenges Some farmers not participating in LEAD supported activities explained that they were part of the APEP groups but refused to join the LEAD supported groups because key farmers were buying produce and offering farmers low prices. They complained about the lack of transparency and feedback on key issues. While not ruling out elitism in the Key Farmer model under POs, it is possible that farmers with this perception have not understood the transaction costs involved in sale of their produce, let alone the fact that they should incur part of it. For example in May 2010 Bugaya ACE took 30,607 kg, 31,409 kg and 32,761 kg of maize to Agroways. Total Agro Ways charges for these consignments were 1,483,332/=, 1,540, 473/= and 1,533,003/= respectively. These costs were for drying, cleaning, loading, fumigation and storage. Failure of ACE leadership to be transparent, communicate these issues clearly to farmers and involve them in planning and decision making could result in the collapse of these cooperatives. This experience points to the need for capacity building for POs and multi POs under LEAD, particular with respect to the governance of POs. There is need for strategies for supporting multi PO leadership structures) and Area Cooperative enterprises to ensure they are actually serving the interests of member farmers and that the are not seen as entities taken over by a few individuals as their own produce businesses.
Box 4: Case Study-Bugaya Area Cooperative Enterprise
From the case study, a number of observations regarding the working and evolution of POs as entities around which livelihoods are built and sustained for poor households can be made. First, farmers have strong reservations about bulk marketing due to previous bad experiences and hence are reluctant to use this vehicle. Second, production volumes by farmers are still low due to partial application of recommended practices and effects of bad weather. Therefore, the amount of produce is not attractive enough to draw big buyers. Third, most of the POs do not have stores and therefore prefer to sell their produce at farm gate soon after harvest. This is because farm gate purchases by middlemen guarantee farmers immediate payment as opposed to bulking and waiting for payments to be made later on. These sentiments were raised by both grantees (e.g. Mukwano) and PO members during focus group discussions. They suggest the need for continuous efforts in not only promoting the usefulness of POs to farmers, but also demonstrating the long-term benefits.
In summary, the sustainability of POs requires further analysis in order to understand the attributes that facilitate the likelihood of longevity of a PO. Based upon this insight, recommendations about what sort of organizations the POs should evolve into is from anecdotal evidence. In this regard, LEAD needs to create its own operational data base of the POs, building on processes started during the MTE to cover all the districts. This database will be useful in tracking the progress of each PO over time. Sub IR 3.4 Public-Private Partnerships (PPP) developed The MTE findings revealed that a total of 42 partnerships had been established, although two had been discontinued due to lack of proper conduct by two of the sub grantees. Stakeholder consultations as part of the MTE confirmed that public-private dialogue mechanisms had been utilized for discussion and identification of solutions covering a range of issues affecting performance of value chains. The MTE findings on the number of public-private partnerships formed as a result of USG assistance support the LEAD self-reported data.
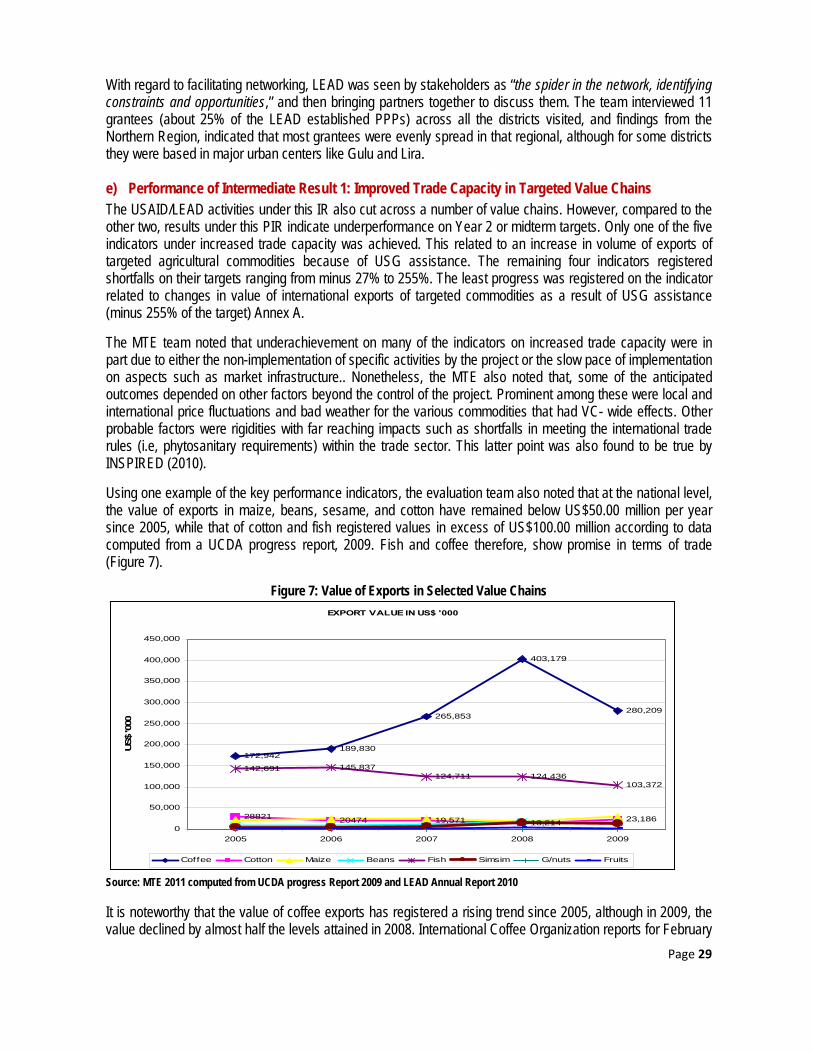
Page 29
With regard to facilitating networking, LEAD was seen by stakeholders as “the spider in the network, identifying constraints and opportunities,” and then bringing partners together to discuss them. The team interviewed 11 grantees (about 25% of the LEAD established PPPs) across all the districts visited, and findings from the Northern Region, indicated that most grantees were evenly spread in that regional, although for some districts they were based in major urban centers like Gulu and Lira.
e) Performance of Intermediate Result 1: Improved Trade Capacity in Targeted Value Chains The USAID/LEAD activities under this IR also cut across a number of value chains. However, compared to the other two, results under this PIR indicate underperformance on Year 2 or midterm targets. Only one of the five indicators under increased trade capacity was achieved. This related to an increase in volume of exports of targeted agricultural commodities because of USG assistance. The remaining four indicators registered shortfalls on their targets ranging from minus 27% to 255%. The least progress was registered on the indicator related to changes in value of international exports of targeted commodities as a result of USG assistance (minus 255% of the target) Annex A.
The MTE team noted that underachievement on many of the indicators on increased trade capacity were in part due to either the non-implementation of specific activities by the project or the slow pace of implementation on aspects such as market infrastructure.. Nonetheless, the MTE also noted that, some of the anticipated outcomes depended on other factors beyond the control of the project. Prominent among these were local and international price fluctuations and bad weather for the various commodities that had VC- wide effects. Other probable factors were rigidities with far reaching impacts such as shortfalls in meeting the international trade rules (i.e, phytosanitary requirements) within the trade sector. This latter point was also found to be true by INSPIRED (2010).
Using one example of the key performance indicators, the evaluation team also noted that at the national level, the value of exports in maize, beans, sesame, and cotton have remained below US$50.00 million per year since 2005, while that of cotton and fish registered values in excess of US$100.00 million according to data computed from a UCDA progress report, 2009. Fish and coffee therefore, show promise in terms of trade (Figure 7).
Figure 7: Value of Exports in Selected Value Chains
EXPORT VALUE IN US$ '000
172,942189,830
265,853
403,179
280,209
28821 20474 19,571 13,214 23,186
142,691 145,837124,711 124,436
103,372
0
50,000
100,000
150,000
200,000
250,000
300,000
350,000
400,000
450,000
2005 2006 2007 2008 2009
US$
'000
Coffee Cotton Maize Beans Fish Simsim G/nuts Fruits
Source: MTE 2011 computed from UCDA progress Report 2009 and LEAD Annual Report 2010
It is noteworthy that the value of coffee exports has registered a rising trend since 2005, although in 2009, the value declined by almost half the levels attained in 2008. International Coffee Organization reports for February

Page 30
2011 indicate that global coffee prices have been on the rise and volumes especially of Robusta have been on the decline over the last eight months. In addition, although fish values are relatively high, they have shown a declining trend since 2006.
Trade Linkages Developed and Strengthened The evaluation team established that, cross border trade between the Northern and Southern Sudan has benefitted from produce from LEAD farmers (beans, millet, and sesame seed) and in the Eastern Region and Kenya (maize). In addition, respondents also reported new fish product exports to the Democratic Republic of Congo from the Western Region. The team found that all the enterprises that were visited reported changes in the way they conducted their businesses but not particularly investments alone. The changes reported included the following: i) The packaging of their products like inputs into smaller sizes; ii) Inventory forecasting; and iii), training of customers on utilization, financial management and marketing of business products in a manner that endeared them to their clients. This was reported in all the regions visited in the country. There were a number of linkages created between microenterprises especially stockists and large scale firms like Victoria Seed in the North. In the Eastern Region, farmers preferred purchase of improved seed directly from seed companies instead of the input dealers or stockists because of the lower prices. This directly affects the volume of business between the SME and the large scale farms. Victoria Seed in the North has plans to extend its supply network to every subcounty in the region, in the short to medium term. Access to Financial Products and Services to Value Chain Actors Increased LEAD performance data on the following indicators was below target: i) Amount of private financing mobilized with a DCA guarantee; ii) Number of SMEs, receiving USG supported assistance to access bank loans or private equity; iii) Number of SMEs that successfully accessed bank loans or private equity as a result of USG assistance; and iv) Dollar value of loans provided to USG-supported Producer Organization for farm inputs from credit institutions. The reason for underachievement on the four indicators was a delay in the finalization of the DCA. It is expected that these indicators should improve in the remaining period of LEAD implementation, as the processing of the DCA has been finalized, and the required ground work with POs done.
LEAD Headquarter staff reported that the DCA had only recently operationalized the loan guarantee facility for three banks. One of these was Centenary Bank (which had developed its own product and expected to benefit LEAD POs that had received Animal Traction training through the FFS approach). Another one was Bank of Africa (BoA), where 58 applicants had succeeded in getting loans . The DCA facility for Centenary and Bank of Africa is for USD 6 Million each while Opportunity Uganda it is USD 3 million. The SMEs interviewed reported that while they had received assistance to access bank loans in terms of linking them to the financial institutions, they were hesitant to proceed because some of them thought that LEAD was going to directly provide the loans or equity to them. SMEs in the Eastern Region were hesitant to proceed with the loan processes, because they thought these were potential debt traps. Only one SME, Bugaya Area Cooperative Enterprise in the Eastern Region, reported accessing a USD 15,000 loan from National Housing Finance Bank in 2010, using 144 metric tons of maize they had stored with Agroways as collateral. Other SMEs in the Northern and Eastern Region reported that they preferred to use their own savings. This, however, does not mean that no other SMEs were successful in acquiring loans only that those interviewed reported otherwise.
In the North, all household respondents reported receiving training on savings and also of being members of VSLAs. A number also reported the introduction of the associations as one of the aspects of LEAD from which

Page 31
they have benefitted the most. The VSLAs in the North meet weekly to save the weekly USD 0.50 per household or member and then provide miniloans to members wishing to borrow. They also reported that the loans were usually used to solve domestic problems like school fees or scholastic needs like books and others. Very few reported loans for purchase of agricultural inputs. In the Eastern, Central, and Western Region, POs had also formed VSLA but the enthusiasm was much lower for reasons that include the amounts saved or available for lending are too low; others belonged to SACCOs and other informal arrangements that addressed their needs as they deemed fit. However, in general VSLAs have also contributed to strengthening POs especially in the North where the weekly meetings have gradually been institutionalized. Focus group discussions with PO households also indicated that a number of linkages had been made between POs and produce buyers, input suppliers and financial institutions although they also reported that some or most of the linkages (depending on the nature of the private sector entity) had not always proceeded beyond establishment. In other words, while they had been introduced to financial institutions like Centenary and Opportunity Bank, the interaction of input suppliers and produce buyers with banks had not necessarily resulted in any trade or actual transactions due to a number of reasons. These included: lack of collateral, inadequate produce for bulking, or limited capacity to purchase inputs. Investments in Market Infrastructures Increased Activities under this sub IR consisted mainly of SAF grantee investments in market infrastructure such as warehouse construction and PHH equipment as depicted in Table 6 below.
Table 6: Construction of Market Infrastructures District SME Market Infrastructure
Constructed PHH Equipment Value Chains
Kumi KUDFA 500MT warehouse Shelling Equipment Groundnuts
Bukedia Marsenne 1000MT warehouse Seed cleaner and dryer
Epuripuri Sorghum/ maize
Iganga UGACOF Coffee Washing Station - Coffee Source: LEAD MTE 2011
The team found that under mostly grantee or their own efforts, a few PO and Multi PO have constructed or are in the process of constructing storage infrastructure. In the meantime, they are renting lockups or small stores as they await support for storage infrastructure. LEAD provided technical (financial) assistance for private companies in Bushenyi like Kawacom to construct central washing stations and coffee warehouses that will serve as marketing centers for POs while a grantee, UGACOF is using part of its grant to construct a coffee washing station in the now Lubuka District, three acres of land were purchased and construction is in progress.
It was established from respondents that LEAD has also provided technical and financial support for coffee post-harvest handling to help coffee producers gain international certification in Central and Western Uganda specifically in Mukono and Bushenyi. Cases reported include PHH equipment (Bushenyi) by Kawacom while UGACOF in Iganga is supporting farmers to get certification. In the West, all farmers have been supplied by ACPCU with mats to dry coffee, which has resulted in an increase of the quality of coffee by 12% from 88% to 96% of coffee without residue. Previously, the coffee constituted dust, stones, and sometimes animal droppings. The project has also trained POs and coffee trade associations in management and in agribusiness management

Page 32
The team also established that LEAD also supported through grantees, the establishment of fish market centers in the Western and Central Regions and others in the North for purchase of sunflower and certified seed. Out of all the sub-PIRs under trade capacity enhancement, investment in market infrastructure performed the worst, with all the markers of progress under the sub-PIR underachieved. The magnitude of the underachievement was also large (63 % to 74% below Year 2 targets), suggesting the need for increased attention in this area as persistent underperformance will erode the gains made on the other sub-PIRs and hence achievement of the whole IR 1. Overall Assessment of PIR 1 On the basis of the evidence presented above, the overall assessment is that the intermediate result on enhancing trade capacity lags behind at MTE, with the implication that it is not likely to be achieved by the LOP. Consequently, if the project will continue pursuing the strategies and interventions related to the achievement of the project under this IR, improving access to financial services through the DCA and facilitating the required actions for POs to access financial services become critical. The challenges related to the slow movement on investments in Market Infrastructures have been noted and in the team’s view are equally critical to the achievement of this IR as some of the key gaps along the value chains.
f) Comparison of LEAD and Non-LEAD Households
The MTE collected data from 98 non-LEAD3 respondents selected from all the regions visited and specifically from localities close to LEAD respondents. The key questions to them focused on household characteristics, annual household income, and yield data from farming activities, if any. The inclusion of a limited number of non-LEAD respondents was to get an indication of whether there were any differences between the two populations regarding some of the LEAD’s project outcomes. It is also worth pointing out that although the traditional belief is that those who benefit from LEAD interventions (treatment population) should be better off compared to those not benefiting (control population). This may not necessarily hold true in these circumstances where there are comparable programs such as those implemented by LEAD. There are other initiatives that finance similar activities to LEAD such as the NAADS and other USG projects (e.g., ACDI/VOCA) in many of the sampled districts, which were confirmed by the evaluation team. In fact, the control population in this case may sometimes be better off compared to the “treated” one, especially if it receives a better resource package from several programs other than LEAD.
A further caveat is that for incomes and yields, these were based on reported figures by respondents and should therefore be interpreted with caution. In the subsequent sections and figures, are some of the examples of LEAD supported groups and non-LEAD groups that portray some similarities and differences between the two subpopulations on the aspects highlighted above.
i) Comparison on the Farmers Reported Mean incomes4
Comparison of the mean annual reported income from crop farming by LEAD and Non-LEAD farmers indicated that apart from Apac and Kamuli, LEAD farmers in other MTE districts reported higher incomes. As illustrated in Figure 8, on one hand it can be noted that apart from Mukono, Apac, Kamwengye and Nebbi (where noticeable difference are seen), the rest of the districts display near similar levels of income estimates, whereas in Mukono, Kamwengo and Nebbi, LEAD respondents reported higher incomes compared to the non-LEAD beneficiaries. On the other hand, those in Apac and Kamuli reported lower average incomes compared
3 Non LEAD refers to respondents who reported not receiving any kind of support or intervention from LEAD. They answered NO to the question whether they had interacted, received support or been trained by LEAD staff. 4 Consumption patterns can also be used to assess this welfare outcome as it is deemed to be smoother and easier to
recall than incomes that tend to be lumpy for certain periods of the year

Page 33
to the non-LEAD respondents. The existence of other factors such as operations similar to LEAD, and other opportunities like proximity to better economic opportunities (e.g., Mukono) explain the much higher incomes beyond that attributable to LEAD’s impact.
However, within the districts reporting higher incomes for LEAD versus non-LEAD farmers, the significant differences in income range were between Nebbi in West Nile (Northern) and Mukono in Central Uganda. Looking at the two, the team noted that Mukono is a major coffee producer with lower poverty indices and is more urbanized and nearer to the capital city, whereas Nebbi is comparatively more rural with higher poverty levels and a significant distance away from the capital, although it had access to markets in Southern Sudan and DRC.
Figure 8: Comparison of Income For LEAD And Non-Lead Farmers (Control)
Source: LEAD MTE 2011
ii) Comparison on Reported Average Yields
A look at yield data in Figure 9 below shows that Mukono and Kamwenge, show comparatively higher yield levels for LEAD respondents compared to non-LEAD ones. However, Kamuli (with maize and coffee), Bukedea (maize) and Kumi (ground nuts) show higher yields for non-LEAD farmers. Furthermore, cross tabulation of yield data with mean household income data shows consistency only for Kamuli district but not for Bukedea and Kumi. The explanation for the variance in performance between LEAD and non-LEAD districts is again embedded in the argument of proximity to better economic opportunities. The results of the crosstabulation with mean incomes confirms the case with the consistent results for Kamuli for non-LEAD farmers.

Page 34
Figure 9: Yield Comparisons between LEAD and Non-LEAD Farmers
Source: LEAD MTE 2011
It is important to note that estimating the impacts of an operation such as the LEAD project that are in many ways similar to other programs like NAADS and establishing a plausible causal relationship solely to the project, while controlling for other factors is extremely difficult. Construction of the counterfactual would need a careful understanding of how individuals become beneficiaries of the project, and they would have to be completely isolated from the effects of the other programs. The two sets of samples (LEAD and non-LEAD) can be obtained using probability sampling methods. Since LEAD does not operate in all parishes or counties in the districts, a control group may be obtained from those counties where LEAD is not operating. However, a point to note here is that the characteristics of the two samples would have to be similar at the beginning, and then one would have to be completely isolated from any sort of similar treatment. The methodology for assessments also needs to be the same at the beginning, midterm, and at the end of the project. In the context of the agricultural sector in Uganda, this is currently impossible. As such, the illustrative characteristics highlighted above between the LEAD and non-LEAD respondents do shed some light on the differences between the two in some aspects such as yield and income, with LEAD having a greater impact in most cases but with the reverse scenario in some districts.
g) Cross-Cutting Issues The Role of Cross-cutting Issues in Shaping the Achievement of LEAD Results
This section considers the role of cross-cutting issues in shaping LEAD interventions and the extent to which they influenced achievement of results. These issues were specified as gender, conflict, and youth including orphans and vulnerable children. In order to assess the extent to which these issues influenced the achievement of results, the evaluation looked at participation and the LEAD project benefits accruing to the various social groups such as women, orphans, and youth. Regarding conflict, the issue of whether the uncertainty of peace and stability in Northern Uganda affected results was the major focus. An additional issue that the midterm evaluation looked at was the environment and climate change. The evaluation found that these issues informed LEAD’s interventions and influenced the achievement of the project results. This conclusion is made on the basis of the discussion that follows.
The LEAD Project Design and Cross-Cutting Issues
The design and implementation of the LEAD project has been informed by gender, conflict, and vulnerability issues. The project recognized the different roles women and men played, particularly in the agriculture sector that accounts for 70% of the labor. Design and implementation also recognized the major role played by women in Uganda’s agricultural sector, including roles such as provision of labor input in the production

Page 35
process. With Producer Organizations as the main community institution through which farmers have been reached with LEAD support, the constitution and participation of women within the POs was considered critical to the achievement of project objectives.
The dynamics of the war in Northern Uganda where project resources were to be focused necessitated the need for a strategy that was dynamic in responding to both gender and conflict issues. The design actively included the need to work with and augment the work of other USG projects such as the food for peace projects. In addition, the return to stability after years of conflict, or the regression to conflict would be critical in the extent to which the project results would be achieved. Consequently, the project built in contingency plans should a return to instability be observed. A singular manifestation of this contingency was the introduction of the OVC intervention. Environmental issues were integrated into the project design, including the need to track greenhouse emissions. Although not explicit in the design, weather patterns were a key issue as most of the value chains supported are dependent on rainfall.
The evaluation team noted that while LEAD did not provide for or recruit a dedicated gender focal person in its organization, project implementation duly emphasized gender as a critical cross-cutting issue. This was addressed by mainstreaming gender into the entire project design, implementating all activities to the extent possible, and ensuring that the M&E system provided for a number of indicators at outcome and output levels to track gender disaggregated performance data. The LEAD project team encouraged the recruitment of women facilitators and field officers as well as other staff at its headquarters in Kampala.
To the extent that the LEAD project design would work through POs that also included women both as participants in the governance of POs and direct beneficiaries of services from the project, the design was effective in incorporating gender issues. In addition, the indicative resource plan was for the northern part of the country to receive the bulk of the resources under the project to address issues of vulnerability arising from the war. The orphans and other vulnerable children component would also assist in reaching orphans, youth (and other vulnerable children), and assist in improving their livelihoods. Although it was anticipated at the design stage that greenhouse emission would be monitored during the course of the project, the midterm evaluation did not find evidence that this was happening. The drip irrigation practice for some crops and some agronomic practices (such as mulching that were designed as part of Technology Observation Ponds and Plots) addressed issues of changes in weather patterns, especially rainfall. Hence, the overall assessment in regard to the extent to which the project interventions were shaped by cross-cutting issues is that the design adequately incorporated these issues.
Participation and Benefits as They Relate to Cross-Cutting Issues The LEAD project design is such that there are services and resources that all PO members access irrespective of gender. These services and resources include training under the Farmer Field Schools, Technology Observation Plots and Ponds (TOP), and participation in linkage activities such as deciding on the produce buyer to sell bulk commodities to. Further, all PO members are exposed to link with financial institutions as well as with input suppliers and traders. This means that women as a group directly benefit and influence the achievement of the results via participation and production in the context of the PO. Figure 10 depicts the participation of women and men in the various VCs.

Page 36
Figure 10: Female Percentage of Total PO Members per Value Chain
GENDER COMPARISON BY VALUE CHAIN WITHIN PRODUCER ORGANISATIONS
46 46
6355
4550
4454 54 55
5060
41
51
010203040506070
Beans
Cassa
va
Coffee
Fish
Gro
undn
uts
Maize
Mille
tRic
e
Simsim
Sorgh
um
Soyab
eans
Sunflo
wer
Sweet p
otatoe
s
Total
%Men %Female
Source: LEAD MTE 2011
The MTE noted that apart from the coffee and sunflower value chains which had more male representation. in the rest of the VCs the participation rates were not very different between men and women. In terms of accessibility to services, it is clear that POs and their members benefited from almost all of LEAD services. Table 7 shows the different categories of beneficiaries accessing services under the various LEAD interventions. Table 7: Services Accessed by Category of Beneficiary INTERVENTION CATEGORY OF BENEFICIARY ACCESSING SERVICES Production and PHH Technology generation and dissemination through FFS All PO Members
OVC Groups Grantee PO members
PO strengthening All PO Members OVC Groups Grantee PO members
Private Sector Input supply system strengthening Input suppliers Agricultural Training (informal and formal) All PO Members
Grantee PO members OVC groups
Market development All PO Members Grantee PO members Input suppliers, stockists Produce Buyers
Agricultural investment promotion All PO members Produce buyers Input suppliers Financial Institutions
Agricultural finance Grantee PO Grantee Input suppliers Financial Institutions
Agro processing Grantee produce buyers BDS strengthening BD Service Providers Small scale Marketing and Storage Infrastructure support PO and Multi PO
Produce Buyers SAF Grantee PO
Grantees Source: Mid Term Evaluation 2011

Page 37
In addition, the team established that because the SAF interventions are tailored to grantee core operations, LEAD grantee female beneficiaries access services that other beneficiaries will not (e.g., PHH equipment like tarpaulins and shellers). The team established that this was not deliberate but was not an intended outcome of the SAF intervention. The team also established that POs with female members were also adopters of bulk marketing practices, though the percentage of women in these POs was much the same as for other POs, (i.e., in the 30% range). With regard to the manner that gender influenced implementation, the evaluation team observed that there were some, albeit unique, specific interventions that focused on enhancing the role of women in LEAD activities. Such examples included: (a) The Reduction of “Female Time Poverty” (time spent by women doing drudgery work adding to their helplessness and poverty), which intervention was reported by respondents benefiting from a grantee, Victoria Seeds in Gulu district. The activity has decreased the time spent by LEAD women beneficiaries in land preparation by providing subsidized tractor ploughing services before the planting season. About 500 acres were ploughed in one season; (b) Training women farmers on animal traction and provision of ox ploughs; (c) Provision of improved seed to vulnerable categories of women (widows, caregivers, and household heads) in OVC groups. In the North, about 30% of PO Chairpersons were women, and although the numbers are low, women still played a key role in shaping the governance of the POs. The team was informed that female participation in PO activities was influenced by the gender composition of the PO leadership. Accessibility to services became an issue where the chair, secretary and treasurer, or nominated decision makers were all male. OVC and Youth Interventions Regarding OVCs and Youth, there are services that directly target these groups. The OVC program under LEAD ensures that these groups are deliberately and actively sought out and targeted with interventions. More explicitly, these groups access demonstration materials, fertilizers, seed and ox ploughs, financial services, and others. The OVC groups, whose composition has a major proportion of females by virtue of the vulnerability assessment and screening process (widows, PLWA, and other vulnerable groups), receive training in caregivers’ package in addition to forming caregivers associations. LEAD provided support to facilitate OVC Group generation of income through training using the FFS approach, in various areas including animal traction and provision of inputs like improved seed per group and in some districts (like Gulu) per household. Other support included: provision of ox ploughs as a contribution and incentive to facilitate animal traction practice; establishment and operationalization of VSLA in OVC groups, with group members reporting weekly contributions of UGX1000 (USD 0.50); training on vulnerability- care giving, household gardening, counselling, entrepreneurial skills, appropriate nutrition and HIV AIDS, life skills, and psychosocial support. In addition, LEAD fostered linkage between the OVC groups and service providers within overall LEAD strategy framework—including Financial Institutions, input suppliers, produce buyers, and referral hospitals. The evaluation noted that to date, a number of OVCs and youth had been reached with technical and material assistance. An estimated 20,000 OVCs had been reached with social and technical assistance as of MTE,

Page 38
while 8,464 households with OVCs had been reached with agricultural inputs. Both achievements were well above the set targets for 2010, at 15,000 and 5000, respectively. Youth apprenticeship programs were assisting in providing labor market skills for youth, with some youth reported getting employed soon after completion of the apprenticeship training. Female PO members in the North were of the view that they had benefitted more than the men had because in their view the men were not always fully committed to the PO activities unless there were free inputs for distribution or when they needed to access loans from the VSLA. The manuals related to the care and the mentoring of youth are likely to have an institutional effect, provided they are applied. Nonetheless, the impact of these interventions is not readily apparent; although the beneficiaries indicated that they had been able to improve their yields and improved food security at the household level.
a) Changes in Weather Patterns and Food Security for OVC Households While situations of adverse weather have affected farming efforts in the last two years, OVC households report a comparatively more stable food security situation especially when compared to IDP camp life. In some places, especially the North, yields were affected due to either too much or too little rain. Although the magnitude of the effect of inclement weather on crop production was not estimated, these had an effect on the overall volumes of produce. Farmers interviewed in the northern districts indicated they had experienced these effects in the last two seasons. Consequently, these changes in the rainfall patterns definitely affected the achievement of the LEAD project results. b) Post-Conflict, LEAD Interventions and Results LEAD design required that the project channel a larger proportion of TA resources (60%) to the Northern Region. This was because the Northern Region, especially Acholi and Lango subregions, were emerging from two decades of conflict that had led to internal displacement of people. LEAD is also obligated to ensure that a specific proportion of US aid is directed to the poor communities. LEAD design had anticipated a slow return to peace and stability, but fortunately, the return from IDP camps occurred faster than had been anticipated. This meant that LEAD had to reorient planned interventions from supporting resettlement to addressing a post- conflict situation. This is shown in the Table 8 below. Table 8:Post-Conflict Status Influenced LEADS Results
Post-Conflict Situation LEAD Results* Nature of Influence
Returnee status Increased Agricultural productivity Improved Trade capacity Enhanced competitiveness
The above should be looked at in the context of the process results highlighted in question 1.
Provided opportunity for PO mobilization within homes
Enabled FFS training within farm vicinity Provided a comparatively more stable
learning environment Provided opportunity for enhanced food
security Limited service delivery
Provided opportunity to fill gaps for service outreach
Provided opportunity for partnerships establishment
Provided opportunity for building on past and ongoing USG effort
Transition from handouts to self-sustenance
Provided opportunity for households to try and put into practice acquired skills and knowledge

Page 39
Post-Conflict Situation LEAD Results* Nature of Influence
Accelerated process of transition to normalcy
Provided foundation for empowerment Limited or no household asset base
Spurred interest in the training and linkages with service providers
Provided stimulus for engagement in activities that would enable accumulation
Source: Lead Mid Term Evaluation 2011 d) Concluding Note on Crosscutting Issues The evaluation noted that cross-cutting issues shaped both the design and extent of achievement of LEAD results. More precisely, the design was adequate in terms of integrating cross-cutting issues into the project. The quick return to stability in the Northern Region may have hastened the pace of implementation as more and more people were mobilized into POs. In view of the presence of OVCs, especially in the North, deliberate interventions via the OVC component were designed and implemented to address OVC and youth needs. Inconsistent weather patterns in some parts of the country affected yields, and hence some of the outcomes that the LEAD project sought to influence.

Page 40
4.0 EFFECTIVENESS OF THE LEAD STRATEGIC ACTIVITY FUND (SAF)
Question 3: How Effective is the LEAD Strategic Activity Fund (SAF) as a Tool for Leveraging Private Sector Resources to Improve Service Outreach to End Users of the Program The SAF was designed to complement technical assistance activities, leverage private sector resources, and contribute toward achievement of project objectives/targets. The SAF was to operate through public-private partnerships (PPPs) arrangement, to provide matching grants aimed at strengthening market actors across selected value chains. The grants were expected to play a catalytic role in the LEAD approach for Producer Organization (PO) development, an added incentive supporting Farmer Field School (FFS) training. The SAF accounts for US$12.7 million, representing approximately 36% of LEAD project resources. The MTE SOW required an assessment of the effectiveness of the LEAD Strategic Activity Fund (SAF) as a tool for leveraging private sector resources to improve service outreach to end users of the program. In order to assess this, the midterm evaluation team looked at a number of factors to gauge the effectiveness of the SAF. These included the following: (a) the amount of resources committed by the LEAD project compared to contributions by private sector agencies; (b) extent to which the project was able to extend its service outreach to end users via the SAF grants; (c) the extent to which the SAF played a catalytic and facilitative role for strengthening the various value chains supported under LEAD; and (d) the SAF governance framework.
Level of LEAD Resources and Private Sector Matching Grants By the MTE, a total of 42 grants had been awarded. A total of US$11.2 million had been leveraged in grants by the MTE time. A breakdown of the leveraged resources is provided in Figure 11
Figure 11: Amount of Private Sector Resources Leveraged
Amount of Private Sector Resources Leveraged (US$ million)
1.174
1.585
3.388
5.026
11.173
0 2 4 6 8 10 12
Finance
Aquaculture
Coffee
Staples
Total
US$ million
Source: LEAD Annual Project Progress Report 2010
The value chains that include cereals, pulses, root and oil crops, and horticulture/vegetables benefitted most from resources leveraged with LEAD financial services, whereas the aquaculture chain leveraged the least. A review of the resources committed by LEAD against grantee commitments indicate that the project has been effective in bringing more resources on board to extend the program’s reach. According to LEAD staff, the proportion of funding leveraged through the public-private partnerships is in the range of 40:60. The team however proceeded to physically check and compute the ratios using the records provided in the LEAD annual progress report 2010.

Page 41
The summary analysis by the MTE is provided in the following Table 9.
Table 9: Resources leveraged through Grantees Year Targeted Number of
Grantees No of Grantees Committed
USD Leveraged
USD 2008/2009 NA 23 NA NA 2009/2010 40 19 3,860,082 NA Total 7,280,000 10,854,1605 Source: LEAD MTE 2011 Computation from LEAD Annual Progress Report 2010
Note: 2 grantees were suspended and asked to refund grant resources that had been extended to them.
This means that for every US$1.00 that LEAD has invested in the SAF activities to date, grantees have mobilized US$1.5. Consequently, more funds have been made available than would have been the case if the SAF was not undertaken. Hence, the MTE concluded that the SAF has been effective in mobilizing additional resources to implement activities and contribute to the achievement of LEAD objectives.
Extent to Which the Project was Able to Extend its Service Outreach to End Users via the SAF Grants As noted in the foregoing sections, the SAF grantees have been able to mobilize POs and implement activities that contribute to the achievement of the project objectives of increasing production, competitiveness and trade capacities. It is projected that an additional 272,773 farmers will have been reached by the end of the project through SAF grants. If all the activities under the current grants are implemented successfully, these figures would represent 45% contribution of the SAF grant to the achievement of the targeted 600,000 persons reached with support under LEAD. In terms of allocation of resources, the MTE found that of the 42 grants made, twenty-five were in the North (59.5%), while 17 were in the East and Western Regions (40.5%). The evaluation team’s assessment is that the SAF was indeed effective in extending service outreach to end users of the project.
As a result of the SAF activity, grantees increased the coverage of POs exposed to LEAD interventions, although in some cases there were cases of duplication where LEAD and the Grantees were targeting the same PO such as those in Dokolo. Some grantees provided support to SMEs involved in retail activities such as stockists of seed at subcounty level. In almost all cases, grantees made serious efforts to ensure that the grants went a long way in expanding their core business activities. The team also came across a few cases where Grantees exploited emerging windows of opportunity. For instance, in one case a grantee, obtained seed cleaning machinery that facilitated the procurement of a contract with Nile Breweries, elevating them from the position of intermediaries to directly contracted suppliers. The same grantee also realized later on that the machinery they had obtained could be dual purposed to deal with more than one commodity; consequently, the grantee has now penetrated the maize business and plans to export produce to countries in the region. The SAF Role in Strengthening the Value Chains Supported Under LEAD The SAF directly complimented LEAD’s ability to achieve its value chain transformation goals through the following: (a) Grantee use of discretion to reach beyond the limits of technical assistance and deliver variety of other
inputs and materials where this became necessary and appropriate; (b) Response to selected windows of opportunity for removing critical value chain bottlenecks and enabling
small and medium scale investments in infrastructure equipment and research;
5 This figure is different because of the exclusion of 2 suspended grantees

Page 42
(c) Deployment of a variety of strategic incentives to elicit positive and productive behavior change among value chain participants.
As noted above, grantee key initiatives include activities for certification of coffee seeds, research on various farming practices such as mixed cropping, purchase of machinery to assist in post-harvest handling of produce to improve trade competitiveness, strengthening research for certified seed production, among others. The team has also established that the SAF has operated as a cross-cutting component supporting various value chains. Out of the 42 VCs, 18 were in cereals, pulses, root and oil crops representing 42.9% of all grants, 13 in coffee (30.9% of grants), 7 in aquaculture (16.7%), and 4 in financial services (9.5%). Through LEAD SAF grants and its own matching funds, grantees strengthened POs through the enhancing of management skills and agribusiness development through PO training in the areas such as available bank products, prudent borrowing, and Business Development Services. grantee POs were trained by grantee FF using the FFs on various value chains such as rice, sorghum, groundnuts, beans, maize, and coffee on good agronomic practices. Grantees also set up Technology Observation Ponds and trained farmers in various areas of aquaculture. In addition, the team found that training was also conducted on PHH technologies focusing on improving quality of the produce for marketing and the grantees supplied PHH equipment like shellers and sorghum seed from Nile Breweries. All this contributed to the achievement of the LEAD objectives. SAF Contribution to LEAD Objectives A number of areas of contributions may be mapped directly to the SAF grants. First, with regard to PHH marketing infrastructure and strengthening of farm input supply systems, warehouses, marketing centers, and agro processing facilities, grantees were involved in procuring seed and PHH equipment as well as supporting bulking initiatives. In the Eastern Region grantees also procured maize shelling and grain processing machines. Another grantee UGACOF has acquired additional land for construction of a washing station for coffee. Second, Grantee staff received training in financial management and procurement. These activities are designed to improve trade competitiveness and hence key LEAD outcomes. Third, although the changes may not be attributable to SAF activities alone, coffee yields under grantee support registered significant yield increase from 0.5Kg per tree as indicated in the LEAD baseline to over 3Kg per tree surpassing the target of 1.5kg increment. In terms of yield per acre, this increase represents a change from 222kg to over 1,332 kg per acre. Fourth, additional services beyond those in the nongrantee services have been availed to POs, including certification for coffee and maize, higher prices for good quality produce and the Female Poverty Time activity that availed subsidized tractor mechanization services for women so as to reduce labor requirement for land preparation. Box 5: SAF Support toward Trade Competitiveness Source: LEAD MTE 2011
Following LEAD support to ACPCU, the grantee produced written and audited books of accounts in addition to being transparent with democratically elected leaders. As a result, ACPCU was linked to the Fair Trade System, under which traders/buyers pre-financed ACPCU producer with US$ 100,000 advanced at a fair negotiated interest rates on the strength of its ability to deliver. ACPCU is also in the process of negotiating with another buyer in Germany identified by LEAD to whom two containers have been shipped (one container equivalent to UGX 89m). Due to better prices offered by ACPCU, farmers are no longer selling coffee in their gardens before drying it, which could affect coffee quality and coffee farmers no longer sell land to get school fees. Farmers have increased savings through e their own societies/POs and can now extend credit among themselves and ACPCU has created over 20,000 jobs due to coffee business.

Page 43
The Governance of the SAF On the basis of documentation review related to the process of selection of subgrantees, the evaluation found that the procedures were sound, and consistent with a fiduciary management framework to ensure resources were used for the intended purpose. Nonetheless, some stakeholders interviewed expressed concern over the lack of transparency in the selection of the subgrantees. This was because once the SAF was advertised, all other critical processes were handled internally by LEAD with misgivings that staff involved may be influencing decisions against or in favour of certain agencies. The team noted that this internal process is not very different from grant awarded activities in other USG interventions. The evaluation concluded that while there may be no wrong doing in the selection of the grantees, these perceptions undermine the credibility of the whole process. In the view of the evaluation team, because mechanisms to ensure objectivity were in place and had worked well to date, and the fact that a review and evaluation committee was operational, and facilitated the determination of whether the proposal met the required criteria based on a team rather than individual assessment, negates this perception.
Nonetheless, one option to address the transparency issue would be to include competent stakeholders external (to LEAD) to sit on the technical review and evaluation committee. These may be representation from other USG effort or agencies with a stake in the project. However, for control purposes, the number should not exceed two representatives and their role should be clearly spelled out and understood by all the parties involved at the onset. Furthermore, inclusion of Government of Uganda representation is likely to raise issues related to the need for allowances for their participation, which cannot be done according to current USG guidelines.
Another issue of concern to some stakeholders was that a lot of funds were provided to agencies that already had capacity. However, the justification provided for this was that these agencies were credible, and had the capacity to reach more farmers and also met the cost share requirements.
An allied issue was the framework for ensuring adherence to the contracts signed between grantees and LEAD. The MTE found that some grantees did not always adhere to the provisions of the contractual agreements. A case in point is a grantee whose Field Facilitators were supposed to mobilize POs, support their registration, and train them before handing them over to LEAD FFs. However, the grantee did not do any mobilization and carried out registration of PO members at produce-buying centers. The team established that the main activities that essentially constituted grantee FF’s main interaction with farmers was when they were delivering seed for sale at the beginning of the season and when they returned to purchase produce after the harvest. Overall Assessment of SAF The MTE team’s assessment was that the SAF component had been effective in leveraging private sector resources to reach more farmers and business entities with a view of strengthening the VCs. The SAF was also effective in facilitating various services to the value chains, including support for dialogue sessions, provision of skills and equipment to improve business capacity, and competitiveness. Finally, the evaluation team’s opinion of the SAF governance procedures is that they are well within the approved LEAD framework. However, in view of the sentiments that have been raised by some stakeholders, measures to improve transparency of the entire process as suggested above would go a long way in presenting a fair framework for SAF management and implementation.

Page 44
5.0 COORDINATION WITH OTHER USG AND DONOR EFFORTS Question 4: How is LEAD’s Implementation Coordinated/Synchronized with Other USG Efforts and Other Donor Activities Aimed at Improving Agricultural Productivity in Uganda? According to the LEAD contract and work plan, one of the strategies to facilitate optimal synergy development as well as establish mutually beneficial partnerships that would contribute to LEAD goals accomplishment was to ensure implementation of interventions was coordinated and synchronized to maximize opportunities for leveraging resources for complimentary activities. To this end, LEAD was supposed to combine efforts and cooperate especially with ongoing USG efforts and other donor or Government of Uganda (GoU) activities (according to the initial award contract) focused on improving agricultural production in Uganda. This section reports the results of the consultation, especially with respect to the MTE SOW requirement to assess the extent to which LEAD coordinated with other USG and other donor initiatives. It draws on the outcome of interactions with a spectrum of key informants from NGOs, GoU functionaries, including USAID Mission staff. The USG projects that were consulted as part of the MTE were the Market Linkages Initiative and ACDI/VOCA. Other key agencies consulted active in the agriculture sector were the ABi Trust supported by Danida and other donors (IFPRI and IITA). The information obtained has been summarized into a stakeholder analysis matrix in Annex C that captures stakeholder identity, their interests, their definition of opportunities and understanding of the strategy and mode of operation, and an assessment of what synergies were developed, worked (and the reasons why), and lastly what could have been done differently. The evaluation team found that LEAD has indeed established partnerships that have created opportunities for synergy especially with USG efforts that include ACDI/VOCA and Market Linkages Initiative among others. A critical strategy for LEAD to be able to achieve its objectives was the extent to which the project would create a framework to partner with other agencies and USG projects. More precisely, coordination was expected with Food for Peace Title II Food Security projects and the Peace and Reconciliation programs. Coordination with programs supported by government and other donors was also expected. The evaluation found that commendable strides had been made to facilitate partnerships. For those agencies where collaboration with LEAD existed, elements that were said to be working included capacity building for POs and subgrantees, the benefits from the results of research in the coffee VC, enhanced quality of products due to purchase of processing equipment, facilitation, of networking among agro-input dealers and working through stakeholders to reach more farmers. The main reason was that the relationships were based on formal contracts. The team established that partnerships with formal collaborative agreements, involving cost sharing and mutual accountability such as those with IITA, AK Fats and Oils (Mukwano) and other subgrantees were more effective than those without agreements. There were specific outputs such as research results and the number of Producer Organizations reached that would potentially contribute to the achievement of LEAD and system-wide outcomes associated with formal arrangements. Partners consulted were asked to rate the extent to which they saw LEAD partnered with other agencies. The ratings were based on a Likert scale, taking the value of 1 if they perceived performance to be poor, 2 when it was good, and 3 when it was very good. The results are summarized in Table 10 below:

Page 45
Table 10: Assessment on LEAD Linkages with Other Development Initiatives # A. LEAD Performance Average
Score Remarks
1 Establishment and maintenance of strategic linkages 2.3 They are good at facilitating linkages. They are like “the spider in the web” looking for constraints and bring everyone around the table. They deliver their part of the bargain.
2 Facilitation of cross component linkages and strategic focus
2.3 Work on research in various commodities naturally leads to improvements in the rest of the value chains. They are ‘going overboard’ on some of the VCs, including work done by other USG projects-e.g. construction of warehouses.
3 Collaboration with Government stakeholders & USG projects
1.7 Very little if any collaboration with MAAIF and its Agencies-e.g. NAADS as well as LGs. Not actively promoting collaboration with Government institutions. Collaboration with other USG projects at the local level can be improved
Overall 2.1 B. LEAD Self-Assessment
1 Establishment and maintenance of strategic linkages 2.5 Project has tried to create linkages. How effective the linkages are have depend on performance of partners
4 Collaboration with Government stakeholders 2.5 There is some collaboration but not significant.
Overall 2.5
Overall for both categories 2.3
Key on score: 1=poor;2= good; 3=very good, Source: LEAD MTE stakeholder consultations, 2011 Source: LEAD MTE, 2011 Beyond coordination with other USG-funded efforts, LEAD was to collaborate with other GoU activities focused on improving agricultural production in Uganda. In this regard, stakeholders at the district level had limited knowledge about LEAD’s overall strategy as a result of their low interaction with the project. The national level stakeholders had a good understanding of the LEAD strategy, although some of them were only aware about the element they interacted about with LEAD. The level of interest in collaborating with LEAD varied by type of partner. For example, private sector agencies’ interest lay in expanding their customer base, sales volumes and achieving negative entropy (ensuring inputs were available to drive production), while similar projects to LEAD focused on synergy and avoiding duplication through sharing of information. The private sector agencies, mainly SAF subgrantees, defined their opportunities around the already existing potential to increase sales as there were already organized farmers that would demand agro inputs. At PO the level, the opportunity lies in the potential increase in production, getting linked to existing markets, and hence the possibility of increasing incomes. Government, CSO and USG-funded projects saw opportunity in working together to avoid duplication of effort, and to increase their capacity to reach more beneficiaries. Sharing of information was said to be particularly useful in determining reliable subgrantees and POs being supported by which organization. However, there is a perception that the participation of government agencies is uniformly decreasing not only for the LEAD project but also for USAID-funded projects in general. This finding has implications on the sustainability and connectedness to broader sector initiatives in the agriculture sector. Although it was argued by internal project stakeholders that the presence of “economic interest” would be the basis for sustainability, rigidities within the agribusiness subsector, underdeveloped capacities by farmers to bulk, and associated inefficiencies will be formidable challenges in the short to long term (INSPIRED, 2009).

Page 46
Regarding what needs to be done differently on partnership, stakeholders indicated the need to address several aspects. First, they suggested the need to strengthen complementarily of effort, especially for USG-funded projects involved in similar activities. The key principle for division of labor should be the comparative advantage of the partners working in the same geographical areas and within links of the value chain. Second, their argument was that more attention should be paid to strengthen POs to organize and bulk in order to address a key gap in the value chain. Given the experience with AK Fats and Oils, one of the partners where farmers regressed to individual contracts as soon as the cooperation between LEAD and AK Fats and Oils ended is a good example. Third, there were views that LEAD needed to work more with government agencies such as NAADS and local government structures to ensure connectedness with broader and established systems in the agricultural sector. Fourth, LEAD should look for key gaps in the value chains and focus on strategically addressing them rather than addressing all the gaps along the length of the value chains. Focusing on a selection of VCs should also assist in achieving focus. Fifth, since there was a lot of learning already happening from LEAD implementation (e.g., work on VC assessments), the need to ensure these are archived properly, such as through putting them on the World Wide Web, should be encouraged. Implications for the USG Feed the Future Strategy
The USG Feed the Future (FTF) strategy seeks to contribute toward the goals of reducing poverty by 50% and reducing under nutrition by 50%. Achievement of these goals will aid in meeting the Millennium Development Goal (MDG) 1. For Uganda, which is one of the twenty countries selected for assistance from the USG under FTF, the focus in is on three strategic value chains—maize, coffee, and beans. The FTF also focuses on a number of programmatic issues including capacity building, promotion of public-private partnerships, agricultural research, policy and enabling environment, working with smaller farmers in POs, agro-input supplies, market information systems, and nutrition programs. The LEAD project’s design and experiences should therefore serve as stepping stone for future similar operations. Specifically, the findings of the MTE have the following implications for the operationalization of the Feed the Future strategy and other future similar strategies in Uganda:
Design: The results of the MTE confirm the relevance of the LEAD project. They suggest that the issues being addressed are key in removing agricultural constraints and hence may contribute to increased productivity, improved trade capacities, and improved food security and incomes for households;
Capacity Enhancement: The observed weaknesses in the SME subsector suggest that attention needs to be paid to continued development of this subsector. This sector is seen as critical in the transformation of the agriculture sector in Uganda;
Working with Government: Since the FTF strategy is premised on working with host governments. The observed low collaboration with government agencies by the MTE implies that deliberate efforts need to be made to ensure strong collaborative links are forged with the Government of Uganda at both policy and operational levels. To this end, the Strategic Activities Fund (SAF) framework currently focused on public-private partnerships may need to be expanded and or modified to include interactions with key public sector agencies critical in agriculture development in Uganda;
Accountability for results: The MTE noted that some of the POs supported by LEAD were also being supported by other agencies. This poses challenges in terms of accountability for results. Future operations would need to account for these aspects. In addition, requirement for impact evaluations need to be an integral part of the program designs to demonstrate effectiveness;
Synchronization and Collaboration: Given the need to achieve complementarities among USG and other donor-funded initiatives, clear frameworks for collaboration with areas of responsibility and

Page 47
accountability with accompanying governance tools such as Memorandum of Understanding (MoUs) to avoid duplication of effort will need to be instituted

Page 48
6.0 EFFECTIVENESS OF LEAD’S MANAGEMENT STRUCTURE AND STAFF COMPOSITION
Question 5: How Effective Is LEAD’s Management Structure and Staff Composition The MTE SOW required the team to assess the effectiveness of the LEAD’s management structure and staff composition. Some of the key components to be assessed included:: conducting a systems check; assessing the appropriateness of the staffing structure and composition; resource planning process; M&E procedures and standards; grants management procedures; and overall project management environment. The assessment was done on the basis of comparison of the project design and the services it was supposed to perform with the management structure and staff composition. A reflection on the originally expected delivery mechanism involving partners was also performed. Staffing Structure and Relevance
The LEAD management structure (see Figure 12) is a hierarchical tiered arrangement based on specific functions and management of LEAD activities. There is provision in the structure for delivery of activities derived from the results framework. There is a clear reporting structure and provision for close monitoring of activities in the North through the establishment of a field office there. The structure is demarcated along technical, administrative, and support functions. The technical positions relate to the value chain component, and there is linkage of integrated production with both the POs and FFs to the results framework PIRs and/or sub-IRs envisaged to lead to increased agricultural production functions. There is also provision in the structure for key issues such as the DCA, warehouse construction, and the OVC component. In view of this, the MTE team’s conclusion was that as currently designed, the management structure was linked to the project design and therefore relevant. However, it is also important to note that the structure has evolved since project start-up, largely based on flexibility, what LEAD management perceived to be the changing needs of the project, and its context. Further, operationalization of the management structure was affected by a number of issues described below.
Effectiveness of the LEAD Management Structure in Facilitating Achievement of Project Results
A key MTE question regarding the management structure had to do with whether or not it was effective in facilitating the achievement of LEAD objectives. This implied the mapping of functional entities to the project core accountabilities around project results that would directly contribute to the achievement of the LEAD intermediate outcomes.
Overall, the evaluation team noted that notwithstanding the changes that the management structure experienced, it was to a large extent adequate and relevant. This assessment is made on the basis of the following observations:
a) Facilitation of Achievement of Project Results: Thus far, the project had managed to set up systems that facilitated the delivery of project results. The achievement of most of the LEAD project results, with the exception of two sub -IRs on increasing trade capacity and sub-IR 3.4 on development of public-private partnerships, suggested that the structure was effective in deploying resources and facilitating key linkages to deliver the project. The nonachievement of these sub-IRs had, in part, much to do with exogenous factors such as changes in international commodity prices beyond the control of the project.. However, some of the internal management issues included delays in the operationalization of the DCA and challenges with securing warehousing services managed by some key partners;

Page 49
b) Setting up and operationalization of management support systems: The evaluation team found that systems had been set up to ensure delivery of the project. These included the application of the SAF procedures, a relatively functional monitoring and evaluation framework, although data and feedback to stakeholders at the district level could be improved;
c) Adaptation of the structure: Although initially the structure was overdesigned and heavy at the top, with six director level positions, the modifications made during the course of project implementation have enabled a relatively effective implementation of the project activities to achieve results. For instance, at the time of the MTE, only three of the six director positions had been retained from the original structure— Agriculture Unit, M&E/SAF and Financial Services;
d) The staff composition: This reflected both academic competencies and working experience that was commensurate with the demands of the project. This was true for staff at director/manager level and technical staff below them. This enabled informed technical advice on both policy and operational aspects of the project. This was said to have assisted in resolving implementation challenges such as on how to effectively support POs during the initial period of the project. Although the MTE team could not verify extent of teamwork amongst the project functional subunits, interviews with staff revealed that periodic orientation and review meetings assisted in achieving focus on achievement of results;
e) LEAD management—USAID Mission interface: To the extent that the quality of achievement of project results was a mutual responsibility between LEAD management and the USAID/Uganda Mission, the evaluation team found that the contract agreement offered one of the most important governance instruments. Technical support from the USAID/Uganda Mission was rated satisfactory by LEAD staff, citing responsiveness of the COTRS, and support provided during policy meetings with other stakeholders.
Challenges and Lessons
The MTE team found that despite the fact that the project management structure was to a large extent appropriate, a number of challenges were also observed. These emerged from both the project environment as well as internal project system weaknesses, as highlighted below:
a) Underdeveloped SME sector in the agribusiness sector: As a result of weaknesses in the expected intermediaries, reaching project end users (POs and their members) with services necessitated the recruitment of about 350 Farmer Filed School Facilitators to respond to this gap. This cadre was not anticipated at design and had the impact of costs to the program delivery mechanism. An analysis of the project expenditure as of MTE revealed that approximately $0.49 was required to deliver $1 in program funds. On the basis of this, the evaluation team considered this to be a relatively high transaction cost.;
b) Partnerships for Implementation: At entry, key partners such as the Catholic Relief Services was expected to provide part of the infrastructure to mobilize communities through Producer Organizations. However, these partnerships did not last for reasons that may be best described as differences in philosophies. This had the same effect as weaknesses in the SME subsector on the ability of the project to deliver services to the end users, like the limited availability of SMEs described above;
c) Limited Impact of Efforts to strengthen BDS and SMEs for supporting POs: The expectation that the LEAD project would strengthen SMEs to support POs was credible with regard to identification of a gap in the subsector concerned, but difficult to implement. More explicitly, although attempts were made to develop BDS capacities and link them with POs, high turnover of the SMEs tended to weaken this anticipated support mechanism.

Page 50
Nonetheless, despite the above challenges, the evaluation team found that the project responded in time. The recruitment of the FFs assisted in ensuring that core project services were delivered to POs and hence contributed to the achievement of project results, albeit at an additional cost not initially anticipated.
The evaluation team learned that the FF cadre will be phased out beginning April 2011. It was also reported that key farmers in POs are expected to take the role of the FFs. The assessment of the MTE team is that this represents a potential threat to achievement of project objectives post midterm, and suggests that a phased approach may assist in ameliorating the effects of a total FF withdrawal. For the medium to long term, riding on the strengths of other players with a network of extension workers may be the way forward, provided these partnerships can be sustained.
Assessment of Selected Management Subsystems in Contributing to Achievement of Project Results
M&E Procedures:
The MTE noted that M&E plans were outlined in the LEAD PMP, and were designed to facilitate collection, analysis, and reporting progress toward objectives via performance targets. This information is key to managing results,and overall improvement in project performance. The evaluation found that data were being collected and analyzed regularly to report on project progress. At the senior management level, the MTE learned that results from the M&E system were used to inform programming decisions. However, the MTE observed that while there was evidence of results being reported to the USAID Mission, feedback of information with partners and project beneficiaries was less evident. Dissemination of results to stakeholders, especially to government offices as well as LEAD community and district level staff did not happen consistently.
Furthermore, the MTE noted that there were data quality problems or that some of the performance targets were set too low, creating the impression that achievement so far recorded was unrealistic. In addition, there are some indicators such as emission of greenhouse gases which did not have an associated strategy for data collection and analysis. Thus, a complete review of the 69 project indicators may be useful. The aim should be to determine a core set of indicators that are monitored for program accountability to get the project focused on collecting information that is relevant for both management decision making and assessing progress toward key results.
A deliberate strategy to disseminate information would assist in improving information sharing and facilitate more transparent implementation and accountability. As such, adopting a more participatory M&E framework would assist in deepening accountability for quality of service delivery.
Grants Management Procedures: The Strategic Activities Fund (SAF) is a key component of the LEAD project. It compliments TA activities, leveraging private sector resources, with a view to contributing to project objectives. The SAF has been key in facilitating public-private partnership (PPP) with the grants provided assisting to strengthen the capacity of market actors in the different value chains. The grants management cycle follows a six-stage process starting with public notice through to close-out. Currently, LEAD staff conducts the evaluation of proposals/submissions, preaward and negotiation and award. Due diligence was said to be strictly applied to prevent lapses. This includes conducting internal compliance reviews (ICR) on the use of funds, as well as procedures within subgrantees and taking corrective action when necessary. On the basis of documentation review related to the process of selection subgrantees, and as noted above, the evaluation found that the procedures in place had succeeded in ensuring a measure of effectiveness in the management of the SAF. The evaluation team concluded that while there may be no wrongdoing in the selection of the grantees, the negative perceptions cited by some stakeholders could undermine the credibility of the whole process.

Page 51
Overall Assessment of Management Structure
The MTE’s overall assessment of the LEAD project management structure was that it was appropriate and relevant. The structure has been effective so far in facilitating the achievement of project results, thanks to the development of functional subsystems that have worked relatively well within the available constraints to facilitate the production of project outputs and services. Although a number of operational and contextual challenges impacted on the ability of the management structure, the structure has been dynamic in responding to emerging needs, and has adapted to ensure achievement of results. Nonetheless, the MTE found that a key implication for an operation such as LEAD was that a reliable and effective extension mechanism was a necessary prerequisite from the beginning. Further, while the envisaged use of BDS/SMEs as intermediary agencies for the project was a credible expectation, it required demonstration before entry.

Page 52
Figure 12: LEAD MANAGEMENT STRUCTURE
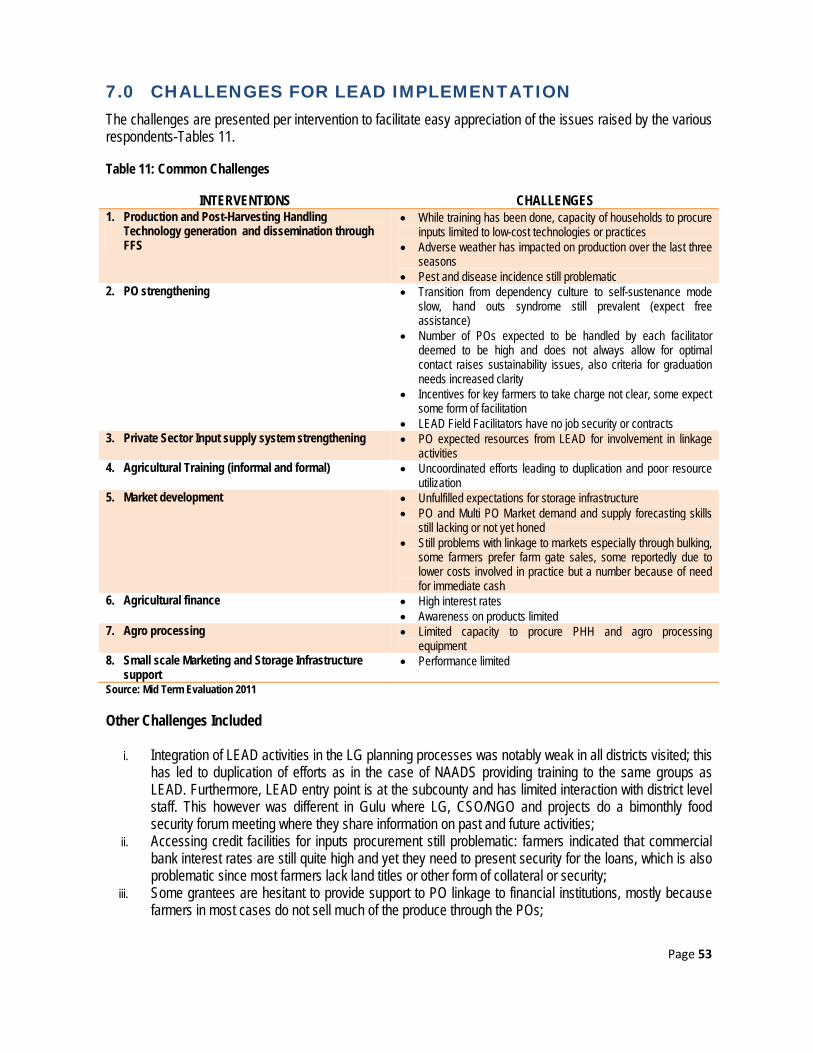
Page 53
7.0 CHALLENGES FOR LEAD IMPLEMENTATION The challenges are presented per intervention to facilitate easy appreciation of the issues raised by the various respondents-Tables 11. Table 11: Common Challenges
INTERVENTIONS CHALLENGES 1. Production and Post-Harvesting Handling
Technology generation and dissemination through FFS
While training has been done, capacity of households to procure inputs limited to low-cost technologies or practices
Adverse weather has impacted on production over the last three seasons
Pest and disease incidence still problematic 2. PO strengthening Transition from dependency culture to self-sustenance mode
slow, hand outs syndrome still prevalent (expect free assistance)
Number of POs expected to be handled by each facilitator deemed to be high and does not always allow for optimal contact raises sustainability issues, also criteria for graduation needs increased clarity
Incentives for key farmers to take charge not clear, some expect some form of facilitation
LEAD Field Facilitators have no job security or contracts 3. Private Sector Input supply system strengthening PO expected resources from LEAD for involvement in linkage
activities 4. Agricultural Training (informal and formal) Uncoordinated efforts leading to duplication and poor resource
utilization 5. Market development Unfulfilled expectations for storage infrastructure
PO and Multi PO Market demand and supply forecasting skills still lacking or not yet honed
Still problems with linkage to markets especially through bulking, some farmers prefer farm gate sales, some reportedly due to lower costs involved in practice but a number because of need for immediate cash
6. Agricultural finance High interest rates Awareness on products limited
7. Agro processing Limited capacity to procure PHH and agro processing equipment
8. Small scale Marketing and Storage Infrastructure support
Performance limited
Source: Mid Term Evaluation 2011 Other Challenges Included
i. Integration of LEAD activities in the LG planning processes was notably weak in all districts visited; this has led to duplication of efforts as in the case of NAADS providing training to the same groups as LEAD. Furthermore, LEAD entry point is at the subcounty and has limited interaction with district level staff. This however was different in Gulu where LG, CSO/NGO and projects do a bimonthly food security forum meeting where they share information on past and future activities;
ii. Accessing credit facilities for inputs procurement still problematic: farmers indicated that commercial bank interest rates are still quite high and yet they need to present security for the loans, which is also problematic since most farmers lack land titles or other form of collateral or security;
iii. Some grantees are hesitant to provide support to PO linkage to financial institutions, mostly because farmers in most cases do not sell much of the produce through the POs;

Page 54
iv. Other than the grantees, LEAD has not effectively involved input suppliers and producer buyers in LEAD activities. In Kiboga and Kamwenge for example, in spite of the identification of input suppliers they have never been trained by LEAD. This has definitely affected potential yields;
v. There are problems with regard to monitoring grantee PO. Information on these PO is limited and in cases questionable since some grantee do not seem to have bought the idea of the PO approach;
vi. USAID’s approach of cost sharing is not fully appreciated by some farmers that are used to free handouts offered by other organizations operating in the same area;
vii. Despite the linkage with the agro-input dealers the farmers are still faced with challenges like the high cost of agro inputs like fertilizers and pesticides, some input dealers do not always have some of the inputs needed by the farmers;
viii. POs still have limited volumes to bulk due to farm gate sales as well as farmers planting various varieties (e.g., some farmers plant yellow and others plant black beans);
ix. Inadequate certified coffee seedlings for planting because the Kituza, a dedicated Coffee Research station, lacks funds for the establishment of a tissue culture unit;
x. Women raised the issue of limited opportunity for engagement in commercial production due to land ownership by men;
xi. Low prices especially when there is an increased production of maize and other crops, sometimes act as a disincentive to production;
xii. Some groups are far from the facilitators point of easy reach within a subcounty or parish thus do not receive adequate technical support.

Page 55
8.0 LESSONS LEARNED
There are a number of lessons learned that the evaluation team presents as key learning points to guide future LEAD implementation. These include: 1. The Producer Organization approach and the Farmer Field School (FFS) methodology have both been and
still are instrumental in enhancing stakeholder interventions by reaching households through groups that facilitate joint learning directly from each other;
2. The LEAD activities directed at the strengthening and development of POs through the approach of addressing gaps and bringing various actors along the value chain together has immense potential for creating a sustainable environment toward reaching the program goal and objective;
3. Planned implementation of all targeted interventions does not always translate into expected aggregate results achievement, as evidenced under LEAD intermediate result (IR) 1 on increased trade capacity and sub-IR 1.3 on increasing investments in market infrastructure. Identifying strategic gaps along the value chain with the most potential for impact presents a better opportunity for achieving the desired results rather than trying to address all the gaps along the value chain;
4. Addressing bulk marketing does not always imply need for sophisticated storage infrastructure, as long as quality is ensured and aggregation of produce at collection centers on predetermined days can serve similar purpose especially in the short term. This is the concept used by some of the POs consulted;
5. USAID/LEAD principle to facilitate increased self-sustenance is commendable and should be strongly promoted. However, the team established that targeted subsidies for inputs used for demonstration in the short to medium term have great potential for contributing to building self-sustainability capacity and elicits positive response from farmers and POs;
6. Grantees with produce buying interventions that pay cash on delivery for produce tend to attract more POs into the marketing system;
7. Limited interaction with central and local governments by LEAD project management at all levels means that LEAD interventions will not be sustainable thereafter. Leaving district, field, and grantee staff to determine the nature of the LG interaction is a manifestation of inconsistent implementation and management approaches. The key lesson is that LGs are critical to future sustainability of LEAD interventions;
8. The range of over achievement (200%) and underperformance (10-12%) for various indicators strongly suggests issues of unrealistic target setting (both under and over targeting).

Page 56
9.0 CONCLUSIONS
The evaluation team presents its conclusions based on the substantive evidence presented in answering the questions that USAID raised in its SOW, and are as follows: Effectiveness of interventions in contributing to achievement of LEADs planned results.
1. The LEAD approach of targeting households through POs as the vehicle to transfer knowledge and skills (building on the APEP PO achievements) has without a doubt led to increased awareness and understanding of improved technologies and practices by PO households. The numbers of POs targeted were significant, although sustainability issues arise;
2. The FFS concept has been unanimously endorsed by farmers as an effective and practical way of transferring knowledge and technology;
3. There has been wide adoption of low-cost/nonmonetized (farmers do not cost or pay for their own labor) management practices such as row planting, timely planting and spacing for all crops, use of improved seeds for maize, groundnuts, rice, and coffee seedlings as well as fish fry for aquaculture. On the other hand, there is limited adoption of high-cost technologies like fertilizers, pesticides, insecticides, and herbicides. Adoption of post-harvest handling (PHH) practices is very limited especially in cases where resources are required for the necessary investments;
4. Yields per unit area have increased but are still lower than expected due to limited input usage and selective adoption of the spectrum of management practices in all value chains resulting in low totality of input use or management practices. This is because of various factors that include partial use of improved seed, limited ability to purchase the total requirement of seeds and fertilizers, climate change problems, weeds, disease, and pest management;
5. The MTE Team assessment is that LEAD interventions have contributed to the achievement of planned results however, there is a disclaimer. The performance has been largely quantitative in nature with an emphasis on achievement of numbers rather than quality. Furthermore, some of the good performance is being eroded by failure to achieve some activities, which have not been implemented such as the construction of market infrastructures on a wide scale.
b) The role cross-cutting issues especially gender, conflict, youth including OVC have played in shaping LEAD interventions and influencing achievement of LEAD results. 1. Cross-cutting issues have definitely played a role in shaping LEAD interventions and have influenced
LEAD results’ achievement in different ways. For example, LEAD data indicates that gender issues have been optimally mainstreamed into the design of the intervention and implementation with specific affirmative action activities like the female time poverty (reduction of time spent by women on drudgery activities) effort reported by some SAF grantees such as Victoria Seeds. The inclusion in the LEAD design of an OVC component in the North is also evidence of the manner that the post-conflict situation influenced LEAD PO interventions;
2. The unanticipated fast pace at which peace returned to the North caused a reconfiguration of the initial LEAD design and influenced subsequent activities by accelerating the speed at which the project had planned to transition returnees from resettlement and relief activities to commercially oriented production. In essence, post-conflict and not conflict per se shaped LEAD activities and positively influenced LEAD achievement of planned results;

Page 57
3. The OVC intervention activities such as animal traction and caregiver training that targeted orphans and vulnerable members of the households (PLWA), nutrition promotion through household gardening and provision of enrollment guidance and formation of groups for children and youth, were determined by the evaluation team to have been very effective in facilitating the quick return of household stability.
c) The Effectiveness of the SAF as a tool for leveraging private sector resources to improve service outreach 1. Grantees have increased PO coverage using both their LEAD resources and their own; In some cases
they had increased their core businesses in volume and quality as well as provided critical services along the value chains like input supply and produce buying;
2. Governance procedures are well within the approved LEAD framework and represent a fair framework for SAF management and implementation
3. Finally, the evaluation team’s conclusion is that the SAF grants have been an effective tool in leveraging resources in that for every LEAD USD 1$, it leveraged USD 1.5$. Households/farmers have benefited from training in areas of practical learning, investigation, problem solving, and information sharing. There is no doubt that the approach has resulted in greatly increasing farmers’ knowledge and awareness about imparted technologies and better management practices. As a result, an estimated additional 200,000 farmers found across targeted value chains are expected to be reached by end of project through the SAF activity;
d) How LEAD’s implementation has been coordinated/synchronized
4. The USAID/LEAD project is regarded as one of the key actors in the agriculture sector. However, there is still room for effective coordination with other actors/stakeholders;
5. LEAD interaction with the LG staff at district and lower levels is limited or absent and will affect sustainability of intervention after project ends;
6. Cases of duplication of effort especially between LEAD and NAADS activities have been reported as well as between some other USG efforts in the field. This was indicative of weak synergy and limited collaboration between LEAD and other agencies, which leads to wastage of limited resources especially in the supported districts.
e) Effectiveness of LEAD management Structure in achieving Results
1. The management structure and staff composition was largely appropriate and has been dynamic in responding to emerging needs. However, relatively high operational costs were observed. Owing to the structural nature of some of the challenges that the project was expected to resolve (i.e. weak agri-input subsector), the project was forced to make modifications to the project delivery structure. This was with specific reference to the recruitment of 350 FFs, which had a big impact on the costs for delivering the project services.
2. The LEAD management structure has thus far been effective in facilitating achievement of most of the LEAD project results, with the exception of two sub-IR on increasing trade capacity and sub-IR 3.4 on development of public-private partnerships. This suggested that the structure was effective in deploying resources and facilitating key linkages to deliver the project services.
3. The staff composition reflected both academic competence and working experience that was
commensurate with the demands of the project SOW. This was true for staff at the director/manager level and technical staff below them. The MTE’s conclusion is that this enabled informed technical advice on

Page 58
both policy and operational aspects of the project, and assisted the project in getting a foothold toward the achievement of project objectives.
f) Overall Performance Management Issues:
i) Design Issues 1. In several respects, while LEAD has achieved considerable success in the range of activities assessed, the
design was over ambitious;
2. LEAD is focusing on 17 value chains and too many interventions along the value chains, some of which are already supported by other USG agencies such as the Market Linkages Initiative;
3. Based on an evaluation of farmers’ value chain ranking, the top five ranked value chains across all the
supported districts include the following: i) Maize; iii) Coffee; iii) Ground Nuts; iv) Sesame; v) Rice and vi) Beans. The evaluation team observed that the main criterion for ranking was source of income, provision of daily food and food security during shortages, easy access to seed as well as other inputs and pest and disease incidence;
4. The MTE Team’s review of the (FTF) strategy revealed that the USG anticipated five-year USD 150M
commitment to be invested in various programs aligns directly with not only the goals of the DSIP but also coincidentally represents 50% of the proposed value chains focus on maize, coffee, and beans that are suggested that LEAD should focus on in the remaining period;
5. The anticipated FTF programming also covers research, policy and enabling environment, partnership
development funding, capacity building, value chain production, market linkages, agro-input services, PO and farm level aggregation development, market information systems, community connector and nutrition programs—all of which have clear linkages with ongoing and past USG activities.
ii) Implementation Issues
1. LEAD has performed poorly on delivery of the activities for market infrastructure;
2. The evaluation team assessed SAF governance and assessed the guidelines and observed that the process of its delivery demonstrated rigor.
iii) Results Performance
1. With the caveat that the LEAD project has contributed to (rather than caused) the results achieved to date, the evaluation team’s view is that most results have been achieved, with the exception of one intermediate result regarding the improvement of trade capacity. Findings have also indicated that that this intermediate result is unlikely to be achieved even by the Life of Project (LOP).

Page 59
10. 0 RECOMMENDATIONS
The following form the thrust of the evaluation teams’ recommendations based on the findings from the various instruments. 1. There is need to revisit the rationale in programming from a strategic perspective only. Our findings clearly
indicate that an inordinate emphasis on number of achievements inadvertently or otherwise led to declines in the quality of achievement. These numbers focused especially on the POs per facilitator, trainings, value chains and subcounties or parishes to be covered. The evaluation team recommends that LEAD review the PO approach and limit increased PO formation that has occurred on an annual basis for the last two years.
2. More precisely, there is need to focus attention toward existing POs. For those POs earmarked for graduation, efforts need to be placed on addressing factors that will keep the PO together and continue to do what it was doing and possibly move toward aggregation into multi-POs grouping;
2. In line with the above finding is the fact that LEAD is engaged in several important activities across the spectrum of a number of value chains; The evaluation team recommends that LEAD identify a mix of fewer chains and key gaps along the value chain that will maximize quantitative and qualitative impact, provide effective lesson learning and build a larger degree of PO sustainability. The proposed value chains, based on both respondents ranking (income generation, food security, and limited pest and disease intervention) and the evaluation teams’ assessment (return to investment, priority within the agro ecological zone, and contribution to exports), are as follows:
i. Northern Region-Maize, Sunflower, Ground Nuts ii. Eastern Region- Maize, Upland rice and Ground Nuts
iii. Central Region- Maize, Coffee and Beans iv. Western Region-Maize, Coffee and Rice implementation
In addition, the team also made comparison with enterprises selected in the Strategic Enterprise intervention detailed in the agriculture sector Development Strategy and Investment Plan (DSIP).
3. The potential for establishment of mutually beneficial synergy and partnerships with central and local governments exists and needs to be actively pursued; The evaluation team recommends that LEAD evolve and implement a clear engagement policy that provides clear incentives for joint planning, implementation and monitoring, and information sharing for nonduplication and assurance of more sustainable outcomes;
4. With regard to increased incomes for the vulnerable resulting from better productivity, LEAD should consider the development of sensitization packages targeting both men and women beneficiaries of the program, focusing on control of and decision making on household resource. In addition, influencing the gender balance in POs to increase women participation will increase LEAD program benefits accruing to women;
5. The FF’s approach has been key in facilitating knowledge transfer to households, and a critical component is the TOP that involves a practical hands-on learning approach and use of demonstration materials whose

Page 60
costs are above their capacity to procure and use. The evaluation team has determined that these inputs have been critical in influencing the behavior of some farmers but the capacity to procure these inputs has hindered efforts for increased production; The evaluation team is aware that USAID/LEAD policy does not permit the provision of free hand outs or inputs but is convinced that subsidized demonstration inputs (especially high cost) like fertilizers, herbicides, and pesticides for demonstrations could address the above stated challenge, especially because these inputs will be one time interventions. Moreover, this may not be a new concept within the current overall design as some grantees under SAF do provide these demonstration inputs; .
6. The use of field facilitators has been key to the achievement of LEAD performance results, even though they were temporary staff. Their proximity to POs and regular technical support made a commendable difference. The proposal by LEAD to phase out this key position in April 2011 has implications on future program performance and achievement of results; Therefore, the evaluation team recommends that LEAD needs to reconsider its position on this critical issue, unless there is an alternative that will equally match the current arrangement.
Note: The experiences in implementation at the beginning suggest the need for further analysis of the assumed intermediary framework (using SMEs) for reaching farmers via the informal commercial sector entities with relatively weak capacities whose focus was prone to change from one activity to another (i.e. from selling agro inputs to selling shoes) depending on what is profitable to them. This analysis would need to focus on understanding the underlying causes of weaknesses and measures that can be used to address them. The ensuing information would useful in informing the implementation methodology for future similar operations;
7. There are still problems with linkage to markets especially through bulking; some farmers prefer to sell at
farm gate, reportedly due to lower costs involved in practice but for many others it was because of need for immediate cash’ To ensure that farmers are linked to profitable markets in a bid to strengthen and develop market linkages, the evaluation team recommends that LEAD should build the market forecasting capacity of farmers and produce buyers. In addition, operationalization of the DCA should be hastened to facilitate access by SMEs to bank loans or private equity.
On cross-cutting issues:
8. Focusing on women in terms of activities such as technical assistance, knowledge exchange tours and marketing may have contributed to increasing gains for women. Currently, except for the ‘female time poverty’ initiative under Victoria Seeds, the evidence is that there was no special training targeted at women as a special group with a view to enhancing their capabilities to cease economic advantage;
9. Although women have benefited from LEAD interventions through LEAD support to various VCs, women participation needs to be actively promoted by ensuring that gender is a key criterion for PO formation during mobilization.
Regarding the SAF: 12. In view of perceptions that administration of the SAF is less than transparent, the project should consider
including external (to LEAD) competent stakeholders from other USG effort, to sit on the technical review

Page 61
and evaluation committee; 13. The dual set of benefits between SAF grantee assisted POs and the non-SAF assisted POs needs to be
clarified to avoid confusion; 14. There is need to strengthen the monitoring of adherence to agreements/contracts signed between LEAD
and grantees, as there was some evidence that some of the grantees did not follow the proper procedures for registering POs and never trained the farmers as expected.
On the Management Structure:
15. The management structure for future operations needs to actively and deliberately cater for promotion of partnerships with other stakeholders in order to ensure better achievement of project targets. The extension mechanism for the FFs should have been established from the very beginning, and consequently, with the rapid increase in numbers of POs, a phased reduction of the Farmer Field School facilitators is recommended post-LEAD MTE.
16. Regarding M&E, formulation of performance indicators needs further attention as some of them are designed to measure sector-wide impacts that cannot be attributed to one actor such as LEAD project. In particular, a review of indicators at project objective, sub-objective, and PIR 1 is recommended because their current phrasing raises issues of not only attribution but also data quality. Further, dissemination of results, to project stakeholders needs to be addressed.
17. In view of the need to demonstrate effectiveness, requiring impact evaluations should be an integral part of future program designs, that will deploy a consistent and rigorous methodology to isolate and quantify a specific project contributions to outcomes that the project contributes toward;
Regarding the USAID Feed the Future Program 18. Bearing in mind the fact that a summative evaluation of LEAD will be conducted at the end of project, the
team is of the view that the following key issues will require close attention especially insofar as they will inform FTF programming: PO development, spread of VC interventions, market infrastructure, access to inputs, and finally increased adoption.

Page 62
11.0 ANNEXES:
Annex A: LEAD PMP/RF Mapping Based on Year Two Target Indicato
r
Indictor Unit of measure
Baseline Target Year 1
Progress: Target Yr2 Progress: Performance:on Yr 1 Targets
(%)
Perf. On Yr2
Targets
Performance: Project
To Date Wgtd Performance
Cumulative Weighted Perf.
Number
Yr 1 Yr2
A. Project Goal: Expanded Sustainable Economic Opportunities for Improved Livelihoods 1 Number of rural households benefiting directly from USG
interventions +* # hh 0 100,000 81,660 250,000 247,272 82 99% -1
20%
101%
2 Number of vulnerable households benefiting directly from USG assistance+*
# hh 0 25,000 26,636 40,000 42,509 107 106% 6 21%
3 Number of very poor households benefiting directly from USG assistance+
# hh 0 20,000 14,091 35,000 26,154 70 75% -25 15%
4 Percent change in income of targeted rural population % 0 25% 19% 30% 36% 76 120% 20 24%
5 Quantity of greenhouse emissions Metric Tons
TBD Na TBD TBD #VALUE! #VALUE!
6 % Micro-enterprise funds disbursed reaching the very
poor % 0 40% 43% 37% 39% 108 105% 5
21% Project Sub-Objective: Increased Transformation of the Rural Agricultural Economy
7 Percent of LEAD supported farmers that have moved from subsistence to farming as a business as a result of USG interventions
% 0 10% 8% 20% 30% 80 150% 50
38%
207%
8 Number of jobs created as a result of USG interventions # hh 0 10,000 19,169 50,000 56,630 192 113% 113,160 28%
9 Number of agricultural-related firms benefiting directly from USG- supported interventions+
# firms 0 20 22 80 145 110 181% 81
45% 10 % USAID assisted SMEs that are sustainable % 0 10% 0% 20% 77% 0 385% 285
96% Project Intermediate Result 1: Increased Trade Capacity in Targeted Value Chains
11 Percent change in value of intra-regional exports of targeted agricultural commodities as a result of USG assistance+*
% 0 10% 18% 25% 16% 180% 64% -36
13% 15%
12 Percent change in value of international exports of targeted commodities as a result of USG assistance+*
% 0 3% -25% 20% -31% -833% -155% -255
‐31%

Page 63
13 % change in $ value of targeted agricultural exports % 0 10% -12% 25% -6% -120% -24% -124 ‐5% 14 Volume of exports of targeted agricultural commodities
as a result of USG assistance Metric Tons
300,000 400,000 447,225 500,000 590,418 112 118% 18
24% 15 $ value of exports of targeted agricultural commodities as
a result of USG assistance $ million 400 410 486 630 458 119 73% -27
15% Sub-IR 1.1 Trade Linkages Developed and Strengthened
16 % change in value of purchases from smallholders of targeted commodities+*
% TBD 20% 23% 40% 177% 115 443% 343 75%
187%
17 Number of trade linkages created between POs and private sector entities
# linkages 0 10 14 65 97 140 149% 49 25%
18 Number of enterprises adopting improved trade/investment strategy*
# firms 0 10 4 42 39 40 93% -7 16%
19 % enterprises adopting improved trade/ investment strategies
% 0 20% 17% 25% 27% 85 108% 8 18%
20 $ Value of business investment as a result of USAID support to increase access to capital
$ million 0 2.8 2.6 10 5.3 93 53% -47
9% 21 Number of linkages created between micro-enterprises
&larger scale firms as a results of USG assistance to the value chain
# linkages 0 10 14 15 38 140 253% 153
43% Sub-IR 1.2: Access a to Financial Products and Services to Value Chain Actors Increased
22 Amount of private financing mobilized with a DCA guarantee
$ million 0 0 0 5 0 #DIV/0! 0 -100
23 Number of SMEs, receiving USG supported assistance to access bank loans or private equity
# SME 0 200 0 1100 405 0 37% -63
6%
109%
24 Number of SMEs that successfully accessed bank loans or private equity as a result of USG assistance+
# SME 0 30 0 200 152 0 76% -24
13% 25 Number of new savers Number 0 3,000 6,609 12,000 20,267 220 169% 69 29% 26 $ Value of new saving held by clients of USG-supported
groups $ thousand
0 300,000 594,810 1200000 1,500,630 198 125% 25 21%
27 $ Value of loans provided to USG-supported producer organization for farm inputs from credit institutions
$ million 0 3,750,000 1,437,500 9,750,000 2,433,238 38 25% -75
4% 28 % SMEs that successfully accessed financial capital as a
results of USG % 0 15% 0% 18% 38% 0 211% 111
36% Sub-IR 1.3: Investments in Market Infrastructures Increased
29 Number of firms receiving USG assistance to invest in market infrastructures*
# firms 0 10 7 80 30 70 38% -63 12% 33%

Page 64
30 Total investment (public and private) in market infrastructures as a result of USG interventions
$ million 0 2 0.841 5 1.76 42 35% -65
12% 31 Number of market centers established as a result of USG
interventions # centers 0 20 1 100 26 5 26% -74
9% Intermediate Result 2: Increased Agricultural Productivity of Targeted Value Chains
32 Volume of targeted agricultural commodities Metric tons
170,000 200,000 178,357 400,000 525,162 89% 131% 31 33%
155%
33 Percent change in gross margins of supported value chains*
% TBD 15% 12% 25% 38% -3% 152% 13 38%
34 % Change in $ value of targeted commodities produced by USAID-assisted clients
% 0 20% 117% 30% 296% 97 987% 266
35 $ Value of targeted commodities produced by USAID-Assisted clients
$ million 30 35 25 84.5 119 71% 141% 41 35%
36 % Change in volume of targeted commodities produced by USAID –assisted clients
% 0 20% 49% 100% 194% 29 194% 94 49%
Sub-IR 2.1: Business Development Services (BDS) Developed and Strengthened 37 Number of BDS providers linked to value chain actors as
a result of USG interventions # BDS providers
0 25 7 75 67 28 89% -11
29%
123%
38 Number of BDS providers strengthened as a result of USG assistance
# BDS providers
0 10 0 37 42 0 114% 14 38%
39 Average percentage change in volume of new business acquired by Business Development Service providers
% 0 10 0% 20% 34% 0 170.0% 14
56% 40 % change in dollar value of business investment by BDS % #DIV/0! #DIV/0! #DIV/0!
Sub-IR 2.2: Agricultural Technology Adoption Increased
41 Percent of trained farmers adopting new technologies and/or management practices
% 0 25% 29% 30% 51% 116 170.0% 70
29%
115%
42 Additional hectares under improved technologies or management practices as a result of USG assistance+*
# hectare 0 50,000 31,590 130,000 171,915 63 132% 32
22% 43 Number of new technologies or management practices
made available for transfer as a result of USG assistance+*
# techn and mgt practices
0 3 2 5 5 67 100% 0
17% 44 Number of new technologies or management practices
under field testing as a result of USG assistance+* # techn and mgt practices
0 3 1 7 5 33 71% -29
12%

Page 65
45 Number of new technologies or management practices under research as a result of USG assistance+*
# techn and mgt practices
0 2 1 3 3 50 100% 0
17% 46 Number of firms receiving USG supported assistance to
invest in improved agricultural technologies+ # firms 0 5 5 20 21 100 105% 5
18% Sub-IR 2.3: Producer Organization Developed and Strengthened
47 Number of producers organizations, water users associations, trade and business associations, and community-based organizations (CBOs) receiving USG assistance+*
# groups 0 4,500 4,197 10,000 11,552 93 116% 16
0.29
246%
48 Number of women’s organizations receiving USG assistance+
# assoc/org
0 450 439 1,200 2,932 98 244% 144 0.61
49 $ value of sales of agricultural commodities produced by USAID-supported producer organizations
$ million 0 8 7.3 15 36.06 91 240% 140
0.6 50 % IDP returnees able to meet a defined % of their food
needs from subsistence farming % 0 10% 0 20% 77% 0 385% 55
96% Sub-IR 2.4: Private Sector Input Supply Systems Improved
51 Number of agri- inputs dealers trained in product knowledge and business skills
# agri-dealers
0 100 158 500 1,013 158 203% 103
1
109%
52 Number of trained agri-inputs dealers linked to value chain actors as a result of USG interventions
# agri-dealers
0 80 33 400 353 41 88% -12
0 53 Number of input suppliers providing services to farmers
and farmer organizations # of suppliers
0 80 33 400 353 41 88% -12
0 54 $ Value of inputs purchased by USG- supported clients $ million 0 5 4 14.95 8.4 80 56% -44
0 Project Intermediate Result 3: Increased Competitiveness of Targeted Value Chains
55 Number of firms receiving USG assistance to improve their management practices+
# firms 0 5 4 10 25 250% 250 150
125% 185%
56 Number of firms achieving international standards as a result of USG interventions
# of enterprise
0 2 1 5 6 120% 120 20
60% Sub-IR 3.1: Market Access Increased
57 Number of firms receiving trade certification as a result of USG assistance
# firms 0 3 3 10 6 60% 60 -40 30% 110%

Page 66
58 Number of new market segments penetrated as a result of USG interventions
# markets 0 2 2 5 8 160% 160 60 80%
Sub-IR 3.2: Enabling Environment for Value Chain Growth Improved 59 Number of policy/ regulatory constraints identified and
made known to value chain actors # identified
0 1 3 6 6 100% 100 0
50% 138% 60 Number of industry clusters/alliances supported through
USG assistance (Action Undertaken to improve business environment)
# clusters 0 2 7 4 7 175% 175 75
88% Sub-IR 3.3: Human and Institutional Capacity Developed
61 Number of individuals who received USG support for short-term agricultural sector productivity training+*
# trained 0 100,000 92,571 250,000 405,429 162% 162 62
28%
162%
62 Number of individuals who have received USG support for long-term agricultural sector productivity training+*
# trained 0 2 0 7 3 43% 43 -57
7% 63 Number of firms receiving USG supported capacity
building assistance # firms 0 2 3 10 37 370% 370 270
63% 64 Number of firms receiving capacity building assistance to
export # firms 0 20 11 25 30 120% 120 20
20% 65 Number of participants in USG supported trade and
investment capacity building training+* #participants
0 5 4 25 34 136% 136 36
23% 66 Number of businesses associations and trade unions
that are at least 50% self-funded as a result of USG assistance+
# associations
0 2 0 5 6 120% 120 20
20% Sub-PIR 3.4: Public-Private Partnerships Developed
67 Number of public-private partnerships formed as a result of USG assistance+*
# PPP 0 20 23 40 19 48% 48 -53 12%
64%
68 Number of public-private dialogue mechanisms utilized as a result of USG assistance+
# PPP dialogue
0 3 2 15 16 107% 107 7
27% 69 Number of actions undertaken to improve the business
environment # actions 0 3 2 15 7 47% 47 -53
12% 70 $ Value of private sector resources leveraged through
public- private partnerships developed under USG -funded activities
$ million 0 2 2.5 10 5.32 53% 53 -47
13%
Key on Color Coding on Cumulative Performance: Blue = Exceeded Targets >110%; Greene = Met Target (>90 – 110%); Red = Not Achieved (< 90% of Target)

Page 67
Annex B: LEAD PMP/RF Mapping Based on LOP Targets
USAID LEAD PMP INDICATOR TRACKER SHOWING YEAR 1 AND YEAR 2 PROGRESS
Indicator Unit of
LOP Target Year 1 Progress
Year 2 Progress
Cumulative Progress to-
date
Progress as % of LOP
target Weighted performance
Cummulative weighted performance
Measure
A. Project Goal: Expanded Sustainable Economic Opportunities for Improved Livelihoods
1 Number of rural households benefiting directly from USG interventions Number 600,000 81,660 247,272 247,272 41% 8
64.1
2 Number of vulnerable households benefiting directly from USG assistance Number 100,000 20,636 42,509 42,509 43% 9
3 Number of very poor households benefiting directly from USG assistance Number 75,000 14,091 26,154 26,154 35% 7
4 Percent change in income of targeted rural population % 50% 19% 36% 36% 72% 14
5 Quantity of green house emissions** Number TBD na na na na
6 % micro-enterprise funds disbursed reaching the very poor* % 30% 43% 39% 39% 130% 26.0
Project Sub-Objective: Increased Transformation of the Rural Agricultural Economy
7 Percent of LEAD farmers who moved from subsistence to farming as a business as a result of USG interventions % 40% 8% 30% 30% 75% 15
106
8 Number of jobs created as a result of USG interventions Number 150,000 19,169 56,630 94,257 63% 13 9 Number of agricultural-related firms benefiting directly from USG-supported
interventions Number
200 22 145 145 73% 15 10 % USAID assisted SMEs that are sustainable
% 40 0 77 77 39 10 % IDP returnees able to meet a defined % of their food needs from subsistence
farming %
60% 0% 77% 77% 128% 26 Project Intermediate Result 1: Increased Trade Capacity in Targeted Value Chains
11 Percent change in value of intra-regional exports of targeted commodities as a result of USG assistance* % 60% 18% 16% 16% 27% 5
40 12 Percent change in value of international exports of targeted agricultural commodities as a result of USG assistance* % 40% -25% -31% -31% -78% -16

Page 68
USAID LEAD PMP INDICATOR TRACKER SHOWING YEAR 1 AND YEAR 2 PROGRESS
Indicator Unit of
LOP Target Year 1 Progress
Year 2 Progress
Cumulative Progress to-
date
Progress as % of LOP
target Weighted performance
Cummulative weighted performance
Measure
13 % change in $ value of targeted agricultural exports* % 50% -12% -6% -6% -12% -2
14 Volume of exports of targeted agricultural commodities as a result of USG assistance metric tons 775,000 447,225 590,418 1,037,643 134% 27
15 Dollar value of exports of targeted agricultural commodities as a result of USG assistance US$ million 745 486 458 944 127% 25
Sub-IR 1.1 Trade Linkages Developed and Strengthened
16 % change in value of purchases from smallholders of targeted commodities* % 65% 23% 177% 177% 272% 45
103
17 Number of trade linkages created between POs and private sector entities Number 100 14 97 111 111% 19
18 Number of enterprises adopting improved trade/investment strategy Number 100 4 39 43 43% 7 19 % enterprises adopting improved trade/ investment strategies %
40% 17% 27% 27% 67% 11 20 $ value of business investment as a result of USAID support to increase access to
capital US$ million
33 2.6 8.9 11.5 35% 6 21 Number of linkages created between micro enterprises and large firms as a result of
USG assistance to value chains # firms
60 14 38 52 87% 14 Sub-IR 1.2: Access a to Financial Products and Services to Value Chain Actors Increased
22 Amount of private financing mobilized with a DCA guarantee US$ million 20 0 0 0 0% 0
54
23 Number of SMEs receiving USG supported assistance to access bank loans or private equity
Number
2,500 0 405 405 16% 2
24 Number of SMEs that successfully accessed bank loans or private equity as a result of USG assistance Number 500 0 152 152 30% 4
25 Number of new savers Number 25,000 6,609 20,267 26,876 108% 15
26 $ Value of new savings held by clients of USG-supported groups USD 11,500,000 594,810 1,500,630 2,095,440 18% 3
27 $ Value of loans provided to USG-supported producer organizations for farm inputs from credit institutions USD 18,750,000 1,437,500 2,433,238 3,870,738 21% 3

Page 69
USAID LEAD PMP INDICATOR TRACKER SHOWING YEAR 1 AND YEAR 2 PROGRESS
Indicator Unit of
LOP Target Year 1 Progress
Year 2 Progress
Cumulative Progress to-
date
Progress as % of LOP
target Weighted performance
Cummulative weighted performance
Measure
28 % SMEs that successfully accessed financial capital as a result of USG assistance % 20% 0% 38% 38% 188% 27
Sub-IR 1.3: Investments in Market Infrastructures Increased
29 Number of firms receiving USG assistance to invest in market infrastructures Number 200 7 30 37 19% 6
15
30 Total investment (public and private) in market infrastructures as a result of USG interventions US$ million 20 0.841 1.76 2.6 13% 4
31 Number of market centers established as a result of USG interventions Number 200 1 26 27 14% 4
Intermediate Result 2: Increased Agricultural Productivity of Targeted Value Chains
32 Volume of targeted agricultural commodities produced by USAID assisted clients metric tons 1,500,000 178,357 525,162 703,519 47% 9
199
33 Percent change in gross margins of supported value chains % 40% 12% 38% 38% 95% 19
34 % change in $ value of targeted commodities produced by USAID-assisted clients % 50% 117% 296% 296% 591% 118
35 Dollar value of targeted commodities produced by USAID-assisted clients US$ million 220 25 119 144 65% 13
36 % Change in volume of targeted commodities produced by USAID-assisted clients % 100% 49% 194% 194% 194% 39
Sub-IR 2.1: Business Development Services (BDS) Developed and Strengthened
37 Number of BDS providers linked to value chain actors as a result of USG interventions Number 200 7 67 74 37% 12
63
38 Number of BDS providers strengthened as a result of USG assistance Number 50 0 42 42 84% 28
39 Average % change in the volume of new businesses acquired by targeted Business Service providers* % 50% 0% 34% 34% 68% 23
Sub-IR 2.2: Agricultural Technology Adoption Increased

Page 70
USAID LEAD PMP INDICATOR TRACKER SHOWING YEAR 1 AND YEAR 2 PROGRESS
Indicator Unit of
LOP Target Year 1 Progress
Year 2 Progress
Cumulative Progress to-
date
Progress as % of LOP
target Weighted performance
Cummulative weighted performance
Measure
40 Percent of trained farmers adopting new technology and/or management practices % 50% 29% 51% 51% 102% 17
87
41 Additional hectares under improved technologies or management practices as a result of USG assistance Hectares 250,000 31,590 171,915 203,505 81% 14
42 Number of new technologies or management practices made available for transfer as a result of USG assistance Number 7 2 5 7 100% 17
43 Number of new technologies or management practices under field testing as a result of USG assistance Number 11 1 5 6 55% 9
44 Number of new technologies or management practices under research as a result of USG assistance Number 5 1 3 4 80% 13
45 Number of firms receiving USG supported assistance to invest in improved technologies Number 25 5 21 26 104% 17
Sub-IR 2.3: Producer Organization Developed and Strengthened
46 % USAID assisted SMEs that are sustainable % 40% 0% 15% 15% 38% 8
117
47
Number of producers organizations, water users associations, trade and business associations, and community-based organizations (CBOs) receiving USG assistance+* Number 15,000 4,197 11,552 11,552 77% 15
48 Number of women’s organizations receiving USG assistance Number 1,500 439 2,932 2,932 195% 39
% IDP returnees able to meet a defined % of their food needs from subsistence farming % 60 0 77 77 26
49 $ value of sales of agricultural commodities produced by USAID-supported producer organizations US $ Million 30 7.3 36.06 43.36 145% 29
Sub-IR 2.4: Private Sector Input Supply Systems Improved
50 Number of agri-inputs dealers trained in product knowledge and business skills Number 1,000 158 1,013 1,013 101% 25
58.2
51 Number of trained agri-inputs dealers linked to value chain actors as a result of USG interventions Number 800 33 353 353 44% 11
52 Number of input suppliers providing services to farmers and farmer organizations Number 800 33 353 353 44% 11

Page 71
USAID LEAD PMP INDICATOR TRACKER SHOWING YEAR 1 AND YEAR 2 PROGRESS
Indicator Unit of
LOP Target Year 1 Progress
Year 2 Progress
Cumulative Progress to-
date
Progress as % of LOP
target Weighted performance
Cummulative weighted performance
Measure
53 $ Value of inputs purchased by USG-supported clients US $ Million 28.7 4 8.4 12.4 43% 11
Project Intermediate Result 3: Increased Competitiveness of Targeted Value Chains
54 Number of firms receiving USG assistance to improve their capacity and management practices Number 23 4 25 25 109% 54
84 55 Number of firms achieving international standards as a result of USG intervention Number 12 1 6 7 58% 29
Sub-IR 3.1: Market Access Increased
56 Number of firms receiving trade certification as a result of USG assistance Number 20 3 4 7 35% 18
59 57 Number of new market segments penetrated as a result of USG interventions Number 12 2 8 10 83% 42
Sub-IR 3.2: Enabling Environment for Value Chain Growth Improved
58 Number of policy/regulatory constraints identified and made known to value chain actors Number 10 3 6 9 90% 45
115 59 Number of industry clusters/alliances supported through USG assistance Number 10 7 7 14 140% 70
Sub-IR 3.3: Human and Institutional Capacity Developed
60 Number of individuals who received USG support for short-term agricultural sector productivity training Number 600,000 92,571 405,429 498,000 83% 14
75
61 Number of individuals who received USG support for long-term agricultural sector productivity training Number 15 0 3 3 20% 3
62 Number of firms receiving USG supported capacity-building assistance Number 20 3 37 40 200% 33
63 Number of firms receiving USG supported capacity-building assistance to export Number 100 11 30 41 41% 7
64 Number of participants in USG supported trade and investment capacity building training Number 50 4 34 38 76% 13
65 Number of business associations and trade unions that are at least 50% self-funded as a result of USG assistance Number 20 0 6 6 30% 5

Page 72
USAID LEAD PMP INDICATOR TRACKER SHOWING YEAR 1 AND YEAR 2 PROGRESS
Indicator Unit of
LOP Target Year 1 Progress
Year 2 Progress
Cumulative Progress to-
date
Progress as % of LOP
target Weighted performance
Cummulative weighted performance
Measure
Sub-PIR 3.4: Public-Private Partnerships Developed
66 Number of public-private partnerships formed as a result of USG assistance Number 130 23 19 42 32% 8
60
67 Number of public-private dialogue mechanisms utilized as a result of LEAD assistance Number 20 2 16 18 90% 23
68 Number of actions undertaken to improve the business environment Number 20 2 7 9 45% 11
69 $ Value of private sector resources leveraged through public- private partnerships developed under USG- funded activities US$ million 15 5.7 5.32 11.02 73% 18
Key Less than 50% Unlikely to achieve LOP targets/results 50-100% Likely to achieve LOP targets/results More than 100% Unlikely to achieve LOP targets/results

Page 73
Annex C: LEAD Stakeholder Analysis Matrix For Mapping Interests Versus Synergies
STAKEHOLDER ANALYSIS MATRIX FOR MAPPING INTERESTS VERSUS SYNERGIES FORMED IN ORDER TO MAXIMISE OPPORTUNITIES FOR LEVERAGING ACTIVITIES AND RESOURCES
STAKEHOLDER THEIR INTEREST THEIR DEFINITION OF OPPORTUNITIES
UNDERSTANDING OF STRATEGY/MODE OF
OPERATION
WHAT SYNERGIES HAVE WORKED AND WHY
WHAT SHOULD BE DONE DIFFERENTLY
Local Government -Collaborating with partners and integrating activities into districts/subcounty plans to remove duplication of support in same location.
-Additional facilitation and funding to implement their activities.
-More emphasis and interventions on farm mechanisation, stronger regulation of planting materials coming into the districts, pest and disease control and climate change management strategies.
-Existing poor and vulnerable communities with land resources and human capital to increase production if guided
-Information sharing.
-Complementing each other’s activities.
-At the district they do not understand the way farmers are selected in LEAD programme and the programme main focus.
-Mode of operation not clearly understood.
-Criteria for selection of the targeted value chains not clear.
- Iganga DAO is aware that LEAD builds on IDEA and APEP.
-Nothing much since operations are parallel.
-DAO for Iganga notes a progressive reduction in involvement of the production office in USAID funded interventions from IDEA to APEP and LEAD.
-In general development partners should endeavour to complement each other’s activities.
-Government is always limited in resources therefore the production departments should be aware of what LEAD is doing and in which locations to avoid implementing similar programmes / duplication.
SAF Grantees -Capacity building for farmers to enhance productivity in terms of volume and quality
-Increasing quality and quantity of
-Existing farmers and land to produce commodities which are required in the markets if guided to bulk quality products.
-Availability of input manufacturers and importers / knowledge sharing.
-Working with LEAD while building on what the grantees are doing and with willing farmers.
-Formation of POs to ease
-Capacity building and market access and procurement of some inputs/building on existing initiatives.
-More farmers are being trained in recommended agricultural technologies and management practices.
-LEAD should be more flexible in allowing adjustment/ changes to detail stated in the grantee proposals.
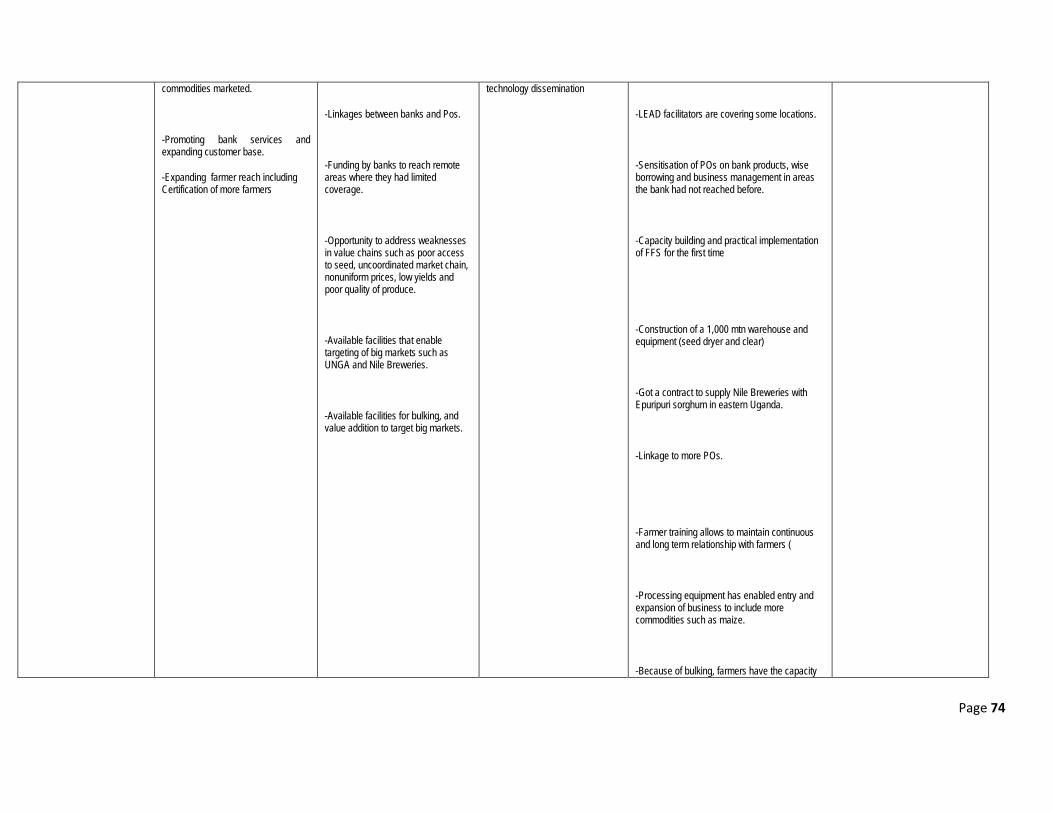
Page 74
commodities marketed.
-Promoting bank services and expanding customer base.
-Expanding farmer reach including Certification of more farmers
-Linkages between banks and Pos.
-Funding by banks to reach remote areas where they had limited coverage.
-Opportunity to address weaknesses in value chains such as poor access to seed, uncoordinated market chain, nonuniform prices, low yields and poor quality of produce.
-Available facilities that enable targeting of big markets such as UNGA and Nile Breweries.
-Available facilities for bulking, and value addition to target big markets.
technology dissemination
-LEAD facilitators are covering some locations.
-Sensitisation of POs on bank products, wise borrowing and business management in areas the bank had not reached before.
-Capacity building and practical implementation of FFS for the first time
-Construction of a 1,000 mtn warehouse and equipment (seed dryer and clear)
-Got a contract to supply Nile Breweries with Epuripuri sorghum in eastern Uganda.
-Linkage to more POs.
-Farmer training allows to maintain continuous and long term relationship with farmers (
-Processing equipment has enabled entry and expansion of business to include more commodities such as maize.
-Because of bulking, farmers have the capacity

Page 75
to target big buyers such as UNGA for maize.
-Acquisition of warehouse and processing equipment for groundnuts in eastern Uganda.
District Extension Officers -Increasing productivity through improved technology transfer and reduction of post-harvest losses and increasing market infrastructure and focusing on plant and animal health
-Availability of land resources, people and two rain periods and with irrigation one can get a third harvest.
LEAD have their own facilitators but can consult if there is a disease outbreak but otherwise have their own approach.
-Training of farmers who have been in NAADS groups
Farmers -Getting access to cheap inputs (Improved seeds/planting material, equipment for land opening and post-harvest handling and access to markets).
-More food
-Better markets
-Available land
-Training in better farming practices
-Linkage to markets.
Through farmer field schools, identify production and marketing constraints and try to get solutions, better than classroom approach.
Understood the PO, training in POs, FFS, bulk marketing. But still want hand outs.
-Soil and crop management/ working with other people through farmers field schools.
-Practical training of many farmers.
-Linkage to markets.
-Bulk purchase of inputs.
-Farmers still feel that LEAD should provide them with seed, fertilizer and tarpaulins
-Expectation of hand outs is still big
Producer Organizations -Increasing production, bulking and households incomes/enhancement of income and food security
-Farmers willing to bulk if there is an identified .
Strengthening existing groups and group formation to access services like training, input and output marketing
-Building on existing groups and collective marketing.
Agro-input Suppliers -Having enough capital for increased input stocks of different varieties to meet farmers needs/increasing input sales.
-Existing producers wanting improved seeds/planting materials and declining soil fertility which require fertilizers.
Mobilizing input suppliers for training and linking them to farmers
-Nothing much given the poor purchasing power of farmers and with attitude that if government cannot supplier or markets give low prices then they cannot buy inputs.
-Volume of business is still below desired levels

Page 76
-Increase in customer base and volume of business.
-Chance to enter small scale processing and value addition (said by one agro dealer in Kumi)
-Linkage to POs.
-Bulk purchase of inputs by some farmers.
-Provision of advisory services to farmers (this has improved relationships with farmers and become a good marketing strategy)
LEAD Field Staff -Better facilitation especially in terms of movement to reach farmers when they are in need and seeing LEADs objective being achieved in terms of increase in productivity, trade and competitiveness.
-Working within project areas which ensures that related production constraints are addressed as they come; Ability to be trained by LEAD given the level of education.
-Working with existing farmers and forming others through exchange visits where the new farmers see and believe on the benefits of the programme.
-Capacity building through farmer field schools has led farmers to appreciate production and marketing constraints than before.
Farmer Field Schools -Members identifying production and marketing constraints and solutions practically
-Farmers willingness to learn new approaches
-Farmers coming together on an established farm or rotating at each individual farmer’s farm to learn farming activities and application of new technologies.
-Building on the farmers traditional knowledge to improve farming activities.
Partners
-Increasing market base
-Organized groups to work with to multiply seed
-Promotion of VSLA
-Certification of farmers
-Linkage to organized farmer groups that can buy seed in bulk.
-Linkage to farmers to work with as out.
-Obtaining demonstration plots (gives a chance to demonstrate how their products work).
-Linkage to farmers to work with as out growers.
-Obtaining demonstration plots (gives a chance to demonstrate how their products work).
-Access to groups for establishment of VSLA.
-LEAD should work with them on other value chains
-There is a limit to the amounts of money farmers can borrow from the VSLA. LEAD should focus on linking them to financial institutions that can lend more.
Produce Buyers
(Agroways, Jinja Upland Rice
-Increased production (quality and quantity) of all commodities
-Improvement of farmers’ production (quality and quantity) through provision of
-Training farmers in recommended production and postharvest practices. There are some improvements in farmers’ produce (in terms of
-More facilitation (in terms of staff) so that more farmers in other districts can be trained.

Page 77
Millers, etc)
-Provision of quality assurance, packaging storage services and milling services
-Expanding volume of business
training quality and quantity).
-Some farmers benefitted from bulking their produce
-For Jinja Upland Rice Millers - a LEAD grant has enabled reaching a large number of farmers in about seven districts to train them.
-The partnership is working well but LEAD should also focus some interventions to middlemen as they are a group that is not going to go away soon.
-LEAD should accept that some farmers will not bulk. And middle men play a role in collecting produce from such farmers
(These are Jinja Upland Rice millers views)

Page 78
Annex D: List of Respondents District Organization Name Designation Iganga LEAD Staff Sirina Byogero Field Officer
Budoli Banuli Field Facilitator Luganda Wilson Field Facilitator Baale Samuel Field Facilitator Bernard Mukuye Field Facilitator Mugabi Joseph Field Facilitator Wilberforce Tibairira Staple Crops Value Chains Technical Advisor
Grantee/ Produce buyer Nakato Viola Field Supervisor- UGACOF Local Government Nantatya Sula District Agricultural Officer Grantee Rogers Sebata Relationship Supervisor- Opportunity Bank Partner Hakim Ndijo Marketing Manager- CAII
Kumi LEAD Staff Joseph Okwakol Field Officer Makara Charles Field Facilitator Moses Malenga Field Facilitator Obore James Field Facilitator Omoding Stephen Field Facilitator
Local Government Odeke Valdo District Agricultural Officer Grantee/ Produce Buyer Okutur James Coordinator- Kumi District Farmers Association- Produce Buyer Okocha Micheal Akibu Farmers
Okiyone Ibrahim Akol Zai Company Oplot Alfred Akibu Millers Obukulem Micheal
Partner Osire Anthony Community Based Trainer- Build Africa Bukedia LEAD Staff Atum George Field Officer
Achom Christine Field Facilitator Otai Charles Field Facilitator Akello Eva Field Facilitator Ilemut Samuel Field Facilitator Arikod Kenneth Field Facilitator
Grantee/ produce buyer Martin Okike Project Manager- Matsenne Kamuli LEAD Staff David Balizindwire Field Officer
Wagose Paul Field Facilitator

Page 79
District Organization Name Designation Kundhuba Julius Field Facilitator Kintu Isma Field Facilitator Boyi James Field Facilitator Kirunda Robert Field Facilitator Lwalanda Ronnie Field Facilitator Magulu David Field Facilitator
Partner/ Produce buyer Francis Onyango Project Field Officer-Kulika Uganda Project Multi-PO/ produce buyer Charles Mpawulo Bugaya ACE Local Government Mpawulo Felix District Agricultural officer
Jinja Produce Buyers Inventory Manager- Agroways Sebastian Oketcho Jinja Upland Rice Millers Phillip Idro Director- Jinja Upland Rice Millers
GULU LEAD Staff Ajok Jennifer Obol Field Officer Akello Beatrice Field Facilitator Apiyo Vicky Field Facilitator Atia Sekogal Field Facilitator Atoo Agnes Field Facilitator
Ego Jasper Field Facilitator Komakech Joseph Jason Field Facilitator Odongo Tonny Thomas Field Facilitator Ojara Francis Field Officer Okello Moses Field Facilitator
Opiyo Richard Field Facilitator Grantee/ Produce buyer Tony Okello Sales and Extension Manager Victoria Seeds
Acao Harriet Produce Buyer
Masaba Gomei Extension Manager Victoria Seeds Local Government Olango Clement Deputy District Agricultural Officer Grantee Mark Moro Executive Director Euro Afric Partner ACDI VOCA Dr. John Wendt
NEBBI LEAD Staff Acanda Sally Field Officer Adegithu John Bosco Field Facilitator Agwokotho Felix Field Facilitator

Page 80
District Organization Name Designation Akenda Benson Field Officer Coope Aliga Kizito Field Facilitator Mungu Acel Ronald Field Facilitator Odubi Anne Orwotho Field Facilitator Okuku Ramadhan Field Facilitator Okwonga Richard Field Facilitator Onencan Jenaro Field Facilitator Oryem Kissah Charles Field Facilitator Rwothumio Dicky Field Facilitator
Grantee/ Produce buyer Jackie Aduny UCA Jessica Giramwa Agro Input Dealer Isaac Manana Golden Produce Buyer
Local Government Philip Otim District Commercial Officer David Tumuswa Assistant Commercial Officer Betty Jokeno Acting DAO
Grantee Alfred ojik Deputy Manager Centenary Bank Partner Jenaro P Onegi CEO WENIPS Jackie Aduny UCA
DOKOLO LEAD Staff Abeku Jacob Goldy Field Facilitator Akan Sarah Field Facilitator Akao Martha Field Facilitator Akot Annette Nicky Field Facilitator Alany Daniel Field Facilitator Auma Mary Stella Field Facilitator Ayo Ruth Field Facilitator Oguta Peter Field Facilitator Okello Tom Field Facilitator Okodi Tonny Field Facilitator Opio Bonny Field Officer
Otima Kenneth Field Facilitator Input Supplier Pasquine Akumu Farmers Service Dokolo Branch Herbert Okello MD Farmers Service Dokolo Branch Local Government Okaka Geoffrey DAO Grantee Emwodu Joseph M&E Officer NSARWU Partner
APAC LEAD Staff Abera Judith Field Facilitator Aiso Martha Field Facilitator

Page 81
District Organization Name Designation Akello Carolyn Kelly Field Facilitator Apio Lydia Field Officer Musinguzi Robert Field Facilitator Obongo Richard Field Facilitator Okello Godfrey Field Facilitator Okello Lamech Field Facilitator OKOTH ROBERT Field Facilitator
OLWIT DENIS Field Facilitator Grantee/ Produce buyer Local Government Grantee Partner
KAMPALA Uganda Coffee Trade Federation Betty Namwagala Ag. Chief Exec. Officer Uganda Oil Seed Producers & Processors
Association Bruno Agong Ag. Executive Director
aBi Trust Ronald Bielen Risk Management Advisor Naseco (1996) Ltd. Nicolai Rodeyns Managing Director aBi Trust Edward Gitta Value Chain Manager Mukwano Group of Companies-Uganda (AK Fats
& Oils) David Luseesa Extension Services Manager
IITA Piet van Asten Systems Agronomist ACDI/VOCA Iven Ose Country Representative Market Linkages Initiative Charles Mulagwe Technical Project Manager Eastern Africa Grain Council Harriet Nabirye Country Manager-Uganda Catholic Relief Services Jack Norman Country Representative General & Allied Ltd. B NS Gowda USAID/UGANDA MISSION David Eckerson Mission Director Jacqueline Wakhweya Development Finance Specialist Gaudensia Kenyangi Agric. Development Specialist Brian Conklin Deputy Dir, Economic Growth Team Jenna Diallo Private Enterprise Development Officer
KAMPALA LEAD Susan Corning Chief of Party John Fitzgerald FSI Director Peter Wathum Grants/M&E Director Maria P Jaramillo OVC Component Manager Paul Forrest Agric. Unit Director

Page 82
District Organization Name Designation George Kaweesi PO/FFS Specialist Nathan Uringi Coffee VC Manager Jacob Olwo Fish VC Manager Arthur Arinaitwe M&E Specialist Stephen Kiirya Former LEAD Financial/Admin. Controller IFPRI Todd Benson Country Representative-Uganda ACODS Morgan Benedict Head-Animal Traction Program
LIRA ACODS Stephen Otim Accountant ACDI VOCA/EDCO Victor Ochaya M&E Officer Puranga Farm Suppliers James Odongo MD LEAD Dorcas Adul Regional TA

Page 83
Annex E: Map of Uganda Showing MTE LEAD Districts
N
60 0 60 120 Kms
Buvu ma
Aru a
Hoima
Kaa bo ng
Kalan ga la
Lamw o
Napa kNyo ya
Gu lu
Rakai
Apa c
Kib aa le
Kotid o
Kitgu m
Pad er
Amu ru
Kiru hu ra
Aga go
Mukon o
Masin di
Moro to
Mube nd e
Abim
Kase se
Mayug e
Nama yingo
Wakiso
Oyam
Isin giro
Amu riaLira
Nakap irip iri t
Nakase ke
Moyo
Nebb i
Adjuma ni
Yum be
Kata kwiBul iisa
Luwe ro
Ser ere
Kirya nd on go
Masaka
Kyen jojo
Nakaso ngo la
Mpig i
Otuke
Kab ale
Sor oti
Kole
Kib og a
Go mba
Kam uli
Kam weng e
Buye nd e
Mbar ara
Kum i
Amu dat
Kab ar oleMitya na
Buikw e
Kyan kwanzi
Ntu ng amo
Amo latar
Kayu ng a
Ssemb ab ule
Bug iri
To ro ro
Nto roko
Rubi rizi
Kyeg eg wa
Pal lisa
Rukun gir i
Jinja
Dokolo
Ale ba to ng
Kal iro
Ig an ga
Kan un gu
Ib an da
Busia
Lwen go
Zo mbo
Kwee n
Kab erama ido
Buke de a
Ngor a
Kisoro
Luu ka
Bush en yi
Kalun gu
Kob oko
Buh weju
Lyan to nd e
Mbale
She ema
Buta leja
Bukwa
Bun dibu gyo
Kib ukuNamu -tu mba
Mana fwa
Mitooma
Siro nkoBud aka
Buta mba la
Mara cha
Buko man simbi
Bud ud a
Kam pala
Kapchorwa
Bulam buli
Rice , MilletMaize
Coffe e, Mill etFi sh
Coffe e, FishMaize
Maize , Rice
Mille t, MaizeG-n uts, Rice
Rice, M ille t, G-nu ts
Maize , FishCoffe e, Rice
Maize , FishCoffe e, Rice
Coffe e, Simsim
Cassava, FishG-n uts, Rice
Simsim, Su nflo wer,Maize
Fish, S imsimSun flowe r, Maize
Simsim, Su nflo werMaize , Fish
Mille t, Su nflo werSimsimDistr ict B oun da ry
Water bod ie s
Othe r Distr icts
Distr icts Eva lua te d
Legend
MAP OF UGANDA SHOWING DISTRICTS OF LEAD MID TERM EVAL UAT ION

Page 84
Annex F: LEAD Midterm Evaluation Scope Of Work

Page 85

Page 86

Page 87

Page 88
References:CAADP Compact Agreement, signed between GoU and Development Partners Chemonics International.(2008). Moving From Subsistence to Commercial Farming in Uganda, APEP Final Report Contract Between USAID and ARD for the Implementation of the LEAD Project Government of Uganda. (2009). National Development Plan Government of Uganda, COMESA and NEPAD.(2009). Uganda: Review of Ongoing Agricultural Efforts, CAADP Brochure 2 Government of Uganda, COMESA and NEPAD.(2009)b. Uganda: Agricultural Growth and Poverty Reduction: past performance and prospective outcomes, CAADP Brochure 3 Government of Uganda.(2010). Development Strategy and Investment Plan-2010/11 to 2014/15 INSPIRED.(2009). Financing Analysis for LEAD's Value Chains: Coffee INSPIRED.(2009). Uganda Maize Situation Analysis Niringiye, A.(2009).Patterns of Agricultural growth and overall growth of the Uganda Economy, African Journal of Agricultural Research, Vol 4 (12):1364-174
Plan for Modernization of Agriculture. (2010). Enterprise Budget Survey: An Analysis of Crop and Livestock Enterprises Salami,A., Kamara, A B., and Brixiova, Z.(2010). Smallholder Agriculture in East Africa: Trends, Constraints and Opportunities, working paper No. 105 Uganda Bureau of Statistics.(2010). Statistical Abstract LEAD First Annual Progress Report, October 2008 to September 2009 LEAD First Year Work Plan SO7 Economic Growth PMP Indicator Table UBOS 2005/06 National Household Survey Agricultural Model UBOS 2010 Statistical Abstract Uganda Census of Agriculture 2008/2009 Results: Agricultural Holdings and Holding Characteristics

Page 89
Uganda Census of Agriculture 2008/2009 Results: Area and Production of Major Crops USAID LEAD PMP Indicator Tracker for Year 1 and 2 Progress USAID. (Undated).LEAD Award, Section C of Award Document USAID/LEAD .(2009). Newsletter, Volume 1, Issues 2 USAID/LEAD Various Crop Protocols for Farm Field Facilitators USAID/LEAD. (2009).First Annual Progress Report-October 2008 to September 2009 USAID/LEAD. (2009).First Annual Work Plan-October 2008 to September 2009 USAID/LEAD. (2010). Second Year Annual Progress Report, October 2009 to September 2010 USAID/LEAD.(2009). Performance Monitoring Plan USAID/LEAD.(2009). Value Chain Prioritization For USAID-Funded Livelihoods And Enterprises For Agricultural Development (LEAD) Uganda Project