Gender and Diverse Livelihoods in Uganda - gov.uk · LADDER is a research project funded by the...
32
Gender and Diverse Livelihoods in Uganda by Catherine Dolan LADDER Working Paper No.10 February 2002
-
Upload
nguyenmien -
Category
Documents
-
view
218 -
download
2
Transcript of Gender and Diverse Livelihoods in Uganda - gov.uk · LADDER is a research project funded by the...

Gender and Diverse Livelihoods in Uganda
by
Catherine Dolan
LADDER Working Paper No.10
February 2002

ABOUT LADDER
LADDER is a research project funded by the Policy Research Programme of the UKDepartment for International Development (DFID) that seeks to identify alternative routes bywhich the rural poor can climb out of poverty. LADDER is working with nearly 40 villagesand 1,200 households in Uganda, Tanzania, Malawi and Kenya to discover the blocking andenabling agencies in the institutional environment facing rural people that hinder or help theirquest for better standards of living for themselves and their families.
This working paper represents work-in-progress and the reader is advised that it has not beensubjected to academic quality control, nor edited for errors of fact or interpretation. The paperforms part of a mosaic of research findings that will contribute towards an overall picture ofrural livelihoods and micro-macro links to poverty policies in the case-study countries. Thefindings and views expressed here are solely the responsibility of the authors and are notattributable to DFID.
All available Working Papers and Village Reports can be downloaded from the projectwebsite: http://www.uea.ac.uk/dev/odg/ladder/, which also details other information about theproject. For any further enquiries, please email [email protected].

- 1 -
Gender and Diverse Livelihoods in Uganda
by
Catherine Dolan∗
Summary
This paper seeks to contribute a gender perspective to the analysis of rural livelihoodsin three Uganda districts, focusing specifically on how gender-related constraintsinfluence the livelihood options of male- and female-headed households variously. Thegeneral picture emerging from this review is that the livelihood portfolios in Mbale,Kamuli and Mubende districts vary substantially between male- and female-headedhouseholds, and among men and women. In all three districts, household assets andendowments, which are important determinants of household income, are stronglydifferentiated between male- and female-headed households, with the latterconsistently disadvantaged relative to their male counterparts. Evidence alsosuggests that households are diversifying away from farming due to land and capitalconstraints that make reliance on agriculture as a sole income source less viable.However, the potential for, and benefits of, diversification are contingent upon thenature of household headship, as well as upon the kinds of off-farm activities in whichhouseholds are likely to engage.
While the Ugandan government has implemented a far-reaching approach to genderpolicy, FHHs face a number of de facto constraints that circumscribe their capacity toexpand and/or diversify their livelihood portfolios. These include gender specificconstraints such as unequal gender divisions of labour, gender intensified constraintssuch as asymmetries in land rights and financial capital, and gender imposedconstraints such as discrepancies in the provision of credit. The paper argues thatwhile certain constraints pose more serious challenges for the livelihood security ofFHHs than others, changing the way gender relations are materially expressed willrequire long-term commitment to realise the government’s objectives of gender equity.
1. Introduction
There is now a sizeable body of literature documenting the complexity of rural livelihoods indeveloping countries.1 These studies recognise that households seldom specialise in oneincome-earning activity but rather are sustained through myriad strategies of incomegeneration and labour allocation. In Uganda, specifically, households have grown ever moredependent on a broad range of economic undertakings, including agriculture, petty trade, andwage employment.
∗ School of Development Studies, University of East Anglia, Norwich NR4 7TJ. Email
addresses: [email protected]
1 See Ellis, 1998, 2000; Carney, 1998; Singh and Gilman, 1999; Gonzalez de la Rocha, 2000;Chambers, 1983; Chambers and Conway, 1992; and Scoones ,1998.

- 2 -
While the multidimensionality of rural livelihoods is now taken for granted, the role thatgender plays in enabling or disabling these livelihood choices has received relatively littleattention. Yet a number of well known gender-related constraints circumscribe the extent towhich households are willing, or able, to increase their output. For example, livelihoodchoices can be compromised by gender differences in reproductive responsibilities and accessto productive resources (land, capital, labour), as well as gender biases in marketing systemsand infrastructure (Baden, 1998). Female household heads, in particular, face distinctconstraints based on their unique position in the household including their often soleresponsibility for income generation and reproductive work, and higher dependency burdenthan their male-headed counterparts (Rosenhouse, 1989). While some of these constraintscan be difficult to overcome (e.g. cultural and religious norms), others have greater potentialto be addressed through policy measures. Gender-specific information, therefore, might behelpful in formulating a more appropriate policy response by addressing the specificobstacles that female-headed households (FHHs), and women in particular, face in expandingand diversifying their livelihood activities.
This paper seeks to contribute a gender perspective to the analysis of rural livelihoods inthree Uganda districts, focusing specifically on how gender-related constraints influence thelivelihood options of male and female-headed households variously. The paper is structuredas follows. Section 2 discusses why the gender composition of households is important to ananalysis of rural livelihoods, and why gender identities present different opportunities andconstraints for livelihood diversification. Section 3 provides an overview of the compositionof female and male-headed households (MHHs), and presents data on the assets andentitlements with which those livelihoods are constructed. Section 4 outlines the mainfeatures of district livelihood portfolios, examining how participation in particular economicundertakings is conditioned by household headship. Section 5 presents the main constraintsidentified by FHHs, and discusses the extent to which they may or may not be amenable topolicy measures.
2. Gender and Rural Livelihoods
Livelihood strategies are shaped by a broad range of economic, political, and social factors,and vary markedly betwen economic necessity (responding to shocks, vulnerability andpoverty) on the one hand and choice (as a way to further investment, savings andaccumulation) on the other (Kabeer and Ang, 2000).2 However, while livelihood options aremediated by a number of external factors, they are also conditioned by the composition andinternal dynamics of households. Individuals are not simply isolated, independent actors butare embedded in broader systems of household economic activity and undertakings (Newmanand Canagarajah, 2000:8). As several anthropologists have shown, household relations,which are comprised of mutuality and dependence as well as authority and control, oftencircumscribe opportunities for social and economic well-being (Moore, 1988; Guyer,1980,1988; Whitehead, 1981). For example, it is within the household that social divisionssuch as gender and kinship operationalise systems of labour obligation, resource allocationand income distribution giving rise to well-documented inequities. For women, in particular,the position they occupy within household and kinship systems often directly determines their 2 Various external factors -- resource endowments, accessibility to markets, and the capacity
to mobilise social networks -- differentiate local circumstances and structure the nature,form and extent that diversification will play in household livelihood strategies (Ellis, 2000;Whitehead, 2001; Kabeer and Tran Thi Van Anh, 2000; Hussein and Nelson, 1998).
- 3 -
capacity to access and mobilise resources and hence the types of livelihood opportunities thatare open to them.
From a gender perspective, the fact that households are differentiated by individuals withvarying degrees of agency, entitlement and mobility, needs to be central to any analysis oflivelihood diversification. Poverty and economic change not only impose unequal costs andburdens on household members (Beneria and Feldman, 1982), but gender identities alsovisibly shape the options and rights individuals possess. However, the gender of thehousehold member not only shapes access to particular livelihood opportunities but also theway in which social norms are expressed materially. For example, local conceptions ofgender rights and responsibilities (men's work/women's work, men’s expenses/women’sexpenses) will frame the possibilities for engaging in any number of economic undertakings.As a result, the potential to exploit a particular asset or capitalise on a livelihood option is asmuch governed by the social meanings attached to particular tasks (men plough, womenplant) and modes of income generation (men’s export crops, women’s domestic crops) as tothe individual bearer of gender. Hence, identifying the nature of gender relations not onlyprovides a clearer picture of intrahousehold obligations and exchanges, but also shows ushow livelihood strategies are negotiated, structured and legitimated through broaderideological processes.
Yet despite the key role that gender plays in facilitating or inhibiting the pursuit of particularlivelihood options, it has received comparatively little attention in the literature onsustainable livelihoods. While several academic studies have documented the linkagesbetween agrarian change and gender relations (Carney, 1992; Francis, 1998; Kabeer and TranThi Van Anh, 2000; Mackenzie, 1990), few have examined how gender relations bothconstitute and are constituted by household livelihood strategies. Policy makers themselveshave tended to dodge gender dynamics. They either assume that households, whether male orfemale-headed, respond to economic incentives corporately (Warner and Campbell, 2001), orreduce women’s contribution to household livelihoods as “survival” strategies in a context ofgrowing poverty and economic vulnerability (Kabeer and Tran Thi Van Anh, 2000).3
One way of gauging gender differences in poverty levels and livelihood options is to comparethe circumstances of female- and male-headed households. Over the last decade a wide rangeof studies4 have wrestled with the question of whether female-headed households (FHHs) aredisproportionately represented among the poor, and subsequently, whether the category of"female headship" is an appropriate tool for targeting policy interventions. While thesestudies have yielded inconsistent conclusions, pointing to the tenuous and highly contextualnature of the relationship between female headship and poverty, headship neverthelessremains a useful tool for understanding how gender identity might condition the capabilities,entitlements and subsequent opportunities of households. Households headed by women, forexample, are typically endowed with varying amounts and types of resources and capabilitiesthat equip them to respond to change and opportunities differently. As a result, headship canprovide a useful analytical device to identify how households adapt in the face of
3 See Hussein and Nelson (1998)4 See Appelton (1996), Buvinic and Gupta (1997) Bruce and Lloyd (1997), Chant (1997),
Handa (1994) and Fuwa (2000).

- 4 -
vulnerability, and how, more specifically, gender creates variation in the options fordiversification, 5 mobility and investment.
3. District Descriptions
This paper is based on quantitative and qualitative research undertaken to examine the genderdimensions of rural livelihoods in three districts in central and eastern Uganda: Mubende,Kamuli and Mbale.6 These districts were selected to capture the range of livelihood patternsrepresented including farming (crop and livestock production), off-farm, and fisheries-basedactivities (see Table 1). While Mubende, Kamuli and Mbale are generally classified asbelonging to the montane, banana/finger millet/cotton, and banana/coffee farming systemsrespectively, there is considerable variability between and within districts. For example,Mubende district, which represents the typical banana/coffee production systems, is locatedin the Central Region, approximately 160 kilometres to the west of Kampala. The moreremote areas of the district are relatively land abundant due to the depopulations arising fromyears of civil war.
In contrast, Mbale district, which belongs to the coffee/cotton/maize production system, is anarea of extreme land shortages. Lying on the slopes of Mt Elgon (4,321m) and some 250miles from Kampala, the district is extremely densely populated, with an average populationdensity7 more than three times the national average. Land scarcity is a significant factorunderlying the choice of livelihoods in the region as the viability of farming diminishes forsuccessive generations.
Finally, Kamuli district, bordering Lake Kyoga in the North, is based on the maize, millet androot crop farming systems, with considerable reliance on livestock grazing in some areas.While agriculture is the mainstay of economic activity, the district is distinguished fromMbale and Mubende by the importance of fishing to community livelihood strategies. This isparticularly important from a gender perspective as there is considerable seasonal migrationof fishermen, resulting in a high number of de facto female household heads in the area.
5 While the relationship between female headship and poverty varies widely, evidence
suggests a positive an association between poverty and the extent to which households aresustained through female earnings (Buvinic and Gupta, 1997, Chant, 1997).
6 Three villages were selected in each of the three districts, with a sample size of 35households for each village. A series of PRA and wealth ranking activities were undertakento ensure that the households drawn from each village represented, as broadly as possible,the full range of livelihood activities.
7 Average population density is 284 persons per sq km (James, Francis, and Turiho-Habwe,2001).

- 5 -
Table 1: Main Livelihood Features of Sample Districts
Mbale Mubende Kamuli
Crop Production Banana, maize, beans,sweet potatoes, coffeeMaize, beans,bananas, cotton, sweetpotatoes and millet,horticulture
Bananas, maize,beans, Irish potatoes,ground-nuts, cassava,sweet potatoes, coffee
Maize, sweet potatoes,cassava, finger milletand cotton
Livestock and Fish Dairy cattle, pigs,goats, chickens
Cattle (milk andmeat), chickens andgoats
Cattle (meat), goats,chickens and ducks,Nile Perch, mukene,Tilapia, Lung fish
Off- Farm Sale of labour, pettytrade (producevending, brewing,bicycle transport,brick making,brewing, shopkeeping)
Sale of labour (farm),petty trade (producevending, tradingbanana juice, charcoal,mats, handicrafts,beer, porridge, snacks,brick making, clothesvending), foodprocessing, shopkeeping, transport,construction,governmentemployment, tailoring,hunting
Fish trading, fishcarrying, sale oflabour, transport(bicycles and boats)shop keeping,firewood, brewing
Source: Qualitative research conducted in 9 Uganda villages in Jan-April 2001
4. Household Portfolios
In Uganda, the circumstances under which women become household heads, and the optionsand constraints this engenders, is particularly germane. Evidence suggests that between 20per cent and 30 per cent of all households in the country are female-headed, and that FHHsmay be among the most vulnerable of the country’s population (Elson and Evers, 1997;Manyire, 1994; Goetz, Maxwell and Manyire, 1994). In this study, the proportion of female-headed households was similarly prevalent, constituting 20 per cent, 20 per cent, and 15 percent of sample households in Mbale, Kamuli and Mubende respectively. Between 15 percent and 30 per cent of these households were de facto female-headed, with the spousereported as mostly or permanently away. 8 The average age of household heads in de facto
8 While the issue of what constitutes the category of female headship is widely debated, the
classification of FHHs nevertheless influences the type of policy inferences that can bedrawn. For example, Buvinic and Gupta (1997) illustrate how even within the same countrythe likelihood of FHHs being poor varies according to the nature of circumstances thatprecipitated headship. In this paper FHHs include the following: a) female entered on

- 6 -
FHHs is less than de jure heads (34 in contrast to 55), with the latter characterised by a highproportion of widows.
As Table 2 (facing) indicates, the mean household size of FHHs is smaller than MHHs in allthree districts. While the age profile of household members is comparable, FHHs as a wholehave fewer resident economically active adults (EAAs) than MHHs, with 73 per cent ofsample FHHs containing one or fewer EAAs in contrast to 17 per cent of MHHs.
The smaller labour pool of FHHs not only influences their production and investmentdecisions, but leaves them less equipped to cope with seasonal stresses and otherunpredictable livelihood shocks. Conversely, FHHs have more non resident EAAs than theirmale counterparts, indicating greater levels of household out-migration. Migration isespecially high in Mbale, where 37 per cent of all FHHs reported at least one householdmember permanently or mostly away. In the majority of cases, migration is mainlyundertaken by adult sons, who generally travel outside the districts in search of agriculturally-based work (less than 30 per cent of migration was for activities outside of agriculture).
Women’s mobility is curtailed by familial and/or childcare responsibilities, as well as culturalstereotypes that stigmatise the independent movements of women in rural areas. As a result,female migrants generally consist of daughters who have migrated to other parts of thecountry for purposes of marriage. While income is only one dimension of poverty9, in purelyeconomic terms FHHs are disadvantaged relative to their male counterparts. Firstly, usingincome as a proxy for economic welfare, the proportion of FHHs situated in the lowestincome quartile is higher in all three districts, with the disparity particularly notable in theagriculturally-based regions of Mbale and Mubende (see Table 3). Conversely, MHHspredominate in the highest income quartiles.
These findings are further reinforced by per capita income data, with mean per capita incomelower in FHHs than in MHHs in all three districts.10 This poverty is partly a product ofFHHs’ inability to diversify into higher return activities, which is discussed in Section 4.However, within female-headed households, the qualitative research suggests that widows(particularly older widows) fare much worse than either de facto female heads or divorcedwomen in terms of economic welfare. While the quantitative survey cannot substantiate this,widows typically expressed higher levels of income vulnerability and impoverishment. Thissuggests that widow-headed households may be worse off, both among all sampledhouseholds as well as within the category of FHHs itself. 11
survey form as household head (HHH: but excluding cases where there is a residenthusband listed as well); b) female entered as 'Wife', but no resident husband; c) nobodyentered as HHH, no husband listed; and d) husband or male household head listed aspermanently or mostly away.
9 As Chambers (1989) argues, maximising incomes may be less of a priority among the poorthan decreasing the vulnerability and enhancing the security of their livelihoods.
10 Per capita income was Ush 562,315 (USD 320) among MHHs in contrast to 388,306 (USD221) among FHHs.
11 See Appelton (1996) for a similar conclusion on Uganda as a whole.

- 7 -
Table 2. Selected HH Assets by Gender of HHHAll Mbale Kamuli Mubende
Male Female Male Female Male Female Male FemaleMean no. of years in education per EAA* perHH
4.8 3.1 5.7 2.6 4.6 3.1 4.2 3.9
Total no. of years in education (resident EAAs) 10.5 5.2 12.0 3.7 10.2 4.8 9.4 7.8No. of years in education - household head 5.6 3.7 6.4 3.2 5.7 3.7 4.8 4.5HH Size (Actual - resident) 5.8 4.0 6.0 4.0 5.9 3.8 5.5 4.1HH Size (Actual - non-resident) 0.9 1.7 1.2 2.3 0.9 1.3 0.6 1.4AEUs: residents 3.9 2.7 4.1 2.6 3.9 2.6 3.8 2.8AEUs: non-residents 0.7 1.4 0.9 2.1 0.6 0.9 0.5 1.3AEUs: homestead 4.6 4.1 5.0 4.8 4.6 3.5 4.3 4.1No. of resident EAAs 2.1 1.3 1.9 0.9 2.2 1.3 2.1 1.6No of non-resident EAAs 0.6 1.5 0.9 2.3 0.5 0.8 0.5 1.4Percent with Migrant Household Members 11.8 23.1 18.6 36.8 8.1 15.8 8.8 14.3Percent Receives remittances 9.9 44.2 10.5 63.2 10.5 31.6 8.8 35.7Area owned (ha.) 1.6 0.8 1.6 1.2 0.8 0.3 2.2 1.1Area farmed (ha.) 1.4 0.8 1.6 1.2 0.9 0.2 1.6 1.0Livestock holding in CEUs12 2.2 0.5 1.4 0.7 2.9 0.2 2.4 0.6Tools13 10.8 7.8 15.5 7.1 3.2 0.9 13.6 18.0Boat assets14 15.5 9.7 . . 15.5 9.7 . .Fishing gear assets 14.6 7.8 . . 14.6 7.8 . .Age of household head 40.4 50.1 42.1 55.4 38.3 45.8 41.0 48.6
*EAA = Economically active adults (Individuals aged 15-60 inclusive, except those in education)Source: Sample survey conducted in 9 villages Jan-April 2001
Table 3. Distribution of HHs Across Per Capita Income Quartiles by Gender of HHH (%)
Per capita incomequartiles for wholesample
All Mbale Kamuli Mubende
Male Female Male Female Male Female Male FemaleLowest 23.2 34.6 22.1 36.8 23.3 31.6 23.1 35.7Mid Low 24.3 28.8 23.3 36.8 24.4 31.6 26.4 21.4Mid High 26.2 19.2 29.1 5.3 24.4 26.3 24.2 28.6Highest 26.2 17.3 25.6 21.1 27.9 10.5 26.4 14.3
Total 100.0 100.0 100.0 100.0 100.0 100.0 100.0 100.0 Source: Sample survey conducted in 9 villages Jan-April 2001
12 CEUs are Cattle Equivalent Units based on the following comparative values: Cattle = 1;
Goats = 0.12; Pigs = 0.14; Sheep = 0.10; Turkeys = 0.04; Chickens = 0.02; Other = (givenprice/5 per cent trimmed mean price for cattle).
13 Tools are a value-based index for ownership of axes, hoes, knives & sewing machines. TheHH tool index = (total HH value of tools/maximum value within district sample) x 100.
14 Asset index. Boat assets = No. owned (per type) x 5% trimmed mean current cost (pertype). Standardised by: (HH value/max value) x 100.

- 8 -
Secondly, economic welfare is also based on the assets, entitlements, and capabilities ofhouseholds. As Table 2 indicated, FHHs support a narrower range of asset stocks than theirmale-headed counterparts, irrespective of type and district. Such incongruities may haverepercussions on livelihood possibilities as the nature and quantity of assets stocks (e.g. land,livestock, water, credit, human capital) often directly shapes a household’s capacity to moveout of poverty.
In terms of human capital, residents of FHHs have half as many years in education as theirmale counterparts. At an individual level, 8 per cent of women in contrast to 32 per cent ofmen had attained no education whatsoever, with the gap more pronounced at secondary andtertiary levels. These gender differentials have implications for wider social and economicwelfare. The capacity of a household to engage in off-farm work or otherwise diversify itsincome sources is commonly associated with its level of educational attainment, with wagerises and other opportunities corresponding with educational achievement. Further, lowlevels of education among FHHs are believed to perpetuate a cycle of intergenerationaldeprivation, as children’s educational outcomes are jeopardised by household poverty15
(Appleton, 1996; Fuwa, 2000).
5. Household Livelihood Activities and Incomes
In all three sample districts, households pursue diverse livelihood strategies comprised ofcrop and livestock production, wage and self-employment, and a plethora of natural resource-based activities. While female and male-headed households (as well as the men and womenwithin them) share many of the same economic undertakings, their reliance on particularactivities differs (see Table 4). This section examines the main income earning strategies ofhouseholds, and specifically, how gender composition conditions the nature of thosestrategies.
Table 4. Aggregated Income Portfolios* by Gender of HHH, All Cases and by District Sample**All HHs Mbale Kamuli Mubende
All Cases Male Female Male Female Male Female Male Female% of total
income% of total
income% of total
income% of total
income% of total
income% of total
income% of total
income% of total
income
Bananas 20.1 28.1 34.4 47.2 0.0 0.0 29.0 34.9Other food crops 11.7 10.2 9.4 13.4 6.6 2.6 24.4 13.8Cash crops 0.6 0.1 1.0 0.2 0.0 0.0 1.0 0.1Livestock 6.0 1.2 4.7 0.2 3.3 1.1 12.6 2.3
Total Agriculture 38.5 39.6 49.5 61.0 9.9 3.7 67.1 51.1Wages 10.8 9.4 14.1 8.7 6.1 11.2 13.0 8.5Self-employment* 26.7 31.1 34.7 13.2 23.3 46.3 18.3 34.1Fish 22.8 8.2 0.0 0.0 60.1 26.2 0.0 0.0Transfers 1.2 11.8 1.6 17.1 0.6 12.6 1.7 6.3
Total Non Farm 61.5 60.4 50.5 39.0 90.1 96.3 32.9 48.9Source: Sample survey conducted in 9 villages Jan-April 2001
15 However, there is also evidence that women tend to allocate a greater proportion of
household resources to their children, and thus children in FHHs may gain from suchpreferences.

- 9 -
Agriculture: Crop-Based Activities
In all three districts, agrarian-based activities16 play an important role in the livelihoodstrategies of rural households, with the gender profile of these activities representative of thecountry as a whole. For example, in Uganda, 90 per cent of rural women and 53 per cent ofrural men are engaged in agricultural production, with women responsible for 80 per cent offood crop and more than 50 per cent of cash crop production (Kasente et al., 2000; Elson andEvers, 1997). In Mbale and Mubende, reliance on agriculture is similarly predominant,especially among FHHs who derive 61 per cent and 51 per cent of all household income fromfarm-based activities (see Table 4). In fact, over 10 per cent of FHHs in both these twodistricts are solely reliant on farming, garnering no income outside of the sale of agriculturalproducts.
Both Mubende and Mbale produce a broad range of food and cash crops including bananas(both cooking and eating), maize, beans, sweet potatoes, coffee, cotton, millet, andhorticulture (see Table 5). In both districts coffee, formerly among the most remunerativecash crops, has declined over the last decade,17 with the market production of maize, beansand bananas becoming more prevalent. Kamuli is also characterised by crop and livestockproduction, with maize and mixed maize plots dominating lakeshore farm systems.
Table 5. Proportionate Crop Incomes by Gender of HHHAll Districts Mbale Kamuli Mubende
Crop Male Female Male Female Male Female Male Female% ofcrop
income
% ofcrop
income
% ofcrop
income
% ofcrop
income
% ofcrop
income
% ofcrop
income
% ofcrop
income
% of cropincome
Bananas -cooking
61.4 73.2 76.1 77.6 0.0 0.0 52.6 71.5
Bananas - sweet 0.5 0.0 0.5 0.0 0.0 0.0 0.6 0.0Beans 4.5 4.7 3.0 4.3 0.5 -0.9 7.5 5.3Coffee 1.8 0.2 1.9 0.3 0.0 0.0 1.9 0.1Cassava 6.6 2.7 1.4 0.0 45.5 -4.4 6.1 6.1Cotton 0.1 0.0 0.2 0.0 0.4 0.0 0.0 0.0Groundnut 1.7 0.4 2.5 0.5 -0.7 -4.1 1.1 0.4Irish potatoes 1.7 2.1 0.0 0.0 0.0 0.0 4.6 4.6Millet - finger 0.6 3.1 0.9 5.5 -0.2 5.9 0.3 0.2Maize 10.3 6.4 5.8 7.6 19.9 26.2 14.8 4.2Other crops 6.1 1.9 4.6 0.1 19.1 5.1 5.6 3.9Sorghum 0.1 0.2 0.0 0.2 1.1 0.0 0.2 0.2Sweet potatoes 3.6 5.1 1.8 3.8 14.6 72.3 4.0 3.5Tobacco 0.1 0.0 0.2 0.0 0.0 0.0 0.0 0.0Vegetables 0.8 0.0 0.9 0.0 0.0 0.0 0.7 0.0
Total cropincome
100.0 100.0 100.0 100.0 100.0 100.0 100.0 100.0
Source: Sample survey conducted in 9 villages Jan-April 2001
16 This includes both crop and livestock production.17 In Mbale, this decline is a product of increased land fragmentation, coupled with the
dissolution of state sponsored co-operatives in the early 1990s. In Mubende, it isattributable to coffee wilt disease.

- 10 -
However, in contrast to Mbale and Mubende, farming activities comprise a much smallerproportion of livelihood activities in Kamuli, with fishing and fishing-related employment theprimary source of income for most households. In part this reflects the dwindling viability ofagriculture due to land constraints and widespread drought. The principal crops grown in theDistrict-- millet, cassava, maize, sweet potatoes, beans, coffee and cotton -- have all beenaffected by drought, with many women either reducing the area under cultivation, or ceasingto cultivate altogether due to insufficient rainfall. As one female head claimed, 'There is norain, therefore I cannot waste my money' [on farming].
The significance of particular crops to overall household income, however, varies betweenfemale- and male-headed households. For example, 28 per cent of total household income infemale-headed households is derived from a single crop – cooking bananas (matooke) – incontrast to 20 per cent of income in male-headed households. Further, As Table 5 indicates,cooking bananas alone comprise 73 per cent of all crop income in FHHs.
While several respondents reported a decline in the sex segregation of crops, most householdscontinue to demarcate fields for ‘women’s crops’ and ‘men’s crops’. These culturalassociations condition the types of crops that are typically grown on male versus female land,with women’s garden plots earmarked for maize, beans, bananas, and cassava, grown forfamily provisioning and sale on the local market. Men’s crops, which include coffee, cotton(Mubende), banana, maize, Irish potatoes, beans and cassava, are generally sold. In general,it is the outlet (consumption versus sale) rather than the crop itself that is delineated bygender. As Table 6 reveals, male-headed households direct a larger proportion of crops,excepting Irish potatoes, to the market (both domestic and export) than do female-headedhouseholds.
Table 6. Aggregate Proportions (%)1 for Crops Sold, by Gender ofHHH (%)
Male Female All HHsAggregate %
soldAggregate %
soldAggregate %
soldBananas - cooking 35.5 29.2 34.8Bananas - sweet 47.6 47.6Beans 47.5 43.8 47.2Coffee 98.2 74.1 98.0Cassava 23.0 7.8 22.5Cotton 100.0 100.0Groundnut 29.3 21.9 29.1Irish potatoes 68.4 73.6 68.9Millet - finger 23.4 8.4 19.1Maize 64.5 39.3 63.3First other crop 45.9 0.0 44.5Second other crop 90.9 72.8 90.7Third other crop 95.4 0.0 94.8Sorghum 75.8 68.2Sweet potatoes 7.0 6.0 6.9Tobacco 100.0 100.0Vegetables 75.9 75.9Source: Sample survey conducted in 9 villages Jan-April 2001

- 11 -
Similarly, while men and women are assigned normative responsibility for specific crops,several respondents reported less rigidity in the distinction between male and femaleagricultural tasks, and some chinks in prevailing gender ideologies. This was particularlymarked in Mubende where extensive gender sensitisation has been undertaken in rural areas.However, in most households, the labour process is still governed by cultural norms of rightsand responsibilities, with clear expectations of work allocation by gender. For example, menretain primary responsibility for land clearing and ploughing while women are responsible forsowing, planting, weeding and harvesting, on both their own and their husband’s crops (seeTable 7). According to one female head, however, these definitions are particularlyuncompromising with “workloads culturally termed as women’s work.” In most cases,visible disparities in agricultural labour burdens persist, and what is culturally termedwomen’s work actually means longer hours as unpaid family workers. Several female headsalleged that the only way that labour allocation could become ‘ungendered’ was throughillness, death, or divorce in the family, compelling men to assume more responsibility forostensibly ‘female’ tasks.
Table 7: Land Use by Gender of Cultivator% of total area for crop cultivated by:
Use Joint Female Male UnspecifiedBananas 57.0 22.0 1.3 19.6Banana/coffee 57.6 23.6 5.4 13.5Banana/other 27.7 52.8 11.5 8.0Maize/maizemixtures
62.9 21.3 3.7 12.1Millet 44.6 39.5 0.0 15.9Food crop mixture(grain/root/pulses)
76.8 17.8 3.8 1.7Roots (monocrop) 58.8 27.2 1.5 12.5Pulses 36.6 37.3 3.5 22.6Livestock uses 63.5 8.2 14.3 14.0Other 5.8 1.9 2.9 89.5Unspecified 7.9 0.0 92.1
Total 46.6 20.1 3.9 29.3*U= UnspecifiedSource: Sample survey conducted in 9 villages Jan-April 2001
Agriculture: Livestock Activities
In contrast to crop production, livestock rearing plays a relatively small part in the economicportfolio of sample households despite its importance as a buffer against market and climaticshocks. There are, however, clear gendered patterns of livestock ownership, with male andfemale-headed households characterised by different levels and types of livestockendowments.
Overall, reliance on livestock as an income earning strategy is considerably less among FHHsthan MHHs, with the former deriving only one percent of their total household income fromlivestock. As Table 8 illustrates, a significant proportion of FHHs have no livestockwhatsoever. For example, while the percentage of sample FHHs owning no cattle was 85 percent overall, varying between 68 per cent in Mbale, 86 per cent in Mubende and 100 per centin Kamuli, it was significantly less among MHHs (68 per cent: see Table 8).

- 12 -
In general, ownership of small stock (chickens, goats, pigs, ducks and rabbits) is morewidespread among FHHs with 39 per cent, 31 per cent and 15 per cent of all sample FHHsowning chickens, goats and pigs respectively. Despite the marginality of livestock to overallhousehold income, several female heads adopted livestock rearing (particularly larger stocksuch as goats and pigs) as an investment strategy, enabling them to either augment existingincome earning strategies or diversify into something new.
As one female head in Mbale described, “I have more farming activities now because Ibought a cow and 2 goats a couple of years ago. I wanted to invest my money in order to beable to pay my granddaughter’s school fees when she starts school. I also wanted to get cowdung to fertilise my bananas, and I milk too’. In addition, several female heads referred tothe importance of livestock as an asset that could be quickly liquidated in circumstances ofeconomic shortfall or for lumpy expenditures such as medical care, school fees or to paybride price for married daughters. As one respondent from Mbale said, ‘We are trying toinvest our money in cows so that in the future, we can sell them to cover our children’sschool fees’.
Table 8. Percent of Households Owning No Livestock, by Gender of HHHAll Mbale Kamuli Mubende
M F M F M F M FCattle 68.4 84.6 61.6 68.4 70.9 100.0 72.5 85.7Goats 52.9 69.2 57.0 52.6 46.5 78.9 54.9 78.6Chickens 30.0 61.5 11.6 36.8 40.7 84.2 37.4 64.3Source: Sample survey conducted in 9 villages Jan-April 2001
While FHHs may have fewer livestock endowments than their male counterparts, women inFHHs generally experience fewer restraints to securing access to, and control over livestockand livestock products than do women in MHHs. For example, none of the female headsinterviewed were limited by restrictions as to which animals they could maintain and/or sell.In contrast, the potential of women within male-headed households to exercise claims tolivestock was contingent upon marital negotiations and the leverage that they could exertwithin their households. While there was substantial intra-district variation, for the most partwomen in MHHs reported that they do not control the disposal or sale of the animals theytend, and must consult their husband before an animal is sold. Similarly, women may controlsome, but not all, livestock products such as meat, milk and manure but not the right tosell/use animal skins and/or wool.
Non Farm Income Activities
While agriculture is an important ingredient in household livelihood strategies, over the lastdecade new avenues for income generation have emerged, reflecting the growingmonetisation of the rural economy and the importance of off-farm income to householdincome portfolios (James, Francis, and Turiho-Habwe, 2001). Recent development literaturehas generally depicted diversification into off-farm activities favourably, associatingdiversification with poverty reduction, employment generation and enhanced market linkagesfor rural households (Reardon, 1997; Yunez-Naude and Taylor, 2001; Ranis and Stewart,1993; Ellis, 2000). In Uganda, for example, poverty levels among households participating innon farm activities experienced a more precipitous decline than among those solely reliant on

- 13 -
agriculture.18 This decline was particularly marked among FHHs, where the decrease inpoverty for those participating in non farm activities was greater than that experienced inMHHs (Newman and Canagarajah, 2000). However, has diversification similarly bufferedsample households against vulnerability and poverty? And, are the types of diversificationactivities undertaken conditioned by the composition and headship of households?
Diversification and Income
Across all sample districts there is evidence that households are diversifying away fromagriculture. The impetus for this diversification stems largely from the crisis in agriculture,with all three districts beset by declining soil fertility, crop and livestock diseases, increasedland fragmentation, and climatic change in recent years. As a result, households (both maleand female-headed) now straddle several different types of income generating activities andrely on myriad non farm income sources to comprise household livelihood portfolios. Theinterlocking nature of these strategies was captured by one female head who said, ‘I was onlyinvolved in farming 5 years ago. I sell my labour now, because at least I can get food to feedthe children with. I grow more bananas because even if it is the dry season, we can still getsome food from them. I keep chickens too, because they are easy to look after and I can sellsome when I don’t have any money’. Among female-headed households specifically, incomefrom non farm sources represents 39 per cent, 96 per cent and 49 per cent of total householdincome in Mbale, Kamuli and Mubende respectively (see Table 4 on page 8).19 Thecontribution of this income to the overall household income level is clear. As Table 9illustrates, 64 per cent of FHHs with no access to off-farm income fall into the lowest incometercile in contrast to 26 per cent of MHHs. Income from these off-farm sources is generallyderived from three broad categories: self-employment, wage employment, and remittances.
Table 9: Distribution of 'No Non Farm Income' Across Income Tertiles,by Gender of HHH (%)
All Mbale Kamuli MubendeMale Female Male Female Male Female Male Female
Low 26.2 64.3 40.0 66.7 100.0 0.0 23.8 75.0Middle 47.6 21.4 35.0 11.1 100.0 52.4 25.0High 26.2 14.3 25.0 22.2 0.0 23.8Total 100.0 100.0 100.0 100.0 100.0 100.0 100.0 100.0
Source: Sample survey conducted in 9 villages Jan-April 2001
(a) Self Employment and Trade
The majority of sample households are characterised by extensive participation in selfemployment and trade-related activities (see Table 10).
18 For example, among households whose primary occupation was agriculture, poverty fell by20 per cent and for those in non-farm activities, it fell by 31 per cent. In contrast, amonghouseholds working entirely in non farm activities poverty fell by 42 per cent in contrast toagriculture only at 17 per cent (Newman and Canagarajah 2000).19 These figures are consistent with Reardon’s (1997) review of 23 studies in SSA, whichcalculated over 45 per cent of rural household income based on non farm activities.

- 14 -
Table 10. Percent of HHs with Non-farm Income by Gender of HHH, by District (%)All Mbale Kamuli Mubende
Male Female Male Female Male Female Male FemaleNone 16.0 26.9 23.3 47.4 1.2 5.3 23.1 28.6Wages 24.7 15.4 29.1 21.1 12.8 15.7 31.9 7.1Salary 1.9 3.5 2.2Self-employment 30.0 32.7 32.6 26.3 24.4 31.6 33.0 42.9Fishing 7.2 1.9 22.1 5.3Multiple 0.4 1.2Wages & self-employment 8.0 15.4 10.5 5.3 3.5 21.1 9.9 21.4Salary & self-employment 0.4 1.9 1.2 5.3Fishing & wages 0.8 2.3Fishing & self-employment 10.6 5.8 32.6 15.8
Total 100.0 100.0 100.0 100.0 100.0 100.0 100.0 100.0Source: Sample survey conducted in 9 villages Jan-April 2001
These activities are comprised of a mixture of food processing, produce vending, retailtrading, the transportation of produce and people by bicycle (boda boda), brick-making,malwa brewing/ trade, handicrafts, charcoal, food preparation and vending, shop keeping,brewing, selling clothes, hunting, brick making, transport, construction, and a range of otherpetty trade activities. Most of these activities are characterised by strong genderdifferentiation, with women (in both male- and female-headed households) predominantlyselling cooked/processed food, alcohol, and charcoal, and men involved in brick making, beertrading, and fish processing.
Overall, FHHs are highly dependent on self-employment activities, with a greater proportionof income in FHHs derived from self-employment activities (31 per cent) than their malecounterparts (27 per cent). In fact, while mean household income is higher among MHHsacross the sample as a whole, income derived from businesses is considerably greater amongFHHs than MHHs (1,329,807 to 927,246 Ushs).20 This difference is particularly salient inKamuli, where participation in self-employment activities -- processing and trading waragi21
and cooked food, handicrafts, brick making, selling firewood, and fish processing and trading-- is sizeable. In Kamuli, 43 per cent of FHHs in contrast to 13 per cent of MHHs areengaged in self-employment activities, largely due to the dominance of fish trading. While adecline in the quality/quantity of fish stocks has precipitated a move away from the morelucrative Tilapia and Nile Perch toward mukuene trading, for many women the mukuene tradecontinues to furnish opportunities for income, both for subsistence as well as for investmentin other income generating activities. Obtaining the capital to engage in mukuene 22
processing and trading, however, varies between women in MHHs and FHHs households.For example, married women obtain the initial capital from their husbands, who provide theirwives with Ushs.3,500/ (equivalent to about 6 basins of mukuene) at marriage to enter themukuene trade in order to contribute to household income. Among FHHs, the capital toengage in fish processing and trading is typically acquired through the sale of local food 20 This is equivalent to 751.30 and 523.87 USD. In April, 2001, 1,000 Uganda Shillings(Ushs) = 0.56497 US Dollars (USD); 1,000 USD = 1,770,000 Ushs21 An alcohol distilled from cassava.22 Prices of mukuene vary but a basin generally costs between Ushs.3,000-5,000/= freshweight and Ushs.4,000-4,500/= dry weight.

- 15 -
crops, which are now threatened by drought. However, in both cases, women’s capacity torealise more substantial gains from fishing is curtailed by social norms that proscribe femaleparticipation in fish harvesting itself.23 While many women said they would like to acquirethe skills in fishing, there are no opportunities do so, both due to lack of capital and thepotency of cultural norms.
While diversification into self-employment activities is widespread, to what extent does itembody possibilities for long term security and broader accumulation? From a genderperspective, the picture is mixed. For female-heads in Kamuli, trade has indeed broadenedtheir options, if not economically then socially. In fact, all women who were asked which oftheir income earning activities they valued the most cited trading due to the enhanced statusand economic autonomy it conferred. On the other hand, self-employment may have limitedpotential for long term investment and growth.
Firstly, while participation in self-employment enables women to balance income earningwith domestic responsibilities, trade is also an area in which gender segregation anddifferential remuneration are apparent. FHHs and women in particular tend to beconcentrated in low wage activities such as selling cooked food, alcohol, juice andhandicrafts on the local market.
In Mubende, for example, while both men and women trade in coffee, women trade inparchment beans (due to a lack of capital to engage in coffee processing) while men sellprocessed coffee. In most cases women sell their coffee at the farm gate to traders who offerlower prices than can be obtained in market centres. Further, with the exception of fishtrading, women are restricted to participating in businesses that have few entry barriers andlow start up costs, with the income derived from these activities markedly less than theincome garnered through men’s trading activities.
This type of labour market segregation has been documented in other parts of SSA.Whitehead (2001) cites Scotts’ (1995) work in Zimbabwe, which demonstrated that brickmaking (a ‘male’ occupation) garnered 7 times as much income as beer brewing (a ‘female’occupation) despite comparable investment. Similarly, Hussein and Nelson (1998) showedthat women’s main off-farm income earning strategy (selling beer) was less profitable thanmen’s (selling grain) in Burkina Faso. Such gender segregation limits the potential of tradeas an avenue for upward mobility among women in either male- or female-headedhouseholds.
Secondly, while there is a strong correlation between participation in diversified incomesources and income levels across case-study districts, this correlation is less auspicious forfemale-headed households engaged in self employment. Despite the substantial participationof FHHs in self-employment, and their concomitant dependency on it as an income source,close to 50 per cent of FHHs engaged in self-employment fall into the lowest per capitaincome tercile (see Table 11). This suggests that the association between gender ofhousehold head and occupation may be a strong indicator of household poverty.
23 According to cultural norms, the presence of a woman on a fishing expedition jeopardises
the prospects of a successful catch, and hence, women are limited to fish processing andtrading.

- 16 -
Table 11. Participation in Self-Employment, by Gender of Household Head and Income Terciles
All Mbale Kamuli MubendeGender of HH Male F Male F Male F Male F
All lowest 30.4 47.1 28.6 40.0 42.9 66.7 30.0 33.3All middle 29.1 11.8 35.7 20.0 33.3 16.7 33.3All highest 40.5 41.2 35.7 40.0 23.8 33.3 53.3 50.0
Total 100.0 100.0 100.0 100.0 100.0 100.0 100.0 100.0Source: Sample survey conducted in 9 villages Jan-April 2001
Thirdly, it is important to distinguish between diversification activities that are adopted toreduce risk and avert crisis from those that are part of wider household accumulationstrategies (Reardon, 1997). For most FHHs, particularly those in Mbale and Mubende,participation in self-employment reflects a dearth of alternative options rather than anopportunity to capitalise on investment opportunities. As one female respondent claimed,“‘[Non-farm activities are the] only sources of livelihood where I get money to feed myfamily, buy clothes and pay school fees’. Another said that, “I would prefer to plant moremaize and beans but I don’t have enough money to hire cows to plough the land. I need tosell local brew, which gets enough income to supplement what I get from farming’. Thissuggests that not only would households prefer to remain in farming but that they arecompelled to diversify, choosing self employment in the face of deteriorating economicoptions.
(b) Wage Employment
A second avenue of livelihood diversification is through wage employment, particularly asthe opportunities for farm labour expand in the region and households place more workers inthe labour market as a defence against poverty. While more men are involved in wageemployment than women, in both Mbale and Kamuli the stigma formerly attached to womenworking on the land of others has diminished, with approximately 10 per cent of women inthe labour market in both those districts. In Kamuli, for instance, the increase in female wagelabour was attributed to the government gender sensitisation campaign conducted as part of awider appeal to the community to diversify its income generating activities. The prevalenceof female wage employment remains low in Mubende due to strong patriarchal norms thatassociate female labour participation with male default on marital responsibilities.
The nature of wage employment, however, is gender specific. While both men and womenare engaged in seasonal employment on nearby farms (see Table 12), women are hired for thelabour-intensive tasks of planting, weeding, heaping potatoes, harvesting maize and coffee,collecting firewood for sale, and selling water. Men predominate in tasks that requiresignificant physical strength such as land clearing, ploughing, brick making, logging,transport (on heads), and construction of pit latrines. In addition, a greater share of men areengaged in regular wage employment than women, suggesting a link between gender andhousehold migration strategies.
As discussed in Section 3, within FHHs there is a higher proportion of men that migrate thanwomen, indicating either that men have greater mobility or that they have more earningpower when they migrate. The latter may be related to education, as the types of employmentthat men and women obtain is correlated to their educational level with higher levels ofeducational attainment translating into more secure and better remunerated positions.

- 17 -
Conversely, lower levels of education are associated with farm labour, and otherwise manual,unskilled work in which women predominate (Muzaki, 1996).
Table 12: Participation in Wage Labour by Gender of Individual - All CasesAll Districts Mbale Kamuli Mubende
Men Women Men Women Men Women Men WomenWorktype % of % of % of % of % of % of % of % ofSeasonal wage 15.5 5.3 14.5 6.7 9.0 7.3 22.4 1.9Regular wage 13.1 2.2 25.0 2.9 6.0 2.7 11.2 1.0Seasonal wage & business 1.8 0.6 5.3 0.0 0.0 0.9 0.9 1.0Regular wage & business 0.7 0.3 0.0 0.0 1.0 0.0 0.9 1.0
Total 31.1 8.5 44.7 9.5 16.0 10.9 35.5 4.8Source: Sample survey conducted in 9 villages Jan-April 2001
At a household level, while wage employment constitutes a lower proportion of householdincome in FHHs, there is substantial intra-district variation. Wage employment figures lessin the livelihood portfolios of FHHs in Mbale, where crop based activities are prominent andmore strongly in Kamuli, where agriculturally-based activities have become less viable (seeTable 13).
Table 13. Aggregated Wage Income Portfolios* by Gender of HHH, All Cases and by District Sample**All Mbale Kamuli Mubende
Male Female Male Female Male Female Male Female% totalincome
% totalincome
% totalincome
% totalincome
% totalincome
% totalincome
% totalincome
% totalincome
Regular wages 6.2 3.9 8.9 2.2 3.4 6.5 6.0 4.6Seasonal wages 2.5 2.9 2.6 2.0 1.0 3.6 4.8 3.9Govt/parastatal salary 2.2 0.0 2.6 0.0 1.7 0.0 2.2 0.0Private sector salary 0.0 0.2 0.0 0.0 0.0 1.0 0.0 0.0
Total wage 10.8 7.0 14.1 4.3 6.1 11.2 13.0 8.5Source: Sample survey conducted in 9 villages Jan-April 2001
Yet there is the broader question of whether diversification into wage employment ultimatelycontributes enhanced household welfare. This depends on a number of factors. Firstly, insituations where male household members migrate for employment, the domestic burden offemale heads is exacerbated as they must assume full responsibility for reproductiveactivities. Likewise, the income-generating options for female-heads confronted with theresultant labour shortages may be limited. While these adverse consequences might offset byremittances (due to the capacity to hire labour), this is contingent upon the nature ofintrahousehold relations.
When employment is undertaken by female heads themselves, it raises a different set ofissues. Chant’s (1997) research on FHHs in Mexico suggested a positive correlationbetween female labour force participation and the welfare of FHHs, which was somewhatsupported by the Uganda data. In contrast to self-employment, the majority of FHHs thatparticipate in wage employment fall within the middle income tercile (see Table 14),suggesting a positive correlation between employment and household income, and enhancedoptions for diversification and investment. This was echoed by a female head from Mbale,who said “I earn at least 1000 shillings per day by selling my labour and I have bought a

- 18 -
cow. I am even able to look after my children better than when I was with my husband, whowas a dictator in the house’.
Table 14. Participation in Wage Employment by Gender of HHH and Income TercilesAll Mbale Kamuli Mubende
Gender of HH Head M F M F M F M FLowest 40.0 25.0 32.0 25.0 54.5 33.3 41.4 0.0Middle 40.0 62.5 40.0 50.0 45.5 66.7 37.9 100.0Highest 20.0 12.5 28.0 25.0 20.7 0.0
Total 100.0 100.0 100.0 100.0 100.0 100.0 100.0 100.0Source: Sample survey conducted in 9 villages Jan-April 2001
There is, however, a need to exercise caution in viewing employment as a positivediversification strategy, particularly employment that is casual or seasonal in nature. Firstly,as Evans’ (1992) work in Uganda illustrated, women often seek employment in response tosocial and economic crises such as separation, divorce and widowhood, or under otherwise“distress” conditions. In this study, such ‘distress sales’ were recorded among several samplehouseholds in which divorce, separation and death precipitated a discernible shift towardwage employment. However, in these situations women enter the bargaining process in aninferior position, as poverty and vulnerability may compel them to sell their labour wellbelow market rate (Whitehead, 2001:38). In such cases, entry into employment may indeedrepresent a “coping” strategy in a context of crisis and deprivation.
Secondly, while employment has the potential to transform women’s lives (Sen, 1999),employment alone may not be a sufficient condition for empowerment. This wasdemonstrated by Gonzalez de la Rocha’s review of 22 poverty studies from 15 countries,which found that women’s participation in wage employment failed to produce equality ingender relations (2000). This is partly related to wage inequalities stemming from genderbased discrimination in labour markets, with women locked into low productivityoccupations. In Uganda, for example, women’s wages average 40 per cent below men’s withhalf of that difference attributable to discrimination (Appleton, 1995). Casual and seasonallabour, specifically, is characterised by low and irregular wages, insecurity, and often pooremployment conditions. Hence, although FHHs are diversifying, their lack of assets (skills,information, command over labour and technology, or credit) may confine them to poorquality employment with low returns.
Finally, the opportunities for household members to benefit from employment are governedby cultural systems that define who gains access to, and control over resources (Goetz andSen Gupta, 1994). These cultural norms and ideologies determine, to a great extent, whetheror not women and their households will reap the benefits of their labour. As Kabeer (1999)notes, there is no straightforward relationship between wage earnings and the capacity toexert claims on household resources. We need to know more about how household dynamicswill govern women’s decisions to participate in market activities and under what conditionsthey will be able to secure control over their income.
(c) Remittances
As Table 4 (page 8) indicated, FHHs have less diversified income sources than MHHs,signifying more opportunities for mobility among men. The constraint on female mobility isalso suggested by the differential reliance that male- and female-headed households have on
- 19 -
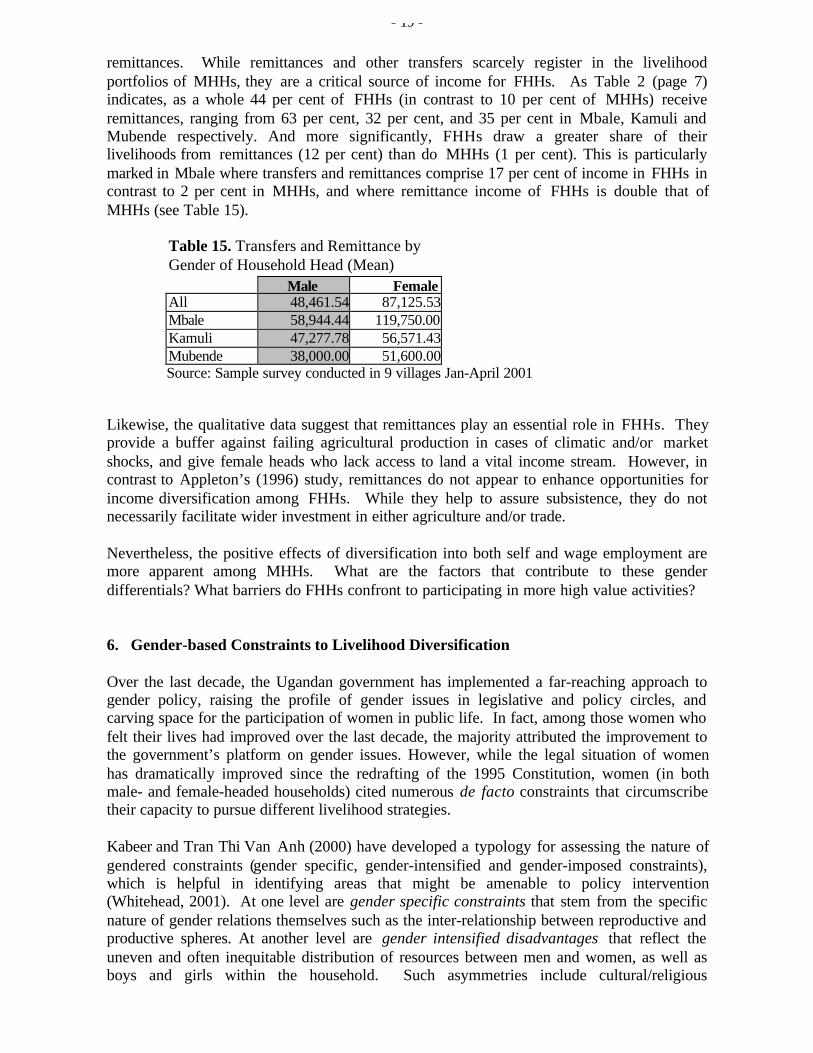
remittances. While remittances and other transfers scarcely register in the livelihoodportfolios of MHHs, they are a critical source of income for FHHs. As Table 2 (page 7)indicates, as a whole 44 per cent of FHHs (in contrast to 10 per cent of MHHs) receiveremittances, ranging from 63 per cent, 32 per cent, and 35 per cent in Mbale, Kamuli andMubende respectively. And more significantly, FHHs draw a greater share of theirlivelihoods from remittances (12 per cent) than do MHHs (1 per cent). This is particularlymarked in Mbale where transfers and remittances comprise 17 per cent of income in FHHs incontrast to 2 per cent in MHHs, and where remittance income of FHHs is double that ofMHHs (see Table 15).
Table 15. Transfers and Remittance byGender of Household Head (Mean)
Male FemaleAll 48,461.54 87,125.53Mbale 58,944.44 119,750.00Kamuli 47,277.78 56,571.43Mubende 38,000.00 51,600.00Source: Sample survey conducted in 9 villages Jan-April 2001
Likewise, the qualitative data suggest that remittances play an essential role in FHHs. Theyprovide a buffer against failing agricultural production in cases of climatic and/or marketshocks, and give female heads who lack access to land a vital income stream. However, incontrast to Appleton’s (1996) study, remittances do not appear to enhance opportunities forincome diversification among FHHs. While they help to assure subsistence, they do notnecessarily facilitate wider investment in either agriculture and/or trade.
Nevertheless, the positive effects of diversification into both self and wage employment aremore apparent among MHHs. What are the factors that contribute to these genderdifferentials? What barriers do FHHs confront to participating in more high value activities?
6. Gender-based Constraints to Livelihood Diversification
Over the last decade, the Ugandan government has implemented a far-reaching approach togender policy, raising the profile of gender issues in legislative and policy circles, andcarving space for the participation of women in public life. In fact, among those women whofelt their lives had improved over the last decade, the majority attributed the improvement tothe government’s platform on gender issues. However, while the legal situation of womenhas dramatically improved since the redrafting of the 1995 Constitution, women (in bothmale- and female-headed households) cited numerous de facto constraints that circumscribetheir capacity to pursue different livelihood strategies.
Kabeer and Tran Thi Van Anh (2000) have developed a typology for assessing the nature ofgendered constraints (gender specific, gender-intensified and gender-imposed constraints),which is helpful in identifying areas that might be amenable to policy intervention(Whitehead, 2001). At one level are gender specific constraints that stem from the specificnature of gender relations themselves such as the inter-relationship between reproductive andproductive spheres. At another level are gender intensified disadvantages that reflect theuneven and often inequitable distribution of resources between men and women, as well asboys and girls within the household. Such asymmetries include cultural/religious
- 20 -
conventions, and the social rules and norms that regulate property rights, inheritancepractices, and resource endowments. While gender-intensified constraints are not alwaysgender specific, they often effect women more deeply than men. Finally, gender imposedconstraints consist of disadvantages that result from the biases and partialities of thoseindividuals who have the authority and power to allocate resources. These include clearpolicy areas such as the provision of credit, information, and agricultural extension, andhence, may be more conducive to policy responses.
Gender Specific Constraints
Labour
In SSA, women's access to labour and/or to the capital to mobilise labour are oftenconsidered more central to well being than having access to land (Whitehead, 2001). In largepart, how labour is defined and allocated within the household differentiates the opportunitiesof men and women, and mediates their options for income security and livelihooddiversification. Section 4 discussed the gender dimension of the labour process in referenceto productive work. However, a gender analysis of livelihood strategies also needs to takeinto account the inter-relationship of ‘market’ and ‘non-market’ spheres that underpins thepotential to engage in productive activities. For example, the allocation of women to the‘reproductive economy’ (the unpaid economy of domestic work and childcare), coupled withan absence of improved domestic technology (piped water and cooking stoves), significantlycompromises women’s ability to expand and/or diversify production. Among samplehouseholds the gender division of labour in reproductive work was very rigid with domesticresponsibilities borne almost wholly by women. As one female-head in Mubende said,“[there is] No flexibility [in labour]. If the wife is sick the children cook and someone is hiredto dig. [the] Husband does not do any home chores.”
It has been argued that women’s double day (combined productive and reproductive work) isparticularly adverse for FHHs, who face greater time poverty due to their often soleresponsibility for income generation and reproductive work. It has also been argued that timedeprivation can engender the intergenerational transmission of nutritional poverty,particularly to daughters, whose own health and/or educational opportunities are underminedby assuming domestic responsibilities. Among sample FHHs, ‘time poverty’ wasexacerbated by the small pool of resident EAAs, making it difficult to accomplish daily tasks,and almost impossible to develop new economic undertakings. For example, time constraintsnot only placed pressure on women’s food cultivation but prevented them from re-allocatingtheir labour time to crops that might be more commercially lucrative, or to labour marketopportunities. As a result, policies aimed at providing agricultural or labour marketincentives may produce a weak or negative supply response unless they account for theinelasticity of female labour obligations.
One final labour-related constraint registered among sample households was the prevalenceof age and illness, which were identified as major factors leading to a decline in livelihoodactivities. While health impairment is not gender-specific per se, it directly shapes ahousehold’s ability to perform daily reproductive and productive tasks, and in all threesample districts was considered a significant constraint on the capacity of households toprofit from, or diversify out of agriculture. This was particularly notable in Mubende, whereAIDS led to the impoverishment and destitution of several households. For example, onefemale head in Mubende claimed that ‘I rely on the income from mat making because I havelittle energy [to farm] compared to long ago. I can’t plant more crops because I’m old and I
- 21 -
can hardly do anything for myself. I’ve spent a lot of time in hospital looking after my son,who died 2 days ago. My household situation has worsened because of the loss of my sonsand daughters due to AIDS and I am at God’s mercy’. Among widow-headed households,specifically, the debilitation of old age reinforced and exacerbated the gender disadvantagesfaced by labour, land and other resource-based constraints, leading to circumstances of severedistress and vulnerability.
Gender Intensified Constraints
Land
One of the most significant gender-based constraints that women face is access to land. InUganda, both the 1995 Constitution and the 1998 Land Law have provided an encouragingframework for enhanced tenure security. However, the implementation of the law has beenvariable, particularly with regard to women, who own only 7 per cent of all land in thecountry (Tripp, 2001; UWONET, 2000). While women are legally entitled to own land,24 inpractice their access to land remains contingent on social rather than material relations. Inmost areas, succession and inheritance practices, based on kinship 25 and conjugal norms,continue to take precedence over statutory rights. These cultural systems determine, to a greatextent, the allocation, management, and control over land, and circumscribe the capacity ofmen and women to make certain livelihood choices.
The asymmetry in control over land has direct implications for the productivity of women’slabour, their willingness to invest in land, their capacity to influence land use priorities, aswell as for the nature of livelihood activities they are likely to undertake. As Agarwal (1997)has illustrated in the Indian context, control over land can strengthen an individual’s fallbackposition, not only as a direct entitlement but also through the conversion of land into capital(e.g. loans and credit) and other assets. For women, in particular, endowments of land cancontribute to a stronger bargaining position, as well as bolster their claims against widergender inequalities.
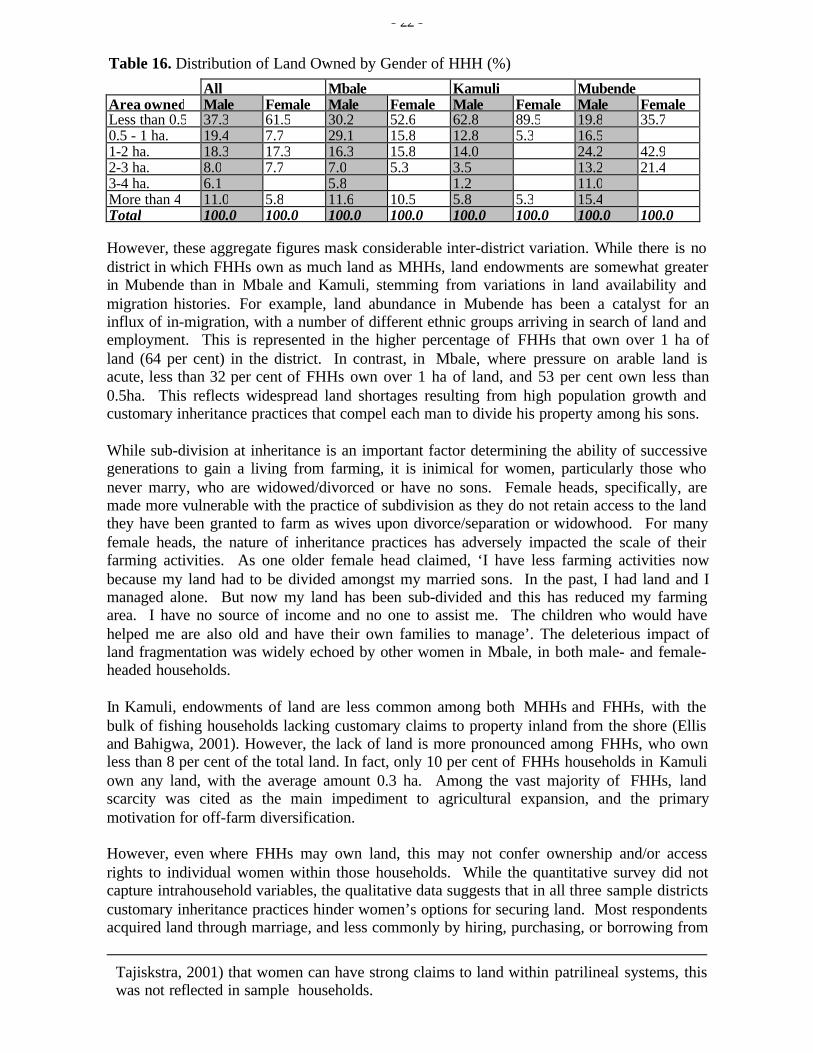
However, despite the close connection between land rights and gender equity, in all threedistricts the paucity and fragility of women’s land rights were considered a main source ofwomen’s vulnerability, as well as a significant constraint on their livelihood options. Whilewomen in both male- and female-headed households consider themselves land-poor, the totalamount of land owned by FHHs was less than that of MHHs in all three sample districts.Sixty-two percent of female-headed households had land holdings of under 0.5 ha in contrastto 37 per cent of male-headed households, (see Table 16), with FHHs owning an average of0.8 ha in comparison to 1.6 ha among MHHs. These figures emulate Appleton’s (1996)study of FHHs in Uganda, which indicated that FHHs were less likely to claim cultivableland among their assets than male-headed households.
24 In Uganda, ownership means that women have the right to plant perennial crops, sell or
bequeath the plot, or use it as collateral without male participation (Kasente et al., 2000).
25All three districts in this study are characterised by patrilineal kinship systems, where landis inherited agnatically from father to son. While it has been argued (Whitehead and
- 22 -
Table 16. Distribution of Land Owned by Gender of HHH (%)
All Mbale Kamuli MubendeArea owned Male Female Male Female Male Female Male FemaleLess than 0.5 37.3 61.5 30.2 52.6 62.8 89.5 19.8 35.70.5 - 1 ha. 19.4 7.7 29.1 15.8 12.8 5.3 16.51-2 ha. 18.3 17.3 16.3 15.8 14.0 24.2 42.92-3 ha. 8.0 7.7 7.0 5.3 3.5 13.2 21.43-4 ha. 6.1 5.8 1.2 11.0More than 4 11.0 5.8 11.6 10.5 5.8 5.3 15.4Total 100.0 100.0 100.0 100.0 100.0 100.0 100.0 100.0
However, these aggregate figures mask considerable inter-district variation. While there is nodistrict in which FHHs own as much land as MHHs, land endowments are somewhat greaterin Mubende than in Mbale and Kamuli, stemming from variations in land availability andmigration histories. For example, land abundance in Mubende has been a catalyst for aninflux of in-migration, with a number of different ethnic groups arriving in search of land andemployment. This is represented in the higher percentage of FHHs that own over 1 ha ofland (64 per cent) in the district. In contrast, in Mbale, where pressure on arable land isacute, less than 32 per cent of FHHs own over 1 ha of land, and 53 per cent own less than0.5ha. This reflects widespread land shortages resulting from high population growth andcustomary inheritance practices that compel each man to divide his property among his sons.
While sub-division at inheritance is an important factor determining the ability of successivegenerations to gain a living from farming, it is inimical for women, particularly those whonever marry, who are widowed/divorced or have no sons. Female heads, specifically, aremade more vulnerable with the practice of subdivision as they do not retain access to the landthey have been granted to farm as wives upon divorce/separation or widowhood. For manyfemale heads, the nature of inheritance practices has adversely impacted the scale of theirfarming activities. As one older female head claimed, ‘I have less farming activities nowbecause my land had to be divided amongst my married sons. In the past, I had land and Imanaged alone. But now my land has been sub-divided and this has reduced my farmingarea. I have no source of income and no one to assist me. The children who would havehelped me are also old and have their own families to manage’. The deleterious impact ofland fragmentation was widely echoed by other women in Mbale, in both male- and female-headed households.
In Kamuli, endowments of land are less common among both MHHs and FHHs, with thebulk of fishing households lacking customary claims to property inland from the shore (Ellisand Bahigwa, 2001). However, the lack of land is more pronounced among FHHs, who ownless than 8 per cent of the total land. In fact, only 10 per cent of FHHs households in Kamuliown any land, with the average amount 0.3 ha. Among the vast majority of FHHs, landscarcity was cited as the main impediment to agricultural expansion, and the primarymotivation for off-farm diversification.
However, even where FHHs may own land, this may not confer ownership and/or accessrights to individual women within those households. While the quantitative survey did notcapture intrahousehold variables, the qualitative data suggests that in all three sample districtscustomary inheritance practices hinder women’s options for securing land. Most respondentsacquired land through marriage, and less commonly by hiring, purchasing, or borrowing from
Tajiskstra, 2001) that women can have strong claims to land within patrilineal systems, thiswas not reflected in sample households.

- 23 -
sons (who have inherited the father’s land). In the bulk of cases, women’s rights hinge on thebenevolence of their male kin, placing them in a perpetual cycle of dependency. As onewoman said, “[life is] more difficult. Women used to have their own pieces of land tomanage. Now the husband manages all the land leaving the women with nothing to sell.When the children were young a little food was set aside for family consumption. This is nowset aside for sale.”
Furthermore, while women in both male and female-headed households are awarded rights ofusufruct from their husbands and sons, 26 they face several obstacles to retaining those rightsin the case of divorce, separation, and widowhood. For example, in Kamuli 40 per cent ofsample FHHs were widows,27 and half of them had lost access to their husband's land uponhis death. Either their father-in-law had expropriated the land, or it had been passed down totheir sons. Similar occurrences were recorded in Mbale, where one interviewee said, ‘Myland was taken away by my sons when my husband died and now I have to sell my labour toget money for survival’. In another case, a woman’s husband had sold off their land beforehis death in order to pay for medical costs.
For those women who lack ownership and/or access rights to land, renting in land iscommon. This is particularly significant in Kamule, where renting land from inshore villagesis widespread (63 per cent of FHHs rent land in Kamuli in comparison to 16 per cent and 18per cent of sample FHHs in Mbale and Mubende respectively). However, for somehouseholds the cost of renting land is prohibitive.28 As one female head said, '[There is] noland to cultivate crops. In the past we used to cultivate freely, but now you have to hire landwhich is impossible for us[…]I don't have a husband to hire for me land for agriculture'. Infact, the cost of renting land was a key factor leading to a shift toward non-farm activities.For those women who have the resources to rent land, other issues arose regarding theduration of land leases. One female head from Kamuli mentioned that her landlord onlyallows her to rent for one season, which restricts the types of crops she can cultivate,particularly cassava. She said, ‘I have not started new farming activities in the past 5 yearsdue to poor health and no land. I would have to hire land, and would only be allowed tocultivate it for one season. It’s better to trade [fish] than to beg for land every season.’
Financial Capital
A second type of gender-intensified constraint confronted by sample households was ashortage of capital for investment in production activities. Reardon (1997) has termed suchcapital constraints investment poverty -- a paucity of resources to direct toward incomegeneration. While the majority of respondents expressed aspirations of expanding theirincome generating activities, including a wide range of crop production, livestockmanagement and trade-related activities – they faced several barriers in materialising thoseaspirations. For example, several households claimed that they would prefer to specialise in 26 Women in male-headed households are allocated plots by their husbands, on which they
cultivate largely for home consumption.
27 While widows (as the mother of a son in the patrilineage) can have strong claims tomaintenance following the death of their husband, this claim was not enforced in thesecases (Whitehead 2001).
28 In Bukhasusa, Mbale renting land for cultivation averages approximately sh.50000/= peracre for one production season.
- 24 -
agriculture but lacked the money to purchase land. Female heads, specifically, expressed adesire to cultivate new crop varieties, however, the majority lacked the resources to purchaseinputs (seeds, fertilisers, pesticides), and/or to hire the labour to assist them.Capital constraints also contributed to gender differences in the capacity of male and female-headed households to participate in non farm activities. For example, most FHHs claimedthat their inability to finance initial start-up costs prevented them from investing in businessesand trade activities. This leaves FHH confined to trading activities characterised by lowreturns, limiting their prospects of generating a surplus for reinvestment in agriculture orother off farm endeavours. The dearth of capital, thus, is likely to perpetuate poverty amongFHHs, and potentially intensify gender-based income differentials in rural areas (Whitehead,2001).
Gender Imposed Constraints
Credit
One way that capital constraints can be alleviated is through the provision of credit, which isgenerally considered a promising route out of poverty for the rural poor. Likewise, mostsample households identified credit as the main resource that would enable them to broadentheir livelihood options, whether it be agriculture, trade, or other non farm entrepreneurialactivities. However gender-based institutional barriers that exclude women from formalcredit have been widely documented in Uganda (Goetz, 1995), 29 and were similarly evidentin sample districts. As a result, most women resort to informal credit systems such as thefemale-dominated rotating savings and credit associations (kamatuli) found in both Mbaleand Mubende.
In both male- and female-headed households, kamatuli were seen as a valuable source ofsavings and economic betterment, providing several women with the ability to hire land andlabour, and pay for medical costs and school fees. They also fulfil important social capitalfunctions. As one woman noted, “Nowadays we also have associations which we canparticipate in and get credit and can meet with other women to share problems and getsolutions.” However, the potential of kamatuli as a way to secure capital for broaderinvestment is limited. The associations generally represent a narrow segment of women in themiddle-income tercile, and tend to marginalise poorer women who are unable to mobilise thefunds required to meet the regular repayments. Similarly, the Foundation for Credit andCommunity Assistance (FOCCAS), a well-known micro-finance institution, offers credit toseveral women’s groups in Mbale. Again, these loans were best placed to assist better-offwomen, particularly those who had businesses or stable trading activities, and could meet theweekly repayment schedule. This effectively excluded women who wanted to invest inagriculture, which rarely yields weekly returns. However, of wider concern were the caseswhere the pressures of repayment forced women to liquidate their assets. For example, onewoman from Mbale said, ‘I no longer dig as I used to, because I don’t have enough money toemploy labour. Even the cassava and soya beans I used to grow have declined due todiseases, and I sold my cow in order to pay back the loan I got from FOCASS’. Hence, whilethere is a clear need for microcredit to engender livelihood security, at present credit schemesdo not appear to reach the women and households that may need them most.
29 In Uganda, women’s share of formal credit is only 1 per cent. Gender-based inequalities in
obtaining credit stem from several factors, including women’s lack of mobility, time andcollateral (Elson and Evers, 1997).

- 25 -
Thus, this section has shown that a combination of cultural, financial, and institutionalconstraints pose impediments to the attainment of gender equity in rural livelihoods. Whilecertain constraints are more destabilising for households than others, they are also mutuallyreinforcing. For example, access to land determines a household’s ability to obtain credit,which in turn impacts their capacity to invest in business activities. Investing in businesseswould allow them to generate the income required to invest in hired labour and/or agriculturalinnovations. Thus constraints in one sector affect the functioning of the others and are likelyto compound the difficulties that households face.
7. Conclusion
The general picture emerging from the above review is that the livelihood portfolios inMbale, Kamuli and Mubende districts vary substantially between male- and female-headedhouseholds, and among men and women. In all three districts, household assets andendowments, which are important determinants of household income, are stronglydifferentiated between male- and female-headed households, with the latter consistentlydisadvantaged relative to their male counterparts.
Similarly, the potential for diversification is differentially experienced by male- and female-headed households. While the importance of livelihood diversification for poverty reductionhas been well-documented, this analysis suggests that the benefits of diversification are oftencontingent upon the kinds of off-farm activities in which households are likely to engage.Because the number and type of off-farm opportunities available to FHHs are morecircumscribed than they are for MHHs (due to variations in assets, mobility etc.), the formerare more likely to participate in self-employment activities that have low barriers to entry andgenerate lower returns. Overall, diversification into self-employment has not provided aroute out of poverty, and the majority of FHHs participating in self-employment remain inthe lowest income tercile. Hence, self-employment and trade are more strongly correlatedwith sustaining or augmenting existing livelihood activities rather than diversifying out ofthem entirely. In contrast, wage employment is more positively associated with higherincome levels among FHHs. However, the nature of that employment and its implications ongender equity are less clear. Firstly, a large part of employment in FHHs is comprised ofmen who have out-migrated, leaving the burden of reproductive responsibilities to women.Secondly, in cases where female heads themselves are employed, the outcome depends on thequality and security of the employment, and the extent to which employment encroaches onthe time available for other productive and reproductive responsibilities. Hence, whileemployment may go some length in mitigating income poverty, it may fail to ameliorateother forms of inequality and vulnerability in households.
This paper has also pointed to differences in the nature of constraints that female- and male-headed households face, which tend to circumscribe their capacity to stabilise and/or broadentheir livelihood portfolios. While these constraints can be mitigated, some pose more seriouschallenges for livelihood security than others. For example, gender-imposed constraints suchas access to credit, agricultural extension and training may be more amenable to policyintervention than either gender-specific or gender-intensified constraints. The paucity ofcredit awarded to women is an area ripe for policy attention, and could dramatically facilitatewomen’s capacity to expand both on and off farm activities. Likewise, initiatives to supporttrading activities (e.g. measures to limit taxation) could especially benefit FHHs, who derivea greater share of their income from trade-related activities than male-headed households.Finally, interventions to alleviate unequal labour burdens through labour saving devices

- 26 -
and/or social infrastructure such as water supply and childcare facilities could enhanceproductivity and advance gender equity both within and between households. Nevertheless,such ‘enabling’ strategies are not as straightforward as they seem. The provision of creditand technical assistance, for instance, has had a long and chequered history of unintendedconsequences, overlooking the most marginal of the rural poor in favour of the better-off.Any policy measures adopted to mitigate gender-imposed constraints need to be mindful ofthis tendency, and designed specifically to strengthen the capacity of the poorest such asFHHs to participate in economic opportunities.
Gender-specific and intensified constraints, on the other hand, can raise more potent obstaclesto gender-differentiated policy design. As this analysis has documented, cultural and socialnorms that define property rights and labour responsibilities strongly differentiate theopportunities for livelihood security and diversification by gender. Cultural rules andconventions, however, are among the most impervious to policy change, requiring broad anddeep policy interventions to alleviate gender discrimination, and the underlying social normsthat perpetuate it. The Uganda government has initiated positive steps in this regard. Thedevolution of power and resources to locally-elected bodies has created an entry point foraddressing gender concerns at a local level and created space for women’s participation in arange of local decision making bodies (MoGCD, 1997). Likewise government and NGOsensitisation campaigns have raised awareness of gender issues in rural areas, creating anattitudinal shift among men, who are beginning to allow women some degree of economicindependence and social autonomy. These efforts should be supported and reinforced aschanging the way gender relations are socially constructed will require persistent and longterm commitment to realise the government’s stated goals of gender equity.
References
Agarwal, B., 1997, ‘Environmental Action, Gender Equity and Women’s Participation’,Development and Change, Vol. 28, pp. 1-44.
Appleton, S., 1995, Woman-Headed Households and Poverty: an Empirical Deconstructionfor Uganda, Centre for the Study of African Economies, Oxford, mimeo
Appleton, S., 1996, ‘Women-Headed Households and Household Welfare: AN EmpiricalDeconstruction for Uganda’, World Development, Vol. 4, No. 12, pp. 1811-1827.
Baden, Sally, 1998, Gender Issues in Agricultural Liberalisation, Topic Paper Prepared forDirectorate General for Development of the European Commission, Report No. 41, Brighton:Institute of Development Studies.
Baden Sally, 1997, Economic Reform and Poverty: A Gender Analysis, BRIDGE Report, No.50, Brighton: Institute of Development Studies.
Benería, Lourdes and Shelley Feldman (eds), 1992, Unequal Burden. Economic Crises,Persistent Poverty and Women’s Work. Boulder, Colorado: Westview Press.
Bruce, J., & Lloyd, C., 1997, ‘Finding the Ties that Bind : Beyond Headship and Household’,in L. Haddad, J. Hoddinott, & H. Alderman (eds), Intrahousehold Resource Allocation inDeveloping Countries: Methods, Models and Policy, Baltimore: Johns Hopkins UniversityPress.

- 27 -
Buvinic, Mayra and Geeta Rao Gupta, 1997, ‘Female-Headed Households and Female-Maintained Families: Are they Worth Targeting to Reduce Poverty in DevelopmentCountries?’, Economic Development and Cultural Change, Vol. 42, No. 2, pp. 259-280
Carney, D., 1998, ‘Implementing the Sustainable Rural Livelihoods Approach’, in D. Carney(ed), Sustainable Rural Livelihoods: What Contribution Can We Make?, London: Departmentfor International Development.
Carney, Judith, 1992, ‘Peasant Women and Economic Transformation in The Gambia’,Development and Change , Vol. 23, No. 2, pp. 67-90.
Chambers, R., 1983, Rural Development: Putting the Last First, Longman, London.
Chambers, R. and G. Conway, 1992, Sustainable Rural Development: Practical Concepts forthe 21st Century, IDS Discussion Paper No. 296, Brighton: Institute of Development Studies.
Chant, S., 1997, Women-headed Households: Diversity and Dynamics in the DevelopingWorld, Macmillan Press, London.
Ellis, F., 1998, ‘Household Strategies and Rural Livelihood Diversification’, Journal ofDevelopment Studies, Vol. 35, No. 1, pp. 1-38.
Ellis, F., 2000, Rural Livelihoods and Diversity in Developing Countries, Oxford: OxfordUniversity Press
Ellis, F., and G. Bahiigwa, 2001, ‘Livelihoods and Rural Poverty Reduction in Uganda’,LADDER Working Paper, No. 5, Norwich: UEA.
Elson, D., and B. Evers, 1997, ‘Gender Aware Country Economic Reports: Uganda’,Working Paper No. 2, Manchester, UK: GENECON Unit, University of Manchester.
Evans, A. 1992 ‘A Review of Rural Labour Markets in Uganda’, Washington: World BankAgricultural Secretariat, mimeo.
Evers, B. and Walters, B., 2000, ‘Extrahousehold factors and Women Farmers' supplyResponse in Sub Saharan Africa"’, World Development 28(7).
Francis, E., 1998, ‘Gender and Rural Livelihoods in Kenya’, Journal of Development Studies,Vol. 35, No. 2, pp. 72-95.
Fuwa, Nobuhiko, 2000, ‘The Poverty and Heterogeneity Among Female-HeadedHouseholds Revisited: The Case of Panama’, World Development, Vol. 28, No. 8, pp.1515-1542.
Goetz, A. M., 1995, ‘Macro-Meso-Micro Linkages: Understanding Gendered InstitutionalStructures and Practices’, A contribution to the SAGA Workshop on Gender and EconomicReform in Africa, Ottawa, 1-3 October.

- 28 -
Goetz, A, Maxwell, S. and H. Manyire, 1994, ‘SPA Povery and Social Policy WorksingGroup Consultancy on Poverty Assessment and Public Expenditure Issues: Uganda CountryStudy’, Brighton: Institute of Development Studies, mimeo.
Goetz, Anne Marie and Rina Sen Gupta, 1996, ‘Who Takes the Credit? Gender, Power andControl Over Loan Use in Rural Credit Programs in Bangladesh.’ World Development, Vol.24, No. 1, pp. 45-63.
Gonzalez de la Rocha, Mercedes, 2000, ‘Private Adjustments: Household Responses to theErosion of Work’, A. Grinspun (ed.), SEPED Conference Paper Series, No. 6, NY: UNDP.
Government of Uganda and Uganda National Council for Children (GoU & NCC), 1994,Equity and Vulnerability: A Situation Analysis of Women, Adolescents and Children inUganda, National Council For Children, UNICEF, Child Health and Development Centre,Makerere University, October.
Guyer, J., 1980, ‘Food, Cocoa, and the Division of Labor by Sex in Two African Societies’,Comparative Studies in History and Society, Vol. 22, pp. 355-373.
Guyer, J., 1988, ‘Dynamic Approaches to Domestic Budgeting: Cases and Methods fromAfrica’, in D. Dwyer and J. Bruce (eds.), A Home Divided, Stanford, CA: StanfordUniversity Press, pp. 155-172.
Handa, S., 1994, ‘Gender, Headship and Intrahousehold Resource Allocation’, WorldDevelopment, Vol. 22, No. 10, pp. 1535-1547.
Hussein, K. and J. Nelson , 1998, Sustainable Livelihoods and Livelihoods Diversification,IDS Working Paper No. 69, Brighton: Institute of Development Studies.
James, R., Francis, P. and G. Turiho-Habwe, 2001, ‘Decentralisation in Uganda:Technocracy plus patronage equals popular democracy?’, LADDER Working Paper,Norwich: UEA.
Kabeer, N. 1999, ‘Resources, Agency, Achievements: Reflections on the Measurement ofWomen’s Empowerment’, Development and Change Vol. 30, No. 3, pp. 435-464.
Kabeer, N. and Tran Thi Van Anh, 2000, ‘Leaving the Ricefields but not the Countryside:Gender Livelihood Diversification and Pro-Poor Growth in Rural Vietnam’, OccasionalPaper No. 13, Geneva: UNRISD.
Kasente, D., Lockwood, M., Vivian, J. and A. Whitehead, 2000, ‘Gender and the Expansionof Agricultural Exports in Uganda’, UNRISD Occasional Paper No. 12, Geneva: UNRISD.
Mackenzie, F., 1990, ‘Gender and Land Rights in Murang'a District, Kenya’, Journal ofPeasant Studies, Vol.7, No. 4, pp. 609-643.
Manyire, Henry, 1994, Agricultural Intensification, the Rural Agricultural Markets, andGender: Uganda Country Study, A Paper Submitted to the United Nations Research Institutefor Social Development (UNRISD).

- 29 -
Moore, Henrietta L., 1988, Feminism and Anthropology. Minneapolis: University ofMinnesota Press.
Muzaki, Sarah, 1996, Gender in the Rural Informal Labour Market: The Case of BudadiriCounty, Mbale District, (Dissertation), Makere
Newman, C. and Canagarajah, S. 2000, ‘Gender, Poverty, and Nonfarm Employment inGhana and Uganda’, World Bank Policy Research Paper, No. 2367, Washington: WorldBank.
Ranis, Gustav and Frances Stewart, 1993, ‘Rural Nonagricultural Activities in Development:Theory and Application’, Journal of Development Economics, Vol. 40, pp. 75-101.
Reardon, T (1997) ‘Using Evidence of Household Income Diversification to Inform Study ofthe Rural Nonfarm Labor Market in Africa’ World Development, Vol. 25, No. 5.
Rosenhouse, S., 1989, ‘Identifying the Poor: Is Headship a Useful Concept?’, World BankLiving Standards Measurement Study Working Paper, No. 58, World Bank: Washington DC.
Scoones, I., 1998, ‘Sustainable Rural Livelihoods: A Framework for Analysis’, IDS WorkingPaper, No.72
Scott, E. P. 1995 ‘Home Based Industries: An Alternative Strategy for Household Security inRural Zimbabwe’, The Journal of Developing Areas, Vol. 29.
Sen , G. 1999 ‘Engendering Poverty Alleviation: Challenges and Opportunities’,Development and Change, Vol. 30, No. 3, pp. 685-692.
Singh, Naresh and Jonathan Gilman, 2000, ‘Employment and Natural ResourcesManagement: A Livelihoods Approach to Poverty Reduction’, SEPED Conference PaperSeries, UNDP (www.undp.org/seped/publications/conf_pub.htm)
Singh, N. and J. Gilman 1999 ‘Making Livelihoods More Sustainable’ International SocialScience Journal, Vol. 51, No. 4, pp. 539-545.
Tripp. A.M, 2001, ‘The Politics of Autonomy and Cooptation in Africa: The Case of theUgandan Women’s Movement’, Journal of Modern African Studies, Vol. 39, No. 1, pp. 101-128.
Uganda Women's Network (UWONET), 2000, ‘Women Know Your Land Rights’, Kampala.
Warner, J. M. and Campbell, D. A., 2000, ‘Supply Response in an Agrarian Economy withNon-Symmetric Gender Relations’, World Development, Vol. 28, No. 7, pp. 1327 –1340.
Whitehead, Ann, 2001, ‘Trade, Trade Liberalisation and Rural Poverty in Low-IncomeAfrica: A Gendered Account’, Background Paper for the UNCTAD 2001 Least DevelopedCountries Report, mimeo.
Whitehead, A. 1981, ‘I'm Hungry, Mum': The Politics of Domestic Budgeting in’, in K.Young, R. McCullugh and C. Wolkowitz (eds) Of Marriage and the Market, London: CSEBooks.

- 30 -
Whitehead, A. and Tsikata, D., 2001 ‘Policy Discourses about Women's Land Rights in sub-Saharan Africa’: UNRISD.
Yunez-Naude, A. and J. Edward Taylor, 2001, ‘The Determinants of Nonfarm Activities andIncomes of Rural Households in Mexico, with Emphasis on Education” World Development,Vol. 29, No. 3, pp. 561-572.


![YOUTH ENTREPRENEURSHIP AND EMPOWERMENT PROJECT … · in Uganda and Kenya: A Participatory Action Research [PAR] Report. ... • Charles Okello Owiny – VSO Livelihoods Programme](https://static.fdocuments.net/doc/165x107/5e3f5dfa370a21286a0a987a/youth-entrepreneurship-and-empowerment-project-in-uganda-and-kenya-a-participatory.jpg)