UBuhlebezwe Municipality Final Budget
36
UBuhlebezwe Municipality 2016 – 17 Final Budget 1 UBUHLEBEZWE MUNICIPALITY 2016/2017 FINALBUDGET Copies of this document can be viewed: In the municipal buildings Municipal library and the website www.ubuhlebezwe.org.za
Transcript of UBuhlebezwe Municipality Final Budget

UBuhlebezwe Municipality 2016 – 17 Final Budget
1
UBUHLEBEZWE MUNICIPALITY
2016/2017 FINALBUDGET
Copies of this document can be viewed: In the municipal buildings
Municipal library and the website
www.ubuhlebezwe.org.za

UBuhlebezwe Municipality 2016 – 17 Final Budget
2
Table of Contents
PART 1 – DRAFT ANNUAL BUDGET ................................................................................................................
1.1 MAYOR’S REPORT .............................................................................................................................
1.2 COUNCIL RESOLUTIONS .....................................................................................................................
1.3 EXECUTIVE SUMMARY .......................................................................................................................
1.4 OPERATING REVENUE FRAMEWORK ...................................................................................................
1.5 OPERATING EXPENDITURE FRAMEWORK.............................................................................................
1.6 CAPITAL EXPENDITURE ......................................................................................................................
1.7 ANNUAL BUDGET TABLES ..................................................................................................................
PART 2 – SUPPORTING DOCUMENTATION ......................................................................
2.1 OVERVIEW OF THE ANNUAL BUDGET PROCESS ............................................................................................. 2.2 OVERVIEW OF ALIGNMENT OF ANNUAL BUDGET WITH IDP ........................................................................... 2.3 MEASURABLE PERFORMANCE OBJECTIVES AND INDICATORS ....................................................................... 2.4 OVERVIEW OF BUDGET RELATED-POLICIES ................................................................................................... 2.5 OVERVIEW OF BUDGET ASSUMPTIONS .......................................................................................................... 2.6 OVERVIEW OF BUDGET FUNDING ................................................................................................................... 2.7 ANNUAL BUDGETS AND SDBIPS – INTERNAL DEPARTMENTS ....................................................................... 2.8 CONTRACTS HAVING FUTURE BUDGETARY IMPLICATIONS ............................................................................ 2.9 LEGISLATION COMPLIANCE STATUS ............................................................................................................... 2.10 MUNICIPAL MANANGER'S QUALITY CERTIFICATE……………………………………………………………………
2.11 OTHER DOCUMENTS ……………………………………………………………………………………………………….

UBuhlebezwe Municipality 2016 – 17 Final Budget
3
Part 1: Final Annual Budget
1. MAYORAL BUDGET SPEECH
Speech by the Mayor of uBuhlebezwe Municipality, Z.D. Nxumalo on the occasion of the Council meeting to present an Final Budget for the 2016/2017 financial year. 26 May 2016
Madame Speaker, Cllr N Peterson;
Deputy Mayor, Cllr CT Dlamini
Colleagues in the Executive Committee
Chairperson to MPAC, Cllr Jili
Fellow Councillors
oNdabazitha/ Amakhosi
All Distinguished Guests present;
The entire Management led by the Municipal Manager
Ladies and Gentleman, and everyone present Good day On the 23rd of March we assembled at this council chamber as we were tabling the municipality’s draft budget. The document that I am presenting today was taken to the communities for public participation to receive comments and blessings from the public, this took place in the week of the 12, 13 and 14 April 2016. It further went to the strategic planning session for finalisation in Margate South Coast, Desroches Hotel on the 18th to 22nd of April 2016, where it was presented and discussed with all members of the council and Amakhosi. Madam Speaker, after the 2016 local government elections, Ubuhlebezwe Municipality will be given two additional wards, which has the potential to positively or negatively impact our budget. The population will increase which will assist in the increase of our equitable share in the 2017/18 financial year. However, it may also negatively impact us on financial year 2016/17 as we will need to provide services to new wards that were previously outside of our boundaries. I must also emphasise to my colleagues that, this is our last budget as councillors inaugurated in 2011, and the challenge is still upon us to leave a lasting legacy at this municipality. Madam Speaker on electrification projects, we have R30 Million from the Department of Minerals and Energy. Although we have not received any funding from Cogta on electrification for financial year 2016/17, with the funds that we have available, we are going to supply electricity to houses without electricity. National Treasury’s allocation on MSIG has been withdrawn. Madame Speaker, I must close by thanking the management for a wonderful job done in compiling this budget. We are a clean audit municipality and I hope that the budget that we are approving today will also harvest another clean audit. I thank you.
UBuhlebezwe Municipality 2016 – 17 Final Budget
4
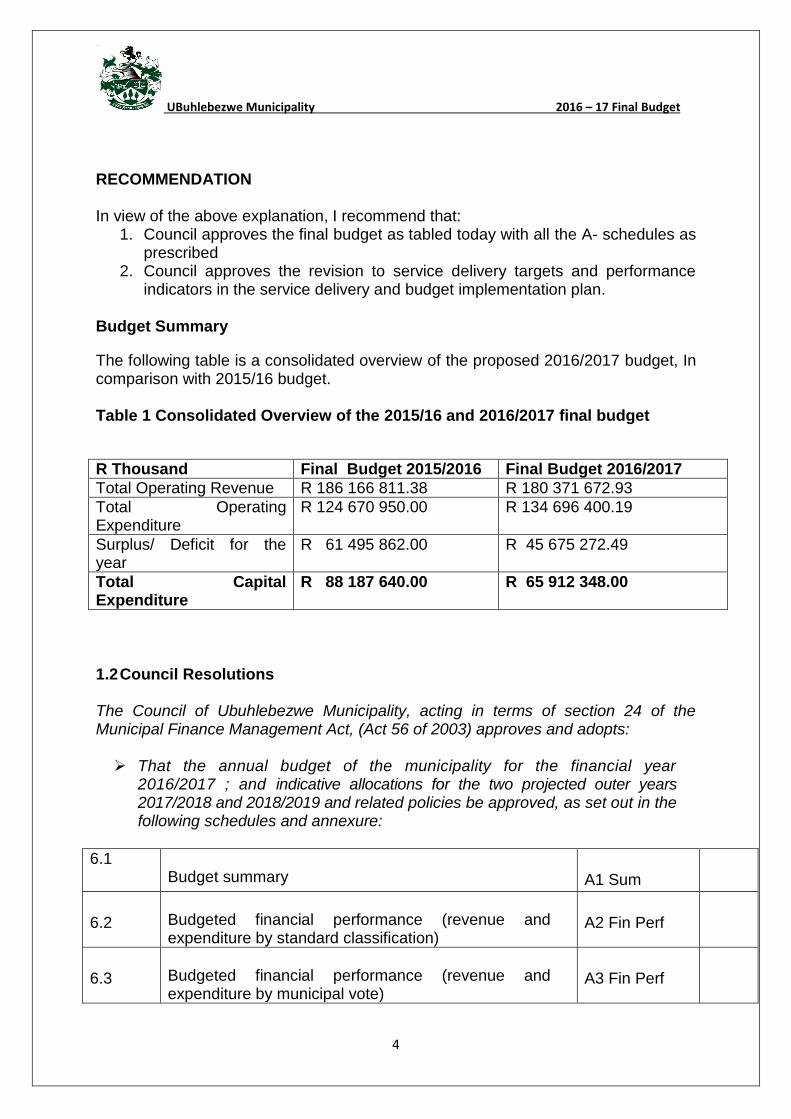
RECOMMENDATION In view of the above explanation, I recommend that:
1. Council approves the final budget as tabled today with all the A- schedules as prescribed
2. Council approves the revision to service delivery targets and performance indicators in the service delivery and budget implementation plan.
Budget Summary
The following table is a consolidated overview of the proposed 2016/2017 budget, In comparison with 2015/16 budget. Table 1 Consolidated Overview of the 2015/16 and 2016/2017 final budget
R Thousand Final Budget 2015/2016 Final Budget 2016/2017
Total Operating Revenue R 186 166 811.38 R 180 371 672.93
Total Operating Expenditure
R 124 670 950.00 R 134 696 400.19
Surplus/ Deficit for the year
R 61 495 862.00 R 45 675 272.49
Total Capital Expenditure
R 88 187 640.00 R 65 912 348.00
1.2 Council Resolutions The Council of Ubuhlebezwe Municipality, acting in terms of section 24 of the Municipal Finance Management Act, (Act 56 of 2003) approves and adopts: That the annual budget of the municipality for the financial year
2016/2017 ; and indicative allocations for the two projected outer years 2017/2018 and 2018/2019 and related policies be approved, as set out in the following schedules and annexure:
6.1 Budget summary
A1 Sum
6.2
Budgeted financial performance (revenue and expenditure by standard classification)
A2 Fin Perf
6.3
Budgeted financial performance (revenue and expenditure by municipal vote)
A3 Fin Perf

UBuhlebezwe Municipality 2016 – 17 Final Budget
5
6.4
Budgeted financial performance (revenue and expenditure)
A4 Fin Perf
6.5
Budgeted capital expenditure by vote, standard classification and funding
A5 Cap Ex
6.6
Budgeted financial position
A6 Fin Pos
6.7
Budgeted cash flows
A7Cas Flow
6.8
Cash backed reserves/accumulated surplus reconciliation
A8 Res Rec
6.9
Asset management
A9 Asset
6.10
Basic service delivery measurement
A10 SerDel
UBuhlebezwe Municipality 2016 – 17 Final Budget
6
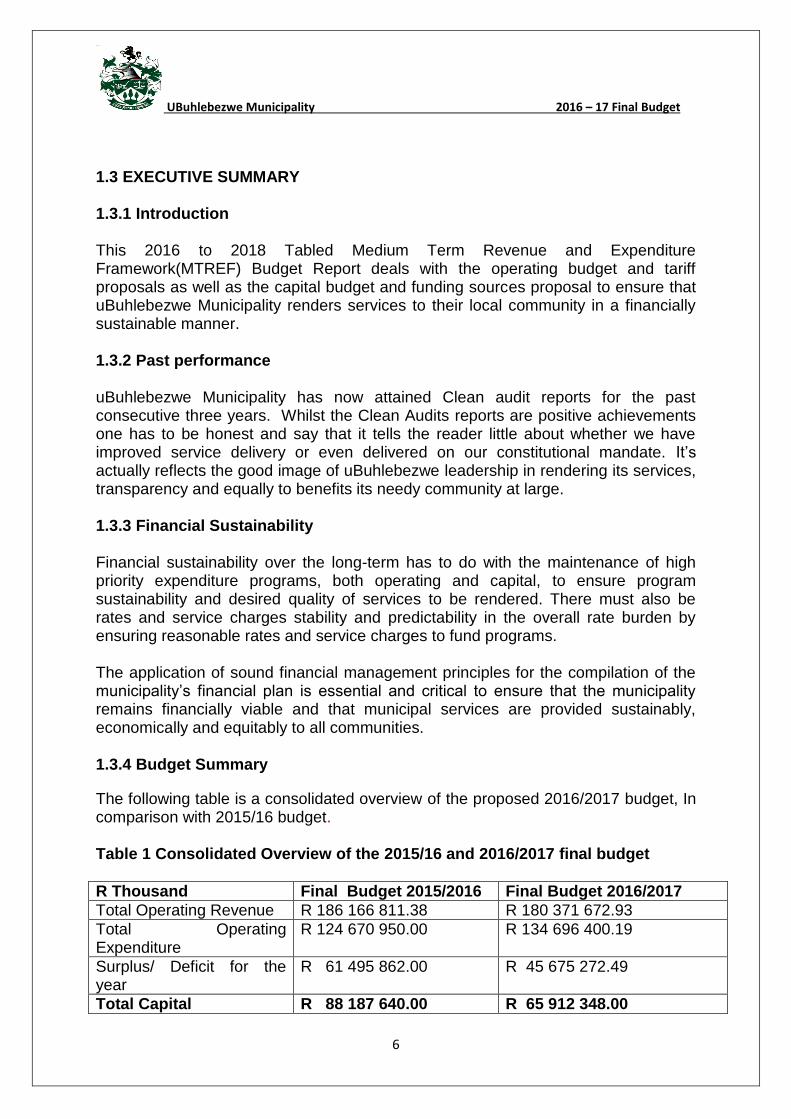
1.3 EXECUTIVE SUMMARY 1.3.1 Introduction This 2016 to 2018 Tabled Medium Term Revenue and Expenditure Framework(MTREF) Budget Report deals with the operating budget and tariff proposals as well as the capital budget and funding sources proposal to ensure that uBuhlebezwe Municipality renders services to their local community in a financially sustainable manner. 1.3.2 Past performance uBuhlebezwe Municipality has now attained Clean audit reports for the past consecutive three years. Whilst the Clean Audits reports are positive achievements one has to be honest and say that it tells the reader little about whether we have improved service delivery or even delivered on our constitutional mandate. It’s actually reflects the good image of uBuhlebezwe leadership in rendering its services, transparency and equally to benefits its needy community at large. 1.3.3 Financial Sustainability Financial sustainability over the long-term has to do with the maintenance of high priority expenditure programs, both operating and capital, to ensure program sustainability and desired quality of services to be rendered. There must also be rates and service charges stability and predictability in the overall rate burden by ensuring reasonable rates and service charges to fund programs. The application of sound financial management principles for the compilation of the municipality’s financial plan is essential and critical to ensure that the municipality remains financially viable and that municipal services are provided sustainably, economically and equitably to all communities. 1.3.4 Budget Summary
The following table is a consolidated overview of the proposed 2016/2017 budget, In comparison with 2015/16 budget. Table 1 Consolidated Overview of the 2015/16 and 2016/2017 final budget
R Thousand Final Budget 2015/2016 Final Budget 2016/2017
Total Operating Revenue R 186 166 811.38 R 180 371 672.93
Total Operating Expenditure
R 124 670 950.00 R 134 696 400.19
Surplus/ Deficit for the year
R 61 495 862.00 R 45 675 272.49
Total Capital R 88 187 640.00 R 65 912 348.00

UBuhlebezwe Municipality 2016 – 17 Final Budget
7
OPERATING REVENUE The estimated operating revenue has been projected at R 180 371 672.93. Total operating revenue has been decreased by 3.1 % for the year 2016/2017 financial year when compared to 2015/16 financial year; this is as a result of the electrification grant and MIG which has decreased for the forth-coming year. MSIG fund has not been allocated for the financial year 2016/17. The following table is a summary of the 2016/2017 MTREF(classified by main
revenue source):
In line with the formats prescribed by Municipal Budget and Reporting Regulations, capital
transfers and contributions are excluded from the operating statement, as inclusion of
these revenue sources would distort the calculation of the operating surplus or deficit.
Government Subsidies / Grants
R95 039 000 Grants total consist of Equitable Share increased from R85 227 000
to R 90 491 000, FMG from R 1 800 000 to R 1 825 000, EPWP from R 1 420 000
to R 1 985 000, and Library Grant from R 723 000 to R 738 000.

UBuhlebezwe Municipality 2016 – 17 Final Budget
8
Grants remain the largest revenue source.
Property Rates The municipality has resolved to increase the rates and service charges by 5%. This
led to the budget for rates to be R 15 753 821.25 for the 2016/2017 financial year.
The amount of R 15.7 million is the net amount after considering revenue foregone /
rebates.
738000 1985000 1825000
90491000
Library Grants FMG FMG Equitable share
GRANTS

UBuhlebezwe Municipality 2016 – 17 Final Budget
9
Comparison of proposed rates to levied for the 2016/17 financial year
Refuse / Service Charges This refers to refuse removal income that the municipality collects as budgeted. The proposed budget for services amounted to R 1 990 710 for 2016/2017. The municipality has not reached a break – even point in delivering this service, meaning the cost of providing the service is more that the revenue recovered. Comparison between current waste removal fees and increases
REFUSE REMOVAL 2015/16 2016/17
Small Business R 793.76 R 833.45
Big Business R 2 313.05 R 2 428.70
Residential R 115.33 R 121.10
Welfare R 24.56 R 25.79
Fairview and other low cost housing projects R 24.56 R 25.79
Garden Refuse Removal per load R 172.63 R 181.26
Builder’s Waste R 186.80 R 196.13
Purchases of Refuse Bins, each Cost + 10% Cost + 10%
Refuse Containers / Skip Bins: (Supply once off, per container)
per agreement
Removal per month per agreement

UBuhlebezwe Municipality 2016 – 17 Final Budget
10
For the processing of any application received for the
disposal of domestics refuse in those cases where disposal is
undertaken by the owner into bylaws 2(2)
Solid Waste Bylaws R 508.52 R 533.94
Recovery of enforcement costs in terms of bylaw 22(4) Actual cost Actual cost
Rental
This refers to rental for municipal facilities, the municipality budgeted the amount of
R 500 000.
Traffic Fines
Traffic Fines budget has been increased from R 200 000 to R 250 000.
Interest on Investments
This refers to funds invested by the municipality on various institutions, for less than
one year, we have budgeted an amount of R 4 000 000.
Licence and Permit
The Municipality has budgeted to collect R 3 560 000 from Licence and Permit.
Agency Services
The Municipality has budgeted to collect R 720 000 from Agency Services.
Other Income
The Municipality has budgeted amount of R 278 500 for other Income

UBuhlebezwe Municipality 2016 – 17 Final Budget
11
1.4 Operating Revenue Framework For uBuhlebezwe Municipality to continue improving the quality of services provided to its citizens it needs to generate the required revenue. In these tough economic times strong revenue management is fundamental to the financial sustainability of every municipality. The reality is that we are faced with development backlogs and poverty. The expenditure required to address these challenges will inevitably always exceed available funding, hence difficult choices have to be made in relation to tariff increases and balancing expenditures against realistically anticipated revenues. The municipality’s revenue strategy is built around the following key components:
National Treasury’s guidelines and macroeconomic policy
Efficient revenue management, which aims to ensure a 99 per cent annual collection rate for property rates and other key service charges,
Determining the tariff escalation rate by establishing/calculating the revenue requirement of each service
The municipality’s Property Rates Policy approved in terms of the Municipal Property Rates Act,2004(Act 6 of 2004)MPRA,
Increase ability to extend new services and recover costs
The municipality’s Indigent Policy and rendering of free basic services and
Tariff policies of the Municipality

UBuhlebezwe Municipality 2016 – 17 Final Budget
12
OPERATING EXPENDITUE Total operating expenditure for the 2016/2017 financial year has been appropriated at R134 696 400.19 and compare to 2015/2016 financial year which was R124 670 950. 1.5 Operating Expenditure Framework The total operating expenditure for 2016/2017 financial year has been appropriated at R134 696 400. The Municipality’s expenditure framework for the 2016/17budget is informed by the following:
Balanced budget constraint(operating expenditure should not exceed operating revenue)unless there are existing uncommitted cash-backed reserves to fund any deficit
Funding of the over the medium-term as informed by Section 18 and 19 of the MFMA,
Strict adherence to the principle of no project plans no budget. If there is no business plan no funding allocation can be made.
Expenditure by Source Table
Choose name from list - Table A4 Consolidated Budgeted Financial Performance (revenue and expenditure)
Description Ref 2012/13 2013/14 2014/15
R thousand 1Audited
Outcome
Audited
Outcome
Audited
Outcome
Original
Budget
Adjusted
Budget
Full Year
Forecast
Pre-audit
outcome
Budget Year
2016/17
Budget Year
+1 2017/18
Budget Year
+2 2018/19
Expenditure By Type
Employ ee related costs 2 – – 33 657 50 975 54 029 50 975 – 60 566 63 595 66 774
Remuneration of councillors 5 633 6 893 7 180 7 556 7 556 7 655 7 655 9 855 10 348 10 865
Debt impairment 3 1 435 4 835 5 218 1 700 1 700 1 700 1 700 1 900 1 995 2 095
Depreciation & asset impairment 2 16 421 12 610 16 627 18 000 18 000 18 000 12 840 19 000 19 950 20 948
Finance charges 133 101 57 – – – – – – –
Bulk purchases 2 – – – – – – – – – –
Other materials 8 1 828 2 762 2 339 4 311 4 299 2 810 2 810 2 994 3 143 3 300
Contracted serv ices 1 864 4 405 4 962 6 073 6 684 3 666 3 666 6 484 – –
Transfers and grants 1 935 1 115 1 514 2 465 2 465 2 465 1 644 4 435 4 657 4 890
Other ex penditure 4, 5 23 096 20 699 21 969 30 893 30 711 28 554 28 554 29 462 30 935 32 482
Loss on disposal of PPE 6 167 375 3 095 – – – – – – –
Total Expenditure 58 512 53 796 96 620 121 973 125 444 115 825 58 870 134 696 134 623 141 354
Surplus/(Deficit) 23 916 40 900 9 653 (9 430) (10 591) 12 045 69 000 (12 604) (6 426) (6 748)
Transfers recognised - capital 16 982 28 052 60 238 73 624 88 624 88 030 88 030 58 280 61 194 64 253
Contributions recognised - capital 6 – – – – – – – – – –
Contributed assets – – – – – – – – – –
Surplus/(Deficit) after capital transfers &
contributions
40 899 68 952 69 891 64 194 78 033 100 075 157 030 45 675 54 767 57 506
Tax ation – – – – – – – – – –
Surplus/(Deficit) after taxation 40 899 68 952 69 891 64 194 78 033 100 075 157 030 45 675 54 767 57 506
Attributable to minorities – – – – – – – – – –
Surplus/(Deficit) attributable to municipality 40 899 68 952 69 891 64 194 78 033 100 075 157 030 45 675 54 767 57 506
Share of surplus/ (deficit) of associate 7 – – – – – – – – – –
Surplus/(Deficit) for the year 40 899 68 952 69 891 64 194 78 033 100 075 157 030 45 675 54 767 57 506
2016/17 Medium Term Revenue &
Expenditure FrameworkCurrent Year 2015/16

UBuhlebezwe Municipality 2016 – 17 Final Budget
13
Employee Related Costs
This refers to the salaries and benefits paid to employees, currently the municipality has tentatively budgeted 6% for salary increases. The proposed total cost to employer amount to R70 421 411. This amount includes the Councilors Remuneration.
Provision for doubtful debts. The provision of debt impairment was determined based on an annual collection rate. For the 2016/2017 financial year this amount equates to R1 900 000. While this expenditure is considered to be non-cash item, it informed the cost associated with rendering the services of the municipality, as well as the municipality’s realistically anticipated revenues.
Depreciation Provision for depreciation and asset impairment has been informed by the Municipality’s Asset Management Policy. Depreciation is widely considered a proxy for the rate asset consumption. Budget appropriations in this regard total R19 000 000 for the 2016/2017 financial year and equates to 14 per cent of the total operating expenditure, it has been increased by R 1000 000 compare to 2015/2016.
Repairs and Maintenance In line with repairs and maintenance plan this group of expenditure has been prioritised to ensure sustainability of the Municipality’s infrastructure assets. The amount of R 2 993 650 has been budgeted for 2016/2017.
Contracted Services The budget of R 6 484 000 has been set aside for contracted services, this refers to lease payable for printing and photocopying machines that municipality is using, security, car tracker, Insurance ect.
Transfers and Grants/ Free Basic Services The social package assists households that are poor or face other circumstances that limit their ability to pay for services. To receive these free services the households are required to register in terms of the Municipality’s Indigent Policy. The budget of R 4 435 000 has been set aside.

UBuhlebezwe Municipality 2016 – 17 Final Budget
14
Other Expenditure Other expenditure is the expenditure incurred by the municipality for its operations,
the amount of R29 462 339 is projected.
Community Development Programmes/Projects
PROGRAMMES 2015/2016 2016/2017
Bursary Youth 500 000 600 000
Disaster Management 230000 250 000
Grant in aid 10 000 10 000
Marketing and Tourism 30 000 60 000
Moral Generation 250 000 120 000
Performing Arts 200 000 320 000
Back To School 15 000 15 000
Arts and Culture 190 000 250 000
Community Development 571 000 1 200 000
Youth Programs 200 000 200 000
52%
2%
14%
2%
5%
3%
22%
OPERATING EXPENDITURE
Employee related costs Provision for doubtful debts Depreciation
Repairs and maintanance Contracted Services Transfers and Grants
Other Expenditure

UBuhlebezwe Municipality 2016 – 17 Final Budget
15
HIV/AIDS Awareness 210 000 150 000
Ward Committee 760 464 1 235 000
Public Participation 300 000 150 000
LED Projects 1 500 000 1 000 000
Stakeholders forum 100 000 50 000
Garden Manure and Tree 230 000 32 000
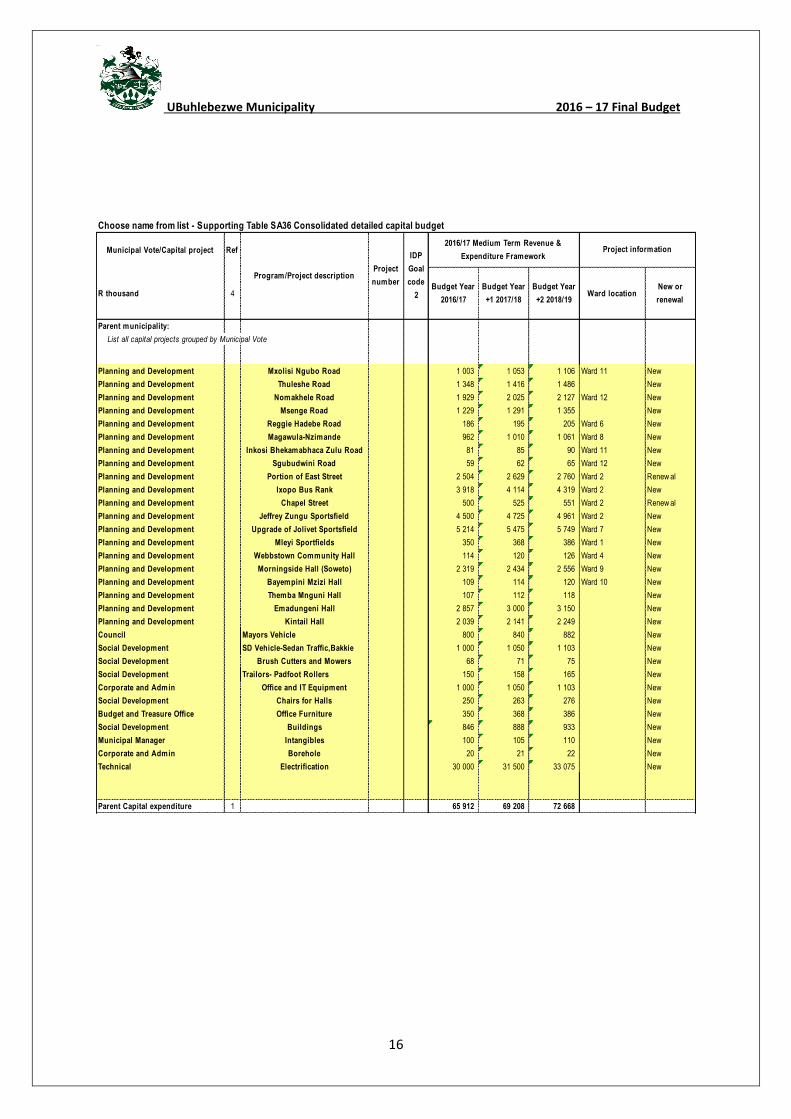
1.6 CAPITAL EXPENDITURE The total Capital budget for 2016/2017 financial year has been appropriated at R 65 912 348. The capital budget of R65 912 348 for 2016/2017 is 25.3% less, when compared to 2015/16 final budget. Capital projects are funded by 78.1% grants and 21.9% internally generated funds. Capital expenditure funding is funded by grants which is an amount of R24 057 000 from MIG and R30 000 000 for Electrification from DOE respectively. Other expenditure of R11 855 348 is funded from internally generated funds. Summary of Capital Expenditure
MIG R 24 057 000
Electrification R 30 000 000
Internal Funded R 11 855 348
Total R65 912 348
UBuhlebezwe Municipality 2016 – 17 Final Budget
16
Choose name from list - Supporting Table SA36 Consolidated detailed capital budget
Municipal Vote/Capital project Ref
R thousand 4Budget Year
2016/17
Budget Year
+1 2017/18
Budget Year
+2 2018/19Ward location
New or
renewal
Parent municipality:
List all capital projects grouped by Municipal Vote
Planning and Development Mxolisi Ngubo Road 1 003 1 053 1 106 Ward 11 New
Planning and Development Thuleshe Road 1 348 1 416 1 486 New
Planning and Development Nomakhele Road 1 929 2 025 2 127 Ward 12 New
Planning and Development Msenge Road 1 229 1 291 1 355 New
Planning and Development Reggie Hadebe Road 186 195 205 Ward 6 New
Planning and Development Magawula-Nzimande 962 1 010 1 061 Ward 8 New
Planning and Development Inkosi Bhekamabhaca Zulu Road 81 85 90 Ward 11 New
Planning and Development Sgubudwini Road 59 62 65 Ward 12 New
Planning and Development Portion of East Street 2 504 2 629 2 760 Ward 2 Renew al
Planning and Development Ixopo Bus Rank 3 918 4 114 4 319 Ward 2 New
Planning and Development Chapel Street 500 525 551 Ward 2 Renew al
Planning and Development Jeffrey Zungu Sportsfield 4 500 4 725 4 961 Ward 2 New
Planning and Development Upgrade of Jolivet Sportsfield 5 214 5 475 5 749 Ward 7 New
Planning and Development Mleyi Sportfields 350 368 386 Ward 1 New
Planning and Development Webbstown Community Hall 114 120 126 Ward 4 New
Planning and Development Morningside Hall (Soweto) 2 319 2 434 2 556 Ward 9 New
Planning and Development Bayempini Mzizi Hall 109 114 120 Ward 10 New
Planning and Development Themba Mnguni Hall 107 112 118 New
Planning and Development Emadungeni Hall 2 857 3 000 3 150 New
Planning and Development Kintail Hall 2 039 2 141 2 249 New
Council Mayors Vehicle 800 840 882 New
Social Development SD Vehicle-Sedan Traffic,Bakkie 1 000 1 050 1 103 New
Social Development Brush Cutters and Mowers 68 71 75 New
Social Development Trailors- Padfoot Rollers 150 158 165 New
Corporate and Admin Office and IT Equipment 1 000 1 050 1 103 New
Social Development Chairs for Halls 250 263 276 New
Budget and Treasure Office Office Furniture 350 368 386 New
Social Development Buildings 846 888 933 New
Municipal Manager Intangibles 100 105 110 New
Corporate and Admin Borehole 20 21 22 New
Technical Electrification 30 000 31 500 33 075 New
Parent Capital expenditure 1 65 912 69 208 72 668
Project information
Program/Project descriptionProject
number
IDP
Goal
code
2
2016/17 Medium Term Revenue &
Expenditure Framework

UBuhlebezwe Municipality 2016 – 17 Final Budget
17
1.7 Annual Budget Tables-
1.7.1 Explanatory notes to MBRR Table A1-Budget Summary for 2016/2017 Financial year.
Table A1 is a budget summary and provides a concise overview of Ubuhlebezwe Local Municipality’s budget from all the major financial perspectives (operating, capital expenditure, financial position, cash flow and MFMA funding compliance.
The table provides an overview of the amounts approved by Council for operating performance, resources deployed to capital expenditure, financial
position, cash and funding compliance, as well as the municipality’s commitment to eliminating basic service delivery backlogs.
Financial management reforms emphasises the importance of the municipal budget being funded. The Budget Summary provides the key information in this regard;
Transfer recognised is reflected on the Financial Performance Budget Internally generated funds are financed from a combination of the
operating surplus and accumulated cash-backed surplus from previous years. The fact that the municipality’s cash flow remains positive, and is improving indicates that the necessary cash resources are available to fund the Capital Budget.
Even though the Council is placing great emphasis on securing the financial sustainability of the municipality, this is not being done at the expense of services to the poor. The municipality is committed to provide free basic services to the needy community. In addition, the municipality continues to make progress in addressing service delivery backlogs.

UBuhlebezwe Municipality 2016 – 17 Final Budget
18
Description 2012/13 2013/14 2014/15
R thousandsAudited
Outcome
Audited
Outcome
Audited
Outcome
Original
Budget
Adjusted
Budget
Full Year
Forecast
Pre-audit
outcome
Budget Year
2016/17
Budget Year
+1 2017/18
Budget Year
+2 2018/19
Financial Performance
Property rates 8 298 12 949 12 349 12 980 12 983 23 441 23 441 15 754 16 542 17 369
Serv ice charges 1 272 1 478 1 454 1 878 1 878 1 793 1 793 1 991 2 090 2 195
Inv estment rev enue 2 864 3 793 5 456 3 000 4 500 6 599 6 599 4 000 4 200 4 410
Transfers recognised - operational 64 778 71 011 80 757 90 100 90 100 88 775 88 775 95 039 99 791 104 780
Other ow n rev enue 5 217 5 464 6 257 4 585 5 392 7 262 7 262 5 309 5 574 5 853
Total Revenue (excluding capital transfers
and contributions)
82 428 94 696 106 273 112 543 114 853 127 870 127 870 122 092 128 197 134 606
Employ ee costs – – 33 657 50 975 54 029 50 975 – 60 566 63 595 66 774
Remuneration of councillors 5 633 6 893 7 180 7 556 7 556 7 655 7 655 9 855 10 348 10 865
Depreciation & asset impairment 16 421 12 610 16 627 18 000 18 000 18 000 12 840 19 000 19 950 20 948
Finance charges 133 101 57 – – – – – – –
Materials and bulk purchases 1 828 2 762 2 339 4 311 4 299 2 810 2 810 2 994 3 143 3 300
Transfers and grants 1 935 1 115 1 514 2 465 2 465 2 465 1 644 4 435 4 657 4 890
Other ex penditure 32 562 30 315 35 245 38 666 39 095 33 920 33 920 37 846 32 930 34 577
Total Expenditure 58 512 53 796 96 620 121 973 125 444 115 825 58 870 134 696 134 623 141 354
Surplus/(Deficit) 23 916 40 900 9 653 (9 430) (10 591) 12 045 69 000 (12 604) (6 426) (6 748)
Transfers recognised - capital 16 982 28 052 60 238 73 624 88 624 88 030 88 030 58 280 61 194 64 253
Contributions recognised - capital & contributed assets – – – – – – – – – –
Surplus/(Deficit) after capital transfers &
contributions
40 899 68 952 69 891 64 194 78 033 100 075 157 030 45 675 54 767 57 506
Share of surplus/ (deficit) of associate – – – – – – – – – –
Surplus/(Deficit) for the year 40 899 68 952 69 891 64 194 78 033 100 075 157 030 45 675 54 767 57 506
Capital expenditure & funds sources
Capital expenditure 27 430 28 707 283 117 88 188 102 526 102 637 102 637 65 912 69 208 83 875
Transfers recognised - capital 16 939 19 780 238 228 64 671 78 945 79 028 79 028 54 706 57 441 60 313
Public contributions & donations – – – – – – – – – –
Borrow ing – – 477 – – – – – – –
Internally generated funds 10 491 8 927 44 412 23 517 23 581 23 609 23 609 11 207 11 767 12 355
Total sources of capital funds 27 430 28 707 283 117 88 188 102 526 102 637 102 637 65 912 69 208 72 668
Financial position
Total current assets 63 821 77 572 95 088 54 655 67 952 54 655 – 101 087 106 141 111 448
Total non current assets 193 178 214 785 263 160 236 360 250 528 236 360 – 295 461 310 234 325 746
Total current liabilities 23 499 20 250 23 947 4 862 15 789 4 862 – 20 668 21 702 22 787
Total non current liabilities 4 986 5 706 5 543 4 346 4 346 4 346 – 5 543 5 820 6 111
Community w ealth/Equity 228 515 266 402 328 758 281 808 298 345 281 808 – 370 336 388 853 408 296
Cash flows
Net cash from (used) operating 58 874 43 559 84 951 69 040 94 710 70 530 70 530 100 709 105 744 111 031
Net cash from (used) inv esting (33 695) (10 038) (68 457) (88 188) (51 531) (88 188) (88 188) (65 912) (69 208) (72 668)
Net cash from (used) financing (219) (286) (558) – – – – – – –
Cash/cash equivalents at the year end 57 758 90 993 81 970 44 584 57 880 (17 658) (2 957) 87 969 124 505 162 868
Cash backing/surplus reconciliation
Cash and inv estments av ailable 57 758 66 033 81 970 44 584 57 880 44 584 – 87 969 92 367 96 986
Application of cash and inv estments 22 969 19 530 21 198 (4 177) 746 (1 181) – (1 718) (1 805) (1 894)
Balance - surplus (shortfall) 34 789 46 503 60 772 48 760 57 134 45 764 – 89 687 94 172 98 880
Asset management
Asset register summary (WDV) 193 178 214 785 263 160 107 304 122 231 122 342 295 461 295 461 181 860 182 581
Depreciation & asset impairment 16 421 12 610 16 627 18 000 18 000 18 000 19 000 19 000 19 950 20 948
Renew al of Ex isting Assets – – – 6 197 6 229 6 229 6 229 1 106 1 161 1 220
Repairs and Maintenance 1 834 2 762 2 339 4 311 4 291 1 333 2 994 2 994 3 143 3 300
Free services
Cost of Free Basic Serv ices prov ided – – – – – – – – – –
Rev enue cost of free serv ices prov ided 5 049 6 590 7 587 4 375 4 375 7 787 6 600 6 600 6 930 7 277
Households below minimum service level
Water: – – – – – – – – – –
Sanitation/sew erage: – – – – – – – – – –
Energy : – – – – – – – – – –
Refuse: – – – – – – – – – –
2016/17 Medium Term Revenue &
Expenditure FrameworkCurrent Year 2015/16
Choose name from list - Table A1 Consolidated Budget Summary

UBuhlebezwe Municipality 2016 – 17 Final Budget
19
1.7.2 Explanatory notes to MBRR Table A2-Budgeted Financial Performance
(revenue and expenditure by standard classification)
Table A2 is a view of the budgeted financial performance in relation to revenue and expenditure per standard classification. The modified GFS standard classification divides the municipal services into its functional areas. Municipal revenue, operating expenditure are then classified in terms if each of these functional areas which enables the National Treasury to compile ‘whole of government’ reports
Choose name from list - Table A2 Consolidated Budgeted Financial Performance (revenue and expenditure by standard classification)
Standard Classification Description Ref 2012/13 2013/14 2014/15
R thousand 1Audited
Outcome
Audited
Outcome
Audited
Outcome
Original
Budget
Adjusted
Budget
Full Year
Forecast
Budget Year
2016/17
Budget Year
+1 2017/18
Budget Year
+2 2018/19
Revenue - Standard
Governance and administration 65 074 77 044 89 125 104 187 105 990 116 969 112 405 118 025 123 926
Ex ecutiv e and council – 25 10 – – – – – –
Budget and treasury office 64 796 76 088 88 128 103 987 105 790 116 039 112 155 117 763 123 651
Corporate serv ices 278 931 987 200 200 929 250 263 276
Community and public safety 4 965 4 098 4 952 4 258 4 763 6 203 4 797 5 036 5 288
Community and social serv ices 778 577 737 1 033 1 038 1 569 1 022 1 073 1 126
Sport and recreation 911 63 384 – – – – – –
Public safety 3 274 3 406 3 773 3 225 3 725 4 634 3 775 3 964 4 162
Housing 1 51 58 – – – – – –
Health – – – – – – – – –
Economic and environmental services 28 100 40 010 70 970 75 844 90 846 90 936 61 180 64 239 67 451
Planning and dev elopment 18 211 30 200 62 413 73 704 88 706 88 051 58 415 61 335 64 402
Road transport 9 889 9 810 8 557 2 140 2 140 2 884 2 765 2 903 3 048
Env ironmental protection – – – – – – – – –
Trading services 1 272 1 596 1 464 1 878 1 878 1 793 1 991 2 090 2 195
Electricity – – – – – – – – –
Water – – – – – – – – –
Waste w ater management – – – – – – – – –
Waste management 1 272 1 596 1 464 1 878 1 878 1 793 1 991 2 090 2 195
Other 4 – – – – – – – – –
Total Revenue - Standard 2 99 411 122 748 166 511 186 167 203 477 215 900 180 372 189 390 198 860
Expenditure - Standard
Governance and administration 55 700 56 270 65 439 73 020 73 943 62 025 81 554 85 631 89 913
Ex ecutiv e and council 12 315 13 496 14 980 19 923 19 373 18 885 22 614 23 745 24 932
Budget and treasury office 31 738 24 893 28 218 32 747 33 547 25 641 37 525 39 402 41 372
Corporate serv ices 11 647 17 881 22 241 20 350 21 022 17 499 21 414 22 485 23 609
Community and public safety 9 769 13 370 16 274 21 911 23 481 19 865 23 014 22 925 24 071
Community and social serv ices 4 037 6 446 6 921 8 685 11 012 7 763 9 123 9 579 10 058
Sport and recreation 568 565 625 941 914 1 236 672 705 740
Public safety 4 813 5 993 7 873 11 175 10 501 9 931 12 039 12 641 13 273
Housing 351 366 855 1 109 1 054 935 1 181 – –
Health – – – – – – – – –
Economic and environmental services 13 519 15 939 16 266 22 155 21 072 17 725 21 624 22 705 23 840
Planning and dev elopment 9 324 10 761 10 615 14 922 13 834 11 384 13 732 14 419 15 140
Road transport 4 195 5 179 5 651 7 233 7 239 6 340 7 892 8 286 8 700
Env ironmental protection – – – – – – – – –
Trading services 4 684 4 862 6 176 9 049 6 948 6 999 8 505 8 931 9 377
Electricity – – – – – – – – –
Water – – – – – – – – –
Waste w ater management – – – – – – – – –
Waste management 4 684 4 862 6 176 9 049 6 948 6 999 8 505 8 931 9 377
Other 4 – – – – – – – – –
Total Expenditure - Standard 3 83 672 90 441 104 154 126 134 125 444 106 614 134 696 140 192 147 201
Surplus/(Deficit) for the year 15 739 32 306 62 356 60 033 78 033 109 287 45 675 49 199 51 659
Current Year 2015/162016/17 Medium Term Revenue &
Expenditure Framework

UBuhlebezwe Municipality 2016 – 17 Final Budget
20
1.7.3 Explanatory notes to MBRR Table A3-Budgeted Financial Performance (revenue and expenditure by municipal vote) Table A3 is a view of the budgeted financial performance in relation to the revenue and expenditure per municipal vote. This table facilitates the view of the budgeted operating performance in relation to the organisational structure. This means it is possible to present the operating surplus or deficit of a vote. The table shows the analysis of the surplus or deficit
1.7.4 Explanatory notes to Table A4 - Budgeted Financial Performance (revenue and expenditure) Total revenue is R 122 092 031 in 2016/2017, Revenue to be generated from property rates is R15 753 821 in 2016/2017 financial year. Transfers recognised-operating includes the local government equitable share and other grants from national and provincial government. It is noted that the grants remains a significant and high funding source for the municipality.
Choose name from list - Table A3 Consolidated Budgeted Financial Performance (revenue and expenditure by municipal vote)
Vote Description Ref 2012/13 2013/14 2014/15
R thousandAudited
Outcome
Audited
Outcome
Audited
Outcome
Original
Budget
Adjusted
Budget
Full Year
Forecast
Budget Year
2016/17
Budget Year
+1 2017/18
Budget Year
+2 2018/19
Revenue by Vote 1
Vote 1 - Ex ecutiv e and Council – 25 10 – – – – – –
Vote 2 - BUDGET AND TREASURY 64 796 76 088 88 128 103 987 105 790 116 039 112 155 117 763 123 651
Vote 3 - CORPORATE SERVOCES 278 931 987 200 200 929 250 263 276
Vote 4 - COMMUNITY AND SOCIAL SERVICES 778 577 737 1 033 1 038 1 569 1 022 1 073 1 126
Vote 5 - SPORTS AND RECREATION / PARKS 911 63 384 – – – – – –
Vote 6 - PUBLIC SAFETY 3 274 3 406 3 773 3 225 3 725 4 634 3 775 3 964 4 162
Vote 7 - HOUSING 1 51 58 – – – – – –
Vote 8 - PLANNING AND DEVELOPMENT 1 229 2 260 1 789 80 82 21 135 142 149
Vote 9 - ROADS TRANSPORT 26 871 37 750 69 181 75 764 90 764 90 914 61 045 64 097 67 302
Vote 10 - WASTE MANAGEMENT 1 272 1 596 1 464 1 878 1 878 1 793 1 991 2 090 2 195
Vote 11 - 0 – – – – – – – – –
Vote 12 - 0 – – – – – – – – –
Vote 13 - 0 – – – – – – – – –
Vote 14 - 0 – – – – – – – – –
Vote 15 - 0 – – – – – – – – –
Total Revenue by Vote 2 99 411 122 748 166 511 186 167 203 477 215 900 180 372 189 390 198 860
Expenditure by Vote to be appropriated 1
Vote 1 - Ex ecutiv e and Council 12 315 13 496 14 980 19 923 19 373 18 885 22 614 23 745 24 932
Vote 2 - BUDGET AND TREASURY 31 738 24 893 28 218 32 747 33 547 25 641 37 525 39 402 41 372
Vote 3 - CORPORATE SERVOCES 11 647 17 881 22 241 20 350 21 022 17 499 21 414 22 485 23 609
Vote 4 - COMMUNITY AND SOCIAL SERVICES 4 037 6 446 6 921 8 685 11 012 7 763 9 123 9 579 10 058
Vote 5 - SPORTS AND RECREATION / PARKS 568 565 625 941 914 1 236 672 705 740
Vote 6 - PUBLIC SAFETY 4 813 5 993 7 873 11 175 10 501 9 931 12 039 12 641 13 273
Vote 7 - HOUSING 351 366 855 1 109 1 054 935 1 181 1 240 1 302
Vote 8 - PLANNING AND DEVELOPMENT 6 629 7 047 6 418 8 351 7 127 6 312 7 311 7 677 8 060
Vote 9 - ROADS TRANSPORT 6 890 8 893 9 848 13 804 13 945 11 412 14 313 15 028 15 780
Vote 10 - WASTE MANAGEMENT 4 684 4 862 6 176 9 049 6 948 6 999 8 505 8 931 9 377
Vote 11 - 0 – – – – – – – – –
Vote 12 - 0 – – – – – – – – –
Vote 13 - 0 – – – – – – – – –
Vote 14 - 0 – – – – – – – – –
Vote 15 - 0 – – – – – – – – –
Total Expenditure by Vote 2 83 672 90 441 104 154 126 134 125 444 106 614 134 696 141 431 148 503
Surplus/(Deficit) for the year 2 15 739 32 306 62 356 60 033 78 033 109 287 45 675 47 959 50 357
Current Year 2015/162016/17 Medium Term Revenue &
Expenditure Framework
UBuhlebezwe Municipality 2016 – 17 Final Budget
21
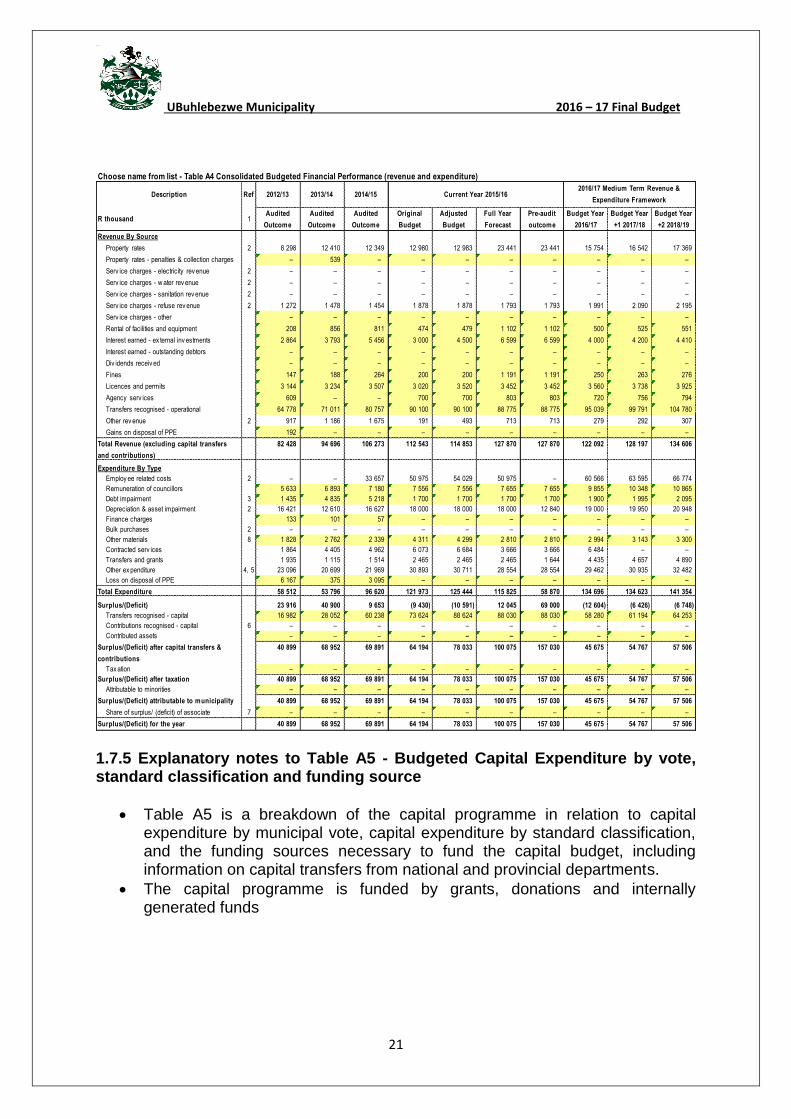
1.7.5 Explanatory notes to Table A5 - Budgeted Capital Expenditure by vote, standard classification and funding source
Table A5 is a breakdown of the capital programme in relation to capital expenditure by municipal vote, capital expenditure by standard classification, and the funding sources necessary to fund the capital budget, including information on capital transfers from national and provincial departments.
The capital programme is funded by grants, donations and internally generated funds
Choose name from list - Table A4 Consolidated Budgeted Financial Performance (revenue and expenditure)
Description Ref 2012/13 2013/14 2014/15
R thousand 1Audited
Outcome
Audited
Outcome
Audited
Outcome
Original
Budget
Adjusted
Budget
Full Year
Forecast
Pre-audit
outcome
Budget Year
2016/17
Budget Year
+1 2017/18
Budget Year
+2 2018/19
Revenue By Source
Property rates 2 8 298 12 410 12 349 12 980 12 983 23 441 23 441 15 754 16 542 17 369
Property rates - penalties & collection charges – 539 – – – – – – – –
Serv ice charges - electricity rev enue 2 – – – – – – – – – –
Serv ice charges - w ater rev enue 2 – – – – – – – – – –
Serv ice charges - sanitation rev enue 2 – – – – – – – – – –
Serv ice charges - refuse rev enue 2 1 272 1 478 1 454 1 878 1 878 1 793 1 793 1 991 2 090 2 195
Serv ice charges - other – – – – – – – – – –
Rental of facilities and equipment 208 856 811 474 479 1 102 1 102 500 525 551
Interest earned - ex ternal inv estments 2 864 3 793 5 456 3 000 4 500 6 599 6 599 4 000 4 200 4 410
Interest earned - outstanding debtors – – – – – – – – – –
Div idends receiv ed – – – – – – – – – –
Fines 147 188 264 200 200 1 191 1 191 250 263 276
Licences and permits 3 144 3 234 3 507 3 020 3 520 3 452 3 452 3 560 3 738 3 925
Agency serv ices 609 – – 700 700 803 803 720 756 794
Transfers recognised - operational 64 778 71 011 80 757 90 100 90 100 88 775 88 775 95 039 99 791 104 780
Other rev enue 2 917 1 186 1 675 191 493 713 713 279 292 307
Gains on disposal of PPE 192 – – – – – – – – –
Total Revenue (excluding capital transfers
and contributions)
82 428 94 696 106 273 112 543 114 853 127 870 127 870 122 092 128 197 134 606
Expenditure By Type
Employ ee related costs 2 – – 33 657 50 975 54 029 50 975 – 60 566 63 595 66 774
Remuneration of councillors 5 633 6 893 7 180 7 556 7 556 7 655 7 655 9 855 10 348 10 865
Debt impairment 3 1 435 4 835 5 218 1 700 1 700 1 700 1 700 1 900 1 995 2 095
Depreciation & asset impairment 2 16 421 12 610 16 627 18 000 18 000 18 000 12 840 19 000 19 950 20 948
Finance charges 133 101 57 – – – – – – –
Bulk purchases 2 – – – – – – – – – –
Other materials 8 1 828 2 762 2 339 4 311 4 299 2 810 2 810 2 994 3 143 3 300
Contracted serv ices 1 864 4 405 4 962 6 073 6 684 3 666 3 666 6 484 – –
Transfers and grants 1 935 1 115 1 514 2 465 2 465 2 465 1 644 4 435 4 657 4 890
Other ex penditure 4, 5 23 096 20 699 21 969 30 893 30 711 28 554 28 554 29 462 30 935 32 482
Loss on disposal of PPE 6 167 375 3 095 – – – – – – –
Total Expenditure 58 512 53 796 96 620 121 973 125 444 115 825 58 870 134 696 134 623 141 354
Surplus/(Deficit) 23 916 40 900 9 653 (9 430) (10 591) 12 045 69 000 (12 604) (6 426) (6 748)
Transfers recognised - capital 16 982 28 052 60 238 73 624 88 624 88 030 88 030 58 280 61 194 64 253
Contributions recognised - capital 6 – – – – – – – – – –
Contributed assets – – – – – – – – – –
Surplus/(Deficit) after capital transfers &
contributions
40 899 68 952 69 891 64 194 78 033 100 075 157 030 45 675 54 767 57 506
Tax ation – – – – – – – – – –
Surplus/(Deficit) after taxation 40 899 68 952 69 891 64 194 78 033 100 075 157 030 45 675 54 767 57 506
Attributable to minorities – – – – – – – – – –
Surplus/(Deficit) attributable to municipality 40 899 68 952 69 891 64 194 78 033 100 075 157 030 45 675 54 767 57 506
Share of surplus/ (deficit) of associate 7 – – – – – – – – – –
Surplus/(Deficit) for the year 40 899 68 952 69 891 64 194 78 033 100 075 157 030 45 675 54 767 57 506
2016/17 Medium Term Revenue &
Expenditure FrameworkCurrent Year 2015/16

UBuhlebezwe Municipality 2016 – 17 Final Budget
22
Choose name from list - Table A5 Consolidated Budgeted Capital Expenditure by vote, standard classification and funding
Vote Description Ref 2012/13 2013/14 2014/15
R thousand 1Audited
Outcome
Audited
Outcome
Audited
Outcome
Original
Budget
Adjusted
Budget
Full Year
Forecast
Pre-audit
outcome
Budget Year
2016/17
Budget Year
+1 2017/18
Budget Year
+2 2018/19
Capital expenditure - Vote
Multi-year expenditure to be appropriated 2
Vote 1 - Ex ecutiv e and Council – – – – – – – – – –
Vote 2 - BUDGET AND TREASURY – – – – – – – – – –
Vote 3 - CORPORATE SERVOCES – – – – – – – – – –
Vote 4 - COMMUNITY AND SOCIAL SERVICES – – – – – – – – – –
Vote 5 - SPORTS AND RECREATION / PARKS – – – – – – – – – –
Vote 6 - PUBLIC SAFETY – – – – – – – – – –
Vote 7 - HOUSING – – – – – – – – – –
Vote 8 - PLANNING AND DEVELOPMENT – – – – – – – – – –
Vote 9 - ROADS TRANSPORT – – – – – – – – – –
Vote 10 - WASTE MANAGEMENT – – – – – – – – – –
Vote 11 - 0 – – – – – – – – – –
Vote 12 - 0 – – – – – – – – – –
Vote 13 - 0 – – – – – – – – – –
Vote 14 - 0 – – – – – – – – – –
Vote 15 - 0 – – – – – – – – – –
Capital multi-year expenditure sub-total 7 – – – – – – – – – –
Single-year expenditure to be appropriated 2
Vote 1 - Ex ecutiv e and Council 1 000 1 200 1 464 1 550 800 800 800 900 945 992
Vote 2 - BUDGET AND TREASURY 667 – 15 377 1 605 1 105 1 150 1 150 350 368 386
Vote 3 - CORPORATE SERVOCES – – 24 339 3 210 2 920 2 920 2 920 1 020 1 071 1 125
Vote 4 - COMMUNITY AND SOCIAL SERVICES 7 700 5 500 94 394 10 899 9 440 9 468 9 468 18 174 19 082 20 036
Vote 5 - SPORTS AND RECREATION / PARKS – – – 6 519 5 679 5 679 5 679 – – –
Vote 6 - PUBLIC SAFETY 1 200 – 2 292 – – – – 1 000 1 050 1 103
Vote 7 - HOUSING – – 67 – – – – – – –
Vote 8 - PLANNING AND DEVELOPMENT – – 271 – – – – – – –
Vote 9 - ROADS TRANSPORT 16 863 22 007 141 212 64 405 82 582 82 620 82 620 44 469 46 692 49 027
Vote 10 - WASTE MANAGEMENT – – 3 701 – – – – – – –
Vote 11 - 0 – – – – – – – – – –
Vote 12 - 0 – – – – – – – – – –
Vote 13 - 0 – – – – – – – – – –
Vote 14 - 0 – – – – – – – – – –
Vote 15 - 0 – – – – – – – – – –
Capital single-year expenditure sub-total 27 430 28 707 283 117 88 188 102 526 102 637 102 637 65 912 69 208 72 668
Total Capital Expenditure - Vote 27 430 28 707 283 117 88 188 102 526 102 637 102 637 65 912 69 208 72 668
Capital Expenditure - Standard
Governance and administration 1 667 1 200 41 180 6 365 4 825 4 870 4 870 2 270 2 384 2 503
Ex ecutiv e and council 1 000 1 200 1 464 1 550 800 800 800 900 945 992
Budget and treasury office 667 – 15 377 1 605 1 105 1 150 1 150 350 368 386
Corporate serv ices – – 24 339 3 210 2 920 2 920 2 920 1 020 1 071 1 125
Community and public safety 8 900 5 500 96 601 17 418 15 119 15 147 15 147 19 174 20 132 21 139
Community and social serv ices 7 700 5 500 94 382 17 418 15 119 15 147 15 147 18 174 19 082 20 036
Sport and recreation – – – – – – – – – –
Public safety 1 200 – 2 152 – – – – 1 000 1 050 1 103
Housing – – 67 – – – – – – –
Health – – – – – – – – – –
Economic and environmental services 16 863 22 007 141 634 64 405 82 582 82 620 82 620 44 469 46 692 49 027
Planning and dev elopment – – 284 – – – – – – –
Road transport 16 863 22 007 141 351 64 405 82 582 82 620 82 620 44 469 46 692 49 027
Env ironmental protection – – – – – – – – – –
Trading services – – 3 701 – – – – – – 11 207
Electricity – – – – – – – – – –
Water – – – – – – – – – –
Waste w ater management – – – – – – – – – 11 207
Waste management – – 3 701 – – – – – – –
Other – – – – – – – – – –
Total Capital Expenditure - Standard 3 27 430 28 707 283 117 88 188 102 526 102 637 102 637 65 912 69 208 83 875
Funded by:
National Gov ernment 15 489 16 580 222 189 64 671 78 945 79 028 79 028 24 057 25 260 26 523
Prov incial Gov ernment 1 450 3 200 16 039 – – – – 30 000 31 500 33 075
District Municipality – – – – – – – – – –
Other transfers and grants – – (0) – – – – – – –
Transfers recognised - capital 4 16 939 19 780 238 228 64 671 78 945 79 028 79 028 54 057 56 760 59 598
Public contributions & donations 5 – – – – – – – – – –
Borrowing 6 – – 477 – – – – – – –
Internally generated funds 10 491 8 927 44 412 23 517 23 581 23 609 23 609 11 855 12 448 13 071
Total Capital Funding 7 27 430 28 707 283 117 88 188 102 526 102 637 102 637 65 912 69 208 72 668
2016/17 Medium Term Revenue &
Expenditure FrameworkCurrent Year 2015/16

UBuhlebezwe Municipality 2016 – 17 Final Budget
23
1.7.6 Explanatory notes to Table A6-Budgeted Financial Position
Table A6 is consistent with international standards of good financial management practice, and improves understand ability for councillors and management of the impact of the budget on the statement of financial position(balance sheet)
This format of presenting the statement of financial position is aligned to GRAP1, which is generally aligned to the international version.
Any movement on the budgeted financial performance or the capital budget will inevitably impact on the Budgeted Financial Position. As an example, the collection rate assumption will impact on the cash position of the municipality and subsequently inform the level of cash and cash equivalent at year end.
Table SA3 provides a detailed analysis of the major components of a number of items, including Call investments deposits Consumer debtors Property, plant and equipment Trade and other payables Provisions non- current Change in net assets, Reserves
The municipal equivalent of equity is Community Wealth/Equity. The justification is that ownership and the net assets on the municipality belong to the community.

UBuhlebezwe Municipality 2016 – 17 Final Budget
24
1.7.7 Explanatory notes to Table A7 - Budgeted Cash Flow Statement
The budgeted cash flow statement is the first measurement in determining if the budget is funded.
It shows the expected level of cash in-flow versus cash out-flow that is likely to result from the implementation of the budget.
Cash and cash equivalent totals R89 687 148 as at the end of the 2016/2017.
Choose name from list - Table A6 Consolidated Budgeted Financial Position
Description Ref 2012/13 2013/14 2014/15
R thousandAudited
Outcome
Audited
Outcome
Audited
Outcome
Original
Budget
Adjusted
Budget
Full Year
Forecast
Pre-audit
outcome
Budget Year
2016/17
Budget Year
+1 2017/18
Budget Year
+2 2018/19
ASSETS
Current assets
Cash 3 485 1 934 3 212 2 500 15 796 2 500 – 4 000 4 200 4 410
Call inv estment deposits 1 54 273 64 100 78 758 42 084 42 084 42 084 – 83 969 88 167 92 576
Consumer debtors 1 4 581 5 674 8 001 7 288 7 288 7 288 – 8 001 8 401 8 821
Other debtors 1 482 1 265 1 446 2 784 2 784 2 784 – 1 446 1 519 1 594
Current portion of long-term receiv ables – – – – – – – – – –
Inv entory 2 – 4 600 3 671 – – – – 3 671 3 855 4 047
Total current assets 63 821 77 572 95 088 54 655 67 952 54 655 – 101 087 106 141 111 448
Non current assets
Long-term receiv ables – – – – – – – – – –
Inv estments – – – – – – – – – –
Inv estment property 17 788 13 026 12 814 17 586 17 586 17 586 – 12 814 13 454 14 127
Inv estment in Associate – – – – – – – – – –
Property , plant and equipment 3 174 950 201 279 249 465 215 644 229 812 215 644 – 281 726 295 812 310 603
Agricultural – – – – – – – – – –
Biological – – – – – – – – – –
Intangible 440 480 881 3 130 3 130 3 130 – 921 967 1 015
Other non-current assets – – – – – – – – – –
Total non current assets 193 178 214 785 263 160 236 360 250 528 236 360 – 295 461 310 234 325 746
TOTAL ASSETS 257 000 292 357 358 248 291 015 318 480 291 015 – 396 548 416 375 437 194
LIABILITIES
Current liabilities
Bank ov erdraft 1 – – – – – – – – – –
Borrow ing 4 384 406 282 430 430 430 – 182 191 200
Consumer deposits – – – – – – – – – –
Trade and other pay ables 4 23 116 19 844 23 665 4 432 15 360 4 432 – 20 487 21 511 22 587
Prov isions – – – – – – – – – –
Total current liabilities 23 499 20 250 23 947 4 862 15 789 4 862 – 20 668 21 702 22 787
Non current liabilities
Borrow ing 763 454 63 488 488 488 – 63 66 69
Prov isions 4 223 5 252 5 480 3 857 3 857 3 857 – 5 480 5 754 6 042
Total non current liabilities 4 986 5 706 5 543 4 346 4 346 4 346 – 5 543 5 820 6 111
TOTAL LIABILITIES 28 485 25 956 29 490 9 208 20 135 9 208 – 26 211 27 522 28 898
NET ASSETS 5 228 515 266 402 328 758 281 808 298 345 281 808 – 370 336 388 853 408 296
COMMUNITY WEALTH/EQUITY
Accumulated Surplus/(Deficit) 228 141 266 028 328 384 281 434 297 971 281 434 – 369 963 388 461 407 884
Reserv es 4 374 374 374 374 374 374 – 374 392 412
TOTAL COMMUNITY WEALTH/EQUITY 5 228 515 266 402 328 758 281 808 298 345 281 808 – 370 336 388 853 408 296
2016/17 Medium Term Revenue &
Expenditure FrameworkCurrent Year 2015/16

UBuhlebezwe Municipality 2016 – 17 Final Budget
25
1.7.8 Explanatory notes to Table A8 - Cash Backed Reserves/Accumulated Surplus Reconciliation
The cash backed reserves/accumulated surplus reconciliation is aligned to the requirements of MFMA Circular 42 – Funding a Municipal Budget.
In essence the table evaluates the funding levels of the budget by firstly forecasting the cash and investments at year end and secondly reconciling the available funding to the liabilities/commitments that exist.
The outcome of this exercise would either be a surplus or deficit. A deficit would indicate that the applications exceed the cash and investments available and would be indicative of non-compliance with the MFMA requirements that the municipality’s budget must be funded
As part of the budgeting and planning guidelines that informed the compilation of the 2016/2017 MTREF the end objective of the medium framework was to ensure the budget is funded aligned to section 18 of the MFMA.
Considering the requirements of section 18 of the MFMA, it can be concluded that the adopted 2016/2017 MTREF is funded
Choose name from list - Table A7 Consolidated Budgeted Cash Flows
Description Ref 2012/13 2013/14 2014/15
R thousandAudited
Outcome
Audited
Outcome
Audited
Outcome
Original
Budget
Adjusted
Budget
Full Year
Forecast
Pre-audit
outcome
Budget Year
2016/17
Budget Year
+1 2017/18
Budget Year
+2 2018/19
CASH FLOW FROM OPERATING ACTIVITIES
Receipts
Property rates, penalties & collection charges 8 292 12 949 12 349 10 514 22 829 10 524 10 524 41 225 43 286 45 450
Serv ice charges 1 272 1 478 1 454 1 521 1 502 1 521 1 521 3 493 3 668 3 851
Other rev enue 1 136 1 186 1 675 4 585 5 056 6 065 6 065 9 469 9 942 10 439
Gov ernment - operating 1 64 778 71 011 80 757 90 100 106 129 90 100 90 100 95 039 99 791 104 780
Gov ernment - capital 1 16 982 28 052 60 238 64 291 67 929 64 291 64 291 58 280 61 194 64 253
Interest 3 793 3 793 5 446 3 000 5 000 3 000 3 000 7 000 7 350 7 718
Div idends – – – – – – – – – –
Payments
Suppliers and employ ees (34 515) (73 797) (75 454) (102 506) (111 286) (102 506) (102 506) (109 361) (114 829) (120 571)
Finance charges – – – – – – – – – –
Transfers and Grants 1 (2 864) (1 115) (1 514) (2 465) (2 450) (2 465) (2 465) (4 435) (4 657) (4 890)
NET CASH FROM/(USED) OPERATING ACTIVITIES 58 874 43 559 84 951 69 040 94 710 70 530 70 530 100 709 105 744 111 031
CASH FLOWS FROM INVESTING ACTIVITIES
Receipts
Proceeds on disposal of PPE – 24 960 – – – – – – – –
Decrease (Increase) in non-current debtors – – – – – – – – – –
Decrease (increase) other non-current receiv ables – – – – – – – – – –
Decrease (increase) in non-current inv estments – – – – – – – – – –
Payments
Capital assets (33 695) (34 998) (68 457) (88 188) (51 531) (88 188) (88 188) (65 912) (69 208) (72 668)
NET CASH FROM/(USED) INVESTING ACTIVITIES (33 695) (10 038) (68 457) (88 188) (51 531) (88 188) (88 188) (65 912) (69 208) (72 668)
CASH FLOWS FROM FINANCING ACTIVITIES
Receipts
Short term loans – – – – – – – – – –
Borrow ing long term/refinancing – – – – – – – – – –
Increase (decrease) in consumer deposits – – – – – – – – – –
Payments
Repay ment of borrow ing 219 (286) (558) – – – – – – –
NET CASH FROM/(USED) FINANCING ACTIVITIES (219) (286) (558) – – – – – – –
NET INCREASE/ (DECREASE) IN CASH HELD 24 960 33 235 15 937 (19 148) 43 179 (17 658) (17 658) 34 796 36 536 38 363
Cash/cash equiv alents at the y ear begin: 2 32 798 57 758 66 033 63 731 14 701 – 14 701 53 172 87 969 124 505
Cash/cash equiv alents at the y ear end: 2 57 758 90 993 81 970 44 584 57 880 (17 658) (2 957) 87 969 124 505 162 868
2016/17 Medium Term Revenue &
Expenditure FrameworkCurrent Year 2015/16

UBuhlebezwe Municipality 2016 – 17 Final Budget
26
1.7.9 Explanatory notes to Table A9 - Asset Management
Table A9 provides an overview of municipal capital allocations to building new assets and the renewal of existing assets, as well as spending on repairs and maintenance by asset class.
National Treasury has recommended that municipalities should allocate at least 40 per cent of their capital budget to the renewal of existing assets, and allocations to repairs and maintenance should be 8 per cent of PPE. The Municipality is working towards meeting both of these recommendations but the budget for uBuhlebezwe is adequate to secure the ongoing health of the municipality’s infrastructure.
Choose name from list - Table A8 Consolidated Cash backed reserves/accumulated surplus reconciliation
Description Ref 2012/13 2013/14 2014/15
R thousandAudited
Outcome
Audited
Outcome
Audited
Outcome
Original
Budget
Adjusted
Budget
Full Year
Forecast
Pre-audit
outcome
Budget Year
2016/17
Budget Year
+1 2017/18
Budget Year
+2 2018/19
Cash and investments available
Cash/cash equiv alents at the y ear end 1 57 758 90 993 81 970 44 584 57 880 (17 658) (2 957) 87 969 124 505 162 868
Other current inv estments > 90 day s 0 (24 960) (0) 0 – 62 241 2 957 – (32 138) (65 882)
Non current assets - Inv estments 1 – – – – – – – – – –
Cash and investments available: 57 758 66 033 81 970 44 584 57 880 44 584 – 87 969 92 367 96 986
Application of cash and investments
Unspent conditional transfers 15 676 11 900 14 169 0 – 0 – 10 169 10 678 11 212
Unspent borrow ing – – – – – – – – –
Statutory requirements 2
Other w orking capital requirements 3 7 293 7 630 7 028 (4 177) 746 (1 181) – (11 888) (12 483) (13 106)
Other prov isions
Long term inv estments committed 4 – – – – – – – – – –
Reserv es to be backed by cash/inv estments 5
Total Application of cash and investments: 22 969 19 530 21 198 (4 177) 746 (1 181) – (1 718) (1 805) (1 894)
Surplus(shortfall) 34 789 46 503 60 772 48 760 57 134 45 764 – 89 687 94 172 98 880
2016/17 Medium Term Revenue &
Expenditure FrameworkCurrent Year 2015/16

UBuhlebezwe Municipality 2016 – 17 Final Budget
27

UBuhlebezwe Municipality 2016 – 17 Final Budget
28
Choose name from list - Table A9 Consolidated Asset Management
Description Ref 2012/13 2013/14 2014/15
R thousandAudited
Outcome
Audited
Outcome
Audited
Outcome
Original
Budget
Adjusted
Budget
Full Year
Forecast
Budget Year
2016/17
Budget Year
+1 2017/18
Budget Year
+2 2018/19
CAPITAL EXPENDITURE
Total New Assets 1 27 430 28 707 283 117 81 991 96 251 96 362 64 806 68 046 71 449
Infrastructure - Road transport 16 863 22 007 96 188 9 887 11 505 11 543 9 801 10 291 10 806
Infrastructure - Electricity – – 30 367 39 724 54 383 54 383 30 000 31 500 33 075
Infrastructure - Water – – 1 748 – 80 80 – – –
Infrastructure - Sanitation – – – – – – – – –
Infrastructure - Other – – 0 – – – – – –
Infrastructure 16 863 22 007 128 303 49 611 65 968 66 007 39 801 41 791 43 881
Community 7 462 5 500 95 928 24 319 23 226 23 226 21 577 22 656 23 789
Heritage assets 2 849 – 4 792 – – – – – –
Inv estment properties – – 13 026 – – – – – –
Other assets 6 256 1 200 40 188 6 460 6 091 6 164 3 328 3 494 3 669
Agricultural Assets – – – – – – – – –
Biological assets – – – – – – – – –
Intangibles – – 881 1 600 965 965 100 105 110
Total Renewal of Existing Assets 2 – – – 6 197 6 229 6 229 1 106 1 161 1 220
Infrastructure - Road transport – – – 4 000 4 000 4 000 – – –
Infrastructure - Electricity – – – – – – – – –
Infrastructure - Water – – – – – – – – –
Infrastructure - Sanitation – – – – – – – – –
Infrastructure - Other – – – – – – – – –
Infrastructure – – – 4 000 4 000 4 000 – – –
Community – – – 642 670 670 – – –
Heritage assets – – – – – – – – –
Inv estment properties – – – – – – – – –
Other assets 6 – – – 1 555 1 559 1 559 1 106 1 161 1 220
Agricultural Assets – – – – – – – – –
Biological assets – – – – – – – – –
Intangibles – – – – – – – – –
Total Capital Expenditure 4
Infrastructure - Road transport 16 863 22 007 96 188 13 887 15 505 15 543 9 801 10 291 10 806
Infrastructure - Electricity – – 30 367 39 724 54 383 54 383 30 000 31 500 33 075
Infrastructure - Water – – 1 748 – 80 80 – – –
Infrastructure - Sanitation – – – – – – – – –
Infrastructure - Other – – 0 – – – – – –
Infrastructure 16 863 22 007 128 303 53 611 69 968 70 007 39 801 41 791 43 881
Community 7 462 5 500 95 928 24 961 23 897 23 897 21 577 22 656 23 789
Heritage assets 2 849 – 4 792 – – – – – –
Inv estment properties – – 13 026 – – – – – –
Other assets 256 1 200 40 188 8 015 7 650 7 723 4 434 4 656 4 889
Agricultural Assets – – – – – – – – –
Biological assets – – – – – – – – –
Intangibles – – 881 1 600 965 965 100 105 110
TOTAL CAPITAL EXPENDITURE - Asset class 2 27 430 28 707 283 117 88 188 102 480 102 591 65 912 69 208 72 668
ASSET REGISTER SUMMARY - PPE (WDV) 5 –
Infrastructure - Road transport 16 409 19 483 15 122 13 887 15 505 15 543 75 345 25 345 25 345
Infrastructure - Electricity 30 474 36 182 28 083 39 724 54 383 54 383 84 383 84 383 84 383
Infrastructure - Water – – – – 80 80 80 80 80
Infrastructure - Sanitation – – – – – – – – –
Infrastructure - Other – – – – – – – – –
Infrastructure 46 882 55 665 43 204 53 611 69 968 70 007 159 808 109 808 109 808
Community 71 349 76 415 82 966 24 961 23 897 23 897 99 209 45 474 45 474
Heritage assets 2 849 2 849 – – – – – – –
Inv estment properties 17 788 13 026 12 814 17 586 17 586 17 586 12 814 13 454 14 127
Other assets 53 870 66 350 123 294 8 015 7 650 7 723 22 710 12 157 12 157
Agricultural Assets – – – – – – – – –
Biological assets – – – – – – – – –
Intangibles 440 480 881 3 130 3 130 3 130 921 967 1 015
TOTAL ASSET REGISTER SUMMARY - PPE (WDV) 5 193 178 214 785 263 160 107 304 122 231 122 342 295 461 181 860 182 581
EXPENDITURE OTHER ITEMS
Depreciation & asset impairment 16 421 12 610 16 627 18 000 18 000 18 000 19 000 19 950 20 948
Repairs and Maintenance by Asset Class 3 1 834 2 762 2 339 4 311 4 291 1 333 2 994 3 143 3 300
Infrastructure - Road transport – – – 800 750 800 750 788 827
Infrastructure - Electricity – – – 100 100 100 120 126 132
Infrastructure - Water – – – – – – – – –
Infrastructure - Sanitation – – – – – – – – –
Infrastructure - Other – – – – – – – – –
Infrastructure – – – 900 850 900 870 914 959
Community – – – 1 550 1 550 – – – –
Heritage assets – – – – – – – – –
Inv estment properties – – – – – – – – –
Other assets 6, 7 1 834 2 762 2 339 1 861 1 891 433 2 124 2 230 2 341
TOTAL EXPENDITURE OTHER ITEMS 18 255 15 372 18 966 22 311 22 291 19 333 21 994 23 093 24 248
Renewal of Existing Assets as % of total capex 0.0% 0.0% 0.0% 7.0% 6.1% 6.1% 1.7% 1.7% 1.7%
Renewal of Existing Assets as % of deprecn" 0.0% 0.0% 0.0% 34.4% 34.6% 34.6% 5.8% 5.8% 5.8%
R&M as a % of PPE 1.0% 1.4% 0.9% 2.0% 1.9% 0.6% 1.1% 1.1% 1.1%
Renewal and R&M as a % of PPE 1.0% 1.0% 1.0% 10.0% 9.0% 6.0% 1.0% 2.0% 2.0%
Current Year 2015/162016/17 Medium Term Revenue &
Expenditure Framework

UBuhlebezwe Municipality 2016 – 17 Final Budget
29
1.7.10 Explanatory notes to Table A10 - Basic Service Delivery Measurement
Table A10 provides an overview of service delivery levels, including backlogs (below minimum service level), for each of the main services. The Municipality continues to make good progress with the eradication of backlogs:
The number of household registered for indigent in 2016/2017 is expected to increase therefore entitled to receiving Free Basic Services, this is covered by municipality’s equitable share.
PART 2
2.1 OVERVIEW OF ANNUAL BUDGET PROCESS
Section 53 of the MFMA requires the Mayor of the municipality to provide general
political guidance in the budget process and the setting of priorities that must guide
the preparation of the budget. In addition Chapter 2 of the Municipal Budget and
Reporting Regulations states that the Mayor of the municipality must establish a
Budget Steering Committee to provide technical assistance to the Mayor in
discharging the responsibilities set out in section 53 of the Act.
The Budget Steering Committee consists of the Executive Committee members, the
Municipal Manager and senior officials of the municipality meeting under the
chairpersonship of the Mayor.
The primary aims of the Budget Steering Committee are to ensure:
That the process followed to compile the budget complies with legislation and
good budget practices;
That there is proper alignment between the policy and service delivery
priorities set out in the municipality’s IDP and the budget, taking into account
the need to protect the financial sustainability of municipality;
That the municipality’s revenue and tariff setting strategies ensure that the
cash resources needed to deliver services are available; and
That the various spending priorities of the different municipal departments are
properly evaluated and prioritised in the allocation of resources.

UBuhlebezwe Municipality 2016 – 17 Final Budget
30
2.2 OVERVIEW OF ALIGNMENT OF ANNUAL BUDGET WITH INTERGRATED
DEVELOPMENT PLAN The municipality’s IDP is its principal strategic planning instrument, which directly
guides and informs its planning, budget, management and development actions.
This framework is rolled out into objectives, key performance indicators and targets
for implementation which directly inform the Service Delivery and Budget
Implementation Plan. The Process Plan applicable to the newly developed IDP
includes the following key IDP processes and deliverables: • Registration of community needs; • Compilation of departmental business plans including key performance
indicators and targets; • Financial planning and budgeting process; • Public participation process; • Compilation of the SDBIP, and • The review of the performance management and monitoring processes.
The details of all revenue, operational expenditure and capital expenditure which are aligned to the goals and action plans in the Integrated Development Plan are outlined in the supporting documentation S4 to S6
2.3 MEASURABLE PRFORMANCE OBJECTIVES AND INDICATORS
Borrowing Management The municipality currently does not have external borrowings. The municipality’s credit worthiness has not been assessed; however there are no plans to utilize this facility in the next two years
Debtors and Creditor’s Management Creditors are paid twice a month in order to cater for SMME’s and in order to avoid late payments thereby incurring interests. The Credit Control and Debt collection policy was adopted in order to tighten up debt collection. Furthermore, the municipality utilizes services of debt collectors to collect from all defaulting debtors.

UBuhlebezwe Municipality 2016 – 17 Final Budget
31
2.4 OVERVIEW OF BUDGET RELATED-POLICIES
The municipality’s budgeting process is guided and governed by relevant legislation,
frameworks, strategies and related policies.
Credit Control and debts Collection policies
Asset Management Policy
Budget Policy
Supply Chain Management Policy
Virement Policy
Cash Management and Investment Policy
Property Rate Policy
Indigent Policy
All the above policies are available on the municipality’s website.
2.5 OVERVIEW OF BUDGET ASSUMPTIONS
The Draft budget was prepared in accordance with guidelines and assumptions as outlined in Municipal Budget and Reporting Regulations, taking into consideration the following aspects:
National budget assumptions, guidelines and projections; Alignment with national and provincial priorities; Headline inflation and gross domestic products forecasts; and Revenue assumptions with regard to grants allocation in terms of
revised DORA. Anticipated own revenue from rates and services charges, sundry
charges and other revenues and affordability of ratepayers and consumers services;
The ability of municipality to collect revenue (payment level); Operating expenditure cost drivers and growth thereof; Capital budget funding model; Protecting the poor by ensuring access to basic services
2.6 OVERVIEW OF BUDGET FUNDING Tariff setting plays a major role in ensuring desired levels of revenue. Getting tariffs
right assists in the compilation of a credible and funded budget. The Municipality
derives most of its operational revenue from grant funding. Other funding is derived
from Property rates, drivers licences, investments, rentals and operating and capital
UBuhlebezwe Municipality 2016 – 17 Final Budget
32
grants and other minor charges (such as building plan fees, licenses and permits
etc).
The revenue strategy is a function of key components such as:
Growth in the municipal area and economic development;
Revenue management and enhancement;
National Treasury guidelines;
Achievement of full cost recovery of specific user charges;
The Property Rates Policy in terms of the Municipal Property Rates Act, 2004
(Act 6 of 2004) (MPRA), and
And the ability to extend new services and obtain cost recovery levels such as
Town planning.
2.7 ANNUAL BUDGETS AND SDBIPs –INTERNAL DEPARTMENT
2.8 CONTRACTS HAVING BUDGETARY IMPLICATIONS
The municipality does not have contracts that go beyond the current Draft
budget year and the two outer years.
In terms of the municipality’s supply chain management policy, no
contracts are awarded beyond the medium-term revenue and expenditure
framework (three years). In ensuring adherence to this contractual time
frame limitation, all reports submitted to either the bid evaluation and
adjustment committees must obtain formal financial comments from the
Financial Management Division of the Budget and Treasury Office
Department.
2.9 LEGISLATION COMPLIANCE STATUS
Compliance with the MFMA implementation requirements have been substantially adhered to through the following activities:
Internship programme The Municipality is participating in the Municipal Financial Management Internship programme and has employed interns undergoing training in various divisions of the Financial Services Department.

UBuhlebezwe Municipality 2016 – 17 Final Budget
33
Budget and Treasury Office The Budget and Treasury Office has been established in accordance with the MFMA.
Audit Committee An Audit Committee has been established and is fully functional.
Annual Report Annual report is compiled in terms of the MFMA and National Treasury requirements.
2.10 MUNICIPAL MANAGER’S QUALITY CERTIFICATE

UBuhlebezwe Municipality 2016 – 17 Final Budget
34
01Budget and Treasury Department
QUALITY CERTIFICATE
(This certificate is done in terms of the Municipal Finance Management Act 56
of 2003, Regulations no: 32141 of April 17, 2009)
I, Gamakulu Ma-Art Sineke (Municipal Manager) of uBuhlebezwe Municipality
(KZN 434), hereby certify that the 2016/ 2017 Final budget and supporting
documentation have been prepared in accordance with the Municipal Finance
Management Act, regulations made under the act and that the annual budget
and supporting documents are consistent with the Integrated Development
Plan of the Municipality.
____________________________
Gamakulu Ma-Art Sineke
Municipal Manager
UBUHLEBEZWE MUNICIPALITY – KZN434
26 May 2016
DATED

UBuhlebezwe Municipality 2016 – 17 Final Budget
35
2.11 OTHER DOCUMENTS UBUHLEBEZWE
Telephone: 039 – 834 7700 PO Box 132 Fax: 039 – 834 1168 29 Margaret Street, Ixopo E-mail: [email protected] KwaZulu - Natal, 3276 Website: www.ubuhlebezwe.org.za South Africa MUNICIPALITY
From the Office of the Municipal Manager
EXTRACT FROM THE MINUTES OF THE COUNCIL MEETING HELD ON THE 26TH MAY
2016 AT 10H00 AT WEBBSTOWN HALL, WEBBSTOWN
RESOLUTION NO : CBTO40/16
AGENDA ITEM/SUBJECT : FINAL BUDGET FOR 2016/2017 FINANCIAL YEAR
Council at its meeting held on the 26th May 2016 considered the above matter. Following
discussion, it was
RESOLVED AS FOLLOWS:
(i) THAT Council approves the Final Budget 2016/17 with all A-schedules as
prescribed,
CERTIFIED A TRUE EXTRACT OF THE ORIGINAL MINUTES NAME OF MUNICIPAL MANAGER : MR GM SINEKE
SIGNATURE OF MUNICIPAL MANAGER :
DATE OF SIGNATURE :

UBuhlebezwe Municipality 2016 – 17 Final Budget
36