UAE Banking Pulse - alvarezandmarsal.com
21
UAE Banking Pulse Quarter 1, 2021
Transcript of UAE Banking Pulse - alvarezandmarsal.com

UAE Banking PulseQuarter 1, 2021

FOREWORD Alvarez & Marsal Middle East Limited (A&M) is delighted to publish the Q1’21 edition of the UAE
Banking Pulse (“The Pulse”). In this quarterly series, we share results from our research examining the
top ten largest listed UAE banks by assets, and highlight key performance indicators of the sector. The
Pulse aims to help banking executives and board members stay current on industry trends.
All the data used in this report has been obtained from publicly available sources and the methodology
for the calculations is discussed in the glossary. Calculation of metrics has been updated, where
required, to reflect appropriate comparative information.
Top ten UAE banks started the year on a mixed note, as total net income rebounded sharply (+85%
QoQ), while loan & advances continued to contract (-0.7% QoQ). Asset quality deteriorated for the sixth
straight quarter, with NPL/net loans ratio reaching 6.3%. The extension of the TESS program until
June’22 has delayed a likely deterioration of the sector’s asset quality.
Despite a strong increase in RoE (+4.7% points QoQ), it still remains in single digits (9.7%). While there
has been an improvement in profitability metrics, the recovery path for the sector remains fairly long.
We hope you will find the Pulse useful and informative.
Disclaimer:
The information contained in this document is of a general nature and has been obtained from publicly available information
plus market insights. The information is not intended to address the specific circumstances of an individual or institution. There
is no guarantee that the information is accurate at the date received by the recipient or that it will be accurate in the fut ure. All
parties should seek appropriate professional advice to analyze their particular situation before acting on any of the informa tion
contained herein2

Author
3
Asad Ahmed
Managing Director
Head of ME Financial Services
30+ years of experience in banking
Focuses on performance improvement, turn-around, credit management, and formulating
and managing strategic and operational changes in financial institutions
Former CEO of banks in the UAE & Kenya
Phone: +97145671065
CONTACT
DETAILS
UAE Macro & Sector Overview
1 IMF, 2 US Board of Federal Reserve, 3 UAE Central Bank, 4 DIB’s net income adjusted for one-time gains of AED 1.0bn on
bargain purchase in 2020, 5 Bloomberg & A&M Analysis, 6 based on data of 8 banks, weighted average exposure of all
banks; for consistency purpose data for all banks is captured from IR presentations * Data for top ten UAE banks by asset
size as of March 31st 2021 4
Macro overview Banking overview Q1’21
In April’21, the US Fed reaff irmed to keep interest rate at
record low levels until substantial progress in labor market is
w itnessed. How ever, risks of higher inf lation could potentially
challenge the Fed’s stance over the coming period
The overnight EIBOR saw a marginal decrease in Q1’21 by
~3.5 bps to 0.11% compared to Q4’20
The UAE’s central bank has extended its TESS program until
the end of June’22 to offset the impact of pandemic. The
banks’ draw dow n under the scheme reached AED 22bn as
on March’21 from AED 44bn in Q2’20
The UAE banks’ exposure to the real estate and construction
sector reduced by ~50 bps6 QoQ
The ongoing headw inds in the nation’s real estate market are
likely to continue in the near term. The sector is expected to
rebound over the medium to long term, driven by measures
such as offering citizenships and golden visas
21.7 21.7 21.4 22.3 21.8
Q1
'20
Q2
'20
Q3
'20
Q4
'20
Q1
'21
Real Estate & Construction as %
of Total Gross Loans4
0.3 0.3 0.3 0.3 0.3
0.6
0.1 0.1 0.1 0.1
Q1
'20
Q2
'20
Q3
'20
Q4
'20
Q1
'21
US Fed Funds Rate2, EIBOR, %
US Fed rate movement Overnight EIBOR
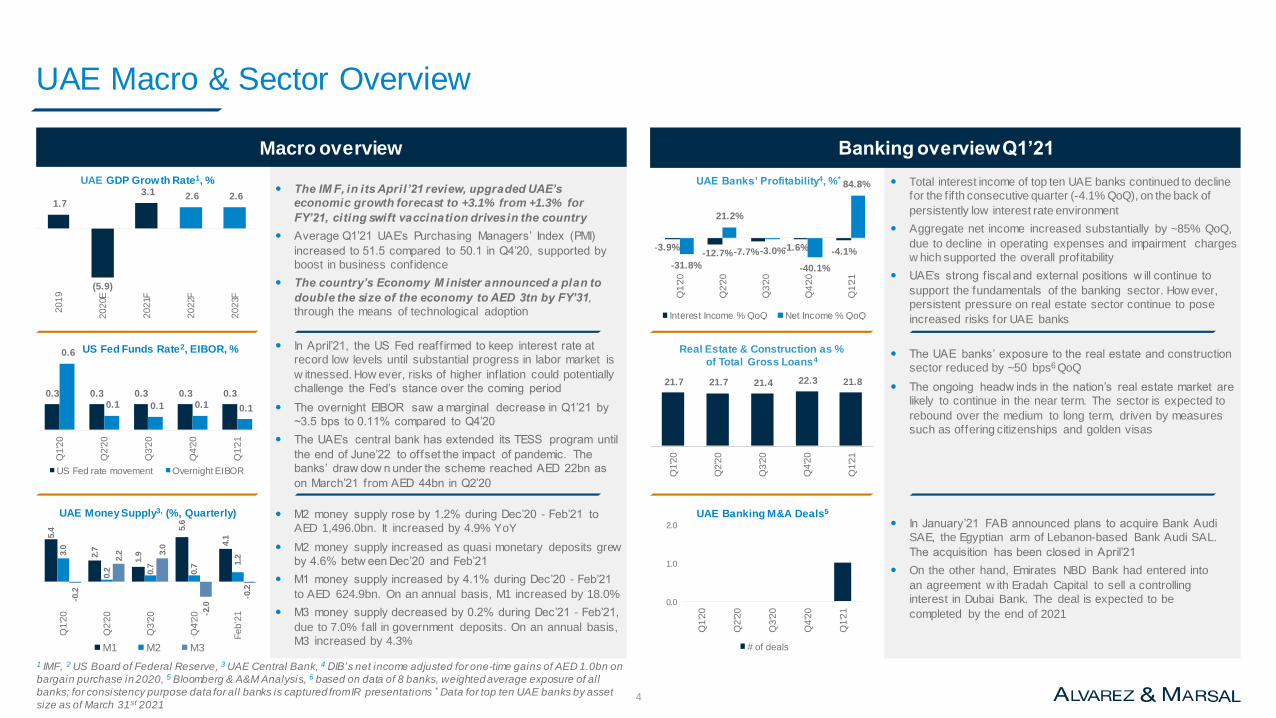
Total interest income of top ten UAE banks continued to decline
for the f if th consecutive quarter (-4.1% QoQ), on the back of
persistently low interest rate environment
Aggregate net income increased substantially by ~85% QoQ,
due to decline in operating expenses and impairment charges
w hich supported the overall profitability
UAE’s strong f iscal and external positions w ill continue to
support the fundamentals of the banking sector. How ever,
persistent pressure on real estate sector continue to pose
increased risks for UAE banks
The IM F, in its April’21 review, upgraded UAE’s
economic growth forecast to +3.1% from +1.3% for
FY’21, citing swift vaccination drives in the country
Average Q1’21 UAE’s Purchasing Managers’ Index (PMI)
increased to 51.5 compared to 50.1 in Q4’20, supported by
boost in business confidence
The country’s Economy M inister announced a plan to
double the size of the economy to AED 3tn by FY’31,
through the means of technological adoption
1.7
(5.9)
3.1 2.6 2.6
2019
20
20E
202
1F
20
22F
20
23F
UAE GDP Growth Rate1, %
M2 money supply rose by 1.2% during Dec’20 - Feb’21 to
AED 1,496.0bn. It increased by 4.9% YoY
M2 money supply increased as quasi monetary deposits grew
by 4.6% betw een Dec’20 and Feb’21
M1 money supply increased by 4.1% during Dec’20 - Feb’21
to AED 624.9bn. On an annual basis, M1 increased by 18.0%
M3 money supply decreased by 0.2% during Dec’21 - Feb’21,
due to 7.0% fall in government deposits. On an annual basis,
M3 increased by 4.3%
In January’21 FAB announced plans to acquire Bank Audi
SAE, the Egyptian arm of Lebanon-based Bank Audi SAL.
The acquisition has been closed in April’21
On the other hand, Emirates NBD Bank had entered into
an agreement w ith Eradah Capital to sell a controlling
interest in Dubai Bank. The deal is expected to be
completed by the end of 2021
5.4
2.7
1.9
5.6
4.1
3.0
0.2 0.7
0.7
1.2
-0.2
2.2 3
.0
-2.0
-0.2
-3.0
-2.0
-1.0
0.0
1.0
2.0
3.0
4.0
5.0
6.0
7.0
Q1
'20
Q2
'20
Q3
'20
Q4
'20
Fe
b'2
1
M1 M2 M3
UAE MoneySupply3, (%, Quarterly)
-3.9%-12.7%-7.7% -1.6% -4.1%
-31.8%
21.2%
-3.0%
-40.1%
84.8%
-60.0%
-40.0%
-20.0%
0.0%
20. 0%
40. 0%
60. 0%
80. 0%
100.0%
Q1
'20
Q2
'20
Q3
'20
Q4
'20
Q1
'21
UAE Banks’ Profitability4, %*
Interest Income % QoQ Net Income % QoQ
0.0
1.0
2.0
Q1
'20
Q2
'20
Q3
'20
Q4
'20
Q1
'21
UAE Banking M&A Deals5
# of deals

Pulse: Profitability Metrics of the UAE Banking Sector Increase, as Impairment and Operating Expenses Decline
Note 1: QoQ stand for quarter over quarter
Note 2: Growth in loans & advances and deposits were presented QoQ instead of YoY
Note 3: Quarterly income was used in the calculation of operating income growth
Source: Financial statements, Investor presentations, A&M analysis
Metric Q4’20 Q1’21 Q1’20 Q2’20 Q3’20 Q4’20 Q1’21
SizeLoans and Advances (L&A) Growth (QoQ) -0.4% -0.7%
Deposits Growth (QoQ) -2.8% 1.2%
Liquidity Loan-to-Deposit Ratio (LDR) 86.2% 84.5%
Income &
Operating Efficiency
Operating Income Growth (QoQ) 2.7% 1.3%
Operating Income / Assets 2.8% 2.9%
Non-Interest Income(NII) / Operating Income 30.6% 34.9%
Yield on Credit (YoC) 5.3% 5.1%
Cost of Funds (CoF) 1.2% 1.2%
Net Interest Margin (NIM) 2.1% 2.0%
Cost-to-Income Ratio (C/I) 36.7% 33.1%
RiskCoverage Ratio 91.8% 91.0%
Cost of Risk (CoR) 2.0% 1.3%
Profitability
Return on Equity (RoE) 5.0% 9.7%
Return on Assets (RoA) 0.6% 1.1%
Return on Risk-Weighted Assets (RoRWA) 0.9% 1.7%
Capital Capital Adequacy Ratio (CAR) 17.6% 17.4%
Key Trends of Q1’21
1
2
3
4
5
6
7
8
L&A declined for the third consecutive quarter (-0.7% QoQ). Deposits increased 1.2% QoQ, after declining in the preceding quarter
RoRWA increased in line with higher net income, while the capital adequacy ratio declined from 17.6% to 17.4%
RoE and RoA increased significantly due to ~85% QoQ increase in aggregate net profit
CoR declined to 1.3% as compared to 2.0% due to 36% QoQ decrease in impairment allowances. Coverage ratio declined to 91.0% from 91.8%
C/I ratio decreased to its lowest level in past seven quarters to 33.1%, driven by 9% QoQ decrease in SG&A expenses
NIM contracted by 10 bps QoQ, as industry-wide rates continue to decline in Q1’21
Operating income growth slowed to 1.3% QoQ, largely on the back of decline in net interest income
LDR decreased to 84.5% from 86.2%, as deposits increased while L&A declined
Improved Stable Worsened
5

FAB Underperformed its Peers on L&A Growth, while SIB’s Deposits Increased Substantially
Note: MS stands for market share
Source: Financial statements, Investor presentations, A&M analysis 6
Top ten UAE banks’ L&A decreased by 0.7% QoQ while the deposits increased by 1.2% QoQ
FAB’s L&A fell 2.2%, on the back of muted demand and repayments in GRE loan book. CBD reported highest increase in L&A (+6.6% QoQ)
SIB reported the highest increase in deposits (+5.6% QoQ), supported by sizeable growth in time deposits (+6.4% QoQ)
On the other hand, ADCB witnessed the highest drop in deposits (-5.0% QoQ), as time deposits decreased 18.7% QoQ
KEY TAKEAWAYS
L&A Growth QoQ (%)
Deposits Growth QoQ (%)
Lost Deposits & Financing MS
Gained Financing MS
Gained Deposits MS
Gained Deposits & Financing MS
Q1’21 Av
1.2%
-0.7%
1
-3.0
-1.0
1.0
3.0
5.0
7.0
-6.0 -4.0 -2.0 0.0 2.0 4.0 6.0 8.0 10.0

65
70
75
80
85
90
95
100
105
0 100 200 300 400 500 600 700 800 900 1000
Millions
Aggregate LDR Decreased After Increasing in the Preceding Quarter
Aggregate LDR decreased to 84.5% in Q1’21 compared to 86.2% in Q4’20
FAB (-5.0% points QoQ) reported the highest decline in LDR to 66.5%
NBF (+4.9% points) and CBD (+4.6% points) reported the highest increase in their LDR during the quarter
Note: The green zone is an area of healthy liquidity
Source: Financial statements, A&M analysis 7
KEY TAKEAWAYS
2
Loans to Deposits Ratio (%)
Total Asset (AED Bn)
Q4’20 AvQ4’20
Q1’21 AvQ1’21
84.5%86.2%

Operating Income Increased as Higher Fees and Other Operating Income Offset Reduced NII
Note: Some numbers might not add up due to rounding
Source: Financial statements, investor presentations, A&M analysis 8
Operating income increased by 1.3% QoQ, driven by 19.2% QoQ growth in fee income and 11.7% QoQ growth in other operating income
This was partially offset by 5.0% QoQ decline in net interest income due to lower interest rates
ENBD (+25.% QoQ) reported the highest increase in its total operating income, as fee income grew by 42%
The bank’s fee income increased on account of higher business volumes
Meanwhile, CBD (-17.3% QoQ) reported highest decline in operating income, followed by DIB (-12.2% QoQ)
KEY TAKEAWAYS
22.6
20.5
19.9 20.4
20.7
10.0
12.0
14.0
16.0
18.0
20.0
22.0
24.0
Q1'20 Q2'20 Q3'20 Q4'20 Q1'21
6.7
5.8 6.1 6.2
7.2
Q1'20 Q2'20 Q3'20 Q4'20 Q1'21
15.9
14.7
13.7 14.2
13.5
Q1'20 Q2'20 Q3'20 Q4'20 Q1'21
Quarterly NII
(AED Bn)
Quarterly Operating Income
(AED Bn)
Quarterly Net Fee commission and other
Operating Income (AED Bn)
+
Improved Stable Worsened
3

NIM Declined After Rising in the Previous Quarter
Note: Relation between elements above represents a functionality and not necessarily an exact mathematical formula
Source: Financial statements, Investor presentations, A&M analysis 9
NIM decreased by ~10 bps QoQ to 2.0%, falling to its multi-period low levels
Yield on credit declined by 19 bps QoQ to 5.1%, while cost of funds remained largely flat at 1.2%
KEY TAKEAWAYSYield On Credit
(Quarterly Annualized)
Net Interest Margin
(%,Quarterly Annualized)
Cost of Funds
(Quarterly Annualized)
–
1.9%1.5% 1.3% 1.2% 1.2%
Q1'20 Q2'20 Q3'20 Q4'20 Q1'21
6.7% 5.8% 5.3% 5.3% 5.1%
Q1'20 Q2'20 Q3'20 Q4'20 Q1'21
87.7% 87.7%
84.1%
86.2%84.5%
Q1'20 Q2'20 Q3'20 Q4'20 Q1'21
Loan-to-Deposit Ratio (LDR) x
4
2.51
2.26
2.05 2.09 2.00
Q1'20 Q2'20 Q3'20 Q4'20 Q1'21
1.3
7
2.4
9
2.4
5
2.3
8
1.7
3
2.6
9
2.3
8
2.1
3
4.5
2
2.4
0
1.2
0
2.5
1
2.2
1
2.3
0
2.0
0
2.5
1
2.1
0
2.0
1
4.2
2
2.4
9
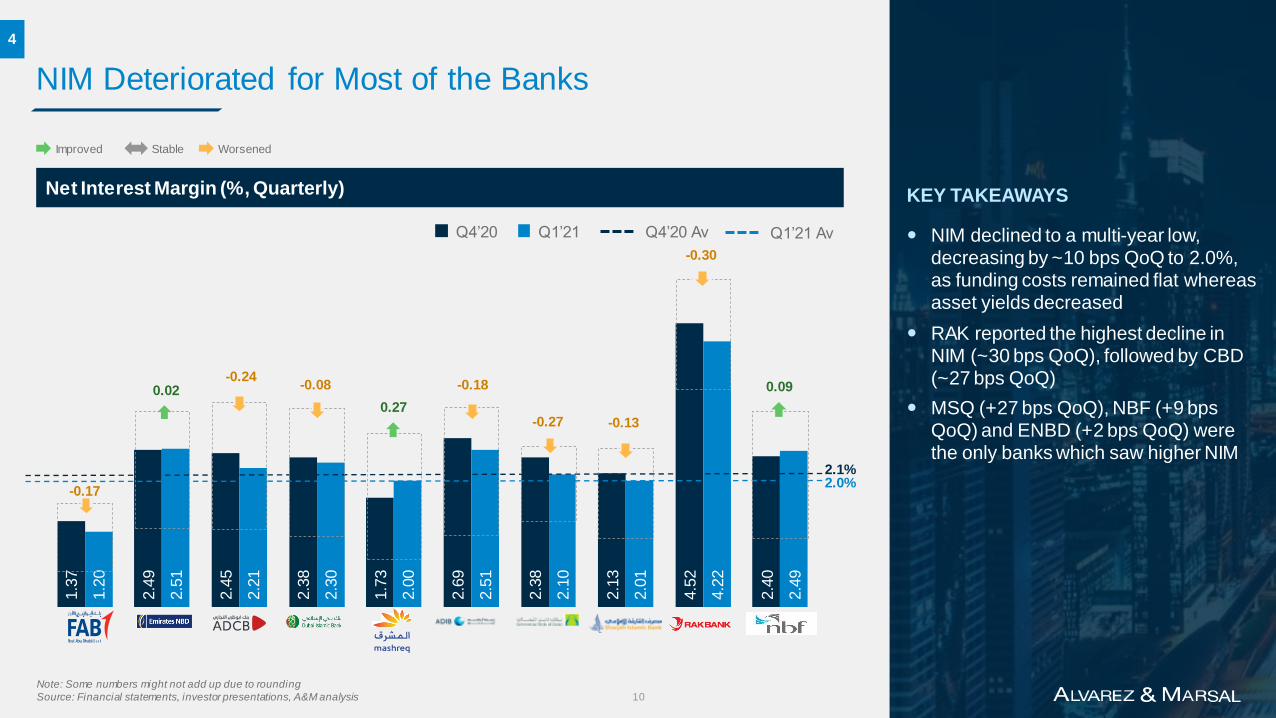
NIM Deteriorated for Most of the Banks
NIM declined to a multi-year low, decreasing by ~10 bps QoQ to 2.0%, as funding costs remained flat whereas asset yields decreased
RAK reported the highest decline in NIM (~30 bps QoQ), followed by CBD (~27 bps QoQ)
MSQ (+27 bps QoQ), NBF (+9 bps QoQ) and ENBD (+2 bps QoQ) were the only banks which saw higher NIM
Note: Some numbers might not add up due to rounding
Source: Financial statements, investor presentations, A&M analysis 10
KEY TAKEAWAYSNet Interest Margin (%, Quarterly)
Improved Stable Worsened
2.1%2.0%
Q4’20 Q4’20 Av Q1’21 AvQ1’21
4
0.02-0.24
-0.18-0.08
-0.30
-0.17
0.27-0.27 -0.13
0.09

7.7
6.9 6.8
7.5
6.8
Q1'20 Q2'20 Q3'20 Q4'20 Q1'21
Cost to Income Ratio Decreased due to Lower Operating Costs
Note: Some numbers might not add up due to rounding
Source: Financial statements, investor presentations, A&M analysis 11
C/I ratio decreased to 33.1% after increasing for two consecutive quarters
Operating expenses declined by ~9% QoQ, after increasing sharply (+10% QoQ) in the preceding quarter
ENBD (-8.7% QoQ) reported a sizeable decline in expenses, as staff costs reduced 6.3% QoQ
MSQ’s (-41.6% QoQ) operating expenses also reduced substantially, as the bank had incurred branch rationalization expense in Q4’20
KEY TAKEAWAYS
Improved Stable Worsened
Quarterly Operating Expenses
(AED Bn)
Cost to Income Ratio
(%, Quarterly Annualized)
Quarterly Operating Income
(AED Bn)
÷
22.6 20.5 19.9 20.4 20.7
Q1'20 Q2'20 Q3'20 Q4'20 Q1'21
33.8%
33.4%
34.3%
36.7%
33.1%
31. 0%
32. 0%
33. 0%
34. 0%
35. 0%
36. 0%
37. 0%
Q1'20 Q2'20 Q3'20 Q4'20 Q1'21
5

25.8
41.5
35.0
23.4
90.1
40.6
24.9
45.1
45.0
42.1
30.1
30.3
36.3
27.5
44.0
44.3
27.3
38.2
41.2
31.1
Efficiency Ratios of MSQ and ENBD Witnessed the Highest Improvement
Five of the top ten banks reported decreased C/I ratio
MSQ’s C/I ratio decreased the most (+46.1% points QoQ)
Similarly, ENBD’s C/I ratio improved by 11.2% points QoQ followed by NBF’s (-11.0% points QoQ)
ENBD’s C/I ratio improved on the back of lower marketing expenses
On the other hand, FAB reported the highest deterioration in C/I ratio (+4.3% points QoQ), as other administration expenses increased ~25% QoQ
Note: Scaling and some numbers might not add up due to rounding
Source: Financial statements, investor presentations, A&M analysis
*Comparison on QoQ basis 12
KEY TAKEAWAYSCost to Income Ratio (%, Quarterly)
Improved Stable Worsened
5
Q4’20 Q4’20 Av Q1’21 AvQ1’21
36.7%33.1%
3.8
-11.2
-6.8
-3.8
-11.0
4.1 2.4
-46.1
4.3
1.3

131 129 131 129125
4.2 4.8
5.5 5.6 5.8
-
1.0
2.0
3.0
4.0
5.0
6.0
7.0
8.0
-
20.0
40.0
60.0
80.0
100. 0
120. 0
140. 0
Q1
'20
Q2
'20
Q3
'20
Q4
'20
Q1
'21
Aggregate Coverage Ratio Decreased; NPL/Net Loan Ratio Increased for the Sixth Consecutive Quarter Aggregate coverage ratio for the banks
decreased to 91.0% from 91.8%
UAE banks need to book AED 18.2bn
worth of more provisions (20% more
than FY’20 provisions) to have 100%
coverage ratio
Coverage ratio of MSQ (-23.5% points
QoQ) and ADCB (-5.2% points QoQ)
declined the most
ADCB need to book AED 5.5bn more
provisions (1.4x FY’20 provisions) to
have a coverage ratio of 100%
ADIB would need AED 3.6bn of
additional provisions (2.8x FY’20) to
reach 100% coverage ratio levels
Aggregate NPL / net loan ratio continued
to rise for the sixth consecutive quarter to
reach 6.3%, as NPLs increased ~1.7%
Note: Scaling and some numbers might not add up due to rounding
Source: Financial statements, investor presentations, A&M analysis, 1 accumulated allowance for impairment / NPL 13
KEY TAKEAWAYS
Coverage Ratio1 and NPL / Net Loans Ratio (%, Quarterly)
Coverage Ratio, % NPL / Net loans, %
6
83 80 82 79 79
3.6 4.1 4.0 4.1
4.2
-
1.0
2.0
3.0
4.0
5.0
6.0
7.0
-
20.0
40.0
60.0
80.0
100. 0
Q1'2
0
Q2
'20
Q3
'20
Q4
'20
Q1
'21
129 125 127 123 131
5.9 6.2 6.4 6.7 6.6
-
1.0
2.0
3.0
4.0
5.0
6.0
7.0
8.0
9.0
-
20.0
40.0
60.0
80.0
100. 0
120. 0
140. 0
Q1
'20
Q2
'20
Q3'2
0
Q4
'20
Q1
'21
7270 67
7367
5.0
5.6 6.0
6.6
7.2
-
1.0
2.0
3.0
4.0
5.0
6.0
7.0
8.0
-
20.0
40.0
60.0
80.0
100. 0
120. 0
Q1
'20
Q2'2
0
Q3
'20
Q4
'20
Q1'2
1
89
74 7370 68
4.5 4.8 5.1
6.1 6.6
-
1.0
2.0
3.0
4.0
5.0
6.0
7.0
8.0
9.0
-
20.0
40.0
60.0
80.0
100. 0
120. 0
Q1'2
0
Q2
'20
Q3
'20
Q4'2
0
Q1
'21
100 98
117126
103
5.5 5.6 5.4
6.4 6.2
-
1.0
2.0
3.0
4.0
5.0
6.0
7.0
8.0
9.0
-
20.0
40.0
60.0
80.0
100. 0
120. 0
140. 0
Q1
'20
Q2
'20
Q3'2
0
Q4
'20
Q1
'21
51 49 4852 53
8.2 8.8
9.4 9.2 9.3
-
2.0
4.0
6.0
8.0
10.0
12.0
14.0
16.0
18.0
-
10.0
20.0
30.0
40.0
50.0
60.0
70.0
Q1
'20
Q2
'20
Q3'2
0
Q4
'20
Q1
'21
8272 76
81 83
6.9
7.3 7.3
7.1
6.9
6.6
6.7
6.8
6.9
7.0
7.1
7.2
7.3
7.4
-
20.0
40.0
60.0
80.0
100. 0
120. 0
Q1
'20
Q2
'20
Q3'2
0
Q4
'20
Q1
'21
92 9086
94 93
4.4 4.5 5.0 4.7 4.9
-
1.0
2.0
3.0
4.0
5.0
6.0
7.0
8.0
9.0
10.0
-
20.0
40.0
60.0
80.0
100. 0
120. 0
Q1
'20
Q2'2
0
Q3
'20
Q4
'20
Q1
'21
7565 66
81 77
7.1 7.9
9.0
10.9 10.9
-
2.0
4.0
6.0
8.0
10.0
12.0
14.0
-
20.0
40.0
60.0
80.0
100. 0
Q1
'20
Q2
'20
Q3'2
0
Q4
'20
Q1
'21
NPL/Net Loans Ratio (Aggregate %)
5.1 5.5 5.7 6.1 6.3
-
1.0
2.0
3.0
4.0
5.0
6.0
7.0
Q1'20 Q2'20 Q3'20 Q4'20 Q1'21

Cost of Risk Declined Significantly as Provisioning Decreased
Note: Scaling and some numbers might not add up due to rounding
Source: Financial statements, investor presentations, A&M analysis 14
Aggregate cost of risk decreased by ~72 bps QoQ, as total provisioning decreased ~36.1% to AED 5.3bn
Overall decrease in provisioning was driven by lower impairments from NBF (-71.7% QoQ), DIB (-60.5% QoQ) and MSQ (-58.5%)
FAB (+48.1% QoQ) and ENBD (+11.9% QoQ) were the only banks which reported an increase in provisions
KEY TAKEAWAYSQuarterly Net Loan Loss Provisions
(AED Bn)
Cost of Risk
(%, Quarterly Annualized)
Average Gross Loans
(AED Bn)
÷
2.06%
1.42%
1.31%
2.01%
1.29%
Q1'20 Q2'20 Q3'20 Q4'20 Q1'21
8.4
5.9 5.5
8.4
5.3
Q1'20 Q2'20 Q3'20 Q4'20 Q1'21
1,642
1,6601,664 1,663
1,653
Q1'20 Q2'20 Q3'20 Q4'20 Q1'21
Improved Stable Worsened
6

Most Banks Reported Lower Cost of Risk, as Impairment Allowances Reduced on Improved Macroeconomic Conditions
Eight of the top ten banks reported a decrease in cost of risk, as improved macroeconomic environment led to lower provisioning
NBF (-776.8 bps QoQ) and MSQ (-519.2 bps QoQ) reported the highest decline in cost of risk
ADCB’s cost of risk fell 36 bps QoQ. The bank has stated that it has booked sufficient provisions related to NMC Health, Finablr and related companies
ENBD’s cost of risk increased 16.4 bps QoQ, as the bank reported increased provisions under its corporate segment
Note: Scaling and some numbers might not add up due to rounding
Source: Financial statements, investor presentations, A&M analysis 15
KEY TAKEAWAYSCost of Risk (bps) – Net of Reversals
6
Improved Stable Worsened
Q4’20 Q4’20 Av Q1’21 AvQ1’21
128.9
201.2
-104.0
15.7
-224.6
-776.8
-73.5
-519.2
-94.9-36.016.4
-25.8
31.4
131.4
149.2
371.2
879.2
165.2
205.7
136.2
465.6
1,0
81.0
47.1
147.8
113.2
146.6
360.0
61.2
110.8
62.8
439.8
304.2
-60
-50
-40
-30
-20
-10
0
10
20
30
0 200 400 600 800 1,000Millions
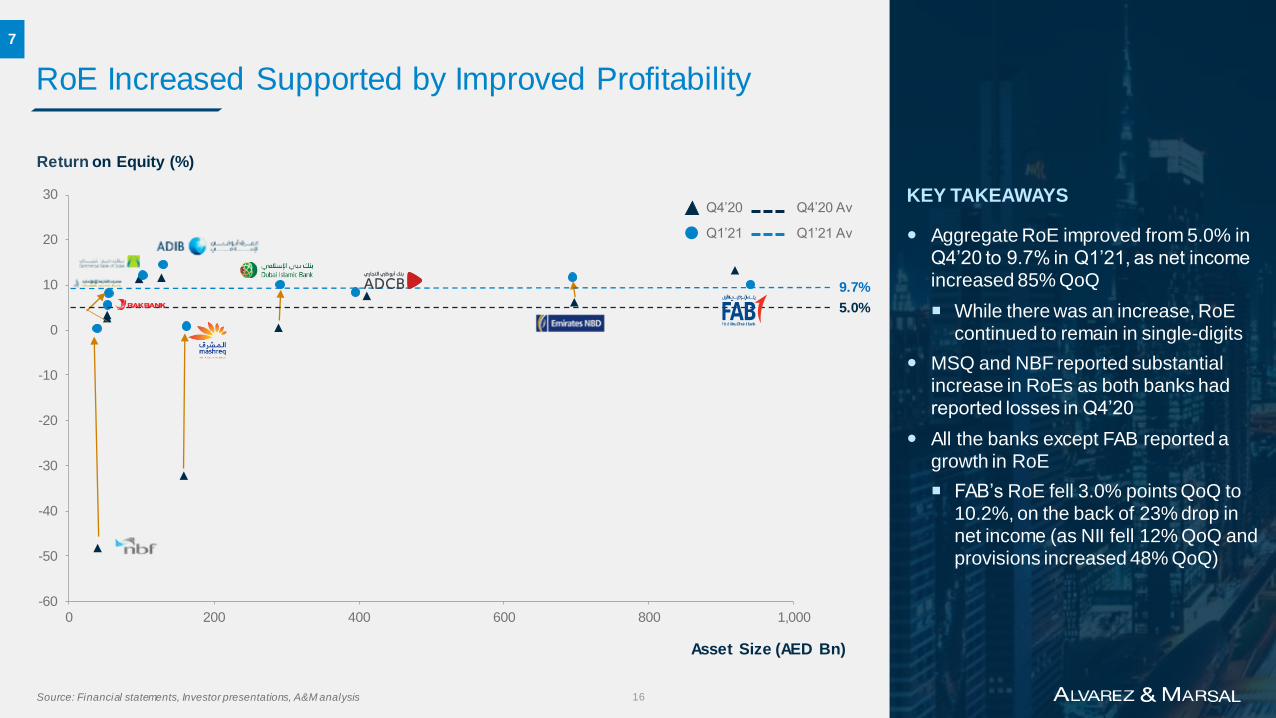
RoE Increased Supported by Improved Profitability
Aggregate RoE improved from 5.0% in Q4’20 to 9.7% in Q1’21, as net income increased 85% QoQ
While there was an increase, RoE continued to remain in single-digits
MSQ and NBF reported substantial increase in RoEs as both banks had reported losses in Q4’20
All the banks except FAB reported a growth in RoE
FAB’s RoE fell 3.0% points QoQ to 10.2%, on the back of 23% drop in net income (as NII fell 12% QoQ and provisions increased 48% QoQ)
Source: Financial statements, Investor presentations, A&M analysis 16
KEY TAKEAWAYS
Return on Equity (%)
7
Asset Size (AED Bn)
5.0%
9.7%
Q4’20 AvQ4’20
Q1’21 AvQ1’21

Recovery of the UAE’s Banking Sector Remains Fragile
Note: All the charts above are based on L3M numbers
Op Income stands for Operating Income
Scaling and some numbers might not add up due to rounding
Source: Financial statements, Investor presentations, A&M analysis 17
While there was a sizeable improvement in the sector’s profitability, the recovery remains fairly fragile
The extension of the TESS program until June’22 has delayed a likely deterioration of the sector’s asset quality
Income streams are expected to remain under pressure, as interest rates are likely to remain at historic low levels in the foreseeable future
The sector could witness the next wave of M&A once the full impact of the pandemic headwinds are visible
KEY TAKEAWAYS
Net Interest Margin (%) Cost of Funds (%)
Non-Interest Income /
Op. Income (%)
Yield On Credit (%)
LDR (%)
Return on Equity (%)
7.6 9.4 8.8
5.0
9.7
Q1
'20
Q2
'20
Q3
'20
Q4
'20
Q1
'21
Return on Assets (%)
0.9 1.1 1.0
0.6
1.1
-
0.2
0.4
0.6
0.8
1.0
1.2
Q1
'20
Q2
'20
Q3
'20
Q4'2
0
Q1
'21
Assets / Equity (x)
8.3 8.2 8.2
7.8
8.1
Q1
'20
Q2
'20
Q3
'20
Q4'2
0
Q1
'21
29.8 28.4 30.9 30.6 34.9
Q1
'20
Q2
'20
Q3
'20
Q4
'20
Q1
'21
2.5 2.3 2.0 2.1 2.0
Q1'2
0
Q2
'20
Q3
'20
Q4
'20
Q1'2
1
6.7 5.8 5.3 5.3 5.1
Q1
'20
Q2'2
0
Q3
'20
Q4
'20
Q1
'21
1.9 1.5 1.3 1.2 1.2
Q1
'20
Q2'2
0
Q3
'20
Q4
'20
Q1
'21
87.7 87.7
84.1
86.2
84.5
Q1
'20
Q2
'20
Q3
'20
Q4
'20
Q1
'21
Improved Stable Worsened
Cost / Income Ratio (%)
Cost of Risk (%)
Op. Income / Assets (%)
33.8 33.4 34.3
36.7
33.1
Q1
'20
Q2
'20
Q3
'20
Q4'2
0
Q1
'21
2.1
1.4 1.3
2.0
1.3
Q1'2
0
Q2
'20
Q3
'20
Q4'2
0
Q1
'21
3.4 3.0 2.8 2.8 2.9
Q1
'20
Q2
'20
Q3
'20
Q4
'20
Q1
'21
7

GCC Banking Consolidation
GCC list of M&A transactions in banking sector since January 2019
Announcement Date Target Company Target Country Acquirer Company % SoughtConsideration
(AED Mn)Deal Status*
20-Jan-21 Bank Audi SAE (Egypt) Egypt First Abu Dhabi Bank PJSC 100% NA Completed
16-Sep-20 Ahli United Bank Egypt SAE Egypt Ahli United Bank BSC 14.4% 298 Pending
30-Jun-20 Al Khalij Commercial Bank PQSC Qatar Masraf Al Rayan QSC 100% 4,404 Pending
25-Jun-20 Samba Financial Group SJSC Saudi Arabia National Commercial Bank SJSC 100% 57,252 Completed
31-Dec-19 Alizz Islamic Bank SAOG Oman Oman Arab Bank SAOC 81% NA Completed
12-Sep-19 Ahli United Bank BSC Bahrain Kuwait Finance House KSCP 100% 21,431 Pending
15-Aug-19 Cqur Bank LLC Qatar VTB Bank PJSC 19% NA Completed
08-Aug-19 DenizBank AS Turkey Emirates NBD PJSC 0.20% NA Completed
20-Jun-19 Warba Bank KSCP Kuwait Kuwait & Middle East Financial Investment Co KSCP 75.70% NA Proposed
12-May-19 Gulf Bank KSCP Kuwait Alghanim Industries Ltd 16% NA Completed
21-Apr-19 HSBC Saudi Arabia Ltd Saudi Arabia HSBC Holdings PLC 2% 31 Completed
10-Apr-19 Invest bank PSC UAE Emirate of Sharjah United Arab Emirates 50% 989 Completed
07-Apr-19 Noor Bank PJSC UAE Dubai Islamic Bank PJSC 100% NA Completed
03-Apr-19 Oman United Exchange Co Oman Private Investor 25% NA Completed
15-Mar-19 Banque Saudi Fransi Saudi Arabia Olayan Investments, Ripplewood Advisors LLC 5% 1,609 Completed
29-Jan-19 Union National Bank PJSC UAE Abu Dhabi Commercial Bank PJSC 100% 11,531 Completed
29-Jan-19 Al-Hilal Bank PJSC UAE Abu Dhabi Commercial Bank PJSC 100% NA Completed
Source: Bloomberg*Proposed Status: Board suggests shareholders to consider the acquisition*Pending Status: Acquisition has announced
*Completed Status: Acquisition has completed 18

GLOSSARY
Glossary
19

Glossary
Metric Abbreviation Definition
SizeLoans and Advances Growth QoQ growth in EOP net loans and advances for the top 10
Deposits Growth QoQ growth in EOP customer deposits for the top 10
Liquidity Loan-to-Deposit Ratio LDR (Net EOP loans and advances / EOP customer deposits) for the top 10
Income &
Operating Efficiency
Operating Income Growth QoQ growth in aggregate quarterly operating income generated by the top 10
Operating Income / Assets (Annualized quarterly operating income / quarterly average assets) for the top 10
Non-Interest Income / Operating Income
(Quarterly non-interest income / quarterly operating income) for the top 10
Net Interest Margin NIM(Aggregate annualized quarterly net interest income) / (quarterly average earning assets) for the top 10Earnings assets are defined as total assets excluding goodwill, intangible assets, and property and equipment
Yield on Credit YoC (Annualized quarterly gross interest income / quarterly average loans & advances) for the top 10
Cost of Funds CoF(Annualized quarterly interest expense + annualized quarterly capital notes & tier I sukuk interest) / (quarterly average interest bearing liabilities + quarterly average capital notes & tier I sukuk interest) for the top 10
Cost-to-Income Ratio C/I (Quarterly operating expenses / quarterly operating income) for the top 10
RiskCoverage Ratio (Loan loss reserves / non-performing loans) for the top 10
Cost of Risk CoR (Annualized quarterly provision expenses net of recoveries / quarterly average gross loans) for the top 10
Profitability
Return on Equity RoE(Annualized quarterly net profit attributable to the equity holders of the banks – annualized quarterly capital notes & tier I sukuk interest) / (quarterly average equity excluding capital notes) for the top 10
Return on Assets RoA (Annualized quarterly net profit / quarterly average assets) for the top 10
Return on Risk-Weighted Assets RoRWA (Annualized quarterly net profit generated / quarterly average risk-weighted assets) for the top 10
Capital Capital Adequacy Ratio CAR (EOP tier I capital + tier II capital) / (EOP risk-weighted assets) for the top 10
Note: LTM and EOP stand for last twelve months and end of period respectively 20

Glossary (cont’d.)
Note: Banks are sorted by assets size
• As on 31st March 2021 21
Bank Assets (AED Bn)* Abbreviation Logo
First Abu Dhabi Bank 940.7 FAB
Emirates NBD 695.1 ENBD
Abu Dhabi Commercial Bank 395.8 ADCB
Dubai Islamic Bank 291.7 DIB
Mashreq Bank 162.3 MSQ
Abu Dhabi Islamic Bank 130.7 ADIB
Commercial Bank of Dubai 102.5 CBD
Sharjah Islamic Bank 54.9 SIB
National Bank of Ras Al-Khaimah 53.2 RAK
National Bank of Fujairah 39.1 NBF


![TAB9 - alvarezandmarsal.com · 2008 ONCA 587, 2008 CarswellOnt 4811, [2008] O.J. No. 3164, 168 A.C.W.S. (3d) 698 ...](https://static.fdocuments.net/doc/165x107/5e044d665296e039b80b831f/tab9-2008-onca-587-2008-carswellont-4811-2008-oj-no-3164-168-acws.jpg)