UAE Banking PulseQ3’19 edition of the UAE Banking Pulse (“The Pulse”). In this quarterly...
20
UAE Banking Pulse Quarter 3, 2019
Transcript of UAE Banking PulseQ3’19 edition of the UAE Banking Pulse (“The Pulse”). In this quarterly...

UAE Banking PulseQuarter 3, 2019

FOREWORD Alvarez & Marsal Middle East Limited (A&M) is delighted to publish the
Q3’19 edition of the UAE Banking Pulse (“The Pulse”). In this quarterly
series, we share results from our research examining the top ten largest
listed UAE banks by assets, and highlight key performance indicators of
the UAE banking industry. The Pulse aims to help banking executives
and board members stay current on industry trends.
All the data used in this report has been obtained from publicly available
sources and the methodology for the calculations is discussed in the
glossary. Calculation of several metrics has been changed from the
previous version to accommodate available information.
We hope that you will find the Pulse useful and informative.
Disclaimer:
The information contained in this document is of a general nature and has been obtained from publicly available information
plus market insights. The information is not intended to address the specific circumstances of an individual or institution. There
is no guarantee that the information is accurate at the date received by the recipient or that it will be accurate in the future. All
parties should seek appropriate professional advice to analyze their particular situation before acting on any of the information
contained herein2

Authors
3
18+ years of international experience in
management consulting and industry
Focuses on strategic and performance-related
matters in financial institutions, sovereign wealth
funds, family businesses, real estate, private equity
and private investments
Emirati National, frequent speaker and moderator in
Banking & Finance events
Board member of the Bahrain Fintech Bay
Dr. Saeeda Jaffar
Lead Author, Managing Director
Asad Ahmed
Co-Author, Managing Director
30+ years of experience in banking
Focuses on performance improvement,
turn-around, credit management, and formulating
and managing strategic and operational changes in
financial institutions
Expertise in Financial Inclusion and creation of
digital wholesale and retail banks
Former CEO of banks in the UAE & Kenya
Served on the governing council of the Kenyan
Bankers’ Association
Neil Hayward
Co-Author, Managing Director
18+ years experience in turnaround and
restructuring in the Middle East, Europe as well as
the U.S.
Focuses on financial services and is an expert in
restructuring both conventional finance and Islamic
finance facilities
Advises financially distressed companies including
playing a major role as a board member
Phone: +97145671065
CONTACT
DETAILS
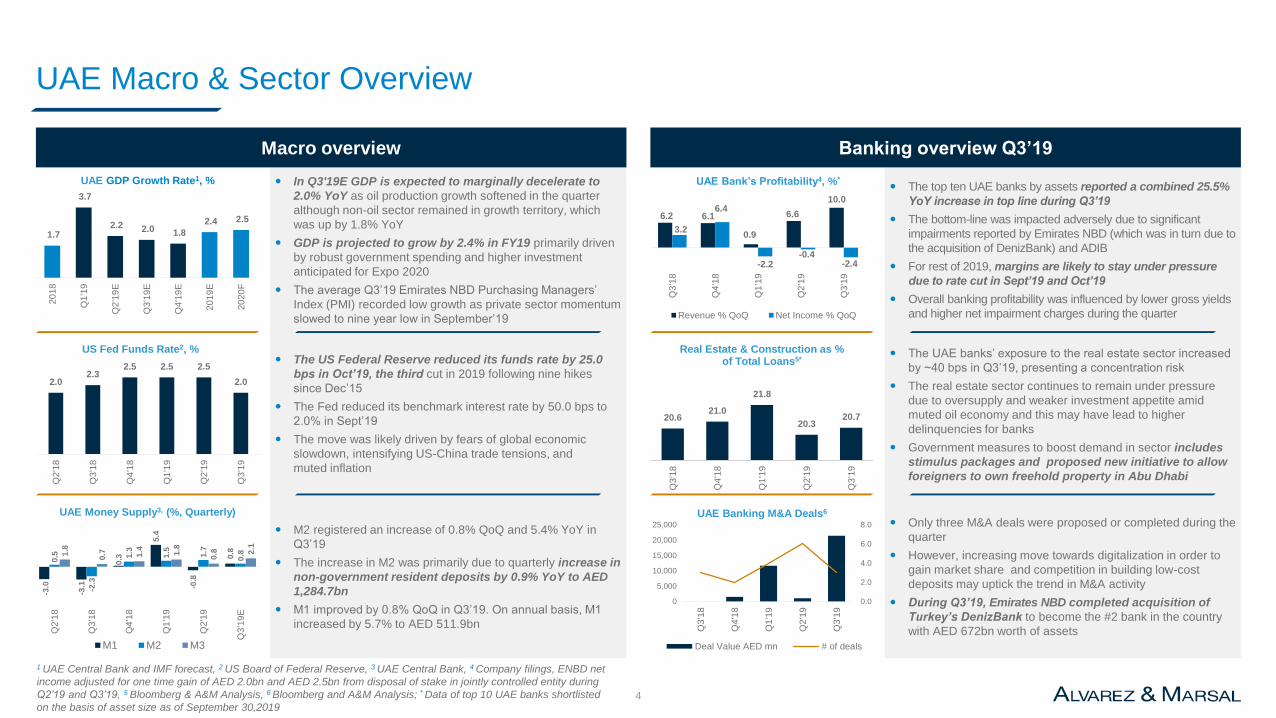
UAE Macro & Sector Overview
1 UAE Central Bank and IMF forecast, 2 US Board of Federal Reserve, 3 UAE Central Bank, 4 Company filings, ENBD net
income adjusted for one time gain of AED 2.0bn and AED 2.5bn from disposal of stake in jointly controlled entity during
Q2’19 and Q3’19, 5 Bloomberg & A&M Analysis, 6 Bloomberg and A&M Analysis; * Data of top 10 UAE banks shortlisted
on the basis of asset size as of September 30,20194
Macro overview Banking overview Q3’19
The US Federal Reserve reduced its funds rate by 25.0
bps in Oct’19, the third cut in 2019 following nine hikes
since Dec’15
The Fed reduced its benchmark interest rate by 50.0 bps to
2.0% in Sept’19
The move was likely driven by fears of global economic
slowdown, intensifying US-China trade tensions, and
muted inflation
The UAE banks’ exposure to the real estate sector increased
by ~40 bps in Q3’19, presenting a concentration risk
The real estate sector continues to remain under pressure
due to oversupply and weaker investment appetite amid
muted oil economy and this may have lead to higher
delinquencies for banks
Government measures to boost demand in sector includes
stimulus packages and proposed new initiative to allow
foreigners to own freehold property in Abu Dhabi
20.621.0
21.8
20.320.7
Q3
'18
Q4
'18
Q1
'19
Q2
'19
Q3
'19
Real Estate & Construction as % of Total Loans5*
2.02.3
2.5 2.5 2.5
2.0
Q2
'18
Q3
'18
Q4
'18
Q1
'19
Q2
'19
Q3
'19
US Fed Funds Rate2, %
The top ten UAE banks by assets reported a combined 25.5%
YoY increase in top line during Q3’19
The bottom-line was impacted adversely due to significant
impairments reported by Emirates NBD (which was in turn due to
the acquisition of DenizBank) and ADIB
For rest of 2019, margins are likely to stay under pressure
due to rate cut in Sept’19 and Oct’19
Overall banking profitability was influenced by lower gross yields
and higher net impairment charges during the quarter
In Q3'19E GDP is expected to marginally decelerate to
2.0% YoY as oil production growth softened in the quarter
although non-oil sector remained in growth territory, which
was up by 1.8% YoY
GDP is projected to grow by 2.4% in FY19 primarily driven
by robust government spending and higher investment
anticipated for Expo 2020
The average Q3’19 Emirates NBD Purchasing Managers’
Index (PMI) recorded low growth as private sector momentum
slowed to nine year low in September’19
6.2 6.1
0.9
6.6
10.0
3.2
6.4
-2.2-0.4
-2.4
Q3
'18
Q4
'18
Q1
'19
Q2
'19
Q3
'19
UAE Bank’s Profitability4, %*
Revenue % QoQ Net Income % QoQ
1.7
3.7
2.2 2.0 1.8
2.4 2.5
20
18
Q1
'19
Q2
'19
E
Q3
'19
E
Q4
'19
E
20
19
E
20
20
F
UAE GDP Growth Rate1, %
M2 registered an increase of 0.8% QoQ and 5.4% YoY in
Q3’19
The increase in M2 was primarily due to quarterly increase in
non-government resident deposits by 0.9% YoY to AED
1,284.7bn
M1 improved by 0.8% QoQ in Q3’19. On annual basis, M1
increased by 5.7% to AED 511.9bn
Only three M&A deals were proposed or completed during the
quarter
However, increasing move towards digitalization in order to
gain market share and competition in building low-cost
deposits may uptick the trend in M&A activity
During Q3’19, Emirates NBD completed acquisition of
Turkey’s DenizBank to become the #2 bank in the country
with AED 672bn worth of assets
-3.0
-3.1
0.3
5.4
-0.8
0.8
0.5
-2.3
1.3
1.5 1.7
0.81
.8
0.7 1.4 1.8
0.8 2
.1
Q2
'18
Q3
'18
Q4
'18
Q1
'19
Q2
'19
Q3
'19
E
M1 M2 M3
UAE Money Supply3, (%, Quarterly)
0.0
2.0
4.0
6.0
8.0
0
5,000
10,000
15,000
20,000
25,000
Q3
'18
Q4
'18
Q1
'19
Q2
'19
Q3
'19
UAE Banking M&A Deals6
Deal Value AED mn # of deals

Pulse: Decrease in RoE and RoA as Pressure on Profitability Margins builds due to Interest Rate Cuts
Note 1: QoQ stand for quarter over quarter
Note 2: Growth in loans & advances and deposits were presented QoQ instead of YoY
Note 3: Quarterly income was used in the calculation of operating income growth
Source: Financial statements, Investor presentations, A&M analysis
Metric Q2’19 Q3’19 Q3’18 Q4’18 Q1’19 Q2’19 Q3’19
SizeLoans and Advances (L&A) Growth (QoQ) 7.5% 7.8%
Deposits Growth (QoQ) 8.5% 7.5%
Liquidity Loan-to-Deposit Ratio (LDR) 87.6% 87.9%
Income &
Operating
Efficiency
Operating Income Growth (QoQ) 4.4% 6.5%
Operating Income / Assets 3.6% 3.5%
Non-Interest Income(NII) / Operating Income 31.4% 30.3%
Yield on Credit (YoC) 7.2% 7.4%
Cost of Funds (CoF) 2.2% 2.3%
Net Interest Margin (NIM) 2.4% 2.5%
Cost-to-Income Ratio (C/I) 32.8% 33.6%
RiskCoverage Ratio 113.2% 111.1%
Cost of Risk (CoR) 0.9% 1.0%
Profitability
Return on Equity (RoE) 14.7% 13.5%
Return on Assets (RoA) 1.9% 1.7%
Return on Risk-Weighted Assets (RoRWA) 2.6% 2.4%
Capital Capital Adequacy Ratio (CAR) 17.6% 17.2%
Key Trends of Q3’19
1
2
3
4
5
6
7
8
The growth in L&A during Q3’19 was primarily driven
due to consolidation of DenizBank with Emirates NBD
RoA declined by 16.5 bps due to lower profit margins.
The CAR declined due to increase in risk weighted
assets
The RoE during Q3’19 declined by 1.2% as the net
income margins were impacted due to two rounds of
interest rate cuts
The increase in CoR was driven by increase in allowance for impairments for Emirates NBD by 2.3x due to consolidation impact
The C/I ratio worsened marginally by 72.1 bps due to
lower operating income of coverage universe which
was partially offset by Emirates NBD’s consolidation
with DenizBank
NIM improved marginally during the quarter
The increase in operating income was mainly
driven by Emirates NBD (+25.5%) as a result of the
consolidation with DenizBank
Excluding Emirates NBD impact, QoQ growth in
L&A and Deposits are 1.6% and 1.5%, respectively
Improved Stable Worsened
5

Overall Deposits Growth Declines Due to Increase in Competition
Note: MS stands for market share
Source: Financial statements, Investor presentations, A&M analysis
** Excluded Emirates NBD due to higher ratios driven by consolidation of Denizbank 6
Excluding Emirates NBD merger
impact, banks QoQ growth in terms of
L&A is 1.5% and deposits is 1.6%
Mashreq Bank reported the highest
deposits growth of 8.4%, while its L&A
growth was 2.0% during the quarter
RAK, SIB and ADCB deposit growth
declined by 6.2%, 4.8%, and 3.8%,
respectively. However, L&A growth
increased for FAB, RAK and CBD by
3.2%, 2.9%, and 2.8%, respectively
KEY TAKEAWAYS**
L&A Growth QoQ (%)
Deposits Growth QoQ (%)
Lost Depositing &
Financing MS
Gained Financing MS
Gained Deposits MS
Gained Deposits &
Financing MS
Q3’19 Av
1.5%
1.6%
1
-1.0
-0.5
0.0
0.5
1.0
1.5
2.0
2.5
3.0
3.5
-8.0 -6.0 -4.0 -2.0 0.0 2.0 4.0 6.0 8.0 10.0

LDR Stabilizes as Lower Policy Rates Unlikely to LiftLoan Demand
70
75
80
85
90
95
100
105
110
115
0 100 200 300 400 500 600 700 800
Millions
Loans to Deposits Ratio (LDR)
(excluding Emirates NBD) marginally
increased to 86.4% in Q3’19 from
86.3% in Q2’19
The LDR for RAK and SIB increased
sharply to reach a range of 90%–100%,
as these banks witnessed increase in
L&A compared to decline in deposits
Note: The green zone is an area of healthy liquidity
Source: Financial statements, A&M analysis
** Excluded Emirates NBD due to ratio driven by consolidation of DenizBank 7
KEY TAKEAWAYS**
1
Loans to Deposits Ratio (%)
Total Asset (AED Bn)
Q2’19 AvQ2’19
Q3’19 AvQ3’19
86.4%
86.3%
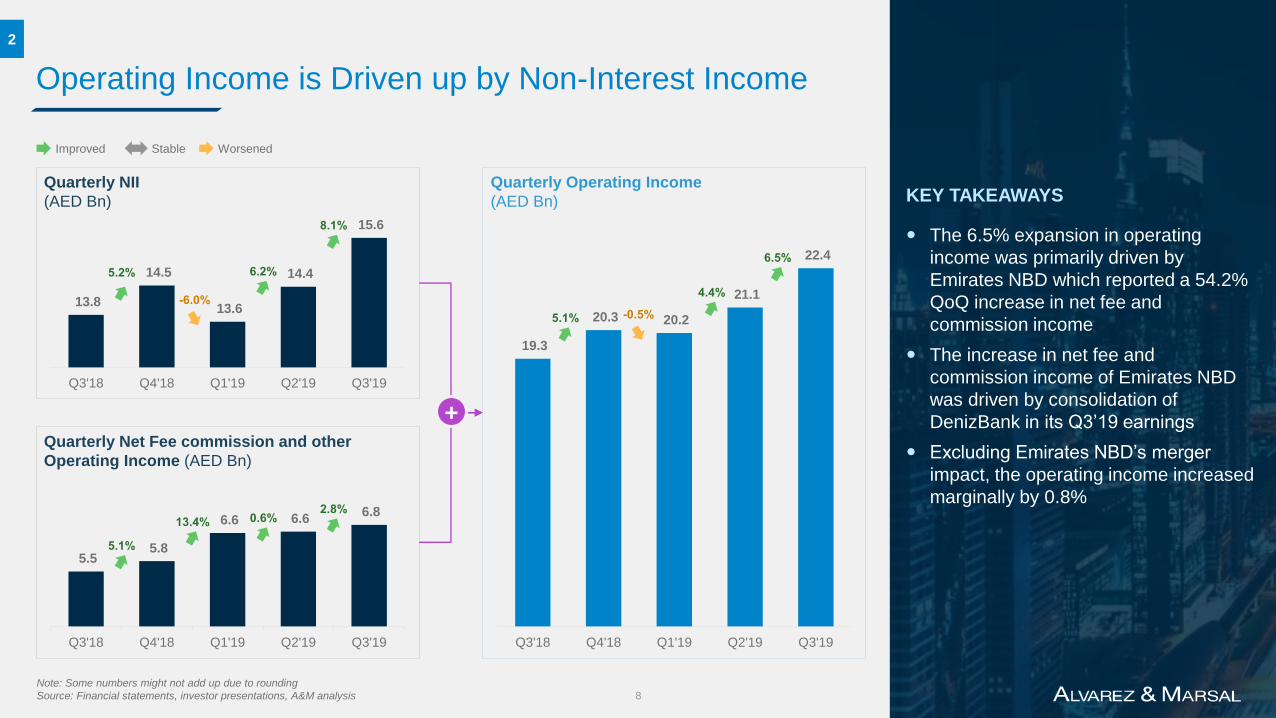
Operating Income is Driven up by Non-Interest Income
Note: Some numbers might not add up due to rounding
Source: Financial statements, investor presentations, A&M analysis 8
The 6.5% expansion in operating
income was primarily driven by
Emirates NBD which reported a 54.2%
QoQ increase in net fee and
commission income
The increase in net fee and
commission income of Emirates NBD
was driven by consolidation of
DenizBank in its Q3’19 earnings
Excluding Emirates NBD’s merger
impact, the operating income increased
marginally by 0.8%
KEY TAKEAWAYS
19.3
20.3 20.2
21.1
22.4
Q3'18 Q4'18 Q1'19 Q2'19 Q3'19
5.5 5.8
6.6 6.6 6.8
Q3'18 Q4'18 Q1'19 Q2'19 Q3'19
13.8
14.5
13.6
14.4
15.6
Q3'18 Q4'18 Q1'19 Q2'19 Q3'19
Quarterly NII
(AED Bn)
Quarterly Operating Income
(AED Bn)
Quarterly Net Fee commission and other
Operating Income (AED Bn)
+
Improved Stable Worsened
2

Marginal Improvement Trend in NIM Continues in Q3’19
Note: Relation between elements above represents a functionality and not necessarily an exact mathematical formula
Source: Financial statements, Investor presentations, A&M analysis 9
NIM improved marginally by 2.3 bps
during Q3’19 to 2.51% compared to
2.49% in Q2’19
The marginal improvement in NIM was
supported by stable L&A and increase
in Yield on Credit
The increasing competition for deposits
continue to push up the cost of funds
KEY TAKEAWAYSYield On Credit
(Quarterly Annualized)
Net Interest Margin
(Quarterly Annualized)
Cost of Funds
(Quarterly Annualized)
–
2.59%2.65%
2.45% 2.49% 2.51%
Q3'18 Q4'18 Q1'19 Q2'19 Q3'19
1.8% 1.9% 2.1% 2.2% 2.3%
Q3'18 Q4'18 Q1'19 Q2'19 Q3'19
6.8%7.1% 7.1%
7.2% 7.4%
Q3'18 Q4'18 Q1'19 Q2'19 Q3'19
87.3%86.5%
88.4%87.6% 87.9%
Q3'18 Q4'18 Q1'19 Q2'19 Q3'19
Loan-to-Deposit Ratio (LDR) x
3

1.8
2.6
2.6
2.7
2.7
3.1
2.6
5.1
3.0
3.1
1.7
2.9
2.5
2.8
2.6
3.0
2.5
5.1
3.6
3.1
Mixed Trend Seen in NIM for the Coverage Universe
Three banks observed an improvement
and two banks witnessed stability in
NIM during the quarter
SIB, ENBD, and DIB showcased
improvement in NIM by 0.6%, 0.2%,
and 0.1%, respectively during Q3’19
The improvement in NIM of Emirates
NBD was due to the positive impact of
DenizBank consolidation
RAK and EIB had stable ratio
compared with Q2’19
Note: Some numbers might not add up due to rounding
Source: Financial statements, investor presentations, A&M analysis 10
KEY TAKEAWAYSNet Interest Margin (%, Quarterly)
Improved Stable Worsened
2.49%
2.51%
0.2 0.1-0.1-0.1
0.6
-0.1
Q2’19 Q2’19 Av Q3’19 AvQ3’19
3
-0.1
0.0-0.1
0.0

6.4 6.7 6.4 6.9
7.5
Q3'18 Q4'18 Q1'19 Q2'19 Q3'19
C/I Ratio Deteriorated for all the Coverage Banks
Note: Some numbers might not add up due to rounding
Source: Financial statements, investor presentations, A&M analysis 11
The higher C/I ratio of the coverage
universe was driven by higher
operating expenses
SG&A cost for Emirates NBD reported
as 31.5% which marginally impacted
the overall universe’s total cost which
inturn pushed up the C/I ratio
Excluding Emirates NBD, C/I ratio was
34.4% in Q3’19 as compared to 33.7%
in Q2’19
KEY TAKEAWAYS
Improved Stable Worsened
Quarterly Operating Expenses
(AED Bn)
Cost to Income Ratio
(%, Quarterly Annualized)
Quarterly Operating Income
(AED Bn)
÷
19.3 20.3 20.2 21.1 22.4
Q3'18 Q4'18 Q1'19 Q2'19 Q3'19
33.4% 32.9%31.8%
32.8%33.6%
Q3'18 Q4'18 Q1'19 Q2'19 Q3'19
4

26.5
29.8
40.2
25.1
44.2
45.6
30.1
39.9
29.9
40.8
27.7
31.2
39.1
26.2
46.6
44.9
30.6
39.3
31.6
38.1
-1.1
1.2
1.4
-0.7
1.1
2.4
1.7
-2.7
0.5
Rise in Staff Cost moved up the SG&A Expenses for Most Banks
C/I ratio was higher* for six banks out
of the total coverage universe
Mashreq, SIB, and Emirates NBD
witnessed the highest escalation in
C/I ratio by 2.4%, 1.7%, and 1.4%,
respectively
The increase in Emirates NBD’s
C/I ratio was primarily driven by
higher SG&A costs of 31.5% due to
merger impact
The C/I ratio improved for EIB, ADCB,
ADIB, and RAK by 2.7%, 1.1%, 0.7%,
and 0.6%, respectively
Note: Scaling and some numbers might not add up due to rounding
Source: Financial statements, investor presentations, A&M analysis
*Comparison on QoQ basis 12
KEY TAKEAWAYSCost to Income Ratio (%, Quarterly)
Improved Stable Worsened
33.6%
32.8%
4
Q2’19 Q2’19 Av Q3’19 AvQ3’19
-0.6

Cost of Risk Increased due to Increase in Net Loan Loss Provisions
Note: Scaling and some numbers might not add up due to rounding
Source: Financial statements, investor presentations, A&M analysis 13
The CoR was reported at 1.0% as the
banks witnessed surge in their net loan
loss provisions by 32.0% during Q3’19
Increasing pressure in real-estate and
construction sector amid softening oil
economy likely to increase the CoR
KEY TAKEAWAYSQuarterly Net Loan Loss Provisions
(AED Bn)
Cost of Risk
(%, Quarterly Annualized)
Average Gross Loans
(AED Bn)
÷0.6%
0.7%
0.8%
0.9%
1.0%
Q3'18 Q4'18 Q1'19 Q2'19 Q3'19
2.1 2.3 2.6
3.0
4.0
Q3'18 Q4'18 Q1'19 Q2'19 Q3'19
1,351 1,356 1,379
1,481
1,600
Q3'18 Q4'18 Q1'19 Q2'19 Q3'19
Improved Stable Worsened
5
49.6
71.8
99.9
97.9
118.9
77.8
110.7
356.9
22.5
127.4
48.6
146.5
88.9
84.5
118.2
101.1
98.5
363.5
52.7
164.7
74.6 -0.7
30.2
37.2
-12.2
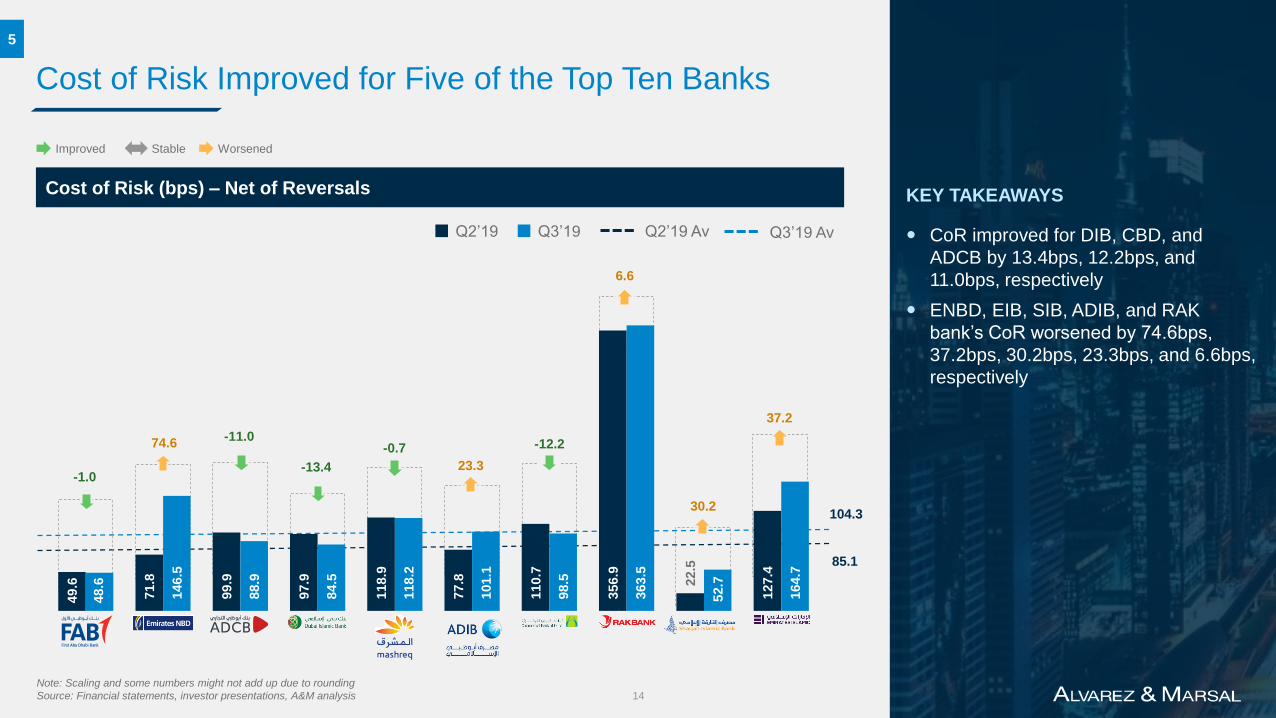
Cost of Risk Improved for Five of the Top Ten Banks
CoR improved for DIB, CBD, and
ADCB by 13.4bps, 12.2bps, and
11.0bps, respectively
ENBD, EIB, SIB, ADIB, and RAK
bank’s CoR worsened by 74.6bps,
37.2bps, 30.2bps, 23.3bps, and 6.6bps,
respectively
Note: Scaling and some numbers might not add up due to rounding
Source: Financial statements, investor presentations, A&M analysis 14
KEY TAKEAWAYSCost of Risk (bps) – Net of Reversals
104.3
85.1
5
Improved Stable Worsened
Q2’19 Q2’19 Av Q3’19 AvQ3’19
-1.0
-11.0
-13.4 23.3
6.6

RoE Declined for all the Coverage Banks
The average RoE for the coverage
universe reported was 13.5% during
Q3’19 compared to 14.7% in Q2’19
RoE was impacted during Q3’19 as
pressure on profitability margin
continues due to interest rate cuts in
Jul’19 and Sep’19
Excluding Emirates NBD, RoE of the
coverage universe dropped to 13.0% in
Q3’19 compared to 14.0% during Q2’19
0
7
13
20
26
- 100 200 300 400 500 600 700 800 900
Millions
Source: Financial statements, Investor presentations, A&M analysis 15
KEY TAKEAWAYS
Return on Equity (%)
Q2’19 Q2’19 Av
Q3’19 AvQ3’19
6
Asset Size (AED Bn)
14.7%
13.5%

UAE Banks’ Profitability Declined; Anticipating the Pressure to Continue
Note: All the charts above are based on L3M numbers
Op Income stands for Operating Income
Scaling and some numbers might not add up due to rounding
Source: Financial statements, Investor presentations, A&M analysis 16
RoE deteriorated to 13.5%, driven by
rise in CoR and higher impairment
allowance during Q3’19
Fed funds rate cut during
September’19 and in Qctober’19 are
likely to put pressure on banks’ margin
in the next quarter
KEY TAKEAWAYS
Net Interest Margin (%) Cost of Funds (%)
Non-Interest Income /
Op. Income (%)
Yield On Credit (%)
LDR (%)
Return on Equity (%)
15.8 15.2 15.5 14.7 13.5
Q3
'18
Q4
'18
Q1
'19
Q2
'19
Q3
'19
Return on Assets (%)
1.9 2.0 1.9 1.9 1.7
Q3
'18
Q4
'18
Q1
'19
Q2
'19
Q3
'19
Assets / Equity (x)
7.6 7.5
7.7 7.6
7.7
Q3
'18
Q4
'18
Q1
'19
Q2
'19
Q3
'19
28.6 28.6
32.6 31.4
30.3
Q3
'18
Q4
'18
Q1
'19
Q2
'19
Q3
'19
2.6 2.6 2.5 2.5 2.5
Q3
'18
Q4
'18
Q1
'19
Q2
'19
Q3
'19
6.8
7.1 7.1 7.2
7.4
Q3
'18
Q4
'18
Q1
'19
Q2
'19
Q3
'19
1.8 1.9 2.1 2.2 2.3
Q3
'18
Q4
'18
Q1
'19
Q2
'19
Q3
'19
87.3
86.5
88.4
87.6 87.9
Q3
'18
Q4
'18
Q1
'19
Q2
'19
Q3
'19
Improved Stable Worsened
Cost / Income Ratio (%)
Cost of Risk (%)
Op. Income / Assets (%)
33.4 32.9
31.8
32.8
33.6 Q
3'1
8
Q4
'18
Q1
'19
Q2
'19
Q3
'19
0.6 0.7 0.8 0.9 1.0
Q3
'18
Q4
'18
Q1
'19
Q2
'19
Q3
'19
3.6 3.6 3.6 3.6 3.5
Q3
'18
Q4
'18
Q1
'19
Q2
'19
Q3
'19
7

GCC Banking Consolidation
GCC list of M&A transactions in banking sector YTD – September’19
Announcement
DateTarget Company
Target
CountryAcquirer Company % Sought
Consideration
(AED Mn)Deal Status*
29-Jan-19 Union National Bank PJSC UAE Abu Dhabi Commercial Bank PJSC 100% 11,531 Completed
29-Jan-19 Al-Hilal Bank PJSC UAE Abu Dhabi Commercial Bank PJSC 100% NA Completed
15-Mar-19 Banque Saudi Fransi Saudi ArabiaOlayan Investments, Ripplewood
Advisors LLC5% 1,609 Completed
03-Apr-19Oman United Exchange Co
LLCOman Private Investor 25% NA Completed
10-Apr-19 Invest bank PSC UAE Emirate of Sharjah United Arab Emirates 50% 989 Completed
21-Apr-19 HSBC Saudi Arabia Ltd Saudi Arabia HSBC Holdings PLC 2% 31 Pending
07-Apr-19 Noor Bank PJSC UAE Dubai Islamic Bank PJSC 100% NA Proposed
12-May-19 Gulf Bank KSCP Kuwait Alghanim Industries Ltd 16% NA Completed
20-Jun-19 Warba Bank KSCP KuwaitKuwait & Middle East Financial
Investment Co KSCP- NA Proposed
08-Aug-19 DenizBank AS Turkey Emirates NBD PJSC 0.2% NA Pending
15-Aug-19 Cqur Bank LLC Qatar VTB Bank PJSC 19% NA Completed
12-Sept-19 Ahli United Bank BSC Bahrain Kuwait Finance House KSCP 100% 21,431 Pending
Source: Bloomberg*Proposed Status: Board suggests shareholders to consider the acquisition*Pending Status: Acquisition has announced *Completed Status: Acquisition has completed
17

GLOSSARY
18
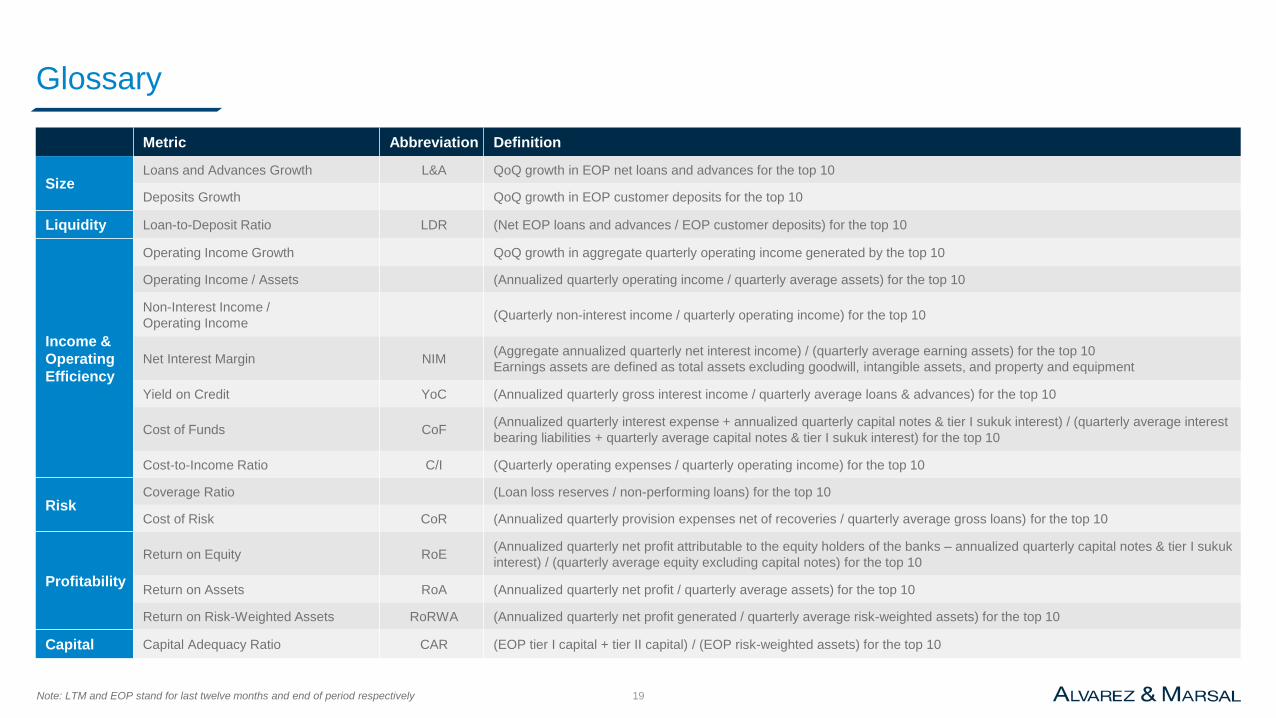
Glossary
Metric Abbreviation Definition
SizeLoans and Advances Growth L&A QoQ growth in EOP net loans and advances for the top 10
Deposits Growth QoQ growth in EOP customer deposits for the top 10
Liquidity Loan-to-Deposit Ratio LDR (Net EOP loans and advances / EOP customer deposits) for the top 10
Income &
Operating
Efficiency
Operating Income Growth QoQ growth in aggregate quarterly operating income generated by the top 10
Operating Income / Assets (Annualized quarterly operating income / quarterly average assets) for the top 10
Non-Interest Income /
Operating Income(Quarterly non-interest income / quarterly operating income) for the top 10
Net Interest Margin NIM(Aggregate annualized quarterly net interest income) / (quarterly average earning assets) for the top 10
Earnings assets are defined as total assets excluding goodwill, intangible assets, and property and equipment
Yield on Credit YoC (Annualized quarterly gross interest income / quarterly average loans & advances) for the top 10
Cost of Funds CoF(Annualized quarterly interest expense + annualized quarterly capital notes & tier I sukuk interest) / (quarterly average interest
bearing liabilities + quarterly average capital notes & tier I sukuk interest) for the top 10
Cost-to-Income Ratio C/I (Quarterly operating expenses / quarterly operating income) for the top 10
RiskCoverage Ratio (Loan loss reserves / non-performing loans) for the top 10
Cost of Risk CoR (Annualized quarterly provision expenses net of recoveries / quarterly average gross loans) for the top 10
Profitability
Return on Equity RoE(Annualized quarterly net profit attributable to the equity holders of the banks – annualized quarterly capital notes & tier I sukuk
interest) / (quarterly average equity excluding capital notes) for the top 10
Return on Assets RoA (Annualized quarterly net profit / quarterly average assets) for the top 10
Return on Risk-Weighted Assets RoRWA (Annualized quarterly net profit generated / quarterly average risk-weighted assets) for the top 10
Capital Capital Adequacy Ratio CAR (EOP tier I capital + tier II capital) / (EOP risk-weighted assets) for the top 10
Note: LTM and EOP stand for last twelve months and end of period respectively 19

Glossary (cont’d.)
Note: Banks are sorted by assets size
* As on 30th September 2019 20
Bank Assets (AED Bn)* Abbreviation Logo
First Abu Dhabi Bank 788.1 FAB
Emirates NBD 675.6 ENBD
Abu Dhabi Commercial Bank 406.9 ADCB
Dubai Islamic Bank 230.0 DIB
Mashreq Bank 146.9 Mashreq
Abu Dhabi Islamic Bank 124.3 ADIB
Commercial Bank of Dubai 82.5 CBD
Emirates Islamic Bank 62.7 EIB
National Bank of Ras Al-Khaimah 56.3 RAK
Sharjah Islamic Bank 45.6 SIB