TYPES OF RESEARCH. Descriptive research Using data to describe situations and trends.
22
TYPES OF RESEARCH
-
Upload
beryl-hensley -
Category
Documents
-
view
214 -
download
0
Transcript of TYPES OF RESEARCH. Descriptive research Using data to describe situations and trends.

TYPES OF RESEARCH

Descriptive researchUsing data to describe situations and trends

Explanatory researchUsing data to explain why things change
Ceasefire less youth violence?
During 1996-1999 police, probation, Federal agents and social agencies in Boston applied a variety of strategies to reduce youth gun violence. These included meeting with at-risk youth, monitoring their behavior and invoking stiff Federal sanctions against armed criminals.
Mean monthly gun deaths dropped 30 percent, from 3.5 pre-Ceasefire to 1.3 during Ceasefire. But gun deaths were also dropping elsewhere. Once that was taken into account the additional benefit of Ceasefire was estimated at 14 percent.
More imprisonment less violence?
Some researchers believe that falling crime rates were caused by harsher sentencing. One criminologist estimated that increased incarceration accounted for 20 percent of the “Great Crime Drop” of the 90’s.
During 1993-2005 the average time served in State prison (all offenses) rose 38 percent, from 21 months to 29 months. In 1991 the violent crime rate was 758.2 per 100,000. By 2000 it was 506.5, one-third lower.
Ceasefire OFF Ceasefire ON

RESEARCH PROCESS:MEASURING VARIABLES

What gets measured? “Variables”
• To describe or explain, we must measure
• What gets measured? Variables.• Variable: any characteristic or
aspect of a person, thing or event that can be “measured”, that is, given a score or assigned a value– Age, height, gender– Ceasefire: N and Y
– Youth gun deaths: mean numberN (3.5) and Y (1.3)
3.5
1.3Hypothesis
Ceasefire Youth gun deaths
Y High
N Low
Ceasefire OFF
Ceasefire ON

Categorical variables
• Nominal– Mutually exclusive groups
or categories• Gender: M/F• Color• Period studied in
Boston: Ceasefire (off/on - N/Y)
• Ordinal– Above, plus an implied
ranking• Low/medium/high• Poor/fair/ good
N
YCeasefire OFF
Ceasefire ON

Continuous variables
• Can be placed on a scale– Length, height, weight, temperature– Differences between adjacent points
are equal (distance between 2 and 3 same as between 6 and 7)
– Example: Mean (arithmetic average) number of Boston youth shot dead each month
• Continuous variables are sometimes “transformed” into ordinal categorical variables– 1-10 low– 11-20 medium– 21-30 high
• Ordinal categorical variables are sometimes “transformed” into continuous variables– Low 1– Medium 2– High 3
3.5
1.3
Ceasefire OFFCeasefire
ON
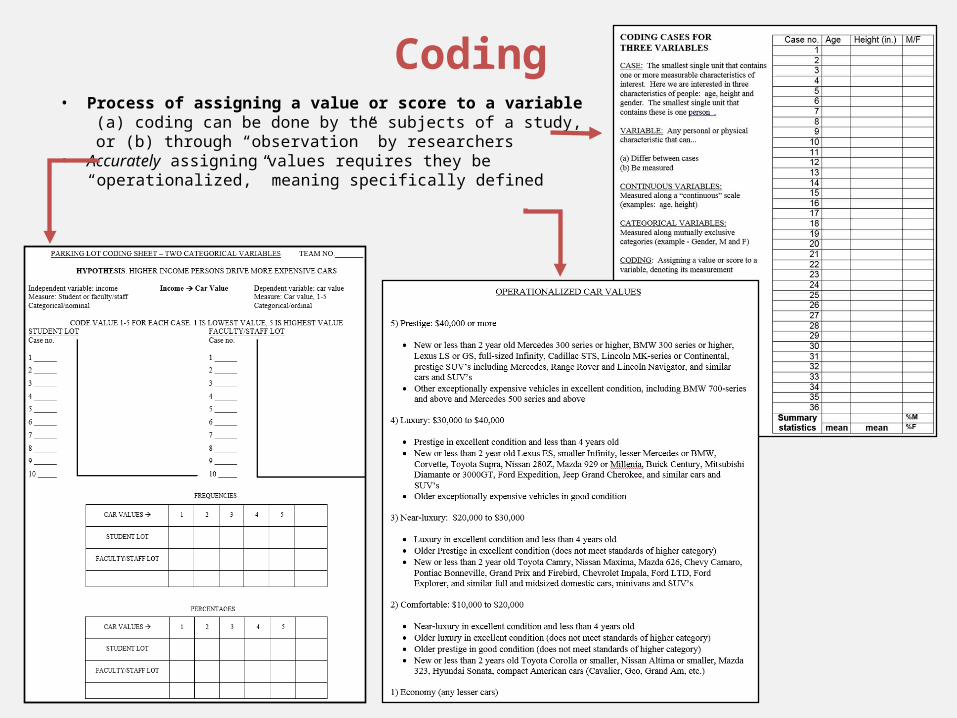
Coding• Process of assigning a value or score to a variable
(a) coding can be done by the subjects of a study, or (b) through “observation” by researchers
• Accurately assigning values requires they be “operationalized,” meaning specifically defined

Two important terms:“unit of analysis” and “case”
• Unit of analysis– “Persons, places, things or events”
under study– Contains all the variables– Boston: youth homicides
• Contains the independent (causal) variable Ceasefire (yes/no) and the dependent (effect) variable youth homicides (mean number)
– Sometimes defining the unit of analysis is tricky (we’ll have an example later)
• Case– A single occurrence of a unit of
analysis– Boston: Each youth homicide
Ceasefire OFF
Ceasefire ON

RESEARCH PROCESS: ASSOCIATION, CAUSATION, HYPOTHESES
Association and causation
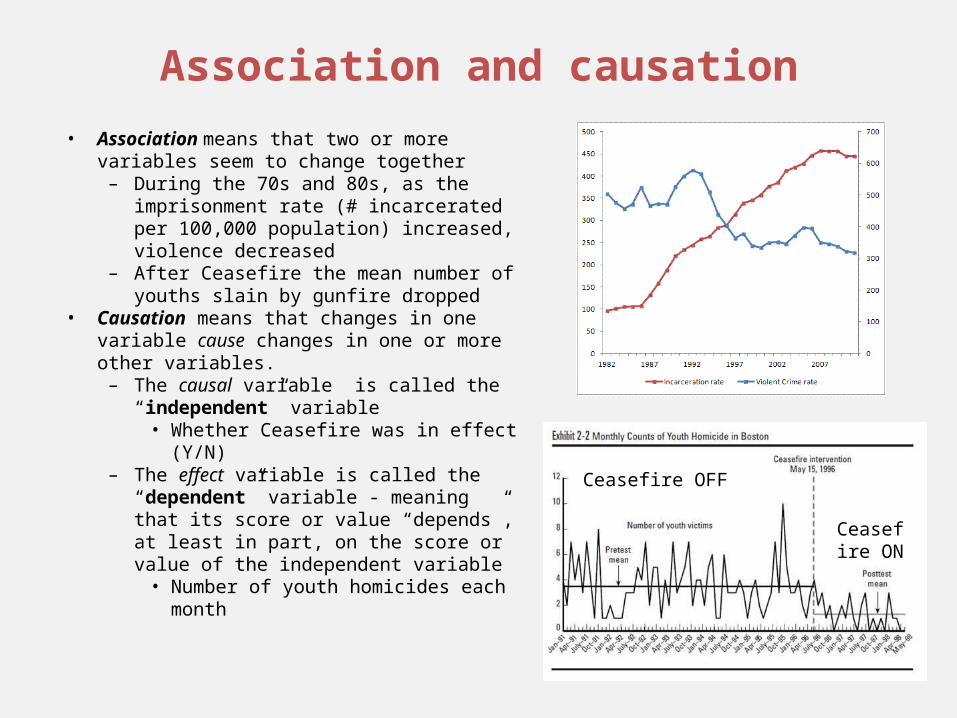
• Association means that two or more variables seem to change together – During the 70s and 80s, as the
imprisonment rate (# incarcerated per 100,000 population) increased, violence decreased
– After Ceasefire the mean number of youths slain by gunfire dropped
• Causation means that changes in one variable cause changes in one or more other variables. – The causal variable is called the
“independent” variable• Whether Ceasefire was in effect
(Y/N)– The effect variable is called the
“dependent” variable - meaning that its score or value “depends”, at least in part, on the score or value of the independent variable• Number of youth homicides each
month
Ceasefire OFF
Ceasefire ON

Research process:from a research question to a hypothesis
• Hypothesis: Ceasefire reduced the number of youth gun deaths– Independent variable on the left, dependent variable on the right– Ceasefire Fewer youth gun deaths
• Direction of effect of independent variable on dependent variable– “Two tailed” hypotheses predict an effect but do not specify its direction
• Ceasefire affected how many youths were murdered (silent as to increase or decrease)– “One-tailed” hypotheses specify the direction of the effect
• Ceasefire led to fewer gun deaths (or, led to more gun deaths)• Positive or negative relationship between variables?
– Positive: Scores of the independent and dependent variables rise and fall together– Negative: Scores of the independent and dependent variables move in opposite directions – Whether the predicted relationship is “positive” or “negative”
depends on how the variables are scaled or categorized– Here the relationship is negative – when Ceasefire is on, or “yes,”
gun deaths are low; when off, or “no,” they’re high– NOTE: Negative does NOT mean “no” relationship - it is just as
much a relationship as a “positive” relationship
1. Researchers begin with a (hopefully, narrow) “research question” relating to their area of interest 2. From prior studies, discovered though a literature review, they identify relevant issues and variables3. They then formulate an implicit or explicit hypothesis - a prediction that certain changes in the independent
variable cause corresponding changes in the dependent variable (i.e., “cause and effect”).4. Data is collected so the hypothesis can be tested.
WARNING: spinning a hypothesis without sufficient basis can yield bogus (spurious) relationships)

Cause Effect
measured with a speedometer
Independent variable Dependent variable
measured with a pressure gauge or by changes in angle of pedal
Get in the car and drive!Hypothesis 1: As pressure on accelerator increases, speed increases (positive relationship)
Hypothesis 2: As pressure on brake increases, speed decreases (negative relationship)

ISSUES IN MEASUREMENT

Validity and reliability• Is a measurement VALID?
– Are we measuring what we say we are measuring?
– Do the results reflect something real?• Measuring how much one weighs is
far simpler and more straightforward than measuring their “attitude”
– Some things can’t be directly measured• Use “surrogate” measures (e.g.,
income for poverty)• Is the measurement process RELIABLE?
– Is it reproducible? Regardless of who measures, does it yield the same values?
– Is it accurate?– Are we throwing away information?
• Collapsing continuous variables into categories
– Do surrogate measures adequately represent the variable of interest?• Does parking lot type
(faculty/student) accuratelyreflect income?

“Intervening” variablesPoverty Crime
• Poverty is strongly associated with crime– So is it simply Poverty Crime?– Or is there something else at work?
• Poor people tend to get poor educations– Maybe education is a more powerful predictor of crime than income– If that is true, education may be an “intervening” variable
• Poverty (as measured by income) is still a factor, but its influence is mediated by education– Education is a more proximate (closer) “cause” of crime
• Bottom line -- we must study all variables (a) that could affect the dependent variable and (b) are related to our independent variable of interest– But sometimes what seems to be a cause turns out not to be a factor at
all…
Income Education Crime

Spurious Relationship
Age Height?
Given that by 18 one has usually stopped growing, how could changes in age in this sample really affect changes in height?
24 CSUF students: 12 males, 12 females, age range 18-25
r statistic - Correlation

Spurious Relationship
Age Height?
The apparent relationship between age and height is spurious. There only seemed to be a relationship because in this sample, males, who tend to be taller, for no particular reason also happened to be older.
It’s still Gender Height
M
M
M
M
M
M
M
M
M
M
M
M
M
M
24 CSUF students: 12 males, 12 females, age range 18-25
r statistic - Correlation

• Former chief Bratton was repeatedly credited with reducingcrime in L.A.– Presence of Bratton (yes/no) is the independent,
causal variable; level of crime the dependent (effect) variable – Hypothesis: Bratton less crime (negative relationship)
• But could the apparent relationship between the presence orabsence of Bratton, and the level of crime, be spurious?– Spurious means that an apparent relationship can be explained away by other factors
• While Bratton was chief, crime was falling around the U.S. for various reasons– These underlying causes (each would be an independent variable, left side of the arrow)
may be why crime fell in L.A. In other words, it may not have been Bratton!
A spurious relationship?
Bratton Crime
Bratton: NO YES

CLASSROOM EXERCISES

• Researchers ride along with cops to observe their interactions with youths
• Examine the table. What do you think is the research question?
• Formulate a (one-tailed) hypothesis that predicts the direction of change in what you feel is the most likely direction
• Is this descriptive or explanatory research?
• What is the unit of analysis?• What is the independent variable?
What kind is it?• What is the dependent variable? What
kind is it?• Are there concerns about reliability and
validity?
Research example:Police Encounters With Juveniles

Hypothesis buildingMake up a hypothesis with one independent (causal) and one dependent (effect) variable. Remember that it must predict that changes in the independent variable cause corresponding changes in the dependent variable. Both variables must in some way be accurately measurable.
1. State your hypothesis. Do so in the conventional manner, with the independent (causal) variable on the left, and the dependent (effect) variable on the right:
2. Identify the independent variable
3. How would you measure it?
4. Identify the dependent variable
5. How would you measure it?
6. Is the predicted relationship between variables positive or negative? (Remember – this depends on how the variables are scaled)