Two-photon excited fluorescence enhancement … excited fluorescence enhancement with broadband...
9
Two-photon excited fluorescence enhancement with broadband versus tunable femtosecond laser pulse excitation Chao Wang Alvin T. Yeh Downloaded From: https://www.spiedigitallibrary.org/journals/Journal-of-Biomedical-Optics on 7/3/2018 Terms of Use: https://www.spiedigitallibrary.org/terms-of-use
Transcript of Two-photon excited fluorescence enhancement … excited fluorescence enhancement with broadband...

Two-photon excited fluorescenceenhancement with broadband versustunable femtosecond laser pulseexcitation
Chao WangAlvin T. Yeh
Downloaded From: https://www.spiedigitallibrary.org/journals/Journal-of-Biomedical-Optics on 7/3/2018Terms of Use: https://www.spiedigitallibrary.org/terms-of-use

Two-photon excited fluorescence enhancement withbroadband versus tunable femtosecond laserpulse excitation
Chao Wang and Alvin T. YehTexas A&M University, Department of Biomedical Engineering, 3120 TAMU, College Station, Texas 77843-3120
Abstract. The inverse relationship between two-photon excited fluorescence (TPEF) and laser pulse durationsuggests that two-photon microscopy (TPM) performance may be improved by decreasing pulse duration. How-ever, for ultrashort pulses of sub-10 femtosecond (fs) in duration, its spectrum contains the effective gain bandwidthof Ti:Sapphire and its central wavelength is no longer tunable. An experimental study was performed to explorethis apparent tradeoff between untuned sub-10 fs transform-limited pulse (TLP) and tunable 140 fs pulse for TPEF.Enhancement factors of 1.6, 6.7, and 5.2 are measured for Indo-1, FITC, and TRITC excited by sub-10 fs TLPcompared with 140 fs pulse tuned to the two-photon excitation (TPE) maxima at 730 nm, 800 nm, and 840 nm,respectively. Both degenerate (v1 ¼ v2) and nondegenerate (v1 ≠ v2) mixing of sub-10 fs TLP spectral componentsresult in its broad second-harmonic (SH) power spectrum and high spectral density, which can effectivelycompensate for the lack of central wavelength tuning and lead to large overlap with dye TPE spectra for TPEFenhancements. These pulse properties were also exploited for demonstrating its potential applications in multicolorimaging with TPM. © 2012 Society of Photo-Optical Instrumentation Engineers (SPIE). [DOI: 10.1117/1.JBO.17.2.025003]
Keywords: two-photon excited fluorescence; femtosecond laser pulse; nonlinear optical microscopy.
Paper 11466 received Aug. 29, 2011; revised manuscript received Nov. 7, 2011; accepted for publication Dec. 7, 2011; published onlineMar. 2, 2012.
1 IntroductionTwo-photon microscopy (TPM), based on ultrafast laser pulsescanning technique, generates nonlinear optical signals frombiosamples for rendering high resolution images. TPM isnoninvasive and capable of imaging live cells within their extra-cellular microenvironment deep inside thick tissues. Nonlinearlight-matter interactions between near-infrared femtosecond (fs)laser pulse and tissue constituents enable intrinsic opticalsectioning,1–3 high signal-to-background ratio2 and large depthimaging.4 The dependence of two-photon signal generation,e.g., two-photon excited fluorescence (TPEF) and secondharmonic generation (SHG), on fs-pulse properties, such aspulse shape5,6 and temporal duration7–11 suggests that TPM per-formance may be improved by utilizing shorter pulse durations.However, as the fs-pulse decreases in duration, its spectrumnecessarily broadens such that for a sub-10 fs pulse its spectralbandwidth can extend more than 100 nm (if centered at∼800 nm) and its central wavelength is no longer tunable. Givenendogenous and exogenous fluorophores with two-photon exci-tation (TPE) maxima throughout the Ti:Sapphire laser-tuningrange, a question arises whether the inability to tune the centralwavelength of broadband fs-pulses compromises its utility forTPM compared with tunable narrowband fs-pulses.
Assuming frequency invariant response of dye-molecules toTPE, TPEF yield varies inversely with fs-pulse duration,7 givenidentical pulse shapes. A number of studies have characterizedthis relationship experimentally albeit with subtle but importantdifferences in how the fs-pulse duration was varied. In two of
those studies, the fs-pulse duration was varied by introducingdispersion, leading to broadened duration while maintainingthe pulse spectrum.7,8 Results nearly consistent with the inverseproportionality relationship between TPEF yield and fs-pulseduration were reported, but interpretation of these resultsremains controversial. It can be shown that, for these studies,TPEF yield was actually related to the dispersion effect onfs-pulse rather than the effects of pulse duration on two-photonprocesses.10 In other words, the results did not reflect photophy-sics of two-photon absorption (and subsequent fluorescence) butthat of pulse peak-power degradation by group velocitydispersion.
This inverse proportionality relationship between TPEF andpulse duration has also been studied using transform-limitedfs-pulses. By using transform-limited pulses, both duration andspectrum change, and thus, for instances of frequency dependentmolecular two-photon absorption, TPEF yield was shown todepend on the overlap integral with fs-pulse SH power spec-trum.10 Using a tunable narrowband fs-pulse laser, shorterpulse durations could be obtained by compression of spectrallybroadened pulses through optical fibers. With grating compres-sor and highly nonlinear photonic crystal fibers, TPEF wasenhanced when using compressed compared to narrowbandfs-pulse,9,11 and imaging depth with TPM was also extended byusing the compressed fs-pulse.9 For pulses as short as sub-10 fs,its spectrum encompasses the effective gain bandwidth of Ti:Sapphire,12 thus making its central wavelength untunable. Thisstudy was designed to investigate whether gains in TPE utilizingultrashort pulses were mitigated by its fixed central wavelengthcompared with tunable narrowband pulses.
Address all correspondence to: Chao Wang, Texas A&M University, Departmentof Biomedical Engineering, 3120 TAMU, College Station, Texas 77843-3120. Tel:979-845-8811; Fax: 979-845-4450; E-mail: [email protected]. 0091-3286/2012/$25.00 © 2012 SPIE
Journal of Biomedical Optics 17(2), 025003 (February 2012)
Journal of Biomedical Optics 025003-1 February 2012 • Vol. 17(2)
Downloaded From: https://www.spiedigitallibrary.org/journals/Journal-of-Biomedical-Optics on 7/3/2018Terms of Use: https://www.spiedigitallibrary.org/terms-of-use
In this research, TPEF yields are measured with three organicdye phantoms excited by nearly transform-limited sub-10 fs(sub-10 fs TLP for simplicity hereafter) and tunable 140 fspulses. To conduct this proof-of-principle study without loss ofgenerality, Indo-1, FITC, and TRITC were selected for their dis-tinct TPEF characteristics, i.e., TPE spectral peak positions,respectively, located to high-frequency (Indo-1), on spectralpeak (FITC), and to low-frequency wing (TRITC) of thesub-10 fs TLP spectrum. By direct comparison and calculation,the physics behind the differentiated TPEF enhancementsamong the three dye-phantoms is discussed, which evokesfurther studies on multicolor TPEF enhancements with a mix-ture of the dye-phantoms, mutual quenching via one-photonabsorption (OPA), and associated solvent effect.
This paper is organized as follows: a description of metho-dology detailed in Sec. 2 includes experimental setup, systema-tic calibrations, and dye-phantom preparation. Section 3 isdevoted to experimental protocol, results presentation, analysison measured and calculated TPEF enhancements, a semi-quan-titative discussion on the differentiated TPEF enhancements,and phantom studies as well as simulations on multicolorTPEF enhancement under environmental influences. Finally,Sec. 4 concludes this paper.
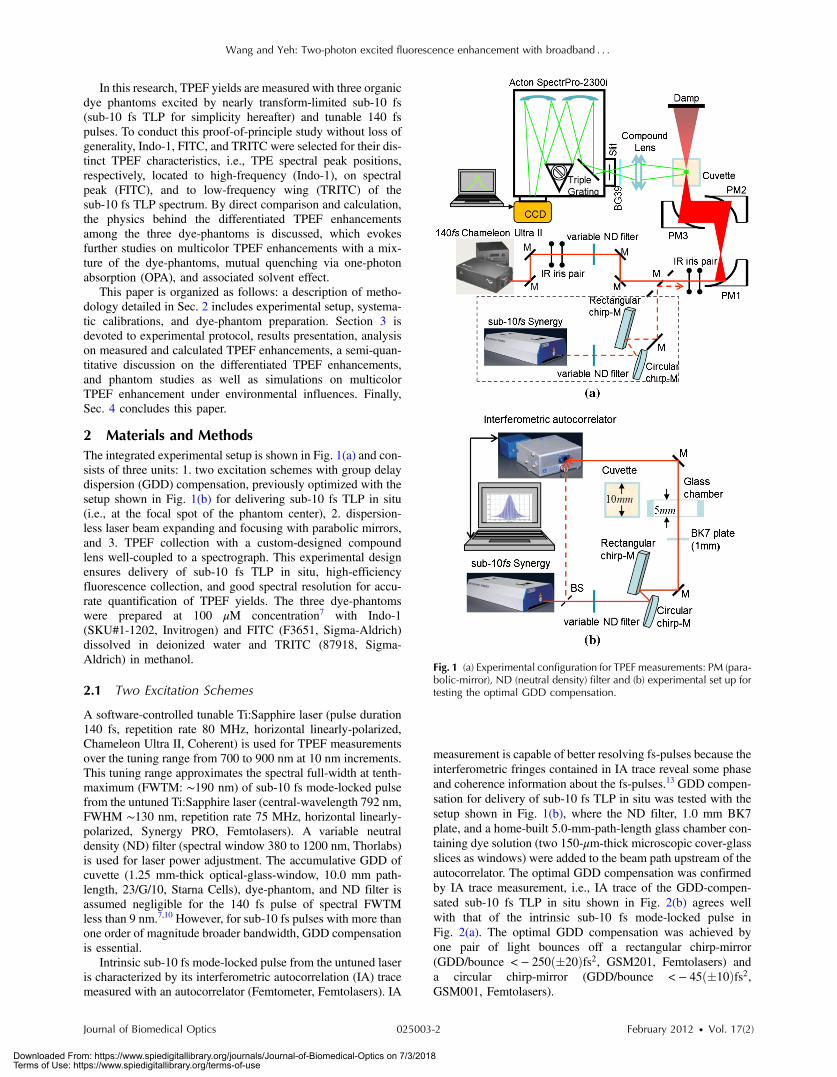
2 Materials and MethodsThe integrated experimental setup is shown in Fig. 1(a) and con-sists of three units: 1. two excitation schemes with group delaydispersion (GDD) compensation, previously optimized with thesetup shown in Fig. 1(b) for delivering sub-10 fs TLP in situ(i.e., at the focal spot of the phantom center), 2. dispersion-less laser beam expanding and focusing with parabolic mirrors,and 3. TPEF collection with a custom-designed compoundlens well-coupled to a spectrograph. This experimental designensures delivery of sub-10 fs TLP in situ, high-efficiencyfluorescence collection, and good spectral resolution for accu-rate quantification of TPEF yields. The three dye-phantomswere prepared at 100 μM concentration7 with Indo-1(SKU#1-1202, Invitrogen) and FITC (F3651, Sigma-Aldrich)dissolved in deionized water and TRITC (87918, Sigma-Aldrich) in methanol.
2.1 Two Excitation Schemes
A software-controlled tunable Ti:Sapphire laser (pulse duration140 fs, repetition rate 80 MHz, horizontal linearly-polarized,Chameleon Ultra II, Coherent) is used for TPEF measurementsover the tuning range from 700 to 900 nm at 10 nm increments.This tuning range approximates the spectral full-width at tenth-maximum (FWTM: ∼190 nm) of sub-10 fs mode-locked pulsefrom the untuned Ti:Sapphire laser (central-wavelength 792 nm,FWHM ∼130 nm, repetition rate 75 MHz, horizontal linearly-polarized, Synergy PRO, Femtolasers). A variable neutraldensity (ND) filter (spectral window 380 to 1200 nm, Thorlabs)is used for laser power adjustment. The accumulative GDD ofcuvette (1.25 mm-thick optical-glass-window, 10.0 mm path-length, 23/G/10, Starna Cells), dye-phantom, and ND filter isassumed negligible for the 140 fs pulse of spectral FWTMless than 9 nm.7,10 However, for sub-10 fs pulses with more thanone order of magnitude broader bandwidth, GDD compensationis essential.
Intrinsic sub-10 fs mode-locked pulse from the untuned laseris characterized by its interferometric autocorrelation (IA) tracemeasured with an autocorrelator (Femtometer, Femtolasers). IA
measurement is capable of better resolving fs-pulses because theinterferometric fringes contained in IA trace reveal some phaseand coherence information about the fs-pulses.13 GDD compen-sation for delivery of sub-10 fs TLP in situ was tested with thesetup shown in Fig. 1(b), where the ND filter, 1.0 mm BK7plate, and a home-built 5.0-mm-path-length glass chamber con-taining dye solution (two 150-μm-thick microscopic cover-glassslices as windows) were added to the beam path upstream of theautocorrelator. The optimal GDD compensation was confirmedby IA trace measurement, i.e., IA trace of the GDD-compen-sated sub-10 fs TLP in situ shown in Fig. 2(b) agrees wellwith that of the intrinsic sub-10 fs mode-locked pulse inFig. 2(a). The optimal GDD compensation was achieved byone pair of light bounces off a rectangular chirp-mirror(GDD/bounce < − 250ð�20Þfs2, GSM201, Femtolasers) anda circular chirp-mirror (GDD/bounce < − 45ð�10Þfs2,GSM001, Femtolasers).
Fig. 1 (a) Experimental configuration for TPEF measurements: PM (para-bolic-mirror), ND (neutral density) filter and (b) experimental set up fortesting the optimal GDD compensation.
Wang and Yeh: Two-photon excited fluorescence enhancement with broadband : : :
Journal of Biomedical Optics 025003-2 February 2012 • Vol. 17(2)
Downloaded From: https://www.spiedigitallibrary.org/journals/Journal-of-Biomedical-Optics on 7/3/2018Terms of Use: https://www.spiedigitallibrary.org/terms-of-use

2.2 Dispersionless Laser Beam Expandingand Focusing
Dispersionless beam expanding and focusing [recall Fig. 1(a)] isaccomplished with three gold-coated 90 deg off-axis parabolicmirrors, i.e., PM1 (effective focal length/EFL, 20.32 mm,50328AU, Newport), PM2 (EFL 50.8 mm, NT47-098, EdmundOptics), and PM3 (EFL 25.4 mm, NT47-096, Edmund Optics),each of which has a 2-D tilt-adjustment and 3-D linear-translation for accurate alignment. This PM-combination islocated at a distance from both laser exit apertures such that thebeam size of the tunable 140 fs and untuned sub-10 fs laserbeam is ∼4 mm. The effective numerical aperture (NA) forbeam focusing is ∼0.2, corresponding to an estimated14,15
axial intensity point spread function (IPSF) of ∼400 μm by 1∕ewidth. This estimated IPSF size in situ is much smaller thancuvette path-length and assumed to be a “point-like source” offluorescence. Thus, the solid-angle of fluorescence con-beamcollection is fixed, which makes TPEF measurements insensi-tive to slight variations in laser beam size.7
2.3 TPEF Collection with a Custom-DesignedCompound Lens Coupled to the Spectrograph
A custom-designed compound lens16,17 was assembled, whichconsists of two bi-convex lenses in contact (KBX043 withfocal-length 19 mm, KBX046 with focal-length 25.4 mm,LKIT-1, Newport); this was to achieve high NA for efficientfluorescence collection and small IPSF projected image onto
the entrance-slit of the spectrograph for high spectral resolution.The resultant compound lens has an EFL of 13.75 mm, effectiveNA ∼0.3, and IPSF projected image size ∼147 μm, with theobject-distance (51.0 mm from the IPSF in situ to the effectivefront-principle-point) and image-distance (18.82 mm from theeffective back-principle-point to the slit) designed for conveni-ent phantom placement and compound lens adjustment. Thelens-tube holder mounted on a triple-stage allowed compound-lens tilt-adjustment and linear-translation. The cuvette-holderwas fixed on the optical table to ensure unchanged IPSF positionwith dye-phantom replacement.
The 300 grooves/mm (BLZ 500 nm) grating was selected inthe spectrograph (focal length 300 mm, Acton SpectrPro-2300i,Princeton Instruments), which was well focused onto the CCDcamera (1340 × 100, pixel size 20 μm, PIXIS100, PrincetonInstruments). A bandpass filter (spectral window 325 to 620 nm,3.0-mm-thick, Schott BG39) was attached to the entrance slit toblock scattered laser light. With the slit width set at 200 μm(greater than the IPSF projected image size), the achieved spec-tral resolution was ∼1.5 nm.
3 Results and DiscussionTPE and OPA spectra are shown for Indo-1 [Fig. 3(a)], FITC[Fig. 3(b)], and TRITC [Fig. 3(c)]. TPE spectra are acquiredby measuring TPEF intensities with 140 fs pulse central wave-length tuned from 700 to 900 nm at 10 nm increments. Indo-1,FITC, and TRITC exhibit TPEmaxima at 730, 800, and 840 nm,respectively, which reside to high-frequency, on spectral peak,and to low-frequency of the sub-10 fs TLP spectrum shown inFig. 3(d). Also shown in Fig. 3(d) are representative 140-fs-pulse spectra centered at 730, 800, and 840 nm, which aptlyillustrates differences in spectral bandwidth with the sub-10fs pulse. By comparing TPE and OPA spectra, it is readilyseen that the 140-fs-tuning range, mirroring the FWTM band-width of sub-10 fs pulse, excites the dye molecules to TPA-associated final states degenerate with [Indo-1; Fig. 3(a)] andhigher in energy [FITC and TRITC; Figs. 3(b) and 3(c)] thanOPA-associated 1st-excited singlet state.18–21 With sub-10 fs
TLP of broad FWTM bandwidth, these dye molecule excitedstates can be simultaneously accessed by degenerate andnondegenerate mixing of the untuned sub-10 fs pulse spectralcomponents, beyond the capability of the narrowband 140 fs
pulse. Thus, TPEF enhancement could be expected from greaterpopulation of two-photon excited dye-molecules owing to thesimultaneous accessibility to TPA-associated final statespromoted more readily by sub-10 fs TLP.
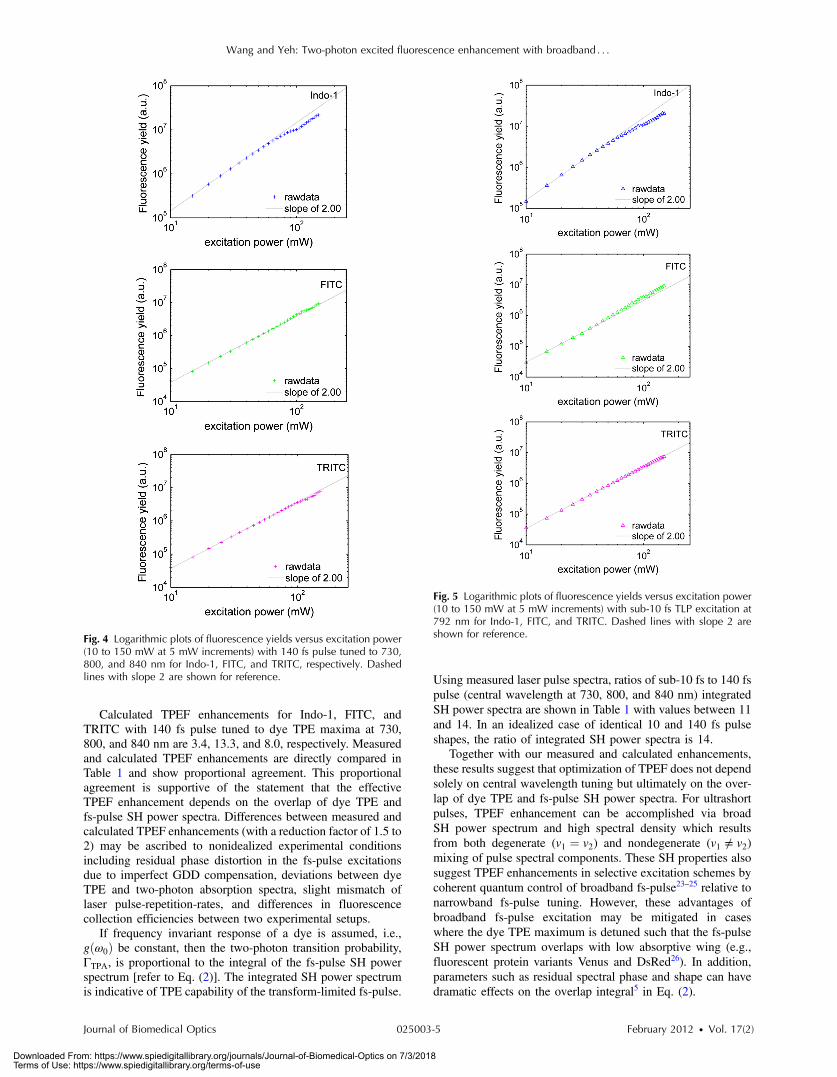
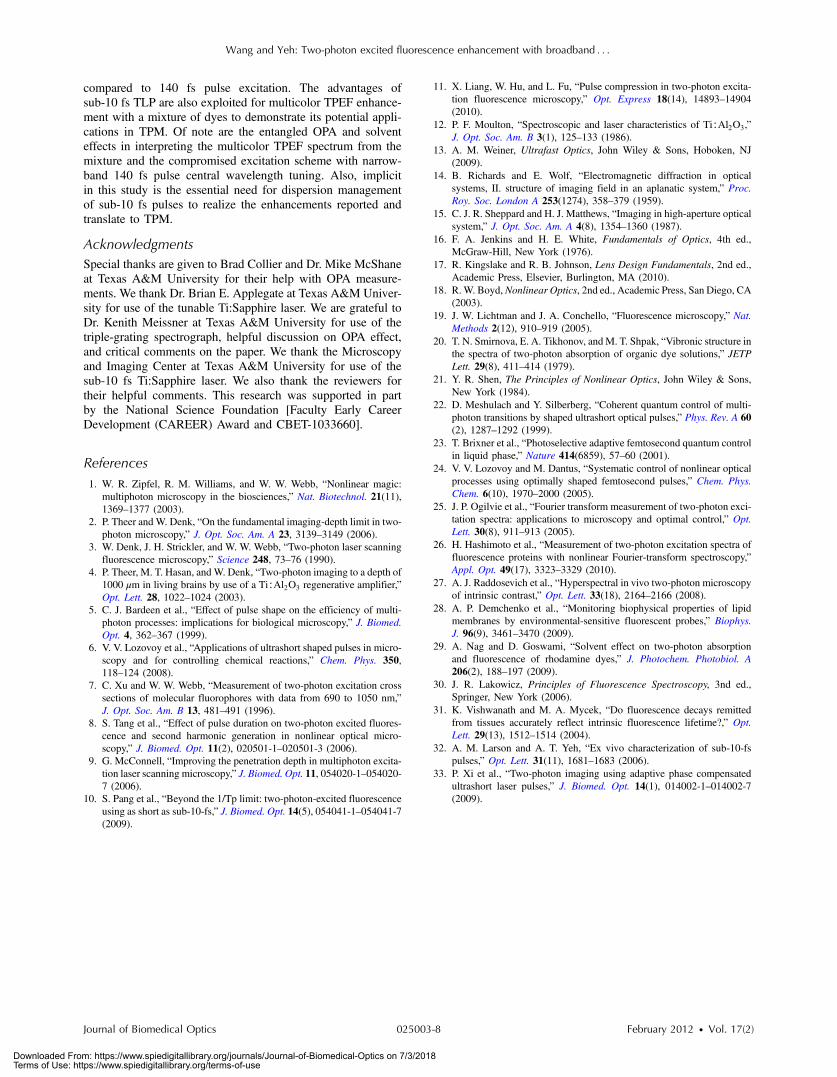
Power dependence of TPEF was previously measured forthe three dyes to find the suitable excitation power range inwhich nonresonant TPEF holds.21 With 140 fs pulse centralwavelength tuned to TPE maxima of Indo-1, FITC, and TRITCat 730, 800, and 840 nm, respectively, fluorescence yields wereintegrated from measured spectra, which are shown on logarith-mic plots as a function of excitation power in Fig. 4. For refer-ence, a dash-line of slope 2 is shown to denote the square-lawdependence.7,18 Subtle deviations from the square-law suggestonsets of saturation or higher-order nonlinearities. Power depen-dence measurements are likewise performed with the untunedsub-10 fs TLP, whose results are shown in Fig. 5. Deviationsfrom the square-law occur for all three dyes at excitation powersabove 40 mW. Conservatively, excitation power of 20 mW isused for all TPEF measurements.
Fig. 2 Interferometric autocorrelation trace of (a) intrinsic sub-10 fsmode-locked pulse from the untuned laser agrees well with that of(b) GDD-compensated sub-10 fs TLP in situ.
Wang and Yeh: Two-photon excited fluorescence enhancement with broadband : : :
Journal of Biomedical Optics 025003-3 February 2012 • Vol. 17(2)
Downloaded From: https://www.spiedigitallibrary.org/journals/Journal-of-Biomedical-Optics on 7/3/2018Terms of Use: https://www.spiedigitallibrary.org/terms-of-use

To make direct comparisons of TPEF yields excited with 140fs and sub-10 fs TLP, all the measured TPEF spectra are normal-ized to exposure-time for each phantom (5.25, 13.9, and 0.45 secfor Indo-1, FITC, and TRITC, respectively, with 140 fs pulseexcitation; 14.5, 10.1, and 0.44 sec for Indo-1, FITC, andTRITC, respectively, with sub-10 fs TLP excitation). 3-Dplots are shown in Fig. 6 of normalized TPEF spectra (x andz-axis) for each phantom with respect to 140 fs pulse tunedwavelengths (y-axis; excitation with sub-10 fs TLP at792 nm). With TPEF yield obtained by integrating the normal-ized TPEF spectrum, TPEF enhancement is defined as the ratioof TPEF yield excited by the sub-10 fs TLP to that by 140 fs
pulse tuned to a specific wavelength. Overall TPEF enhance-ments readily observed in all three phantoms (Fig. 6) shownoticeable advantages of excitation with broadband sub-10 fs
TLP over narrowband tunable 140 fs pulse. At TPE maximafor Indo-1, FITC, and TRITC with 140 fs pulse tuned to730 nm, 800 nm, and 840 nm, respectively, TPEF enhancementsof 1.6, 6.7, and 5.2 are measured (summarized in Table 1).
Differentiated TPEF enhancements among the three dye-phantoms suggest that the measured enhancements depend onthe overlap between dye TPE and fs-pulse SH power spectra.22
Assuming dye TPE are proportional with corresponding TPAspectra, TPEF enhancement may be calculated by the ratio oftwo-photon transition probability (ΓTPA) excited by sub-10 fsversus 140 fs pulse,7 or,
TPEF enhancement ¼ ½FðtÞ�10 fs½FðtÞ�λlaser140 fs
����measured
∝ΓTPA
����10 fs
ΓTPA
����λlaser
140 fs
����calculated
; (1)
where ½FðtÞ� refers to TPEF yield. ΓTPA is calculatedfor each dye by the phenomenologically introducedformula,22 i.e.,
ΓTPA ¼Z
∞
0
gðω0Þ
·
����Z
∞
0
Aðω0∕2 − ΩÞAðω0∕2þ ΩÞdΩ����2
dω0; (2)
where gðω0Þ is frequency dependent TPE spectrum of thedye (refer to TPE spectra in Fig. 3), ω0 denotes two-photontransition energy, j∫ ∞
0 Aðω0∕2 − ΩÞAðω0∕2þ ΩÞdΩj2 is thefs-pulse SH power spectrum (i.e., two-photon spectral den-sity), jAj2 is the fs-pulse spectrum, and Ω stands for angularfrequency of the fs-pulse. Transform-limited pulses areassumed with no phase terms added.
Fig. 3 TPE and OPA spectra of Indo-1 with TPE maximum at 730 nm (a), of FITC with maximum at 800 nm (b), and of TRITC with maximum at 840 nm(c). Laser spectra of the untuned sub-10 fs pulse at 792 nm and 140 fs pulse tuned to 730, 800, and 840 nm (d).
Wang and Yeh: Two-photon excited fluorescence enhancement with broadband : : :
Journal of Biomedical Optics 025003-4 February 2012 • Vol. 17(2)
Downloaded From: https://www.spiedigitallibrary.org/journals/Journal-of-Biomedical-Optics on 7/3/2018Terms of Use: https://www.spiedigitallibrary.org/terms-of-use
Calculated TPEF enhancements for Indo-1, FITC, andTRITC with 140 fs pulse tuned to dye TPE maxima at 730,800, and 840 nm are 3.4, 13.3, and 8.0, respectively. Measuredand calculated TPEF enhancements are directly compared inTable 1 and show proportional agreement. This proportionalagreement is supportive of the statement that the effectiveTPEF enhancement depends on the overlap of dye TPE andfs-pulse SH power spectra. Differences between measured andcalculated TPEF enhancements (with a reduction factor of 1.5 to2) may be ascribed to nonidealized experimental conditionsincluding residual phase distortion in the fs-pulse excitationsdue to imperfect GDD compensation, deviations between dyeTPE and two-photon absorption spectra, slight mismatch oflaser pulse-repetition-rates, and differences in fluorescencecollection efficiencies between two experimental setups.
If frequency invariant response of a dye is assumed, i.e.,gðω0Þ be constant, then the two-photon transition probability,ΓTPA, is proportional to the integral of the fs-pulse SH powerspectrum [refer to Eq. (2)]. The integrated SH power spectrumis indicative of TPE capability of the transform-limited fs-pulse.
Using measured laser pulse spectra, ratios of sub-10 fs to 140 fspulse (central wavelength at 730, 800, and 840 nm) integratedSH power spectra are shown in Table 1 with values between 11and 14. In an idealized case of identical 10 and 140 fs pulseshapes, the ratio of integrated SH power spectra is 14.
Together with our measured and calculated enhancements,these results suggest that optimization of TPEF does not dependsolely on central wavelength tuning but ultimately on the over-lap of dye TPE and fs-pulse SH power spectra. For ultrashortpulses, TPEF enhancement can be accomplished via broadSH power spectrum and high spectral density which resultsfrom both degenerate (v1 ¼ v2) and nondegenerate (v1 ≠ v2)mixing of pulse spectral components. These SH properties alsosuggest TPEF enhancements in selective excitation schemes bycoherent quantum control of broadband fs-pulse23–25 relative tonarrowband fs-pulse tuning. However, these advantages ofbroadband fs-pulse excitation may be mitigated in caseswhere the dye TPE maximum is detuned such that the fs-pulseSH power spectrum overlaps with low absorptive wing (e.g.,fluorescent protein variants Venus and DsRed26). In addition,parameters such as residual spectral phase and shape can havedramatic effects on the overlap integral5 in Eq. (2).
Fig. 4 Logarithmic plots of fluorescence yields versus excitation power(10 to 150 mW at 5 mW increments) with 140 fs pulse tuned to 730,800, and 840 nm for Indo-1, FITC, and TRITC, respectively. Dashedlines with slope 2 are shown for reference.
Fig. 5 Logarithmic plots of fluorescence yields versus excitation power(10 to 150 mW at 5 mW increments) with sub-10 fs TLP excitation at792 nm for Indo-1, FITC, and TRITC. Dashed lines with slope 2 areshown for reference.
Wang and Yeh: Two-photon excited fluorescence enhancement with broadband : : :
Journal of Biomedical Optics 025003-5 February 2012 • Vol. 17(2)
Downloaded From: https://www.spiedigitallibrary.org/journals/Journal-of-Biomedical-Optics on 7/3/2018Terms of Use: https://www.spiedigitallibrary.org/terms-of-use

Just as TPEF enhancements are observed in individual dyeswith TPE maxima across the sub-10 fs pulse spectrum, the broadSH power spectrum and high spectral density of sub-10 fs TLPsuggests an efficient excitation scheme for multicolor TPMapplications. To validate this hypothesis, multicolor TPEFenhancements are quantified with a mixture of the three dyesexcited by the untuned sub-10 fs TLP and tunable 140 fs
pulse. Individual dye-phantoms (100 μM) of Indo-1, FITC,and TRITC were mixed at the volume ratio of 27:17:1 basedon their relative brightness (cf., Fig. 6). TPEF spectra of the mix-ture are shown in Fig. 7 excited by sub-10 fs TLP and 140 fspulse tuned to 730 nm [Fig. 7(a)], 800 nm [Fig. 7(b)], and840 nm [Fig. 7(c)]. Consistent with individual dye TPEFenhancements (recall Fig. 6), multicolor TPEF signals excitedby sub-10 fs TLP are overall stronger than those by 140 fs
pulse tuned to TPE maxima. The readily achieved enhancementby the untuned broadband fs-pulse would greatly improvediscernibility of the generated multicolor TPEF spectrum and
Fig. 6 Normalized TPEF spectra of Indo-1 (peaked at 498 nm), FITC(peaked at 523 nm), and TRITC (peaked at 578 nm) shown in 3-Dplots as a function of emission wavelength (x- and z-axis) in relationto laser excitation wavelength of sub-10 fs TLP at 792 nm and 140fs pulse tuned from 700 to 900 nm at 10 nm increments (y-axis).
Table 1 Measured and calculated TPEF enhancements
Central wavelength of tunable140 fs pulse
730 nm 800 nm 840 nm
Ratios of integrated SH powerspectrum (sub-10 fs pulse : tunable140 fs pulse)
13.5 12.1 11.3
Organic dye phantoms Indo-1 FITC TRITC
Measured TPEF enhancements 1.6 6.7 5.2
Calculated TPEF enhancements 3.4 13.3 8.0
Fig. 7 Normalized mixture TPEF spectrum (Indo-1, FITC, and TRITC)excited by sub-10 fs TLP at 792 nm (red) and by 140 fs pulse (blue)tuned to (a) 730 nm, (b) 800 nm, and (c) 840 nm. Insets show theclose-up of the normalized mixture TPEF spectrum excited by 140 fspulse.
Wang and Yeh: Two-photon excited fluorescence enhancement with broadband : : :
Journal of Biomedical Optics 025003-6 February 2012 • Vol. 17(2)
Downloaded From: https://www.spiedigitallibrary.org/journals/Journal-of-Biomedical-Optics on 7/3/2018Terms of Use: https://www.spiedigitallibrary.org/terms-of-use

facilitate detectability of multicolor TPM imaging from whichpost data processing could benefit. This capability of untunedbroadband fs-pulse excitation for multicolor TPEF enhancementwould not be well recognized without considering extensiveoverlap of its broad SH power spectrum with the TPE spectraof the constituent dyes in the mixture. In contrast with broad-band sub-10 fs TLP excitation, the TPEF spectra of Fig. 7 alsoshow that optimizing the central wavelength of 140 fs pulsefor excitation of one dye comes at the expense of degraded
excitation for the others. This observation is particularly acutefor Indo-1 with significantly reduced TPEF when excited by140 fs pulse tuned to 800 nm [Fig. 7(b), inset] and 840 nm[Fig. 7(c), inset].
Nonetheless, multicolor TPEF spectrum of the mixture is notsimply a linear summation of individual dye spectra. Individualdye TPEF spectra with sub-10 fs TLP excitation, scaled by therespective volume ratio, and its linear summation are shown inFig. 8(a). Discrepancies of the summed with the measured mix-ture TPEF spectra [Fig. 8(c)] are observed particularly withrespect to Indo-1 and TRITC spectral peak positions. A numberof factors could contribute to this observation, including mutualOPA of TPEF (Ref. 27) and environmental influences (i.e.,solvent effects).28 Measured FITC and TRITC OPA spectra atmixture concentrations are shown in Fig. 8(b) and exhibitsignificant overlap with Indo-1 and FITC TPEF spectra. In addi-tion, TRITC TPEF exhibited a marked blue-shift and reductionin intensity when dissolved in mixture solvents of water andmethanol compared to methanol alone. This blue-shift andreduced intensity is due to some combination of solvent effects29
and reduced self-quenching.30 Thus, to simulate the mixtureTPEF spectrum, individual Indo-1 and FITC TPEF spectraweighted by their respective mixture volume fraction weresummed with TRITC TPEF acquired in (methanol/water) mix-ture solution. Absorption of mixture TPEF is introduced throughBeer’s law using measured FITC and TRITC OPA spectrashown in Fig. 8(b) and assuming half the cuvette path-length.The resultant multicolor spectrum by simulation shows goodagreement with the measured mixture TPEF spectrum as seenin Fig. 8(c).
These observations illustrate some issues relevant to multi-color TPM imaging, in particular, perturbed TPEF profiles fromOPA and environmental effects. However, practical evaluationof environmental influences for TPM imaging should bemade with great caution due to their high complexity and entan-glement.28,30 Although imaging depth should be taken intoaccount, frequency dependence of optical scattering and absorp-tion in thick tissue samples can modulate TPEF profiles;31 how-ever, this effect was not studied here. Implied in our results is theimportance of dispersion management especially for broadbandfs-pulses to realize the reported enhancements. For TPM usingpulses as short as sub-10 fs, dispersion management is nontrivialbut has been demonstrated.32,33
4 ConclusionsThis comparative study highlights some tradeoffs in usingbroadband versus tunable fs-pulse lasers for TPM. The resultsare consistent with previous works, which suggest that TPEFcan be effectively enhanced by using fs-pulse of shorterdurations. However, as fs-pulse duration decreases, its spectralbandwidth increases such that the spectrum of sub-10 fs pulsescontains the effective gain bandwidth of Ti:Sapphire and itscentral wavelength is no longer tunable. Herein, TPEF enhance-ments are quantified for a series of individual dye phantomsexcited by sub-10 fs and 140 fs pulses with TPE maxima acrossthe narrowband fs-pulse tuning range. Measured enhancementfactors of 1.6, 6.7, and 5.2 for Indo-1, FITC and TRITC, respec-tively, are in proportional agreement with theoretical values,owing to the broad SH power spectrum and high spectral densityof sub-10 fs TLP. It is believed that these SH properties caneffectively compensate for the lack of central wavelength tun-ing, enabling its larger spectral overlap with dye TPE spectra
Fig. 8 (a) Linear summation (dash-black) and individual TPEF spectra ofIndo-1 (blue), FITC (green), and TRITC (red) scaled by mixture volumeratio. (b) Measured OPA spectra of FITC (green) and TRITC (red) at mix-ture concentrations. (c) Measured (red) and simulated (blue) multicolorTPEF spectra that incorporate OPA contributions from FITC and TRITCand solvent effect plus reduced self-quenching of TRITC.
Wang and Yeh: Two-photon excited fluorescence enhancement with broadband : : :
Journal of Biomedical Optics 025003-7 February 2012 • Vol. 17(2)
Downloaded From: https://www.spiedigitallibrary.org/journals/Journal-of-Biomedical-Optics on 7/3/2018Terms of Use: https://www.spiedigitallibrary.org/terms-of-use
compared to 140 fs pulse excitation. The advantages ofsub-10 fs TLP are also exploited for multicolor TPEF enhance-ment with a mixture of dyes to demonstrate its potential appli-cations in TPM. Of note are the entangled OPA and solventeffects in interpreting the multicolor TPEF spectrum from themixture and the compromised excitation scheme with narrow-band 140 fs pulse central wavelength tuning. Also, implicitin this study is the essential need for dispersion managementof sub-10 fs pulses to realize the enhancements reported andtranslate to TPM.
AcknowledgmentsSpecial thanks are given to Brad Collier and Dr. Mike McShaneat Texas A&M University for their help with OPA measure-ments. We thank Dr. Brian E. Applegate at Texas A&M Univer-sity for use of the tunable Ti:Sapphire laser. We are grateful toDr. Kenith Meissner at Texas A&M University for use of thetriple-grating spectrograph, helpful discussion on OPA effect,and critical comments on the paper. We thank the Microscopyand Imaging Center at Texas A&M University for use of thesub-10 fs Ti:Sapphire laser. We also thank the reviewers fortheir helpful comments. This research was supported in partby the National Science Foundation [Faculty Early CareerDevelopment (CAREER) Award and CBET-1033660].
References1. W. R. Zipfel, R. M. Williams, and W. W. Webb, “Nonlinear magic:
multiphoton microscopy in the biosciences,” Nat. Biotechnol. 21(11),1369–1377 (2003).
2. P. Theer and W. Denk, “On the fundamental imaging-depth limit in two-photon microscopy,” J. Opt. Soc. Am. A 23, 3139–3149 (2006).
3. W. Denk, J. H. Strickler, and W. W. Webb, “Two-photon laser scanningfluorescence microscopy,” Science 248, 73–76 (1990).
4. P. Theer, M. T. Hasan, and W. Denk, “Two-photon imaging to a depth of1000 μm in living brains by use of a Ti∶Al2O3 regenerative amplifier,”Opt. Lett. 28, 1022–1024 (2003).
5. C. J. Bardeen et al., “Effect of pulse shape on the efficiency of multi-photon processes: implications for biological microscopy,” J. Biomed.Opt. 4, 362–367 (1999).
6. V. V. Lozovoy et al., “Applications of ultrashort shaped pulses in micro-scopy and for controlling chemical reactions,” Chem. Phys. 350,118–124 (2008).
7. C. Xu and W. W. Webb, “Measurement of two-photon excitation crosssections of molecular fluorophores with data from 690 to 1050 nm,”J. Opt. Soc. Am. B 13, 481–491 (1996).
8. S. Tang et al., “Effect of pulse duration on two-photon excited fluores-cence and second harmonic generation in nonlinear optical micro-scopy,” J. Biomed. Opt. 11(2), 020501-1–020501-3 (2006).
9. G. McConnell, “Improving the penetration depth in multiphoton excita-tion laser scanning microscopy,” J. Biomed. Opt. 11, 054020-1–054020-7 (2006).
10. S. Pang et al., “Beyond the 1/Tp limit: two-photon-excited fluorescenceusing as short as sub-10-fs,” J. Biomed. Opt. 14(5), 054041-1–054041-7(2009).
11. X. Liang, W. Hu, and L. Fu, “Pulse compression in two-photon excita-tion fluorescence microscopy,” Opt. Express 18(14), 14893–14904(2010).
12. P. F. Moulton, “Spectroscopic and laser characteristics of Ti∶Al2O3,”J. Opt. Soc. Am. B 3(1), 125–133 (1986).
13. A. M. Weiner, Ultrafast Optics, John Wiley & Sons, Hoboken, NJ(2009).
14. B. Richards and E. Wolf, “Electromagnetic diffraction in opticalsystems, II. structure of imaging field in an aplanatic system,” Proc.Roy. Soc. London A 253(1274), 358–379 (1959).
15. C. J. R. Sheppard and H. J. Matthews, “Imaging in high-aperture opticalsystem,” J. Opt. Soc. Am. A 4(8), 1354–1360 (1987).
16. F. A. Jenkins and H. E. White, Fundamentals of Optics, 4th ed.,McGraw-Hill, New York (1976).
17. R. Kingslake and R. B. Johnson, Lens Design Fundamentals, 2nd ed.,Academic Press, Elsevier, Burlington, MA (2010).
18. R.W. Boyd,Nonlinear Optics, 2nd ed., Academic Press, San Diego, CA(2003).
19. J. W. Lichtman and J. A. Conchello, “Fluorescence microscopy,” Nat.Methods 2(12), 910–919 (2005).
20. T. N. Smirnova, E. A. Tikhonov, andM. T. Shpak, “Vibronic structure inthe spectra of two-photon absorption of organic dye solutions,” JETPLett. 29(8), 411–414 (1979).
21. Y. R. Shen, The Principles of Nonlinear Optics, John Wiley & Sons,New York (1984).
22. D. Meshulach and Y. Silberberg, “Coherent quantum control of multi-photon transitions by shaped ultrashort optical pulses,” Phys. Rev. A 60(2), 1287–1292 (1999).
23. T. Brixner et al., “Photoselective adaptive femtosecond quantum controlin liquid phase,” Nature 414(6859), 57–60 (2001).
24. V. V. Lozovoy and M. Dantus, “Systematic control of nonlinear opticalprocesses using optimally shaped femtosecond pulses,” Chem. Phys.Chem. 6(10), 1970–2000 (2005).
25. J. P. Ogilvie et al., “Fourier transform measurement of two-photon exci-tation spectra: applications to microscopy and optimal control,” Opt.Lett. 30(8), 911–913 (2005).
26. H. Hashimoto et al., “Measurement of two-photon excitation spectra offluorescence proteins with nonlinear Fourier-transform spectroscopy,”Appl. Opt. 49(17), 3323–3329 (2010).
27. A. J. Raddosevich et al., “Hyperspectral in vivo two-photon microscopyof intrinsic contrast,” Opt. Lett. 33(18), 2164–2166 (2008).
28. A. P. Demchenko et al., “Monitoring biophysical properties of lipidmembranes by environmental-sensitive fluorescent probes,” Biophys.J. 96(9), 3461–3470 (2009).
29. A. Nag and D. Goswami, “Solvent effect on two-photon absorptionand fluorescence of rhodamine dyes,” J. Photochem. Photobiol. A206(2), 188–197 (2009).
30. J. R. Lakowicz, Principles of Fluorescence Spectroscopy, 3nd ed.,Springer, New York (2006).
31. K. Vishwanath and M. A. Mycek, “Do fluorescence decays remittedfrom tissues accurately reflect intrinsic fluorescence lifetime?,” Opt.Lett. 29(13), 1512–1514 (2004).
32. A. M. Larson and A. T. Yeh, “Ex vivo characterization of sub-10-fspulses,” Opt. Lett. 31(11), 1681–1683 (2006).
33. P. Xi et al., “Two-photon imaging using adaptive phase compensatedultrashort laser pulses,” J. Biomed. Opt. 14(1), 014002-1–014002-7(2009).
Wang and Yeh: Two-photon excited fluorescence enhancement with broadband : : :
Journal of Biomedical Optics 025003-8 February 2012 • Vol. 17(2)
Downloaded From: https://www.spiedigitallibrary.org/journals/Journal-of-Biomedical-Optics on 7/3/2018Terms of Use: https://www.spiedigitallibrary.org/terms-of-use