Introduction to Fluorescence Instrumentation: Fluorometers ...The fluorescence lifetime is the...
33
Introduction to Fluorescence Instrumentation: Fluorometers
Transcript of Introduction to Fluorescence Instrumentation: Fluorometers ...The fluorescence lifetime is the...

Introduction to Fluorescence Instrumentation:
Fluorometers
Presenter
Presentation Notes
Cover option A
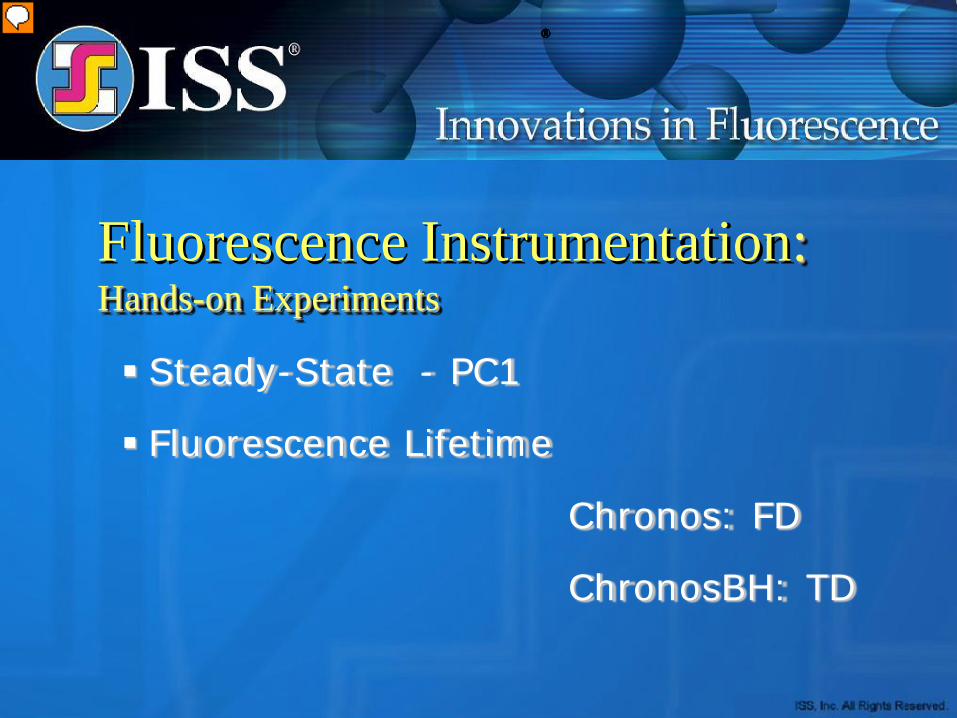
Fluorescence Lifetime
Steady-State - PC1
Fluorescence Instrumentation: Hands-on Experiments
Chronos: FD
ChronosBH: TD
Presenter
Presentation Notes
Second page option A

PC1 T-format with Parallel Beam Geometry
Fully Automated
Steady-State Fluorescence
Compact Design
Upgradeable to Lifetime
Presenter
Presentation Notes
Second page option A

Excitation Monochromator Quantum Counter
Reference PMT
PMT PMT
Lamp
Beam splitter
Excitation Polarizer Filter
PMT
Filter
Emission Monochromator
Filter
Emission Polarizers
Sample cell
Presenter
Presentation Notes
Here is a schematic drawing of the Instrument. The instrument uses a 300 W Xeno Lamp as the excitation source, single monochrometers which are upgrateble to double and a red-sensitive PMT (R 928).

Excitation Spectra
Steady-State Polarization
Measurement Capabilities:
Emission Spectra
Synchronous Spectra
Presenter
Presentation Notes
The PC1 enable the measurement of:

Fluorescence Lifetime
Product-Line:
Presenter
Presentation Notes
The fluorescence lifetime is the average time a fluorescent molecule remains in the excited state before going back to the ground state by emitting a photon. Lifetimes can be single exponential or multi exponential. The measurement of the fluorescent lifetime is more difficult as compared to just the intensity. There are two widely used methods for measuring the fluorescent lifetime:

Two Ways to Measure Lifetime:
Presenter
Presentation Notes
The fluorescence lifetime is the average time a fluorescent molecule remains in the excited state before going back to the ground state by emitting a photon. Lifetimes can be single exponential or multi exponential. The measurement of the fluorescent lifetime is more difficult as compared to just the intensity. There are two widely used methods for measuring the fluorescent lifetime:

It = α e – t/τ
Time-Domain
Presenter
Presentation Notes
In the time-domain or pulsed method approach the fluorescent compound is excited with a laser pulse and the emission profile is measured by collecting the emitted photons with time (time-corelated single photon counting). TCSPC is a digital technique counting photons time-correlated with regards to the excitation pulse. The main tool is a time-to-amplitude converter which works like a fast stopwatch. There are about 2000 pins that are containing the info how long it take from the puls to generating the photon. Typically 80 Hz repetition rate.

Frequency Domain
Phase Shift
Demodulation
21
1
)(M
ωτ+=
tan φ = ωτ
EX
EM
(AC/DC)(AC/DC)M =
Presenter
Presentation Notes
The other way to measure fluorescence lifetimes is by using a modulated light source for excitation and to measure the phase lag or demodulation of the emitted light vs. the excitation light. The emitted light will have the same circular frequency but will be show phase lag of . Based on the phase lag the lifetime can be calculated tan = . Further, the emission is less modulated (demodulated) relative to the excitation. The relative amplitude of the variable portion of the emission AC is smaller for the emission than for the excitation.
Since January 2008 ISS offers both
Time-Domain and Frequency-Domain Instrumentation
Presenter
Presentation Notes
Faster acquisition due to continuous measurement rather than pulsed techniques Higher accuracy due to

What are the main characteristics of Frequency Domain (FD)?
• In FD fluorescence lifetime is calculated from 2 measurable parameters: phase angle and modulation
• FD requires no deconvolution
• FD allows direct, one step measurements of anisotropy decays (rotational correlation times)
• FD is better in resolving short lifetime contributions as compared to TD
• FD is the method of choice for lifetime-based sensing and real-time measurements because of high sampling rates in the ms time scale
Presenter
Presentation Notes
Faster acquisition due to continuous measurement rather than pulsed techniques Higher accuracy due to

What are the main characteristics of Time Domain (TD)? • As compared to FD, TD is a more direct way of measuring lifetime • Unlike FD, TD requires no reference but measurement of an instrument response function (IRF)
• TD anisotropy decay measurements do require two separate measurements at each plane of polarization
• TD has a low duty cycle - approximately only one photon per every 50 flashes is measured
• TD is the preferred method for measuring low fluorescence compounds
Presenter
Presentation Notes
Faster acquisition due to continuous measurement rather than pulsed techniques Higher accuracy due to

Fluorescence Lifetime Chronos Multi-Frequency Cross-Correlation Phase Modulation Fluorimeter
Fully Automated
Lifetime Measurements Utilizing LEDs and LDs Affordable
Presenter
Presentation Notes
The second more affordable version is Chronos.

Presenter
Presentation Notes
Second page option A

Light Source Lines [nm]
Lamps Mercury-Arc 254, 313, 366, 405,
436, 546, 5781 Xenon-Arc 250–1000 Tungsten-Halogen 350–1000
Light Emitting Diodes (LEDs)
280, 300, 370, 460, 480, 520
Diode Lasers
370, 405, 436, 470, 635, 670, 780, 830
Lasers Helium–Cadmium Argon-Ion
325, 442 457, 488, 514
Nd:YAG Helium–Neon
1064, 5322 543, 594, 633
Krypton Ti-Sapphire
668, 647 tunable
Presenter
Presentation Notes
Second page option A

0
30
60
90
10 4 10 5 10 6 10 7 10 8 10 9
Phas
e La
g [D
egre
es]
Modulation Frequency [Hz]
Lifetime [ns]:
1 3 10 30 100 300 1000
Presenter
Presentation Notes
From this Figure it can be seen that in order to measure a certain lifetimes in frequency domain one has to choose the right frequency range. Knowledge of the excited state lifetime of a fluorophore is crucial for quantitative interpretations of numerous fluorescence measurements such as quenching, polarization and FRET. The other important message is that one does not necessarily have to know the fluorescence lifetime when you measure in the frequency doamin (e.g. for sensing applications). The phase angle or modulation can be direcltly related to the analyte concentration.
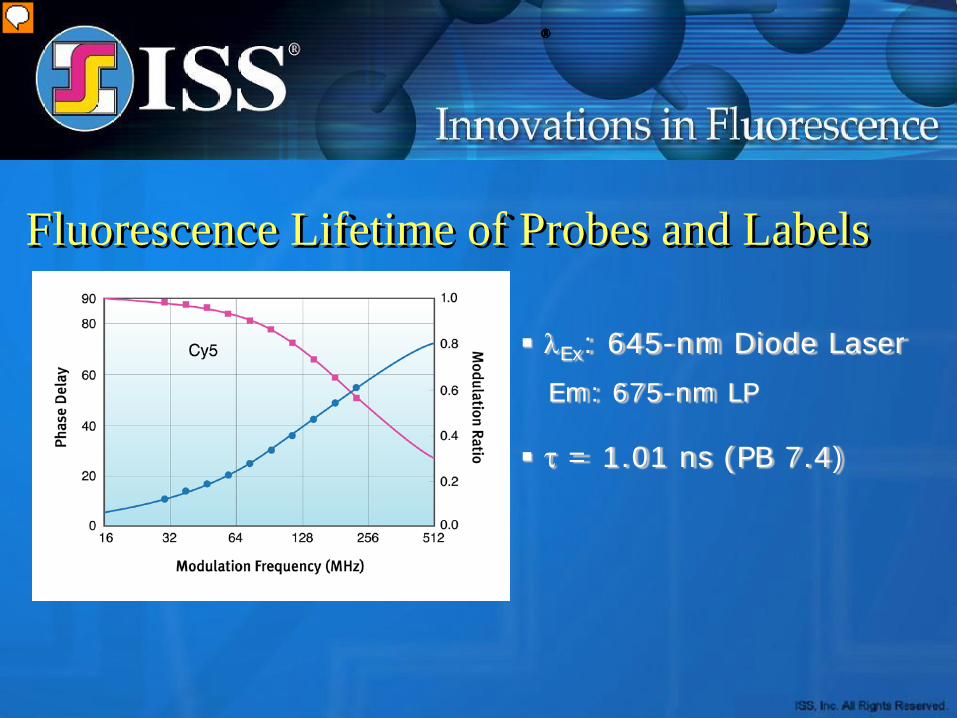
Fluorescence Lifetime of Probes and Labels
λEx: 645-nm Diode Laser Em: 675-nm LP
τ = 1.01 ns (PB 7.4)
Presenter
Presentation Notes
Second page option A

λEx: 786-nm Diode Laser Em: 830-nm LP
τ = 0.56 ns (water)
Fluorescence Lifetime of Probes and Labels
Presenter
Presentation Notes
Second page option A

Fluorescence Lifetime ChronosBH Time-Correlated-Single-Photon-Counting Fluorometer
Fully Automated
Lifetime Measurements Utilizing Lasers and LDs
Intensity- and
Anisotropy Decay
Measurements in a Few Sec
Presenter
Presentation Notes
The second more affordable version is Chronos.
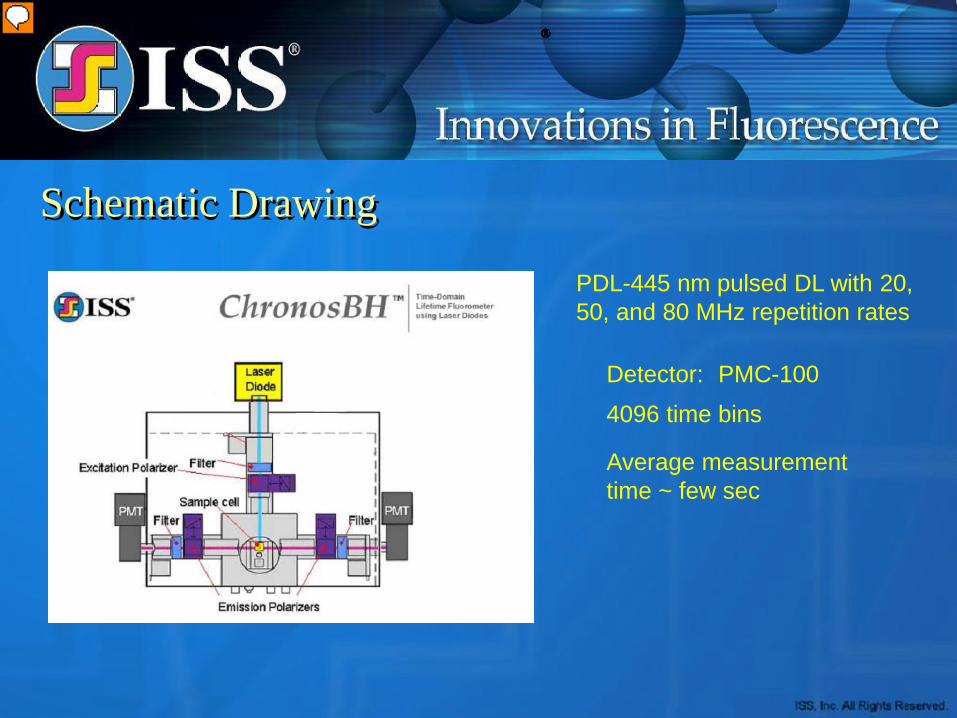
Schematic Drawing
PDL-445 nm pulsed DL with 20, 50, and 80 MHz repetition rates
Detector: PMC-100 4096 time bins
Average measurement time ~ few sec
Presenter
Presentation Notes
Second page option A

Fluorescence Lifetime of Probes and Labels
λEx: 447-nm Diode Laser Em: 505-nm LP
τ = 4.05 ns (water)
Presenter
Presentation Notes
Second page option A

Fluorescence Lifetime of Probes and Labels
λEx: 447-nm Diode Laser Em: KV 505 LP
τ = 5.66 ns (water)
Presenter
Presentation Notes
Second page option A

Vinci - Multidimensional Fluorescence Spectroscopy
Full Remote Instrument Control
Data Analysis
Automated Data Acquisition
Presenter
Presentation Notes
Second page option A

Vinci - Remote Instrument Control All instrument components are remotely accessible
Virtual layout same as instrument layout
Presenter
Presentation Notes
Cover option A

Acquisition Set Up
Presenter
Presentation Notes
Cover option A

Presenter
Presentation Notes
Cover option A
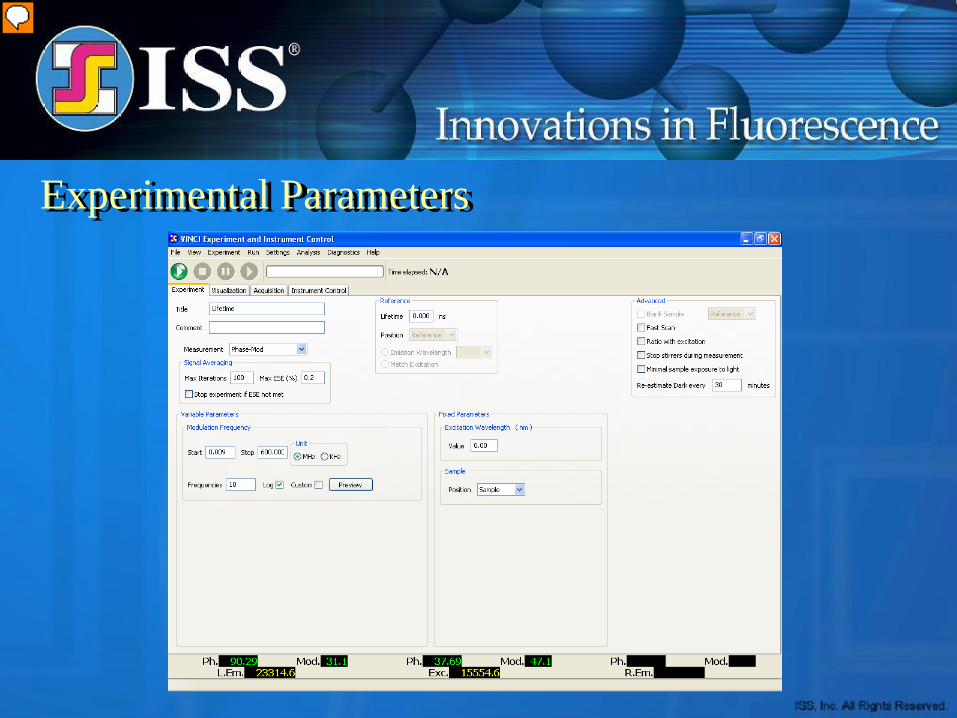
Experimental Parameters
Presenter
Presentation Notes
Cover option A

Measurement
Presenter
Presentation Notes
How is polarization or anisotropy measured: The sample containing the fluorescent probes is excited with linear polarized light and the vertical and horizontal components of the intensity of the emitted light are measured and the anisotropy of polarization is calculated using the following equations:

Fitting
Presenter
Presentation Notes
Cover option A

Fitting Results
Presenter
Presentation Notes
Cover option A

Fitting Models:
Presenter
Presentation Notes
Cover option A

Vinci-Multidimensional Fluorescence Spectroscopy
No Need to Export Data to Excel or Origin
Vinci – Produces Publication-ready
Plots and Figures
Presenter
Presentation Notes
Second page option A

Thank You!
Presenter
Presentation Notes
Cover option A