Two modes of interspike interval shortening by brief ...Two Modes of Interspike Interval Shortening...
13
69:1661-1672, 1993. J Neurophysiol A. D. Reyes and E. E. Fetz neurons brief transient depolarizations in cat neocortical Two modes of interspike interval shortening by You might find this additional info useful... 27 other HighWire hosted articles, the first 5 are: This article has been cited by [PDF] [Full Text] [Abstract] , October 1, 2012; 108 (7): 1838-1855. J Neurophysiol Michael A. Farries and Charles J. Wilson generalization to other cell types Biophysical basis of the phase response curve of subthalamic neurons with [PDF] [Full Text] [Abstract] , October 1, 2012; 108 (7): 1822-1837. J Neurophysiol Michael A. Farries and Charles J. Wilson current injection Phase response curves of subthalamic neurons measured with synaptic input and [PDF] [Full Text] [Abstract] , May 1, 2013; 109 (9): 2306-2316. J Neurophysiol Óscar Miranda-Domínguez and Theoden I. Netoff transient conditions Parameterized phase response curves for characterizing neuronal behaviors under [PDF] [Full Text] [Abstract] , June 1, 2013; 109 (11): 2757-2766. J Neurophysiol Shuoguo Wang, Maximilian M. Musharoff, Carmen C. Canavier and Sonia Gasparini 1 excitability Hippocampal CA1 pyramidal neurons exhibit type 1 phase-response curves and type [PDF] [Full Text] [Abstract] , November 1, 2014; 112 (9): 2302-2315. J Neurophysiol Ahmed Z. Obeidat, Paul Nardelli, Randall K. Powers and Timothy C. Cope Modulation of motoneuron firing by recurrent inhibition in the adult rat in vivo including high resolution figures, can be found at: Updated information and services /content/69/5/1661 can be found at: Journal of Neurophysiology about Additional material and information http://www.the-aps.org/publications/jn This information is current as of February 3, 2015. the American Physiological Society. ISSN: 0022-3077, ESSN: 1522-1598. Visit our website at http://www.the-aps.org/. (monthly) by the American Physiological Society, 9650 Rockville Pike, Bethesda MD 20814-3991. Copyright © 1993 by publishes original articles on the function of the nervous system. It is published 12 times a year Journal of Neurophysiology on February 3, 2015 Downloaded from on February 3, 2015 Downloaded from
Transcript of Two modes of interspike interval shortening by brief ...Two Modes of Interspike Interval Shortening...
69:1661-1672, 1993.J NeurophysiolA. D. Reyes and E. E. Fetzneuronsbrief transient depolarizations in cat neocortical Two modes of interspike interval shortening by
You might find this additional info useful...
27 other HighWire hosted articles, the first 5 are:This article has been cited by
[PDF] [Full Text] [Abstract]
, October 1, 2012; 108 (7): 1838-1855.J NeurophysiolMichael A. Farries and Charles J. Wilsongeneralization to other cell typesBiophysical basis of the phase response curve of subthalamic neurons with
[PDF] [Full Text] [Abstract], October 1, 2012; 108 (7): 1822-1837.J Neurophysiol
Michael A. Farries and Charles J. Wilsoncurrent injectionPhase response curves of subthalamic neurons measured with synaptic input and
[PDF] [Full Text] [Abstract], May 1, 2013; 109 (9): 2306-2316.J Neurophysiol
Óscar Miranda-Domínguez and Theoden I. Netofftransient conditionsParameterized phase response curves for characterizing neuronal behaviors under
[PDF] [Full Text] [Abstract], June 1, 2013; 109 (11): 2757-2766.J Neurophysiol
Shuoguo Wang, Maximilian M. Musharoff, Carmen C. Canavier and Sonia Gasparini1 excitabilityHippocampal CA1 pyramidal neurons exhibit type 1 phase-response curves and type
[PDF] [Full Text] [Abstract], November 1, 2014; 112 (9): 2302-2315.J Neurophysiol
Ahmed Z. Obeidat, Paul Nardelli, Randall K. Powers and Timothy C. CopeModulation of motoneuron firing by recurrent inhibition in the adult rat in vivo
including high resolution figures, can be found at:Updated information and services /content/69/5/1661
can be found at:Journal of Neurophysiologyabout Additional material and information http://www.the-aps.org/publications/jn
This information is current as of February 3, 2015.
the American Physiological Society. ISSN: 0022-3077, ESSN: 1522-1598. Visit our website at http://www.the-aps.org/.(monthly) by the American Physiological Society, 9650 Rockville Pike, Bethesda MD 20814-3991. Copyright © 1993 by
publishes original articles on the function of the nervous system. It is published 12 times a yearJournal of Neurophysiology
on February 3, 2015
Dow
nloaded from on F
ebruary 3, 2015D
ownloaded from

JOURNALOF NEUROPHYSIOLOGY Vol. 69, No. 5, May 1993. Yrintcd
Two Modes of Interspike Interval Shortening by Brief Transient Depolarizations in Cat Neocortical Neurons
ALEX D. REYES AND EBERHARD E. FETZ Department ofPhysiology and Biophysics and Regional Primate Research Center, University of Washington, Seattle, Washington 98195
SUMMARY AND CONCLUSIONS
1. The effects of small, brief depolarizing pulses and excitatory postsynaptic potentials (EPSPs) on neuronal firing were exam- ined in layer V neurons in slices of cat sensorimotor cortex. Dur- ing intracellular recording, brief depolarizing current pulses (dura- tion, 0.5-2.0 ms; amplitude, 0.1-4.0 nA) were injected in neurons to produce pulse potentials ( PPs) with a near-linear rise to a peak (0.08-3.6 mV; rise time = pulse duration) followed by an exponen- tial decay. These PPs resembled EPSPs evoked by electrical stimu- lation of adjacent sites. When injected in neurons that were in- duced to discharge tonically, the PPs shortened the interspike in- tervals (ISIS) in two ways, depending on their time of arrival in the ISI.
2. Toward the end of the ISI, the PPs crossed a time-varying firing level, thereby directly evoking action potentials and shorten- ing the ISIS. These directly evoked spikes occurred during the rise or peak of the PPs. The absolute firing level increased with the membrane trajectory during the latter part of the ISI.
3. PPs that appeared earlier in the IS1 did not cross firing level directly but could nevertheless shorten the IS1 by a slow regenera- tive process. The indirectly evoked spikes occurred after the peak of the PPs, at latencies whose magnitude and variability increased as the PPs appeared at successively earlier times in the ISI. PPs that occurred during the initial portion (approximately the 1st 3rd) of the IS1 did not affect IS1 duration.
4. Stimulus-evoked EPSPs shortened the ISIS in a manner simi- lar to that of PPs. Like PPs, EPSPs caused direct crossings late in the IS1 and indirect crossings earlier. Comparison of the mean and maximum IS1 shortenings and the range of delays in which the PPs and EPSPs consistently produced IS1 shortenings revealed no systematic differences. These similarities suggest that PPs may be used to simulate the IS1 shortenings caused by EPSPs.
5. To characterize possible mechanisms underlying the IS1 shortening, we examined the PP shapes at different times in the ISI. PPs immediately following a spike were smaller and decayed more rapidly than those evoked by the same current at rest. Late in the ISI, when the membrane potential was >5 mV above rest, the PP height exceeded that of the PP at rest. This amplitude increase may be due to activation of the persistent sodium current.
6. PPs appearing at intermediate times in the IS1 activated a slow regenerative process, causing a stereotyped, near-exponential rise in the membrane trajectory that crossed firing level after - 3.1 t 1.6 (SD) ms. Threshold for this process was 4.3 & 2.4 mV below nring level.
7. The combination of the time-varying firing level and the slow regenerative process allowed most of the voltage transients to shorten the IS1 and thereby increase the firing rate of the cortical neurons.
INTRODUCTION
Synaptic current from a population of presynaptic cells is transduced into firing activity of a postsynaptic neuron by various ionic conductances. The degree to which these con- ductances are activated depends on the amplitude of the synaptic current and the resultant change in membrane po- tential. In addition, because these conductances can have different time constants of activation and inactivation, the response also depends on the time course of the synaptic current.
In vivo intracellular recordings reveal that the synaptic potentials evoked by natural stimulation are often com- plex. In cat motoneurons, stretch of muscle can produce steady shifts in the membrane potential accompanied by voltage transients (Calvin and Stevens 1968; Cope et al. 1987; Gustafsson and McCrea 1984). Intracellular record- ings in cat primary visual cortex neurons reveal that large voltage transients are often evoked by stimuli delivered to the cells’ receptive field (Creutzfeldt et al. 1974; Ferster 1986 ) . Similarly, intracellular records of motor cortex neu- rons of awake, behaving monkeys reveal large voltage tran- sients at the onset of movement (Matsumura 1979; M. Matsumura, D. F. Chen and E. E. Fetz, unpublished obser- vations). These composite synaptic potentials can be signifi- cantly larger than documented unitary excitatory postsyn- aptic potentials ( EPSPs) (Fetz et al. 199 1; Kang et al. 1988; Komatsu et al. 1988; Thomson et al. 1988) and may signifi- cantly affect the firing rate of neurons (Fetz and Gustafsson 1983; Fetz et al. 1991).
Neuronal firing is commonly characterized by using steadily injected current to generate spiking activity and constructing curves (fir plots) that relate the firing rate to current magnitude (Calvin and Sypert 1976; Stafstrom et al. 1984a). These plots do not necessarily predict the effects of voltage transients on firing rate because transients may affect conductances differently than steady current. For ex- ample, brief transient depolarizations primarily activate conductances with fast kinetics. In motoneurons, superpo- sition of synaptic current on steadily applied current ap- pears to steepen the slope of thefl1 curve in the secondary range (Granit et al. 1966). Schwindt ( 1973) argued that this steepening was due to the threshold crossings produced by transient synaptic potentials that occurred on the mem- brane trajectory.
To investigate systematically the effects of transient in- puts on cortical neurons, we recorded intracellularly from
0022-3077/93 $2.00 Copyright 0 1993 The American Physiological Society 1661
on February 3, 2015
Dow
nloaded from
1662 A. D. REYES AND E. E. FETZ
layer V neurons in slices of cat sensorimotor cortex and examined the interspike interval (ISI) shortenings pro- duced by voltage transients applied during repetitive dis- charge. Initially we used stimulus-evoked EPSPs, but these were often contaminated with inhibitory synaptic poten- tials, and their shape and size could not be readily varied independently. To avoid these problems, we injected brief rectangular current pulses through the electrode to mimic the synaptic current. These current pulses produced pulse potentials ( PPs) that resembled stimulus-evoked EPSPs re- corded at the cell soma and had similar effects on firing.
This report concerns the mechanisms by which PPs and EPSPs shorten the ISIS of steadily discharging neurons. The effects of varying PP amplitudes and the baseline firing rate are described in the accompanying paper. Initial observa- tions were reported in abstract form (Reyes and Fetz 1989).
METHODS
Surgical preparation
The surgical and slicing procedures were essentially those de- scribed by Stafstrom et al. ( 1984~). Subjects were cats of either sex weighing 2.5-5.5 kg. They were anesthetized with pentobarbital sodium (35 mg/kg ip) and tracheotomized to ensure adequate ventilation. Arterial and venous femoral catheters were inserted to monitor blood pressure and administer anesthesia. Rectal temper- ature was maintained at 37 t 0.5OC (mean t SD) by a controlled heating pad. Pentobarbital sodium was administered periodically at doses sufficient to maintain slitlike pupils and abolish with- drawal reflexes.
A hemicraniotomy was performed, and a block of tissue consist- ing of the lateral half of the cruciate sulcus and approximately half of the posterior sigmoid gyrus was removed, transferred to a vibra- tome tissue slicer, mounted on an agar block with cyanoacrylic ester glue, and submerged in artificial cerebrospinal fluid (ACSF; in mM: 130 NaCl, 3 KCl, 2 CaCl,, 2 MgCl,, 1.25 NaH,PO,, 26 NaHCO,, and 10 dextrose). Eight to 10 slices were cut at 450 pm and transferred to a holding chamber filled with ACSF that was maintained at 34-37°C and gassed with a mixture of 95% oz-5% co,.
Slices were transferred as needed to a gas interface chamber for recording. The slices were in contact with a nylon mesh, and their undersides were perfused with gassed ACSF (37°C) at a rate of -0.7 ml/min. They were kept moist by warm gas saturated with water vapor.
After the slices were obtained, the cats were euthanized with pentobarbital sodium.
Data acquisition
Cells in layer V, approximately two-thirds of the distance from the pial surface to the white matter, were impaled with thin-walled (0.5 mm ID) glass capillaries ( 10 to 20 MQ d.c. resistance) filled with either 3 M KC1 or 2 M K methylsulfate. The intracellular signals were led to an Axoprobe amplifier (Axon Instruments) that permitted injection of current through a bridge circuit. Cell impalement was signaled by a negative d.c. potential, usually with injury discharge. The discharge was suppressed by application of hyperpolarizing steady current, which was gradually removed as the quality of the impalement improved. Input conductance was measured by injecting long current pulses (amplitude, 0.1-0.5 nA; duration, 100-200 ms) through the recording electrode and divid- ing the current by the peak voltage deflection.
Compound EPSPs were evoked by stimulating adjacent white
A pulse potential
B T, To i
T. i
4 b! ; effective interval :
0 delay z (% of ISI) 100
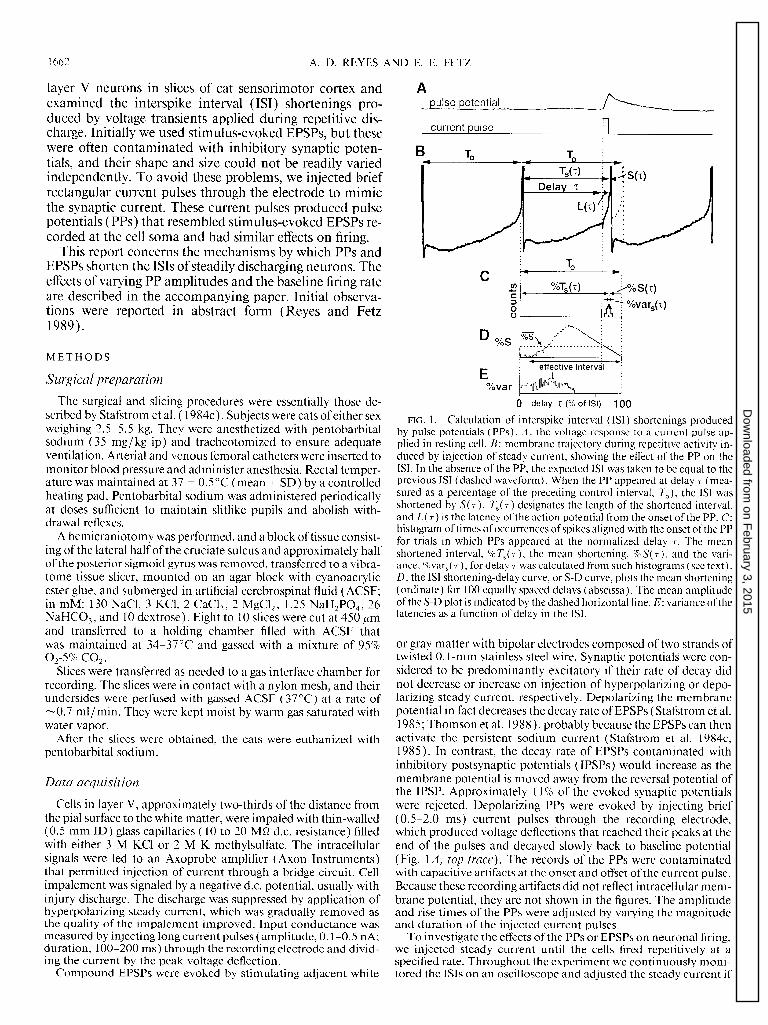
FIG. 1. Calculation of interspike interval (ISI) shortenings produced by pulse potentials (PPs). A : the voltage response to a current pulse ap- plied in resting cell. B: membrane trajectory during repetitive activity in- duced by injection of steady current, showing the effect of the PP on the ISI. In the absence of the PP, the expected IS1 was taken to be equal to the previous IS1 (dashed waveform). When the PP appeared at delay 7 (mea- sured as a percentage of the preceding control interval, To), the IS1 was shortened by S( 7). Ts( 7) designates the length of the shortened interval, and L( 7) is the latency of the action potential from the onset of the PP. C: histogram of times of occurrences of spikes aligned with the onset of the PP for trials in which PPs appeared at the normalized delay 7. The mean shortened interval, %T,( 7) the mean shortening, %S( 7) and the vari- ance, %var,( 4, for delay 7 was calculated from such histograms (see text). D: the IS1 shortening-delay curve, or S-D curve, plots the mean shortening (ordinate) for 100 equally spaced delays (abscissa). The mean amplitude of the S-D plot is indicated by the dashed horizontal line. E: variance of the latencies as a function of delay in the ISI.
or gray matter with bipolar electrodes composed of two strands of twisted 0. l-mm stainless steel wire. Synaptic potentials were con- sidered to be predominantly excitatory if their rate of decay did not decrease or increase on injection of hyperpolarizing or depo- larizing steady current, respectively. Depolarizing the membrane potential in fact decreases the decay rate of EPSPs (Stafstrom et al. 1985; Thomson et al. 1988) probably because the EPSPs can then activate the persistent sodium current (Stafstrom et al. 1984c, 1985). In contrast, the decay rate of EPSPs contaminated with inhibitory postsynaptic potentials (IPSPs) would increase as the membrane potential is moved away from the reversal potential of the IPSP. Approximately 11% of the evoked synaptic potentials were rejected. Depolarizing PPs were evoked by injecting brief (0.5-2.0 ms) current pulses through the recording electrode, which produced voltage deflections that reached their peaks at the end of the pulses and decayed slowly back to baseline potential (Fig. 1 A, top trace). The records of the PPs were contaminated with capacitive artifacts at the onset and offset of the current pulse. Because these recording artifacts did not reflect intracellular mem- brane potential, they are not shown in the figures. The amplitude and rise times of the PPs were adjusted by varying the magnitude and duration of the injected current pulses.
To investigate the effects of the PPs or EPSPs on neuronal firing, we injected steady current until the cells fired repetitively at a specified rate. Throughout the experiment we continuously moni- tored the ISIS on an oscilloscope and adjusted the steady current if
on February 3, 2015
Dow
nloaded from
DEPOLARIZING PULSES SHORTEN INTERSPIKE INTERVALS 1663
there was an obvious change in the average firing rate. The ISIS typically did not vary from the mean control interval by >5 ms in cells discharging at 25 imp/s. The PPs or EPSPs were then intro- duced repetitively at a mean rate that was approximately one-third of the neuronal firing rate. To avoid entrainment of the spikes by the stimulus train, stimulus intervals were randomized with a Schmitt trigger activated by white noise. Each PP or EPSP was applied 1 ,OOO-3,000 times to the discharging cell.
The stimulus triggers, membrane potential, and current traces were monitored on an oscilloscope during the experiments and recorded on an FM tape recorder (Honeywell 7600) for off-line analysis.
Data analysis
We digitized the analog records of PPs and membrane trajecto- ries at a sampling rate of 10 kHz with the use of a PDP- 1 1 / 73 computer. To measure PPs at rest, stimulus-triggered averages of membrane potential were compiled over a 50-ms interval starting 10 ms before the stimulus. Clear records of small PPs could be obtained with averages of 25- 100 events; these averages were used to determine the PP amplitude (the height immediately after the capacitive artifact) and rise time (the time from the pulse onset to the peak).
The times of occurrences of stimulus pulses and action poten- tials were identified with time-amplitude window discriminators and stored on the PDP- 1 1 / 73.
Calculation ofIS shortenings
The effects of the PPs and EPSPs were calculated by comparing the duration of the IS1 in which it occurred with the duration of the preceding interval, as illustrated in Fig. 1. The PP typically shortened the “conditioned” interval ( T,) relative to the preceding unconditioned interval ( To). The membrane potential trajectory in Fig. 1 B illustrates a PP introduced at delay 7, which shortened the IS1 to T,( 7). The amount of shortening was
S(T) = To - Ts(r) (1)
The effects of many PPs introduced at delay 7 are shown by the histogram in Fig. KY, which plots the times at which the subse- quent spikes occurred. To deal with slight variations in firing rate, the delay and shortening were normalized to the preceding control interval and resolved to a binwidth of 0.0 1 To. The mean of this histogram distribution yields the mean shortening, expressed as a percentage of control
%S(r) = FA $ Si(7) 0 1-l
(2)
where Si (7) is the shortening of the ith PP at delay 7. The plot of percentage of shortening, %S( 4, as a function of
delay 7 is called the IS1 shortening-delay curve (S-D curve) and is illustrated in Fig. 1 D.
Another useful statistic is the variance of %S( 7)) which was calculated as
% var, (7) = -& $ [%Sib) - %SW12 l-l
(3)
Figure 1 E plots % var, (7) as a function of 7.
Measurements ofS-D curves
The S-D curves provided several measures of the effect of PPs on the ISI. The average shortening of PPs over the entire IS1 dura- tion could be given as a percentage of control (%S, Fig. 1 D) or as absolute shortening (S)
%S= + l; %S(T) (4) 0 T-O
T -
s = G (%S)
The effective interval is defined as the range of delays in the IS1 where the PP consistently shortened the ISI. In the effective inter- val the S-D curve consistently had positive values (Fig. 10). The best method of determining the effective interval was estimation by eye. Confidence intervals could not be established because there was often no true baseline; in some cases, the S-D curve was greater than zero at all delays; in others, S-D curves were negative at the early delays (see companion paper). In some cases, visual judgment of the onset was aided by smoothing the S-D curves (by convolving them with a Gaussian function) or by integrating the S-D curves. The onset of the effective interval was defined as the time that the S-D curve first became positive and remained so; this was associated with a consistent increase in the integrated curve.
Although the baseline firing rate was controlled, there were nev- ertheless small deviations from the intended firing rate. These de- viations produced some artifactual IS1 lengthening for delays very close to the end of the IS1 in some of the S-D curves. This resulted from the algorithm used in the calculations, in combination with normal variance. To appreciate this effect, consider three sequen- tial spikes occurring at times t 1, t,, and &, with a PP occurring at time I, ( tz < t, < t3). The control interval is defined as t&i. The occurrence of the third spike, t3, is tallied on the histogram aligned with t2, and the shortening is given by (t&i) - ( t3-t2). Because of the variability in the ISIS, t3 may deviate from the mean IS1 period from trial to trial. But by definition, t3 cannot be less than t, be- cause &-& would then be a control interval. Thus for delays near the end of the ISI, the sampled spikes will be biased toward those that occur at times longer than t,. In some cases, particularly for small PPs, this selection bias appears in the S-D curve as an artifi- cial lengthening of the IS1 where there may have actually been an IS1 shortening.
The instantaneous change in firing rate, A&,( 7)) caused by the PP at delay 7 was calculated from the IS1 shortening by
alst(~) = & - + = s(d/ { To*[To - SW1 > (imP/s) s r 0
RESULTS
= S(7)/Tz for S(T) 6 To
Data were obtained from intracellular recordings from 66 neurons in layer V of the sensorimotor cortex. The cells were not morphologically reconstructed, but the relatively large recording electrodes ( 1 O-20 ma) probably biased our sample to the large pyramidal cells in layer V. The mea- sured d.c. input resistances (5.3-25.1 Ma; mean, 11.5 t 4.5 MQ) were comparable with those obtained for identified pyramidal cells in a similar in vitro slice preparation (Spain et al. 199 lb; Stafstrom et al. 1984~).
Impaled cells were accepted for analysis if regular, repeti- tive discharge could be maintained with injection of steady current. Typically, cells were induced to fire repetitively at 25 imp/s for lo- 15 min. Spike heights exceeded 80 mV above resting potential; spike widths (measured at firing level) ranged from 0.4 to 1.6 ms. Cells were rejected if they did not maintain a steady discharge rate for > l-2 min or had small (~60 mV) or wide (>2 ms) spikes. Most cells had resting potentials of -60 to -70 mV. In some cells, hyper- polarizing current had to be continually injected to prevent spontaneous discharge. These cells were accepted for analy-
on February 3, 2015
Dow
nloaded from
1664 A. D. REYES AND E. E. FETZ
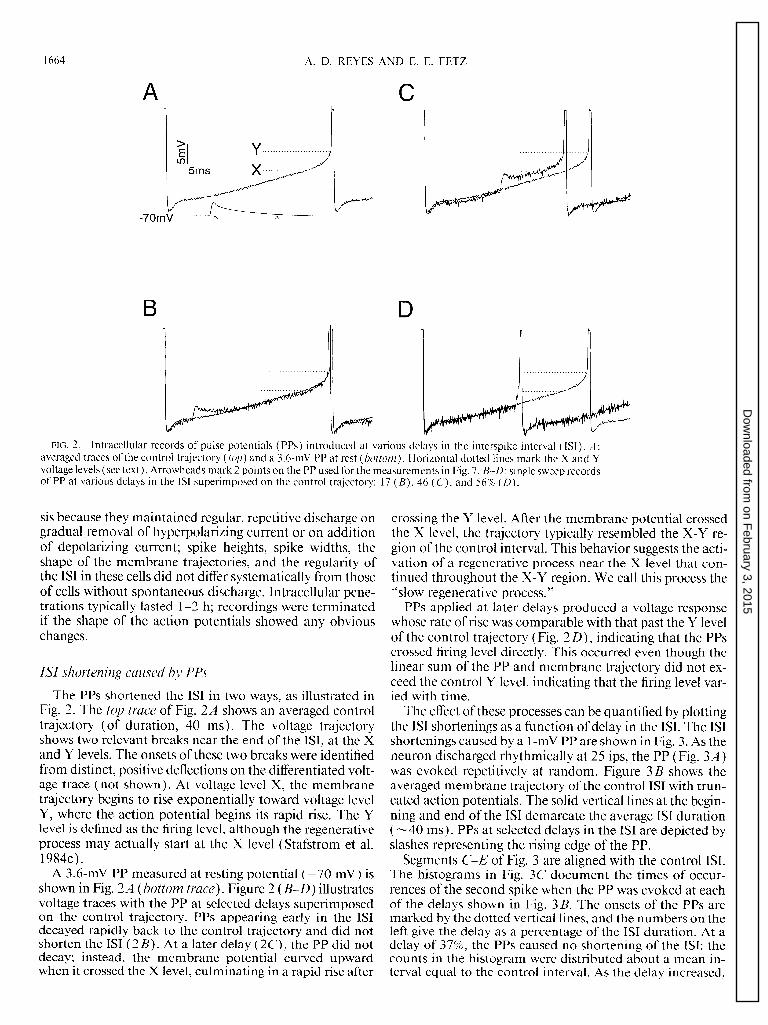
FIG. 2. Intracellular records of pulse potentials (PPs) introduced at various delays in the interspike interval (ISI). A : averaged traces of the control trajectory (top) and a 3.6-mV PP at rest (bottom). Horizontal dotted lines mark the X and Y voltage levels (see text). Arrowheads mark 2 points on the PP used for the measurements in Fig. 7. B-D: single sweep records of PP at various delays in the IS1 superimposed on the control trajectory: 17 (B), 46 ( C), and 56% (n).
sis because they maintained regular, repetitive discharge on gradual removal of hyperpolarizing current or on addition of depolarizing current; spike heights, spike widths, the shape of the membrane trajectories, and the regularity of the IS1 in these cells did not differ systematically from those of cells without spontaneous discharge. Intracellular pene- trations typically lasted l-2 h; recordings were terminated if the shape of the action potentials showed any obvious changes.
ISI shortening caused by PPs
The PPs shortened the ISI in two ways, as illustrated in Fig. 2. The top trace of Fig. 2A shows an averaged control trajectory (of duration, 40 ms). The voltage trajectory shows two relevant breaks near the end of the ISI, at the X and Y levels. The onsets of these two breaks were identified from distinct, positive deflections on the differentiated volt- age trace (not shown). At voltage level X, the membrane trajectory begins to rise exponentially toward voltage level Y, where the action potential begins its rapid rise. The Y level is defined as the firing level, although the regenerative process may actually start at the X level (Stafstrom et al. 1984c).
A 3.6-mV PP measured at resting potential (-70 mV) is shown in Fig. 2A (bottom trace). Figure 2 (B-D) illustrates voltage traces with the PP at selected delays superimposed on the control trajectory. PPs appearing early in the IS1 decayed rapidly back to the control trajectory and did not shorten the IS1 (2 B). At a later delay (2C), the PP did not decay; instead, the membrane potential curved upward when it crossed the X level, culminating in a rapid rise after
crossing the Y level. After the membrane potential crossed the X level, the trajectory typically resembled the X-Y re- gion of the control interval. This behavior suggests the acti- vation of a regenerative process near the X level that con- tinued throughout the X-Y region. We call this process the “slow regenerative process.”
PPs applied at later delays produced a voltage response whose rate of rise was comparable with that past the Y level of the control trajectory (Fig. 2 D), indicating that the PPs crossed firing level directly. This occurred even though the linear sum of the PP and membrane trajectory did not ex- ceed the control Y level, indicating that the firing level var- ied with time.
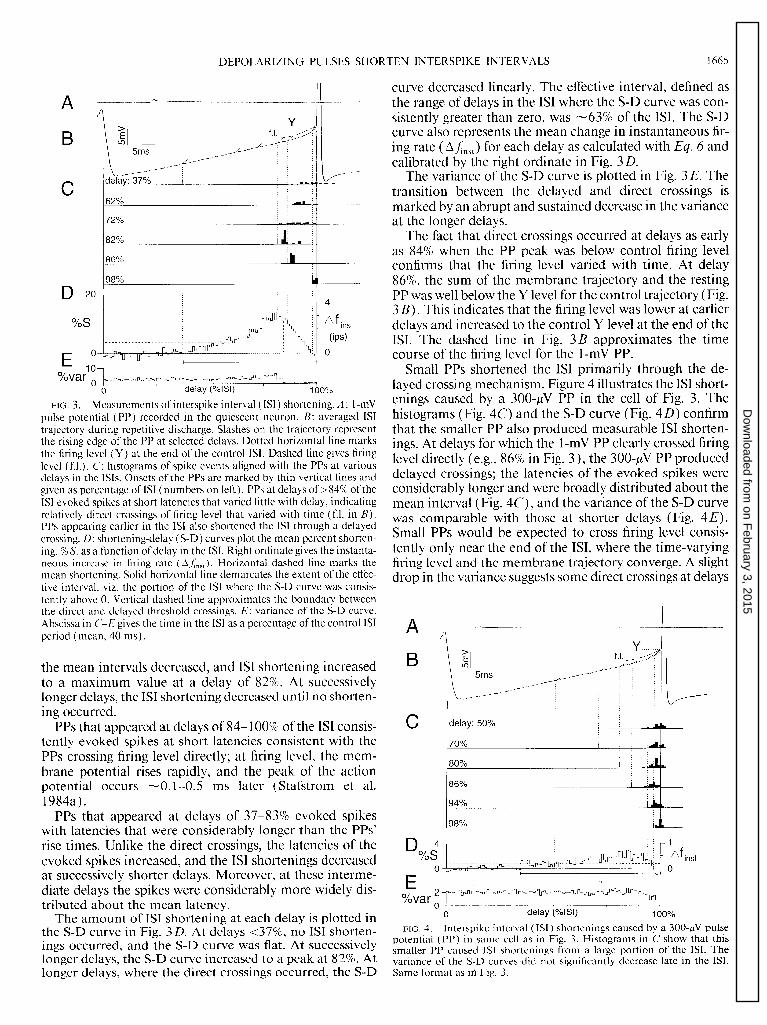
The effect of these processes can be quantified by plotting the IS1 shortenings as a function of delay in the ISI. The IS1 shortenings caused by a 1 -mV PP are shown in Fig. 3. As the neuron discharged rhythmically at 25 ips, the PP (Fig. 3A) was evoked repetitively at random. Figure 3 B shows the averaged membrane trajectory of the control IS1 with trun- cated action potentials. The solid vertical lines at the begin- ning and end of the IS1 demarcate the average IS1 duration ( ~40 ms) . PPs at selected delays in the IS1 are depicted by slashes representing the rising edge of the PP.
Segments C-E of Fig. 3 are aligned with the control ISI. The histograms in Fig. 3C document the times of occur- rences of the second spike when the PP was evoked at each of the delays shown in Fig. 3 B. The onsets of the PPs are marked by the dotted vertical lines, and the numbers on the left give the delay as a percentage of the IS1 duration. At a delay of 37%, the PPs caused no shortening of the ISI: the counts in the histogram were distributed about a mean in- terval equal to the control interval. As the delay increased,
on February 3, 2015
Dow
nloaded from
DEPOLARIZING PI J LSES SHORTEN INTERSPIKE INTERVALS 1665
A A
B \k- /
I C : : : :
62% : : :
72% : .
82%
86%
98% I
/lf inst
(ips)
0
FIG. 3. Measurements of interspike interval (ISI) shortening. A : I-mV pulse potential (PP) recorded in the quiescent neuron. B: averaged IS1 trajectory during repetitive discharge. Slashes on the trajectory represent the rising edge of the PP at selected delays. Dotted horizontal line marks the firing level (Y) at the end of the control ISI. Dashed line gives firing level (f.1.). C: histograms of spike events aligned with the PPs at various delays in the ISIS. Onsets of the PPs are marked by thin vertical lines and given as percentage of IS1 (numbers on left). PPs at delays of >84% of the IS1 evoked spikes at short latencies that varied little with delay, indicating relatively direct crossings of firing level that varied with time (f.1. in B). PPs appearing earlier in the IS1 also shortened the IS1 through a delayed crossing. D: shortening-delay (S-D) curves plot the mean percent shorten- ing, % S, as a function of delay in the ISI. Right ordinate gives the instanta- neous increase in firing rate (AL& Horizontal dashed line marks the mean shortening. Solid horizontal line demarcates the extent of the effec- tive interval, viz, the portion of the IS1 where the S-D curve was consis- tently above 0. Vertical dashed line approximates the boundary between the direct and delayed threshold crossings. E: variance of the S-D curve. Abscissa in C-E gives the time in the IS1 as a percentage of the control ISI period (mean, 40 ms).
the mean intervals decreased, and IS1 shortening increased to a maximum value at a delay of 82%. At successively longer delays, the IS1 shortening decreased until no shorten- ing occurred.
PPs that appeared at delays of 84- 100% of the IS1 consis- tently evoked spikes at short latencies consistent with the PPs crossing firing level directly; at firing level, the mem- brane potential rises rapidly, and the peak of the action potential occurs -0.1-0.5 ms later (Stafstrom et al. 1984a).
PPs that appeared at delays of 37-83% evoked spikes with latencies that were considerably longer than the PPs’ rise times. Unlike the direct crossings, the latencies of the evoked spikes increased, and the ISI shortenings decreased at successively shorter delays. Moreover, at these interme- diate delays the spikes were considerably more widely dis- tributed about the mean latency.
The amount of IS1 shortening at each delay is plotted in the S-D curve in Fig. 3D. At delays <37%, no IS1 shorten- ings occurred, and the S-D curve was flat. At successively longer delays, the S-D curve increased to a peak at 82%. At longer delays, where the direct crossings occurred, the S-D
curve decreased linearly. The effective interval, defined as the range of delays in the IS1 where the S-D curve was con- sistently greater than zero, was -63% of the ISI. The S-D curve also represents the mean change in instantaneous fir- ing rate (AA,,,) for each delay as calculated with Eq. 6 and calibrated by the right ordinate in Fig. 3 D.
The variance of the S-D curve is plotted in Fig. 3 E. The transition between the delayed and direct crossings is marked by an abrupt and sustained decrease in the variance at the longer delays.
The fact that direct crossings occurred at delays as early as 84% when the PP peak was below control firing level confirms that the firing level varied with time. At delay 86%, the sum of the membrane trajectory and the resting PP was well below the Y level for the control trajectory (Fig. 3 B). This indicates that the firing level was lower at earlier delays and increased to the control Y level at the end of the ISI. The dashed line in Fig. 3B approximates the time course of the firing level for the 1-mV PP.
Small PPs shortened the IS1 primarily through the de- layed crossing mechanism. Figure 4 illustrates the IS1 short- enings caused by a 300~PV PP in the cell of Fig. 3. The histograms (Fig. 4C) and the S-D curve (Fig. 4 D) confirm that the smaller PP also produced measurable IS1 shorten- ings. At delays for which the 1-mV PP clearly crossed firing level directly (e.g., 86% in Fig. 3), the 300~PV PP produced delayed crossings; the latencies of the evoked spikes were considerably longer and were broadly distributed about the mean interval (Fig. 4C), and the variance of the S-D curve was comparable with those at shorter delays (Fig. 4E). Small PPs would be expected to cross firing level consis- tently only near the end of the ISI, where the time-varying firing level and the membrane trajectory converge. A slight drop in the variance suggests some direct crossings at delays
A
B 1 Lo- : : : :
5ms : : : :
\ 141.
: : : : : : ; :
C delay: 50%
70%
: : 80% I ; &ill& : f : : 86% I &. .
94%
98%
delay (%ISI)
FIG. 4. Interspike interval (ISI) shortenings caused by a 300-PV pulse potential (PP) in same cell as in Fig. 3. Histograms in C show that this smaller PP caused IS1 shortenings from a large portion of the ISI. The variance of the S-D curvesdid not significantly decrease late in the ISI. Same format as in Fig. 3.
on February 3, 2015
Dow
nloaded from

1666 A. D. REYES AND E. E. FETZ
of >96%. However, measurement of IS1 shortenings at the end of the IS1 is compromised by unavoidable measure- ment errors (see METHODS).
The effective interval varied surprisingly little with PP amplitude; in this cell, the effective intervals for the 1-mV and 300-PV PP were, respectively, 63 and 66% of the ISI. The variation of the S-D curve parameters with PP ampli- tude is further documented in the companion paper (Reyes and Fetz 1993).
Comparison of PPs and stimulus-evoked EPSPs PPs and stimulus-evoked EPSPs shortened the IS1 in a
similar manner. Figure 5 shows the ISI shortenings caused by a 2.6-mV PP (A) and a 2.2-mV EPSP (B) in a cell firing at 20 ips. At delays longer than 70%, the spike latencies (Fig. 5, AC and Bc) were comparable with the potentials’ rise times. At delays shorter than 70%, the latencies in- creased progressively, and there was a marked increase in the variance in the S-D curve (Fig. 5, Ae and Be). The effective intervals were large in both cases (83% for the PP and 7 1% for the EPSP). Similar comparisons were made for 13 other EPSP-PP pairs documented in the same cells.
To make quantitative comparisons between PPs and EPSPs, we calculated the following parameters from the S-D curves of 14 pairs of PPs and EPSPs: 1) mean shorten- ing, S, calculated from the mean of the S-D curve; 2) maxi- mum IS1 shortening, Smax, calculated from the peak of the S-D curve; and 3) the effective interval. Each pair was ob- tained from the same cell, and the EPSP and PP had compa- rable amplitudes. There were no systematic differences in S (Fig. 6A), Smax (Fig. 6 B), or the effective interval (Fig. 6C) for the EPSPs (w) and PPs ( q Q. The delays at which the transition from direct to delayed crossings occurred, as de- termined from the variance curves, were similar in 13 of 14 pairs (Fig. 6 0). In several pairs the variance of the S-D curve tended to be larger for EPSPs than for PPs.
Thus, to a first approximation, the PPs effectively mim- icked the IS1 shortenings produced by EPSPs.
Changes in the PP shape during repetitive firing
Some properties of the ionic conductances underlying IS1 shortenings may be inferred from the changes in the PP shapes with delay in the ISI. The difference between the control trajectory and the trajectories with PPs at various delays in the IS1 was quantified for the PP in Fig. 2. Figure 7 plots the values of two points on the PP (arrowheads in Fig. 2A), corresponding to 1.4 ms (near the PP peak) and 20 ms (at the PP decaying edge) from the onset of the PP as a function of delay in the ISI. The dashed horizontal lines in each graph mark the values of these points at resting poten- tial (-70 mV) in the quiescent neuron. The difference be- tween the membrane potential and resting potential at each delay is also shown on the abscissa.
At subthreshold levels, the height of the PP increased, and the decay rate decreased as a function of delay. For delays of t25%, the amplitude of the voltage response near the PP peak was smaller than that of the PP at rest (Fig. 7A ) ; at these delays the trajectory voltage was <4 mV above rest. With increases in delay, the PP amplitude increased almost linearly, eventually exceeding the amplitude of the PP at rest. At delavs of >50% ( >6 mV above rest). the
IO%, I . . C :: r.-r,
40% ::
I I :: ; :: : :. 4 - ::
55% I :: ,-
60%
65%
75% h :
I 95% ;&
I I e - %“a:; -; __rv I I I 1
0 delay (%ISI) 100%
B a
b
C
y&2 L-‘- I II 10% :
::: : .42% ::: I I ,:' 57%
,:I
62%
67%
e 2. u
%var
0 =:?-:I_I’,, -b--J
0 delay (%lSl) 100%
FIG. 5. Comparison of interspike interval (ISI) shortening produced by a pulse potential (PP) and a stimulus-evoked excitatory postsynaptic potential (EPSP) in the same cell. A : IS1 shortenings caused by a 2.6-mV PP. B: IS1 shortening caused by a comparable 2.2-mV stimulus-evoked EPSP obtained in the same cell. Same format as in Fig. 3.
current pulses generated spikes, precluding measurement of PP amplitudes.
Similar changes of amplitude occurred for the decaying edge of the PP. As can be seen in Fig. 7 B, the difference between the PP decaying edge and the control trajectory was negative at delays of ~20%. These negative values are manifested as transient undershoots in the trajectories (Fig. 2 B). The differences were positive at delays of >20% and were greater than the corresponding amplitudes of the PP at rest.
Some of these changes in the PP shape could also be observed with steadv depolarization in the quiescent cell.
on February 3, 2015
Dow
nloaded from

DEPOLARIZING PULSES SHORTEN INTERSPIKE INTERVALS 1667
A 8 C 100
6 5 tii n 80
S 4 Et5 .- - 60
(ms) g5 40
2 zq g”
z 20
0 1 2 3 4 5 6 7 8 91011121314
Q) 0 1 2 3 4 5 6 7 8 91011121314
EPSP-PP pairs EPSP-PP pairs
- 1 2 3 4 5 6 7 8 9 1011121314 - 1 2 3 4 5 6 7 8 91011121314
EPSP-PP pairs EPSP-PP pairs
pair # 1 2 3 4 5 6 7 8 9 IO 11 12 13 14 , . EPSP (mv) 0.8 0.9 0.9 1.0 1.3 1.3 1.3 1.6 1.6 1.7 2.2 2.4 2.6 3.2 Ezl PP 0.8 1.0 1.1 0.9 1.3 1.5 1.4 1.7 1.8 1.8 2.6 2.1 2.4 3.6
FIG. 6. Comparison of effects of EPSPs and PPs in the same cells. S-D curves were obtained from paired EPSPs (w) and PPs ( q ) with comparable amplitudes, as tabulated at bottom. A : mean shortening, S, calculated from the mean of the S-D curve. B: maximum IS1 shortening calculated from the peak of the S-D curve. C: effective interval. D: delay at which the transition from direct to delayed crossings occurred. *denotes cases without direct crossings. For abbreviations, see legends of Figs. 3 and 5.
Figure 8 illustrates the PP shape obtained at rest, at 5 mV Cell-to-cell variations in firing level above, and at 8 mV below the resting level. When the cell was depolarized, the PP increased in amplitude, and the The manifestation of the slow regenerative process in the decay rate decreased. With the cell hyperpolarized, the de- X-Y curvature differed substantially between cortical neu- cay increased, but the amplitude did not drop. Careful in- Tons. For all recorded cells, the difference in voltage spection suggests that the decaying edge of the PP decay between the X and Y levels ranged from 0.0 to 9.7 mV undershot the holding potential. (mean t SD 4.0 t 2.3 mV). In general, the difference in
A 5 O- 1.4 ms after onset of PP . El
4.0-
0 I r I ' I ' I ' 1
0 IO 20 30 40 50 delay (%lSl)
I I I I I I 12 3 4 5 6
B 3 o 20 ms after onset of PP . 1
-1.0
-2.0: 0 IO 20 30 40
delay (%ISI) r I I I 1 12 3 4 5
membrane potential (mV above rest) membrane potential (mV above rest)
FIG. 7. Quantitative measures of pulse potential (PP) amplitude at various delays in interspike interval (ISI), The control IS1 trajectory was subtracted from single traces of trajectories with PPs. Amplitudes of 2 points on the PP (arrow- heads in Fig. 2A) were measured as a function of delay in the ISI. A : PP amplitude 1.4 ms after the onset, near the PP peak. Lower abscissa shows deviation of membrane trajectory above rest at different delays in the ISI. Dashed horizontal line indicates amplitude measured at rest; solid line indicates best-fit line through data points (slope, 0.5 mV/%delay; r = 0.76). B: measurements taken 20 ms after the pulse onset. Regression line has a slope of 0.7 mV/%delay (Y = 0.77).
on February 3, 2015
Dow
nloaded from

1668 A. D. REYES AND E. E. FETZ
5mV above rest >
5
1 Oms
FIG. 8. Shapes of pulse potential (PP) at different membrane poten- tials in the quiescent neuron. PP shown at rest, 8 mV below, and 5 mV above rest. The PP amplitude increased and the decay rate decreased with depolarization.
the voltage levels increased proportionately with the time difference. The magnitude of the X-Y curvature was not significantly correlated with the input resistance, spike width, or the shape of the afterhyperpolarization.
ti Cells with larger X-Y curvatures showed a greater separa-
on be tween the time-varying firing level and the mem- brane trajectory. Figure 9 illustrates representative S-D curves obtained from cells with small (A) and large (B) X-Y curvatures. The PPs used in both cells were of compa- rable amplitude ( - 800 pV). The cell with the smaller cur- vature produced clear direct crossings at delays of >80% as indicated by the linear portion of the S-D curve and the reduced variance (Fig. 94 bottom traces). Such distinct direct crossings were not produced in the cell with the larger X-Y curvature (Fig. 9 B) ; there was no clear decrease in the variance of the S-D curve at the later delays (Fig. 9 B, bot- tom trace). However, in the same cell a 3-mV PP produced direct crossings at delays >55%, as indicated by the abrupt decrease in the variance at these delays (Fig. SC, bottom trace). Thus the difference between the time-varying firing
A------L B------L
delay (%ISI) delay (%lSl)
yo;o~~~~~
%var2’* 0 f Q delay (%lSl) 100
FIG. 9. Relation between time course of firing level and shortening-de- lay (S-D) curve. A : cell with small X-Y curvature. A 0.8-mV pulse poten- tial ( PP; top trace) caused clear direct crossings at delays >80% of the interspike interval as indicated by linear portion of S-D curve (3rd trace) and abrupt decrease in variance (bottom trace). B and C: cell with a large X-Y curvature. B: a 0.8-mV PP caused no clear direct crossings as indi- cated by the relatively flat variance curve (bottom trace). C: in the same cell as in B, a 3-mV PP caused clear direct crossings at delays of >55%.
B ,. lengthened ISI
%S -wu n l-l r -10 - I I I I
0 delay (%ISI) 100
FIG. 10. Lengthenings of the interval following the shortened interval. A : shortening-delay (S-D) curve obtained with the 3.6-mV pulse potential (PP) in Fig. 2. B: S-D curves obtained for the interval following the PP- shortened interspike interval (ISI). Abscissa shows delays at which the PP appeared in the previous ISI. Negative values on the ordinates represent IS1 lengthenings.
level and the trajectory was generally greater for cells with larger X-Y curvatures.
Lengthening of ISI following shortened interval
In motoneurons, stimulus-evoked EPSPs introduced. in repetitively discharging cells shortened the IS1 but length- ened the following interval ( Schwindt and Calvin 1973). To determine whether PPs had similar effects on neocorti- cal neurons, we compared the ISIS immediately following a shortened IS1 with the control interval. Figure 1OA illus- trates the S-D curve obtained for a 3.6-mV PP. Figure 10 B shows the associated changes for the intervals immediately following the PP-shortened intervals as a function of the delays at which the PP appeared in the shortened interval. The negative values in the S-D curve of Fig. 10 B indicate that the subsequent ISIS were lengthened. As with most cells, the greatest lengthenings occurred in association with the largest shortening in the preceding interval. In this case the mean lengthening was - 19% of the mean shortening produced.
Computer simulations
To gain insights into the possible ionic mechanisms un- derlying the delayed crossings and the time-varying firing level, we simulated the effects of active membrane conduc- tances on the responses of a model neuron to a PP. Our main goal was to determine general features that might be essential for the time-varying firing level and the delayed crossings. The model (described in the APPENDIX) incorpo- rated a sodium conductance (gNa) that produced the up- stroke of the action potential and a potassium conductance (gk) that repolarized the membrane. We hypothesized that the increase in the firing level was due to a decrease in the net inward current. This could be caused by activation of an outward current or by inactivation of an inward current. We chose the latter mechanism and used a hypothetical sodium conductance, g,, to model the decrease in inward current toward the end of the ISI. g, kinetics were similar to those of gNa except that the voltage relations of the Hodgkin
on February 3, 2015
Dow
nloaded from

DEPOLARIZING PULSES SHORTEN INTERSPIKE INTERVALS 1669
mV 1
k
35 ms
1
C I Na I O- I I, I
nA I I
-lOO- X
I
6 delay (% of ISI) 160
FIG. 1 1. Interspike interval (ISI) shortenings caused by pulse poten- tials (PPs) in a computer model of a neuron. A: membrane trajectories during repetitive discharge (spikes truncated). The model displayed an exponential rise in the membrane trajectory in the X-Y interval. Trajecto- ries obtained with a PP (shown at rest in the bottom trace) at 3 delays are superimposed on the control trajectory. The model displayed a time-vary- ing firing level (f.1.). B: ionic currents underlying features of the control trajectory. A sodium current (I,) caused the exponential rise in the X-Y region, whereas a 2nd sodium current ( INa) with a higher threshold caused the upstroke of the action potential at the Y level. A potassium current (&) repolarized the membrane. C: magnitude of Ix produced by the PP at the delays shown in A. D: histograms showing the spikes evoked by PPs at various delays.
and Huxley ( 1952) gating parameters were adjusted so that g, activated at a lower potential than g,, and exhibited significant inactivation late in the IS1 (see APPENDIX). Fig- ure 11 illustrates the voltage trajectories (A ) and underlying ionic currents (B) when a depolarizing steady current was applied. I, is activated near the X level and causes the expo- nential-like increase in the membrane potential. This is fol- lowed by a rapid rise in the membrane potential, which coincides with the onset of INa at the Y level.
This model displayed responses similar to those of corti- cal neurons when probed with PPs, as shown by the super- imposed traces in Fig. 11 A. Late in the IS1 (e.g., delays 2 and 3) the PPs evoked short-latency spikes, whereas at ear- lier delays (e.g., delay 1) they evoked long-latency spikes. At delays of >60%, the latencies of the evoked spikes varied little with delay (Fig. 110). At delays of <60%, the laten- ties increased systematically with decreasing delays.
PPs applied at early delays ( e.g., delay 1) produced a stereotyped exponential-like rise in membrane potential near the X level that resembled the control ISI. Figure 1lC shows the variation of 1X generated by the PPs at the differ- ent delays. I, produced by the control IS1 and by the PP applied at delay 1 was small compared with that at delay 2
or 3 because the slowly rising potential allowed significant inactivation to develop. The larger 1X at delay 2 accelerated the rate of rise of the membrane trajectory. Firing level, defined as the point where the membrane potential rises rapidly, varied with time as depicted by the dashed line in Fig. 11 A.
In this model, the trajectory in the X-Y region was deter- mined by g,, but a simpler model consisting of only gNa and gk exhibits similar slow rises (Reyes 1990). Like the more complex model above, this simpler model fired repetitively, had an X-Y region, exhibited delayed crossings when the PPs crossed the X level, and produced S-D curves with large effective intervals, but did not exhibit a time-varying firing level.
DISCUSSION
The primary aim of this study was to examine the effects of transient depolarizing potentials on the firing rate of cat neocortical neurons. Delivered over a wide range of delays, these transients shortened the ISIS in ways that depended on the delay. Although we did not identify the recorded cells morphologically, we presume that the size of the elec- trode used ( lo-20 Mfi) and the placement of the electrode in layer V biased the recordings to the large layer V pyrami- dal cells. This assumption is supported by the observations of Ghosh and Porter ( 1988) and Spain et al. ( 199 lb), who used electrodes with comparable resistances to record and stain cells from monkey and cat sensorimotor cortex. In the former study, 92 of the 93 impaled neurons were pyramidal in shape; in the latter, all ( 19 / 19) were pyramidal. The input resistances and spike heights of our recorded cells were also within the range of those measured in morphologi- cally identified layer V pyramidal cells (Stafstrom et al. 1984~).
We used brief PPs to mimic the effects of EPSPs. Because the PPs were injected at the soma, they mimicked the tran- sient depolarizations produced by synaptic currents that reach the soma regardless of their origin. Indeed, the PPs shortened the IS1 in a manner very similar to that of stimu- lus-evoked EPSPs. Quantitative measures of their asso- ciated S-D curves did not reveal any systematic differences in the mean and maximum IS1 shortenings and duration of effective intervals. The latencies of the evoked spikes tended to have larger variance for EPSPs than for PPs, possi- bly because the pulses were injected under current-clamp conditions, preventing fluctuations in the amplitude of the current pulse. The shape of the composite EPSP, on the other hand, may fluctuate because of variations in the num- ber of afferent fibers activated and the amount of transmit- ter released.
The PPs shortened the ISIS in two ways. First, they could cross firing level directly to evoke short-latency spikes. These direct crossings occurred late in the ISI, where the difference between the membrane trajectory and the time- varying firing level was less than the PP amplitude. Al- though more experiments using larger PPs are needed to trace the full time course of the firing level at earlier delays, S-D curves obtained with the 3.0-mV PP (Fig. SC) and the 3.6-mV PP (Fig. 1 OA ) suggest the existence of lowered fir- ing level at delays as early as 55% of the ISI. Such time-vary-
on February 3, 2015
Dow
nloaded from

1670 A. D. REYES AND E. E. FETZ
ing firing levels are not unique to pyramidal cells; repeti- tively discharging motoneurons exhibited similar time-var- ying firing levels when probed with stimulus-evoked EPSPs (Calvin 1974).
Second, PPs that did not cross firing level directly could produce IS1 shortenings through delayed crossing. Spikes evoked by delayed crossings had latencies that were longer than the rise times of the PPs and considerably more vari- able than latencies associated with direct crossings. The magnitudes of the IS1 shortenings were greater than would be predicted from direct threshold crossings produced by a linear sum of the decaying PP and the rising membrane trajectory, indicating the involvement of an active, regener- ative process at potentials below firing level.
Properties ofionic conductances underlying ISI shortenings
PPs introduced early in the ISI, during the afterhyperpo- larization, produced voltage responses that were smaller than those evoked by the same current pulse at rest. This reduced amplitude is probably due to the large conductance increases in the afterhyperpolarization following the action potential (Gustafsson 1974; Schwindt and Calvin 1973; Schwindt et al. 1988b,c; Spain et al. 199 la). The under- shoots following the PP at these delays suggest reduction of the net inward current, possibly through the deactivation of the anomalous rectifier (Schwindt et al. 1988a; Spain et al. 1987) or the activation of a fast transient potassium current (Spain et al. 1991a).
At longer delays, the PP amplitudes increased, and decay rates decreased. Similar changes were also observed in the quiescent neuron when the membrane potential was depo- larized. It is likely that later in the ISI, when the membrane potential was more depolarized, the PPs activated the per- sistent sodium current ( INap) (Stafstrom et al. 1984c, 1985). INap is first activated - 5- 10 mV above the resting potential and has sufficiently rapid kinetics (time-to-peak 54 ms) to be significantly activated by the brief PPs. Simi- lar changes have been observed in unitary EPSPs in quies- cent pyramidal cells in layer III of rats (Thomson et al. 1988 ) and in Betz cells in layer V of cats ( Stafstrom et al. 1985) during depolarization. This mechanism appears to be less pronounced in motoneurons because unitary EPSPs at the end of the IS1 trajectory of rhythmically firing moto- neurons resemble those at rest (Cope et al. 1987 ) and uni- tary Ia EPSPs did not show comparable increases with steady depolarization (Edwards et al. 1976 ) .
The slow regenerative process triggered near the X level explains many features of the delayed IS1 shortenings caused by PPs at intermediate delays. Because this process was slow, the latencies of the evoked spikes were greater than the PP rise times. The latency increased as the delay was shortened because successively longer times were re- quired for the membrane potential to cross the X level. The relatively large variance in the spike latency associated with delayed crossings is understandable because the slow rise of the membrane potential would make the eventual crossing of the firing level susceptible to the cumulative effects of synaptic noise. In contrast, PPs that cross firing level di- rectly produce a very rapid rise in voltage, minimizing the
effect of noise. Computer simulations suggest that the slow regenerative process can be accounted for by the properties of a sodium conductance at the cell soma. In these neocorti- cal neurons the persistent sodium current may also contrib- ute to this slow regenerative process (Stafstrom et al. 1984c, 1985).
At the largest delays the PP crossed the firing level (the Y level) directly. Time-dependent changes in the firing level have been observed during ramp changes in membrane po- tential of pyramidal cells (Stafstrom et al. 1984~) and moto- neurons (Calvin 1974). In those studies, slower rises in the membrane potential were associated with a greater increase in the firing level. Such changes were proposed to be due to the inactivation of the initial segment sodium conductance, which presumably reduced the net inward current (Schwindt and Crill 1982). In repetitively firing cells, the rise of the membrane trajectory may be slow enough to allow inactivation to develop during the ISI. Consequently, PPs applied at relatively later delays would activate a smaller current in the initial segment than the same PP applied earlier in the ISI, when inactivation has not yet developed significantly.
We modeled the time-varying threshold with a rapidly inactivating sodium current that behaved much like one found in the motoneuron initial segment. Its inactivation progressively decreased the net inward current toward the end of the ISI. In principle, a voltage- and time-dependent activation of an outward current can also reduce the net inward current near the end of the ISI. In these neocortical neurons, a fast-activating, transient potassium current ( Spain et al. 199 1 a) is activated - 13 mV positive to rest and may contribute to the decrease in the net inward current before the Y level. Although the persistent sodium current is active in the X-Y interval, it would not be ex- pected to produce a time-varying firing level, because acti- vation, and hence the net inward current, continues to in- crease with depolarization ( Stafstrom et al. 1984c, 1985 ).
The lengthenings of the ISIS following the PP-shortened IS1 are likely due to the summated effects of potassium conductances underlying the slow afterhyperpolarizations (Schwindt et al. 1988b,c; Spain et al. 199 la,b). This is con- sistent with our observation that the greatest lengthenings followed the greatest IS1 shortenings.
Functional signifjcance
The combination of the time-varying firing level and the slow regenerative process contribute substantially to the ability of PPs and EPSPs to shorten the IS1 and increase firing rate. The time-varying firing level enabled the PP to shorten the IS1 through direct crossings over a larger pro- portion of the trajectory than predicted by models in which PP amplitude must exceed control firing levels. Over this range the short latency of directly evoked spikes leads to significant IS1 shortenings. In addition, the slow regenera- tive process enabled the PPs to produce shortenings through delayed crossings from a large portion of the ISI. The sum of these effects determines the net effective inter- val, which determines the percentage of trials in which a random PP or EPSP will cause an IS1 shortening. We found
on February 3, 2015
Dow
nloaded from

FIG. Al. Hodgkin and Huxley parameters of the computer model. A and B: respectively, the activation and inactivation parameters of the so- dium conductance (g&. Dotted curves show the parameters for a 2nd sodium conductance, g,. C: activation parameters of the potassium con- ductance, gk.
0.8-
()6- ..*” m
O"o.4-
DEPOLARIZING PI. LSES SHORTEN INTERSPIKE INTERVALS 1671
r 0.4
0.3
‘I;rn OS2 (ms)
0.1
&aK 0 = GNa m"K WV, 0
gdv, 0 = Gn4K 0
gx(K t> = G,m3(K OW> 0 (AU
where G,, , Gk, and GX are the maximum conductances. The activation (m, n) or inactivation (h) parameters varied with volt- age and time according to
h 0.6
OOo.4
0.2
0.0
Voltage (mV)
L d;ldt = I;( V, ~0) - j( V, t)l/q( v) (A2)
where j = m, h, or II and 7; is the time constant of activation or inactivation. Figure A 1, A and B, plots the variation of the activa- tion (m) and inactivation (h) parameters with voltage for gNa. The activation parameters for gX were identical to gNa but shifted in the negative direction along the voltage axis by 15 mV (dotted curves), and the inactivation parameter was shifted along the volt- age axis by 20 mV. Figure 12C plots the variation of the gK activa-
6
5
4
‘h 3 (ms
2
1
0 0 50 100 150
Voltage (mV)
n 0.6
00 0.4
0.2
0.0
2, (ms)
0 50 100 Voltage (mV)
that effective intervals typically exceeded one-half the ISI, indicating that a PP or EPSP, if introduced repetitively and randomly to a discharging cell, has a high probability of shortening the ISI. The following paper (Reyes and Fetz 1993) examines the relation between PP parameters and net increases in the neuronal firing rate.
APPENDIX
The computer model was a modified version of a motoneuron model developed by P. C. Schwindt (personal communication). The neuron was assumed to be isopotential because neocortical cells were found to be electrotonically short (Stafstrom et al. 1984b) ; simulations with a non-isopotential model [a sphere with attached cylinder (Reyes 1990)] produced similar results. Calcu- lation of the membrane response to current input is similar to that outlined by Connors and Stevens ( 197 1).
The model included 1) a sodium conductance ( gNa), which pro- duced the upstroke of the action potential; 2) a potassium conduc- tance (gk), which repolarized the cell; and 3) another hypothetical sodium conductance ( gX ), which generated the time-varying fir- ing level. These ionic conductances were described by the use of Hodgkin and Huxley ( 1952) kinetics and varied with voltage and time as
tion resti
parameters ng potential.
with voltage. All voltages are shown relative to
We gratefully acknowledge the generous help of Drs. Peter Schwindt and Bill Spain with experimental technique and invaluable discussions. We also thank K. Elias for editorial assistance, L. Shupe for computer pro- gramming, and G. Hinz for technical assistance.
This research was supported by National Institutes of Health Grants NS- 12542 and RR-00 166.
Address for reprint requests: A. D. Reyes, Virginia Merrill Bloedel Hear- ing Research Center RL-30, University of Washington, Seattle, WA 98 195.
Received 17 August 1992; accepted in final form 18 December 1992.
REFERENCES
CALVIN, W. H. Three modes of repetitive firing and the role of threshold time course between spikes. Bruin Rex 69: 34 l-346, 1974.
CALVIN, W. H. AND STEVENS, C. F. Synaptic noise and other sources of randomness in motoneuron interspike intervals. J. Neurophysiol. 3 1: 574-587,1968.
CALVIN, W. H. AND SYPERT, G. W. Fast and slow pyramidal tract neurons: an intracellular analysis of their contrasting repetitive firing properties in the cat. J. NeurophjJsiol. 39: 420-434, 1976.
CONNORS, J. A. AND STEVENS, C. F. Prediction of repetitive firing be- haviour from voltage clamp data on an isolated neurone soma. J. Phys- iol. Land. 213: 31-53, 1971.
COOMBS, J. S., CURTIS, D. R., AND ECCLES, J. C. The generation of im- pulses in motoneurones. J. Physiol. Land. 139: 232-249, 1957.
COPE, T. C., FETZ, E. E., AND MATSUMURA, M. Cross-correlation assess- ment of synaptic strength of single Ia fibre connections with triceps surae motoneurones in cats. J. Physiol. Lond. 390: 16 l-l 88, 1987.
CREUTZFELDT,~. D., KUHNT, U., AND BENEVENTO, L.A.Anintracellu- lar analysis of visual cortical neurones to moving stimuli: responses in a co-operative neuronal network. Exp. Brain Res. 2 1: 25 l-274, 1974.
EDWARDS, F.R., REDMAN,~. J., ANDWALMSLEY, B.Theeffectofpolariz- ing currents on unitary Ia excitatory post-synaptic potentials evoked in spinal motoneurones. J. Physiol. Lond. 259: 705-723, 1976.
FERSTER, D. Orientation selectivity of synaptic potentials in neurons of cat primary visual cortex. J. Neurosci. 6: 1284- 130 1, 1986.
FETZ, E. E. AND GUSTAFSSON, B. Relation between shapes of post-synaptic potentials and changes in firing probability of cat motoneurones. J. Physiol. Lond. 341: 387-410, 1983.
FETZ, E. E., TOYAMA, K., AND SMITH, W. Synaptic interactions between cortical neurons. In: Cerebra/ Cortex, edited by A. Peters and E. G. Jones. New York: Plenum, 199 1, vol. 9, p. l-47.
FUORTES, M. G. F., FRANK, K., AND BECKER, M. C. Steps in the produc- tion of motoneuron spikes. J. Gen. Physiol. 134: 45 l-470, 1957.
GHOSH, S. AND PORTER, R. Corticocortical synaptic influences on mor- phologically identified pyramidal neurones in the motor cortex of the monkey. J. Physiol. Lond. 400: 6 17-629, 1988.
GRANIT, R., KERNELL, D., AND LAMARRE, Y. Synaptic stimulation super- imposed on motoneurones firing in the ‘secondary range.’ J. Physiol. Lond. 187: 401-415, 1966.
GUSTAFSSON, B. (4fterhyperpolarization and the control of repetitive firing in spinal neurones of the cat. Acta Physiol. Stand. Suppl. 4 16, 1974.
on February 3, 2015
Dow
nloaded from

1672 A. D. REYES AND E. E. FETZ
GUSTAFSSON, B. AND MCCREA, D. Influence of stretch-evoked synaptic potentials on firing probability of cat spinal motoneurones. J. Physiol. Lond. 347: 43 l-45 1, 1984.
HODGKIN, A. L. AND HUXLEY, A. F. A quantitative description of mem- brane current and its application to conduction and excitation in nerve. J. Physiol. Lond. 116: 449-472, 1952.
KANG, Y., ENDO, K., AND ARAKI, T. Excitatory synaptic actions between pairs of neighboring pyramidal tract cells in the motor cortex. J. Neuro- physiol. 59: 636-647, 1988.
KOMATSU,Y.,NAKAJIMA,S.,TOYAMA,K.,ANDFETZ, E.E.Intracortical connectivity revealed by spike-triggered averaging in slice preparations of cat visual cortex. Brain Res. 442: 359-362, 1988.
MATSUMURA, M. Intracellular synaptic potentials of primate motor cortex neurons during volunatry movement. Brain Res. 163: 33-48, 1979.
REYES, A. D. Efects c$‘BriefDepolarizing Pulses on the Firing Rate @Cat Neocortical Neurons (PhD thesis). Seattle, WA: Univ. of Washington, 1990.
REYES, A. D. AND FETZ, E. E. Effects of depolarizing pulse potentials on the firing rate of cat neocortical neurons. Sot. Neurosci. Abstr. 15: 1309, 1989.
REYES, A. D. AND FETZ, E. E. Effects of transient depolarizing potentials on the firing rate of cat neocortical neurons. J. Neurophysiol. 69: 1672- 1682, 1993.
SCHWINDT, P. C. Membrane-potential trajectories underlying motoneu- ron rhythmic firing at high rates. J. Neurophysiol. 36: 435-449, 1973.
SCHWINDT, P. C. AND CALVIN, W. H. Nature of conductances underlying rhythmic firing in cat spinal motoneurons. J. Neurophysiol. 36: 955- 973, 1973.
SCHWINDT, P. C. AND CRILL, W. E. Factors influencing motoneuron rhythmic firing: results from a voltage-clamp study. J. Neurophysiol. 48: 875-890, 1982.
SCHWINDT, P. C., SPAIN, W. J., AND CRILL, W. E. Influence of anomalous rectifier activation on afterhyperpolarization of neurons from cat sen- sorimotor cortex in vitro. J. Neurophysiol. 59: 468-48 1, 1988a.
SCHWINDT, P. C., SPAIN, W. J., FOEHRING, R. C., STAFSTROM, C. E., CHUBB, M. C., AND CRILL, W. E. Multiple potassium conductances and their functions in neurons from cat sensorimotor cortex in vitro. J. Neurophysiol. 59: 424-449, 1988b.
SCHWINDT, P. C., SPAIN, W. J., FOEHRING, R. C., STAFSTROM, C. E., CHUBB, M. C., AND CRILL, W. E. Slow conductances in neurons from cat sensorimotor cortex in vitro and their role in slow excitability changes. J. Neurophysiol. 59: 450-467, 1988~.
SPAIN, W. J., SCHWINDT, P. C., AND CRILL, W. E. Anomalous rectification in neurons from cat sensorimotor cortex in vitro. J. Neurophysiol. 57: 1555-1576, 1987.
SPAIN, W. J., SCHWINDT, P. C., AND CRILL, W. E. Two transient potassium currents in layer V pyramidal neurones from cat sensorimotor cortex in vitro. J. Physiol. Lond. 434: 59 l-607, 199 la.
SPAIN, W. J., SCHWINDT, P. C., AND CRILL, W. E. Mechanisms underlying post-inhibitory excitation and inhibition in layer V pyramidal neurones from cat. J. Physiol. Land. 434: 609-626, 199 1 b.
STAFSTROM, C. E., SCHWINDT, P. C., CHUBB, M. C., AND GRILL, W. E. Properties of persistent sodium conductance and calcium conductance of layer V neurons from cat sensorimotor cortex in vitro. J. Neurophys- iol. 53: 153-169, 1985.
STAFSTROM,~. E., SCHWINDT, P.C., ANDCRILL, W.E.Repetitivefiringin layer V neurons from cat neocortex in vitro. J. Neurophysiol. 52: 264- 277, 1984a.
STAFSTROM,~. E., SCHWINDT, P.C., ANDCRILL, W.E.Cablepropertiesof layer V neurons from cat sensorimotor cortex in vitro. J. Neurophysiol. 52: 278-299, 1984b.
STAFSTROM,~. E., SCHWINDT, P.C., FLATMAN, J. A., ANDCRILL, W.E. Properties of subthreshold response and action potential recorded in layer V neurons from cat sensorimotor cortex in vitro. J. Neurophysiol. 52: 244-263, 1984~.
THOMSON, A.M., GIRDLESTONE, D., ANDWEST, D.C.Voltage-dependent currents prolong single-axon postsynaptic potentials in layer III pyrami- dal neurons in rat neocortical slices. J. Neurophysiol. 60: 1896-1907, 1988.
on February 3, 2015
Dow
nloaded from