TWENTIETH SESSION OF THE CARIBBEAN DEVELOPMENT AND ...
37
TWENTIETH SESSION OF THE m Êm CARIBBEAN DEVELOPMENT AND COOPERATION COMMITTEE 22-23 April 2004, St. Croix, United States Virgin Islands LIMITED LC/CAR/L.4 CDCC 20/Inf. 5 30 March 2004 ORIGINAL: ENGLISH MEETING THE CHALLENGES OF THE FTAA: TRADE TRENDS, EXPORT SPECIALIZATION PATTERNS AND REGIONAL INTEGRATION IN THE CARIBBEAN (including the case of the NICCS) This document has been reproduced without formal editing.
Transcript of TWENTIETH SESSION OF THE CARIBBEAN DEVELOPMENT AND ...

TWENTIETH SESSION OF THE m Ê m CARIBBEAN DEVELOPMENT AND COOPERATION COMMITTEE
22-23 April 2004, St. Croix, United States Virgin Islands
LIMITED LC/CAR/L.4 CDCC 20/Inf. 5 30 March 2004 ORIGINAL: ENGLISH
MEETING THE CHALLENGES OF THE FTAA:TRADE TRENDS, EXPORT SPECIALIZATION PATTERNS AND REGIONAL
INTEGRATION IN THE CARIBBEAN (including the case o f the NICCS)
This document has been reproduced without formal editing.

Table of Contents
1. The major stylised facts of regional integration.............................................................. 2
2. The Free Trade Area of the Americas and its impending asymmetries........................ 7
2.1 Natural and developmental asymmetries........................................................... 72.2. Asymmetries in economic structure and specialisation................................ 102.3. Asymmetries in internal and external economic performance ................... 15
3. Main trends in FTAA trade flows in goods and services: The perspective ofCARICOM and the NICCs.......................................................................................17
3.1 Trade in goods.....................................................................................................173.2. Trade in services................................................................................................ 21
4. The potential effects of the FTAA on CARICOM and the NICCs ........................... 24
4.1. The state of our knowledge...............................................................................244.2. Outlining some of the potential effects of the FTA A ...................................27
References ....................................................................................................................... 34
Introduction ...........................................................................................................................1

Introduction
The Free Trade Area of the Americas (FTAA) negotiations involves 34 countries with significant differences in size and social and economic development.
The main FTAA documents spelling the underlying principles of the FTAA negotiations state the following guiding principles.1 First, the FTAA trade negotiations should be consistent with Article XXIV of the General Agreement on Tariffs and Trade (GATT) and Article V of the General Agreement on Trade in Services (GATS).
Article XXIV authorizes customs unions and free trade zones as exceptions to the principle of non-discrimination. The regional agreements and free trade zones are expected to remove barriers to trade with respect to the majority of import products, which originated in the constituting members of the customs union or free trade areas. In addition, Article XXIV also states that country members may maintain trade restriction among members of a trade agreement on the basis of GATTs articles XI, XII, XIII, XV and XX. Finally, Article XXIV explicitly states that in order to avoid trade deviation, tariff and/or other trade measures should be established at a level, which in their aggregate, does not make these more restrictive than those previously imposed by the individual members.
Second, as stated previously the negotiations will take into account the differences in size and development of the countries. This mainly involves the provision of a flexible, transparent, simple and easily applicable framework that takes into account the heterogeneity, the differing needs, the characteristics that are specific to each member, and the differences in market access among the member countries. As part of the recognition of the differences in size and development, member countries agreed on a Hemispheric Cooperation Program (HCP) providing a basis for permitting countries to confront and overcome the challenges associated with trade liberalization.
Third, the FTAA explicitly requires all participating countries to progressively liberalize agricultural, non-agricultural goods, services, investment and government procurement. Thus far it has been agreed that in the negotiations in goods, the scope of the negotiations comprise the entire tariff universe. The base for the progressive tariff phase out is the Most Favoured Nation (MFN) applied tariff.2 The tariff phase which is linear out will comprise four phases (immediate, less than five years, less than 10 years and greater than 10 years).
Fourth all decisions within the FTAA are taken by consensus and countries have voluntarily agreed to offer trade liberalization schedules and proposals.
1 Guidelines or directives for the Treatment of the Differences in the Levels of Development and Size ofEconomies (FTAA.TNC/18, November 1, 2002); the Hemispheric Cooperation Program (HCP), the Methods and Modalities for Negotiations (FTAA.TNC/20/Rev.1, October, 18, 2002).
2 This refers to the applied tariff on the date of notification (15 August to 15 October 2002).

2
The aim of this document is to analyse selected issues and highlight some of the effects relating to regional integration focusing on the FTAA from the perspective of the Caribbean Community (CARICOM) and the Non-Independent Territories (NICCs) which form part of the Caribbean Development and Cooperation Committee (CDCC). The document comprises five sections.
Following the introduction the second section presents the current status of knowledge on regional integration of the ECLAC Subregional Headquarters for the Caribbean. It is encapsulated under eight stylised facts. The third section focuses on the impending asymmetries of FTAA member countries and their implications. The fourth section examines the current trends of trade flows in goods and services between CARICOM and the NICCs and the rest of the FTAA member countries. The last section seeks to identify the possible effects of the FTAA on its member and non-member States and its transmission channels. It also addresses issues relating to the microeconomic dimension of the FTAA.
1. The major stylised facts of regional integration
There are currently eight stylised facts that capture the current state of our knowledge of regional integration in Latin America and the Caribbean.
First, there is a coexistence of different regional trading arrangements corresponding to two demarcated orientations in regionalism: the first and second regionalisms. The former includes groupings such as Latin American Free Trade Association (LAFTA) later to be renamed Latin American Integration Association (LAIA) (1980), the Caribbean Free Trade Area (CARIFTA) later to be CARICOM (1973) and the Central American Common External Market (CACM) (1960).
The first regionalism flourished in the 1960s and 1970s and its objective was the creation of a regional market large enough to overcome the constraints imposed by the small size of its individual members. The first regionalism is associated in some instances with protectionism and import substitution.
The second regionalism was propelled by the adhesion of the United States to article XXIV of the GATT and focused initially on developed economies and is associated with outward orientation and with the process of using regional agreements as building blocks to make effective multilateral agreements such as the World Trade Organization (WTO). Trade agreements corresponding to the Second Regionalism include the North American Free Trade Agreement (NAFTA) (1992), the G-3 (Colombia, Mexico and Venezuela, 1993) and to a lesser extent the Southern Cone Common Market (Mercosur) (1991) and the Andean Community (1996).
Secondly, independently of the type of orientation followed, regional schemes have achieved at most a level of integration corresponding to an imperfect customs union and a less than full fledged free trade area. Deeper integration efforts, including the intention to form an

3
economic and political union, which in some cases have been voiced for decades have not fulfilled their promise. Two examples, the CACM and CARICOM, illustrate this point.
Both the CACM and CARICOM were formed with the ultimate intention of arriving at an economic union. In the former, Central American countries agreed on the implementation of a common external tariff only 40 years after the Central American Treaty of Integration was signed and still more than 30% of all tariff lines are not yet harmonised. In the case of CARICOM, two members have not yet implemented the fourth phase of the Common External Tariff (CET). In both schemes there are exceptions to the application of the CET that are not clearly specified. In addition tariff and non-tariff trade barriers continue.
Third, independently of the data set used, in the greater majority of cases regional integration agreements have witnessed an increase in intraregional trade. In the case of CARICOM, the CARICOM Secretariat (2003) reported an increase in intraregional exports from 10% to 20% between 1980 and 2001. According to ECLAC (2002) intraregional imports have also risen during the same period accounting for 7% and 11% of the total between 1985 and2000. Finally for the United Nations Conference on Trade and Development (UNCTAD) (2002) intraregional exports have increased from 5% to 13% of the total between 1980 and 2001 (see Table 1 below).
Fourth, the increase in intraregional trade responds to conditions that are specific to each regional agreement. In the case of CARICOM, the economic development of Trinidad and Tobago, the provision for ineligibility for duty exemptions, and the structure of the common external tariff have played an important part in the expansion of intraregional trade. In the case of Mercosur, the intraregional protection afforded to selected goods has acted as a stimulant to intraregional trade. In the case of NAFTA, the processes of privatisation in Mexico and the importance of Mexican in-bond industries have played a similar role.
Table 1Intraregional trade by trade block (intraregional exports as percentage of the total)
1990 - 20011980 1990 1995 2000 2001
NAFTA 33.6 41.4 46.2 55.7 54.8CACM 24.4 15.4 21.7 13.7 15.0
CARICOM 5.3 8.1 12.1 14.6 13.4FTAA 43.4 46.6 52.5 60.8 60.1
MERCOSUR 11.6 8.9 20.6 20.7 20.8LAIA 13.9 11.6 17.3 12.9 14.5OECS 9.0 8.1 12.6 10.0 5.6
Sources: UNCTAD (2002) and ECLAC (2003)
Fifth, the increase in intraregional trade has been accompanied in some cases by a loss in extraregioinal competitiveness. The case of CARICOM is the most clear. CARICOM has lost market share in two of its major export markets, NAFTA and the European Union. In this

4
particular case it can be said that intraregional trade has acted as a buffer stock for extraregional market share loss.
Sixth, the increase in intraregional trade does not imply that there has been trade creation nor trade diversion. In general the increase in intraregional trade has been accompanied by an increasing process of specialisation and in some cases of concentration. Again CARICOM provides a clear illustration of this trend.
In terms of specialisation, in the case of CARICOM, intraregional trade is still dominated by agricultural products. Using an UNCTAD classification, intraregional imports were classified into four categories: primary commodities; labour-intensive and resource-based manufactures, manufactures with low skill and technology intensity, manufactures with medium skill and technology intensity, manufactures with high skill and technology intensity. Primary commodities represented 47% of the total. Labour-intensive and resource-based manufactures accounted for 22% of the total. For their part, manufactures with low, medium and high skill and technology intensity signified 5%, 7% and 17% of total intraregional imports.
For CARICOM, intraregional trade is not only concentrated at the country level but also at the product level. At the country level Trinidad and Tobago accounts for more than half of all intraregional imports, while other countries contribute a minimal amount to trade flows.
At the product level the provision for ineligibility for duty exemptions protects the most important products and producers, and the major traded commodities in CARICOM. The items falling under that provision comprise those traded goods for which regional output can supply a minimum of 75% of regional demand. In addition, these main export products have, with a few exceptions, a market structure that is non-competitive.
This has partly led to the formation of national and regional monopolies with the concomitant associated costs. Examples of monopolies include flat-coated zinc, paints (Antigua and Barbuda); soaps and toothpaste (Dominica); concentrated orange, orange juice, sugar cane (Belize); cement and cigarettes (Trinidad and Tobago); rice (Guyana); carton box (Organisation of Eastern States - OECS); and wheat and flour (St. Vincent and the Grenadines). There are thus empirical grounds for sustaining that the lack of competition has underpinned the export dynamics for these products.
Seven, regional agreements have not led to a process of convergence. In at least two cases, that of CARICOM and the Central American economies, there is evidence of divergence in terms of GDP per capita. Figures 1 and 2 below plot the relationship between the starting level of income per-capita and the rate of growth of income for CARICOM countries and convergence type-a (the standard deviation of the logarithm of per capita income across Caribbean nations) for 1960-1998. The standard convergence theory shows that if countries with lower starting levels of output grow faster than countries which started with higher levels of output, the dispersion among countries (convergence type-a) should decline over time. In the case of CARICOM the fastest growing countries are not the countries that started at the lower end of the income bracket (see Figure 1) and the dispersion among countries has actually increased (see Figure 2). The discontinuity in Figure 2 is explained by the absence of a consistent data set for

5
the entire time domain considered. Figure 3 shows the process of divergence for Central American countries.
Figure 1: Income levels and growth The Caribbean Case
1960 - 1998
Logarithms of income levels

[FIGURE 3]
6

7
Eight, related to stylised fact number seven is the empirical finding that regional agreements do not imply that economic fluctuations are synchronised. Table 2 presents the results of an exercise correlating the deviation in each country’s rate of growth of GDP from the regional average. The exercise starts by constructing an unweighted average rate of growth for the region for the available time domain, which in this case is 1960-1998. The next step is to obtain the deviations of each country from the regional average for each year. Finally, the correlation coefficient between the deviations of each country member from the average to each other country member is computed and the pair wise coefficients are reported in Table 2. A negative (positive) coefficient between any two countries, especially when its value is significant, implies that both are out of phase (move together) in the business cycle. Close to a half of the computed correlation coefficients are negative but with a few exceptions yield insignificant values. The positive correlation coefficients also have low values (only in three cases are the positive correlation coefficients greater than 0.30.
The results of this empirical exercise reflect the fact that economic fluctuations within CARICOM are for the most unsynchronized which, jointly with the fact that members have experienced a process of divergence over time, can undermine the success of any set of macroeconomic or trade coordination policies and limit the deepening of a regional agreement.
2. The FTAA Agreement and its impending asymmetries
The FTAA negotiations involve 34 countries with important asymmetries in the initial conditions. These disparities can have important implications for the extent to which countries may benefit from a free trade agreement. They also reflect different and conflicting negotiating interests. The initial conditions should be taken seriously into consideration during the negotiating process, as they will be a fundamental factor shaping and determining the final form of the legal FTAA texts and its effects on the member States.
2.1. Natural and developmental asymmetries
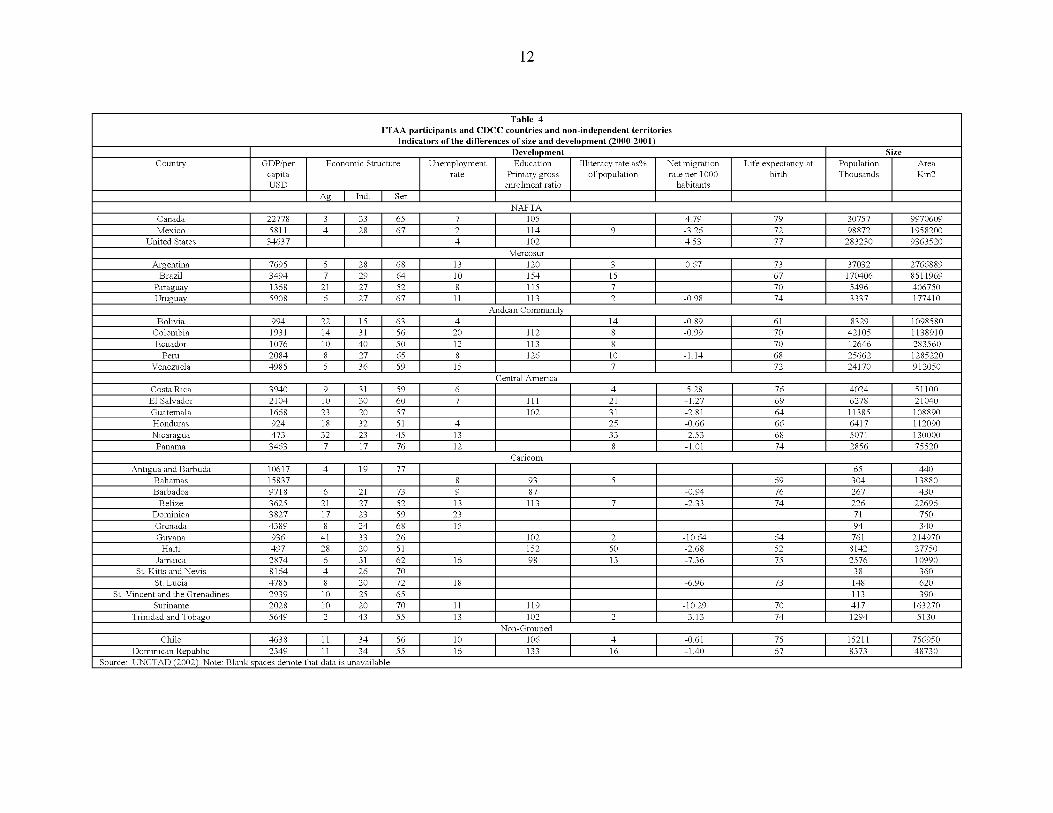
Some inter-country comparisons can illustrate the disparities involved. The United States GNP is more than 8 000 times that of all FTAA countries with the exception of Brazil. Similarly, the population size of the United States, Brazil, and Mexico is above or close to a hundred million inhabitants, while that of 11 countries (Caribbean Islands) is below one million inhabitants. GDP growth rates are also dissimilar in terms of levels and their volatility (see Table 4 below).
A similar situation is reflected in the FTAA members’ GDP per capita levels. The FTAA grouping comprises, at one extreme high income level, countries such as the United States, the Bahamas, Antigua and Barbuda and Canada that have GDP per capita above US$12,000. At the other extreme, it includes countries such as Honduras, Guyana, Haiti and Nicaragua whose GDPs per capita are of the order of US$500 or US$600. Three of the latter four countries (Guyana, Haiti, and Nicaragua) are considered Highly Indebted Poor Counties (HIPCs). In between, at the lower end of the GDP per capita scale are the member countries of the OECS and other Central American countries with a GDP per capita within the range of US$2,000-3,000. Overall the

8
mean GDP per capita is US$5,535. The standard deviation, which is higher than the mean is US$6,887.
Welfare indices, such as the illiteracy rate and the gross enrolment ratio, do not show a significant narrowing of these disparities. The average primary gross enrolment ratio for FTAA member countries is 113.3 and the standard deviation is 16.6.3 The mean illiteracy rate as a percentage of the population is 12.7% and the standard deviation is 11.8%.
3 The primary gross enrolment ratio is defined as the total enrolment in a ‘specific level of education, regardless of age as a percentage of the official school-age population corresponding to the same level of education in a given school year’. (UNCTAD, 2002).

9
Table 2 CARICOM
Synchronicity of economic fluctuations in GDP Correlation coefficients
Deviation from the average 1960-1998
Trinida d and
TobagoBarbad
osBahama
sSurina
me Guyana Belize JamaicaSt.
Lucia
St. Vincent and the Grenadi
nesDomini
caGrenad
a
Antiguaand
Barbuda
St. Kitts and
NevisTrinidad and
Tobago 1.000 -0.007 0.048 0.092 0.054 0.042 -0.024 -0.334 -0.393 -0.238 0.122 -0.283 -0.153Barbados -0.007 1.000 0.248 -0.014 0.143 -0.201 0.032 -0.194 -0.272 -0.375 0.143 -0.026 -0.160Bahamas 0.048 0.248 1.000 -0.340 -0.398 -0.319 -0.411 -0.125 0.201 -0.235 0.136 0.156 -0.116Suriname 0.092 -0.014 -0.340 1.000 0.304 0.124 0.015 0.006 -0.271 -0.131 -0.233 -0.498 -0.323Guyana 0.054 0.143 -0.398 0.304 1.000 0.159 -0.007 -0.287 -0.309 -0.252 -0.028 -0.259 0.033Belize 0.042 -0.201 -0.319 0.124 0.159 1.000 0.195 0.011 -0.204 -0.036 -0.284 -0.143 -0.001
Jamaica -0.024 0.032 -0.411 0.015 -0.007 0.195 1.000 0.019 -0.220 0.068 0.072 -0.082 -0.272St. Lucia -0.334 -0.194 -0.125 0.006 -0.287 0.011 0.019 1.000 0.079 0.072 -0.286 0.084 -0.121
St. Vincent and the Grenadines -0.393 -0.272 0.201 -0.271 -0.309 -0.204 -0.220 0.079 1.000 0.328 -0.204 0.035 0.076
Dominica -0.238 -0.375 -0.235 -0.131 -0.252 -0.036 0.068 0.072 0.328 1.000 -0.305 0.119 0.009Grenada 0.122 0.143 0.136 -0.233 -0.028 -0.284 0.072 -0.286 -0.204 -0.305 1.000 0.008 0.034
Antigua and Barbuda -0.283 -0.026 0.156 -0.498 -0.259 -0.143 -0.082 0.084 0.035 0.119 0.008 1.000 0.345
St. Kitts and Nevis -0.153 -0.160 -0.116 -0.323 0.033 -0.001 -0.272 -0.121 0.076 0.009 0.034 0.345 1.000
Source: On the basis of INTAL (2001)

10
Member countries also exhibit heterogeneous productive structures. At one end of the spectrum there is one group of economies, mainly English speaking Caribbean and Panama, which are clearly service-oriented. Available data for the past 30 years show a marked upward trend in the sectoral contribution of services to the growth of GDP (45% and 68% in the 1970s, and the 1990s). For the same period the sectoral contribution of manufacturing to growth showed a slight increase (23% and 28% of GDP) while that of agriculture contracted significantly (42% and 3%).
In the same vein the sectoral value added of the services sector as a percentage of GDP reached on average 62% during the 1990s while that of agriculture and manufacturing were 11% and 10%, respectively.4 The weight of industrial GDP as a percentage of the total equaled roughly 7% for these economies which is significantly below the 19% recorded for Latin American countries and the Caribbean on average.
This growing specialization in services is also visible from an analysis of export data 5 and is clearly highlighted when Caribbean economies are compared to other world countries. Services represent 48% of global exports of goods and services, which contrasts with a paltry 14% in the case of Latin America. The non-independent territories are also service-oriented.
Manufacturing remains a very small percentage of the Gross Domestic Product (GDP) of the region with the exception of Trinidad and Tobago and Jamaica. Product transformation from agriculture is even less significant, if rum production is removed.
2.2 Asymmetries in economic structure and export specialisation
4 The sectoral value added refers to the net output of a given sector and is equal to outputs minus inputs.5 The ECLAC Subregional Headquarters for the Caribbean has distinguished its work and research between two economic poles: service and resource-based economies as some countries are driven by the services sector while other depend on their natural resource base to propel their economies. The first category comprises the majority of small Caribbean economies, Bahamas and Barbados. They are most vulnerable to external shocks given the strong sectoral linkages of services (in particular tourism) to the other areas of economic activity. Resource-based economies comprise mostly the larger Caribbean States (Belize, Guyana, Jamaica, Suriname, Trinidad and Tobago). The structure of these economies is highly biased towards the production and export earnings from exports of traditional products (sugar, bauxite, oil, and diamonds). Increasingly, with a few exceptions, countries have moved from the latter to the former pole. The most recent example is St. Kitts and Nevis, which due to its failing sugar industry, has sought to increase its specialization in services.

11
Table 3Value-added agricultural production as a percentage of GDP
Country 1998 1999 2000 2001 2002Antigua and Barbuda 4 4 4 4
The BahamasBarbados 6 6 6 6Dominica 19 19 18 18Grenada 8 9 8 8Guyana 35 35 31 31
HaitiJamaica 8 7 6 6
St. Kitts and Nevis 4 4 3 3St. Lucia 8 9 8 7
St. Vincent and the Grenadines 11 11 11 10Trinidad and Tobago 2 2 2 2
Source: World Development Indicators database. http://devdata.worldbank.ors/data-auerv/SMResult.asp
12
Table 4FTAA participants and CDCC countries and non-independent territories
Indicators of the differences of size and development (2000-2001)Development Size
Country GDP/percapitaUSD
Economic Structure Unemploymentrate
Education Prim ary gross
enrolment ratio
Illiteracy rate as% o f population
N et migration rate per 1000
habitants
Life expectancy at birth
PopulationThousands
AreaKm2
Ag Ind. SerNAFTA
Canada 22778 3 33 65 7 105 4.79 79 30757 9970609M exico 5811 4 28 67 2 114 9 -3.26 72 98872 1958200
U nited States 34637 4 102 4.53 77 283230 9363520M ercosur
Argentina 7695 5 28 68 13 120 3 0.67 73 37032 2766889Brazil 3494 7 29 64 10 154 15 67 170406 8511969
Paraguay 1368 21 27 52 8 115 7 70 5496 406750Uruguay 5908 6 27 67 11 113 2 -0.98 74 3337 177410
Andean CommunityBolivia 994 22 15 63 4 14 -0.89 61 8329 1098580
Colom bia 1931 14 31 56 20 112 8 -0.99 70 42105 1138910Ecuador 1076 10 40 50 12 113 8 70 12646 283560
Peru 2084 8 27 65 8 126 10 -1.14 68 25662 1285220V enezuela 4985 5 36 59 15 7 72 24170 912050
Central AmericaCosta Rica 3940 9 31 59 6 4 5.28 76 4024 51100El Salvador 2104 10 30 60 7 111 21 -1.27 69 6278 21040Guatemala 1668 23 20 57 102 31 -2.81 64 11385 108890Honduras 924 18 32 51 4 25 -0.66 66 6417 112090Nicaragua 473 32 23 45 13 33 -2.53 68 5071 130000
Panama 3463 7 17 76 12 8 -1.01 74 2856 75520Caricom
A ntigua and Barbuda 10617 4 19 77 65 440Bahamas 15837 8 93 5 69 304 13880Barbados 9718 6 21 73 9 87 -0.94 76 267 430
Belize 3625 21 27 52 13 113 7 -2.33 74 226 22696Dom inica 3827 17 23 59 23 71 750G renada 4389 8 24 68 15 94 340Guyana 936 41 33 26 102 2 -10.64 64 761 214970
Haiti 497 28 20 51 152 50 -2.68 52 8142 27750Jamaica 2874 6 31 62 16 98 13 -7.36 75 2576 10990
St. Kitts and Nevis 8164 4 26 70 38 360St. Lucia 4785 8 20 72 18 -6.96 73 148 620
St. V incent and the Grenadines 2939 10 25 65 113 390Suriname 2028 10 20 70 11 119 -10.29 70 417 163270
Trinidad and Tobago 5649 2 43 55 13 102 2 -3.13 74 1294 5130Non-Grouped
Chile 4638 11 34 56 10 106 4 -0.61 75 15211 756950D om inican Republic 2349 11 34 55 16 133 16 -1.40 67 8373 48730
Source: UNCTAD (2002). Note: B lank spaces denote that data is unavailable.

13
Table 4 (continued)FTAA participants and CDCC countries and non-independent territories
Indicators of the differences of size and development (2000-2001)Development Size
Country GDP/percapitaUSD
Economic Structure Unemploymentrate
Education Prim ary gross
enrolment ratio
Illiteracy rate as% o f population
N et migration rate per 1000
habitants
Life expectancy at birth
PopulationThousands
AreaKm2
Ag Ind. SerAnguilla 9,533.7 4 18 78 6.7 100.7 5 12.8 76.5 12738 91
M ontserrat 7,730.7 5.4 13.6 81 6.0 3 34.8 78.36 8995 103Aruba 20,604.4 0.6 111 3 0 78.67 70844 193
Netherland Antilles 9,173,52 1 15 84 15.0 111 3.5 -0.41 75.38 216226 800British Virgin Islands 31,414.00 1.8 6.2 92 3.0 1.8 10.45 73.8 21730 151
Cuba 1,714.46 7.6 34.5 57.9 4.1 102 3.3 -1.05 77 11271 110860D om inican Republic 6,193.17 11 34 55 14.5 124 16.4 -3.43 67.1 8716 48730
Puerto Rico 11,434.87 0.7 42.8 56.5 12.0 128.8 8.5 -1.54 77.26 3885877 8897Source: UNCTAD (2002). Note: B lank spaces denote that data is unavailable.

14
While the particular group of countries alluded to is clearly service-oriented, it should not be forgotten however that most FTAA member countries (30 members) have a services sector that contributes more than 50% to GDP. For 13 countries the contribution of services to GDP is between 50% and 60% of GDP. For 11 countries, the contribution of services to GDP comprises between 60% and 70%. Six countries have a services sector whose contribution to GDP is greater than 70%.
At the other end of the FTAA country member spectrum, agriculture contributes close to a third of GDP in countries such as Belize, Bolivia, Guatemala, Guyana, Honduras, Nicaragua and Paraguay. Within this subgroup, Guyana is the only country in which the contribution of agriculture is greater than those of industry and services (41%, 33% and 26%, respectively). Also within this subgroup Guyana and Nicaragua are highly indebted poor countries (HIPC) countries. For these countries the contribution of industrial GDP to the total is 13%.
Finally there is a third group of countries comprising the United States, Canada, Mexico, and Brazil, which are relatively highly industrialized with a low contribution of agriculture to output relative to manufacturing and services (5%, 30% and 65% for agriculture, industry and services, respectively).
To some extent their productive structure has shaped their export specialisation patterns. Thus far ECLAC’s current state of research has identified four export specialisation patterns among FTAA member countries and NICCs.
(a) Exporting States with a strong free zone component (Central American economies) and high and medium technology (North America and the G-3) are characterised by a high percentage of exported products situated in dynamic product categories (i.e., products that have increased their market share) and in particular by a high number of dynamic products for which these countries have increased their market share. These economies have also attracted major foreign direct investment flows. The link between some of these sectors and the rest of the productive sectors is weak indicating that export dynamism is only a condition necessary for economic growth.
(b) Re-exporting States (mainly non-independent territories; i.e., NICCs) have a high concentration in the compositions of their exports, and this in fact makes them mono-reexporters.
(c) Oil exporting member States (Venezuela and Trinidad and Tobago) are characterised by the growing predominance of exports linked to this natural resource, to the detriment of the possible development of alternative export products. In other words, there is a diversification of the composition of external sales, but these are linked to this natural resource.
(d) States with a marked tendency to export traditional products such as agricultural products have a low level of diversification of their exports (Caribbean natural resource-based economies and Central American economies).

15
Member countries are also characterised by a heterogeneous economic performance although they exhibit, with the exception of the United States and Canada, some common trends.
First the rate of growth declined for most FTAA economies during the 1990s relative to earlier decades.
Second, FTAA countries have managed with some exceptions, to reduce the budget deficits and the rate of inflation. The main exceptions to this rule are OECS economies whose budget deficit and debt have risen to significant levels. Calculations undertaken by the Eastern Caribbean Central Bank (ECCB) show that the primary fiscal gap (defined as the difference required to ensure a stable debt to GDP ratio and the actual primary balance) have reached 3.6% and 3.4% of GDP in the case of two OECS economies. This has translated for these economies into a rising public debt reaching, for the smaller economies of the Caribbean, a maximum of 103% and 122% of GDP in the cases of Antigua and Barbuda and St. Kitts and Nevis.
Nevertheless, in all Caribbean economies the fiscal stance (defined as the quotient between government expenditure and the tax-to-GDP ratio) has been shown to be expansionary since 1995 without a concomitant increase in government revenue. ECLAC computations show that in all CARICOM cases, with the exception of Guyana, the fiscal stance has been expansionary. In addition in all countries, with the exception of Guyana and Trinidad and Tobago, the fiscal stance has been increasingly expansionary since the middle of the 1990s.
Third FTAA economies have increased the rate of growth of their exports, but at the same time have not kept pace with the rate of growth of imports leading to increasing current account deficits (see Table 5 below). This has been the case especially for the smaller economies of the Latin America and the Caribbean.
Fourth domestic investment measured as a percentage of GDP has stagnated in many economies. This pertains in particular to Central America and CARICOM. In the case of CARICOM, domestic investment as a percentage of GDP has remained at 25% for the past 20 years. At the same time, there has been an increase in foreign direct investment driven mostly by private investment as official grants have reduced their overall share (50% and 5% in 1990 and 2000).
2.3 Asymmetries in internal and external economic performance

16
Table 5: GDP, export and import growth, 1950-2000
Rates of Growth 1950-1980 1980-1990 1990-2000GDP
Latin America 5.47 1.16 3.27Big economies 5.91 1.22 3.18
Medium Sized economies 4.51 0.82 3.57Small economies of LA 4.57 1.12 3.54CARICOM economies 2.70 1.80
ExportsLatin America 3.76 5.26 9.12Big economies 4.94 7.12 10.43
Medium Sized economies 2.36 3.22 6.98Small economies LA 4.94 2.29 6.12
CARICOM economiesImports
Latin America 5.10 -0.02 10.68Big economies 5.12 0.73 11.74
Medium Sized economies 4.68 -1.99 9.59Small economies LA 5.72 0.15 7.65
CARICOM economiesSource: Moreno-Brid (2001); ECLAC (2002)Note: The author follows the ECLAC methodology of dividing Latin American economies in big (Argentina, Brazil,and Mexico), medium sized and ( Colombia, Chile, Peru, Venezuela) and smaller sized economies (Bolivia, CostaRica, Ecuador, El Salvador, Guatemala, Haiti, Honduras, Nicaragua, Panama, Paraguay, Dominican Republic, andUruguay).
Although, in general, the external and fiscal macroeconomic imbalances are presented as two separate compartments of analysis, they are in fact interrelated. It can be shown that if net asset accumulation by the private sector at the aggregate level is equal to zero, there is a precise relationship between the fiscal stance (defined as the quotient of government expenditure and the tax-to-GDP ratio) and the export performance ratio (defined as the ratio of exports to the average propensity to import). More to the point, when the fiscal stance is greater than the export performance ratio, a fiscal deficit coexists with a balance of payments deficit.
This relationship is most clearly illustrated in the case of the smaller economies of the FTAA and in particular in the case of the OECS. For this group of economies the ratio of loans and advances to private businesses and households to disposable income has steadily increased over time. The ratio of loans and advances to income was equal to 0.46 and 0.95 in 1985 and2001. This coefficient, which is very close to one reflect the fact that expenditure is loangenerated rather than income-generated. That is, there is roughly no asset accumulation.
For the OECS the computation of the fiscal stance and the export performance ratio over time shows that the latter has always exceeded the former indicating the perennial existence of a twin deficits situation. In addition the gap between both widened from 1996 onwards. Other smaller economies exhibit a similar behavior.
As it stands, independently of any perspective of free trade agreements, this gap indicates that the fiscal stance must be aligned sooner or later with the export performance ratio. In the short run, this calls for an eventual adjustment falling mainly on the fiscal side with the

17
concomitant losses in terms of output and employment. Beyond the short run, fiscal adjustment can be avoided only if the export performance improves.
Thus in the short run, even under the hypothesis that the FTAA is implemented, the contraction in economic activity required by an adjustment will preclude some of its member countries from benefiting, at least partially, from the possible or hypothetical initial economic impulse of a free trade agreement. A further and more substantial question is whether the FTAA will be able to alter the existing relationship between the fiscal stance and the export performance ratio to the benefit of the countries involved.
3. Main trends in FTAA trade flows in goods and services: The perspective ofCARICOM and the NICC
3.1. Trade in goods
As stated earlier, CARICOM economies have gained market share at the intraregional level and at the same time have lost market share in the most important extraregional export markets. In 1985, CARICOM represented 0.71% of NAFTA’s total imports. Fifteen years later its share had declined to 0.27%. For the same period in the case of Western Europe, CARICOM’s share also decreased, albeit by a lower margin (0.15% to 0.10% between 1985 and 2000). CARICOM’s market share increased only in the cases of the Andean Community and the CACM (0.40% and 0.20% to 0.96% and 0.92% between 1985 and 2000) (see Table 6 below).
Table 6CARICOM’s market share in goods in regional trading blocks
(in percentages) 1985-2000Regional bloc 1985 1990 1995 2000
NAFTA 0.71 0.43 0.32 0.27Western Europe 0.15 0.13 0.12 0.10
Andean Community 0.40 0.96 0.41 0.96Mercosur 0.30 0. 34 0.19 0.34CACM 0.20 0.18 0.38 0.92
CARICOM (imports) 9.71 9.20 9.77 11.2CARICOM (exports) 13.3 12.3 16.6 20.0
Source: Competitive Analysis o f Nations (2001) and data provided by the CARICOM Secretariat (2003).
In terms of its trade relationships with FTAA member countries, CARICOM’s main trade partner is the United States accounting for one third of its exports and for close to 40% of its imports. Other FTAA groupings have visible trade relations with one or two CARICOM countries. Due to its geographical location, Belize has, leaving aside the United States, a non- negligible trade relationship with Central America and Mexico. Both represent 12% and 18% of its exports. Also to be noted is the trade relation between Dominica and Mexico (5% of the former’s exports are destined to the latter’s market) and between Grenada and the Andean

18
Community. With these exceptions, FTAA countries do not have any significant trade ties with the rest of the American Hemisphere.
As with CARICOM, the non-independent countries, Anguilla, Aruba, the Netherlands Antilles and Montserrat, have a definite trade orientation towards the United States and a partial orientation towards the rest of the hemisphere as evidenced by the relationships between the Netherlands Antilles and the Andean Community; The Netherlands Antilles and the Central American Common Market; Aruba and the Andean Community (see Tables 7 and 8 below) Most of these trade relationships centre on Venezuela and on petroleum products. For 2002, Venezuela was the first destination of Bonaire’s exports.
Table 7Caribbean export market share to FTAA groupings and countries (2001)
MercosurAndean
Community CACMUnitedStates Canada Mexico
Anguilla 0.00 0.00 0.00 25.37 0.00 000Antigua And Barbuda
Aruba 0.00 33.29 8.56 31.52 0.00 0.00Barbados 0.94 0.25 8.67 15.0 1.21 0.25
Belize 1.03 2.33 11.68 29.44 2.19 17.98Netherlands Antilles 0.25 4.91 6.46 0.14 0.65 0.05
Dominica 0.00 0.01 0.04 14.74 0.16 4.55Grenada 0.79 6.73 0.66 12.71 1.90 0.00Guyana 0.00 0.66 0.89 18.42 1.13 0.00Jamaica 0.00 0.17 2.04 34.0 0.86 0.03
Montserrat 0.00 0.00 0.00 9.58 0.17 0.00St. Lucia 0.01 0.35 0.42 7.46 3.78 0.00
St. Kitts/Nevis 0.00 0.00 0.03 4.73 0.82 0.03
St. Vincent And The Grenadines 0.00 0.01 0.00 1.85 21.20 0.00Trinidad And Tobago 0.62 1.97 1.11 0.32 0.49 0.15
Note' Denotes not available.Source: Caribbean Trade Data Base. Caribtrade. ECLAC (2003).

19
Table 8Caribbean import market share from FTAA groupings and countries (2001)
MercosurAndean
Community CACMUnitedStates Canada Mexico
Anguilla 2.53 1.31 2.32 5.71 16.37 1.21Antigua And Barbuda - - - - - -
Aruba 0.99 13.86 3.63 2.71 0.04 0.11Barbados 0.56 8.88 6.71 2.74 0.67 0.78
Belize 0.56 4.58 7.76 1.88 0.80 17.15Netherlands Antilles - - - - -
Dominica 11.82 8.64 4.06 3.04 16.35 0.79Grenada 1.61 0.23 1.57 27.33 2.07 0.13Guyana 0.84 0.37 9.96 15.47 3.19 3.88Jamaica 0.96 0.63 0.41 10.08 0.70 0.39
Montserrat 2.71 4.57 11.40 0.92 0.44 1.28St. Lucia 0.25 0.79 0.50 10.43 19.06 2.48
St. Kitts/Nevis 0.90 1.24 1.75 4.14 1.29 9.77
St. Vincent And The Grenadines 1.94 1.16 7.40 6.11 1.40 4.75Trinidad And Tobago 0.15 4.84 9.41 40.30 1.07 1.03
Note' Denotes not available.Source: Caribbean Trade Data Base. Caribtrade. ECLAC (2003).

20
Table 9Imports of CARICOM from FTAA countries (ord<
1985 -2000 (In percentaîred by country market share) ges)
1985 1995 1990 2000United States of America 40.563 44.756 40.802 38.872
Venezuela 4.297 3.403 5.993 7.227Canada 5.955 3.547 4.562 3.306Mexico 0.913 1.815 2.705 2.988
Colombia 0.555 2.611 0.573 2.961Brazil 1.89 2.105 3.324 2.068
Panama 0.251 0.383 0.327 0.481Guatemala 0.224 0.361 0.148 0.439Honduras 0.666 0.149 0.183 0.3Costa Rica 0.163 0.273 0.269 0.278Ecuador 1.003 0.113 0.088 0.276
Argentina 0.368 0.213 0.505 0.201Dominican Republic 0.333 0.195 0.288 0.193
El Salvador 0.106 0.044 0.068 0.159Uruguay 0.024 0.024 0.03 0.116
Chile 0.043 0.056 0.046 0.111Peru 0.031 0.068 0.043 0.085
Bolivia 0 0.008 0.002 0.025Nicaragua 0.001 0.005 0.005 0.017Paraguay 0 0.011 0.002 0.002
Total 57.053 59.945 59.675 59.912Source: CAN (2002)
Caribbean member States (including CARICOM members and non-independent territories) have registered for the past five years, if not more, a persistent and in most cases increasing deficit in their merchandise balance with each of the subgroupings that form the FTAA. The decomposition of the trade deficit by regional subgrouping shows that NAFTA accounts for 52% of the trade deficit followed by Central America accounting for 25% of the deficit and Mercosur (14%) (see Table 10 below).
The analysis at the product level shows that CARICOM member States exhibit a high degree of concentration. The breakdown of product share by major import market shows that the first five commodities represent more than 50% of the total and in some cases up to 85% of the total. Standard computations of an index of concentration and diversification validate these results.

21
Table 10Caribbean countries balance of trade with FTAA groupings and countries.
Average 1995-2001 US$
MercosurAndean
Community CACMUnitedStates Canada Mexico
Anguilla 1,341,444 1,919,165 2,562,791 18,552,961 17,120,362 1,385,275Antigua And Barbuda 1,065,451 15,198,260 990,483 154,997,515 9,155,959 1,301,039
Aruba 2,014,457 5,184,646 465,762 2,224,578 1,659,984 1,075,469Barbados 13,025,086 40,412,342 32,515,690 2,481,839 9,771,270 5,291,406
Belize 6,180,853 5,855,729 58,791,793 30,958,606 12,163,397 16,355,839British Virgin Islands 294,431 782,836 53,062,952 139,971,825 2,317,534 500,031Netherlands Antilles 23,990,349 10,245,439 3,263,939 9,674,916 8,472,976 1,608,734
Dominica 1,465,579 1,684,386 5,425,677 11,055,377 7,216,858 7,449,931Grenada 2,919,578 22,971,975 7,245,580 71,675,649 11,634,445 5,275,136Guyana 20,140,319 64,972,377 47,747,142 64,068,458 9,403,629 172,580,220Jamaica 21,827,745 72,476,601 288,527,598 33,243,740 51,351,284 790,889
Montserrat 80,388 112,219 121,051 964,268 5,318,701 14,968,550St. Lucia 6,708,150 2,755,187 4,768,815 13,885,352 12,136,897 29,849,183
St. Kitts/Nevis 42,318,718 2,276,426 75,951,490 28,656,898 58,118,515 64,451,886St. Vincent And The
Grenadines 261,402,810 54,990,455 166,905,564 304,709,551 103,008,785 28,458,263Trinidad And Tobago 31,373,908 6,589,384 19,400,247 72,984,809 53,128,468 1,385,275
Total 404,775,358 301,838,043 748,346,327 863,131,184 318,850,596 351,341,851Percent contribution by
regional grouping 14 10 25 29 11 12
Note: .... The balance o f trade for all countries is negative except the corresponding number is highlighted. In that case the trade balance is positive.Source: Caribbean Trade Data Base. Caribtrade. ECLAC (2003).
3.2. Trade in services
On the services side the most important facts to highlight with respect to the FTAA is that, as mentioned earlier, CARICOM countries have a higher specialisation in services compared to most FTAA member countries. For the period 1980-2000, CARICOM’s index of specialisation in services was higher than that recorded for the rest of FTAA groupings. Within CARICOM, and as Table 10 below shows, the OECS has the highest specialisation index among the FTAA regional groupings followed by CARICOM. The results obtained for the non-grouped countries reflect the services orientation of the Dominican Republic (3.83; 2.85 and 2.06 for 1980-2000, respectively). The table also shows once again an increased specialisation over time in the cases of CARICOM, the non-grouped countries and especially the OECS. For the latter regional grouping, the index doubles from 1980-1985 to 1995-2000. As expected two of the nonindependent countries (Aruba and Montserrat), which are included in Table 11 have the highest specialisation ratings.

22
Table 11Services specialization by FTAA grouping and by non-independent states, 1980 - 2000
Averages/Country groupings 1980-1985 1985-1990 1990-1995 1995-2000 1980-2000
CARICOM 2.54 2.73 2.85 3.18 2.85
OECS 2.20 3.71 3.90 4.41 3.83
MERCOSUR 1.31 1.21 1.23 1.30 1.26
Andean Community 0.87 0.88 0.77 0.70 0.81
MCCA 1.41 1.56 1.64 1.59 1.55
NAFTA 0.93 0.98 0.91 0.82 0.91
Non-grouped 1.62 1.99 2.26 2.37 2.06
Aruba 5.17 4.94 4.92 4.99
Montserrat 4.91 4.66 4.23 4.55
Netherlands Antilles 1.23 2.29 2.43 2.56 2.08
Note: The non-grouped countries include the Dominican Republic, Panama and Chile. Source: On the basis of UNCTAD (2002) data.
The decomposition of the services category (transport; travel; communications; construction; computer and software; insurance, financial services; royalties and license fees, other business services; and personal, cultural and recreational services) shows that travel is the most important component for CARICOM and OECS representing three quarters of services exports (see Table 12 below).
In spite of the increased specialisation in services, CARICOM lost half of its market share relative to the FTAA regional grouping as a whole consistently since 1980. In that year CARICOM’s share of commercial services represented 3.6% of the total and declining to 1.8% in 2000. In the subcategory of travel, CARICOM has also shown a decline, albeit a more moderate one. Available data shows that in 1990, CARICOM accounted for 37% of tourist arrivals to the Caribbean region (inclusive of non-independent territories and the Hispanic Caribbean). By the end of that decade CARICOM’s share declined to 34%.

23
Table 12 CARICOM
Percentage contribution of export services subcategories to the total, 1985 -20001980-1985 1985-1990 1990-1995 1995-2000
OECSTransport 0.44 9.40 10.94 9.31
Travel 88.91 79.20 77.12 73.83Other services 10.49 11.39 11.95 16.93
Communications 1.64 1.27Construction 0.12 0.08
Computer and information servicesInsurance 1.01 1.20 2.01
Financial services 1.78Royalties and license fees 0.12
Other business services 10.49 7.70 9.17 11.92Personal, cultural and recreational services
Government services n.i.e. 1.71 1.02 1.44Non-OECS CARICOM
Transport 16.64 10.85 9.49 10.34Travel 71.87 75.57 75.29 73.66
Other services 14.97 13.63 15.24 18.54Communications 0.65 0.74 2.74 5.22
Construction 0.00 0.00 0.00 0.04Computer and information services 0.00 0.00 0.50 1.65
Insurance 1.86 1.71 1.55 2.03Financial services 0.00 0.00 0.22 1.46
Royalties and license fees 2.53 1.32 2.23 0.56Other business services 8.36 6.71 6.71 5.18
Personal, cultural and recreational services 1.14 0.44 0.28 0.66Government services n.i.e. 16.64 10.85 9.49 10.34
Non-independent StatesTransport 29.71 14.63 13.77 7.90
Travel 43.99 49.39 52.30 75.91Other services 26.31 35.96 33.94 16.15
Communications 0.01 0.44Construction 0.08 0.61
Computer and information servicesInsurance 0.13 0.83
Financial services 0.79 0.31Royalties and license fees 0.01
Other business services 24.50 33.08 30.50 11.73Personal, cultural and recreational services
Government services n.i.e. 1.77 2.79 2.38 2.15
Source: On the basis of UNCTAD (2002)

24
4.1. The state of our knowledge
The effects of the FTAA on its member States or the rest of the world (including the NICCs) are to some extent difficult to determine with certainty.
For one thing, trade theory provides little guidance with respect to some of the main issues confronting the formation of a free trade area. The current state of trade theory relating to free trade areas revolves around issues such as the creation and deviation of trade and to what extent regional blocs are building or stumbling blocks to multilateral trade negotiations. While both of these aspects are well developed, they still belong to static theory and key issues to free trade areas such as investment, the transfer of technology, learning through trade or even the relationship between trade and growth remain largely, with a few exceptions, to be explored.
In addition from a normative point of view the FTAA texts are still in the process of negotiation and the significant number of existing paragraphs, sentences and words in brackets reveal the lack of agreement concerning fundamental issues. In turn, this may reflect the fact that the FTAA agreement has conceptual gaps. Among the most important are the absence of a clear specification of the relationship between size and development, the absence of precise criteria or guidelines on how to incorporate the differences in size and development in the legal texts and the lack of consensus as to what constitutes a smaller economy are of fundamental importance.
The FTAA was founded on the premise that the negotiations leading to the final agreement should recognise the differences in levels of size and development. However, in practice it mainly recognises the differences in size of the member countries. The issue is not, for example, whether the Bahamas has a GDP per capita that approaches that of the United States and should be considered by virtue of this variable to be closer to a developed country, but that it is smaller in size relative to most other non-English speaking Caribbean economies. In the same way, the issue is not whether Guyana or Nicaragua, both HIPC countries, are at the lower end of the FTAA development scale relative to any other member country, with the exception of Haiti, and are as a result deserving of asymmetric treatment. Rather the issue is whether The Bahamas, Nicaragua or Guyana are or are not smaller in size than other FTAA countries. It is the size variable and not a development variable (as say, education, literacy or poverty indicators) that puts the Bahamas, Nicaragua and Guyana in the same special category in the FTAA, that of smaller economies, and thus subject to the benefits conferred to smaller States.
Yet surprisingly the demarcation criterion between what constitutes a smaller and larger economy has not yet been defined or established. This is, in greater part, due to the fact that in a trade agreement that includes 34 countries with wide economic disparities the concept becomes too relativistic. For example, Ecuador is a bigger economy in relation to Saint Lucia but at the same time it is a smaller economy in relation to Brazil. In turn, Brazil is a smaller economy compared to that of the United States.
Recently in November 2003, the Trade Negotiations Committee (TNC) presented its report on the results of the progress achieved in relation to the treatment of the differences in the levels of development and size of economies in each of the Negotiating Groups. The ministerial
4. The potential effects of the FTAA on CARICOM and the NICCs
25
team had previously put emphasis on the negotiating groups undertaking market access negotiations to translate the guidelines on the treatment of the differences in the levels of development and size of economies into specific measures. Thus far, two countries have taken into account differences in the levels of development and size of economies in their market access offers by putting forward differentiated offers with more rapid elimination of their import duties for relatively less-developed countries, and being willing to consider offers from relatively less-developed countries that place a higher proportion of their products in the longer tariff phase-out periods.
Subsequent to that meeting, at the eighth ministerial meeting, ministers instructed the TNC to develop a balanced and common set of rights and obligations applicable to all countries. These negotiations on the common set of rights and obligations will include provisions in each of the following negotiating areas: market access; agriculture; services; investment; government procurement; intellectual property; competition policy; subsidies, antidumping, and countervailing duties; and dispute settlement. On a plurilateral basis, interested parties may choose to develop additional liberalization and disciplines. The TNC shall establish procedures for these negotiations that shall, among other things, provide that: countries negotiating additional obligations and benefits within the FTAA shall notify the Co-Chairs of their intention to do so before the outset of the negotiations; and any country not choosing to do so may attend as an observer of those additional negotiations. Observers, by notifying the Co-Chairs, may become participants in these negotiations at any time thereafter. The results of the negotiations must be WTO compliant.
The Consultative Group on Smaller Economies (CGSE), with the assistance of the Tripartite Committee, was instructed to implement the HCP6 and has created important first steps that took place at the first meeting between potential donors and countries and/or subregions seeking assistance. The countries had the opportunity to present their needs and the potential donors the opportunity to indicate possible areas for future cooperation. Countries seeking assistance requested that other additional forms of cooperation, including financial and non-financial assistance, be included with a view to enabling countries to take on the challenges posed by the FTAA in light of their limited indebtedness capacity. One of the more recent developments that have underscored the greater need for the HCP has been the re-designation of Barbados7 and Antigua and Barbuda as ‘high income’ countries. They will lose their designations as beneficiary developing countries for purposes of the generalized system of trade preferences on 1 January 2006.8
6 The HCP has been envisaged as a mechanism for assisting in the integration of the Hemisphere under the FTAA.7 The latest data show that per capita income in Barbados is approximately $15 000 while the island's Gross Domestic Product at market price is $5.2 billion. In 2002 the country's external debt ratio was 6.0% and external debt to GDP was 29.1% at the end of the same year.8 Since 1976, Antigua and Barbuda and Barbados, along with other CARICOM countries, have been exporting to the United States under the Generalised System of Preferences (GSP), which allows their products to pay lower custom duties when they enter the US market, with no obligation of reciprocity. However, the US recently announced that Barbados and Antigua and Barbuda have been re-designated "high income" countries and will lose their trade preferences on 1 January 2006. Between 1996 and 2002, average exports to the US under this programme was 1.9% for the Caribbean region, and though the significance of this may not be as great as that of the CBI, the magnitude of this trade flow on countries such Antigua and Barbuda and Barbados, which export 0.6% and 2.9% of their products to the US under the GSP is well noted. The granting of GSP has been criticised as being arbitrary because it is non-contractual in nature, however countries such as Antigua and Barbados have learned to depend on

26
Table 13Import tax classification and presentation by country
Country Presentation format Import tax dependency Percentage of total tax revenue
(2002)International trade and transactions 53.87
Anguilla Import duties 46.69Foreign exchange tax 1.43International trade and transactions 60.40
Import duties 15.53Antigua and Barbuda Consumption tax 24.64
Customs service charge 12.58Foreign currency levy 1.97
International trade and transactions 65.26Import tax 50.24
Bahamas Stamp tax from imports 13.01Export tax 1.88Stamp tax from exports
Import duties 9.98
BarbadosInternational trade and transactions 45.7
Belize
International trade and transactions 52.71Dominica Import duties 12.08
Consumption tax 31.71Customs service charge 3.70
International trade and transactions 57.65Import duties 12.07
Grenada Foreign exchange tax 0Consumption tax 31.90Customs service charge 9.70
JamaicaInternational trade and transactions 45.34
Import duties 9.21Foreign exchange tax 3.63
Montserrat Consumption tax 16.44Customs service charge 14.86
International trade and transactions 49.17Import duties 15.89Foreign exchange tax 0.00
St. Kitts and Nevis Consumption tax 23.95Customs service charge 7.42
International trade and transactions 52.08Import duties 13.97Foreign exchange tax 0.00
St. Lucia Consumption tax 26.64Customs service charge 7.45
International trade and transactions 48.77Import duties 9.84
St. Vincent and the Foreign exchange taxGrenadines Consumption tax 30.0
Customs service charge 6.99Import duties 7.2
Trinidad and TobagoInternational trade taxes 11.4
Guyana
Source: On the basis o f official data.
these guaranteed markets for their products and by weaning them off the GSP through a differentiated scheme, the attainment of an equitable trading plane under the FTAA would be harmonised.

27
Given the absence of a solid theoretical and legal framework within which to analyze the effects of the FTAA, the major stylized fact of regional integration schemes (Section 1) and the most general considerations of free trade areas can guide the discussion of the said effects.
Within these broad guidelines it can be stated with certainty that the most immediate effects of the entry into force of the FTAA will stem from the reduction in tariffs. It will have an immediate revenue effect especially on those economies that are highly dependent on trade tax revenues (see Table 13 above). In addition to the importance of trade taxes, the total effect will be determined by the size of the tariff reduction and the response of imports to the tariff change. The loss in government revenue can be offset by changes in the tax base, tax rates or by carrying out a fiscal reform. Generally in view of the existing high tax rates in the Caribbean subregion, CARICOM countries have opted to increase the tax base and/or to implement a fiscal reform.
The increase in the tax base has an important implication for domestic policy. It will curtail the leverage that governments possess in their use of fiscal incentives, which is indeed one of the main, if not the main policy tool that smaller economies possess to promote the growth and development of selected economic sectors such as tourism or manufacturing. In the case of the smaller economies the opportunity cost of fiscal incentives has been estimated at 6% of GDP. This domestic policy effect responds to the fact that in smaller economies fiscal policy is a micro rather than a macroeconomic tool.
Fiscal reform has been an impending issue on the economic policy agenda especially in the case of the smaller economies whose tax systems are ridden with complexity and administrative difficulties, a narrow base, a number of loopholes and structural weaknesses. As a result these systems have become ineffective for tax collection and administration. The current proposal for tax reform in some Caribbean countries is comprehensive and contemplates changes in the revenue structure, in trade taxes, the incentives regime, and a reform of the tax administration (Tax reform and administration commission, 2003). Regarding trade taxes the main proposal is the introduction of the Value-Added Tax (VAT), which has proven to yield high coefficients of efficiency in other Caribbean economies such as Barbados and Trinidad and Tobago.
Nevertheless it is important to note that in small open economies the main constraint to growth and development is the foreign exchange constraint. In this sense the success of any fiscal measure will depend on how it relates to the foreign exchange constraint. As long as the fiscal stance is greater than the export performance ratio, whether it be by a fiscal programme of insufficient impact or, more important to the FTAA process, by a sudden deterioration in export performance, a country will experience both an external and internal (i.e., fiscal) disequilibria. Since within this reasoning there is not, necessarily, a priori causality between internal and external balance, a free trade agreement which does not lead to an improvement in the competitiveness of exports or for that matter an increase in imports that overpowers any increase in exports may lead to a fiscal adjustment with the concomitant losses on output and employment. A similar situation may result from a fiscal reform that does not take into account the situation of the external sector.
4.2. Outlining the potential effects of the FTAA

28
Exports to the United States by s
Table 14 CARICOM
pecial program as percentages of the total 1996 - 2002Country Programme
CBTPA CBI GSP CA Ph NPAnguilla n.r. n.r. 7.7 0 n.r. 92.2
81.2 a/Antigua and Barbuda n.r. 9.7 0.6 n.r. n.r. 89.7
81.39a/Bahamas n.r. 20.3 n.r. 0.0 6.3 73.4
70.59Barbados 0.00 44.3 2.9 0.00 7.7 45.1
42.43a/Belize 4.1 37.6 2.3 n.r. n.r. 56.0
34.28a/Dominica n.r. 94.7 0.08 0.001 0.09 5.1Grenada n.r. 48.7 0.2 n.r. n.r. 51.1
94.62a/Guyana 1.9 18.7 2.5 n.r. 0.00 76.8
68.34a/Jamaica 4.9 14.3 0.5 0.2 n.r. 80.3
36.46a/St. Lucia 0.0 31.4 1.9 0.0 n.r. 67.1
31.11a/St. Kitts and Nevis n.r. 73.7 1.5 n.r. 0.45 24.7
St. Vincent and the Grenadines n.r. 36.5 1.8 3.7 n.r. 63.065.24a/
Suriname n.r. n.r. 2.2 n.r. n.r. 97.889.7a/
Trinidad and Tobago 9.8 16.3 0.2 0.0 n.r. 73.844.59a/
Netherlands Antilles n.r 0.70 0.087 n.r. n.r. 99.2British Virgin Islands n.r. 2.59 0.08 1.05 n.r. 96.29
Average totals 3.45 37.18 1.88 0.49 2.91 64.01Average CARICOM 3.45 37.18 1.88 0.49 2.91 64.01
Average RBE 3.32 30.27 1.30 0.034 0.015 64.97Average SBE 0 29.76 1.86 0.79 4.82 70.18
Average NICS 0 1.10 2.62 0.35 0 95.90
Note: CBTPA=Caribbean Basin Trade Partnership Act; CBI= Caribbean Basin Initiative; GSP = General System of Preferences; CA= Civil Aviation; Ph=Pharmaceuticals;NP = No program. n.r.= Not reported.a/ Refers to the percentage of NP exports that pay a 0% tariff rate in the United States. Source: On the basis of USITC (2003).
The evidence available as presented in the second section would lead to the expectation that the formation of the FTAA and the concomitant decline in tariffs will increase intraregional trade. Also in the case of some subregional groupings such as CARICOM, for the reasons presented in Section 1, the decline in tariffs may provoke a change in the composition and structure of intraregional trade.

29
However, there is no guarantee that countries will benefit in an equitable manner. Indeed, the FTAA may lead to a concentration in trade direction and trade specialization. In other words the formation of the FTAA may not lead to an improvement in overall export competitiveness or at most will result in a polarization of export competitiveness.
In this sense the FTAA will not soften the existing constraints or guarantee per se the growth or convergence of income among its members. It may actually lead to the formation of differing growth plateaux and ‘convergence clubs’. The latter are most likely to be formed among countries of similar levels of income and perhaps under specific circumstances between low and high research and development economies through technological spillovers (Schiff and Winters, 2003). A necessary but insufficient condition for the existence of technological spillover among economies of different levels of development is that their levels of productivity should not be too much apart (Targetti and Foti, 1997).
In the case of CARICOM economies, these do not form a ‘convergence club’ with any of the other members of the FTAA and the spillover research and development effects are difficult to measure. Moreover such arguments overlook the fact that knowledge spillovers are provided by CARICOM economies to more developed economies such as the United States through the migration of workers in fundamental areas such as health and education.
The identification of these potential effects brings to the forefront two main issues for CARICOM and more generally smaller economies. First there is an urgent need to develop and enhance the competitiveness of exports. As mentioned earlier, the Caribbean subregion has witnessed the deterioration of export competitiveness and the export promotion strategies are still not fully and coherently articulated. There are however cases of success at the micro level such as those of Martinique and Barbados or the development of technology management centres, which are worth mentioning.
Researchers in Martinique have been able to provide a ready product from the banana using a simple technology. With a market survey showing that the impediment to increasing use of the banana as a staple is the problem associated with peeling and discoloration, researchers have been able to provide a package of bananas ready for cooking when bought at the supermarket. Of course the research and development capabilities in Martinique are not insignificant, being a Departement of France. This has helped to significantly increase the use of the local product.
The other success story comes from the efforts of the Ministry of Trade and Industry in Barbados with their operation of an Industrial Incubator and Industrial Park. The business incubator concept is not new in the subregion. However, “common services” rather than improved research and development capability has been its main argument where it has been experimented. The difference in the Barbados model is that a clear nexus between Micro Enterprises, small and medium enterprises (SMEs), and industrial development in general was established with one feeding into the other. The programme facilitates the growth and movement from micro to small to medium and beyond, if necessary, through a series of incentives, business management, product development and market research. Each phase has a specific time frame for meeting targets and graduating from one to the other.

30
Technology management or development centres have been operating in other parts of the subregion such as the Dominican Republic, Cuba and further afield, in Costa Rica, where their contribution to agro processing and other product development, including the making of paper from the banana fibre is well known. There are, of course, some other success stories in the region, namely Willies Ice-cream Company of Trinidad and Tobago, which started off as a small business with mobile carts selling ice-cream on street corners to ice cream shop franchises and supermarkets to eventually making inroads into the regional and North American markets. There are other examples of small business, which have been able to penetrate the United States market, but by and large the count is not high. It may be necessary, therefore, to outline the steps and decisions taken to make these stories reality.
Second, since it is argued that the basic difference between product producer and nonproducer (develop and developing economy and in Latin America and the Caribbean between larger and smaller economies) is the technology gap, it is clear that greater attention should be paid to research and development and funding to sustain continuous research. In that respect, the research institutions like the Produce Chemist Laboratories (PCLs) should be re-established with clear mandates and funding. Other institutions should be funded at a sufficiently high level to provide for a critical mass of indigenous knowledge to drive the competitiveness process nationally and regionally.
To encourage entrepreneurship it is necessary to provide incentives, especially start up and risk capital to the micro and small enterprises at the national level. Governments may wish to consider a levy on some business activities that can be matched from the consolidated fund to provide some funding for the above. Funding for research cannot be left to outside grants or aid that is not reliable or consistent.
Institutions of higher learning at the national level and regionally should develop integral linkages to industry, where research and development, knowledge dissemination and teaching form a nexus.
Areas of focus in production, marketing and development should be identified at both the national and regional levels and a detailed plan developed and implemented for attaining the desired objectives.
The industrial development thrust in the subregion, with the exception of Trinidad and Tobago and Jamaica, has not been driven by the natural resource base, either nationally or regionally. It may be necessary to shift the focus to agricultural industrialization as a base or starting point for general industrialization.
Small enterprises that already make up a significant portion of economic activity in the subregion should be seen as the platform for improved product development. At present this is apparent mostly in terms of poverty reduction schemes that are short term in nature and uncoordinated nationally.
Science and technology popularization programmes should be developed and sustained nationally to continue to provide the entrepreneurial pool and the knowledge base for an research

31
and development platform. Countries that are at the advanced stages of development are those that have had such programmes from the primary school level.
A deliberate bias in favour of the natural and/or pure sciences should be built into the school curriculum to counter what is an obvious shortcoming of the present system. National programmes of incentives and recognition of achievements should be implemented to promote excellence in science and technology.
These issues have a direct linkage to the question of investment flows and the impact of the formation of a free trade area on the direction of these flows for member and non-member countries. There is empirical evidence stating that the formation of an FTAA may lead to a temporary investment boom and this can be conducive to economic growth. Also some evidence shows that a regional agreement or free trade area can absorb investment that, otherwise, would have been directed towards non-members. The relevant case quoted in the literature is that of the effect of the formation of the European Community’s Single Market Programme on the European Free Trade Association (EFTA) countries, which led to investment switching from the latter to the former. Nonetheless the question remains as to whether the investment switching phenomenon responded to short-run or more permanent factors (Schiff and Winters, 2003).
In addition for non-members (i.e., NICCs) the reduction of tariffs, given the size of the FTAA, will affect their terms of trade. Several scenarios can be envisaged. Within an FTAA a decline in tariffs that is translated into a cost and price reduction will give its members a price competitive advantage over non-members encouraging these to follow suit. In addition, if the FTAA accounts for a large share of the output of the goods affected by the decline in prices, nonmembers may also be forced to cut prices incurring in income losses for the factors of production engaged in producing those same goods. Obviously a similar situation can also occur via income effects, say due to a drop in demand for a given set of products from FTAA member countries.
Investment switching and the negative effect of the terms of trade will be partly balanced by the fact that the FTAA may not, due to existing market access arrangements, result in trade deviation away from the exports of the NICCS. The United States import market is effectively open to NICCs imports. The majority of all of NICCs exports (95% of the total) enter under no programme at all (see Table 14 above) but are imported by the United States with a 0% ad valorem tariff rate and only in some cases do other import charges apply.9 As a result, as long as the NICCs are able to maintain this type of market access the effect of the FTAA on trade diversion may not be a significant one.
Thus overall it can be said that for member countries the impacts of the FTAA are likely to centre on trade intensity and trade structure and on the relationship between internal balance and the foreign exchange constraint. For non-member countries (which, as shown in Figure 4, have remained over time on the frontier of GDP per capita convergence) the effects are likely to focus on the terms of trade and on investment switching. For these countries, given the present structure of market access, the possibilities of trade diversion are small.
9 The United States has five special import programmes. These are the Caribbean Basin Trade Partnership Act (CBTPA), the Caribbean Basin Initiative (CBI), the Generalized System of Preferences (GSP), the Civil Aviation Programme, and the special treatment to pharmaceuticals.9

32
[INSERT FIGURE 4]

33
Finally it should be stated that the FTAA has a microeconomic dimension that must be explored in greater detail and which has been to some extent overlooked in the existing literature. The microeconomic dimension relates to the effect of the FTAA on firms and in particular SMEs.
Caribbean governments have all bought into the idea that SMEs can contribute significantly to the economic development process of the subregion. As a result, there has been much discussion, meetings, and seminars in the subregion on small and medium-sized industries, but by all accounts the growth and sustainability of SMEs are below expectation. In the policy sphere, there has been no link between SME policy and industrial policy in the subregion. While activities, including tourism activities, designated as industrial, enjoy incentives and tax free holidays, the small entrepreneur has limited access to assistance from the public sector. There are small business development centres and agencies that are supposed to assist but these are, for the most part, understaffed and undertrained.
There exist SME institutions in the subregion such as the Sustainable Economic Development Units (SEDUs) in the OECS, business development centres in the Dutch Antilles and the small business agencies in the other countries of the subregion, which focus mainly on business plan development and some business management training. The PCLs that were established in the OECS in the 1970s to research and promote agro-industrial development have all but disappeared, and the two that exist are woefully understaffed and underfunded. Research institutions such as the Caribbean Industrial Research Institute (CARIRI) in Trinidad; the Scientific Research Council (SRC) in Jamaica and the Institute of Applied Science and Technology (IAST) in Guyana never realized their full potential as generators of products for a number of reasons, not the least of which was financing. Table 4 gives some indication of the research and development efforts across countries. It is only in more recent times, with the Science and Technology Indicators Programme in the Caribbean that attempts are being made to collect information on research and development spending in the subregion. The Science and Technology Indicators Programme in the subregion is in its infant stages and therefore information on research and development spending in the subregion is sparse.
These are but a few of the micro aspects that need to be considered if, especially, the small countries within the FTAA hope to be able to provide some products to this proposed enlarged market. It will surely require technology transfer and other mechanisms to meet shortfalls, but it has been shown that technology transfer and other assistance mechanisms are only beneficial if the receiving State has the capacity to absorb. Capacity to absorb, though, requires a minimal level of industrial capability, institutional support, sustained financial commitment and long-term policy directives. Or else those ahead will always be ahead.

34
References
Caribbean Tourism Organization (2001-2002). Caribbean Tourism Statistical Report. St. Michael: Barbados.
Caribtrade. Caribbean Trade Data Base. ECLAC Subregional Headquarters for the Caribbean. 2003.
CARICOM Secretariat (2002) CARICOM Secretariat. Final Report on Component III. Inventory o f non-tariff, trade restricting measures applied by member states o f the Caribbean Community.
CARICOM-Secretariat (2002) Review o f Trade Policy Instruments and Administrative Practices Governing the Operation o f the CARICOM CET and Rules o f Origin. Final Report . Trevor Hamilton and Associates.
CARICOM. (1991) Revised Treaty o f Chaguaramas Establishing The Caribbean Community Including the CARICOM Single Market and Economy.
Clegg, P. (2000) The Development o f the Windward Islands Banana Export Trade: Commercial Opportunity & Colonial Necessity. The Society For Caribbean Studies Annual Conference Paper, Vol1. http://www.scsonline.freeserve.co.uk/olvol1.html
Competitive Analysis of Nations. Software Program. Version 2002, Trade CAN. ECLAC.Santiago Chile. Chile.
ECLAC (2002)Globalization and Development. 29th ECLAC Session Period, 6-10 of May 2002. LC/G.2157(SES.29/3). 9 April 2002.
Findlay, R. (1995) Factor proportions, trade and growth. The MIT Press: Cambridge.
Grimwade, N. (1996) International Trade Policy .New York: Routledge.
Grossman, L.S. (1994) British A id and Windward Bananas: The Case o f St. Vincent and the Grenadines. Social and Economic Studies, 43:1, pp.151-179.
IMF (2002). International Financial Statistics. Yearbook, 2002. International Monetary Fund: Washington D.C.
International Trade Center (2000) Trade Secrets. The Export Answer Book fo r Small and Medium-Sized Exporters. International Trade Center UNCTAD/WTO (ITC): Port of Spain..
Itam, S., Cueva, S., Lundback, E., Stotsky, J. and Tokarick, S. (2000) Developments and Challenges in the Caribbean Region. Occasional Paper 201. IMF, Washington, D.C..

35
Module to analyze the growth of international commerce (MAGIC), 2003. ECLAC Subregional Headquarters in Mexico City.
Moreno-Brid, J.C. (2002) Porqué fue tan bajo el creciemiento económico de América Latina en los noventa? (una interpretación estructuralista). Inédito.
McIntyre A.M. (1995) Trade and Economic Development in Small Open Economies. The Case of the Caribbean Countries. Westport:Praeger.
National Economic Research Associate s. (NERA) (2003) Banana exports from the Caribbean since 1992. Prepared by NERA for the Caribbean Banana Exporters Association.
Panagariya, A. (2000) Preferential Trade Liberalization: The Traditional Theory and New Developments, Journal of Economic Literature, Volume XXXVIII, Number 2. pp. 287-331.
Sauvé, P. & Stern, R.M. (2000) gats 2000 new directions in services trade liberalization. Washington D.C.: The Brookings Institution.
Schiff M. & Winters, A. (2003) Regional Integration and Development (Washington: Oxford University Press and the World Bank).
Targetti, F. and Foti, A. (1997) Growth and productivity: a model o f cumulative growth andcatching-up, Cambridge Journal of Economics, Vol.21, 27-43.
UNCTAD (2002) UNCTAD Handbook o f Statistics, 2002. United Nations: Geneva.
Van Beek, F., Rosales, J.R., Zermeño, M. Randall, R. Shepherd, J. (2000) The Eastern Caribbean Currency Union. Institutions, Performance, and Policy Issues. IMF, Occasional Paper 195. Washington D.C.
USITC (2003). Trade data.
World Bank (2002) Caribbean Group for Cooperation in Economic Development. Development Assistance and Economic Development in the Caribbean Region: Is there a correlation? Discussion Draft. World Bank., Washington D.C.
World Bank (2002) Caribbean Group for Cooperation in Economic Development. Macroeconomic Volatility, household vulnerability, and institutional and policy responses. Discussion Draft. World Bank., Washington D.C.
World Trade Organization.(2002) Small Economies: A Literature Review. Note by the Secretariat. WT/COMTD/SE/W/4.