Tutorial: Getting Started with myPROJECT Designernsa.myscada.org/manuals/version6/PD getting started...
72
Tutorial: Getting Started with myPROJECT Designer by mySCADA Technologies, Jan. 2014
Transcript of Tutorial: Getting Started with myPROJECT Designernsa.myscada.org/manuals/version6/PD getting started...

Tutorial: Getting Started with
myPROJECT Designerby mySCADA Technologies, Jan. 2014
Introduction to myPROJECT DesignerAll-in-one Development Platform
mySCADA > Mobile > Compact > Panel > Desktop > Server Series
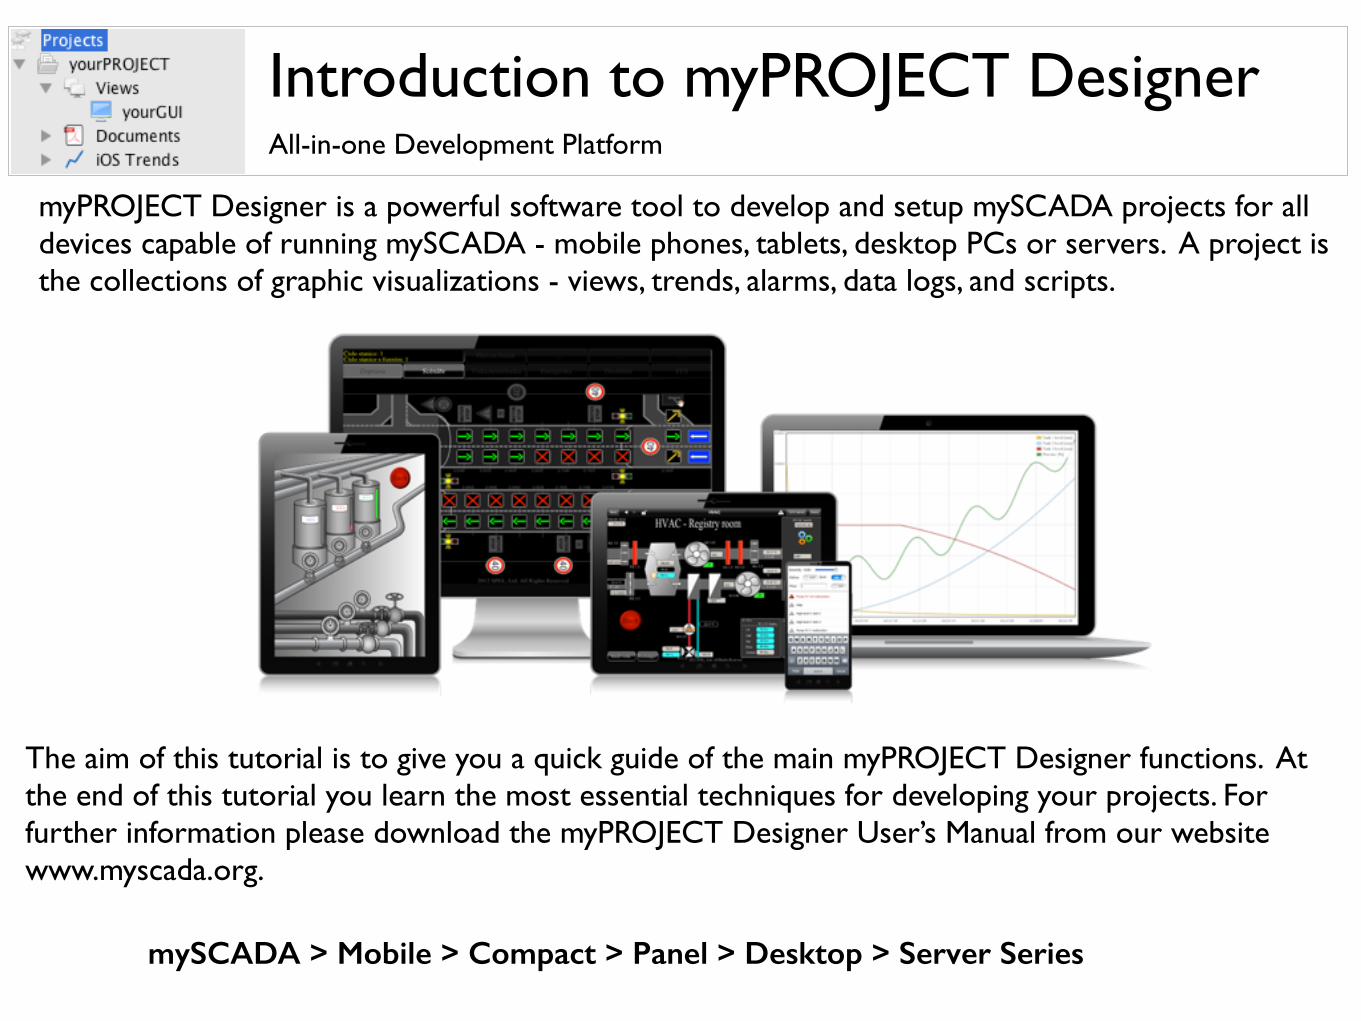
myPROJECT Designer is a powerful software tool to develop and setup mySCADA projects for all devices capable of running mySCADA - mobile phones, tablets, desktop PCs or servers. A project is the collections of graphic visualizations - views, trends, alarms, data logs, and scripts.
The aim of this tutorial is to give you a quick guide of the main myPROJECT Designer functions. At the end of this tutorial you learn the most essential techniques for developing your projects. For further information please download the myPROJECT Designer User’s Manual from our website www.myscada.org.
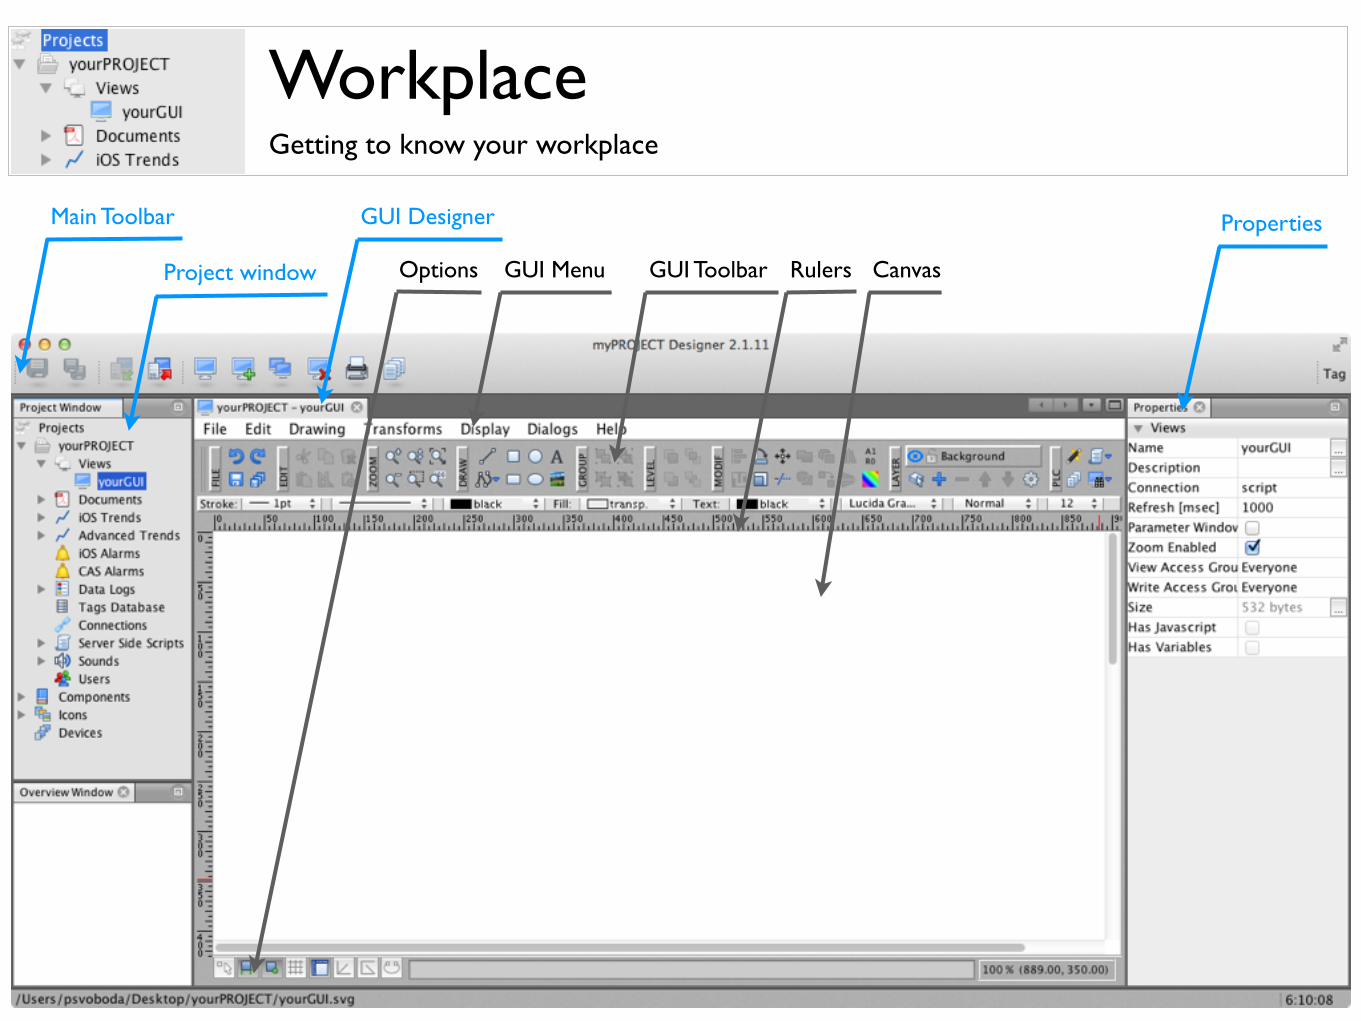
WorkplaceGetting to know your workplace
Main Toolbar
Project window
GUI Designer
GUI Menu GUI Toolbar Rulers CanvasOptions
Properties
Managing Workplace - WindowsGetting to know your workplace
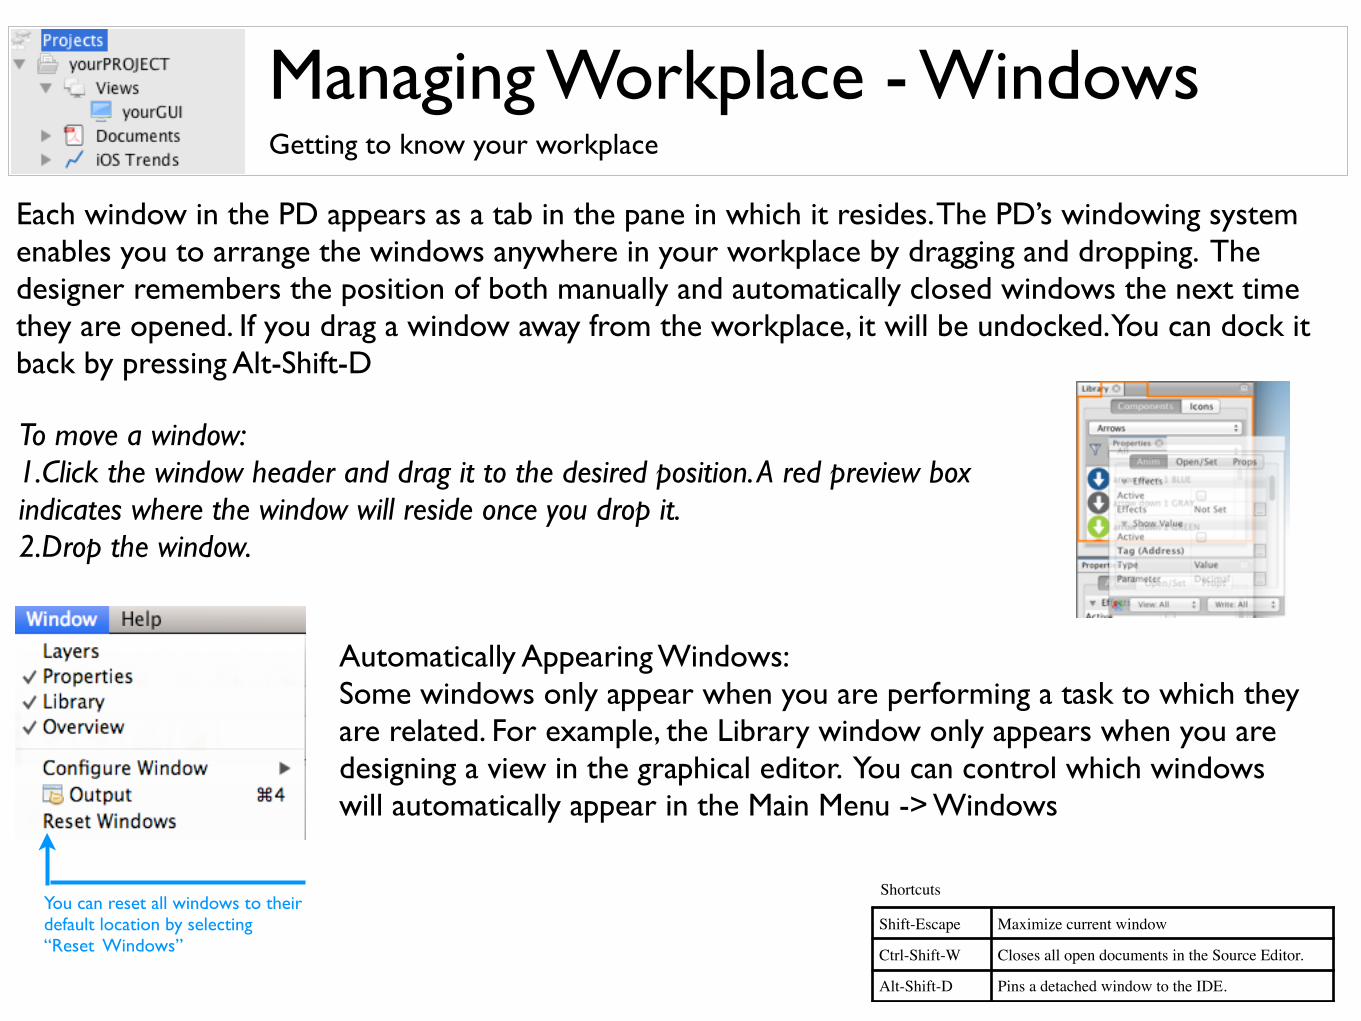
Each window in the PD appears as a tab in the pane in which it resides. The PD’s windowing system enables you to arrange the windows anywhere in your workplace by dragging and dropping. The designer remembers the position of both manually and automatically closed windows the next time they are opened. If you drag a window away from the workplace, it will be undocked. You can dock it back by pressing Alt-Shift-D
To move a window:1.Click the window header and drag it to the desired position. A red preview box indicates where the window will reside once you drop it.2.Drop the window.
Automatically Appearing Windows:Some windows only appear when you are performing a task to which they are related. For example, the Library window only appears when you are designing a view in the graphical editor. You can control which windows will automatically appear in the Main Menu -> Windows
You can reset all windows to theirdefault location by selecting “Reset Windows”
Shift-Escape Maximize current window
Ctrl-Shift-W Closes all open documents in the Source Editor.
Alt-Shift-D Pins a detached window to the IDE.
Shortcuts

Creating a New ProjectGetting to know your workplace
To start working with myPROJECT Designer, you must first create a new project.
1.Select Projects in the Project window.2.Click the New Project icon on the main toolbar.3.Select Empty Project or Project Wizard.
• use the “New Project” command from the Projects on the main menu to create an empty new project, or
• click the New Project icon on the main toolbar to create an empty new project, or
• click the New Project on the main toolbar. and select New Project Wizard. If you select this option, the wizard guides you through several simple steps to create a functional base of your new project. The wizard creates for you a new PLC connection, set up a simple screen with animations, preconfigure alarms and data logging.
Creating PLC ConnectionsConnecting to your technology
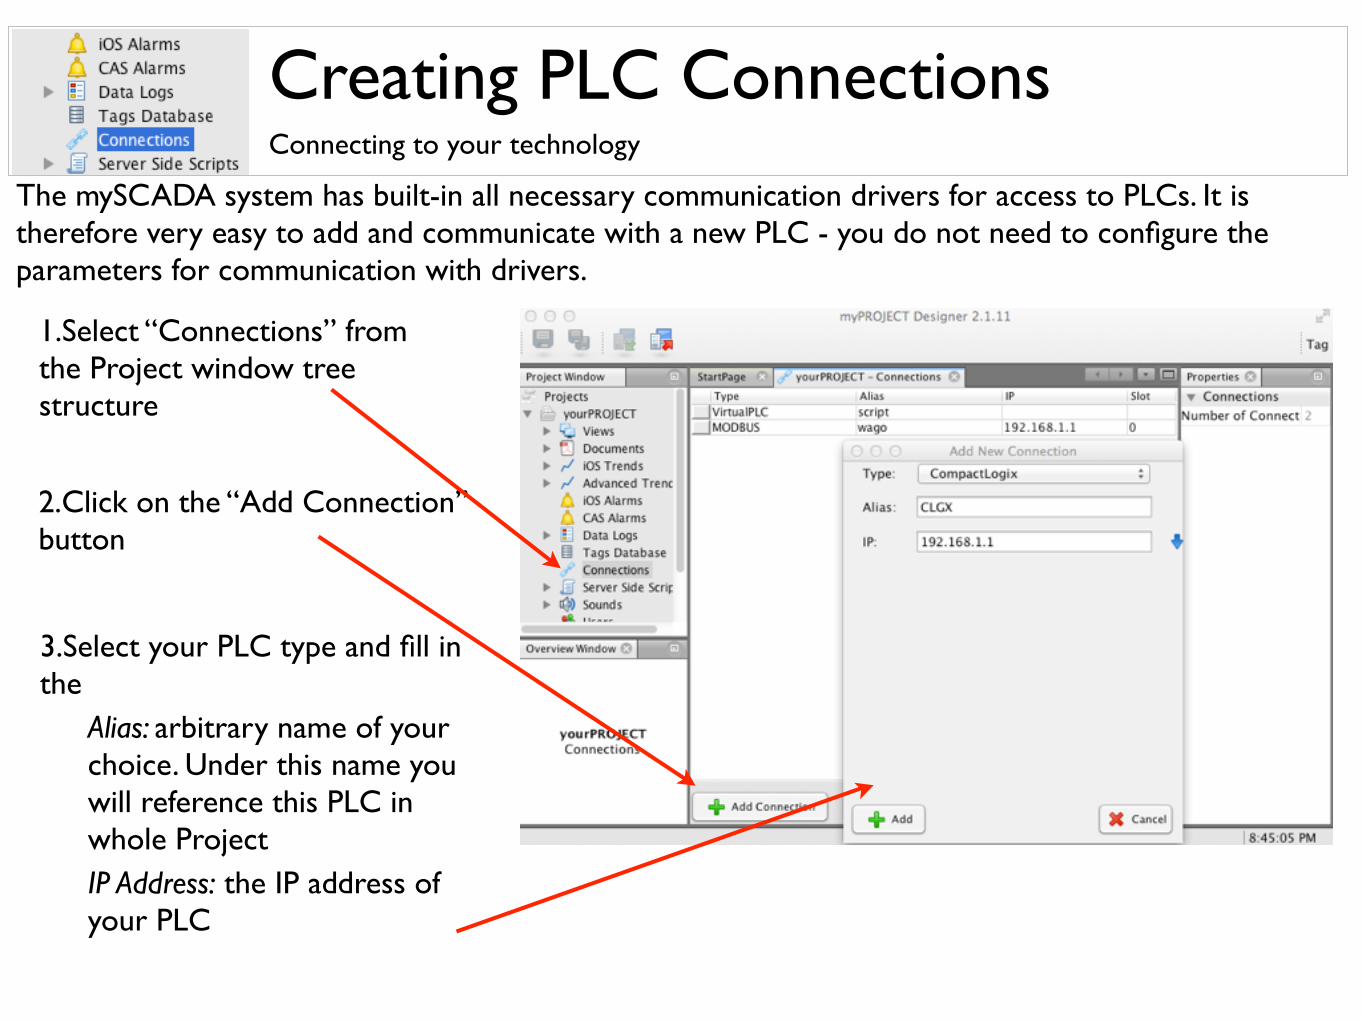
1.Select “Connections” from the Project window tree structure
2.Click on the “Add Connection” button
3.Select your PLC type and fill in the
Alias: arbitrary name of your choice. Under this name you will reference this PLC in whole ProjectIP Address: the IP address of your PLC
The mySCADA system has built-in all necessary communication drivers for access to PLCs. It is therefore very easy to add and communicate with a new PLC - you do not need to configure the parameters for communication with drivers.
Creating Graphics - ViewsCreating Graphics
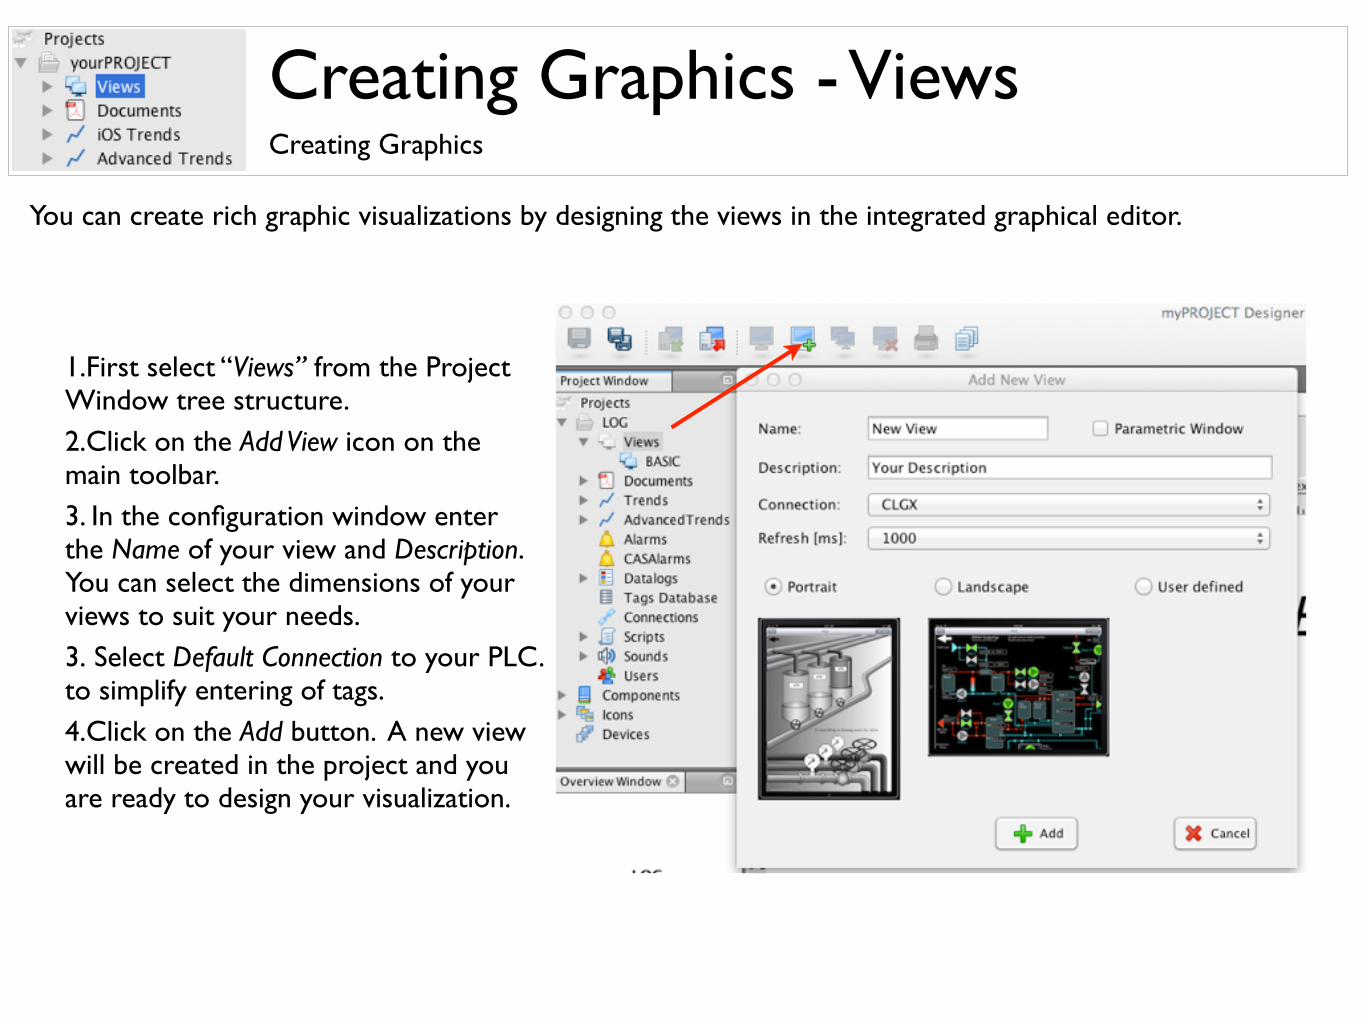
1.First select “Views” from the Project Window tree structure. 2.Click on the Add View icon on the main toolbar.3. In the configuration window enter the Name of your view and Description. You can select the dimensions of your views to suit your needs.3. Select Default Connection to your PLC. to simplify entering of tags. 4.Click on the Add button. A new view will be created in the project and you are ready to design your visualization.
You can create rich graphic visualizations by designing the views in the integrated graphical editor.
Creating Graphics - ViewsCreating Graphics
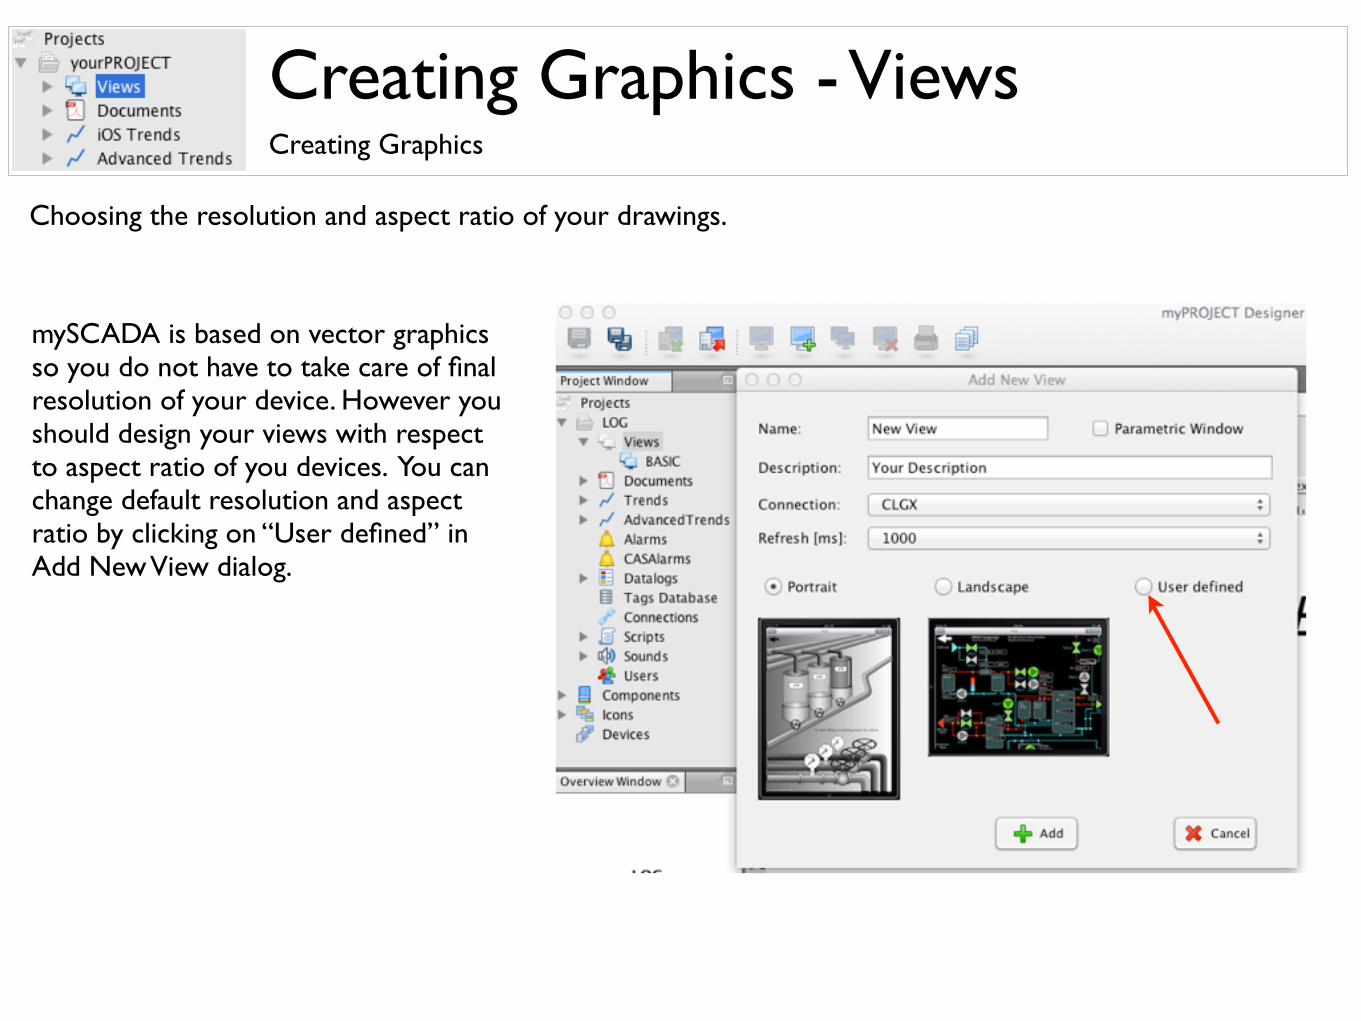
mySCADA is based on vector graphics so you do not have to take care of final resolution of your device. However you should design your views with respect to aspect ratio of you devices. You can change default resolution and aspect ratio by clicking on “User defined” in Add New View dialog.
Choosing the resolution and aspect ratio of your drawings.
Layouts & ViewsCreating Graphics
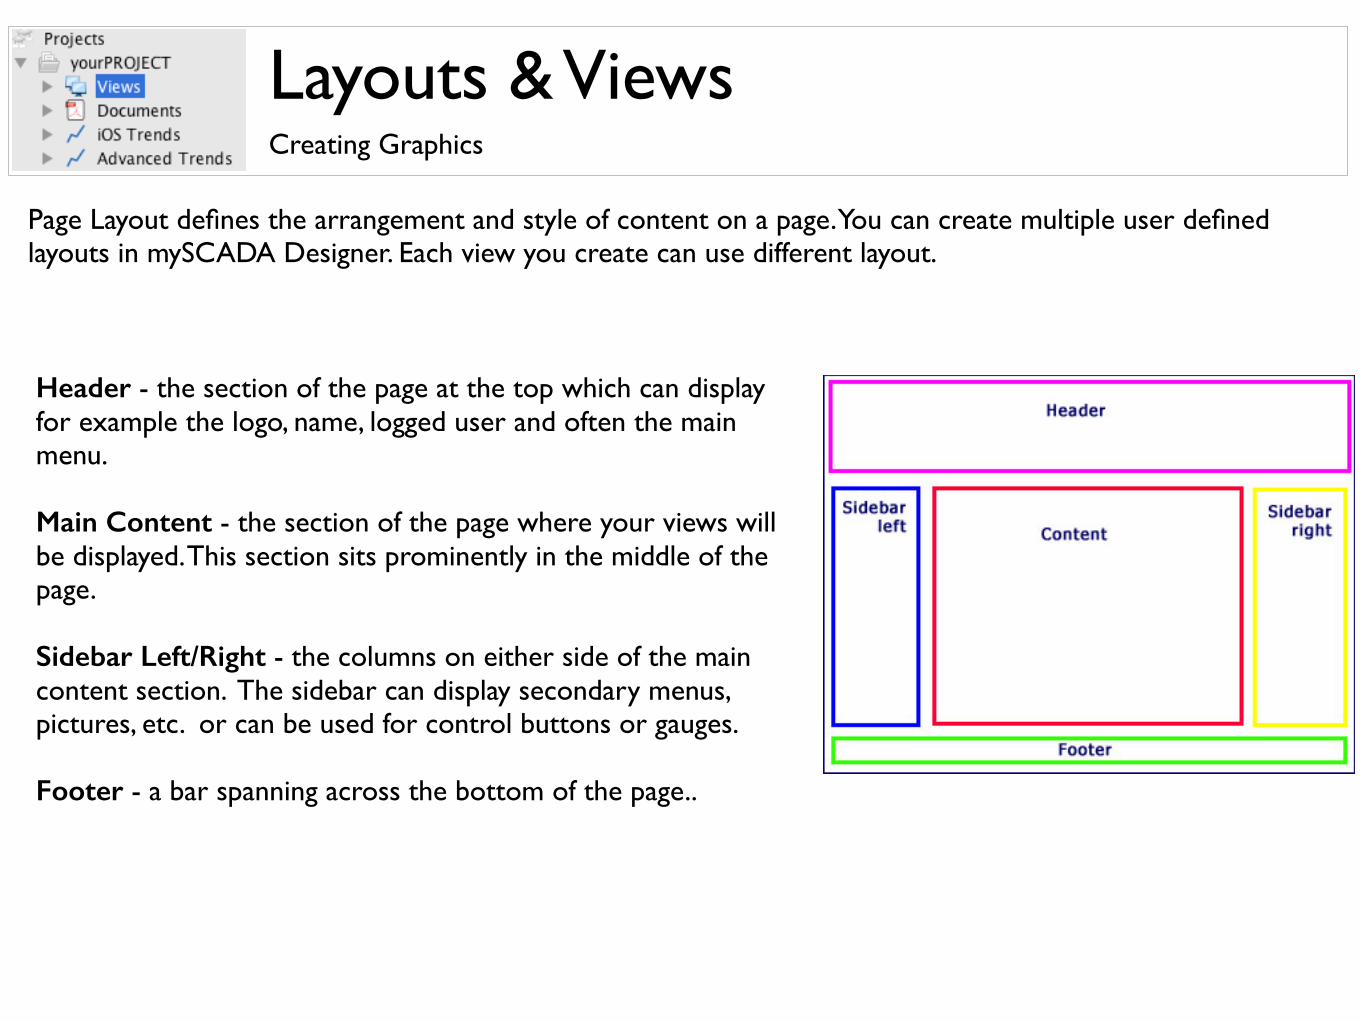
Header - the section of the page at the top which can display for example the logo, name, logged user and often the main menu.
Main Content - the section of the page where your views will be displayed. This section sits prominently in the middle of the page.
Sidebar Left/Right - the columns on either side of the main content section. The sidebar can display secondary menus, pictures, etc. or can be used for control buttons or gauges.
Footer - a bar spanning across the bottom of the page..
Page Layout defines the arrangement and style of content on a page. You can create multiple user defined layouts in mySCADA Designer. Each view you create can use different layout.
Layouts & ViewsCreating Graphics
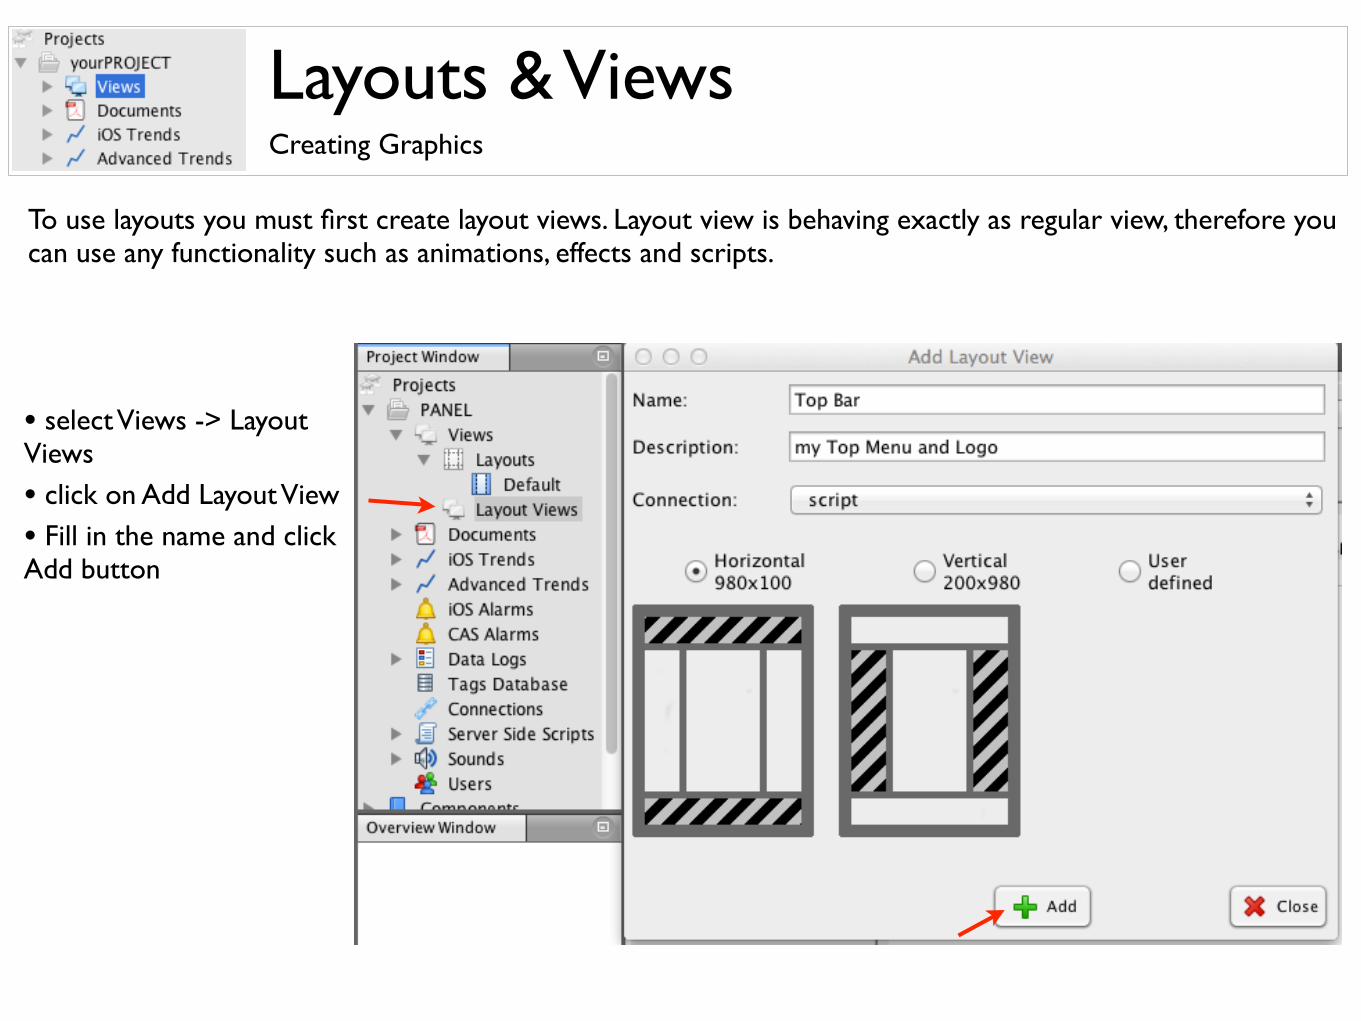
• select Views -> Layout Views
• click on Add Layout View
• Fill in the name and click Add button
To use layouts you must first create layout views. Layout view is behaving exactly as regular view, therefore you can use any functionality such as animations, effects and scripts.
Layouts & ViewsCreating Graphics
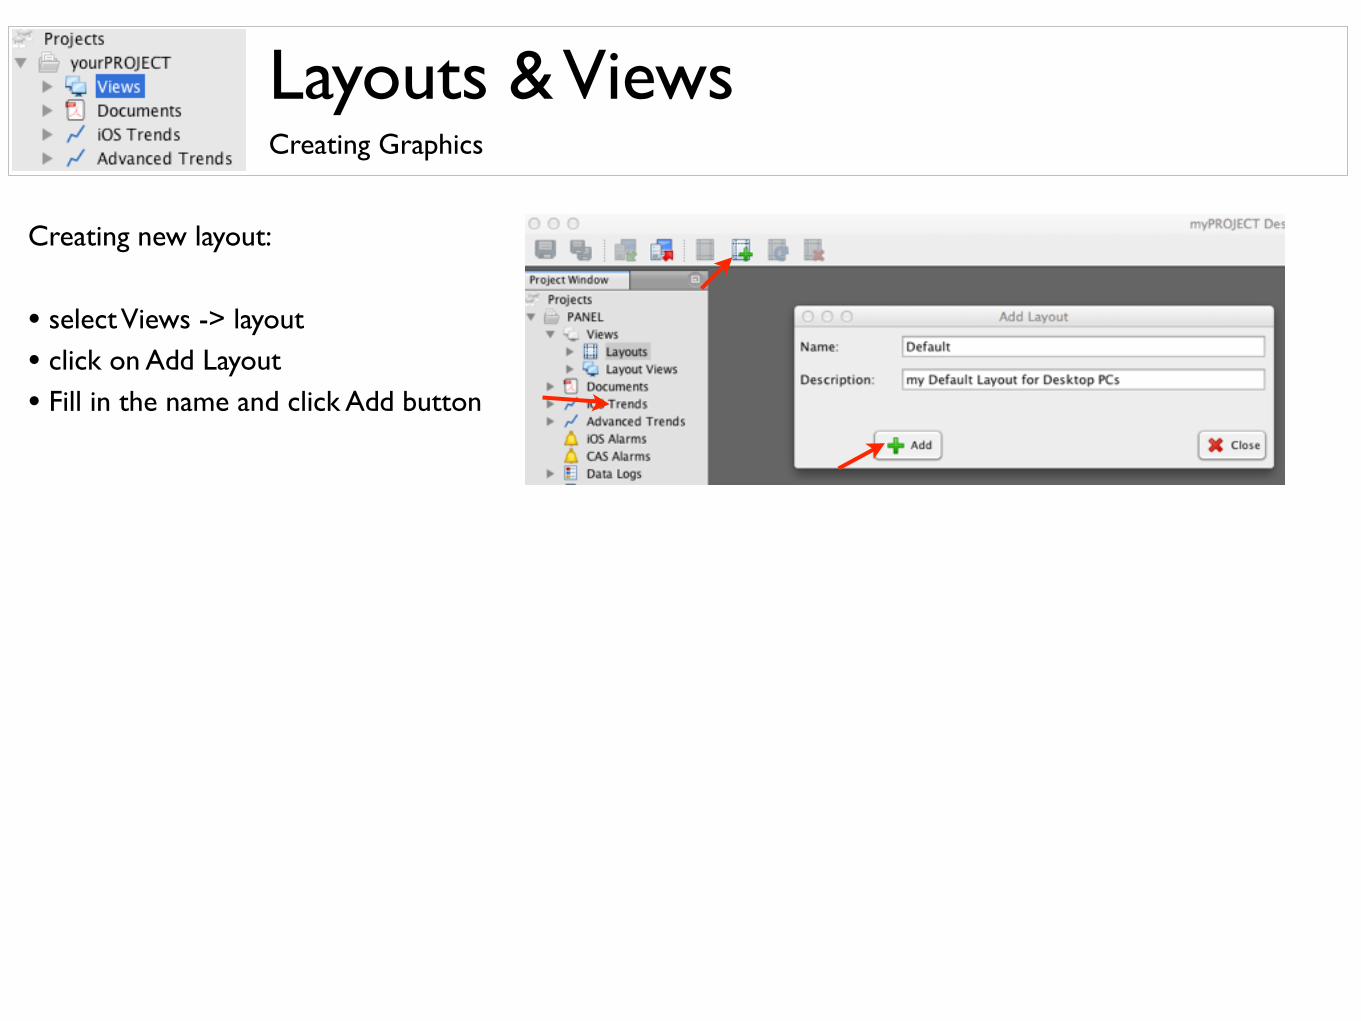
• select Views -> layout
• click on Add Layout
• Fill in the name and click Add button
Creating new layout:
Creating Graphics - Layouts & ViewsCreating Graphics
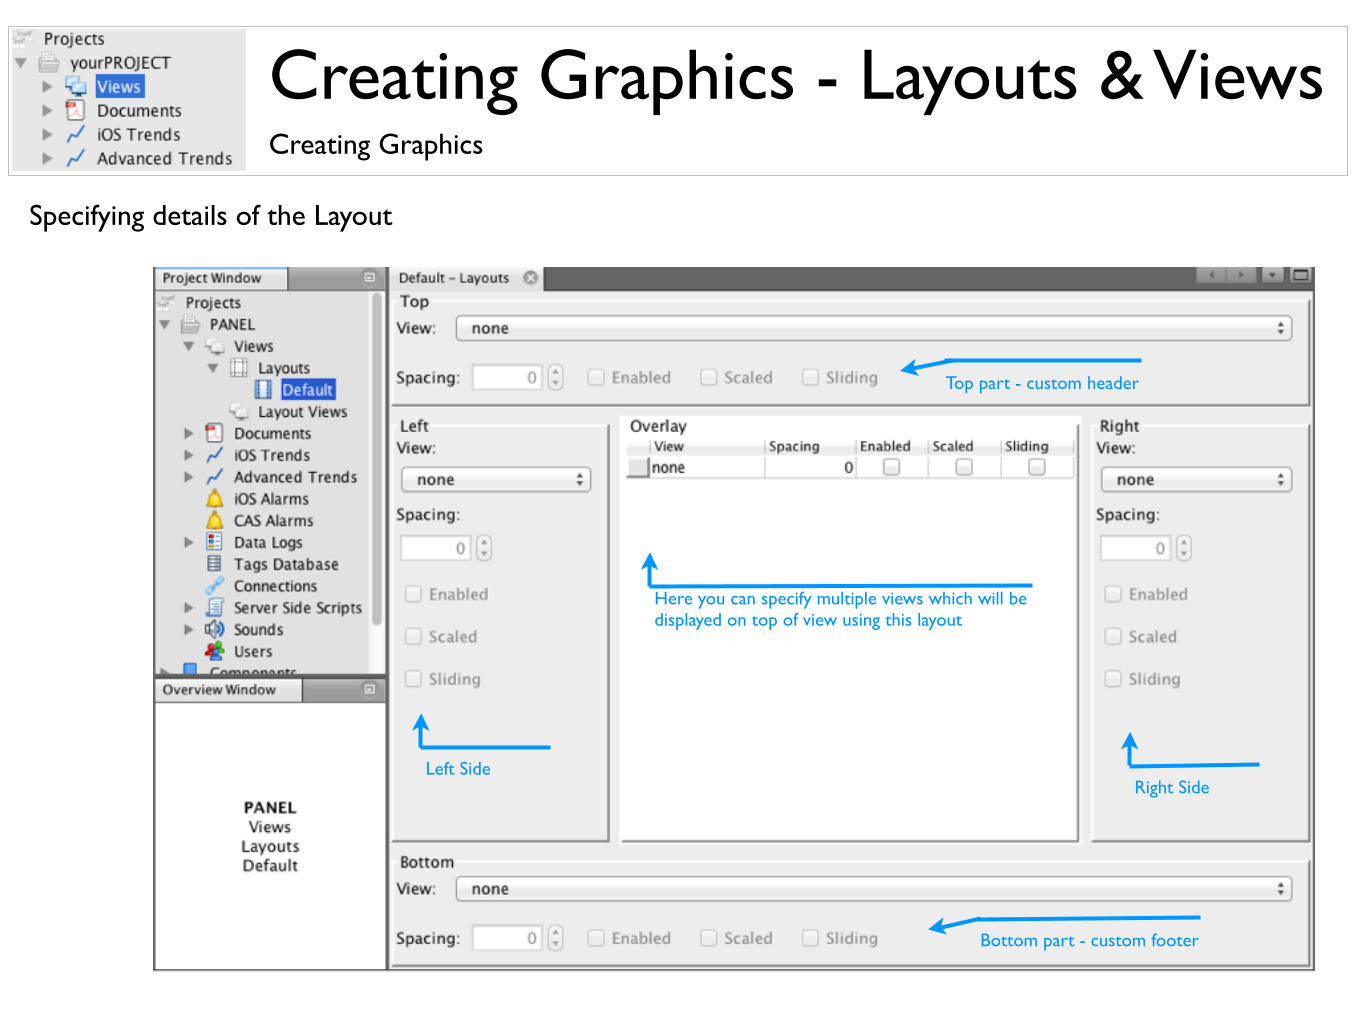
Specifying details of the Layout
Right SideLeft Side
Top part - custom header
Bottom part - custom footer
Here you can specify multiple views which will bedisplayed on top of view using this layout
Creating Graphics - Layouts & ViewsCreating Graphics
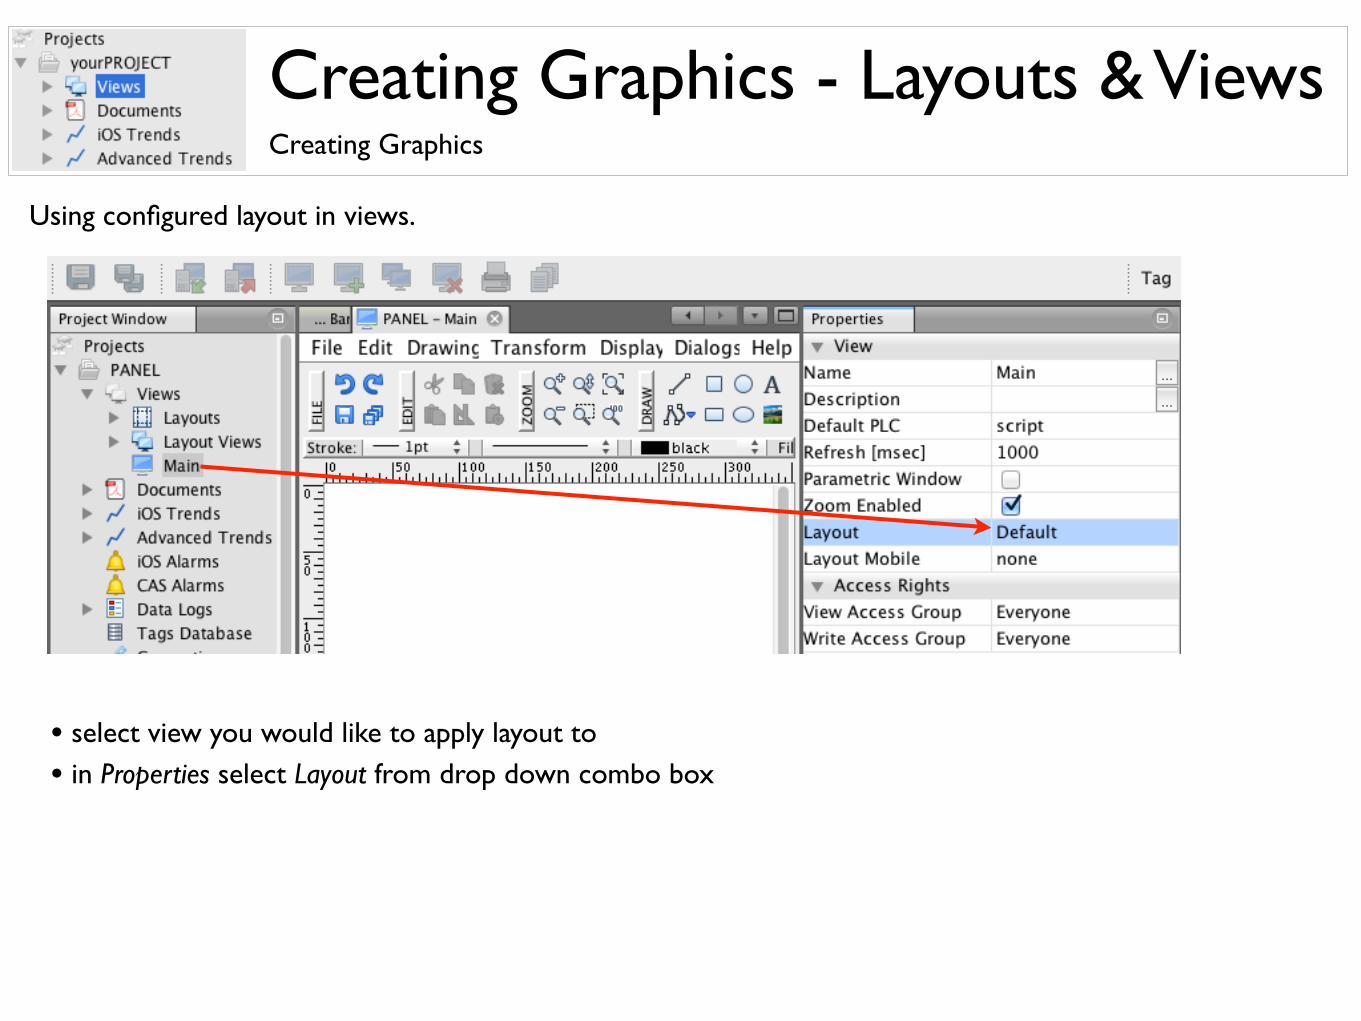
Using configured layout in views.
• select view you would like to apply layout to
• in Properties select Layout from drop down combo box
GUI ToolbarCreating Graphics
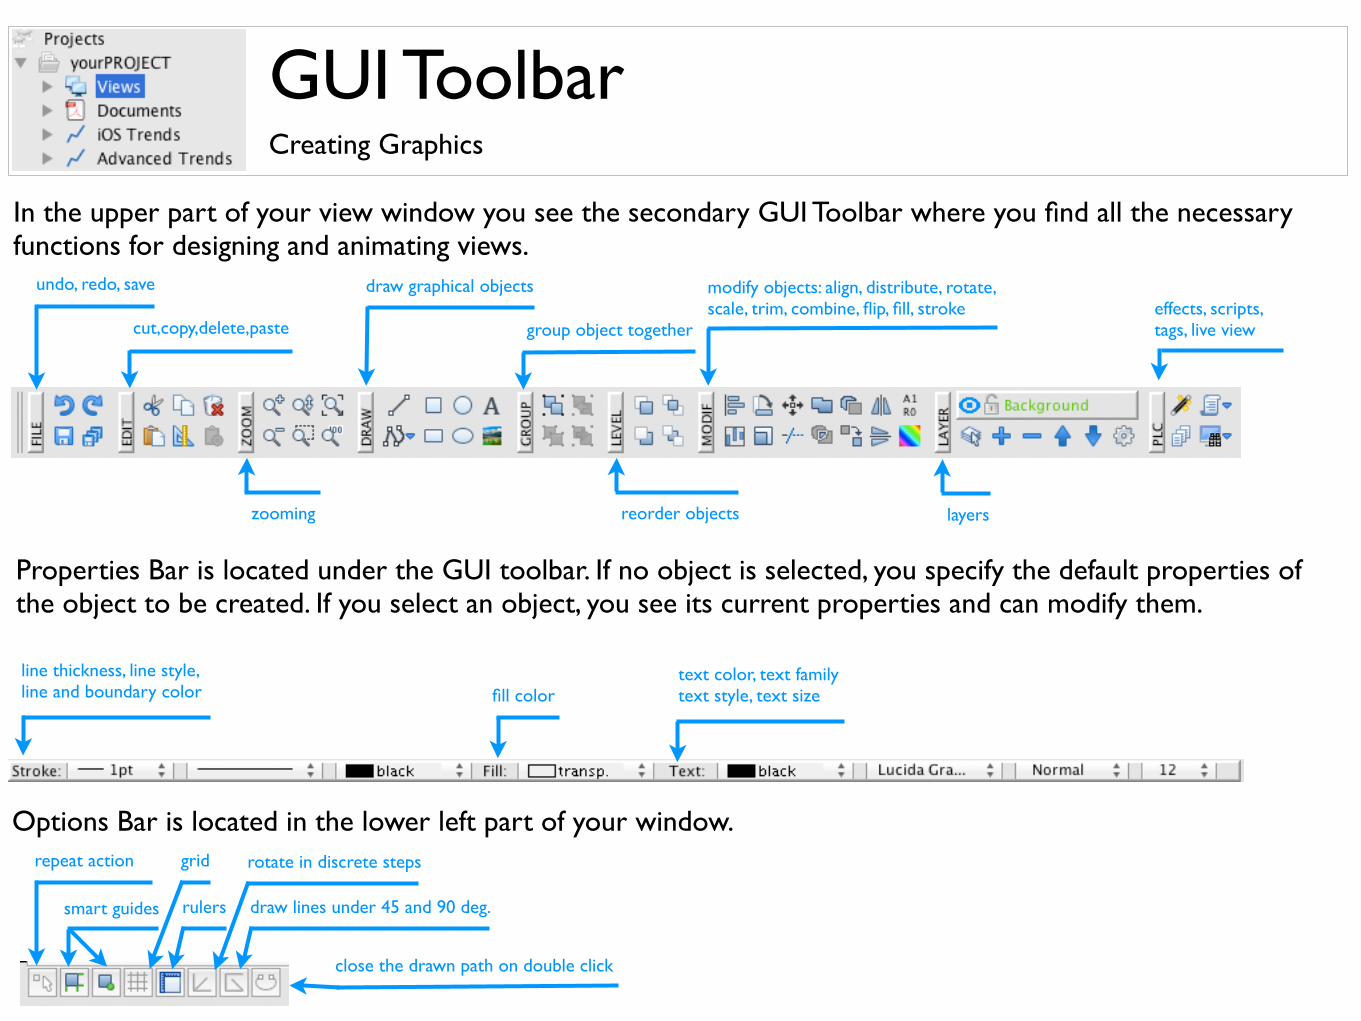
In the upper part of your view window you see the secondary GUI Toolbar where you find all the necessary functions for designing and animating views.
undo, redo, save
cut,copy,delete,paste
zooming
draw graphical objects
group object together
reorder objects
modify objects: align, distribute, rotate,scale, trim, combine, flip, fill, stroke
layers
effects, scripts, tags, live view
Properties Bar is located under the GUI toolbar. If no object is selected, you specify the default properties of the object to be created. If you select an object, you see its current properties and can modify them.
line thickness, line style,line and boundary color fill color
text color, text familytext style, text size
Options Bar is located in the lower left part of your window. repeat action
smart guides
grid
rulers
rotate in discrete steps
draw lines under 45 and 90 deg.
close the drawn path on double click
Drawing PrimitivesCreating Graphics
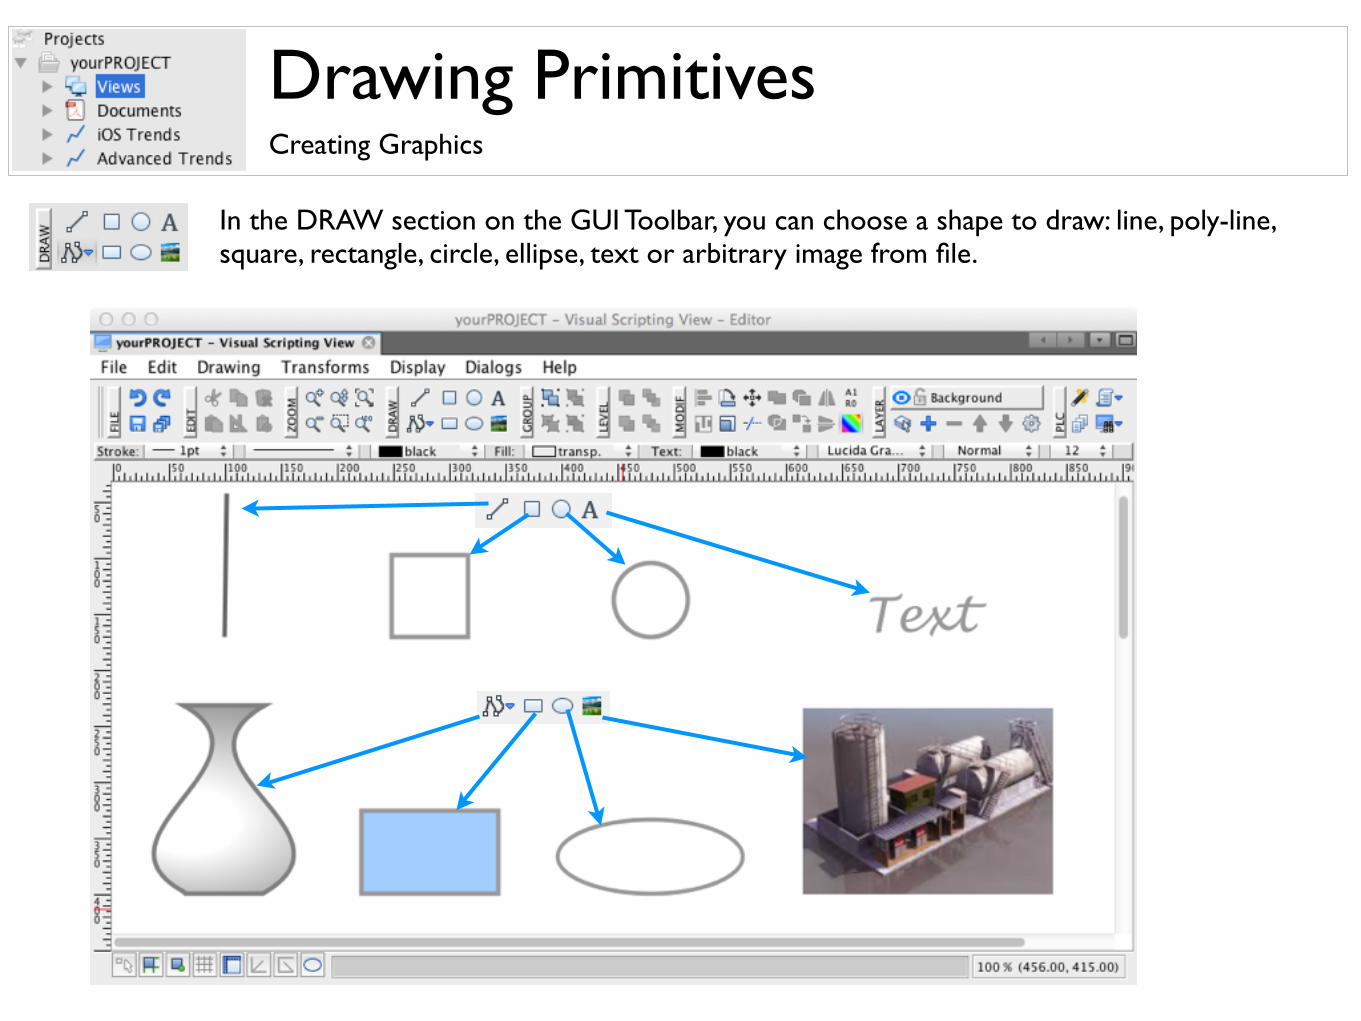
In the DRAW section on the GUI Toolbar, you can choose a shape to draw: line, poly-line, square, rectangle, circle, ellipse, text or arbitrary image from file.
Drawing Poly-linesCreating Graphics
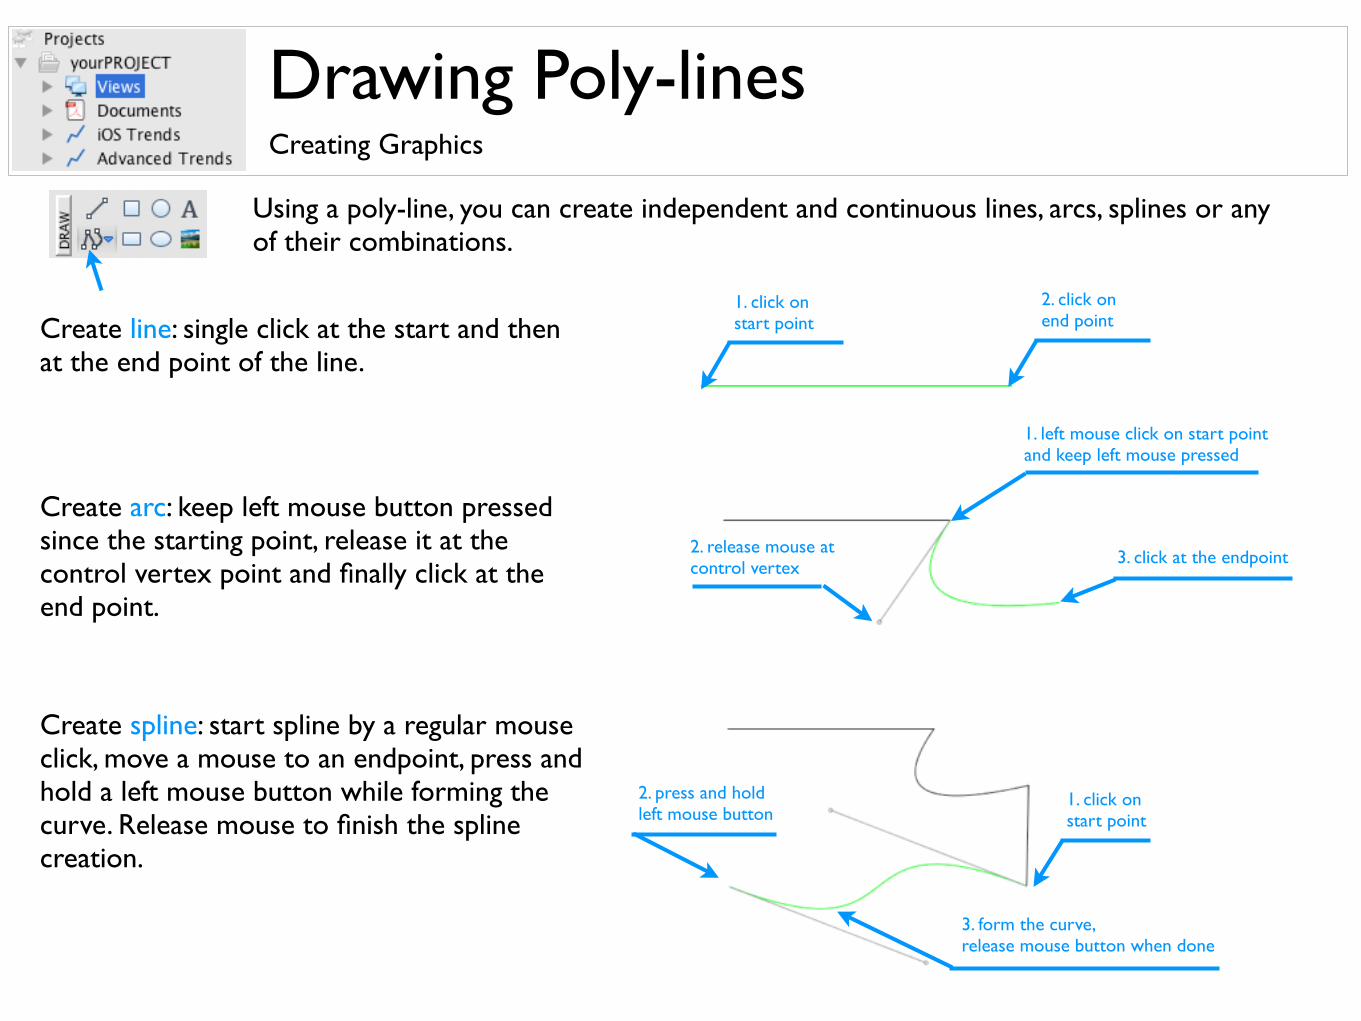
Using a poly-line, you can create independent and continuous lines, arcs, splines or any of their combinations.
Create line: single click at the start and then at the end point of the line.
Create arc: keep left mouse button pressed since the starting point, release it at the control vertex point and finally click at the end point.
Create spline: start spline by a regular mouse click, move a mouse to an endpoint, press and hold a left mouse button while forming the curve. Release mouse to finish the spline creation.
1. click on start point
2. click onend point
1. left mouse click on start pointand keep left mouse pressed
2. release mouse atcontrol vertex 3. click at the endpoint
1. click on start point
2. press and holdleft mouse button
3. form the curve,release mouse button when done
Drawing Poly-linesCreating Graphics
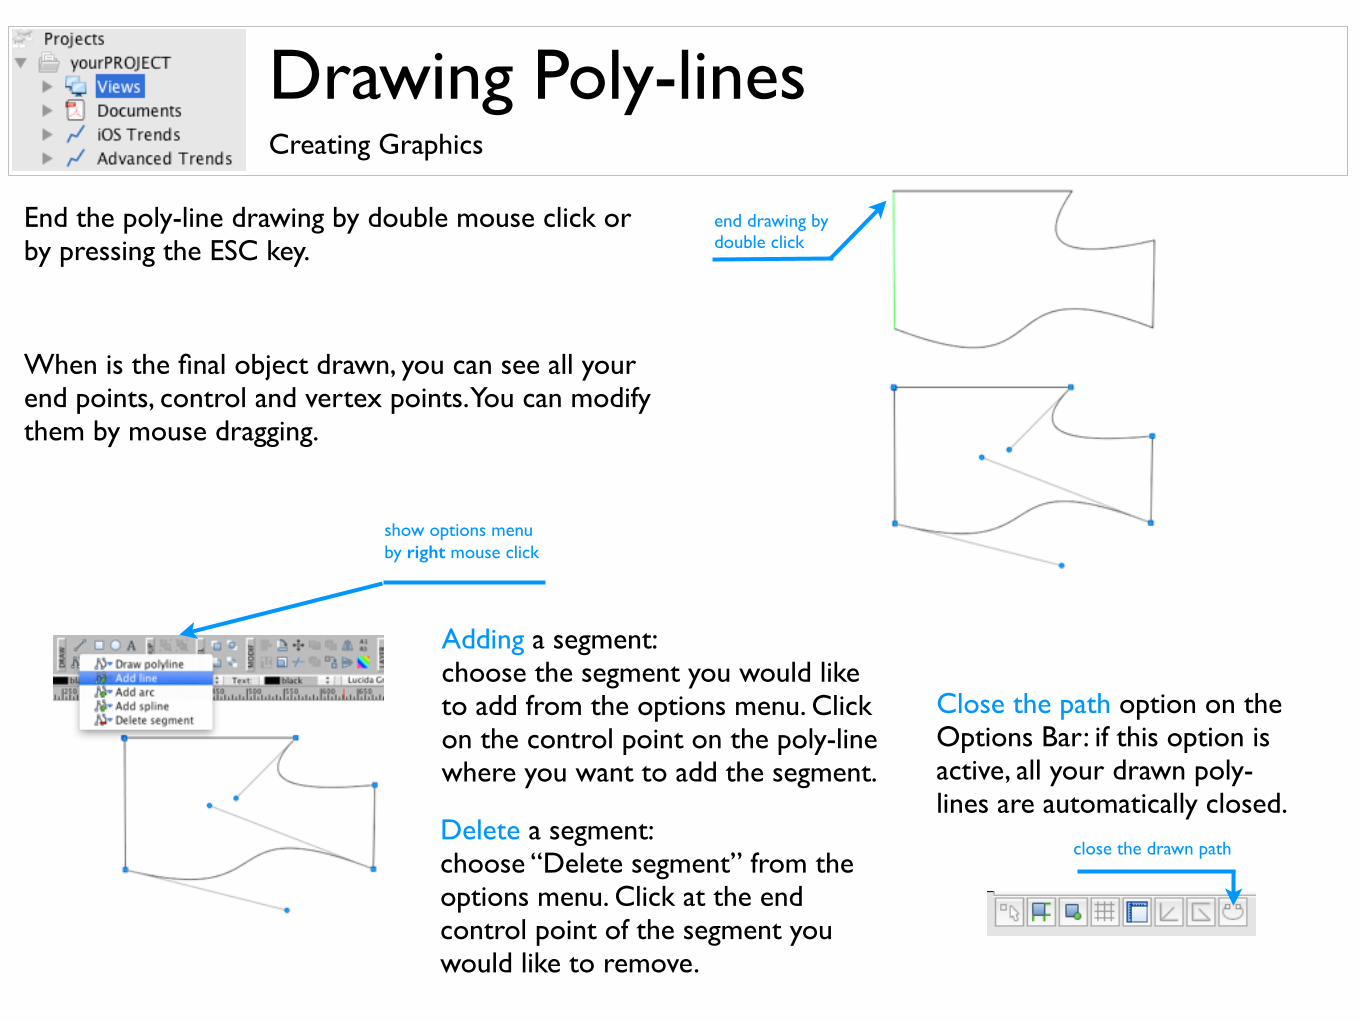
End the poly-line drawing by double mouse click or by pressing the ESC key.
end drawing by double click
When is the final object drawn, you can see all your end points, control and vertex points. You can modify them by mouse dragging.
Adding a segment: choose the segment you would like to add from the options menu. Click on the control point on the poly-line where you want to add the segment.
Delete a segment: choose “Delete segment” from the options menu. Click at the end control point of the segment you would like to remove.
show options menuby right mouse click
close the drawn path
Close the path option on the Options Bar: if this option is active, all your drawn poly-lines are automatically closed.
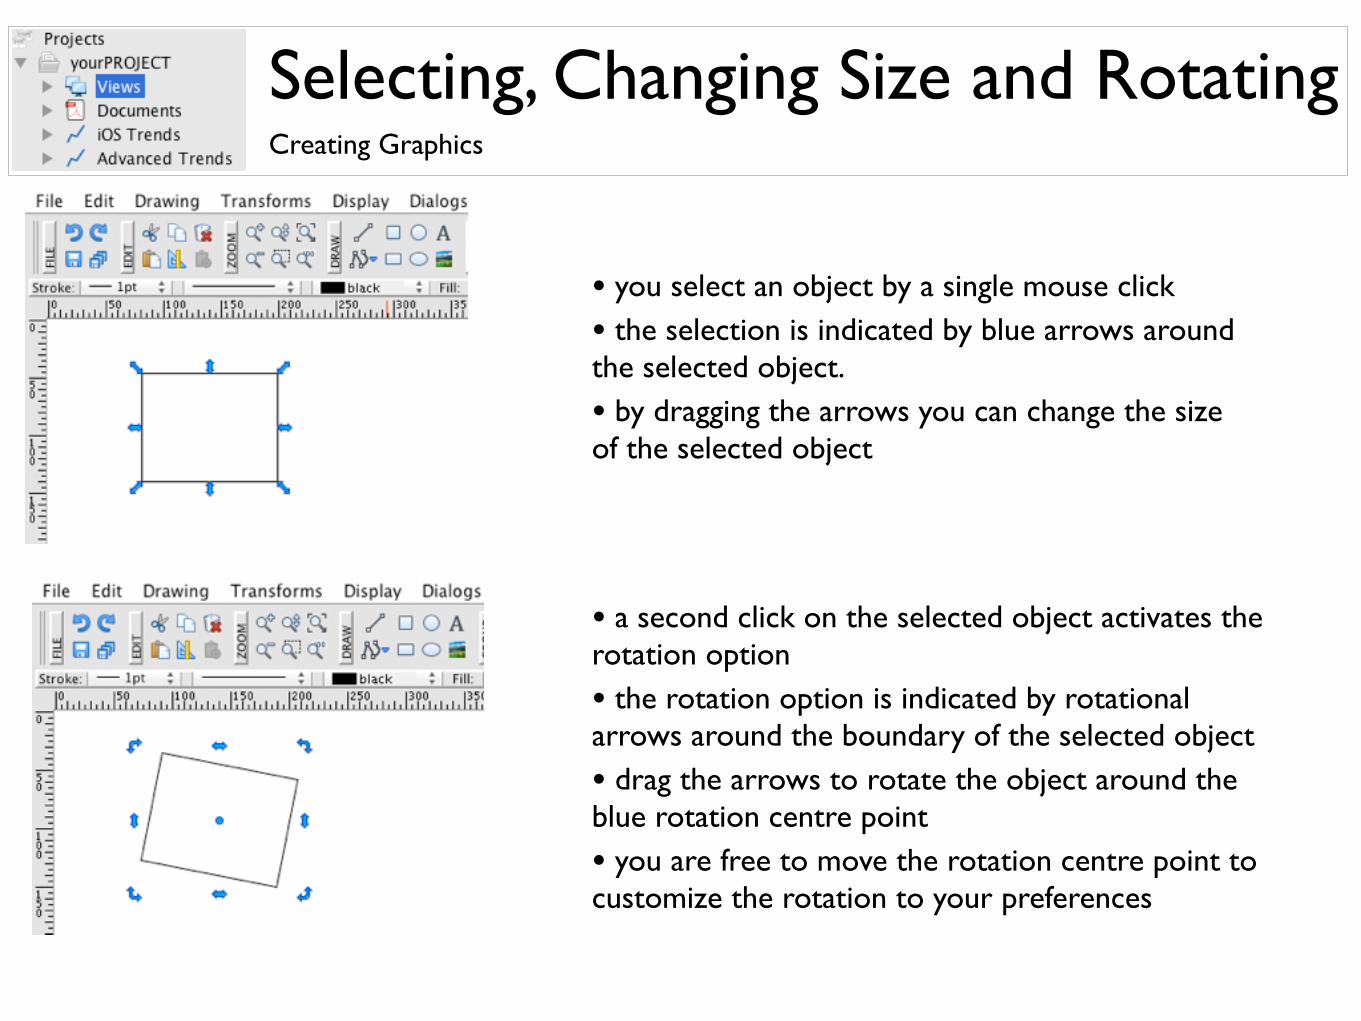
Selecting, Changing Size and RotatingCreating Graphics
• you select an object by a single mouse click
• the selection is indicated by blue arrows around the selected object.
• by dragging the arrows you can change the size of the selected object
• a second click on the selected object activates the rotation option
• the rotation option is indicated by rotational arrows around the boundary of the selected object
• drag the arrows to rotate the object around the blue rotation centre point
• you are free to move the rotation centre point to customize the rotation to your preferences
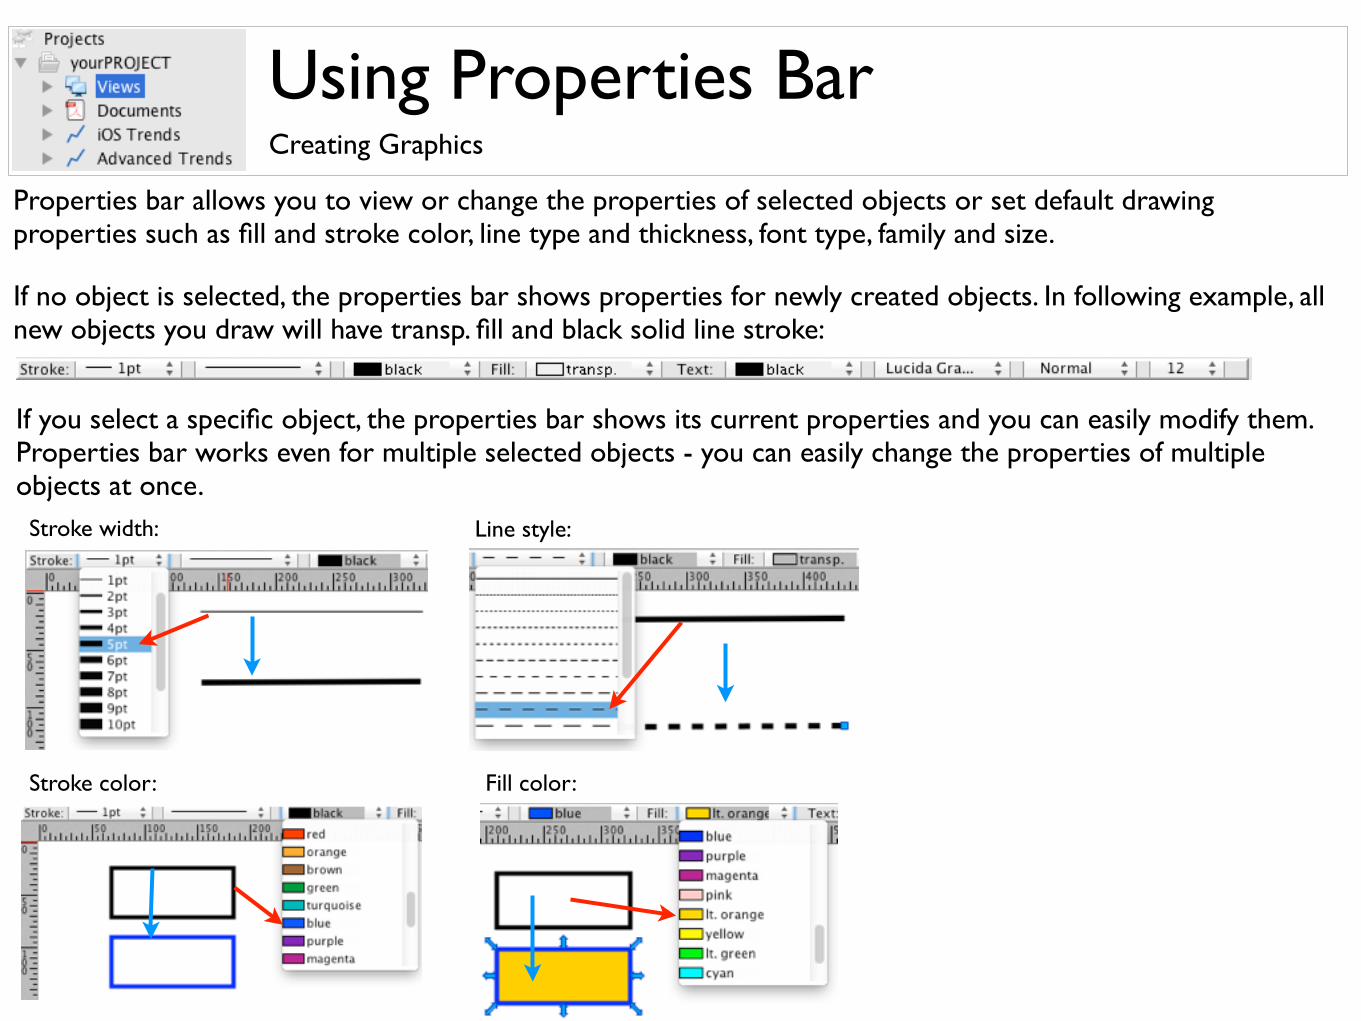
Using Properties BarCreating Graphics
Properties bar allows you to view or change the properties of selected objects or set default drawing properties such as fill and stroke color, line type and thickness, font type, family and size.
If no object is selected, the properties bar shows properties for newly created objects. In following example, all new objects you draw will have transp. fill and black solid line stroke:
If you select a specific object, the properties bar shows its current properties and you can easily modify them. Properties bar works even for multiple selected objects - you can easily change the properties of multiple objects at once.Stroke width: Line style:
Stroke color: Fill color:
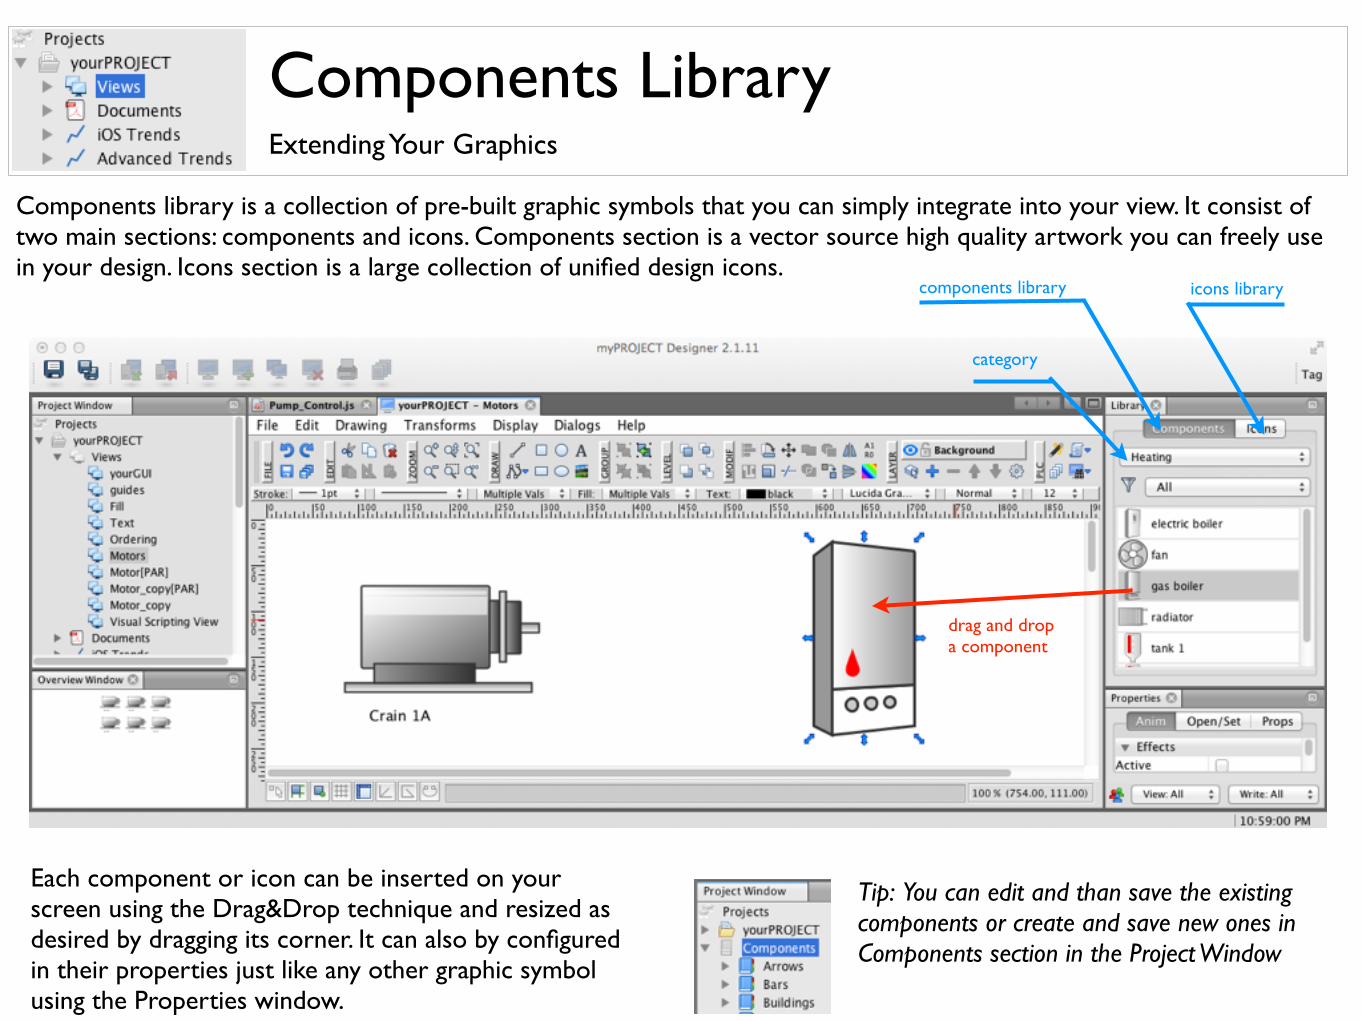
Components LibraryExtending Your Graphics
Components library is a collection of pre-built graphic symbols that you can simply integrate into your view. It consist of two main sections: components and icons. Components section is a vector source high quality artwork you can freely use in your design. Icons section is a large collection of unified design icons.
drag and dropa component
components library icons library
category
Tip: You can edit and than save the existing components or create and save new ones in Components section in the Project Window
Each component or icon can be inserted on your screen using the Drag&Drop technique and resized as desired by dragging its corner. It can also by configured in their properties just like any other graphic symbol using the Properties window.
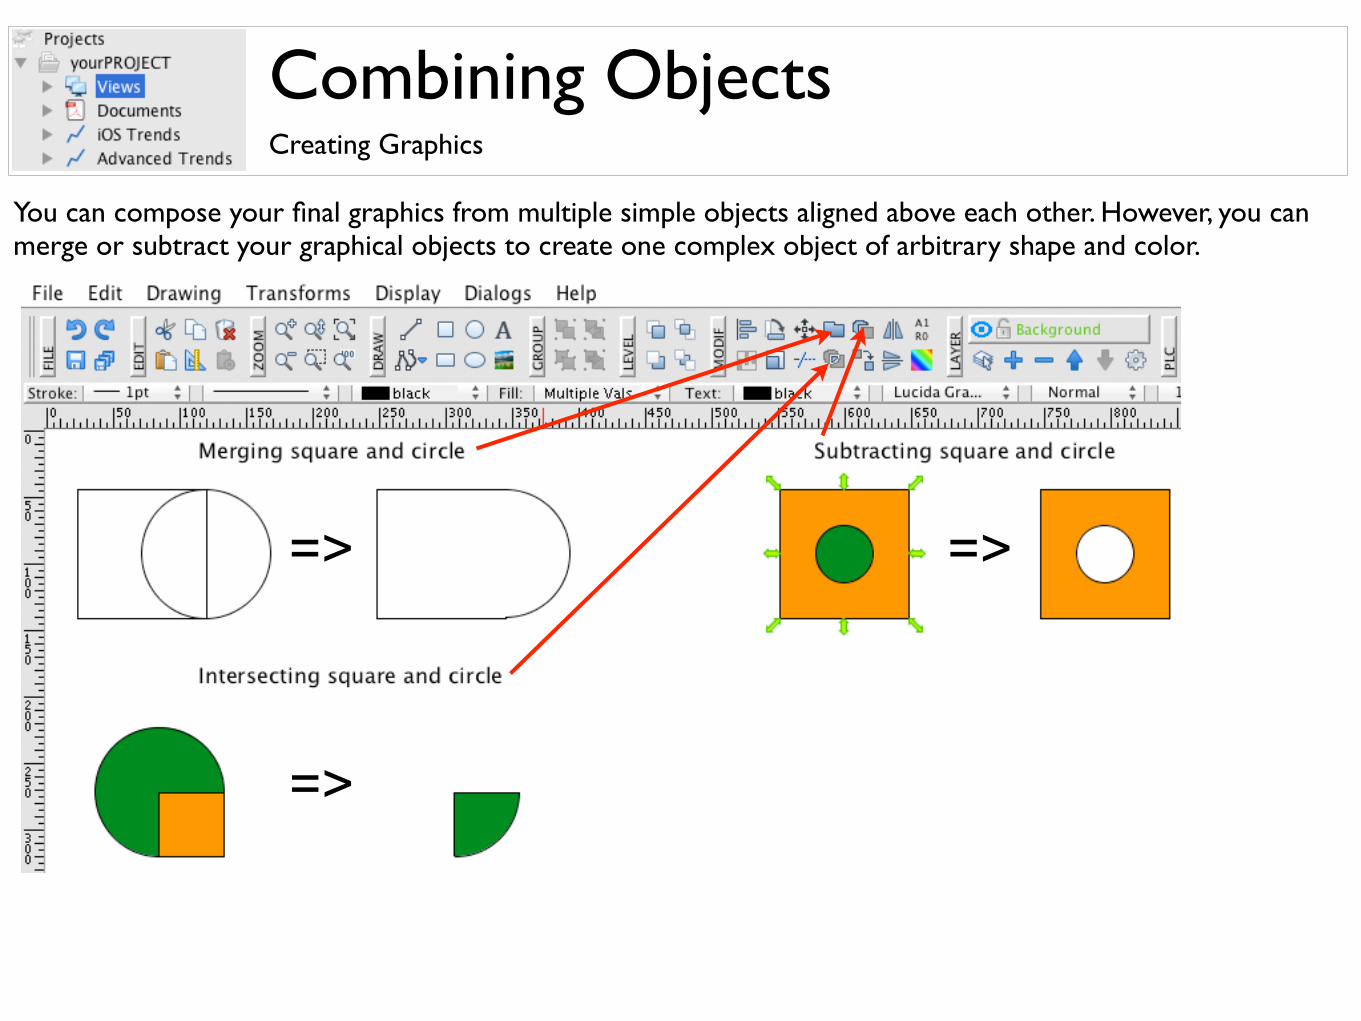
Combining ObjectsCreating Graphics
You can compose your final graphics from multiple simple objects aligned above each other. However, you can merge or subtract your graphical objects to create one complex object of arbitrary shape and color.
=> =>
=>
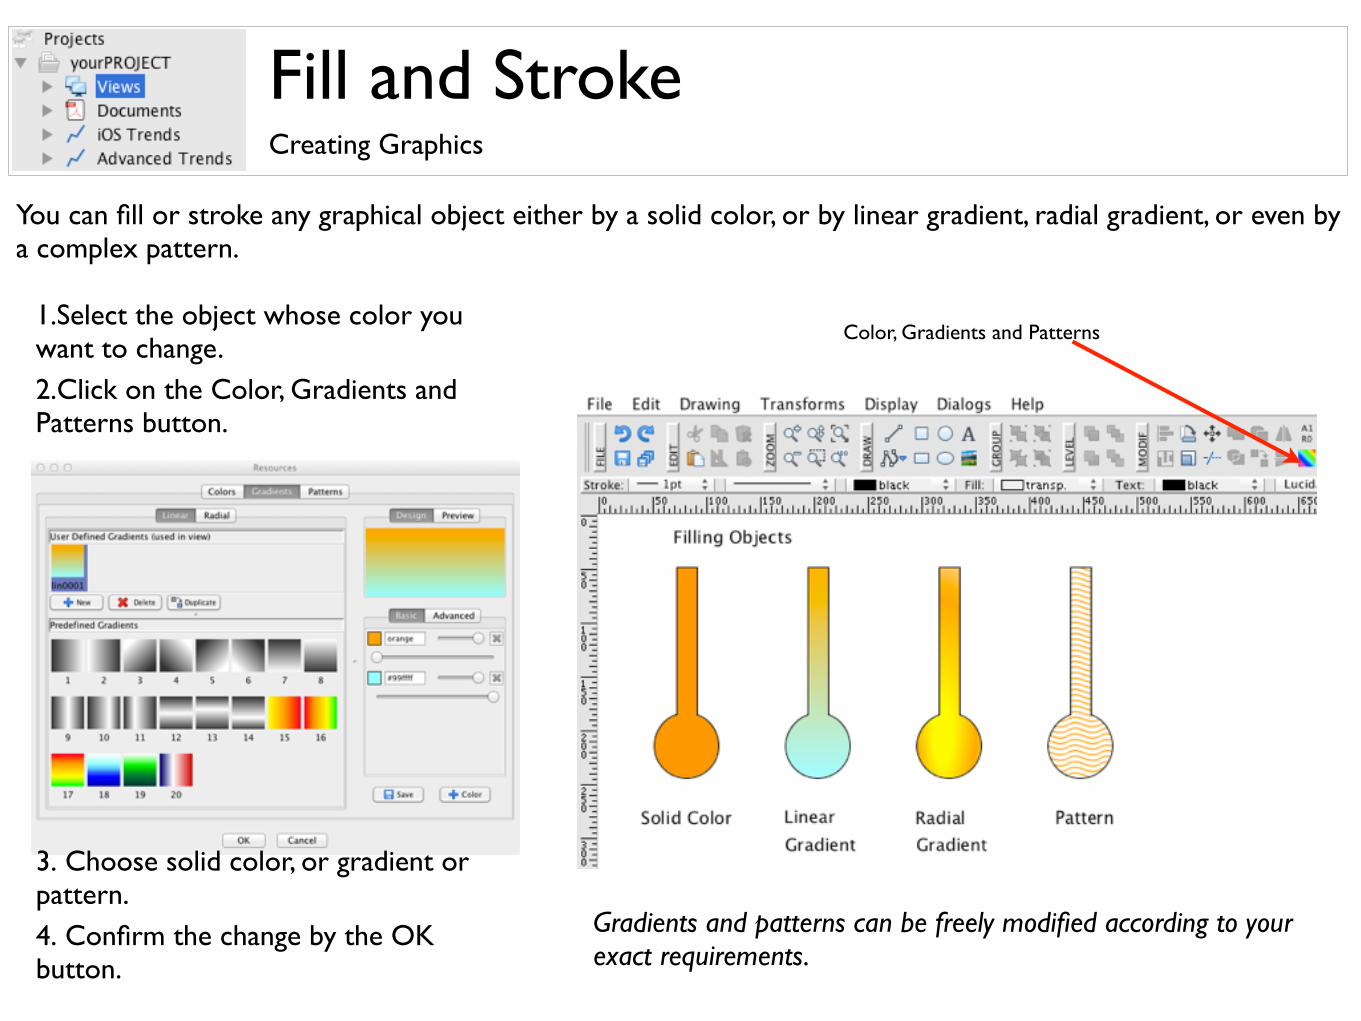
Fill and StrokeCreating Graphics
1.Select the object whose color you want to change.2.Click on the Color, Gradients and Patterns button.
You can fill or stroke any graphical object either by a solid color, or by linear gradient, radial gradient, or even by a complex pattern.
Color, Gradients and Patterns
3. Choose solid color, or gradient or pattern.4. Confirm the change by the OK button.
Gradients and patterns can be freely modified according to your exact requirements.
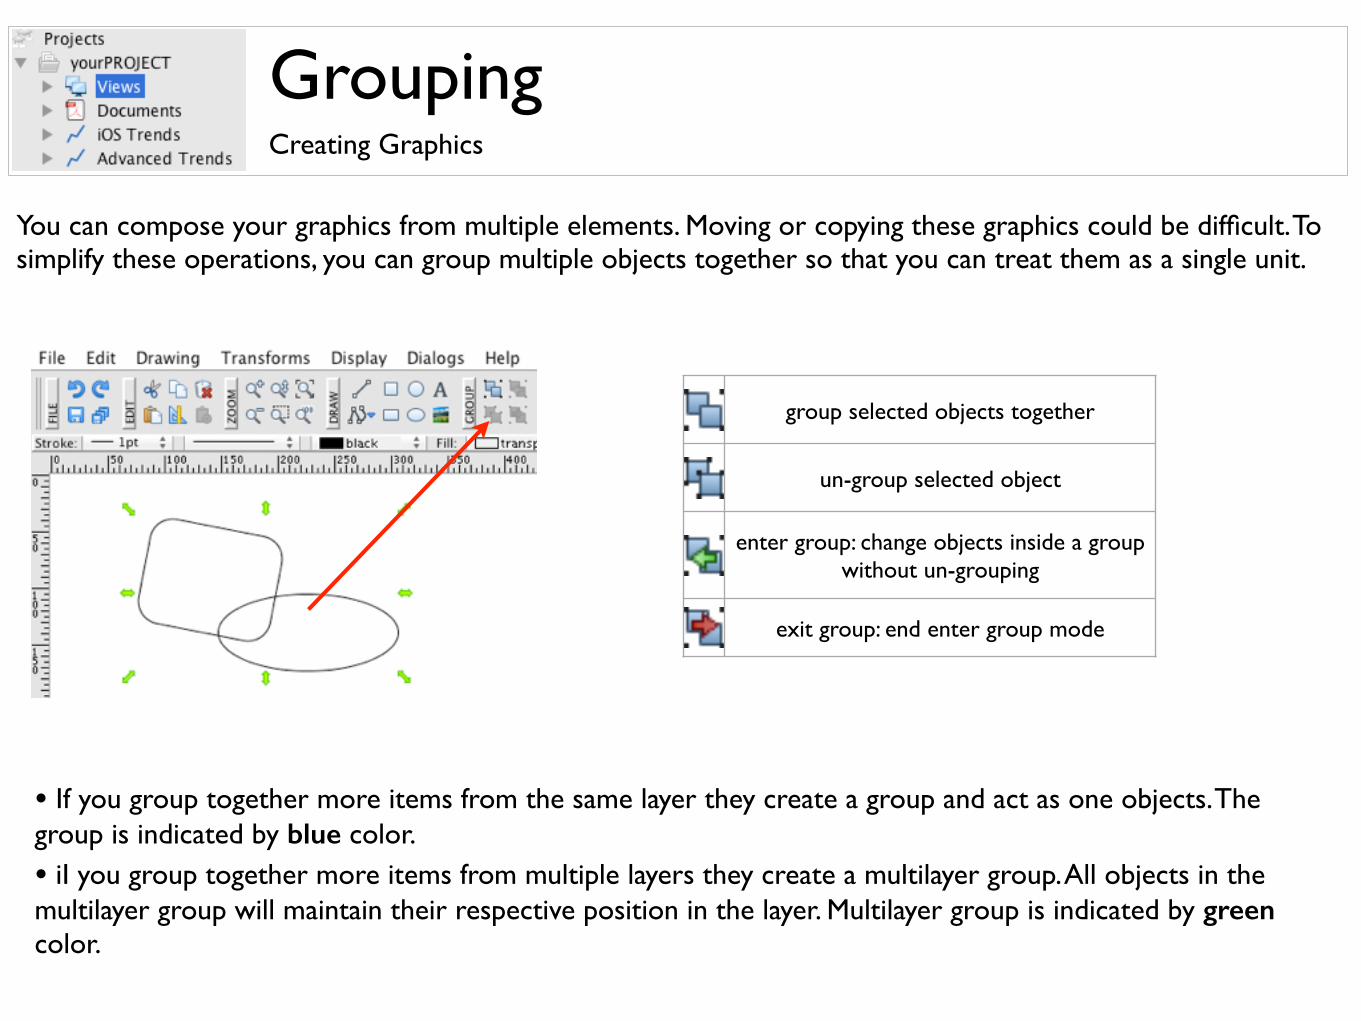
GroupingCreating Graphics
You can compose your graphics from multiple elements. Moving or copying these graphics could be difficult. To simplify these operations, you can group multiple objects together so that you can treat them as a single unit.
• If you group together more items from the same layer they create a group and act as one objects. The group is indicated by blue color.
• iI you group together more items from multiple layers they create a multilayer group. All objects in the multilayer group will maintain their respective position in the layer. Multilayer group is indicated by green color.
group selected objects together
un-group selected object
enter group: change objects inside a group without un-grouping
exit group: end enter group mode
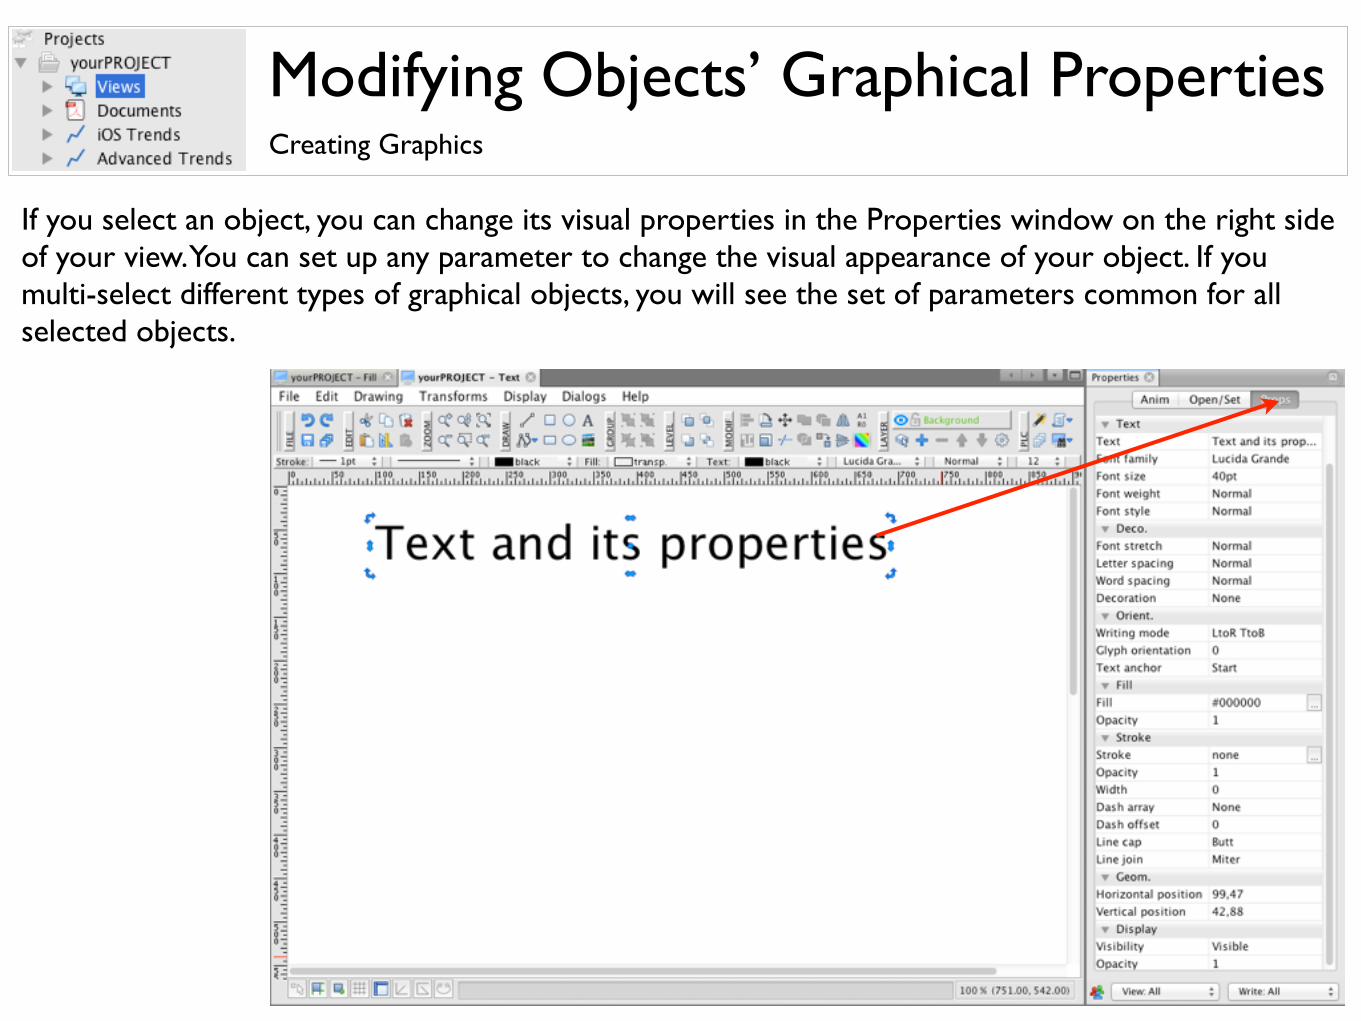
Modifying Objects’ Graphical PropertiesCreating Graphics
If you select an object, you can change its visual properties in the Properties window on the right side of your view. You can set up any parameter to change the visual appearance of your object. If you multi-select different types of graphical objects, you will see the set of parameters common for all selected objects.
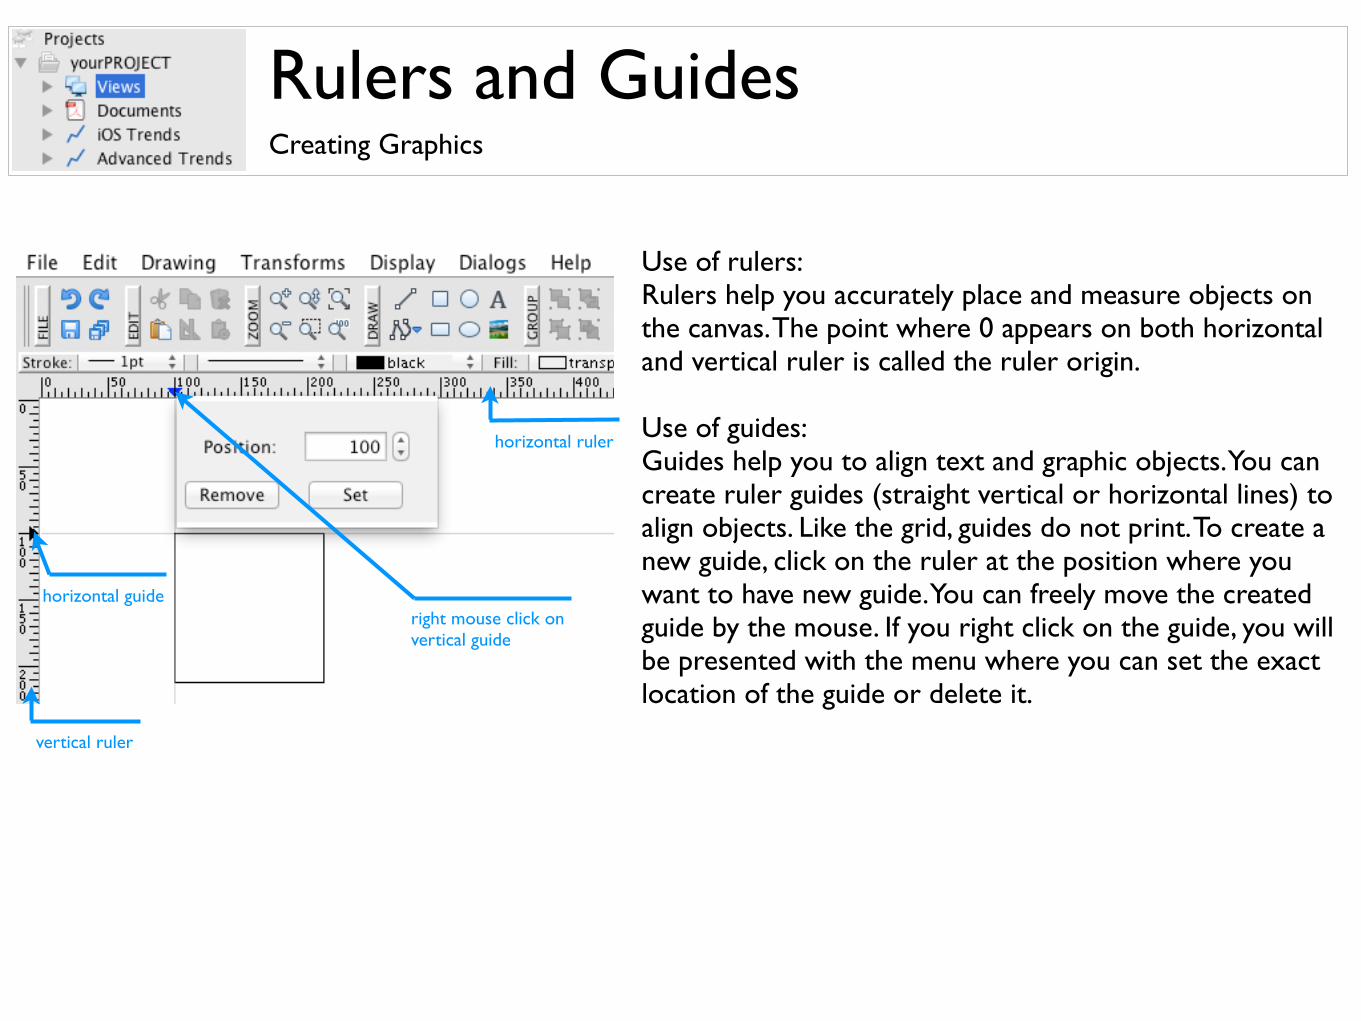
Rulers and GuidesCreating Graphics
Use of rulers:Rulers help you accurately place and measure objects on the canvas. The point where 0 appears on both horizontal and vertical ruler is called the ruler origin.
Use of guides: Guides help you to align text and graphic objects. You can create ruler guides (straight vertical or horizontal lines) to align objects. Like the grid, guides do not print. To create a new guide, click on the ruler at the position where you want to have new guide. You can freely move the created guide by the mouse. If you right click on the guide, you will be presented with the menu where you can set the exact location of the guide or delete it.
horizontal ruler
vertical ruler
horizontal guideright mouse click on vertical guide
Smart Guides and Snap-to-PointCreating Graphics
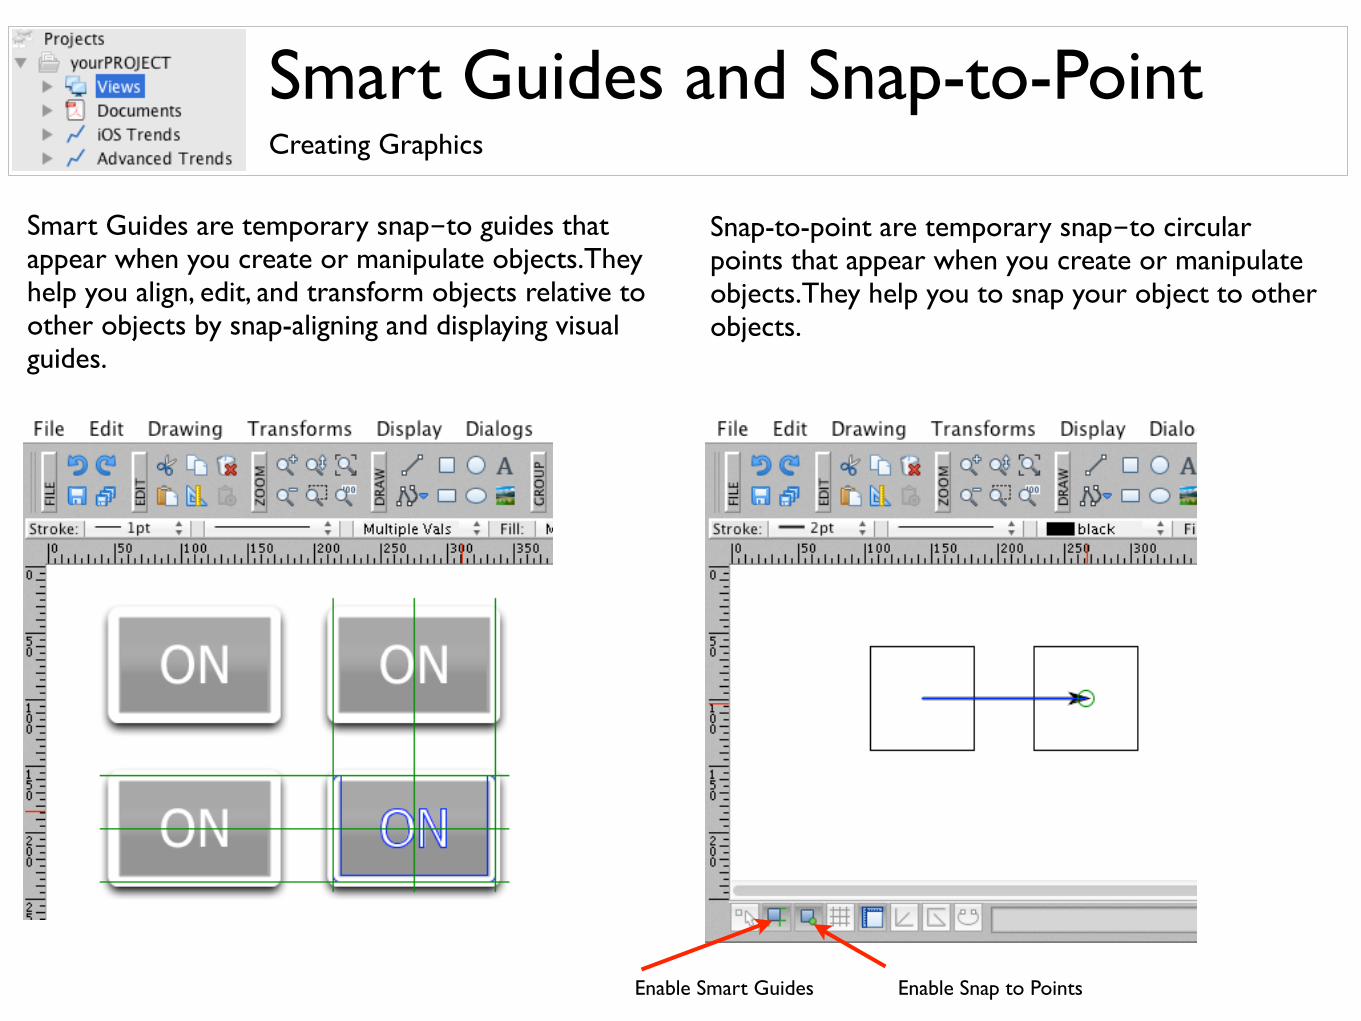
Smart Guides are temporary snap-to guides that appear when you create or manipulate objects.They help you align, edit, and transform objects relative to other objects by snap-aligning and displaying visual guides.
Snap-to-point are temporary snap-to circular points that appear when you create or manipulate objects.They help you to snap your object to other objects.
Enable Smart Guides Enable Snap to Points
GridCreating Graphics
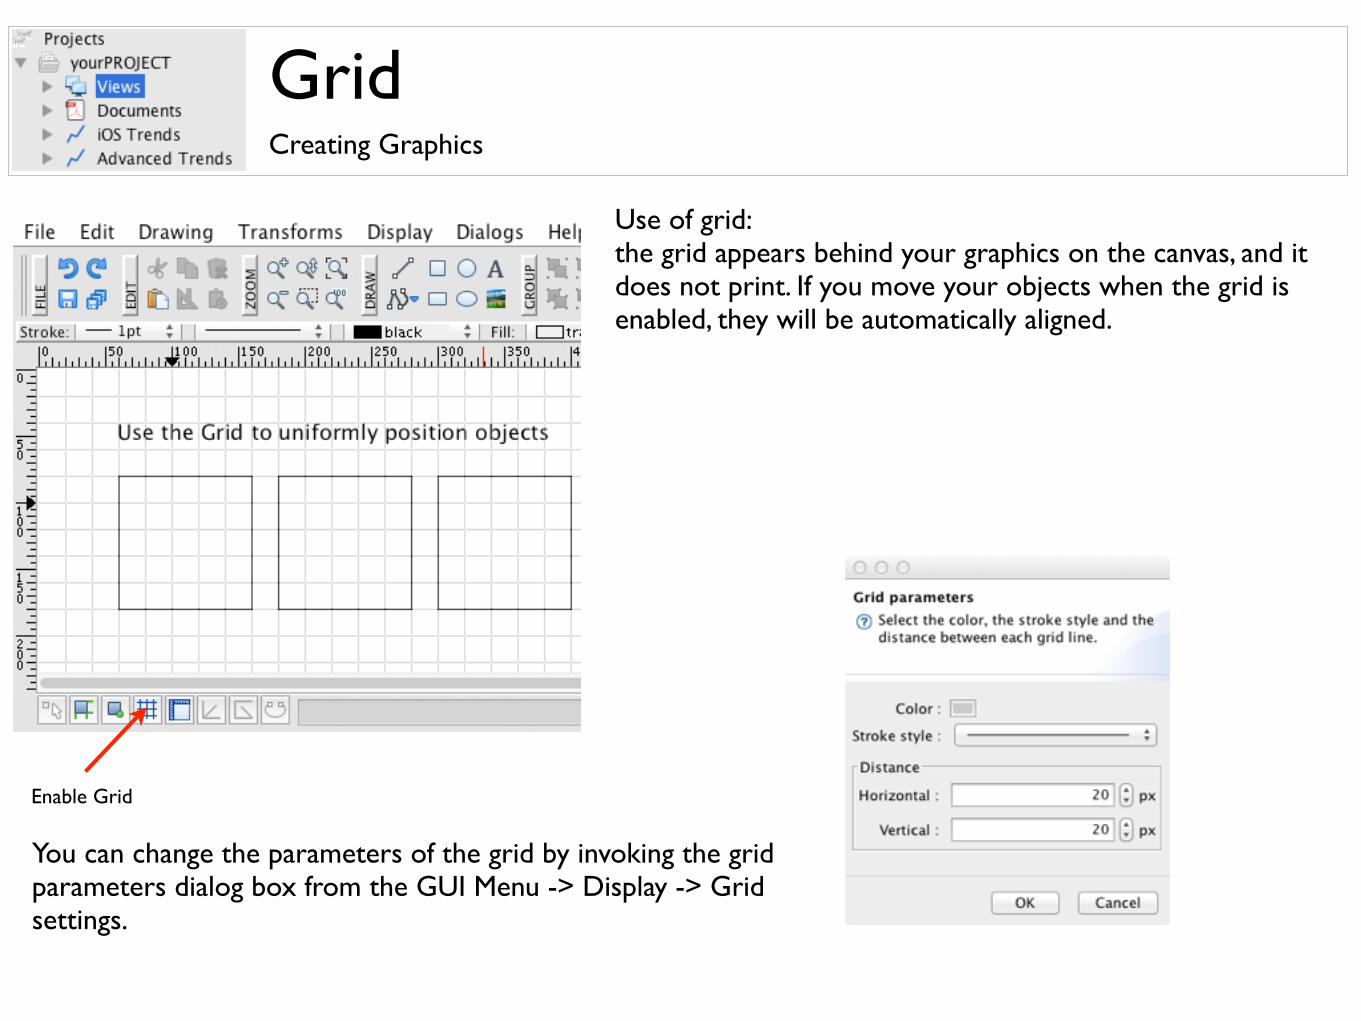
Use of grid: the grid appears behind your graphics on the canvas, and it does not print. If you move your objects when the grid is enabled, they will be automatically aligned.
Enable Grid
You can change the parameters of the grid by invoking the grid parameters dialog box from the GUI Menu -> Display -> Grid settings.
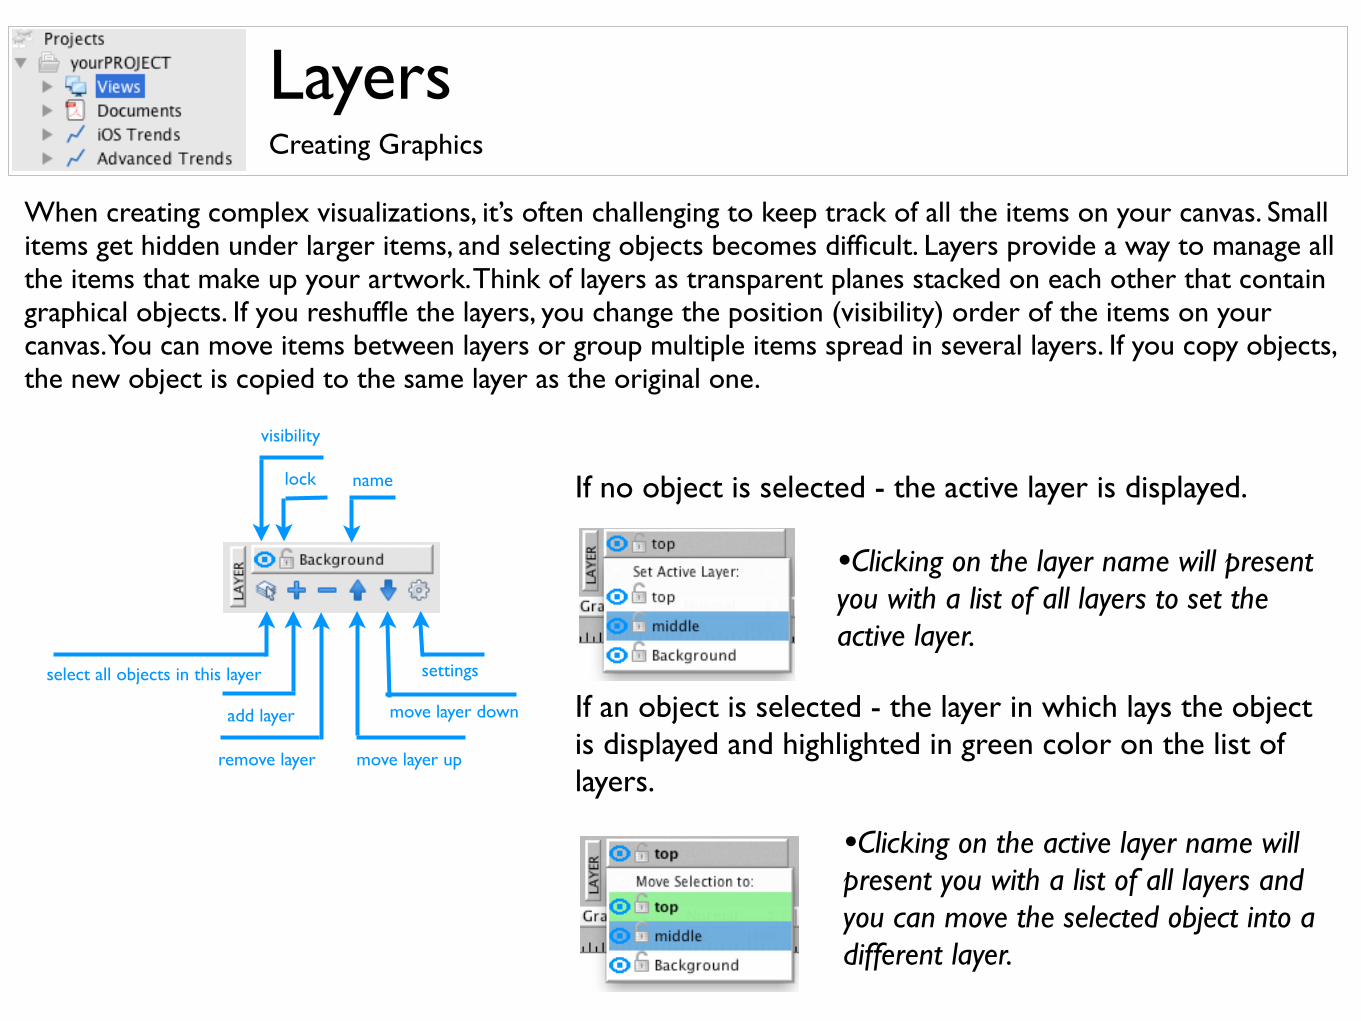
If no object is selected - the active layer is displayed.
If an object is selected - the layer in which lays the object is displayed and highlighted in green color on the list of layers.
LayersCreating Graphics
When creating complex visualizations, it’s often challenging to keep track of all the items on your canvas. Small items get hidden under larger items, and selecting objects becomes difficult. Layers provide a way to manage all the items that make up your artwork. Think of layers as transparent planes stacked on each other that contain graphical objects. If you reshuffle the layers, you change the position (visibility) order of the items on your canvas. You can move items between layers or group multiple items spread in several layers. If you copy objects, the new object is copied to the same layer as the original one.
visibility
lock name
select all objects in this layer
add layer
remove layer
settings
move layer down
move layer up
•Clicking on the layer name will present you with a list of all layers to set the active layer.
•Clicking on the active layer name will present you with a list of all layers and you can move the selected object into a different layer.
Ordering ObjectsCreating Graphics
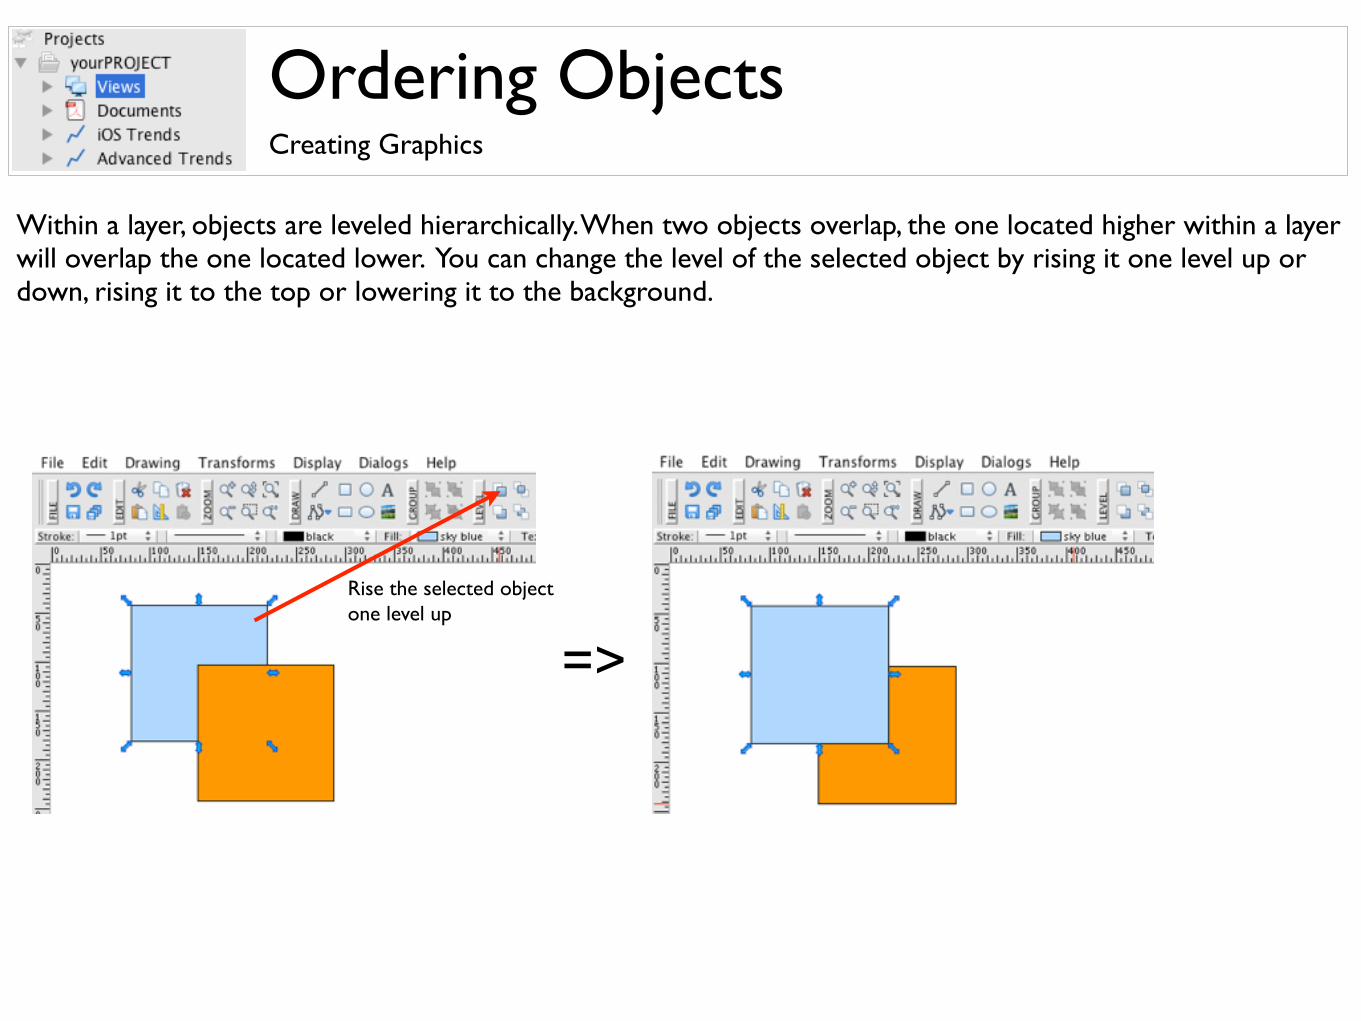
Within a layer, objects are leveled hierarchically. When two objects overlap, the one located higher within a layer will overlap the one located lower. You can change the level of the selected object by rising it one level up or down, rising it to the top or lowering it to the background.
Rise the selected object one level up
=>
Linking with a controller (PLC)Creating Graphics
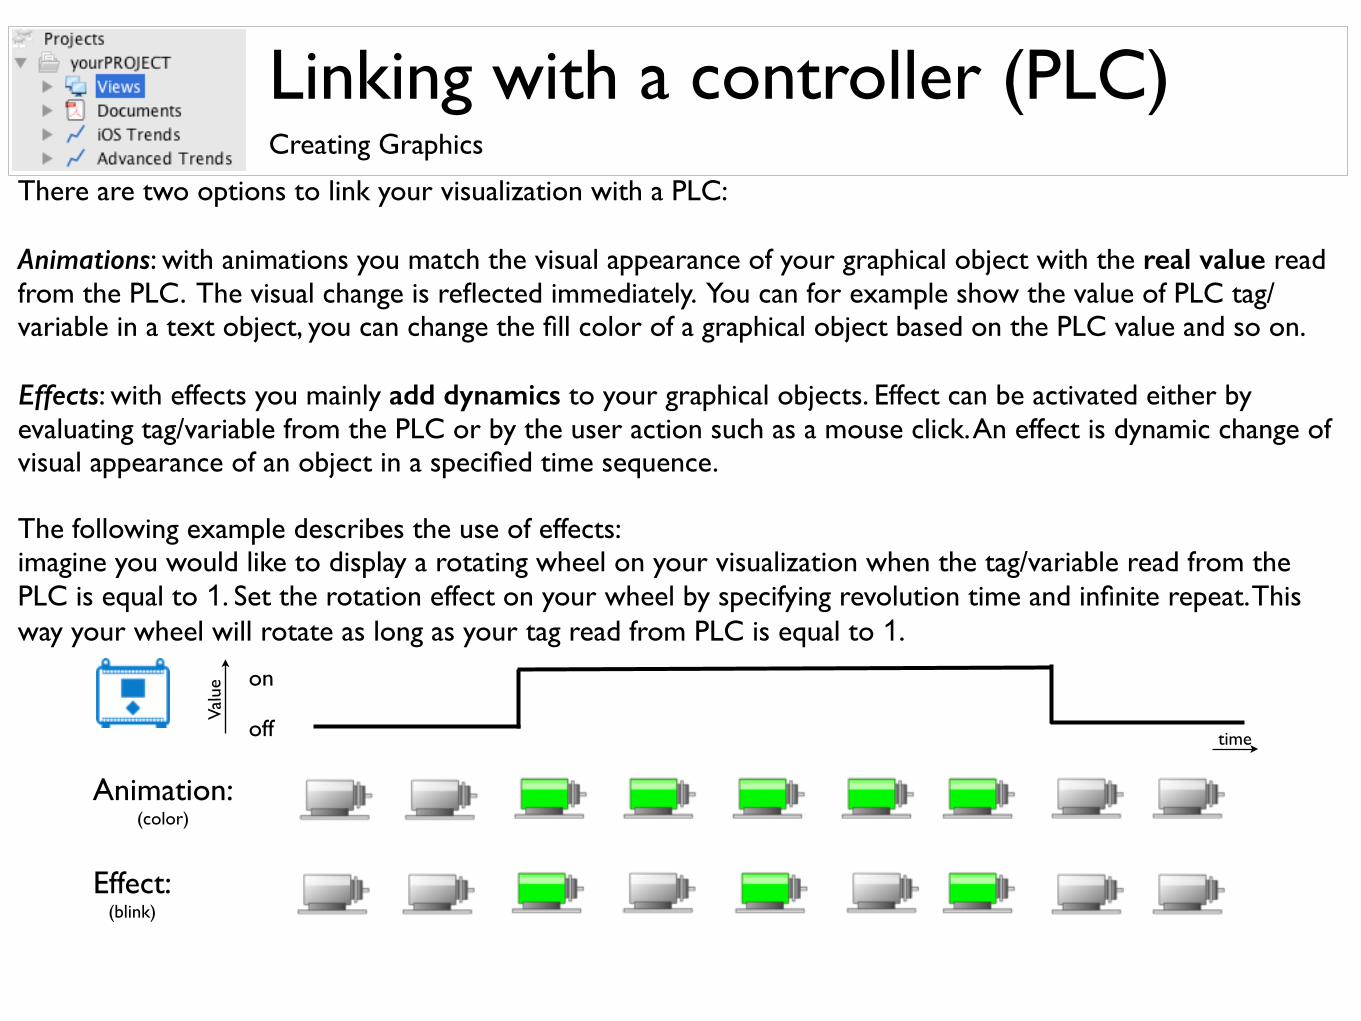
There are two options to link your visualization with a PLC:
Animations: with animations you match the visual appearance of your graphical object with the real value read from the PLC. The visual change is reflected immediately. You can for example show the value of PLC tag/variable in a text object, you can change the fill color of a graphical object based on the PLC value and so on.
Effects: with effects you mainly add dynamics to your graphical objects. Effect can be activated either by evaluating tag/variable from the PLC or by the user action such as a mouse click. An effect is dynamic change of visual appearance of an object in a specified time sequence.
The following example describes the use of effects: imagine you would like to display a rotating wheel on your visualization when the tag/variable read from the PLC is equal to 1. Set the rotation effect on your wheel by specifying revolution time and infinite repeat. This way your wheel will rotate as long as your tag read from PLC is equal to 1.
Valu
e
off
on
time
Animation:(color)
Effect:(blink)
Linking with PLCs - AnimationsCreating Graphics
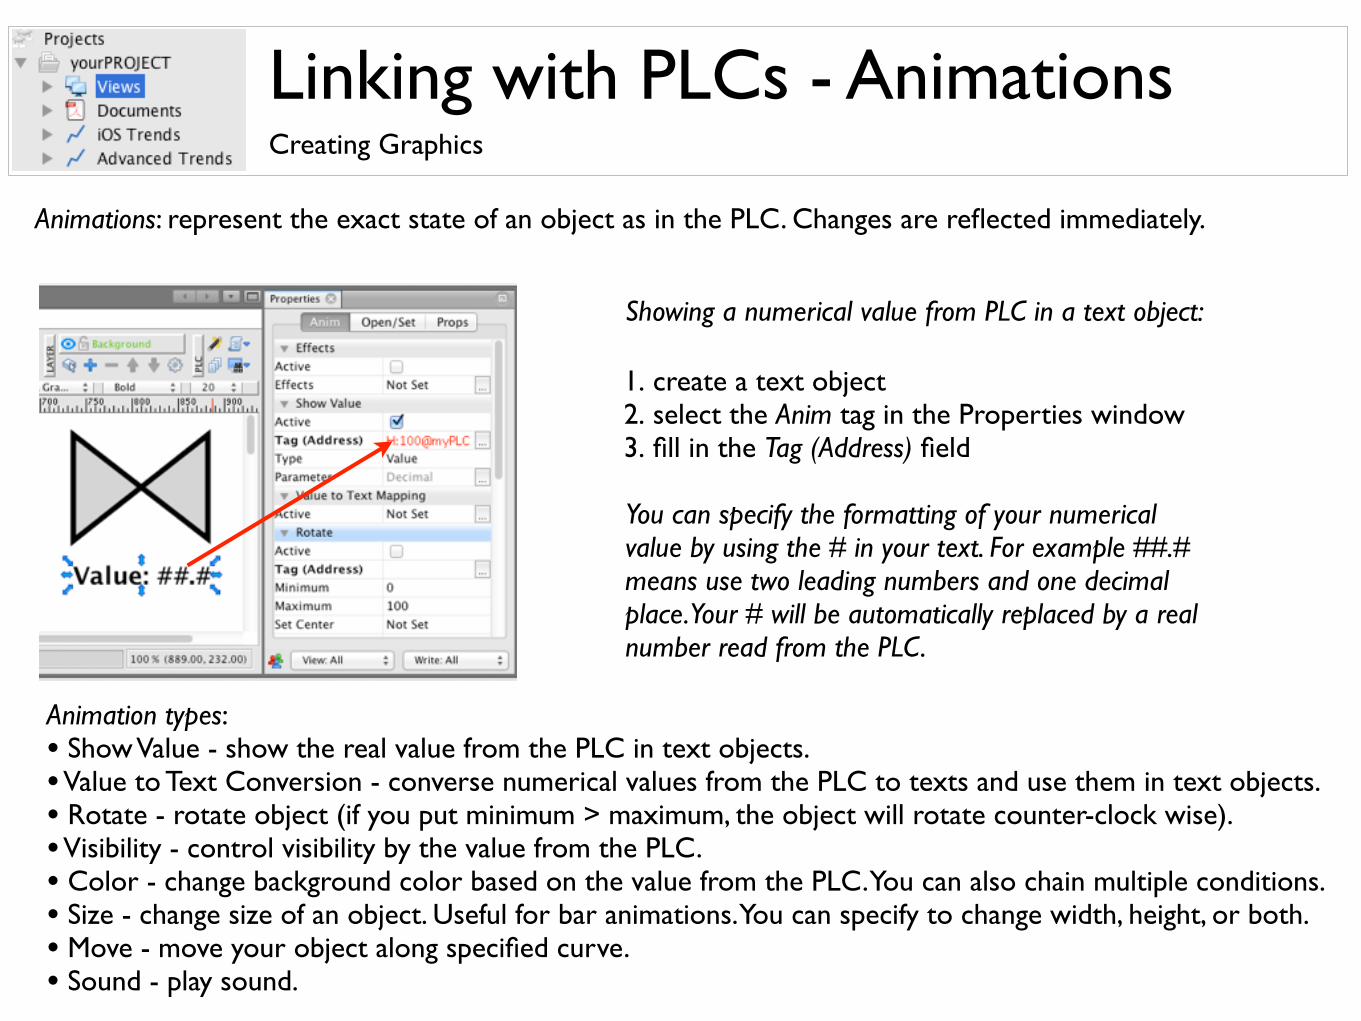
Animations: represent the exact state of an object as in the PLC. Changes are reflected immediately.
1. create a text object2. select the Anim tag in the Properties window3. fill in the Tag (Address) field
Showing a numerical value from PLC in a text object:
You can specify the formatting of your numerical value by using the # in your text. For example ##.# means use two leading numbers and one decimal place. Your # will be automatically replaced by a real number read from the PLC.
Animation types: • Show Value - show the real value from the PLC in text objects.• Value to Text Conversion - converse numerical values from the PLC to texts and use them in text objects.• Rotate - rotate object (if you put minimum > maximum, the object will rotate counter-clock wise).• Visibility - control visibility by the value from the PLC.• Color - change background color based on the value from the PLC. You can also chain multiple conditions.• Size - change size of an object. Useful for bar animations. You can specify to change width, height, or both.• Move - move your object along specified curve.• Sound - play sound.
Linking with PLCs - EffectsEffects brings dynamics to your screen.
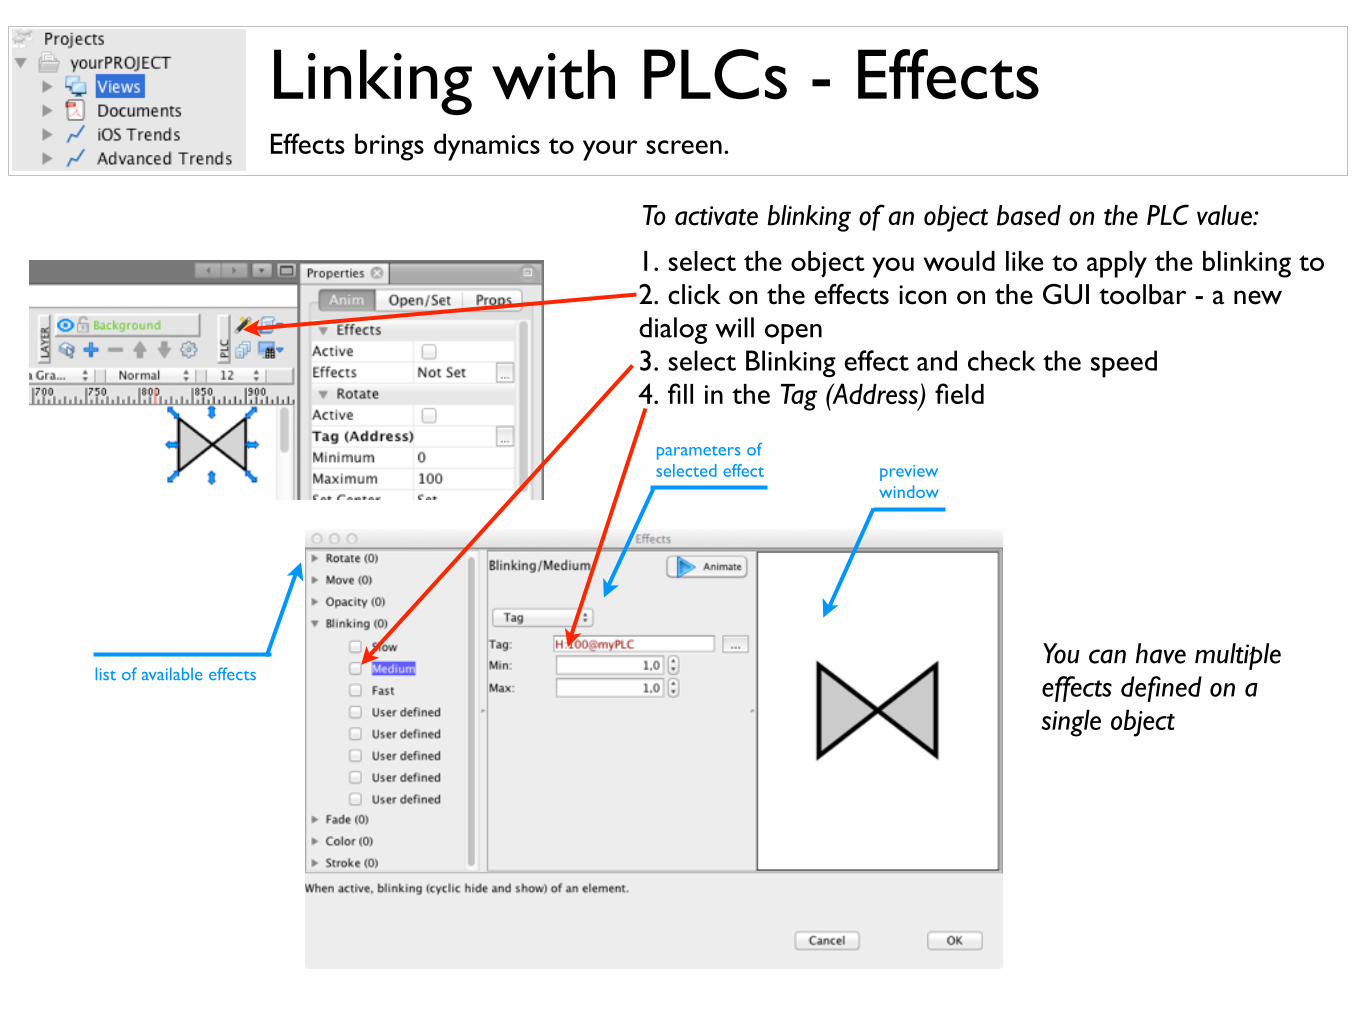
list of available effects
parameters of selected effect preview
window
1. select the object you would like to apply the blinking to2. click on the effects icon on the GUI toolbar - a new dialog will open3. select Blinking effect and check the speed4. fill in the Tag (Address) field
To activate blinking of an object based on the PLC value:
You can have multiple effects defined on a single object
Entering TagsCreating Graphics - Linking with PLCs
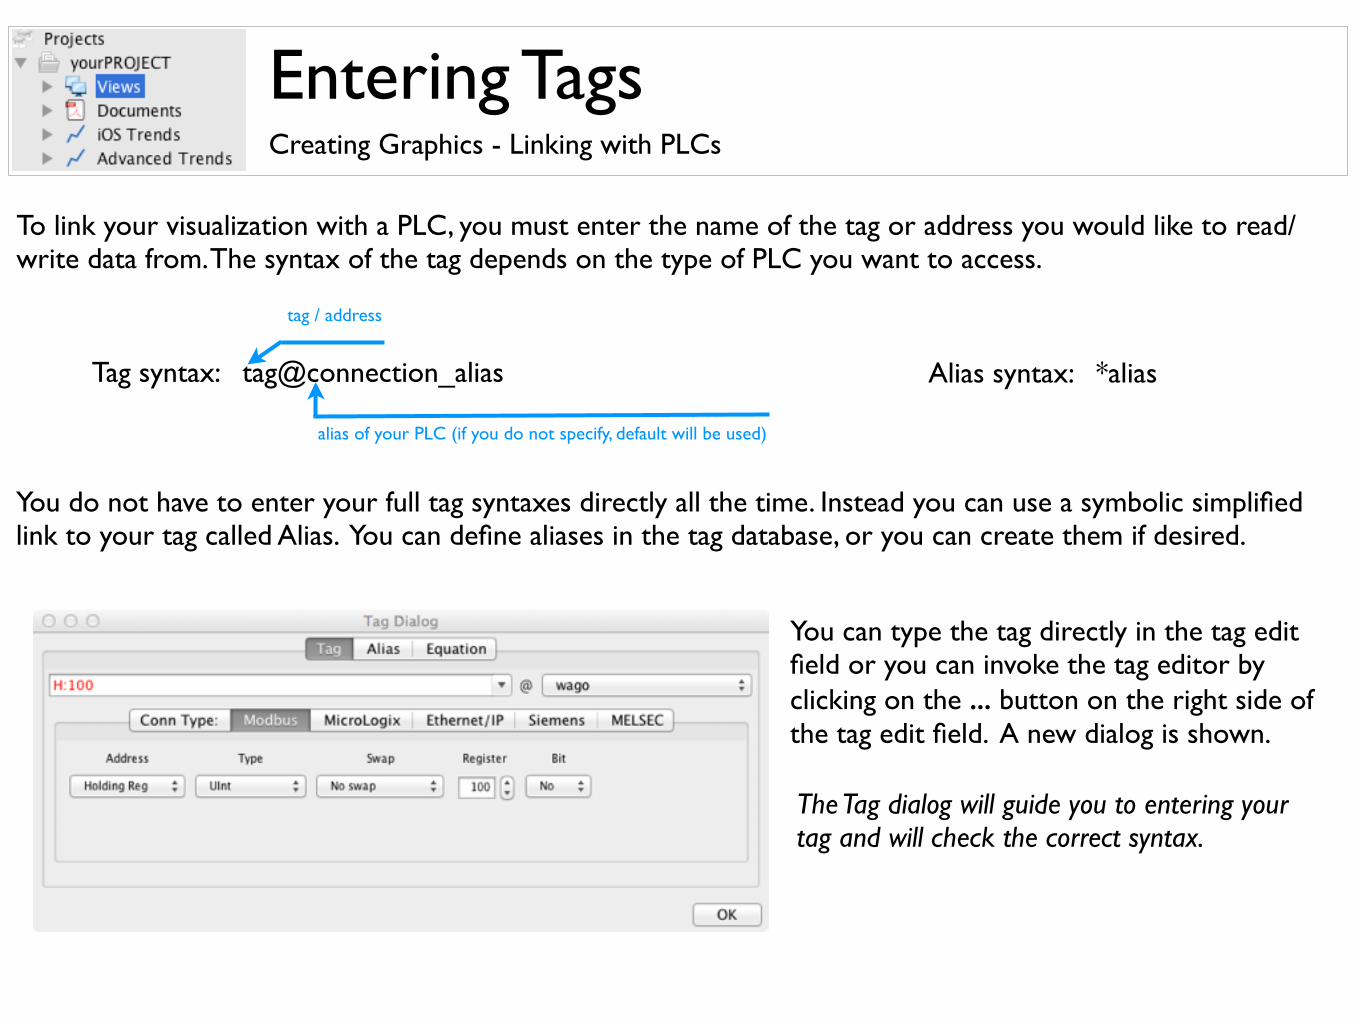
To link your visualization with a PLC, you must enter the name of the tag or address you would like to read/write data from. The syntax of the tag depends on the type of PLC you want to access.
Tag syntax: tag@connection_alias
tag / address
alias of your PLC (if you do not specify, default will be used)
You can type the tag directly in the tag edit field or you can invoke the tag editor by clicking on the ... button on the right side of the tag edit field. A new dialog is shown.
The Tag dialog will guide you to entering your tag and will check the correct syntax.
Alias syntax: *alias
You do not have to enter your full tag syntaxes directly all the time. Instead you can use a symbolic simplified link to your tag called Alias. You can define aliases in the tag database, or you can create them if desired.
Entering EquationsCreating Graphics - Linking with PLCs
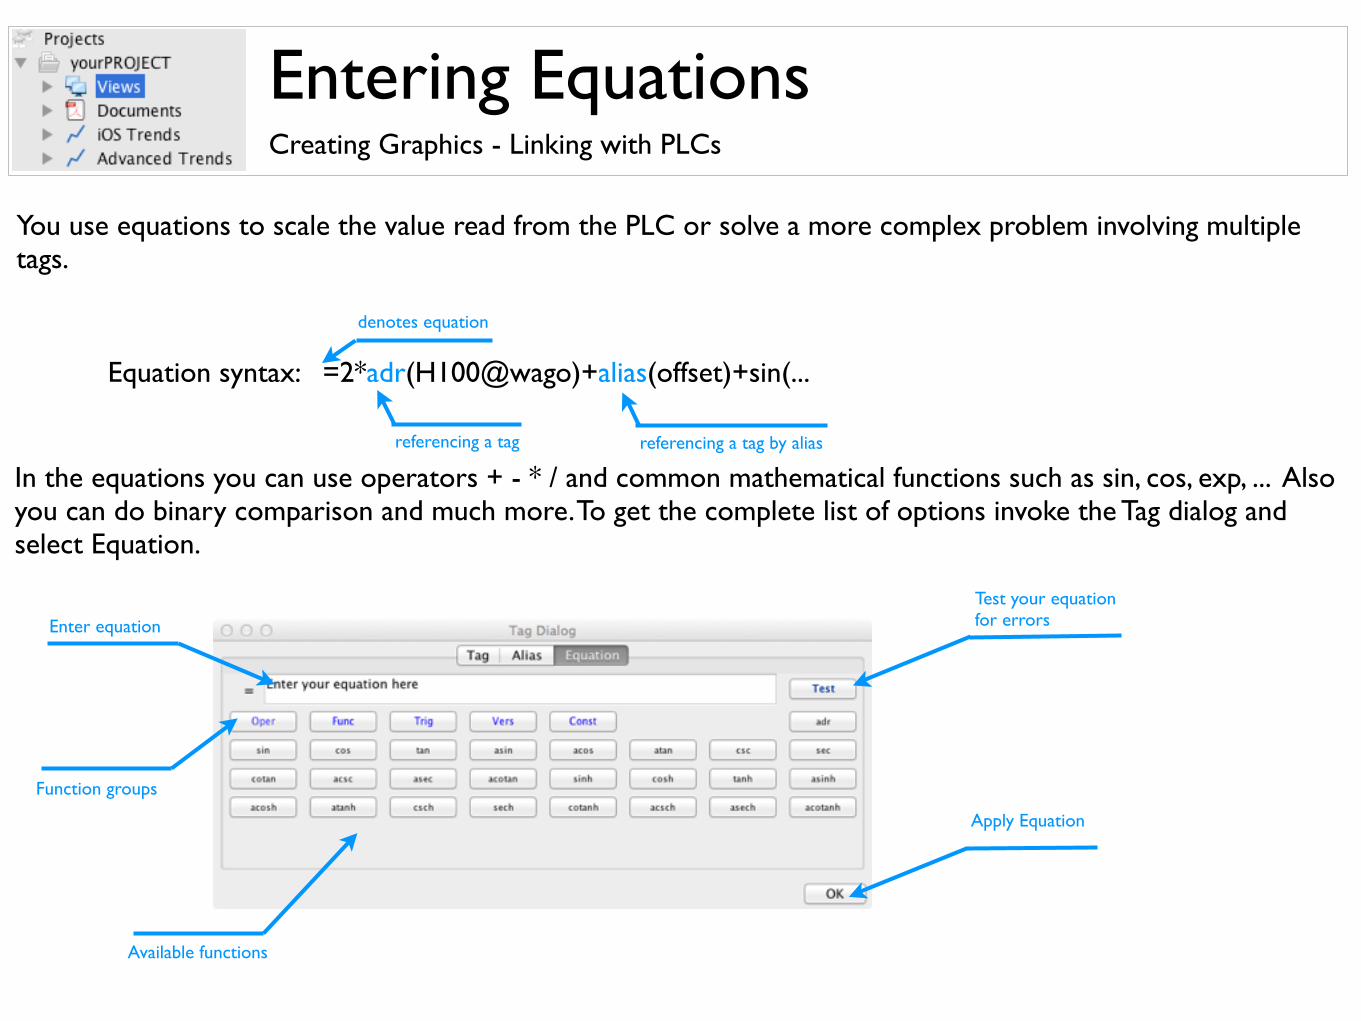
You use equations to scale the value read from the PLC or solve a more complex problem involving multiple tags.
Equation syntax: =2*adr(H100@wago)+alias(offset)+sin(...
denotes equation
referencing a tag
In the equations you can use operators + - * / and common mathematical functions such as sin, cos, exp, ... Also you can do binary comparison and much more. To get the complete list of options invoke the Tag dialog and select Equation.
referencing a tag by alias
Enter equation
Function groups
Test your equationfor errors
Available functions
Apply Equation
Write CommandsCreating Graphics
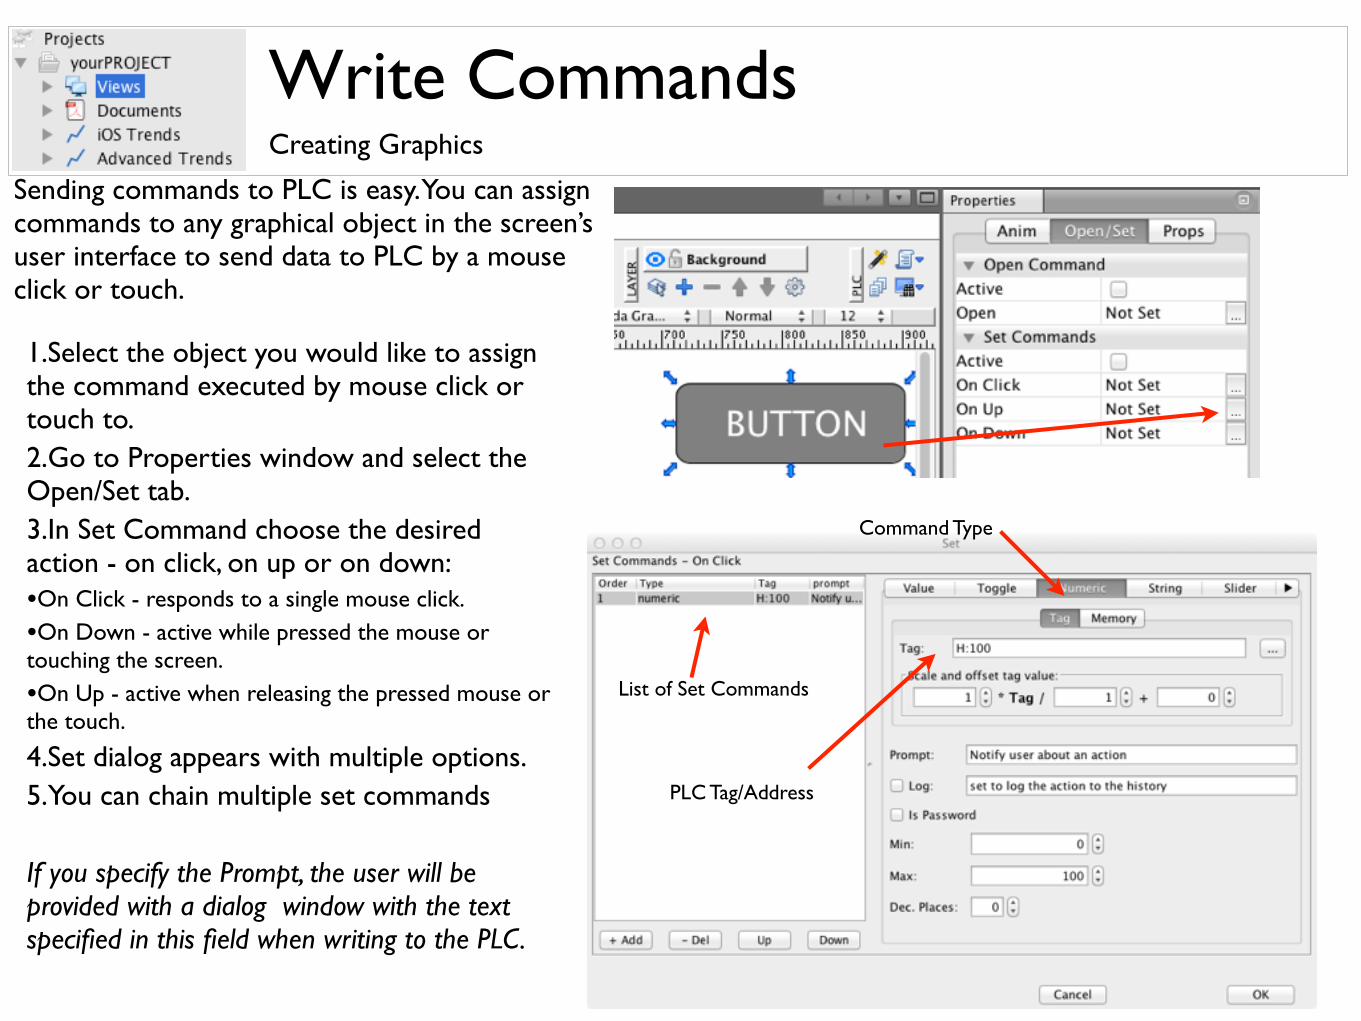
Sending commands to PLC is easy. You can assign commands to any graphical object in the screen’s user interface to send data to PLC by a mouse click or touch.
1.Select the object you would like to assign the command executed by mouse click or touch to. 2.Go to Properties window and select the Open/Set tab. 3.In Set Command choose the desired action - on click, on up or on down:•On Click - responds to a single mouse click.
•On Down - active while pressed the mouse or touching the screen.
•On Up - active when releasing the pressed mouse or the touch.
4.Set dialog appears with multiple options.5.You can chain multiple set commands
If you specify the Prompt, the user will be provided with a dialog window with the text specified in this field when writing to the PLC.
List of Set Commands
Command Type
PLC Tag/Address
Open CommandCreating Graphics
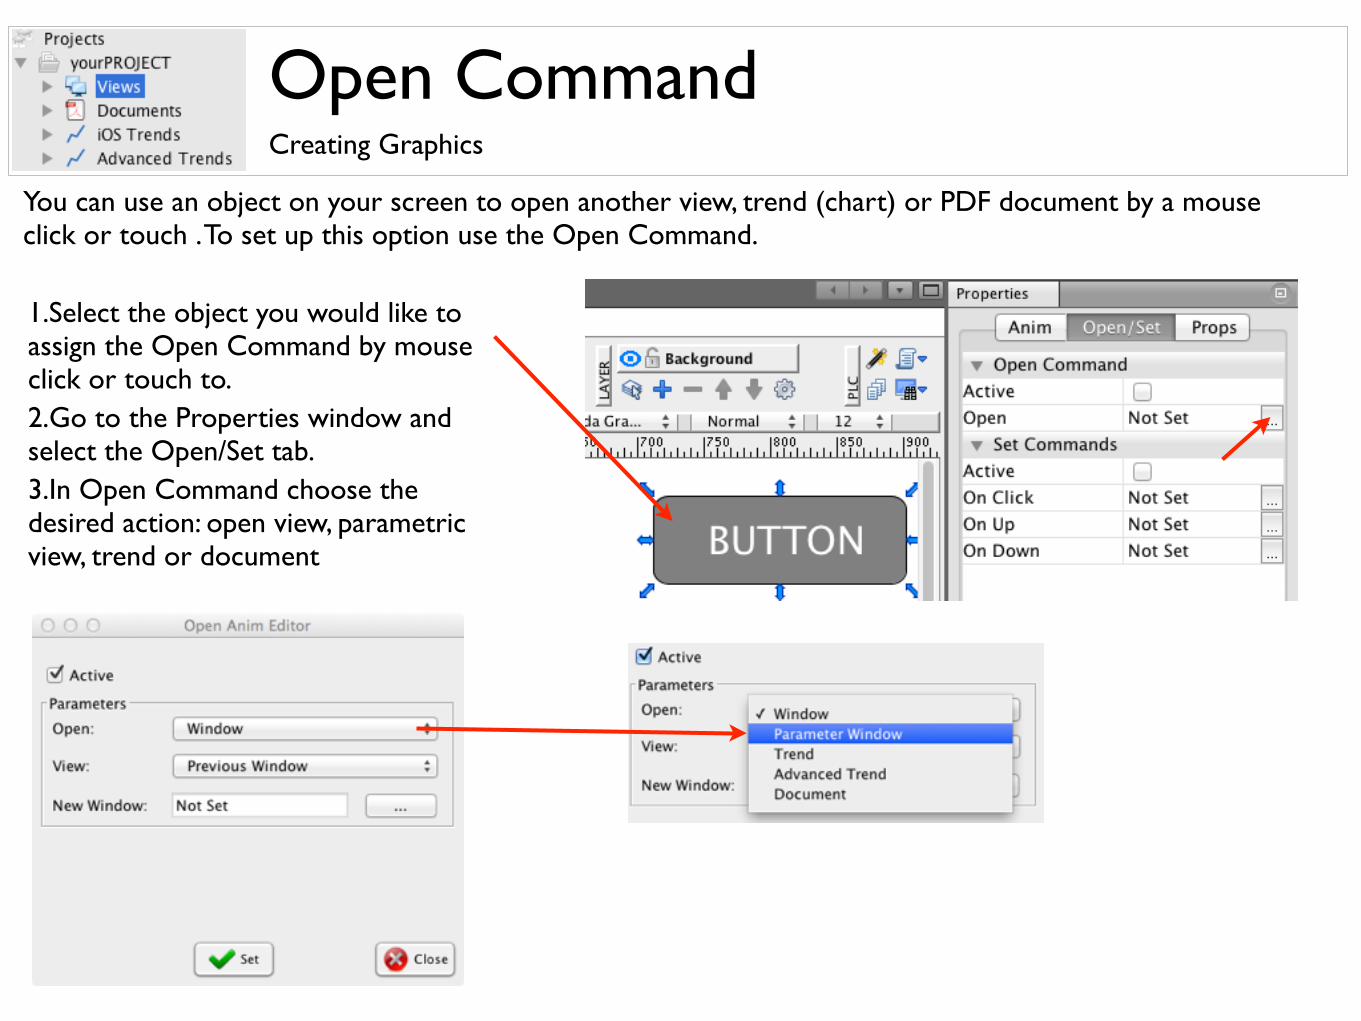
You can use an object on your screen to open another view, trend (chart) or PDF document by a mouse click or touch . To set up this option use the Open Command.
1.Select the object you would like to assign the Open Command by mouse click or touch to. 2.Go to the Properties window and select the Open/Set tab. 3.In Open Command choose the desired action: open view, parametric view, trend or document
Open in New Window (Faceplate)Creating Graphics
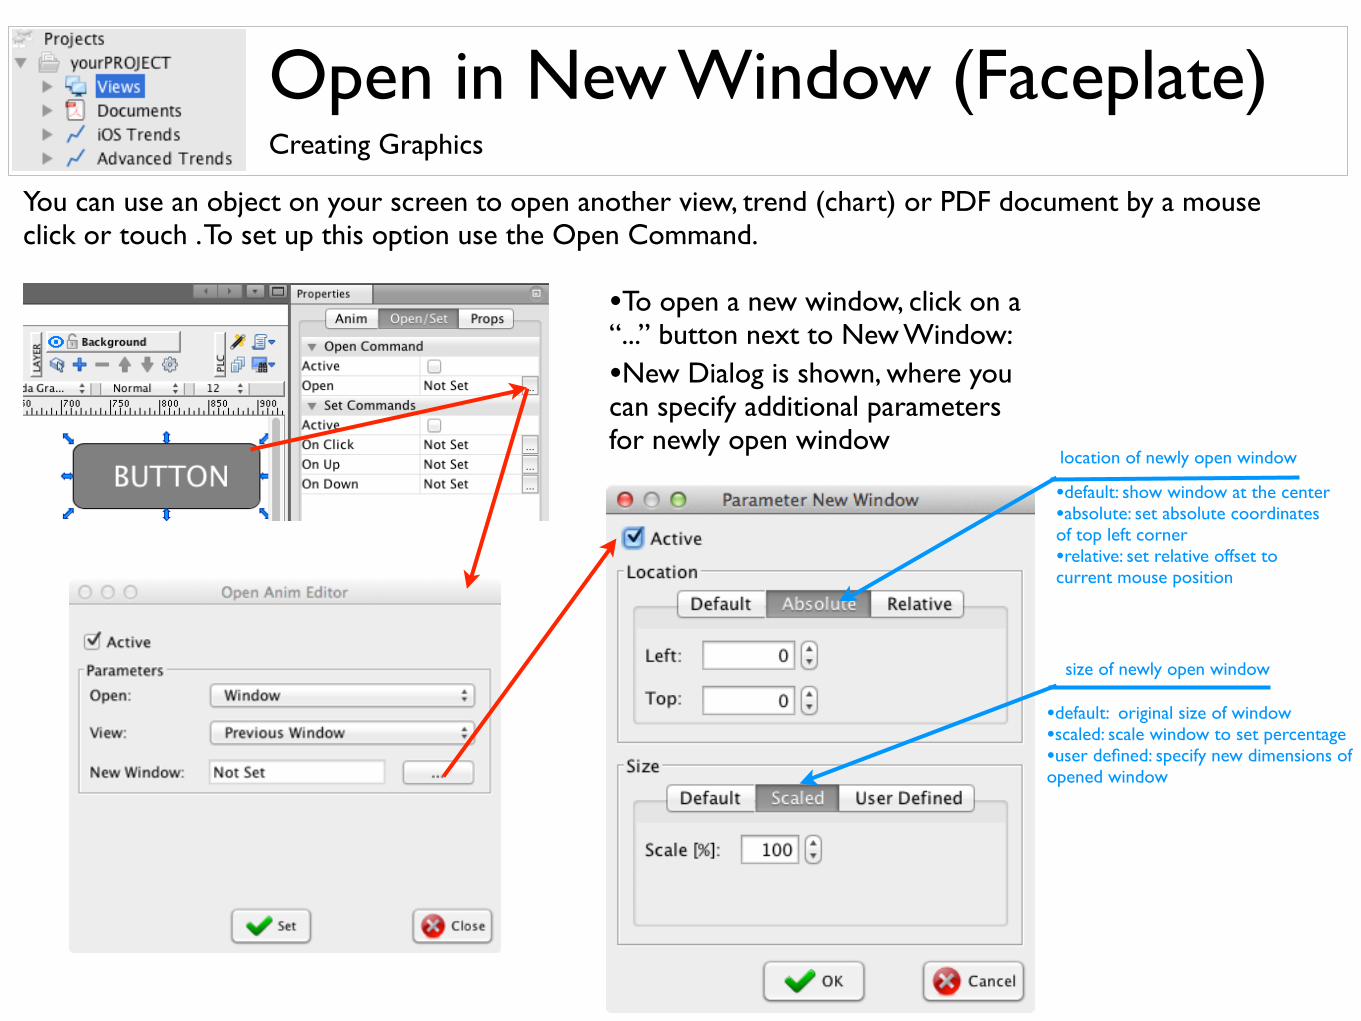
You can use an object on your screen to open another view, trend (chart) or PDF document by a mouse click or touch . To set up this option use the Open Command.
•To open a new window, click on a “...” button next to New Window:•New Dialog is shown, where you can specify additional parameters for newly open window
location of newly open window
size of newly open window
•default: show window at the center•absolute: set absolute coordinates of top left corner•relative: set relative offset to current mouse position
•default: original size of window•scaled: scale window to set percentage•user defined: specify new dimensions of opened window
Parametric ViewsCreating Graphics
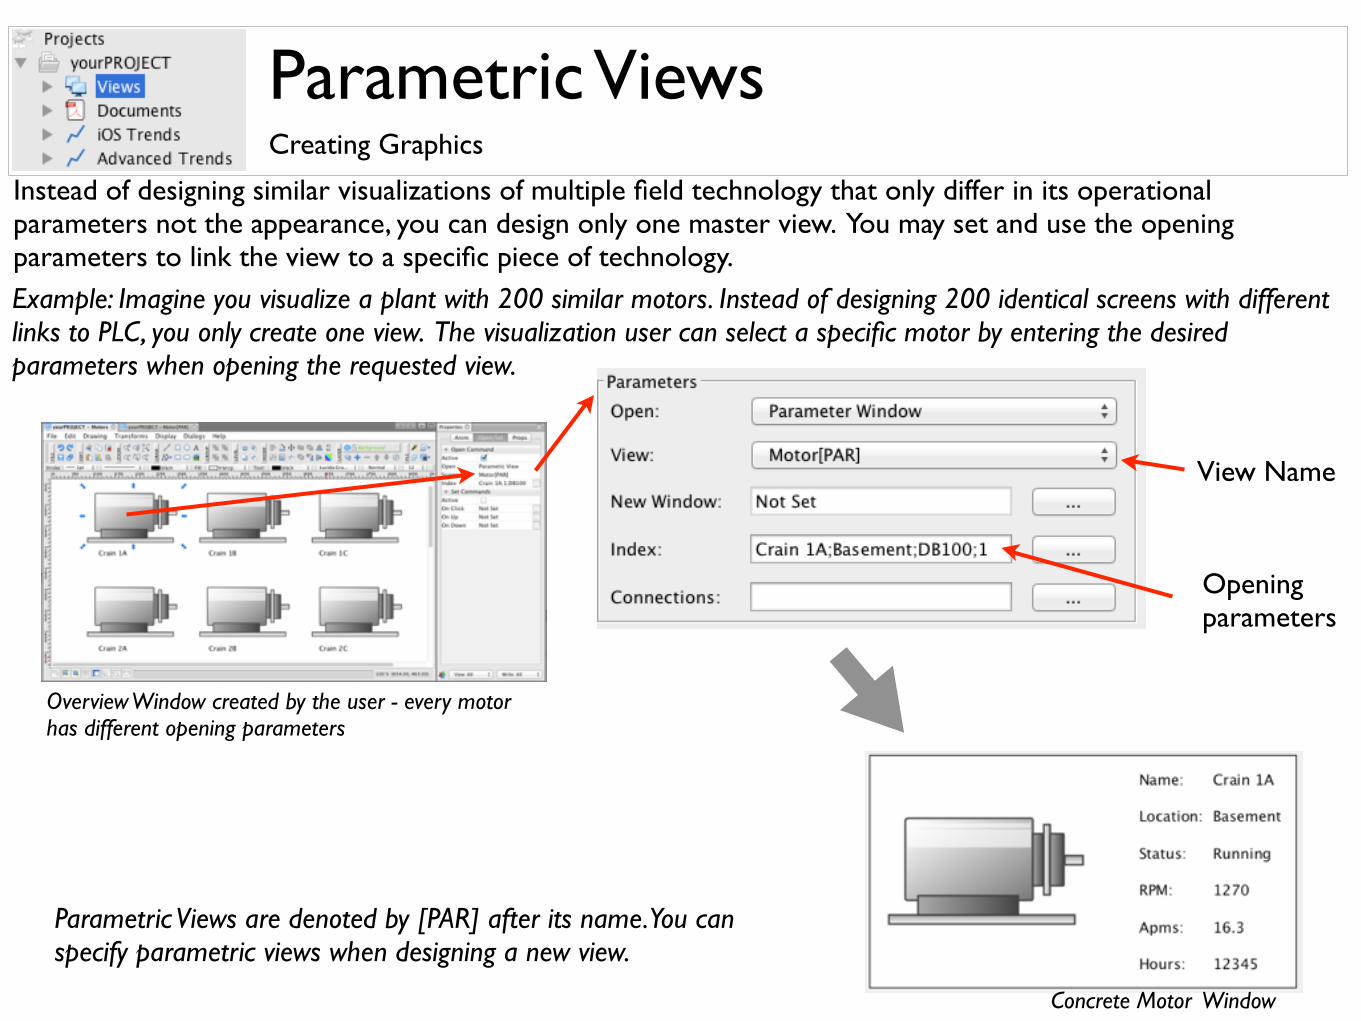
Instead of designing similar visualizations of multiple field technology that only differ in its operational parameters not the appearance, you can design only one master view. You may set and use the opening parameters to link the view to a specific piece of technology.Example: Imagine you visualize a plant with 200 similar motors. Instead of designing 200 identical screens with different links to PLC, you only create one view. The visualization user can select a specific motor by entering the desired parameters when opening the requested view.
Overview Window created by the user - every motor has different opening parameters
Concrete Motor Window
View Name
Opening parameters
Parametric Views are denoted by [PAR] after its name. You can specify parametric views when designing a new view.
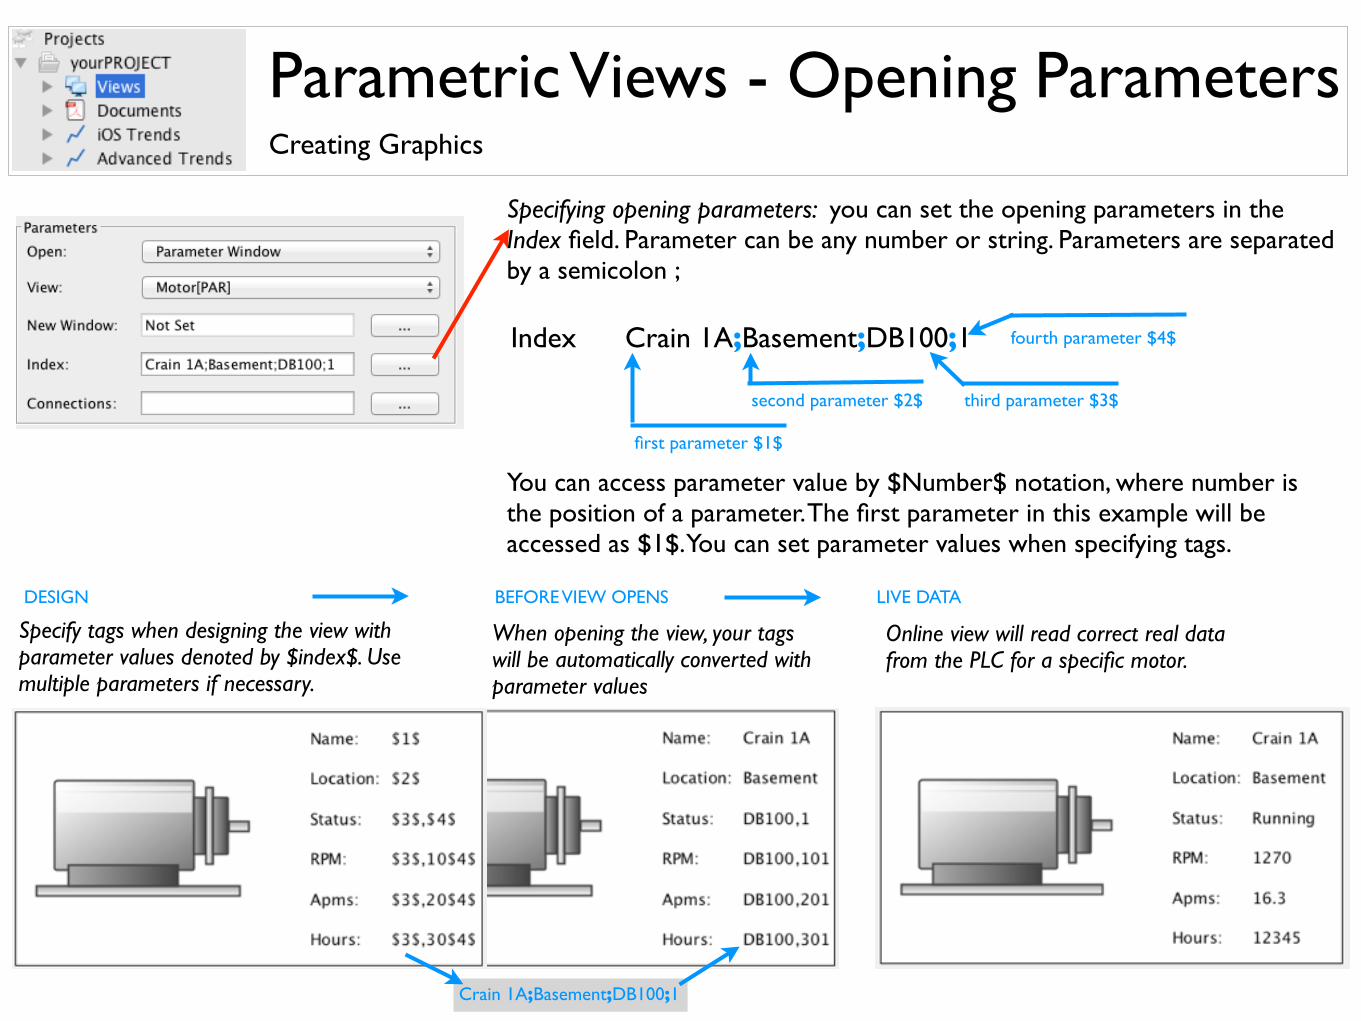
Parametric Views - Opening ParametersCreating Graphics
Online view will read correct real data from the PLC for a specific motor.
Specifying opening parameters: you can set the opening parameters in the Index field. Parameter can be any number or string. Parameters are separated by a semicolon ;
Index Crain 1A;Basement;DB100;1
first parameter $1$
second parameter $2$ third parameter $3$
fourth parameter $4$
You can access parameter value by $Number$ notation, where number is the position of a parameter. The first parameter in this example will be accessed as $1$. You can set parameter values when specifying tags.
Specify tags when designing the view with parameter values denoted by $index$. Use multiple parameters if necessary.
When opening the view, your tags will be automatically converted with parameter values
DESIGN BEFORE VIEW OPENS LIVE DATA
Crain 1A;Basement;DB100;1
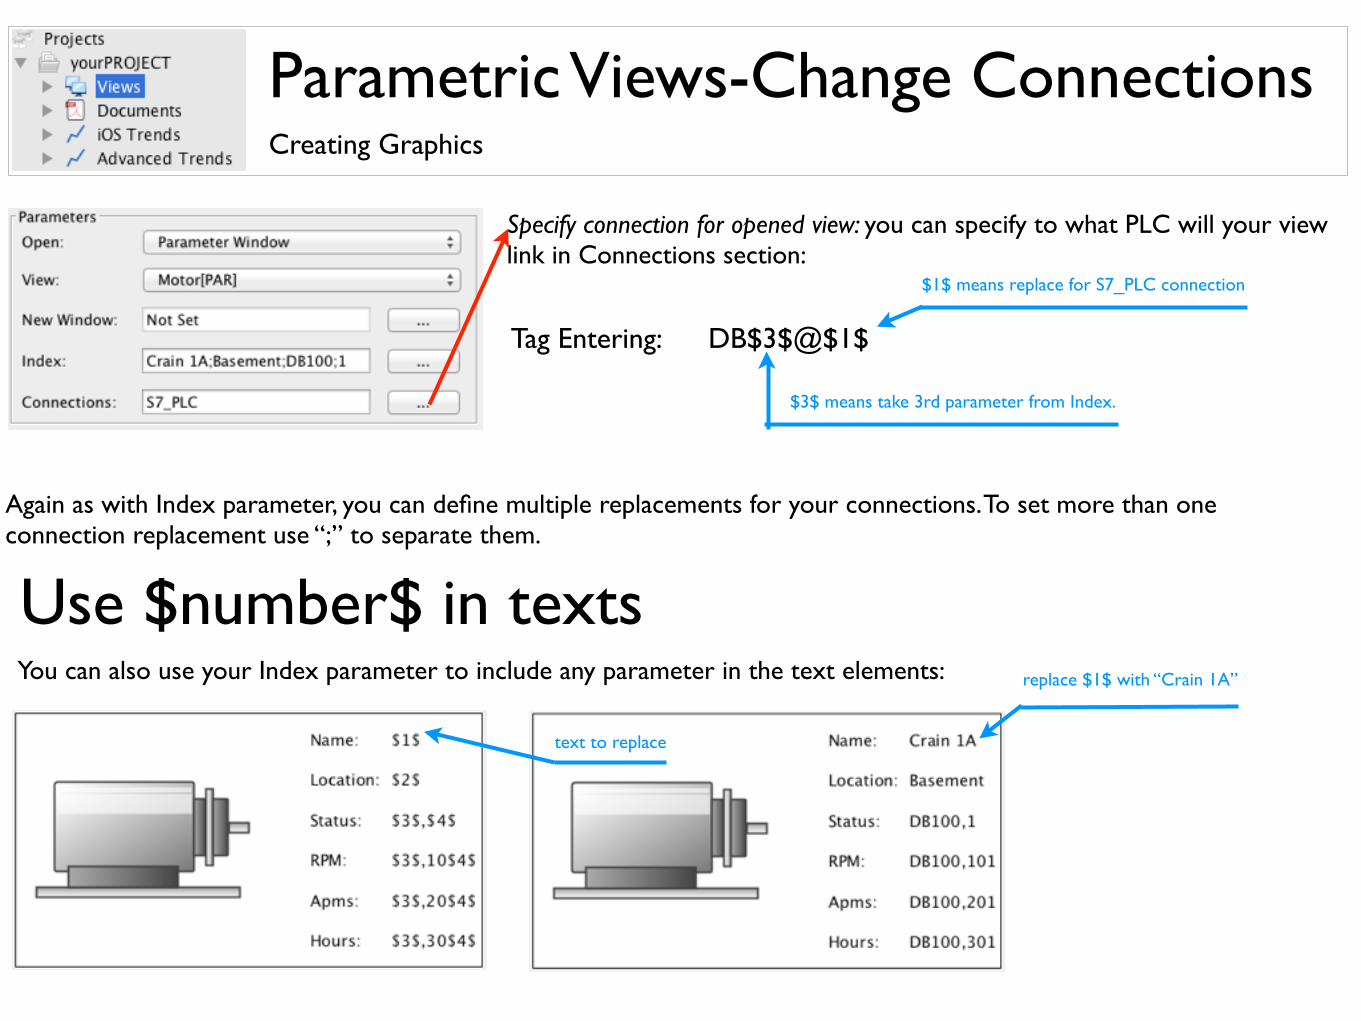
Parametric Views-Change ConnectionsCreating Graphics
Specify connection for opened view: you can specify to what PLC will your view link in Connections section:
Tag Entering: DB$3$@$1$
$3$ means take 3rd parameter from Index.
$1$ means replace for S7_PLC connection
Again as with Index parameter, you can define multiple replacements for your connections. To set more than one connection replacement use “;” to separate them.
You can also use your Index parameter to include any parameter in the text elements:
Use $number$ in textsreplace $1$ with “Crain 1A”
text to replace
Visual ScriptingCreating Graphics
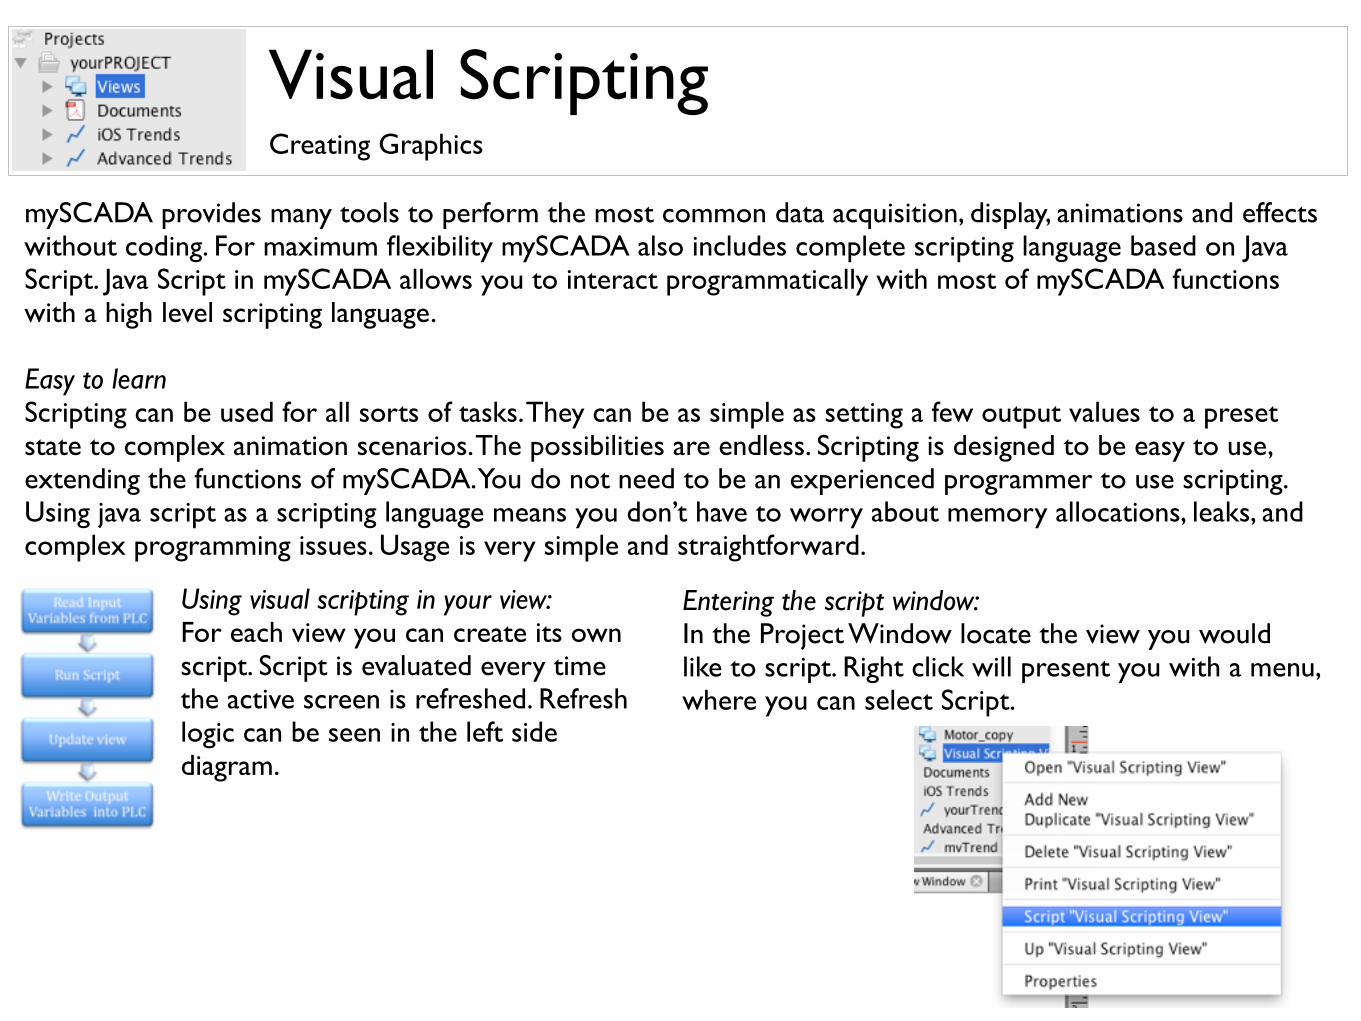
mySCADA provides many tools to perform the most common data acquisition, display, animations and effects without coding. For maximum flexibility mySCADA also includes complete scripting language based on Java Script. Java Script in mySCADA allows you to interact programmatically with most of mySCADA functions with a high level scripting language. Easy to learnScripting can be used for all sorts of tasks. They can be as simple as setting a few output values to a preset state to complex animation scenarios. The possibilities are endless. Scripting is designed to be easy to use, extending the functions of mySCADA. You do not need to be an experienced programmer to use scripting. Using java script as a scripting language means you don’t have to worry about memory allocations, leaks, and complex programming issues. Usage is very simple and straightforward.
Using visual scripting in your view: For each view you can create its own script. Script is evaluated every time the active screen is refreshed. Refresh logic can be seen in the left side diagram.
Entering the script window: In the Project Window locate the view you would like to script. Right click will present you with a menu, where you can select Script.
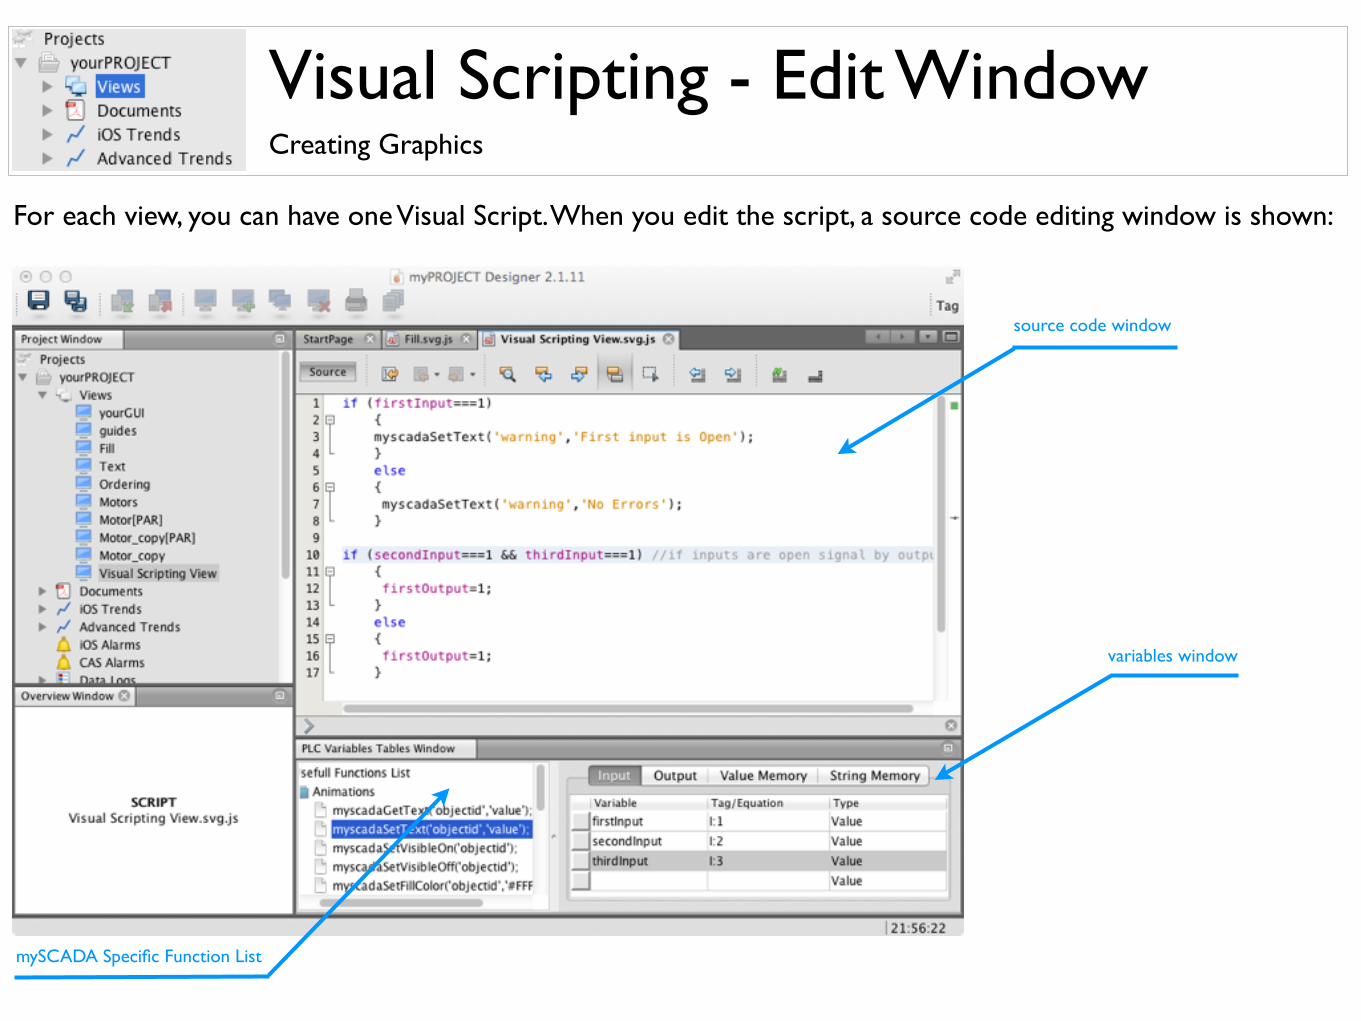
Visual Scripting - Edit WindowCreating Graphics
For each view, you can have one Visual Script. When you edit the script, a source code editing window is shown:
source code window
mySCADA Specific Function List
variables window
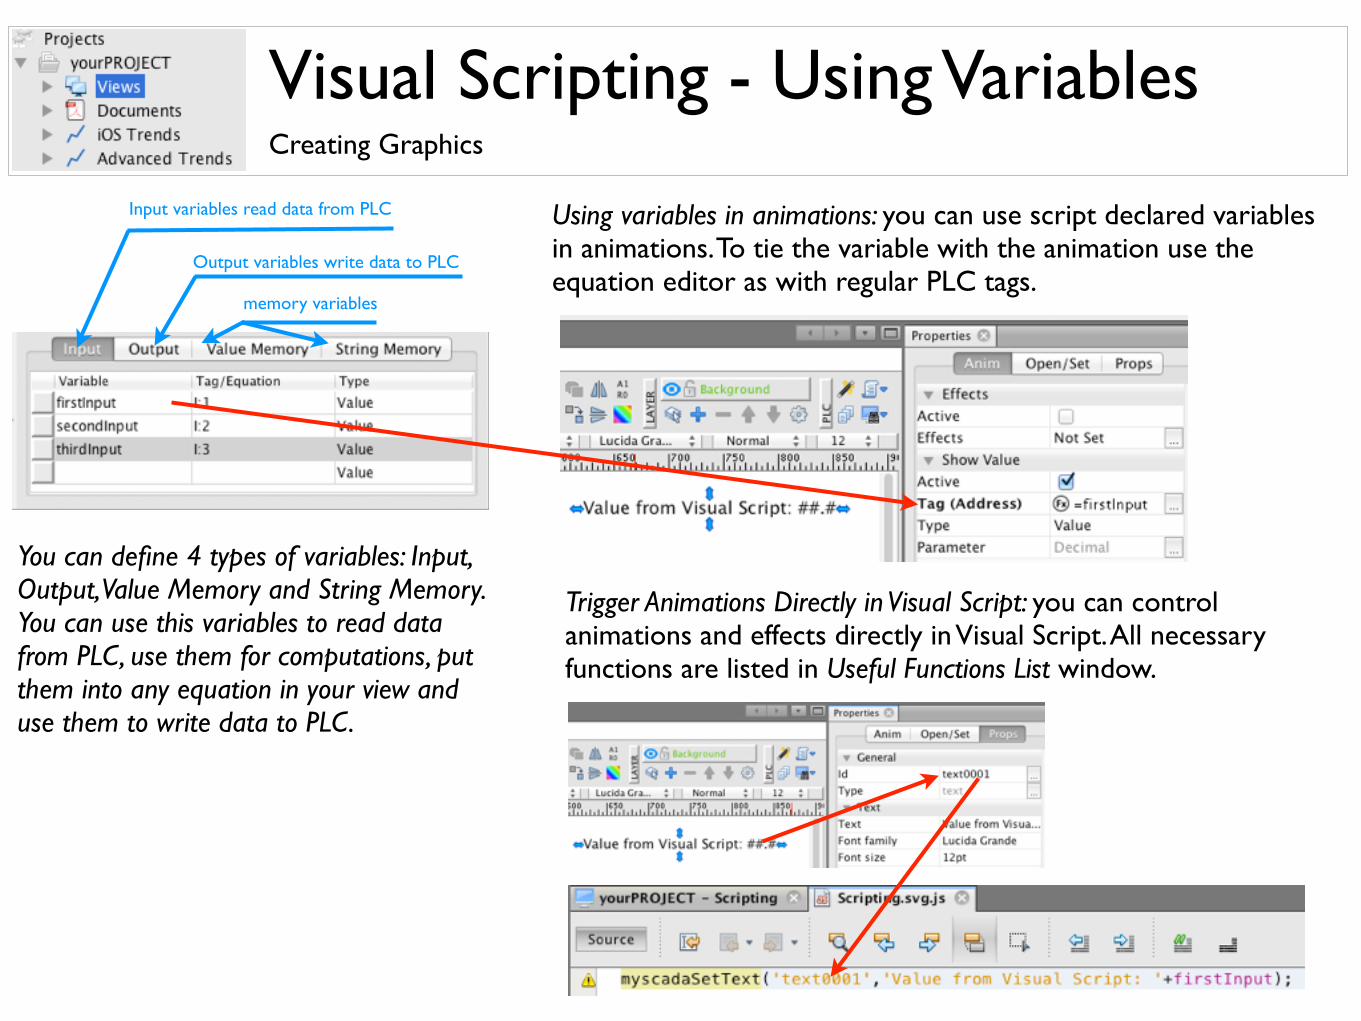
Visual Scripting - Using VariablesCreating Graphics
You can define 4 types of variables: Input, Output, Value Memory and String Memory. You can use this variables to read data from PLC, use them for computations, put them into any equation in your view and use them to write data to PLC.
memory variables
Output variables write data to PLC
Input variables read data from PLC Using variables in animations: you can use script declared variables in animations. To tie the variable with the animation use the equation editor as with regular PLC tags.
Trigger Animations Directly in Visual Script: you can control animations and effects directly in Visual Script. All necessary functions are listed in Useful Functions List window.
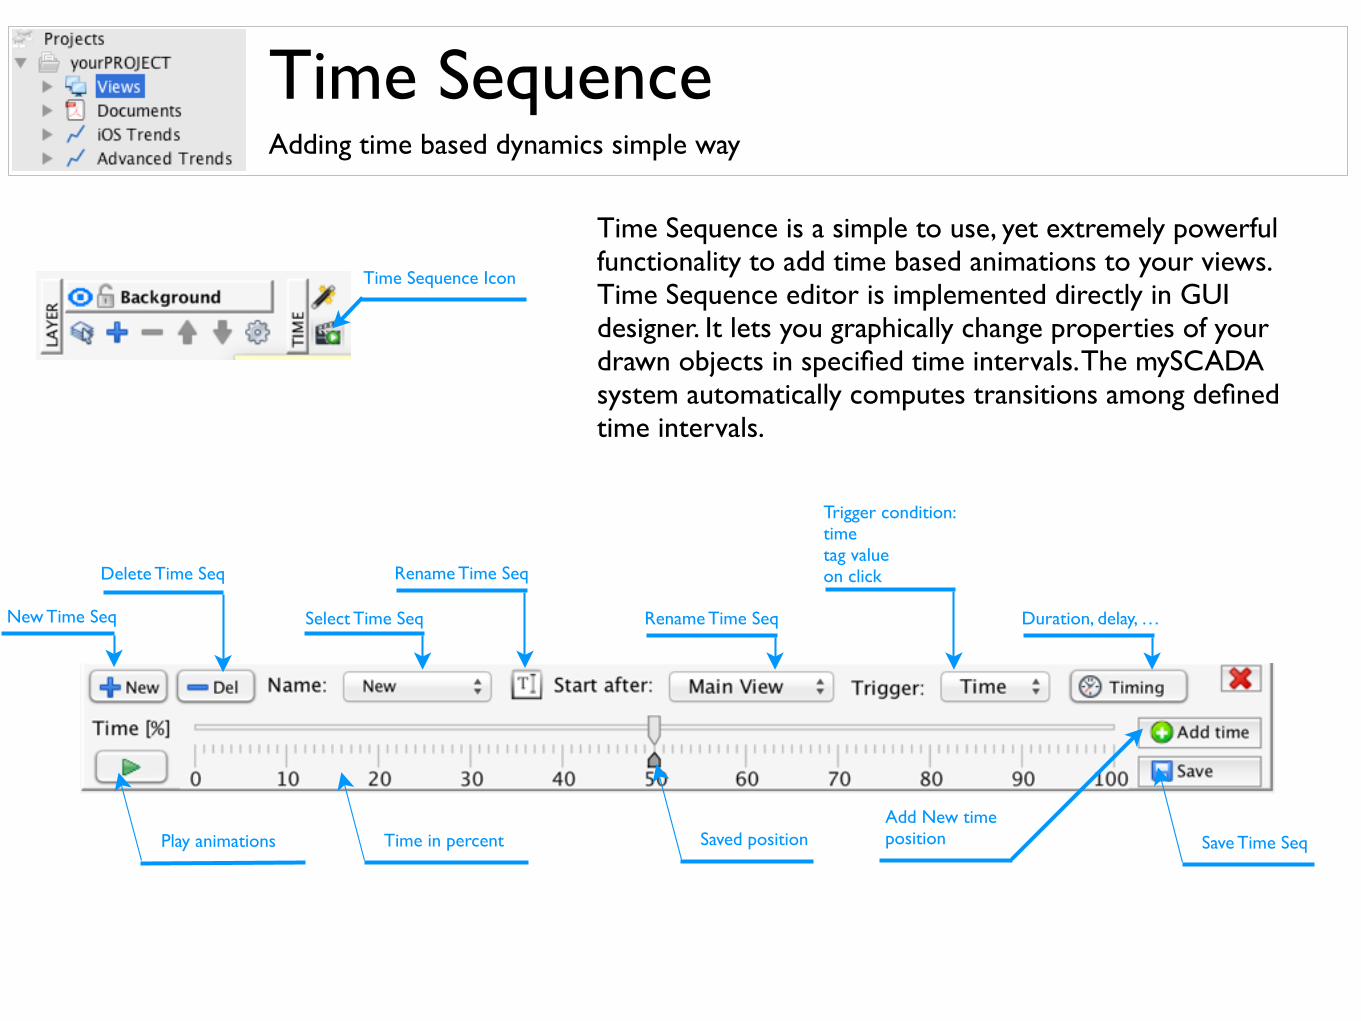
Time SequenceAdding time based dynamics simple way
Time Sequence is a simple to use, yet extremely powerful functionality to add time based animations to your views. Time Sequence editor is implemented directly in GUI designer. It lets you graphically change properties of your drawn objects in specified time intervals. The mySCADA system automatically computes transitions among defined time intervals.
Time Sequence Icon
New Time Seq
Delete Time Seq
Select Time Seq
Rename Time Seq
Rename Time Seq
Trigger condition:timetag valueon click
Duration, delay, …
Play animations Time in percent Saved position Save Time SeqAdd New timeposition
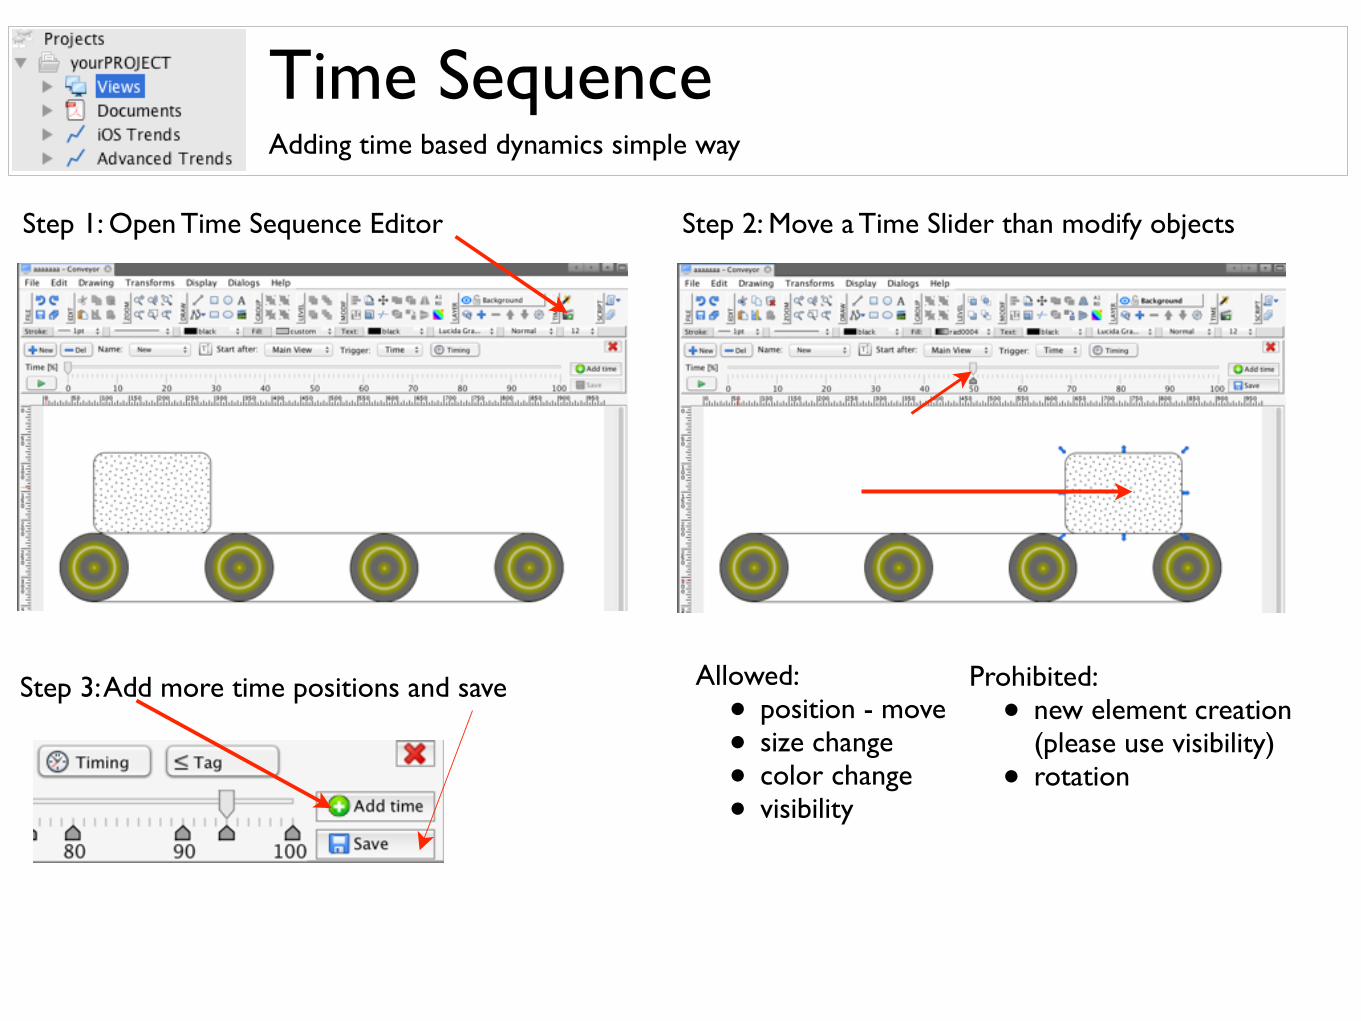
Time SequenceAdding time based dynamics simple way
Step 1: Open Time Sequence Editor Step 2: Move a Time Slider than modify objects
Step 3: Add more time positions and save Allowed:• position - move• size change• color change• visibility
Prohibited:• new element creation
(please use visibility)• rotation
Time SequenceAdding time based dynamics simple way
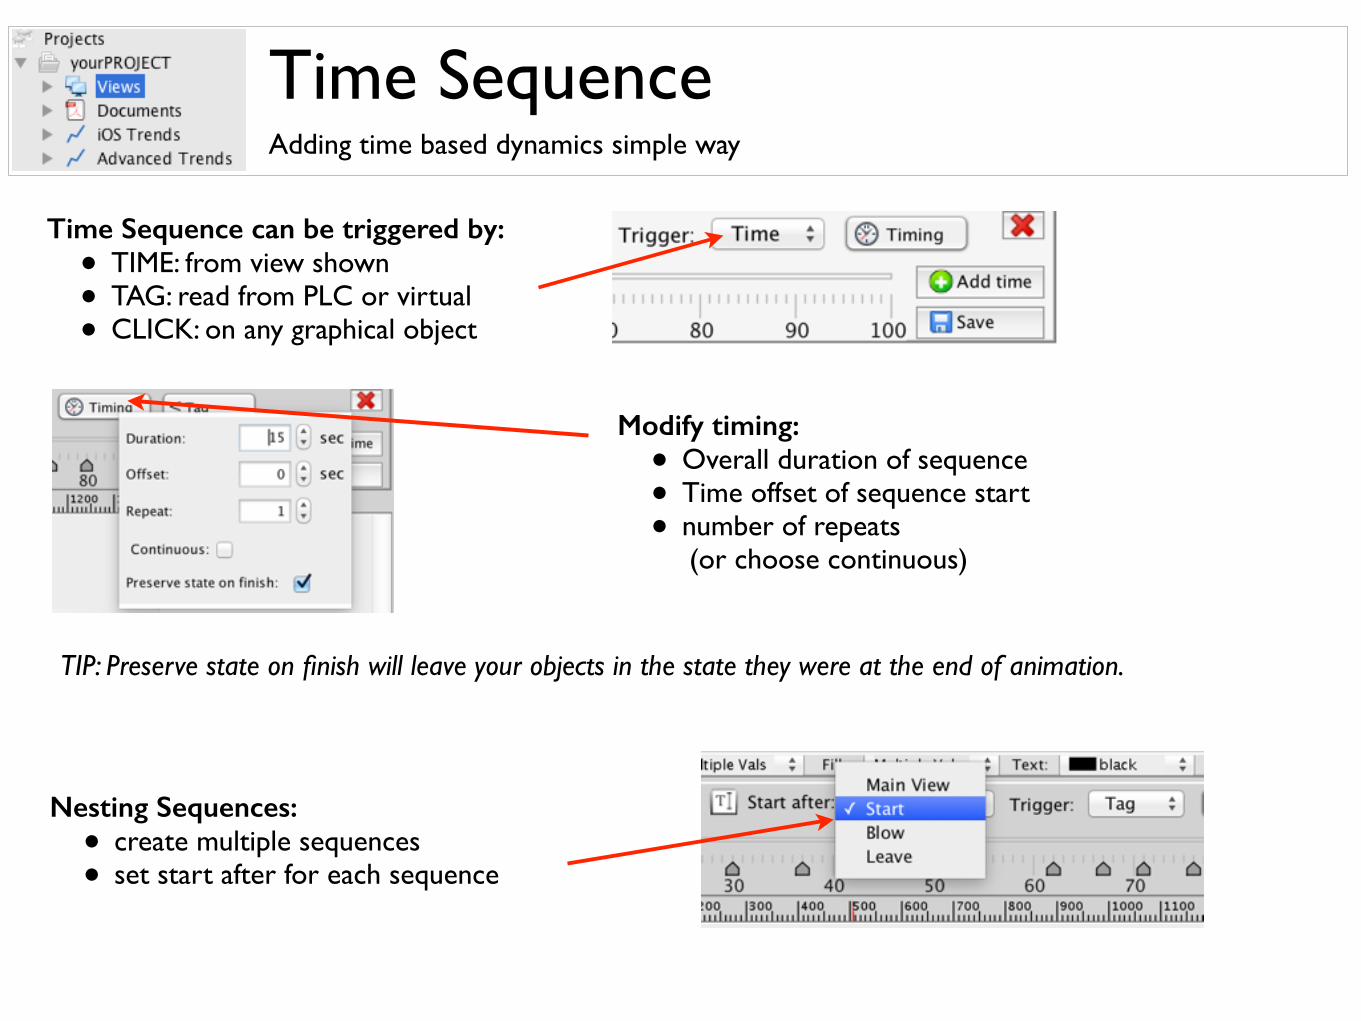
Time Sequence can be triggered by: • TIME: from view shown• TAG: read from PLC or virtual• CLICK: on any graphical object
Modify timing: • Overall duration of sequence• Time offset of sequence start• number of repeats
(or choose continuous)
TIP: Preserve state on finish will leave your objects in the state they were at the end of animation.
Nesting Sequences: • create multiple sequences• set start after for each sequence
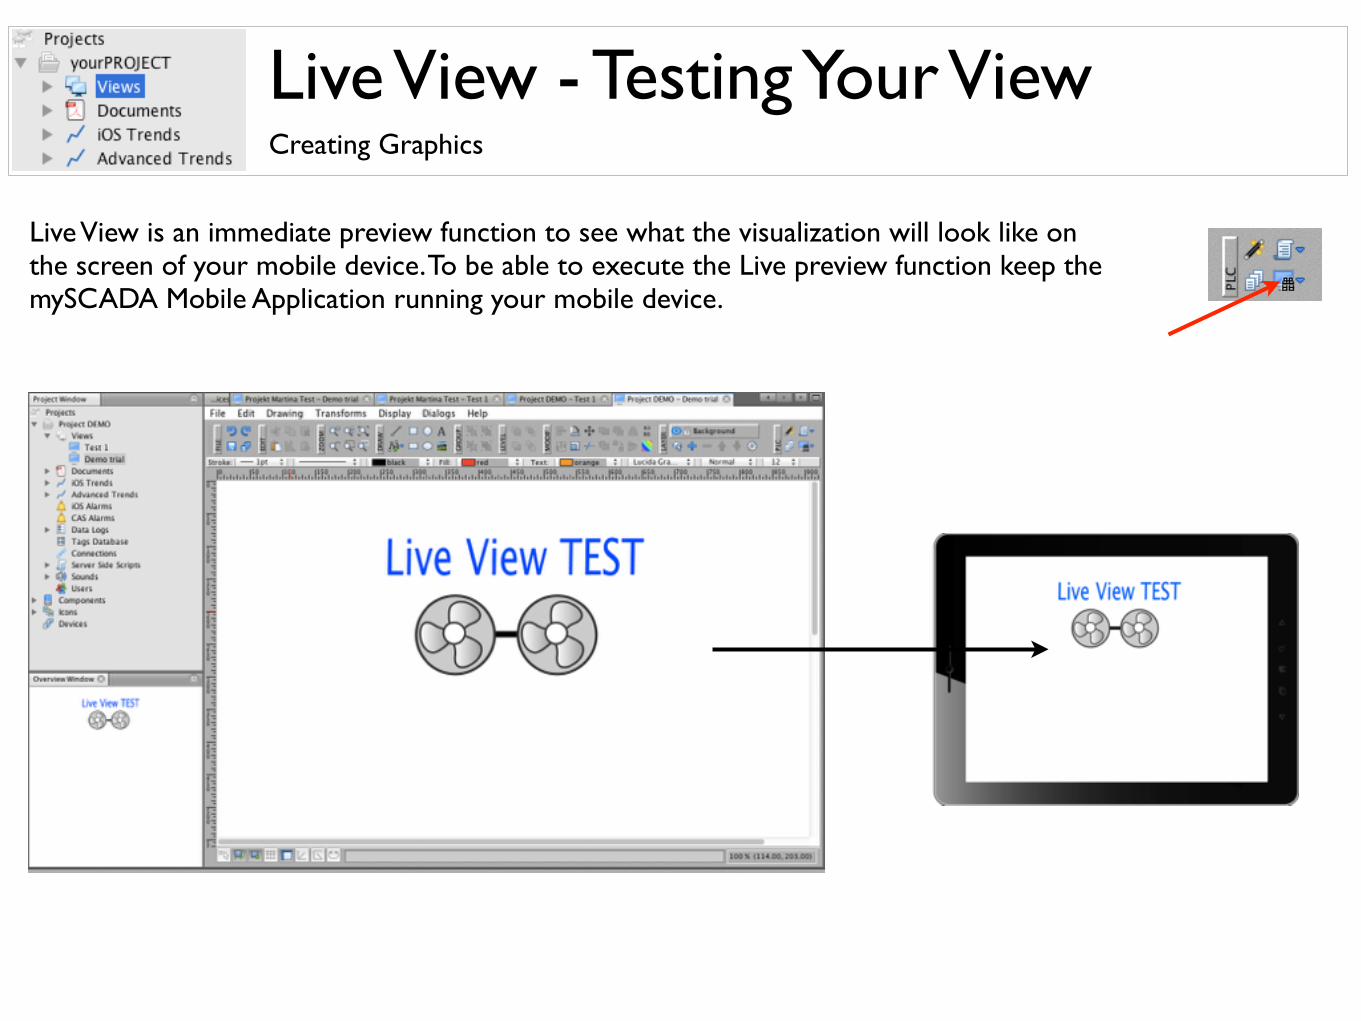
Live View - Testing Your ViewCreating Graphics
Live View is an immediate preview function to see what the visualization will look like on the screen of your mobile device. To be able to execute the Live preview function keep the mySCADA Mobile Application running your mobile device.
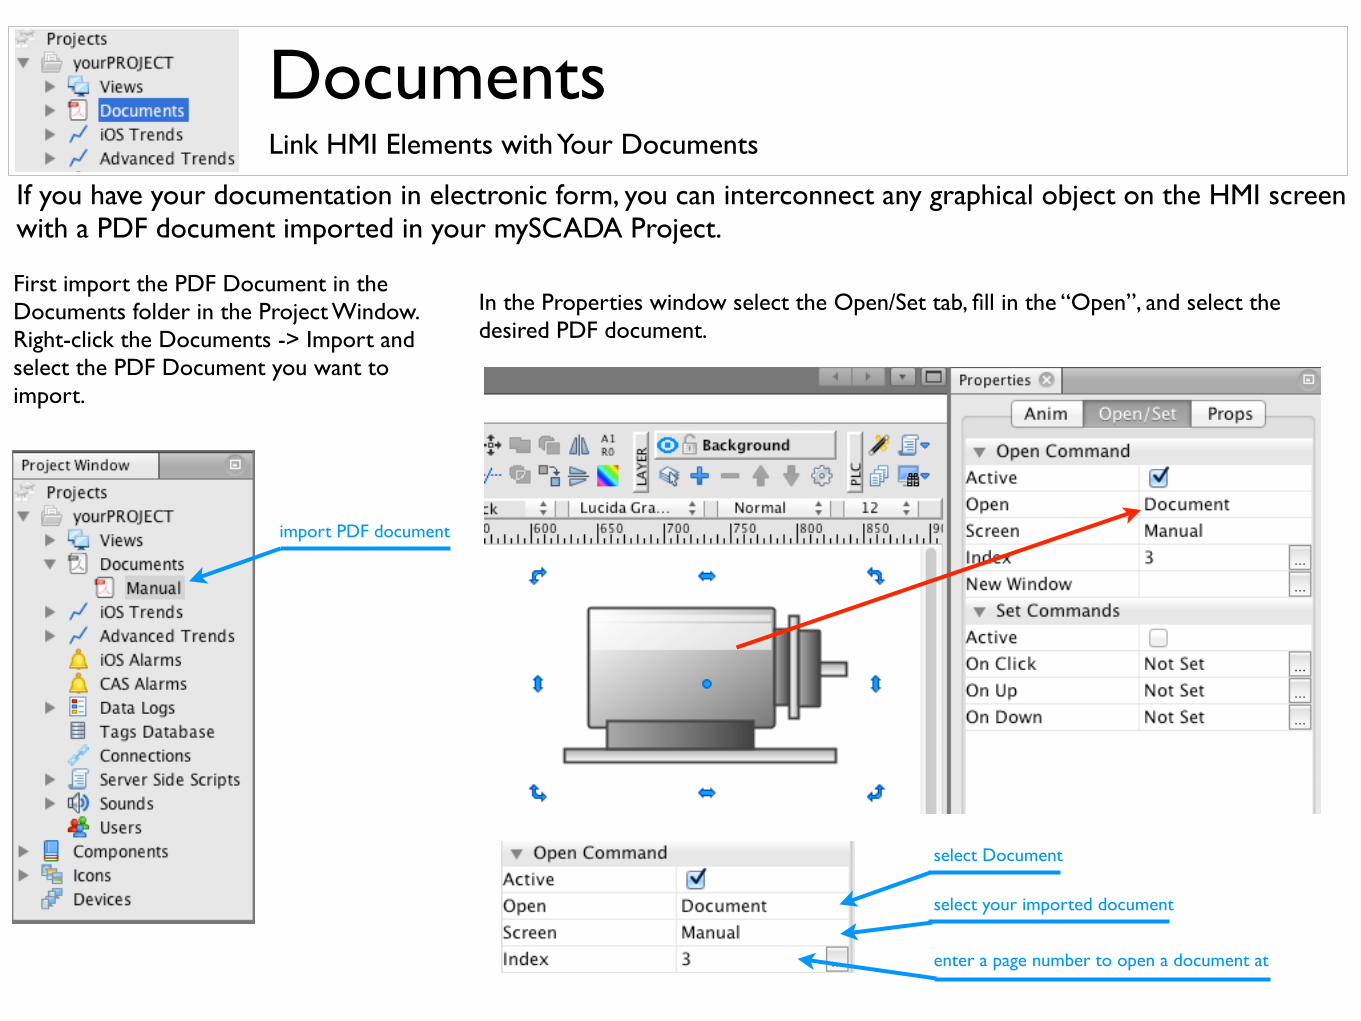
DocumentsLink HMI Elements with Your Documents
If you have your documentation in electronic form, you can interconnect any graphical object on the HMI screen with a PDF document imported in your mySCADA Project.
import PDF document
select Document
select your imported document
enter a page number to open a document at
First import the PDF Document in the Documents folder in the Project Window. Right-click the Documents -> Import and select the PDF Document you want to import.
In the Properties window select the Open/Set tab, fill in the “Open”, and select the desired PDF document.
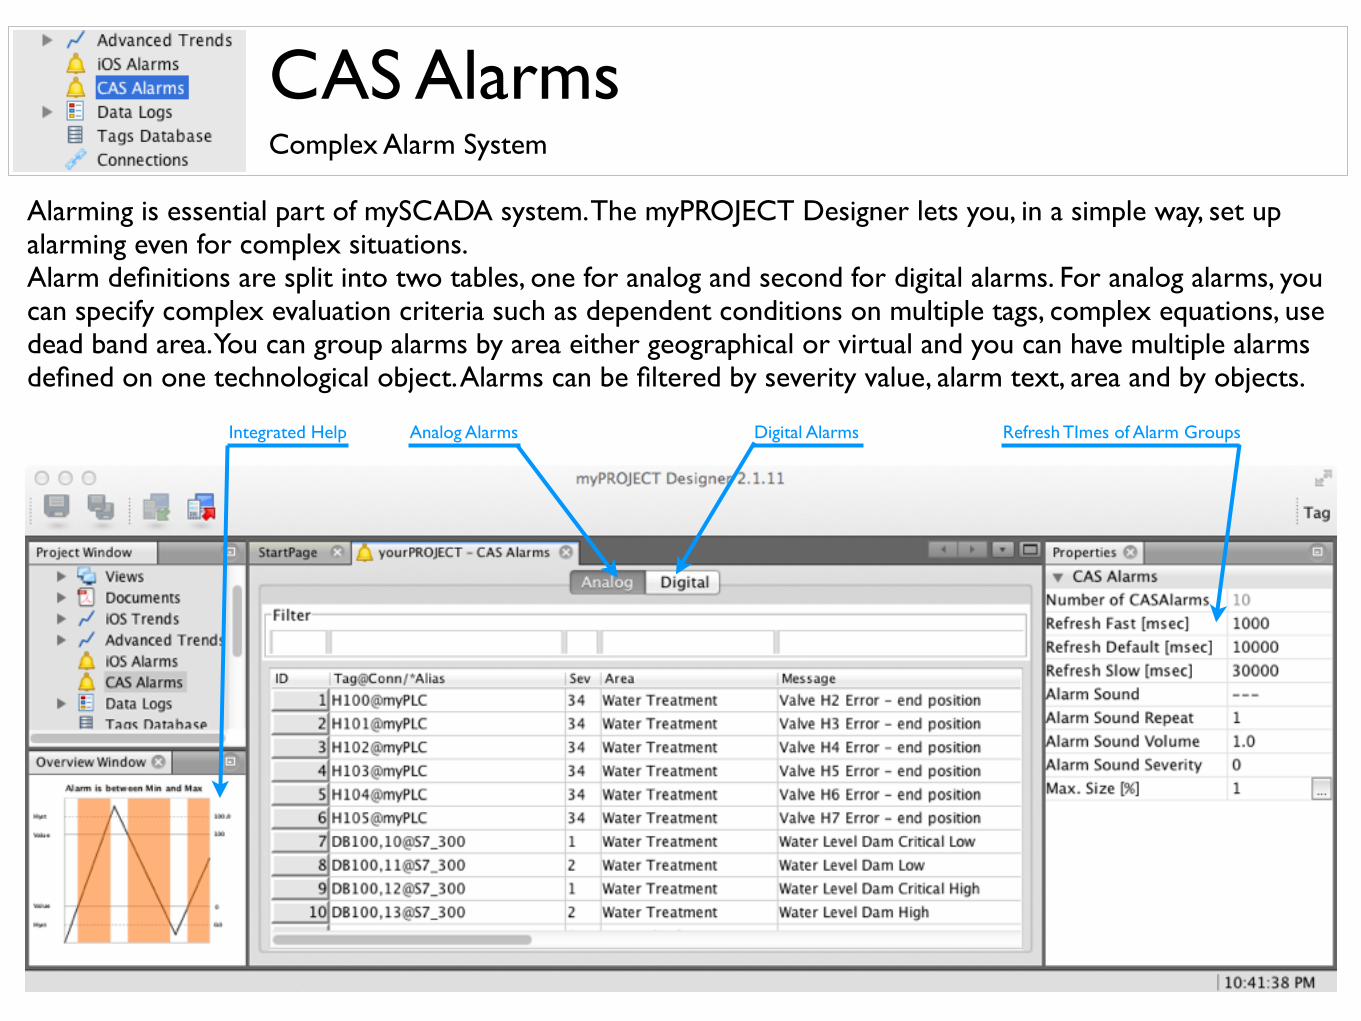
CAS AlarmsComplex Alarm System
Alarming is essential part of mySCADA system. The myPROJECT Designer lets you, in a simple way, set up alarming even for complex situations. Alarm definitions are split into two tables, one for analog and second for digital alarms. For analog alarms, you can specify complex evaluation criteria such as dependent conditions on multiple tags, complex equations, use dead band area. You can group alarms by area either geographical or virtual and you can have multiple alarms defined on one technological object. Alarms can be filtered by severity value, alarm text, area and by objects.
Analog Alarms Digital Alarms Refresh TImes of Alarm GroupsIntegrated Help
CAS AlarmsComplex Alarm System
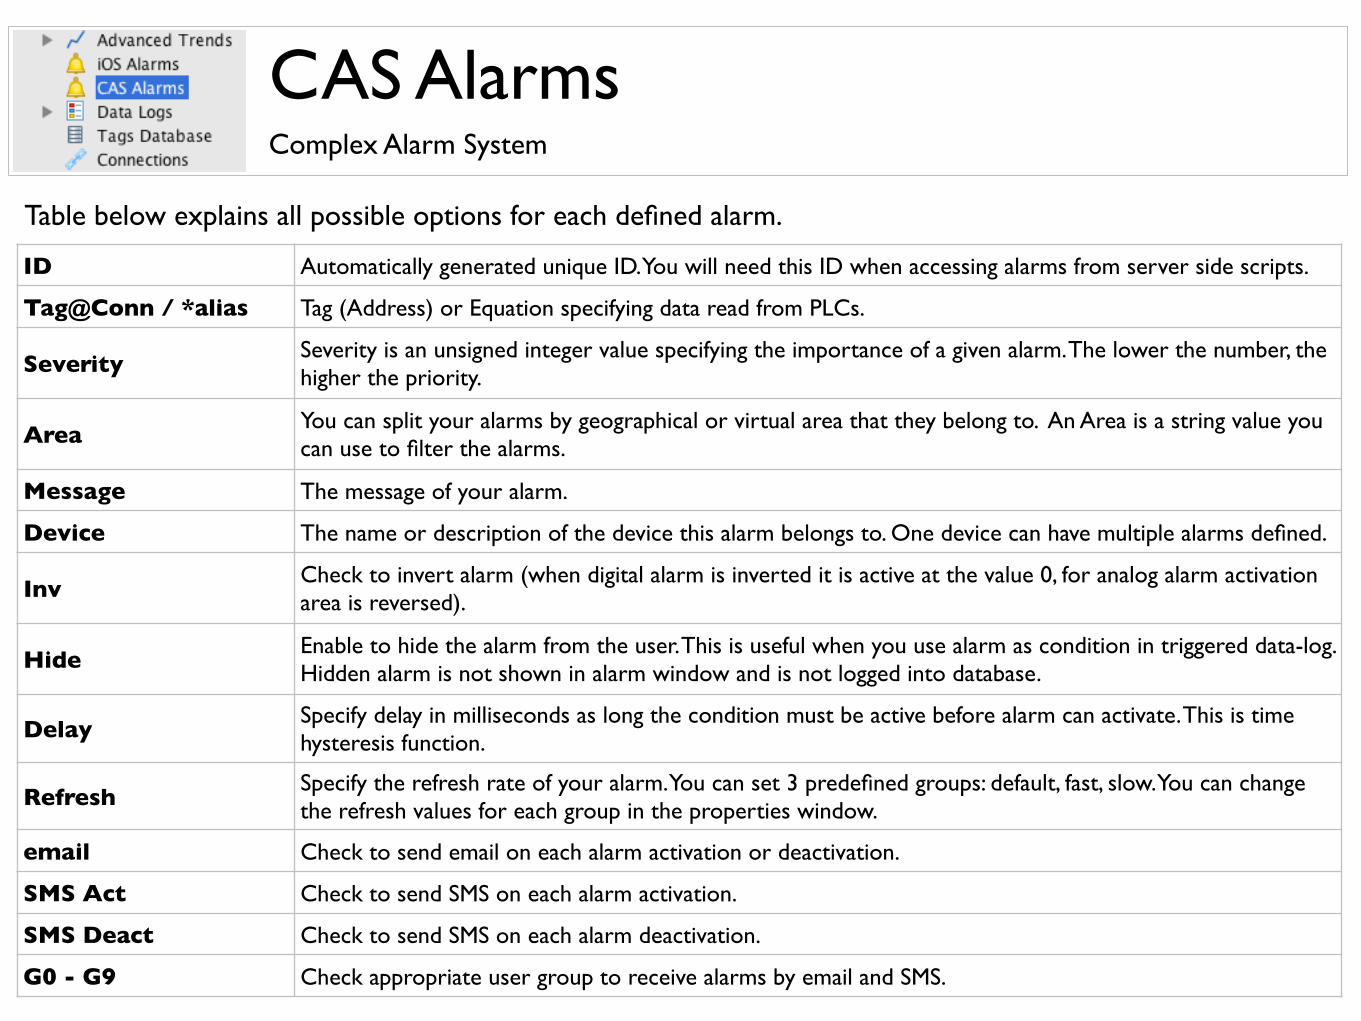
ID Automatically generated unique ID. You will need this ID when accessing alarms from server side scripts.
Tag@Conn / *alias Tag (Address) or Equation specifying data read from PLCs.
Severity Severity is an unsigned integer value specifying the importance of a given alarm. The lower the number, the higher the priority.
Area You can split your alarms by geographical or virtual area that they belong to. An Area is a string value you can use to filter the alarms.
Message The message of your alarm.
Device The name or description of the device this alarm belongs to. One device can have multiple alarms defined.
Inv Check to invert alarm (when digital alarm is inverted it is active at the value 0, for analog alarm activation area is reversed).
Hide Enable to hide the alarm from the user. This is useful when you use alarm as condition in triggered data-log. Hidden alarm is not shown in alarm window and is not logged into database.
Delay Specify delay in milliseconds as long the condition must be active before alarm can activate. This is time hysteresis function.
Refresh Specify the refresh rate of your alarm. You can set 3 predefined groups: default, fast, slow. You can change the refresh values for each group in the properties window.
email Check to send email on each alarm activation or deactivation.
SMS Act Check to send SMS on each alarm activation.
SMS Deact Check to send SMS on each alarm deactivation.
G0 - G9 Check appropriate user group to receive alarms by email and SMS.
Table below explains all possible options for each defined alarm.
CAS Alarms - Analog ValuesComplex Alarm System
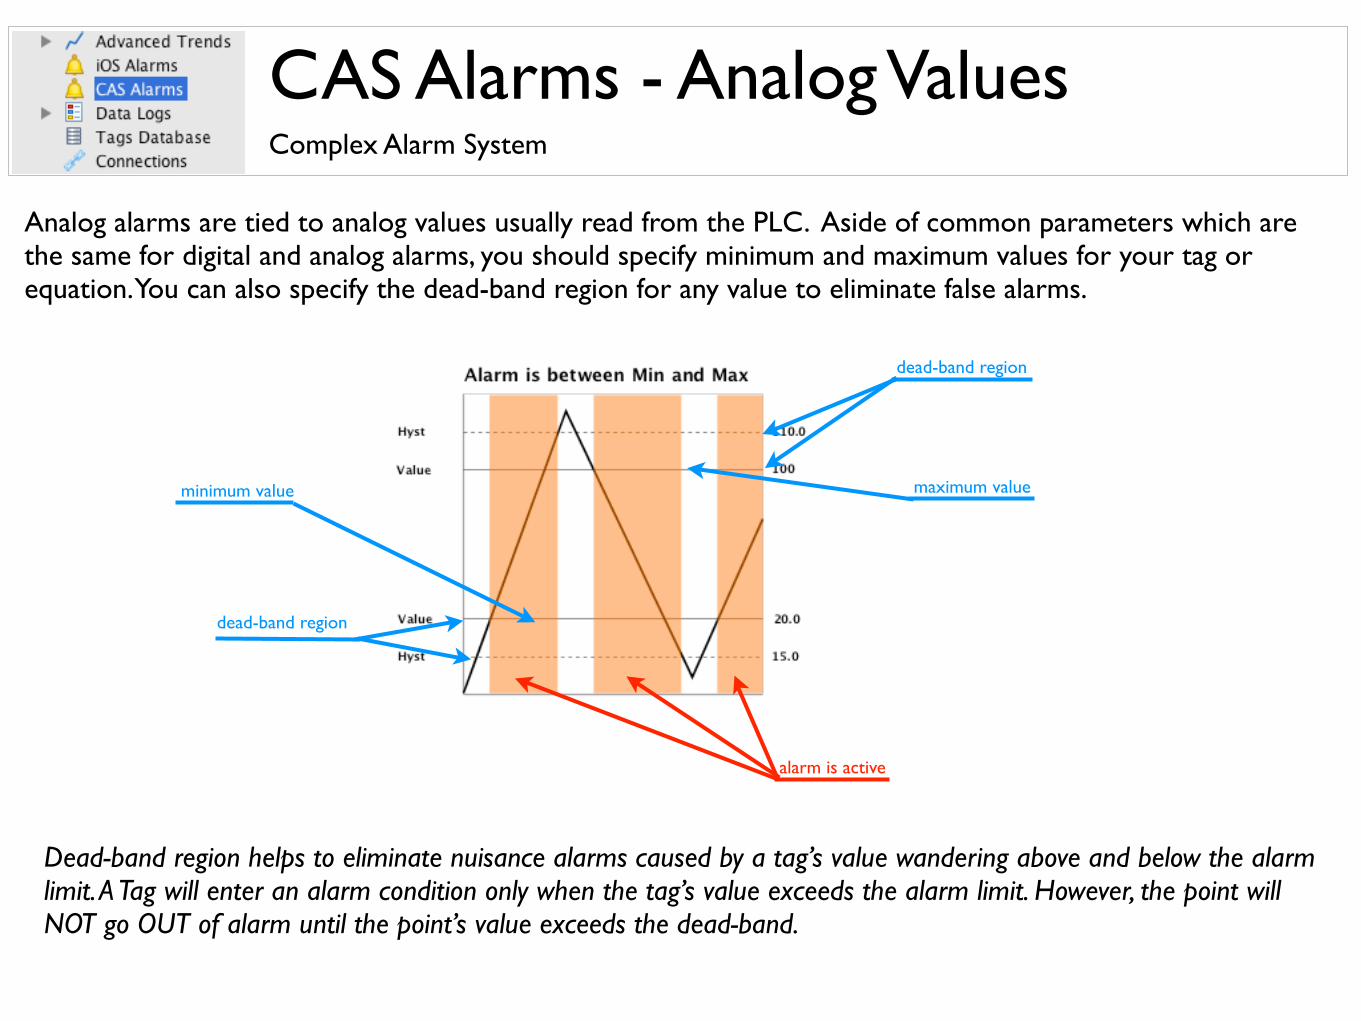
Analog alarms are tied to analog values usually read from the PLC. Aside of common parameters which are the same for digital and analog alarms, you should specify minimum and maximum values for your tag or equation. You can also specify the dead-band region for any value to eliminate false alarms.
Dead-band region helps to eliminate nuisance alarms caused by a tag’s value wandering above and below the alarm limit. A Tag will enter an alarm condition only when the tag’s value exceeds the alarm limit. However, the point will NOT go OUT of alarm until the point’s value exceeds the dead-band.
maximum value
dead-band region
dead-band region
minimum value
alarm is active
Historical DataHistorical Data
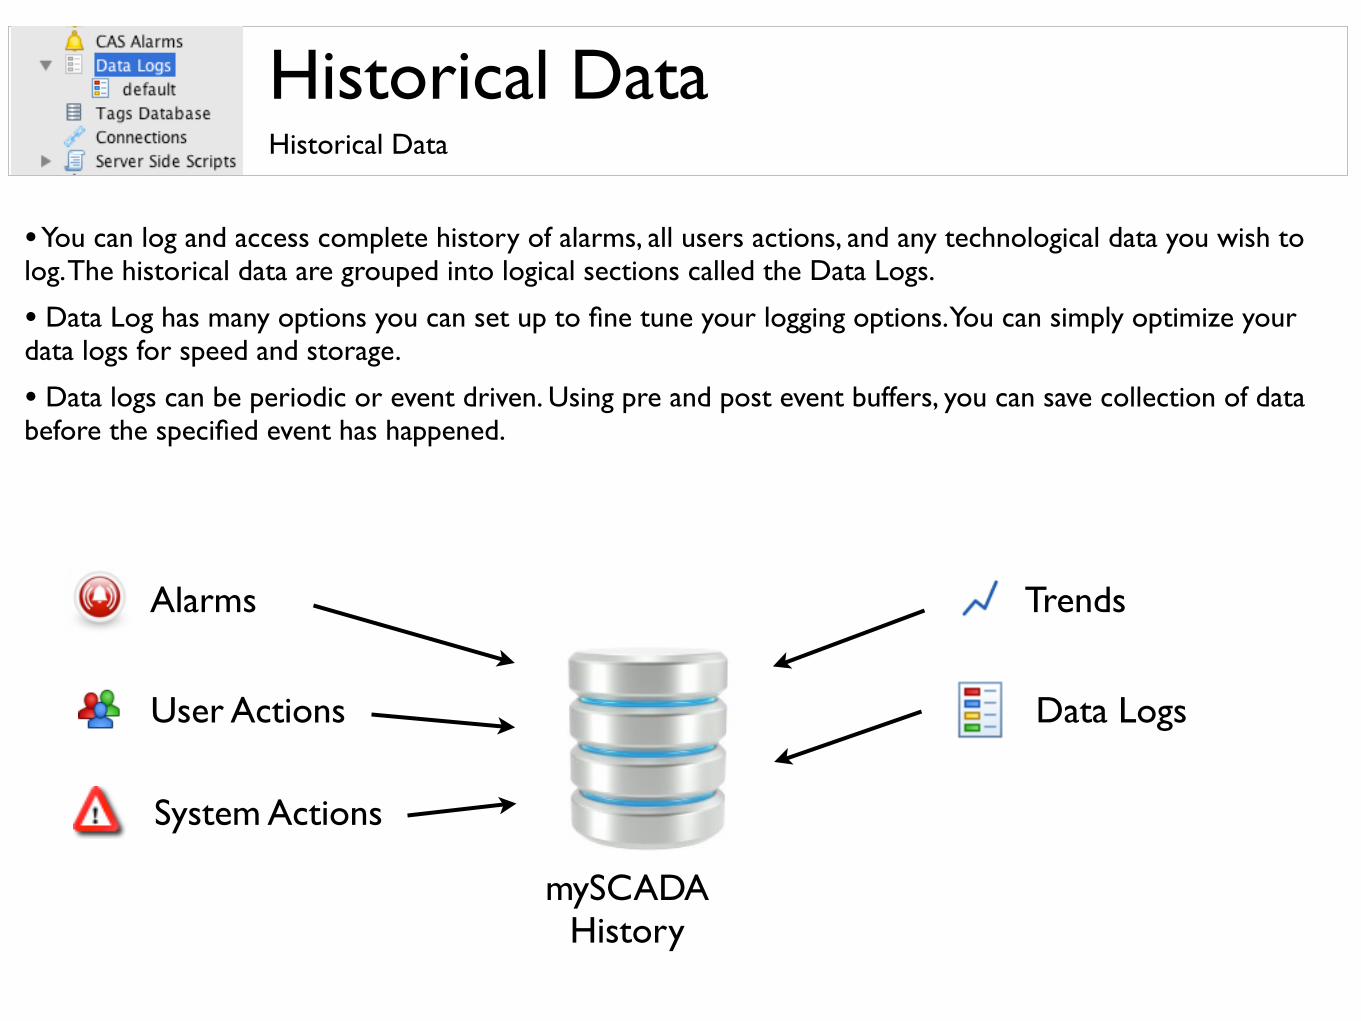
• You can log and access complete history of alarms, all users actions, and any technological data you wish to log. The historical data are grouped into logical sections called the Data Logs.
• Data Log has many options you can set up to fine tune your logging options. You can simply optimize your data logs for speed and storage.
• Data logs can be periodic or event driven. Using pre and post event buffers, you can save collection of data before the specified event has happened.
mySCADAHistory
Alarms
User Actions
System Actions
Trends
Data Logs
Data LogsHistorical Data
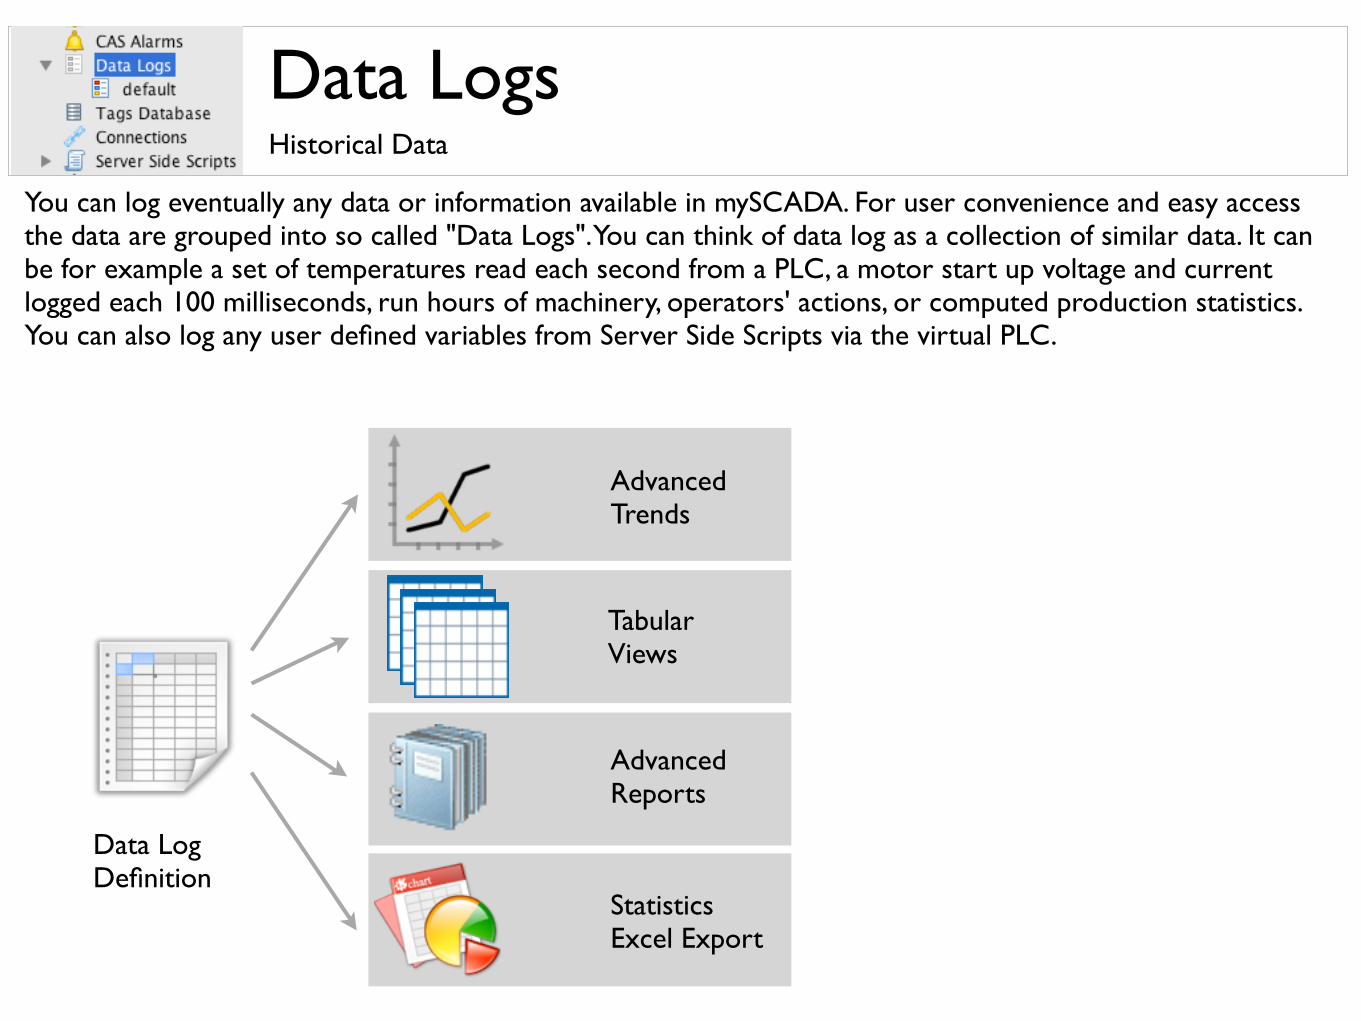
You can log eventually any data or information available in mySCADA. For user convenience and easy access the data are grouped into so called "Data Logs". You can think of data log as a collection of similar data. It can be for example a set of temperatures read each second from a PLC, a motor start up voltage and current logged each 100 milliseconds, run hours of machinery, operators' actions, or computed production statistics. You can also log any user defined variables from Server Side Scripts via the virtual PLC.
Data Log Definition
Advanced Trends
Tabular Views
AdvancedReports
StatisticsExcel Export
Data LogsHistorical Data
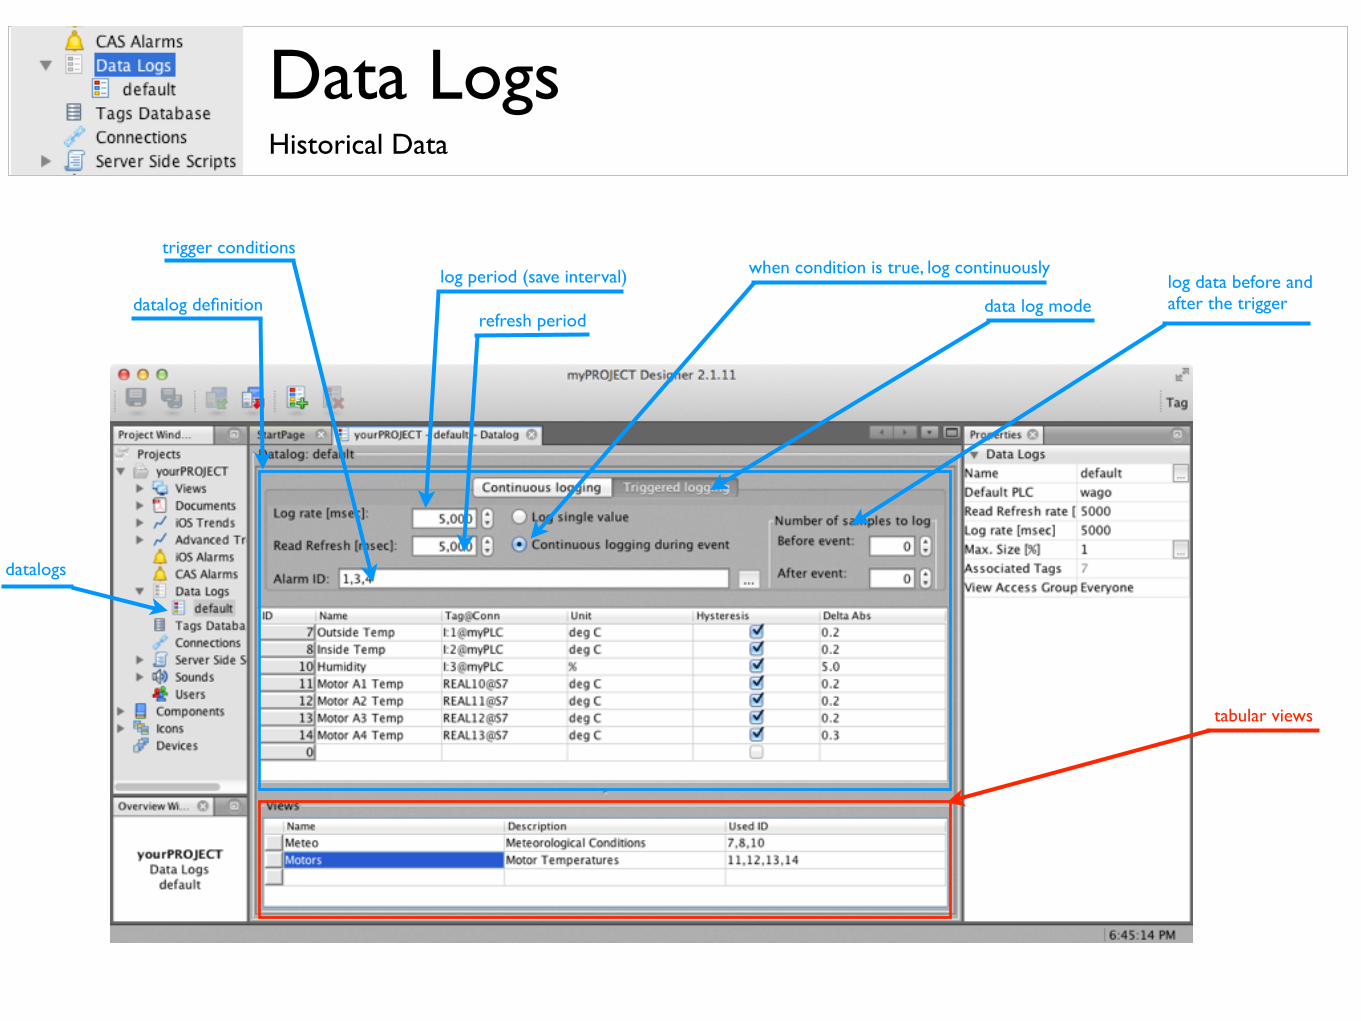
datalogs
datalog definition data log moderefresh period
log period (save interval) when condition is true, log continuously
tabular views
trigger conditions
log data before and after the trigger
Data LogsHistorical Data
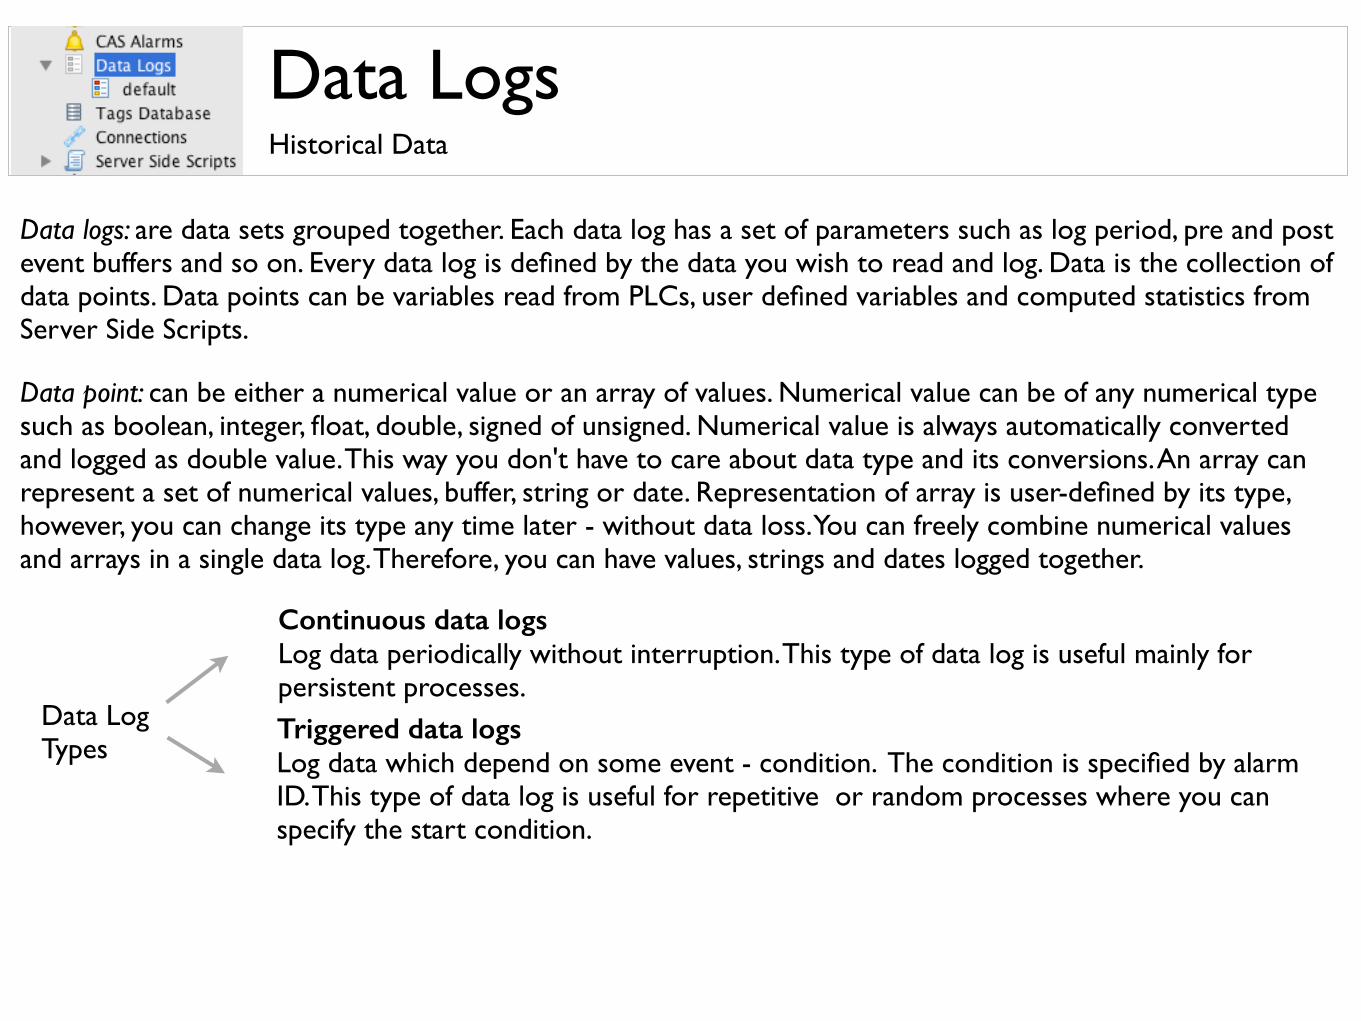
Data logs: are data sets grouped together. Each data log has a set of parameters such as log period, pre and post event buffers and so on. Every data log is defined by the data you wish to read and log. Data is the collection of data points. Data points can be variables read from PLCs, user defined variables and computed statistics from Server Side Scripts.
Data point: can be either a numerical value or an array of values. Numerical value can be of any numerical type such as boolean, integer, float, double, signed of unsigned. Numerical value is always automatically converted and logged as double value. This way you don't have to care about data type and its conversions. An array can represent a set of numerical values, buffer, string or date. Representation of array is user-defined by its type, however, you can change its type any time later - without data loss. You can freely combine numerical values and arrays in a single data log. Therefore, you can have values, strings and dates logged together.
Continuous data logs Log data periodically without interruption. This type of data log is useful mainly for persistent processes.Triggered data logs Log data which depend on some event - condition. The condition is specified by alarm ID. This type of data log is useful for repetitive or random processes where you can specify the start condition.
Data LogTypes
Data Logs - ContinuousHistorical Data
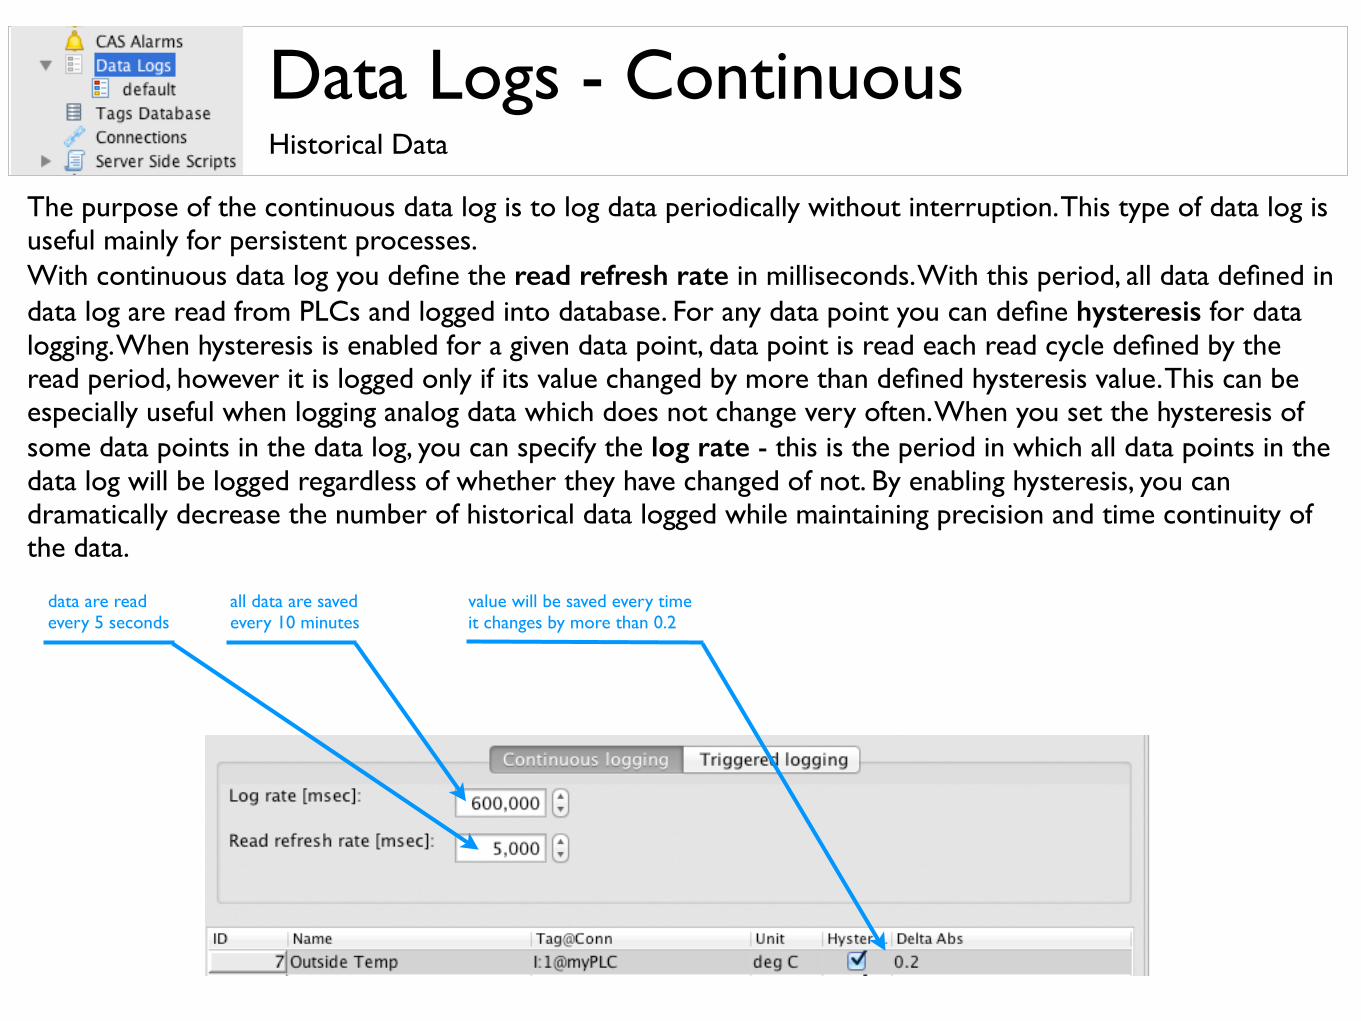
The purpose of the continuous data log is to log data periodically without interruption. This type of data log is useful mainly for persistent processes. With continuous data log you define the read refresh rate in milliseconds. With this period, all data defined in data log are read from PLCs and logged into database. For any data point you can define hysteresis for data logging. When hysteresis is enabled for a given data point, data point is read each read cycle defined by the read period, however it is logged only if its value changed by more than defined hysteresis value. This can be especially useful when logging analog data which does not change very often. When you set the hysteresis of some data points in the data log, you can specify the log rate - this is the period in which all data points in the data log will be logged regardless of whether they have changed of not. By enabling hysteresis, you can dramatically decrease the number of historical data logged while maintaining precision and time continuity of the data.
data are readevery 5 seconds
all data are savedevery 10 minutes
value will be saved every time it changes by more than 0.2
Data Logs - TriggeredHistorical Data
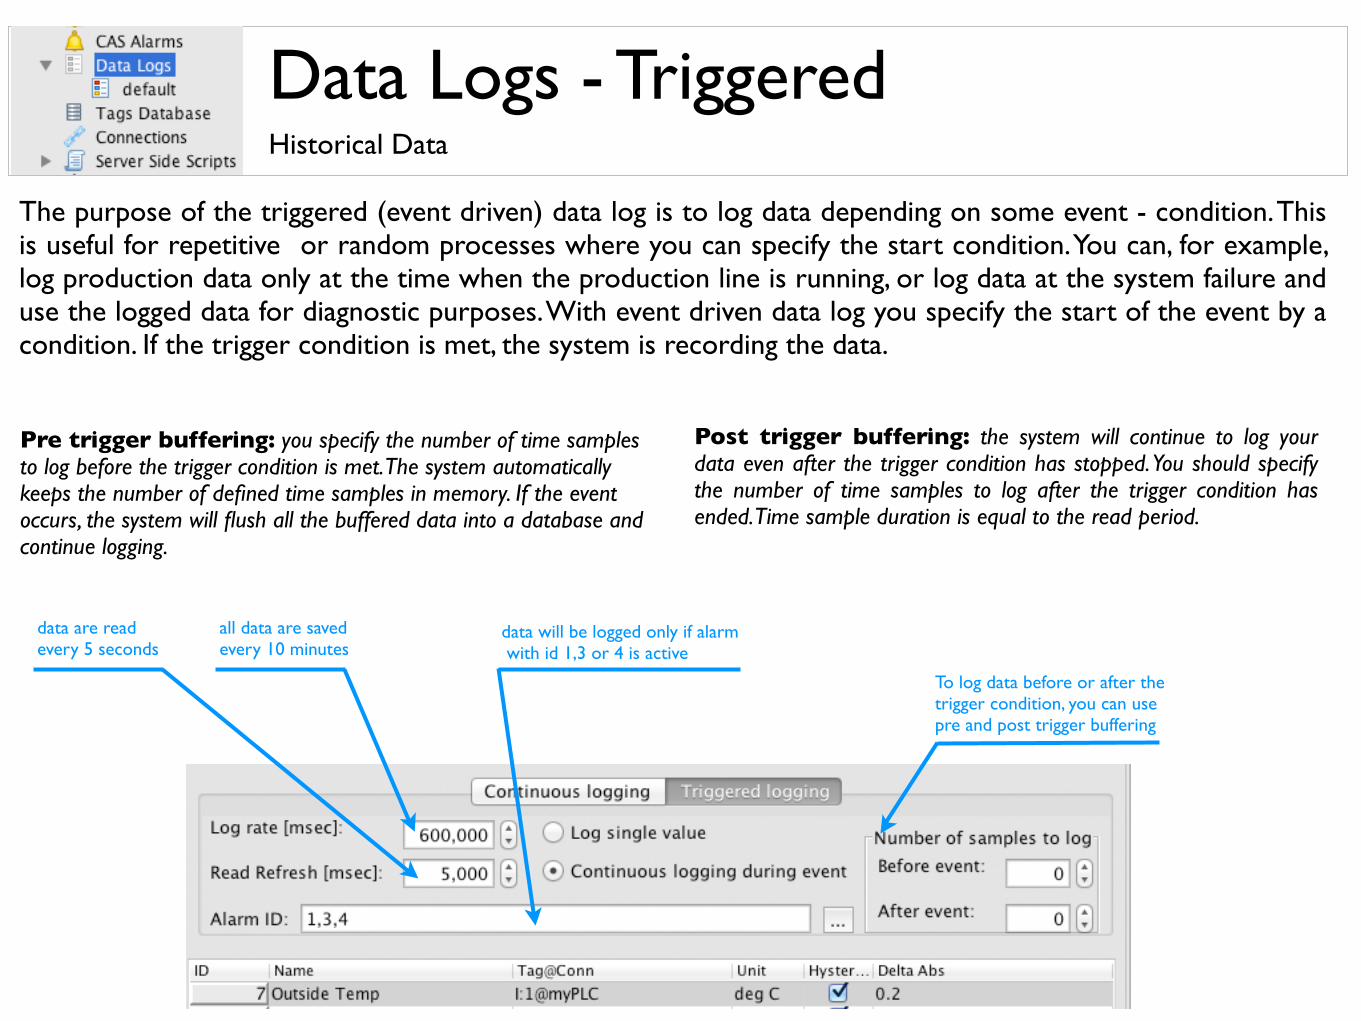
The purpose of the triggered (event driven) data log is to log data depending on some event - condition. This is useful for repetitive or random processes where you can specify the start condition. You can, for example, log production data only at the time when the production line is running, or log data at the system failure and use the logged data for diagnostic purposes. With event driven data log you specify the start of the event by a condition. If the trigger condition is met, the system is recording the data.
To log data before or after the trigger condition, you can use pre and post trigger buffering
data are readevery 5 seconds
all data are savedevery 10 minutes
data will be logged only if alarm with id 1,3 or 4 is active
Pre trigger buffering: you specify the number of time samples to log before the trigger condition is met. The system automatically keeps the number of defined time samples in memory. If the event occurs, the system will flush all the buffered data into a database and continue logging.
Post trigger buffering: the system will continue to log your data even after the trigger condition has stopped. You should specify the number of time samples to log after the trigger condition has ended. Time sample duration is equal to the read period.
Data Logs - Tabular ViewsHistorical Data
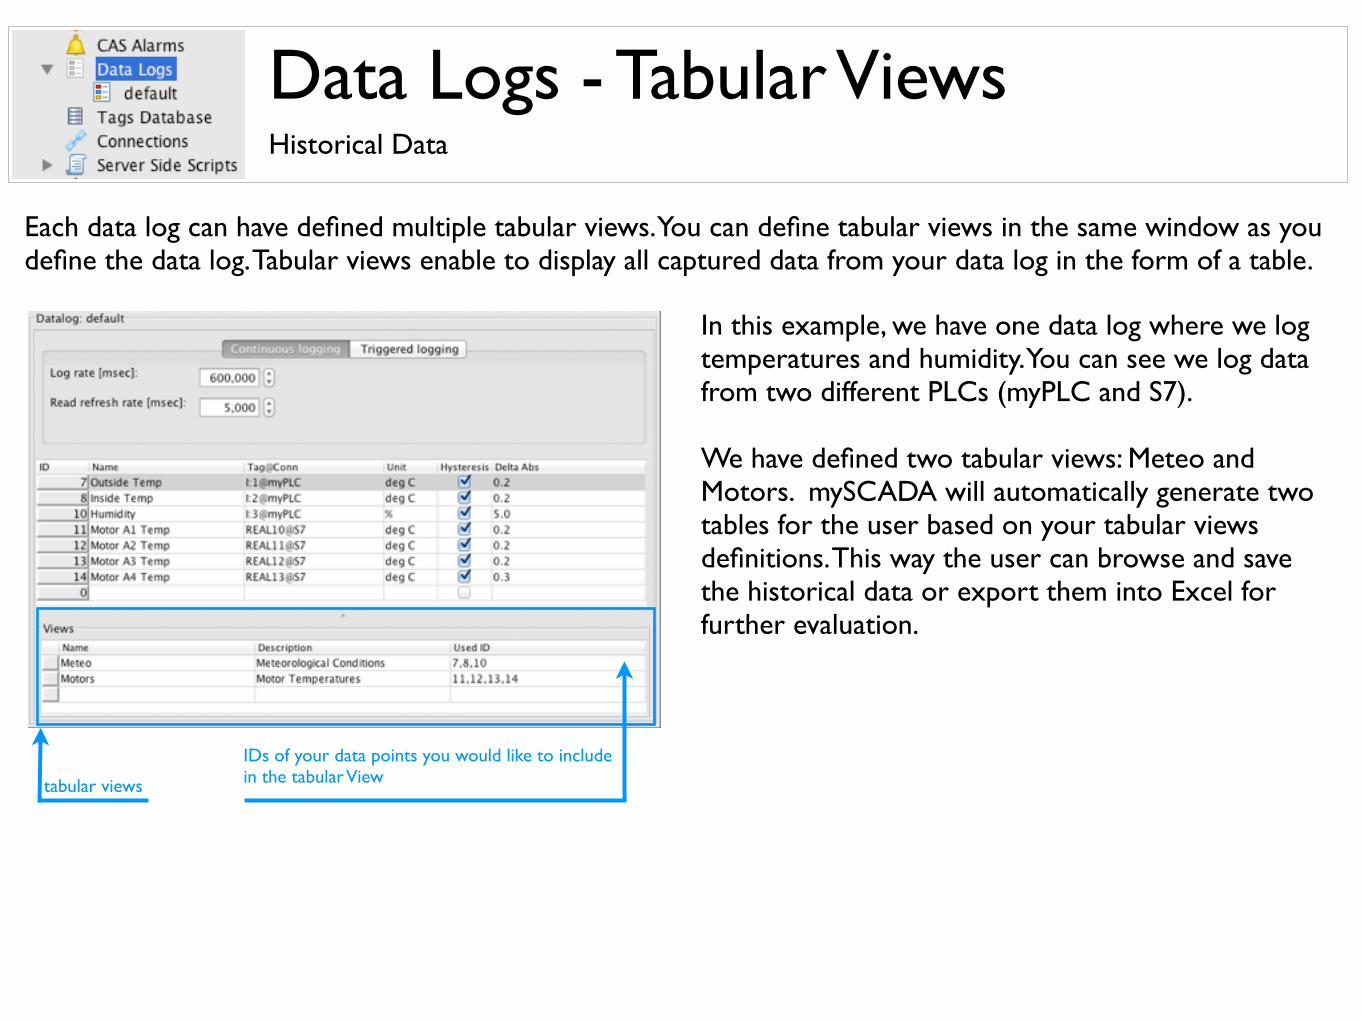
Each data log can have defined multiple tabular views. You can define tabular views in the same window as you define the data log. Tabular views enable to display all captured data from your data log in the form of a table.
tabular views
IDs of your data points you would like to includein the tabular View
In this example, we have one data log where we log temperatures and humidity. You can see we log data from two different PLCs (myPLC and S7).
We have defined two tabular views: Meteo and Motors. mySCADA will automatically generate two tables for the user based on your tabular views definitions. This way the user can browse and save the historical data or export them into Excel for further evaluation.
Advanced TrendsHistorical Trends
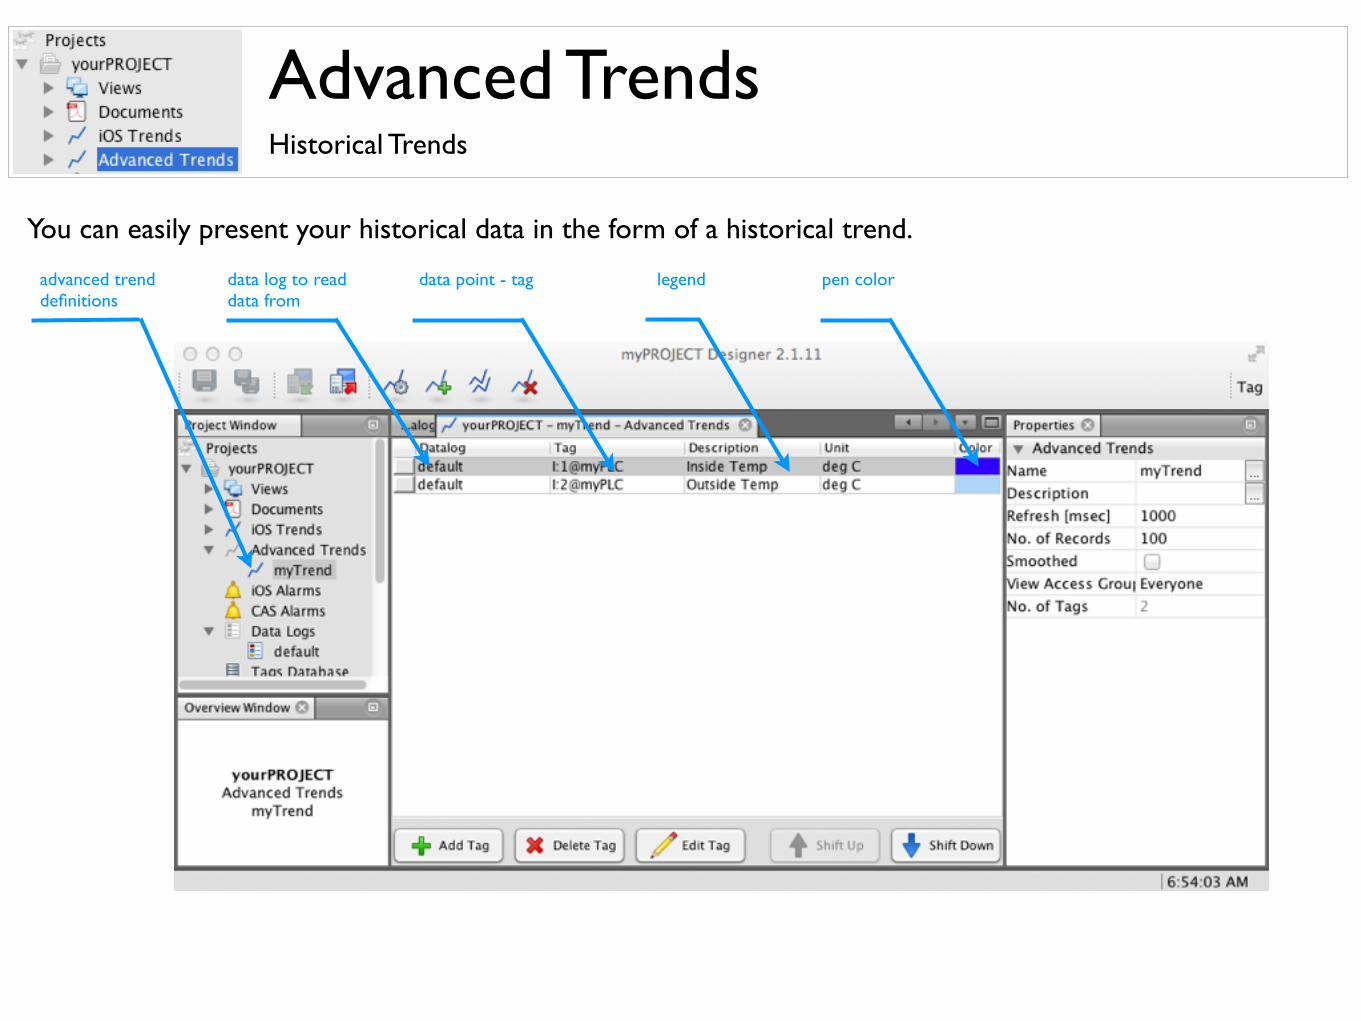
You can easily present your historical data in the form of a historical trend.
advanced trend definitions
data log to read data from
data point - tag legend pen color
Tags DatabaseManage your tags easily
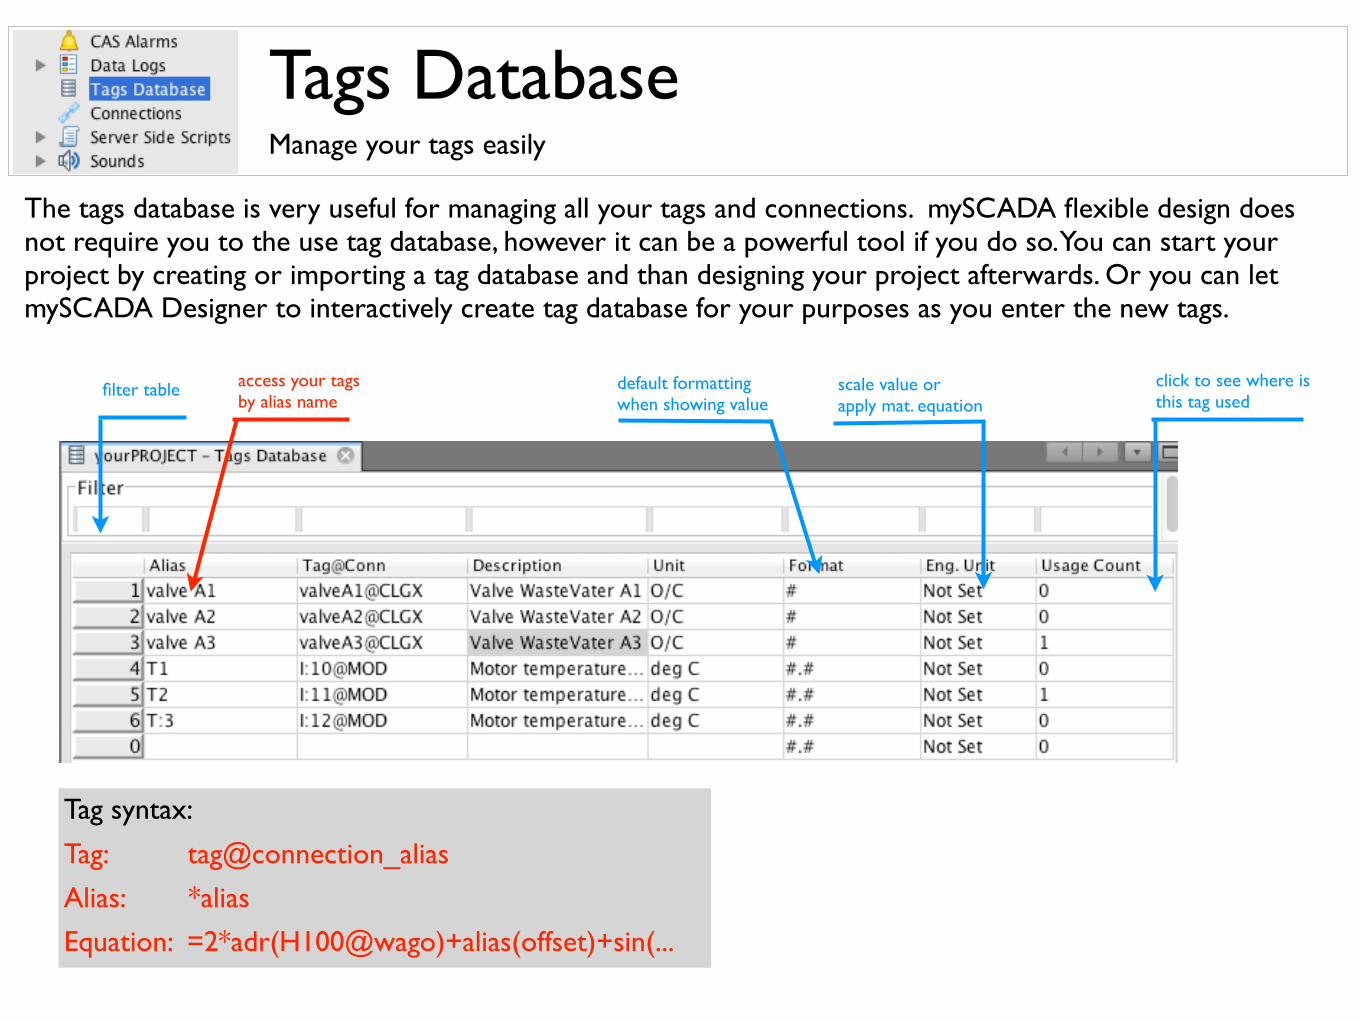
The tags database is very useful for managing all your tags and connections. mySCADA flexible design does not require you to the use tag database, however it can be a powerful tool if you do so. You can start your project by creating or importing a tag database and than designing your project afterwards. Or you can let mySCADA Designer to interactively create tag database for your purposes as you enter the new tags.
filter table scale value orapply mat. equation
click to see where isthis tag used
default formattingwhen showing value
access your tags by alias name
Tag: tag@connection_alias
Alias: *alias
Equation: =2*adr(H100@wago)+alias(offset)+sin(...
Tag syntax:
User AccessProtect Your System
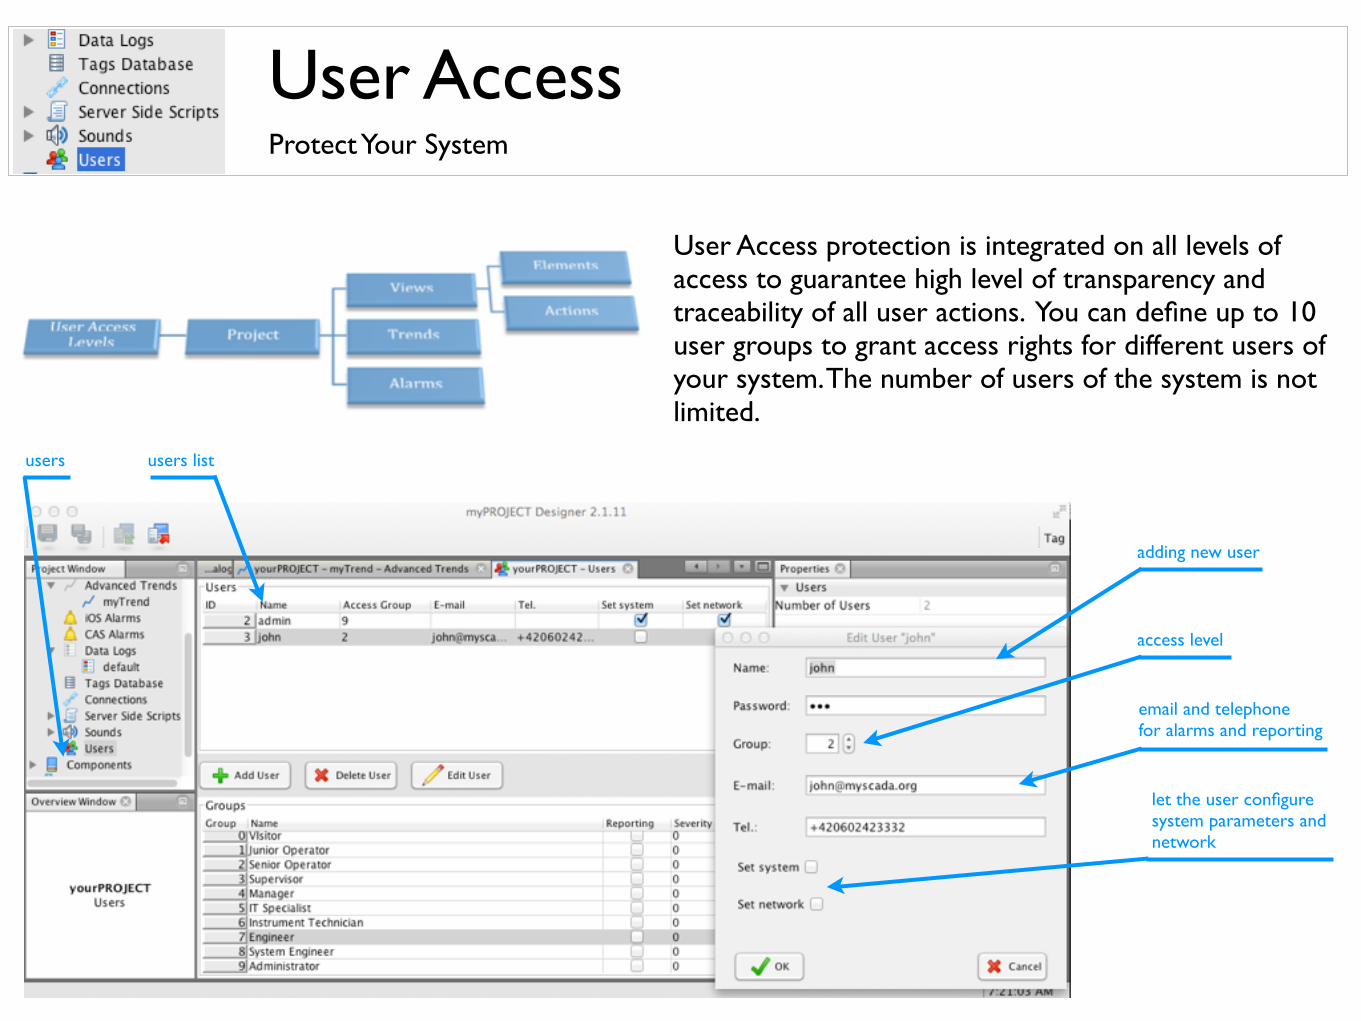
User Access protection is integrated on all levels of access to guarantee high level of transparency and traceability of all user actions. You can define up to 10 user groups to grant access rights for different users of your system. The number of users of the system is not limited.
users users list
adding new user
access level
email and telephonefor alarms and reporting
let the user configure system parameters and network
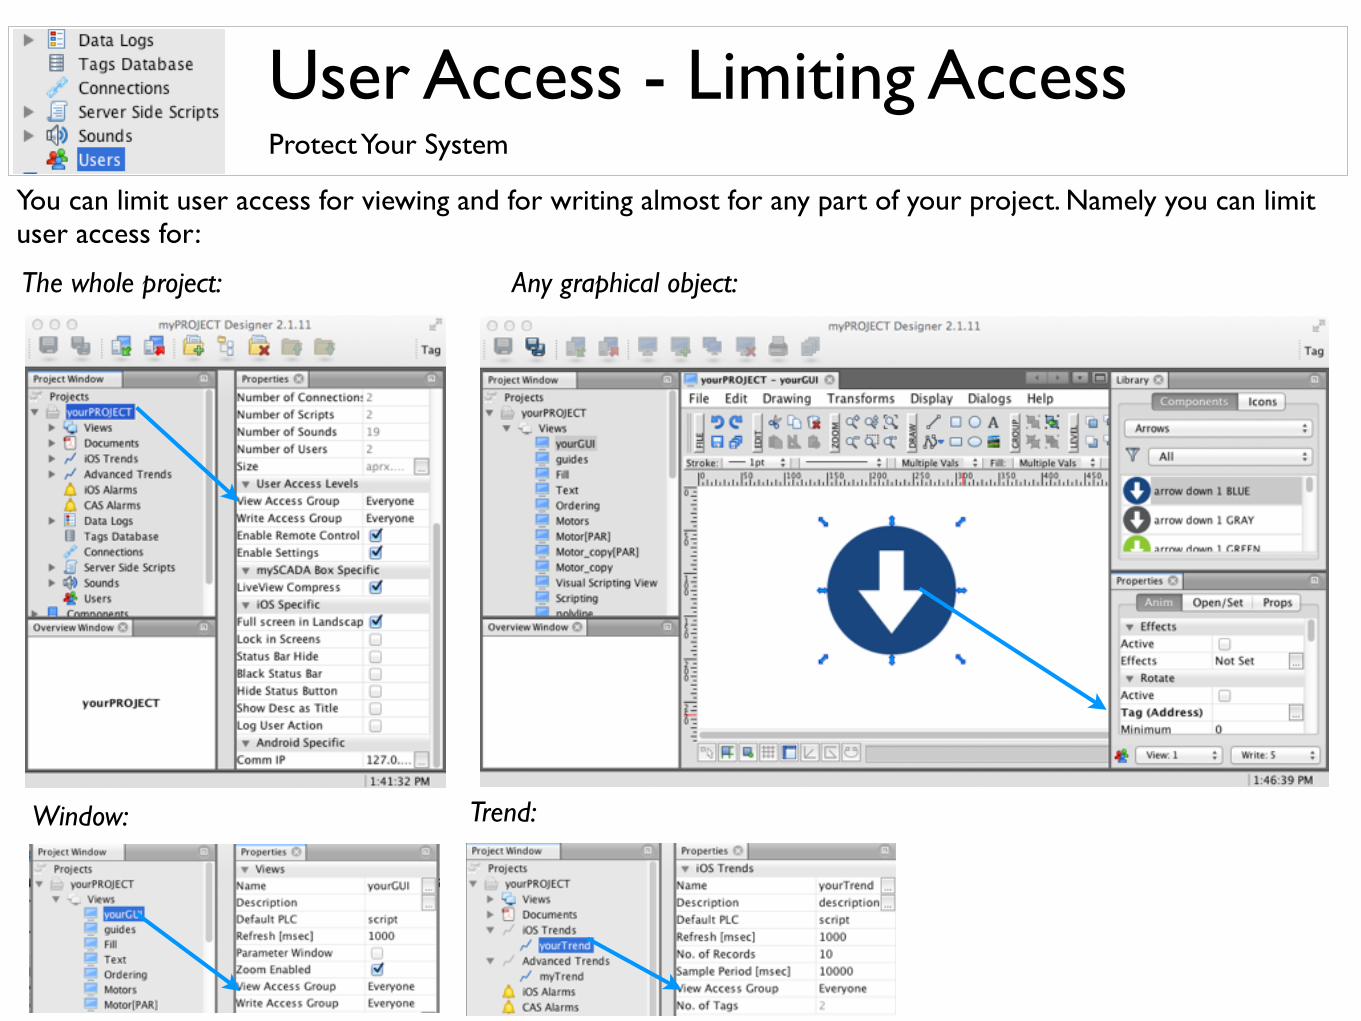
User Access - Limiting AccessProtect Your System
You can limit user access for viewing and for writing almost for any part of your project. Namely you can limit user access for:
The whole project:
Window:
Any graphical object:
Trend:
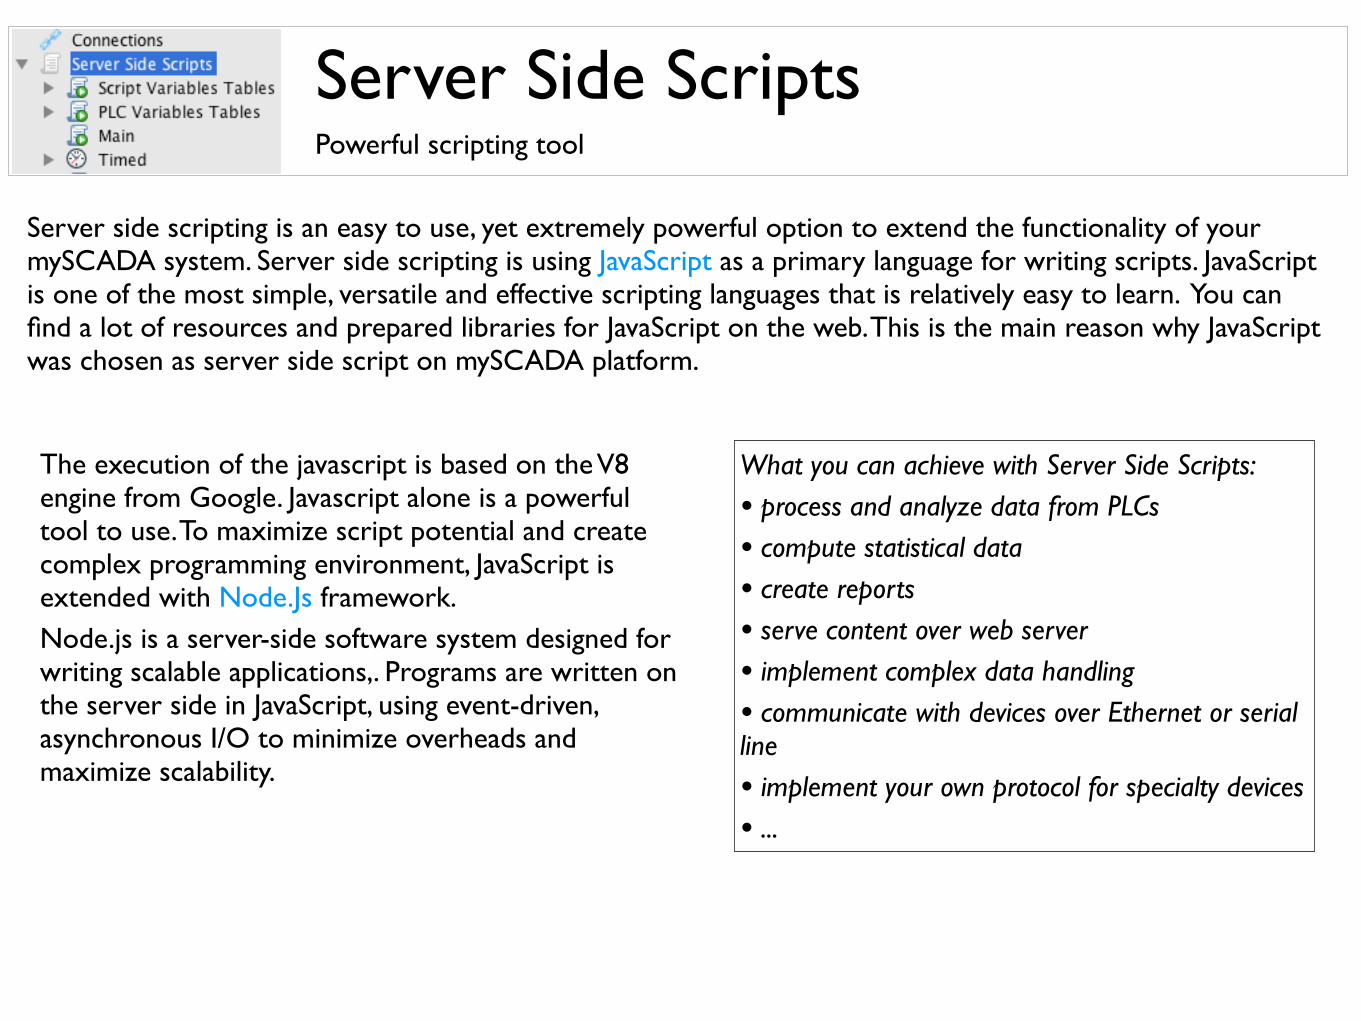
Server Side ScriptsPowerful scripting tool
Server side scripting is an easy to use, yet extremely powerful option to extend the functionality of your mySCADA system. Server side scripting is using JavaScript as a primary language for writing scripts. JavaScript is one of the most simple, versatile and effective scripting languages that is relatively easy to learn. You can find a lot of resources and prepared libraries for JavaScript on the web. This is the main reason why JavaScript was chosen as server side script on mySCADA platform.
What you can achieve with Server Side Scripts:
• process and analyze data from PLCs
• compute statistical data
• create reports
• serve content over web server
• implement complex data handling
• communicate with devices over Ethernet or serial line
• implement your own protocol for specialty devices
• ...
The execution of the javascript is based on the V8 engine from Google. Javascript alone is a powerful tool to use. To maximize script potential and create complex programming environment, JavaScript is extended with Node.Js framework. Node.js is a server-side software system designed for writing scalable applications,. Programs are written on the server side in JavaScript, using event-driven, asynchronous I/O to minimize overheads and maximize scalability.
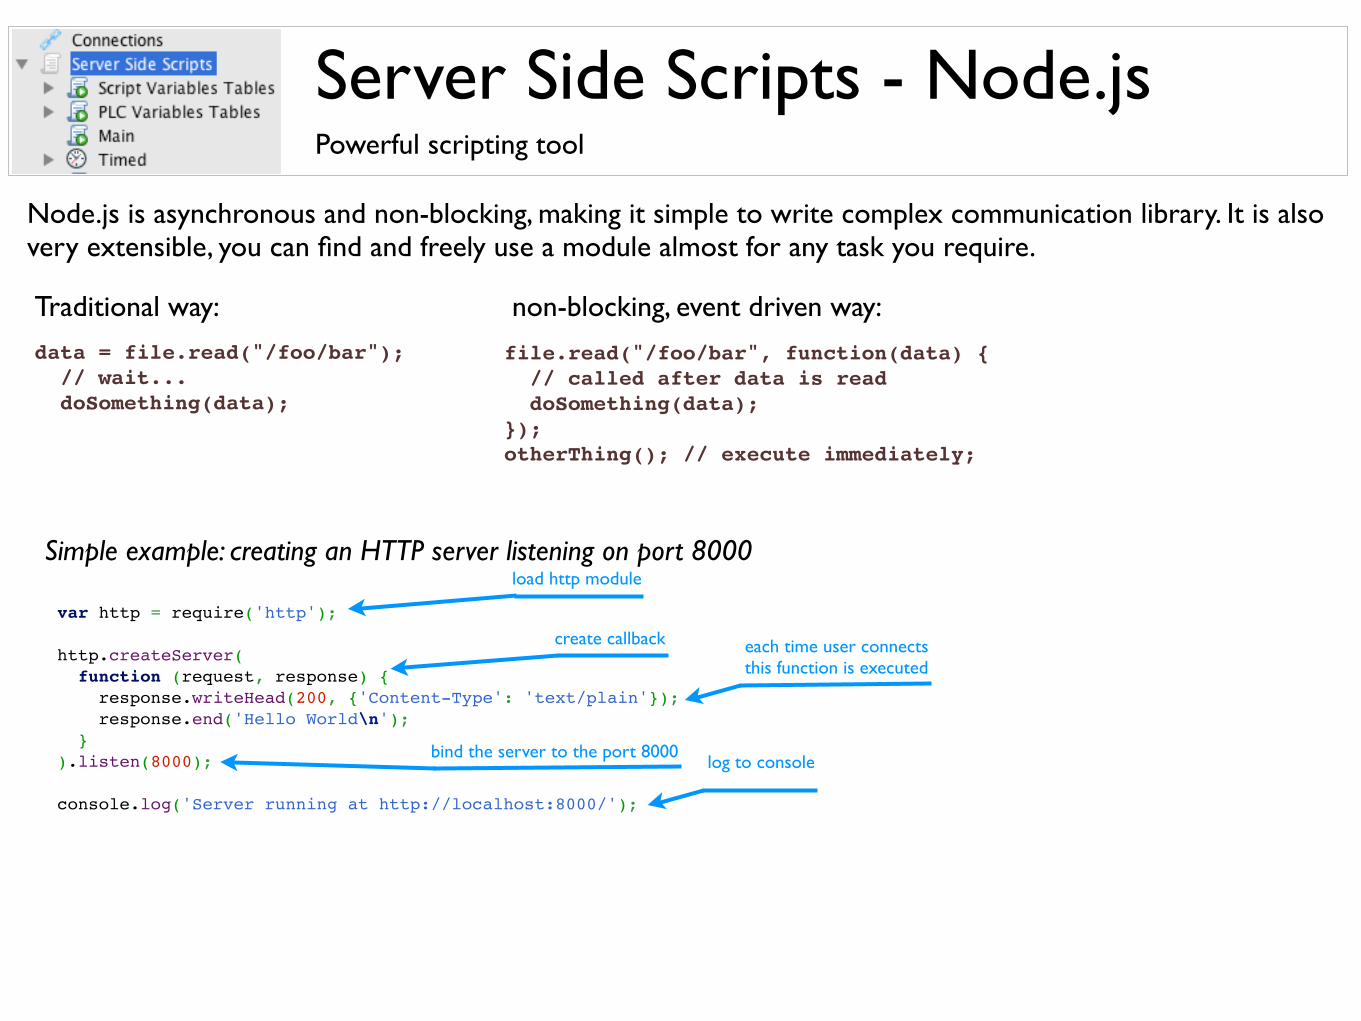
Server Side Scripts - Node.jsPowerful scripting tool
Node.js is asynchronous and non-blocking, making it simple to write complex communication library. It is also very extensible, you can find and freely use a module almost for any task you require.
file.read("/foo/bar", function(data) { // called after data is read doSomething(data);});otherThing(); // execute immediately;
data = file.read("/foo/bar"); // wait... doSomething(data);
Traditional way: non-blocking, event driven way:
var http = require('http'); http.createServer( function (request, response) { response.writeHead(200, {'Content-Type': 'text/plain'}); response.end('Hello World\n'); }).listen(8000); console.log('Server running at http://localhost:8000/');
Simple example: creating an HTTP server listening on port 8000load http module
create callback each time user connectsthis function is executed
bind the server to the port 8000 log to console
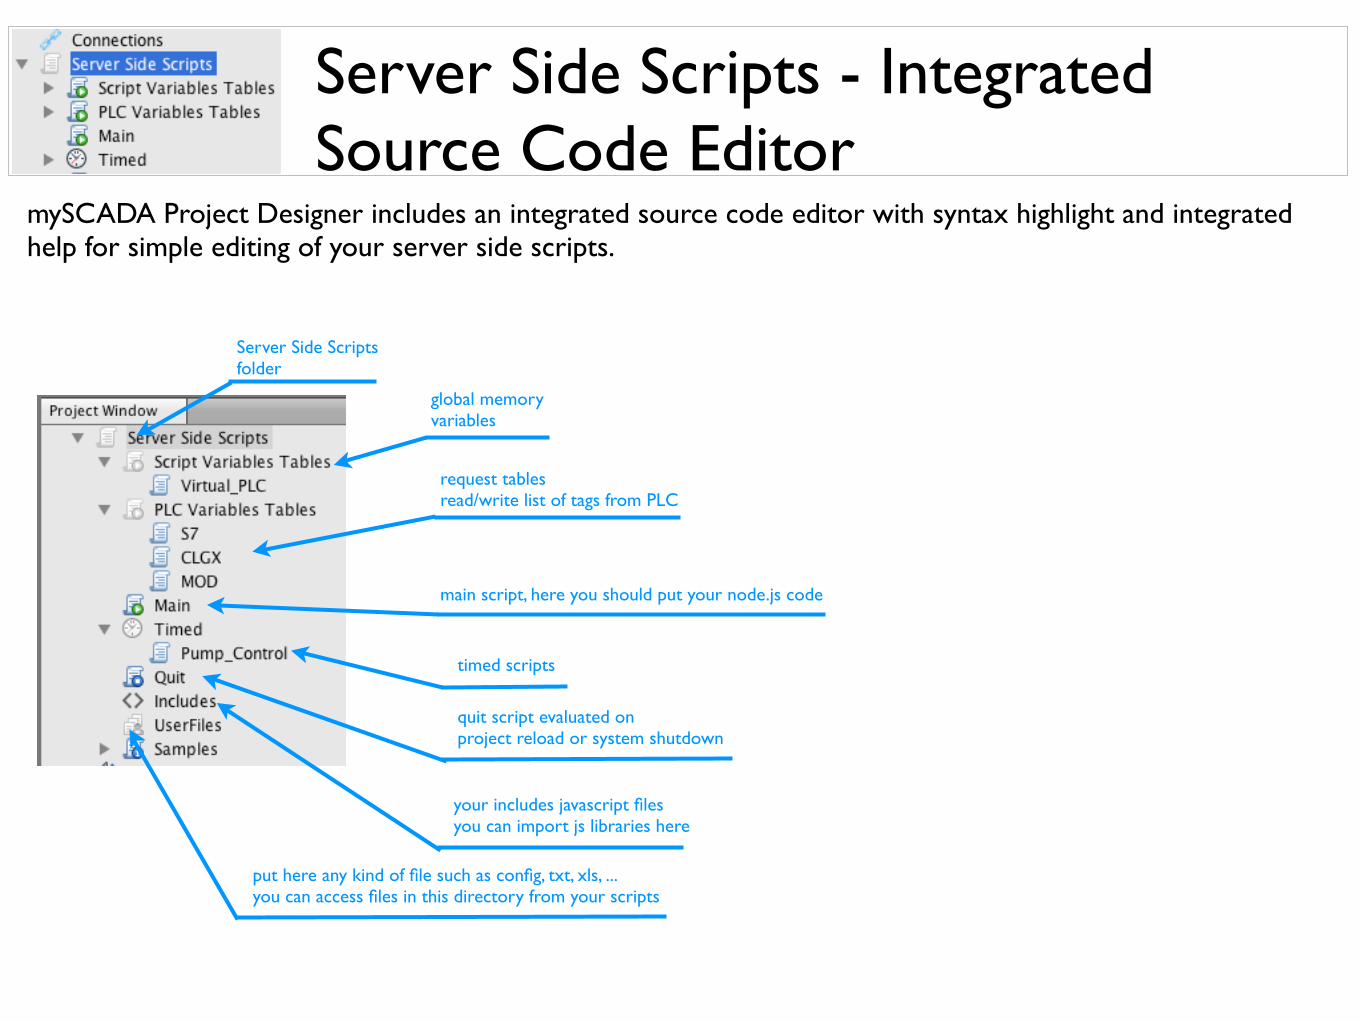
Server Side Scripts - Integrated Source Code Editor
global memoryvariables
request tablesread/write list of tags from PLC
main script, here you should put your node.js code
timed scripts
quit script evaluated onproject reload or system shutdown
your includes javascript filesyou can import js libraries here
put here any kind of file such as config, txt, xls, ...you can access files in this directory from your scripts
Server Side Scriptsfolder
mySCADA Project Designer includes an integrated source code editor with syntax highlight and integrated help for simple editing of your server side scripts.
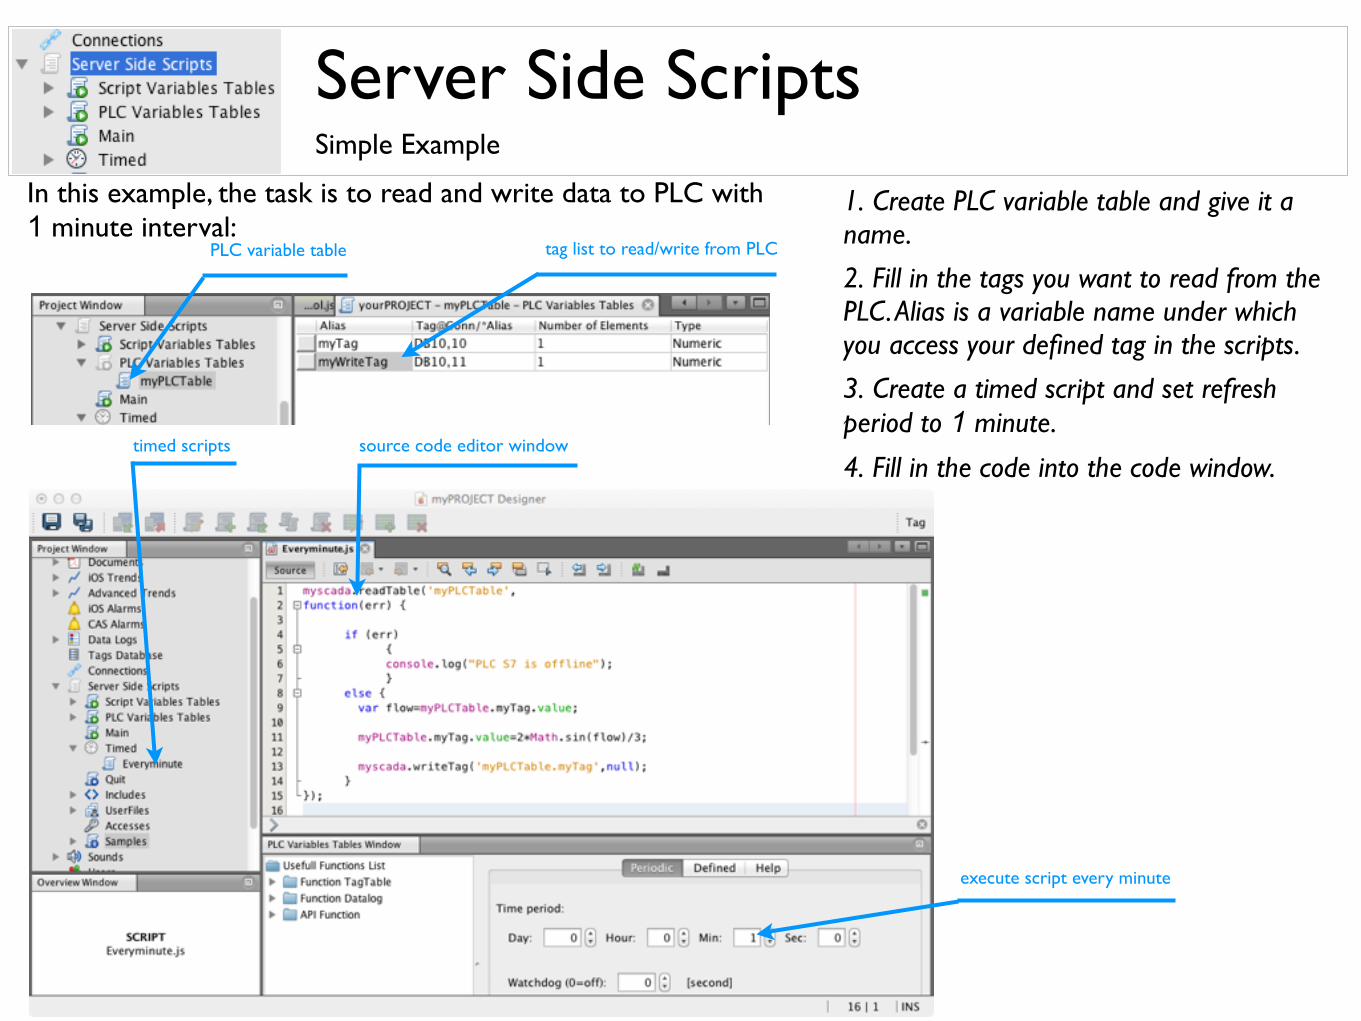
Server Side ScriptsSimple Example
In this example, the task is to read and write data to PLC with 1 minute interval:
PLC variable table tag list to read/write from PLC
timed scripts source code editor window
execute script every minute
1. Create PLC variable table and give it a name.
2. Fill in the tags you want to read from the PLC. Alias is a variable name under which you access your defined tag in the scripts.
3. Create a timed script and set refresh period to 1 minute.
4. Fill in the code into the code window.
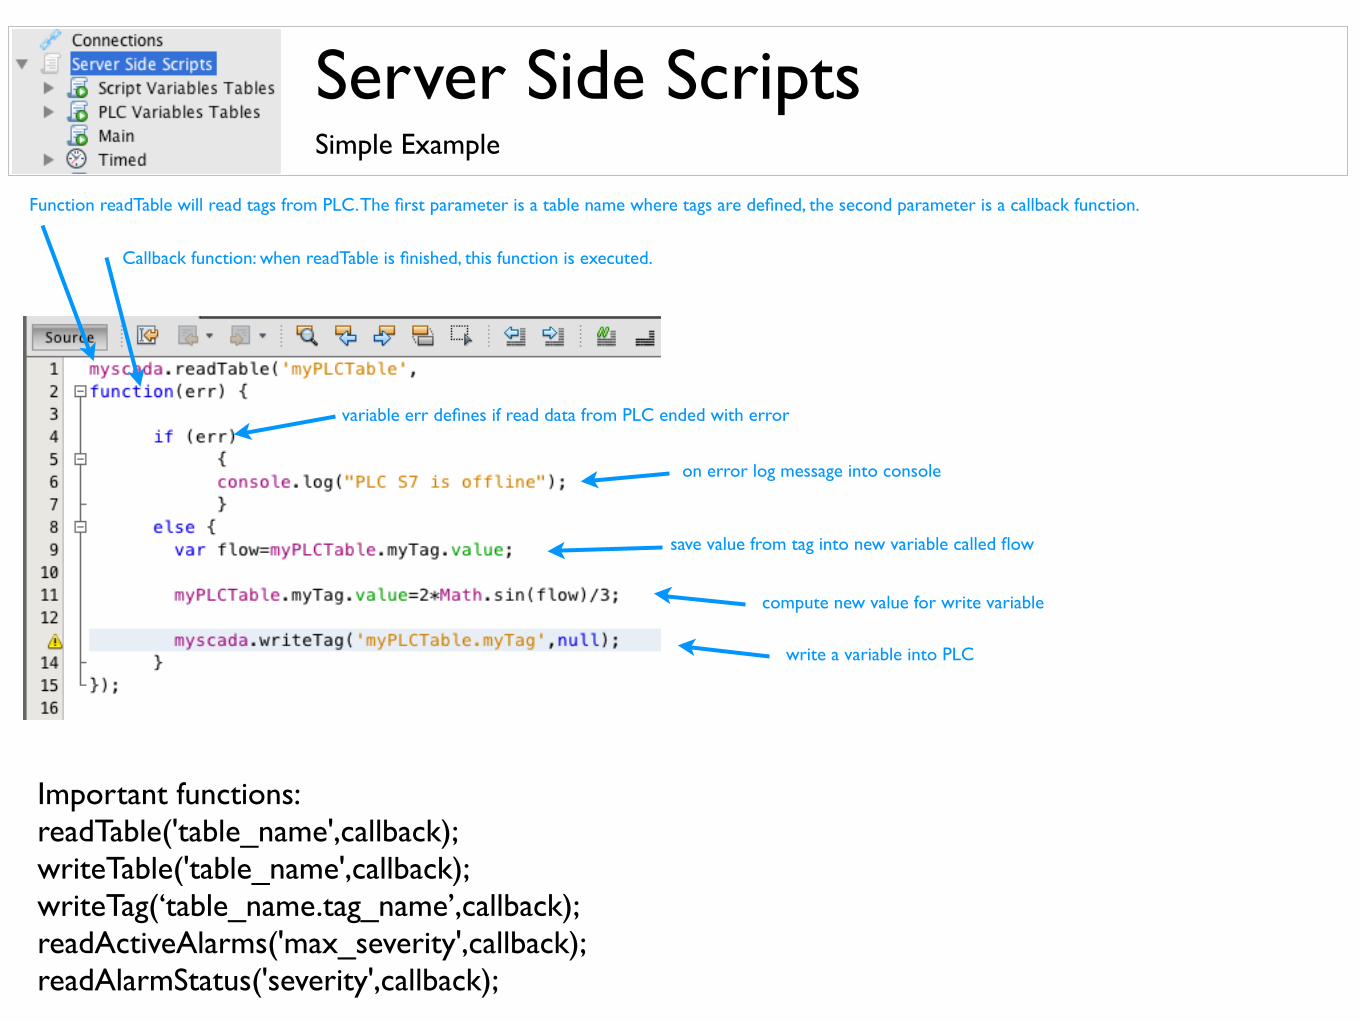
Server Side ScriptsSimple Example
Function readTable will read tags from PLC. The first parameter is a table name where tags are defined, the second parameter is a callback function.
Callback function: when readTable is finished, this function is executed.
variable err defines if read data from PLC ended with error
on error log message into console
save value from tag into new variable called flow
compute new value for write variable
write a variable into PLC
Important functions:readTable('table_name',callback);writeTable('table_name',callback);writeTag(‘table_name.tag_name’,callback);readActiveAlarms('max_severity',callback);readAlarmStatus('severity',callback);
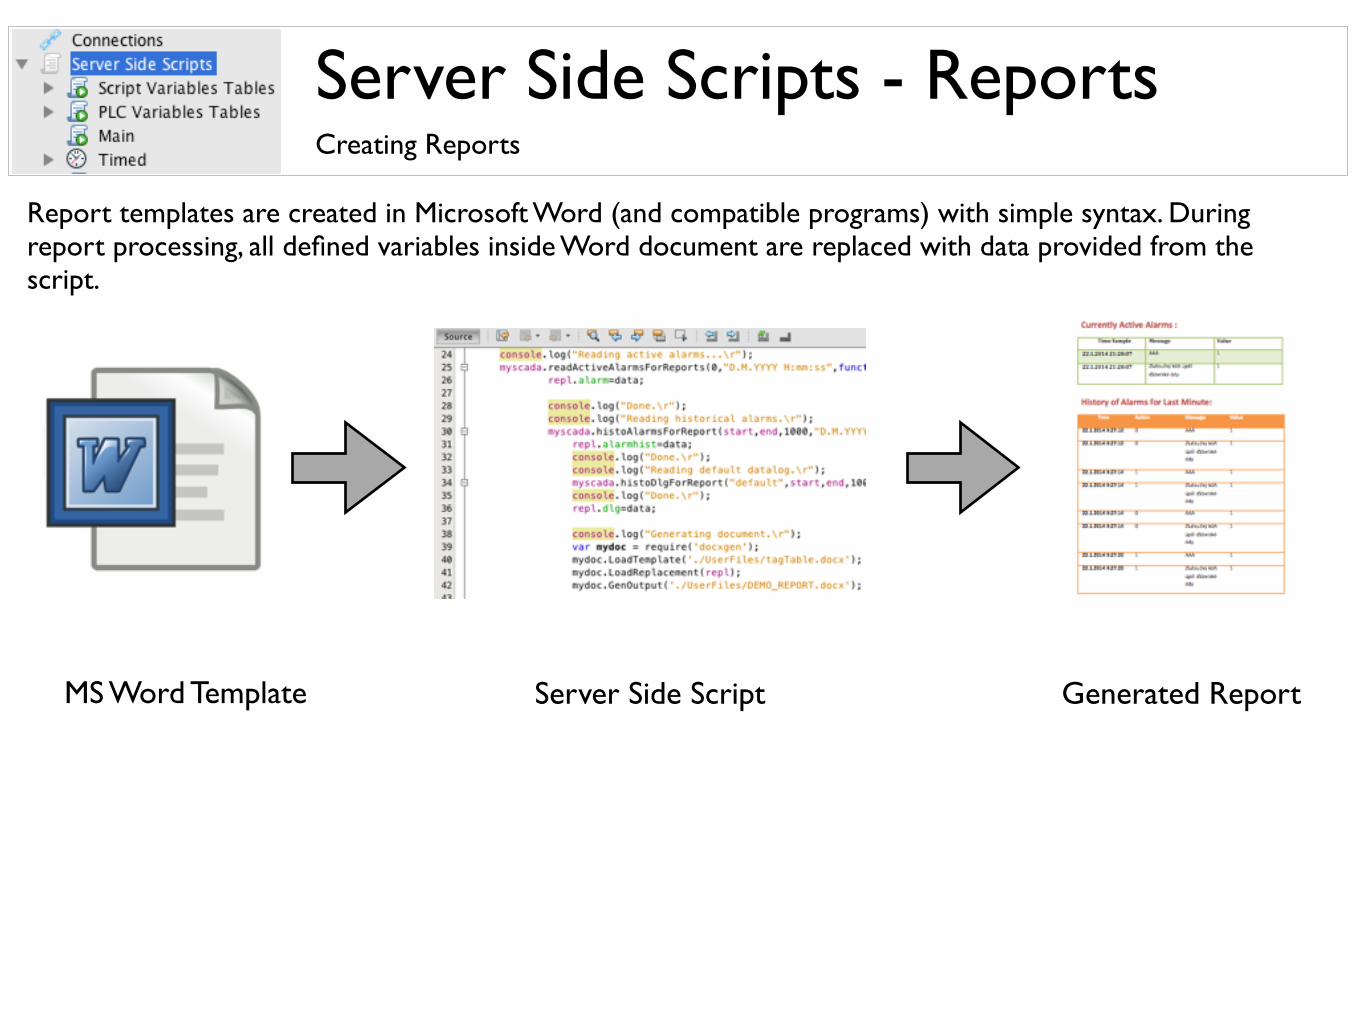
Server Side Scripts - ReportsCreating Reports
Report templates are created in Microsoft Word (and compatible programs) with simple syntax. During report processing, all defined variables inside Word document are replaced with data provided from the script.
MS Word Template Server Side Script Generated Report
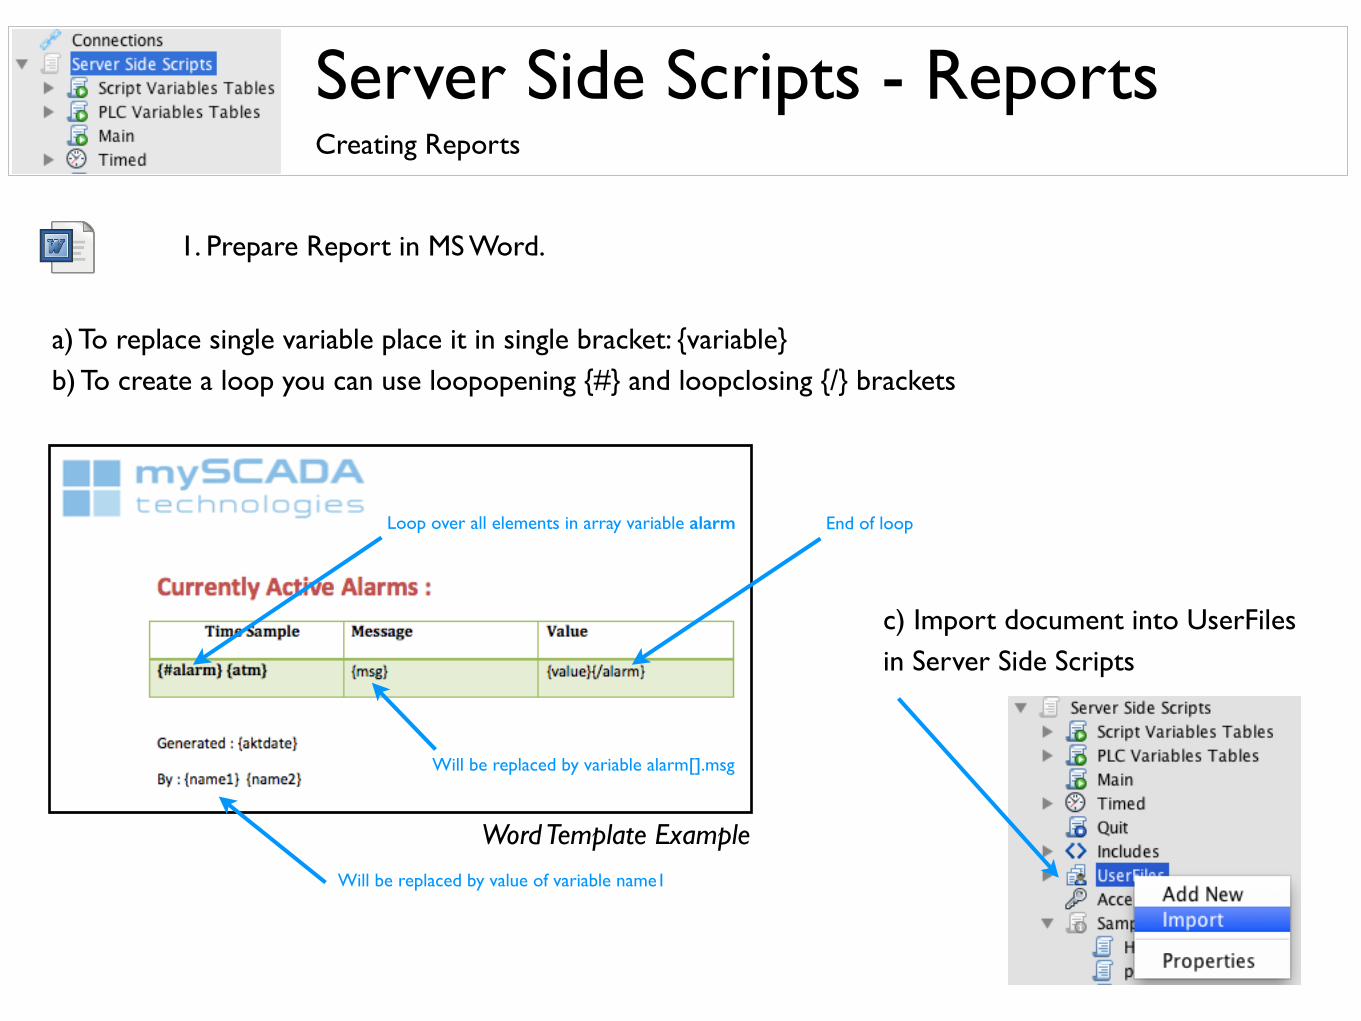
Server Side Scripts - ReportsCreating Reports
1. Prepare Report in MS Word.
a) To replace single variable place it in single bracket: {variable}b) To create a loop you can use loopopening {#} and loopclosing {/} brackets
Will be replaced by value of variable name1
Loop over all elements in array variable alarm End of loop
Will be replaced by variable alarm[].msg
Word Template Example
c) Import document into UserFilesin Server Side Scripts
Server Side Scripts - ReportsCreating Reports
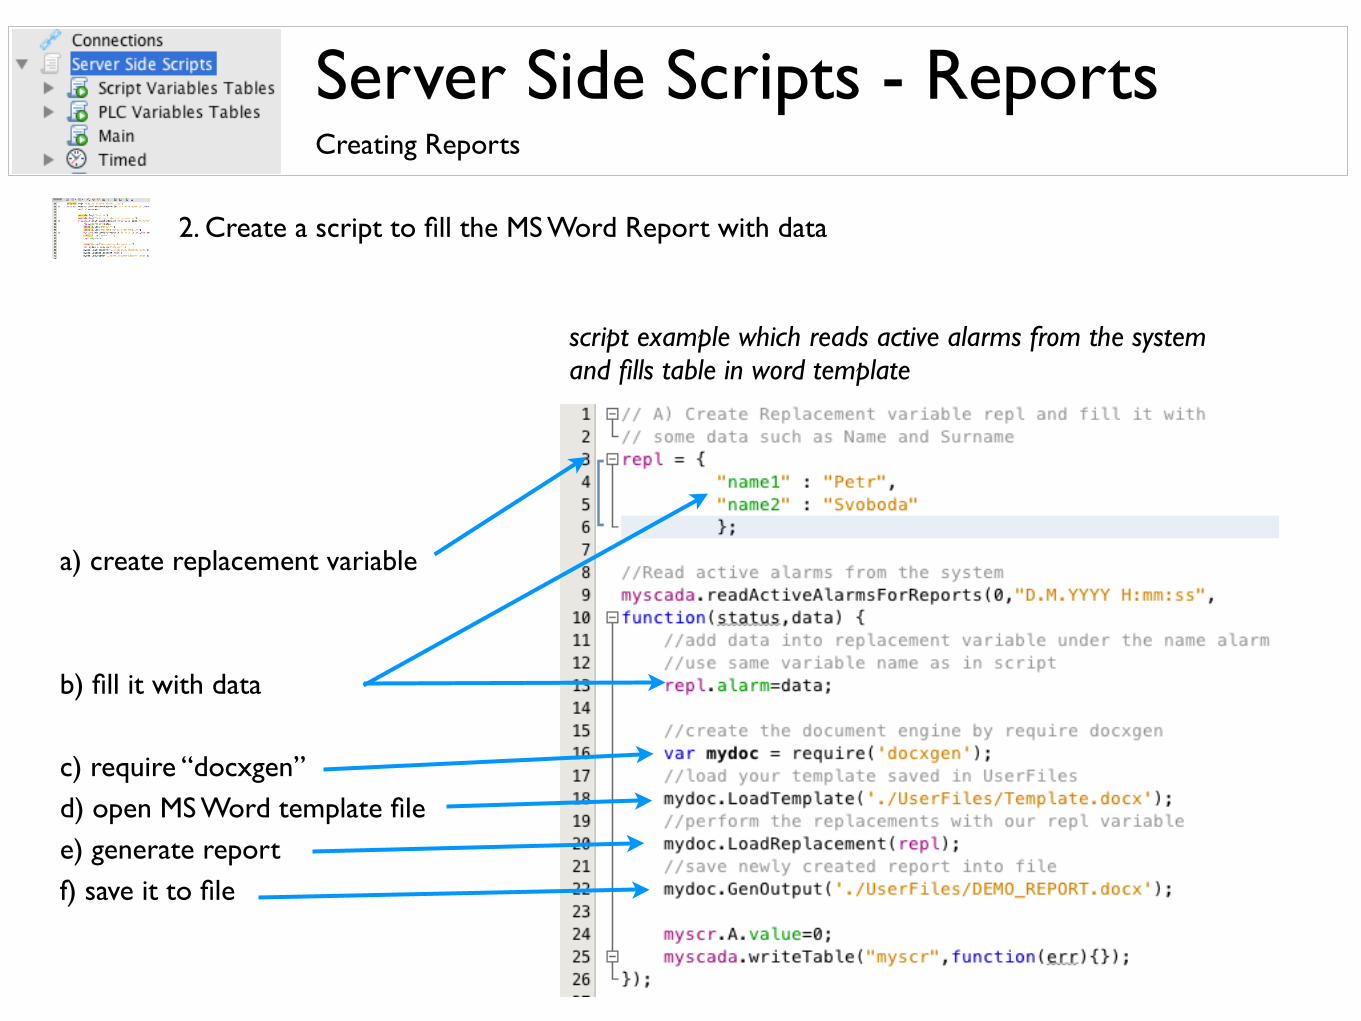
2. Create a script to fill the MS Word Report with data
a) create replacement variable
b) fill it with data
c) require “docxgen”d) open MS Word template filee) generate reportf) save it to file
script example which reads active alarms from the system and fills table in word template
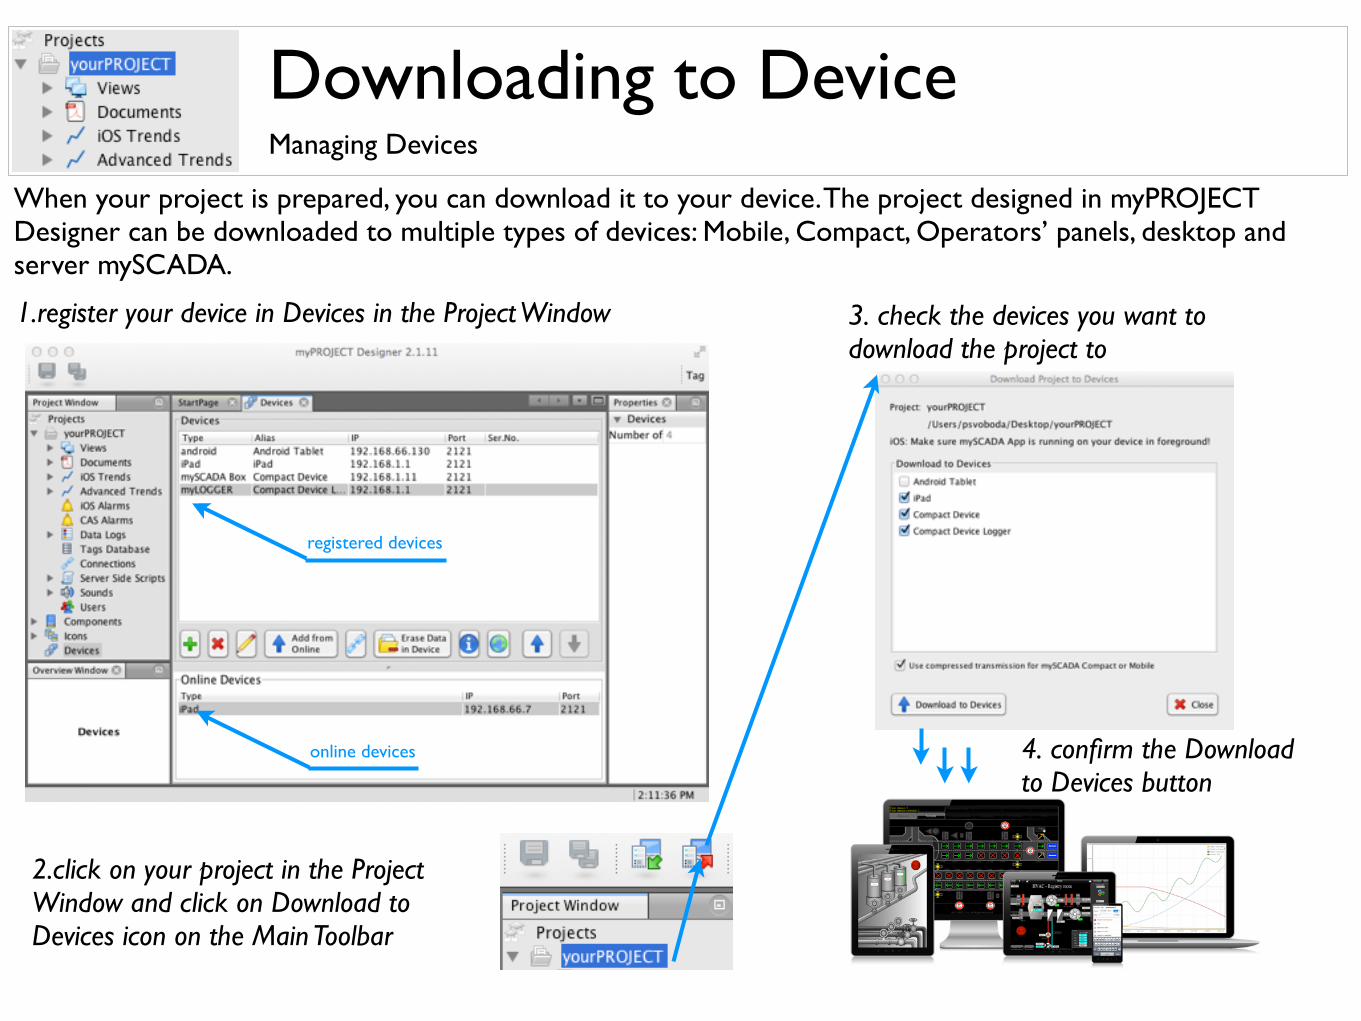
Downloading to DeviceManaging Devices
When your project is prepared, you can download it to your device. The project designed in myPROJECT Designer can be downloaded to multiple types of devices: Mobile, Compact, Operators’ panels, desktop and server mySCADA.
1.register your device in Devices in the Project Window
2.click on your project in the Project Window and click on Download to Devices icon on the Main Toolbar
registered devices
online devices
3. check the devices you want to download the project to
4. confirm the Download to Devices button

Created by mySCADA Technologies s.r.o., Jan. 2014. All rights reserved. www.myscada.org
No part of this document or of the mySCADA Products can be reproduced or transmitted in any form without the written permission of mySCADA Technologies s.r.o. Information in this document is subject to change without notice and is not binding in any way for mySCADA Technologies s.r.o.
PROFESSIONAL INDUSTRIAL SCADA
INNOVATIVE, FAST, PERFECTLY DESIGNED, EXTREMELY POWERFUL... mySCADA
![Skaffold - storage.googleapis.com · [getting-started getting-started] Hello world! [getting-started getting-started] Hello world! [getting-started getting-started] Hello world! 5.](https://static.fdocuments.net/doc/165x107/5ec939f2a76a033f091c5ac7/skaffold-getting-started-getting-started-hello-world-getting-started-getting-started.jpg)