Tuna Fisheries Report – Papua New Guinea COMMITTEE SECOND REGULAR SESSION 7-18 August 2006 Manila,...
25
SCIENTIFIC COMMITTEE SECOND REGULAR SESSION 7-18 August 2006 Manila, Philippines PAPUA NEW GUINEA ANNUAL FISHERY REPORT WCPFC-SC2-2006 Tuna Fisheries Report – Papua New Guinea (Prepared for the 2 nd Science Committee Meeting Manilla, Philippines August, 2006)
Transcript of Tuna Fisheries Report – Papua New Guinea COMMITTEE SECOND REGULAR SESSION 7-18 August 2006 Manila,...
SCIENTIFIC COMMITTEE SECOND REGULAR SESSION
7-18 August 2006
Manila, Philippines
PAPUA NEW GUINEA ANNUAL FISHERY REPORT WCPFC-SC2-2006
Tuna Fisheries Report – Papua New Guinea
(Prepared for the 2nd Science Committee Meeting Manilla, Philippines August, 2006)

1
L. Kumoru and L. Koren
Papua New Guinea National Fisheries Authority, Port Moresby, PNG
July 2006
2
1. Background to the fishery Papua New Guinea’s Exclusive Economic Zone (PNG EEZ), 2.4 million km2 in extent, is one of the largest and more productive in the Western and Central Pacific Ocean. Industrial scale fisheries for tuna and associated species have operated since the 1950s, and in certain years, around 10% of the global catch of the main market species of tuna has been taken within the PNG EEZ. The tuna fishery is the largest of Papua New Guinea’s fisheries and represents a balance of both domestic industry development and foreign Distant Water Fishing Nations (DWFN) access arrangements. Currently, domestic longline vessels and purse seine vessels - domestic, locally-based foreign and foreign access - operate under various arrangements. A large domestic pole-and-line fishery operated in the past but has not been active since 1986. Since 1999, the development of the tuna fishery has been guided by a National Tuna Fishery Management Plan which establishes an overall management structure, and an application framework for the longline, purse seine and pole-and-line fisheries, including licence limits and Total Allowable Catches (TACs). The PNG purse seine fishery operates within the guidelines of several important regional and sub-regional arrangements eg PNA, Palau, and FSM Arrangements. With the entry into force of the Western and Central Pacific Fisheries Convention (WCPFC), PNG tuna fishery is subjected the requirements of the Commission. Under the present Government’s export-driven economic growth strategy, onshore investment in tuna processing for export is being actively encouraged. Foreign and domestic access by purse seine vessels is, as a result, increasingly linked to commitment to onshore investment, especially in the form of tuna processing. 2. Annual Fisheries Information 2.1 National and foreign fleet structure 2.1.1 National Fleet Domestic longline Since 1995, participation in the PNG longline fishery, under a domestication policy, has been restricted to national or citizen companies, with limited allowance for dry charter of additional foreign vessels. Although the fishery began primarily as a fresh chilled tuna fishery, some vessels with freezer capacity increasingly targeted shark, beginning on a large scale in 1997. Since 2002, a distinct shark longline fishery has been recognized, with separate statistical arrangements and monitoring activity assigned to this fishery. Under the Shark Longline Management Plan, effort limits (9 vessels and 1,200 hooks per set per day) and a TAC (2,000mt dressed weight) has been established. Shark catches by the tuna longline fishery are also accounted for under the Plan. The Tuna Fishery Management Plan, also establishes effort limits (100 vessels and 1,200 hooks per set per day) and catch limit (10,000mt per year based on the combined catch of yellowfin and bigeye) for the tuna longline fishery sector. The total number of longline vessels has been stable at about 50 vessels (41 tuna and 9 shark vessels) in the last four years. The number of tuna longline vessels has dropped from 42 in 2005, to only 27 in 2006, with only about 18 vessels active in 2006, as compared to 39 active in the previous two years. Shark vessels have been steady at 9 vessels as that is the limit in the fishery. Any change in licence numbers will most probably be a decrease in vessel numbers.

3
Handline fishery After an initial trial fishing for a year involving two Philippine vessels (bancas or Pump boats) commencing in December 2002; interest in this fishing method, considered part of the longline/midwater fishery, grew. Such that this fishing method is now recognised as a fishery and is guided by a management guideline under the National Tuna Fishery Management Plan (this has being reviewed to include this fishing method). There are currently 5 vessels fishing part-time. In addition 10 smaller vessels, less than 1 tonne (fish + ice) carrying capacity are fishing inshore waters as an artisan fishery. Table 1 (a). Number of Papua New Guinea longline and handline vessels active in the
WCPFC Convention Area, 2001-2005
Year Longline (tuna)
Handline (tuna)
Longline (shark) Total
2000 36 0 21 57 2001 39 0 12 51 2002 40 2 10 52 2003 39 2 9 50 2004 40 0 9 49 2005 42 0 9 51 2006 27 15 9 51
Domestic purse seine Twenty-two (22) purse seine vessels are regarded as domestic. Fourteen of these are not PNG flag vessels but are associated with the tuna cannery, and land all their catch there. Most are smaller medium sized vessels which fish in association wit Fish Aggregation Devices (FADs), transfer catch to carrier motherships at sea, and take most of their catch within archipelagic waters. Locally based foreign purse seine Nineteen larger vessels, mostly flagged in Vanuatu with the home party assigned to PNG and operating widely throughout the region under FSM Arrangement licences (Figure 1), are locally based. These vessels are associated with present or planned onshore processing developments. They typically take around 30% of their catch in PNG waters. 2.1.2 Foreign Fleet – foreign access purse seine PNG currently has bilateral purse seine access agreements with China, Korea, Taiwan and Philippine companies, as well as being a signatory to the United States Multilateral Treaty (USMLT). Several Vanuatu flag vessels are also under bilateral agreement with PNG. A total of 177 purse seine vessels are currently licensed (Table 1). One hundred fifty-five (155) of these are foreign, with fleets taking varying proportions of their regional catch in PNG waters. Vessels of other parties to the FSM Arrangement also fish in PNG waters to a limited extent. The increase in 2006 is due to the licensing of Japanese vessels after a successful re-negotion to access PNG waters earlier this year (2006) after approximately nineteen (19) years of absence. However most of their vessels are yet to fish.

4
Table 1 (b). Number of purse-seine vessels licensed to fish in PNG waters, 2001-2005
Year P/seine (local)
P/seine (locally based)
P/seine (bilateral access)
P/seine (USMLT)
P/seine (FSM Non PNG)
Total
2001 19 5 80 35 11 150 2002 19 8 84 32 15 158 2003 18 11 80 26 16 151 2004 18 16 84 15 14 147 2005 23 19 84 14 13 153 2006 22 19 116 14 6 177
2.2 Coverage categories for catch, effort and size data Coverage of catch, effort and size data can now be categorized into three categories. They can either be high, medium or low. Where there is no data, it would be stated as “no data”. For the catch/effort data coverage “high” represents coverage of greater than 80%, “medium” between 50-80% while “low”0-50%. For the size data coverage “high” is represented greater than15%, “medium” 5-15% and “low” 0-15% (see Table 2 (a)). The percentage representation of the latter data coverage is so because the actual size data collection is not extensive (i.e. a sample representation is required only) and in many cases can only be partially carried out. Table 2 (b) tabulates the estimated annual coverage of catch, effort and size data for PNG fleets in the WCPFC Convention Area, 2003 – 2005. It shows that the estimated annual coverage of catch/effort data for both purse seine and longline PNG Fleets is high as well as for longline size data coverage. PNG fleets size data coverage is between 5 – 15%, medium. This is primarily being collected through the NFA observer programme. Table 2 (a). Categories of coverage for catch, effort and size data.
Category
Catch/Effort data coverage Size data coverage
HIGH > 80% > 15% MEDIUM 50-80% 5-15% LOW 0-50% 0-5% – No data No data LEGEND :
“Catch/Effort data coverage” is determined by the comparing the annual catch from operational (logsheet) data to the total annual catch, as determined by unloadings or other types of data/information.
“Size data coverage” is determined by comparing the number of trips covered by port sampling and observers (collecting size data) with the estimated number of actual trips undertaken by this fleet during that year.

5
PNG Fleet Data coverage for PNG longline for years 2003-2004 and 2005 is high, for both catch effort and size data (table 2b). The purse-seine fishery data coverage is however high for catch/effort, but medium for size data in the same years(table 2b). Data coverage for PNG purse-seine fleet is similar to that of the foreign fleet operating in PNG waters (table2c). Table 2 (b). Estimated annual coverage of catch, effort and size data for Papua New Guinea
fishing fleets in the WCPFC Convention Area, 2003–2005.
Gear
Fleet
Year
Catch/Effort data coverage
% coverage Size data coverage
% coverage
LONGLINE
PAPUA NEW GUINEA
2003-2004 HIGH >80% HIGH >15%
2005 HIGH >80% HIGH >15% PURSE SEINE
PAPUA NEW GUINEA
2003-2004 HIGH >80% MEDIUM 5-15%
2005 HIGH >80% MEDIUM 5-15% Foreign Fleet For all purse-seine fleets by major countries (China, Korea, Chinese Taipei and Vanuatu) the catch/effort data coverage is high for the recent years (2003 – 2005). The size data coverage for foreign fleet has medium coverage. There are no foreign longline fleets operating in PNG EEZ therefore there is no data coverage for foreign longline. Table 2 (c). Estimated coverage of catch, effort and size data for bilateral-arrangement,
foreign fleets fishing in Papua New Guinea’s EEZ.
Gear
Fleet
Year
Catch/Effort data coverage
% coverage Size data coverage
% coverage
PURSE SEINE CHINA 2003-2004 HIGH >80% MEDIUM 5-15% 2005 HIGH >80% MEDIUM 5-15% KOREA 2003-2004 HIGH >80% MEDIUM 5-15% 2005 HIGH >80% MEDIUM 5-15% Chinese
Taipei 2003-2004 HIGH >80% MEDIUM 5-15%
2005 HIGH >80% MEDIUM 5-15% VANUATU 2003-2004 HIGH >80% MEDIUM 5-15% 2005 HIGH >80% MEDIUM 5-15%
6
2.3 Annual National Fleet Catch by species in the WCPFC Convention Area, 2001 - 2005
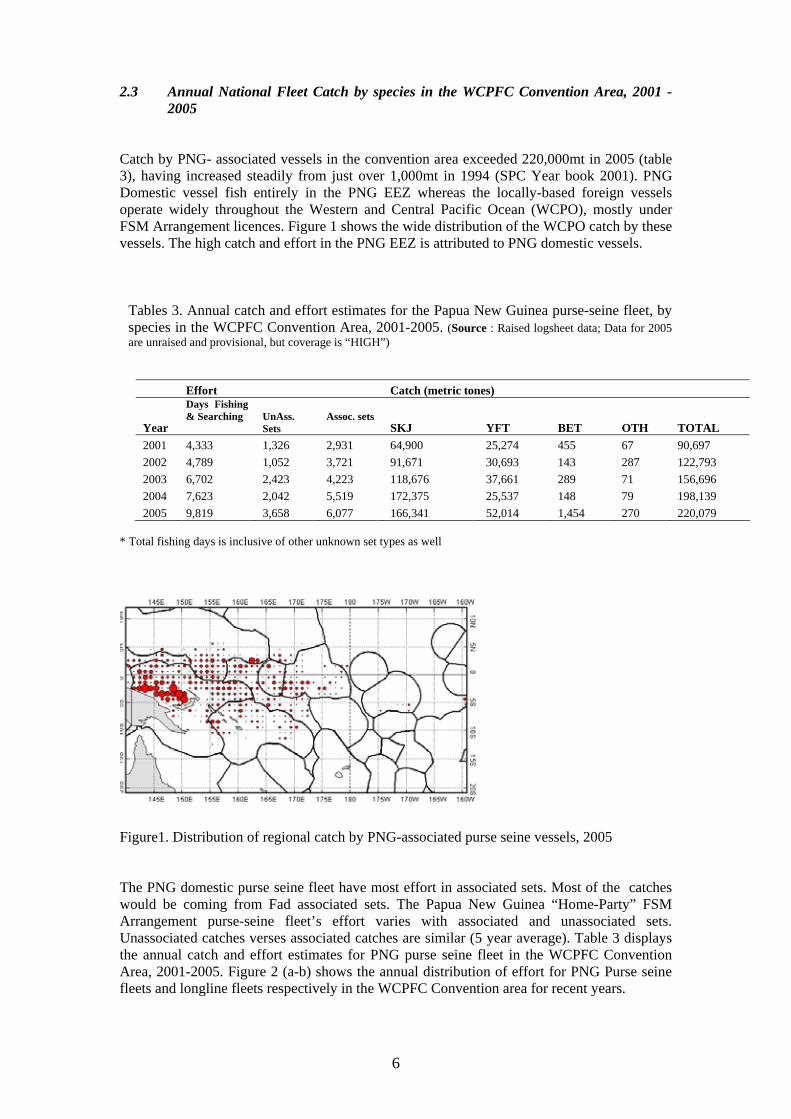
Catch by PNG- associated vessels in the convention area exceeded 220,000mt in 2005 (table 3), having increased steadily from just over 1,000mt in 1994 (SPC Year book 2001). PNG Domestic vessel fish entirely in the PNG EEZ whereas the locally-based foreign vessels operate widely throughout the Western and Central Pacific Ocean (WCPO), mostly under FSM Arrangement licences. Figure 1 shows the wide distribution of the WCPO catch by these vessels. The high catch and effort in the PNG EEZ is attributed to PNG domestic vessels.
Tables 3. Annual catch and effort estimates for the Papua New Guinea purse-seine fleet, by species in the WCPFC Convention Area, 2001-2005. (Source : Raised logsheet data; Data for 2005 are unraised and provisional, but coverage is “HIGH”)
Effort Catch (metric tones)
Year
Days Fishing & Searching
UnAss. Sets
Assoc. sets
SKJ YFT BET OTH TOTAL 2001 4,333 1,326 2,931 64,900 25,274 455 67 90,697 2002 4,789 1,052 3,721 91,671 30,693 143 287 122,793 2003 6,702 2,423 4,223 118,676 37,661 289 71 156,696 2004 7,623 2,042 5,519 172,375 25,537 148 79 198,139 2005 9,819 3,658 6,077 166,341 52,014 1,454 270 220,079
* Total fishing days is inclusive of other unknown set types as well
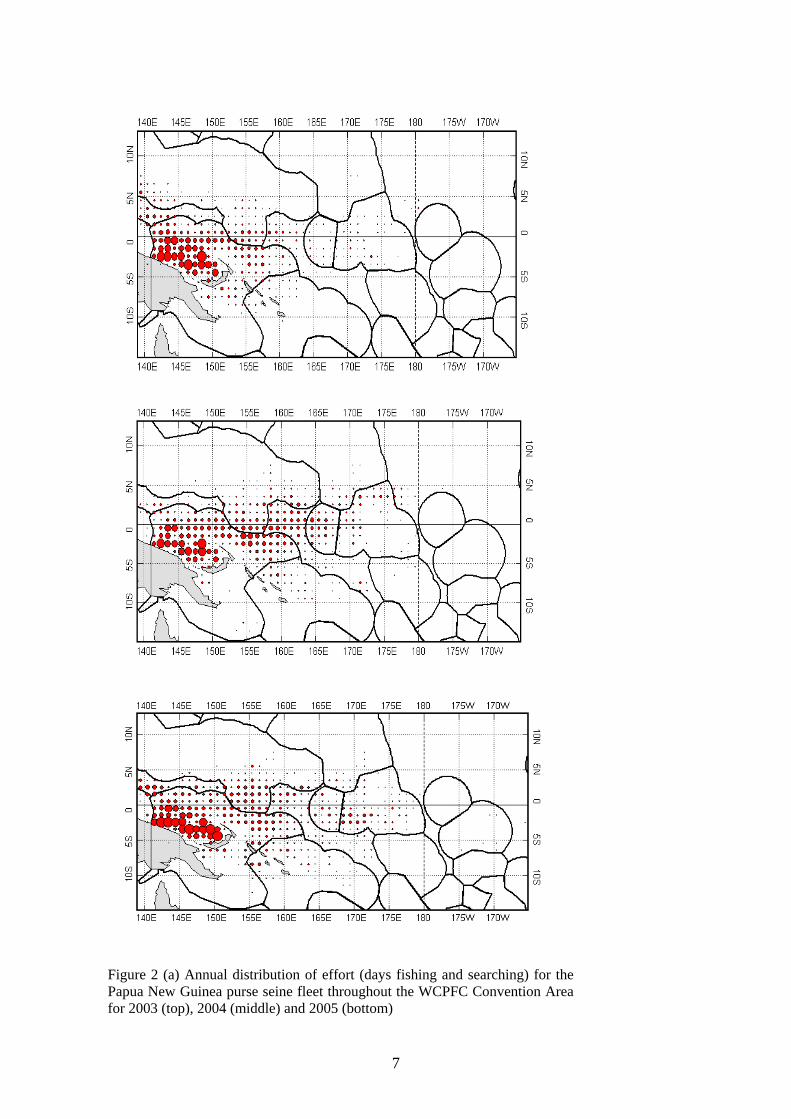
Figure1. Distribution of regional catch by PNG-associated purse seine vessels, 2005 The PNG domestic purse seine fleet have most effort in associated sets. Most of the catches would be coming from Fad associated sets. The Papua New Guinea “Home-Party” FSM Arrangement purse-seine fleet’s effort varies with associated and unassociated sets. Unassociated catches verses associated catches are similar (5 year average). Table 3 displays the annual catch and effort estimates for PNG purse seine fleet in the WCPFC Convention Area, 2001-2005. Figure 2 (a-b) shows the annual distribution of effort for PNG Purse seine fleets and longline fleets respectively in the WCPFC Convention area for recent years.
7
Figure 2 (a) Annual distribution of effort (days fishing and searching) for the Papua New Guinea purse seine fleet throughout the WCPFC Convention Area for 2003 (top), 2004 (middle) and 2005 (bottom)

8
Figure 2 (b) Annual distribution of effort (100s of hooks) for the Papua New Guinea longline fleet throughout the WCPFC Convention Area for 2003 (top), 2004 (middle) and 2005 (bottom)

9
2.4 Annual Home EEZ Catch by gear, fleet and species, 2001 - 2005 Longline (tuna) There has been no licensed access by DWFN longline vessels to PNG waters since 1995, with a peak historical catch of nearly 20,000t (1978) achieved by Japanese vessels during this earlier period. Domestic longline activity started in 1995, following the introduction of the domestication policy. Prior to 2001, logsheet coverage of the domestic fishery has been poor and catches are difficult to estimate with any confidence. Table 2 (b) shows that catch/effort coverage (logbook data) for longline for 2003 – 2005 is high therefore this situation has improved; coverage has remained to be high for the last three recent years. Estimates of the tuna longline catch for 2005 from available logsheet data indicate a total catch of 3,574t (all species), of which 1,052.t yellowfin, 211t bigeye and 2,088t albacore and 222t of other fish. This is a decrease from a catch of 4,810t in 2004. Catch in 2005 was dominated by Albacore (58.4% of the total catch and 62% of the tuna catch) with lesser catches of bigeye. Catch is for the first time dominated by albacore and this is due to a number of reasons, including favourable environmental conditions enabling albacore to be more available to the fishery plus some intentional targeting driven by improved prices of albacore. Quantities of albacore have increased in recent years also as a result of increasing effort mostly in the Coral Sea. The concentration of effort in the Coral Sea area is an architect of economic convenience. The optimal fishing areas, in terms of catch rates and bigeye proportion in the catch, are in the north of the EEZ. In general catch rates have been much lower than the Japanese historical catch rates. Tables 4. Annual catch and effort estimates for the Papua New Guinea longline fleet, by
species in the WCPFC Convention Area, 2001-2005 (Source : Raised logsheet data; Data for 2005 are unraised and provisional)
Effort Catch (metric tonnes) Year hhooks ALB BET YFT BLM BUM MLS SWO OTH TOTAL 2001 59,018 124 240 1,812 45 138 22 33 753 3,167 2002 59,602 142 318 1,738 61 125 8 35 1,050 3,477 2003 66,569 857 390 1,747 24 126 13 22 174 3,354 2004 93,188 1,903 392 2,267 26 81 12 26 123 4,810 2005 75,872 2,088 211 1,052 38 58 9 18 99 3,574

10
Figure 3. Distribution of catch by PNG tuna longline vessels, 2005 Longline (shark) The fishery started on a significant scale in 1997, when vessels licensed as tuna vessels and with freezer capacity began targeting shark. This quickly expanded to over 20 vessels, although many of these did not fish for lengthy periods of time. Data coverage prior to 2002 is sparse (less than 30%) with poor facility on the existing tuna logsheets to record shark catch. Shark and tuna catches taken by longline vessels targeting shark, now limited to nine. Estimates of the shark longline catch for 2004 from the available logsheet and landings data, indicate a total catch (all species) of 1,474t, with 1,240t of dressed shark (84%), and 71t of G&G tuna (5%). Dressed Marlin is 46t (3%), Swordfish is 57t (4%), sailfish18t (1%), and various other fish species 42t (3%) make up the remainder of the catch. The main shark species taken, based on extensive observer data, are silky shark, silvertip, grey reef, black tip and oceanic white-tip, although species composition of the catch varies considerably by area. Based on available export data, 1,271t of frozen shark meat (more than 1,000t whole weight of shark) was exported in 2005 suggesting that considerable and increasing quantities of shark are being processed and consumed locally. Purse seine (local and locally based foreign) The catch by domestic and locally based foreign vessels in PNG waters continues to increase (Table 5), and exceeded 100,000t in 2003 again in 2004 and 2005. It now makes up over 40% of the total purse seine tuna catch in the EEZ. Skipjack now contributes around 65% of the declared catch by species, as opposed 80 and 72% in the previous two years. Yellowfin still makes up most of the remainder. The proportion of yellowfin in the declared catch has again exceeded 30% after dropping in the previous two years. Observer data suggest that the percentage of yellowfin and bigeye in the catch in associated sets may be even higher, as much as 60% of the total by weight from these sets in some instances. Most of the catch by the locally licensed vessels has been taken in association with anchored Fads; recent adoption of an FAD Management policy now see restrictions placed on FAD numbers and operations, due to resource and gear conflict concerns.

11
Table 5. Domestic and locally based foreign vessel purse seine catch in PNG waters by species
Year #. vls Skipjack % Yellowfin % Bigeye % Other % Total 2001 22 35,068 64.6 18,700 34.4 451 0.9 67 0.1 54,286 2002 25 46,686 67 22,634 32.5 122 0.2 287 0.3 69,728 2003 33 82,880 72.7 30,948 27.1 94 0.1 69 0.1 113,991 2004 37 92,328 84.3 17,101 15.6 100 0.1 47 0 109,577 2005 42 73,350 65.1 37,998 33.7 1,056 0.9 199 0.3 112,602
Purse seine (bilateral and multilateral) Of the foreign access fleets, only the Philippines fleet of ten vessels (an eleventh vessels is flagged in PNG but fishes elsewhere) consistently takes virtually all of its catch in the PNG EEZ, with the other fleets (Taiwan, Korea, China and US) taking varying proportions of their catch in PNG waters, higher in La Nina years. Several of the Philippines vessels have access agreements with other Pacific Island Nations but have not fished there to any great extent. The annual catches by foreign purse seine fleets in the Papua New Guinea EEZ, by flag and species, 2001-2005 is as shown in Table 6. Catch is dominated by the Chinese Taipei fleet accounting for about half (46%) of the annual catch in the last five years. About a third (29%) is caught by the Korea fleet and about 20% is by the Philippine fleet. Less than 5% is caught by the other foreign fleets. Figure 4 (a) displays distribution of effort by main foreign purse seine fleets active in PNG EEZ for 2004 and 2005 respectively

12
Tables 6. Annual catches by foreign purse seine fleets in the Papua New Guinea EEZ, by flag and species, 2001-2005 (Source : Raised logsheet data collected by NFA)
Catch (metric tones)
Fleet YEAR SKJ YFT BET OTH TOTAL % Catch China 2001 2002 1,160 165 0 0 1,325 1.4% 2003 5,557 1,382 0 0 6,939 3.2% 2004 4,751 285 0 1 5,037 2.4% 2005 6,557 1,169 0 1 7,726 4.6% FSM 2001 843 588 0 0 1,431 1.6% 2002 2,129 819 0 0 2,948 3.1% 2003 7,903 3,286 10 0 11,199 5.1% 2004 8,049 1,134 0 0 9,183 4.5% 2005 4,172 1,046 0 0 5,218 3.1% Philippines 2001 15176 9698 417 12 25303 29.0% 2002 18552 6816 798 18 26183 27.7% 2003 12384 3688 155 35 16262 7.5% 2004 22584 4811 675 38 28108 13.6% 2005 12451 6018 368 52 18889 11.2% Korea 2001 10,850 5,473 12 0 16,335 18.7% 2002 11,493 2,981 6 0 14,480 15.3% 2003 56,229 22,199 25 0 78,453 36.0% 2004 72,637 9,572 18 1 82,227 39.9% 2005 45,030 12,385 15 1 57,431 34.2% Chinese Taipei 2001 35,041 8,942 226 0 44,209 50.6% 2002 41,839 7,692 59 0 49,590 52.5% 2003 85,720 18,310 987 80 105,097 48.2% 2004 74,199 5,517 59 15 79,790 38.7% 2005 57,251 12,646 215 21 70,133 41.7% Vanuatu 2001 2002 2003 0 0 0 0 0 0 2004 1,815 52 0 0 1,867 0.9% 2005 7,248 1,381 0 2 8,631 5.1%
TOTAL EEZ 2001 61,910 24,701 655 12 87,278 2002 75,172 18,473 863 18 94,525 2003 167,793 48,865 1,177 115 217,950 2004 184,035 21,372 751 54 206,211 2005 132,708 34,645 598 76 168,028

13
KOREA
CHINA
CHINESE TAIPEI Figure 4 (a). Annual distribution of effort by the main foreign purse seine fleets active in the Papua New Guinea EEZ for 2004 (left) and 2005 (right)

14
2.5 Total home EEZ catch, for all species, all gears and all fleets combined 2001 – 2005 The estimated total catch by all vessels fishing in the PNG EEZ for the past five years (2001-2005 inclusive) is shown in Table 7, and is comprised for the most part of purse seine catches (99% of the total catch). The considerable inter-annual variations seen in these catches is the result of both large-scale environmental events (ENSO) affecting surface tuna availability in the PNG EEZ (higher in La Nina years). The average annual purse seine catch in the EEZ has been around 260,000t during this recent five-year period, roughly 20% of the regional purse seine catch. Table 7 Total catch by all vessels fishing in PNG waters (Source: Purse seine - SPC raised data (BEST) from logsheets and landings data; longline - NFA logsheet data; incomplete but including catches by tuna and shark longliners; some by-catch included)
Year 2001 2002 2003 2004 2005 Historical high
Purse seine 141,564 164,253 331,995 315,788 280,630 331,995 (2003)
Longline 2,585 3,341 3,354 3,948 3,574 19,584 (1978)
Pole&line 0 0 0 0 0 74,649 (1974)
TOTAL 144,149 167,594 335349 319736 284,204
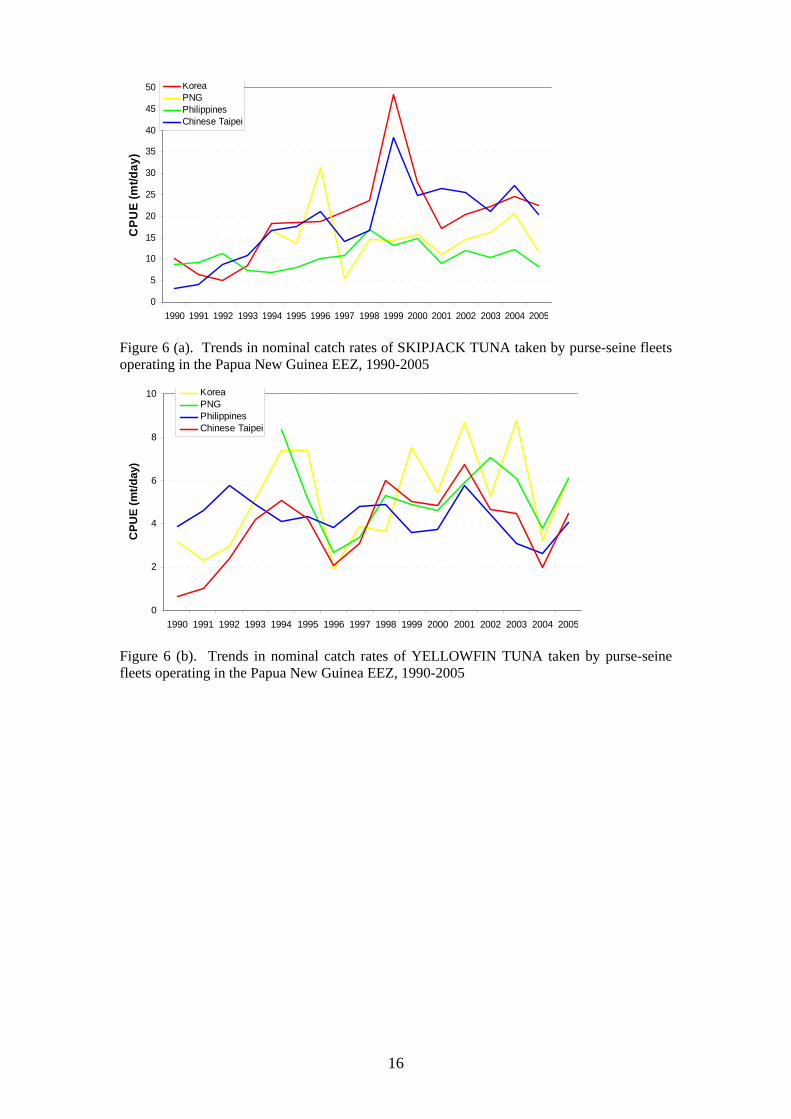
The purse seine catch in the EEZ by domestic vessels, and foreign vessels based in PNG, the latter now numbering over 37 in total, has increased steadily since the establishment of the Madang cannery in 1997, and through more recent association with onshore commitments (Table 5). It is now about 40% of the total purse seine catch in the EEZ and is expected to increase further as new onshore developments come on stream and concurrently, bilateral access arrangements are accorded lower priority. 2.5.1 Catch rates in PNG waters Catch rates by the various fleets in fishing in the waters of PNG is variable with those fishing mainly on free schools having a higher catch per day than those fishing predominantly on Anchored Fads. Trends in catch rates by species (Yellowfin, Bigeye and Albacore) for longline fleet operating in PNG EEZ, 1990 – 2005 is shown in Figure 5 (a – c). Trends in catch rates by species ( Skipjack and Yellowfin) for purse seine fleet operating in PNG EEZ, 1990 – 2005 is shown in Figure 6 (a – b).

15
0
0.5
1
1.5
2
2.5
3
1980
1982
1984
1986
1988
1990
1992
1994
1996
1998
2000
2002
2004
CPU
E (N
o. p
er 1
00 h
ooks
)
Japan
Korea
PNG
Chinese Taipei
Figure 5 (a). Trends in nominal catch rates of YELLOWFIN TUNA taken by longline fleets operating in the Papua New Guinea EEZ, 1990-2005
0
0.2
0.4
0.6
0.8
1
1.2
1980
1982
1984
1986
1988
1990
1992
1994
1996
1998
2000
2002
2004
CPU
E (N
o. p
er 1
00 h
ooks
)
Japan
Korea
PNG
ChineseTaipei
Figure 5 (b). Trends in nominal catch rates of BIGEYE TUNA taken by longline fleets operating in the Papua New Guinea EEZ, 1990-2005
0
0.5
1
1.5
2
2.5
3
1980
1982
1984
1986
1988
1990
1992
1994
1996
1998
2000
2002
2004
CPU
E (N
o. p
er 1
00 h
ooks
)
Japan
Korea
PNG
ChineseTaipei
Figure 5 (c). Trends in nominal catch rates of ALBACORE TUNA taken by longline fleets operating in the Papua New Guinea EEZ, 1990-2005
16
0
5
10
15
20
25
30
35
40
45
50
1990 1991 1992 1993 1994 1995 1996 1997 1998 1999 2000 2001 2002 2003 2004 2005
CPU
E (m
t/day
)
KoreaPNGPhilippinesChinese Taipei
Figure 6 (a). Trends in nominal catch rates of SKIPJACK TUNA taken by purse-seine fleets operating in the Papua New Guinea EEZ, 1990-2005
0
2
4
6
8
10
1990 1991 1992 1993 1994 1995 1996 1997 1998 1999 2000 2001 2002 2003 2004 2005
CPU
E (m
t/day
)
KoreaPNGPhilippinesChinese Taipei
Figure 6 (b). Trends in nominal catch rates of YELLOWFIN TUNA taken by purse-seine fleets operating in the Papua New Guinea EEZ, 1990-2005
17
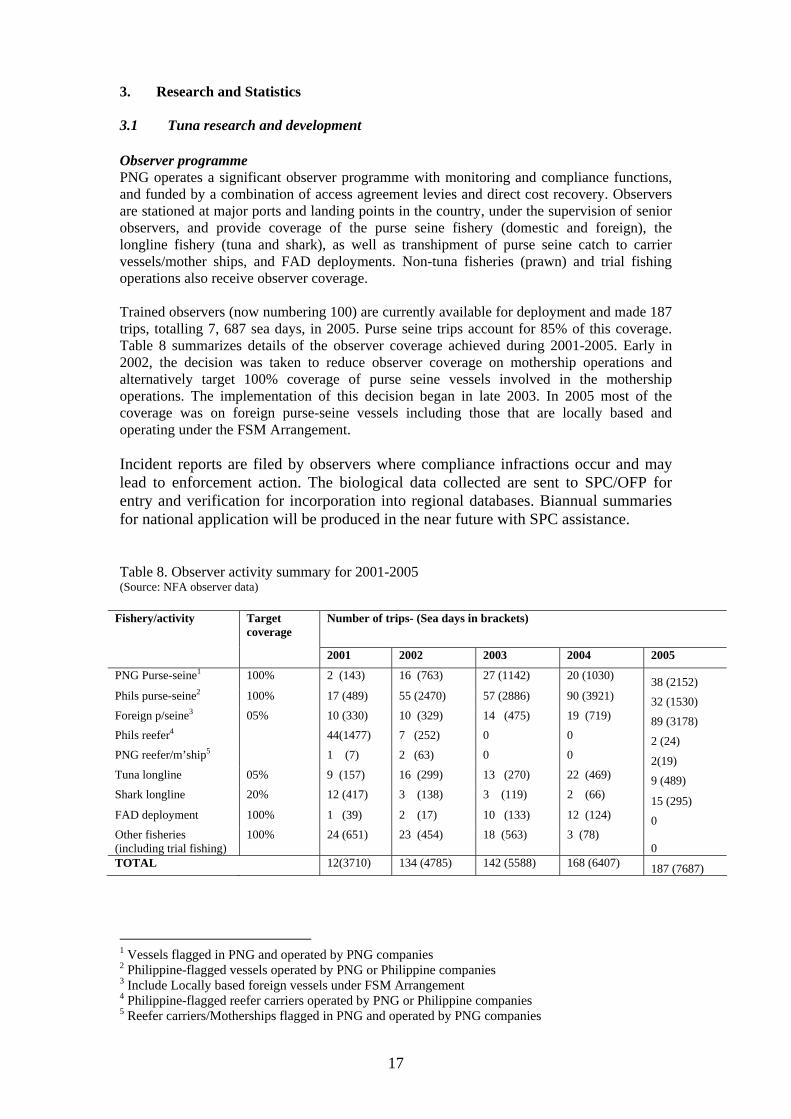
3. Research and Statistics 3.1 Tuna research and development Observer programme PNG operates a significant observer programme with monitoring and compliance functions, and funded by a combination of access agreement levies and direct cost recovery. Observers are stationed at major ports and landing points in the country, under the supervision of senior observers, and provide coverage of the purse seine fishery (domestic and foreign), the longline fishery (tuna and shark), as well as transhipment of purse seine catch to carrier vessels/mother ships, and FAD deployments. Non-tuna fisheries (prawn) and trial fishing operations also receive observer coverage. Trained observers (now numbering 100) are currently available for deployment and made 187 trips, totalling 7, 687 sea days, in 2005. Purse seine trips account for 85% of this coverage. Table 8 summarizes details of the observer coverage achieved during 2001-2005. Early in 2002, the decision was taken to reduce observer coverage on mothership operations and alternatively target 100% coverage of purse seine vessels involved in the mothership operations. The implementation of this decision began in late 2003. In 2005 most of the coverage was on foreign purse-seine vessels including those that are locally based and operating under the FSM Arrangement. Incident reports are filed by observers where compliance infractions occur and may lead to enforcement action. The biological data collected are sent to SPC/OFP for entry and verification for incorporation into regional databases. Biannual summaries for national application will be produced in the near future with SPC assistance. Table 8. Observer activity summary for 2001-2005 (Source: NFA observer data)
Fishery/activity Target coverage
Number of trips- (Sea days in brackets)
2001 2002 2003 2004 2005
PNG Purse-seine1 100% 2 (143) 16 (763) 27 (1142) 20 (1030) 38 (2152) Phils purse-seine2 100% 17 (489) 55 (2470) 57 (2886) 90 (3921) 32 (1530) Foreign p/seine3 05% 10 (330) 10 (329) 14 (475) 19 (719) 89 (3178) Phils reefer4 44(1477) 7 (252) 0 0 2 (24) PNG reefer/m’ship5 1 (7) 2 (63) 0 0 2(19) Tuna longline 05% 9 (157) 16 (299) 13 (270) 22 (469) 9 (489) Shark longline 20% 12 (417) 3 (138) 3 (119) 2 (66) 15 (295) FAD deployment 100% 1 (39) 2 (17) 10 (133) 12 (124) 0 Other fisheries (including trial fishing)
100% 24 (651) 23 (454) 18 (563) 3 (78) 0
TOTAL 12(3710) 134 (4785) 142 (5588) 168 (6407) 187 (7687) 1 Vessels flagged in PNG and operated by PNG companies 2 Philippine-flagged vessels operated by PNG or Philippine companies 3 Include Locally based foreign vessels under FSM Arrangement 4 Philippine-flagged reefer carriers operated by PNG or Philippine companies 5 Reefer carriers/Motherships flagged in PNG and operated by PNG companies

18
Port sampling activity was re-established during 2002, to gather information primarily on size and species composition of landed catches. The information is send to SPC. There are 22 port samplers who are also trained observers stationed in ports throughout the country. The estimated annual total catches of non-target species and species group by PNG purse seine fleets and longline fleet, 2003 – 2005 are tabulated in tables 9 and 10. Figure 7 and 8 show proportions of non-target species groups in the catch of PNG purse seine vessels and longline vessels respectively. The non-target species groups’ proportion from total catch in PNG purse seine vessels has been decreasing over the last three years (Figure 7). In the longline there was a decrease in the proportion of nontarget species in 2004 as compared to 2003, but there was a slight increase in 2005.(Figure 8). It is interesting to see that the composition of sharks and rays for the non-target species has increased from 2003 for PNG tuna longline vessels. Table 9. Estimated Annual total catches of non-target species and species groups, by Papua New Guinea purse seine fleets, 2003-2005. (Source of data : Data collected under the Papua New Guinea Observer Programme (managed by NFA) and the FSM Arrangement Observer Programme (managed by FFA); Coverage of observer data : 2003– 23.7%; 2004–35.3%; 2005–18.1%; Coverage has been estimated by comparing observer-recorded target species catch to annual catch estimates for this fleet; ‘%’ represents percentage of total catch which includes target tuna species catch)
Species MT % MT % MT %
Skipjack 119,611 75.77% 175,906 87.03% 166,341 75.68%
Yellowfin 35,949 22.77% 22,601 11.18% 43,829 19.94%
Bigeye 2,300 1.46% 3,609 1.79% 9,639 4.39%
Blue marlin 55 0.03% 18 0.01% 13 0.01% Black marlin 61 0.04% 19 0.01% 8 0.00%
Billfish 17 0.01% 8 0.00% 7 0.00% Total Billfish 134 0.08% 44 0.02% 29 0.01%
Blue shark 0 0.00% 0 0.00% 0 0.00% Mako sharks 7 0.00% 0 0.00% 0 0.00%
Oceanic whitetip shark 1 0.00% 1 0.00% 1 0.00% Silky shark 95 0.06% 35 0.02% 20 0.01%
Other sharks and rays 363 0.23% 22 0.01% 23 0.01% Total Sharks and Rays 467 0.30% 59 0.03% 44 0.02%
Bullet/Frigate tunas 470 0.30% 54 0.03% 31 0.01% Kawakawa 36 0.02% 27 0.01% 0 0.00%
Rainbow Runner 470 0.30% 405 0.20% 84 0.04% Wahoo 7 0.00% 10 0.01% 3 0.00%
Common dolphinfish 54 0.03% 28 0.01% 11 0.00% Triggerfish 52 0.03% 133 0.07% 23 0.01% Barracudas 9 0.01% 3 0.00% 3 0.00%
Escolars 0 0.00% 0 0.00% 0 0.00% Lancetfishes 0 0.00% 0 0.00% 0 0.00%
Ocean sunfish 0 0.00% 0 0.00% 0 0.00% Oilfish 0 0.00% 0 0.00% 0 0.00%
Opah 0 0.00% 0 0.00% 0 0.00% Pomfrets 6 0.00% 1 0.00% 1 0.00%
Small baitfish 54 0.03% 120 0.06% 30 0.01%
Other fish 500 0.32% 49 0.02% 41 0.02% Total Other finfish 1,658 1.05% 831 0.41% 228 0.10%
Total non-target species 2,259 1.43% 934 0.46% 301 0.14%
2003 2004 2005Catch Estimates

19
2003Target species
Billf ish
Sharks and Rays
Other f inf ish
Non Target
2004
2005
Figure 7. Proportion of non-target species groups in the catch of Papua New Guinea purse seine vessels, by year, 2003–2005. (Source of data : Data collected under the Papua New Guinea Observer Programme (managed by NFA) and the FSM Arrangement Observer Programme (managed by FFA)

20
Table 10. Estimated Annual total catches of non-target species and species groups, by Papua New Guinea longline fleet, 2003-2005. (Source of data : Data collected under the Papua New Guinea Observer Programme (managed by NFA); Coverage of observer data : 2003–1.5%; 2004–1.5%; 2005–0.5%; Coverage has been estimated by comparing observer-recorded target species catch to annual catch estimates for this fleet; ‘%’ represents percentage of total catch which includes target tuna species catch)
Species MT % MT % MT %
Albacore 857 21.70% 1,903 36.06% 2,088 53.06%
Yellowfin 1,747 44.20% 2,267 42.95% 1,052 26.74%
Bigeye 390 9.86% 392 7.42% 211 5.37%
Blue marlin 112 2.83% 32 0.60% 74 1.87% Black marlin 5 0.13% 17 0.33% 0 0.00%
Striped Marlin 59 1.48% 24 0.45% 0 0.00% Swordfish 81 2.05% 33 0.62% 72 1.84% Billfish 81 2.05% 38 0.72% 30 0.77%
Total Billfish 337 8.54% 143 2.72% 176 4.47%
Blue shark 20 0.51% 52 0.98% 0 0.00% Mako sharks 11 0.28% 19 0.36% 167 4.25%
Oceanic whitetip shark 102 2.58% 12 0.22% 13 0.33% Silky shark 52 1.32% 103 1.95% 10 0.26%
Other sharks and rays 0 0.00% 63 1.19% 1 0.01% Total Sharks and Rays 185 4.68% 248 4.69% 191 4.86%
Bullet/Frigate tunas 0 0.00% 0 0.00% 0 0.00% Kawakawa 0 0.01% 0 0.00% 0 0.00%
Rainbow Runner 0 0.00% 0 0.01% 0 0.00% Wahoo 36 0.91% 18 0.35% 3 0.07%
Common dolphinfish 12 0.31% 11 0.21% 6 0.16% Triggerfish 0 0.00% 0 0.00% 0 0.00% Barracudas 36 0.90% 24 0.45% 19 0.48%
Escolars 0 0.00% 1 0.01% 12 0.30% Lancetfishes 5 0.14% 8 0.16% 0 0.00%
Ocean sunfish 13 0.32% 0 0.00% 0 0.00% Oilfish 31 0.78% 29 0.55% 18 0.46%
Opah 130 3.30% 141 2.67% 39 1.00% Pomfrets 7 0.17% 6 0.12% 1 0.02%
Small baitfish 0 0.00% 0 0.00% 0 0.00%
Other fish 111 2.81% 86 1.63% 118 3.01% Total Other finfish 381 9.65% 325 6.16% 217 5.51%
Total non-target species 904 22.87% 716 13.57% 584 14.84%
2004 20052003Catch Estimates

21
2004
2005
2003Target species
Billf ish
Sharks and Rays
Other f inf ish
Figure 8. Proportion of non-target species groups in the catch of Papua New Guinea tuna longline vessels, by year, 2003–2005. (Source of data : Data collected under the Papua New Guinea Observer Programme managed by NFA

22
4. Final market destination of catches/disposal of catch Domestic longline (tuna) The majority of the fresh chilled tuna catch (yellowfin and bigeye) is exported by airfreight to markets in Japan and Australia. Exports have increased steadily since 1994 and based on available records, exceeded 2,000t dressed weight (est. 2,400t whole weight), valued at over USD 8 million, for the first time in 2002 (Table 11). Frozen tuna (mostly albacore, now increased to more than 1,000t in last 2 years) is also exported. Smaller amounts of lower grade tuna and by-catch species (Wahoo, mahimahi, some shark) are sold on local markets, and some sharkfin is (mostly frozen) exported. Domestic longline (shark) Shark meat has been exported since the fishery moved to a significant scale in 1998, with over 2,000t whole weight equivalent exported each year since then. During 2004, increasing amounts of shark meat were processed in PNG for sale to local food outlets. Frozen sharkfin export has been in excess of 100t since 2000 but has dropped to less than 100t in the most recent two years. Tuna caught by the shark longline vessels (approx. 6% of the catch by weight) is also exported frozen (several hundred tonnes per year). Local licensed purse seine In each of 2001, 2002 and 2003, over 30,000t of frozen tuna was exported by the three local companies, representing around 50% of the total catch taken by these vessels. Figures for frozen tuna have dropped as more tuna is now being processed in country. In 2004 only 10,000t was exported. 2005 it can be seen that figures will further drop as the other plants come into production. Limited quantities of by-catch species and small fish are sold locally. The local market for canned tuna, in addition to exports, has expanded rapidly Locally based foreign purse seine catch The 200mt/day loin plant in Wewak is in operation as of March 2003, and currently operating at a capacity of 60mt/day. It is hoped that the out put will increase to 100t/day sometimes this year. All of the catch by these vessels is currently transhipped and exported, apart from small quantities unloaded to the RD cannery from time to time (< 1,000t in 2002). Much of the transhipment occurs in non-PNG ports. Foreign purse seine vessels All of the catch taken by foreign bilateral and multilateral access vessels is transhipped, some from PNG designated ports, and exported. Unloading of by-catch during transhipment is encouraged. 4.1 Exports Table 11 lists tuna fishery exports by main category and value for the period 2001-2005. The total value of tuna fishery related exports has dropped in the last two years by about 10% from a high of USD64 million in 2002; these figures may still be incomplete. The export figures do not include the value of tuna transhipped by PNG-based vessels. Chilled tuna, as noted, is mostly exported to Japan and Australia, frozen tuna to Philippines, Japan and Taiwan, canned tuna mainly to the European markets (Germany, Great Britain), with small quantities to Pacific Island countries, tuna loins to Europe and US and fish meal to Australia and Japan. Shark products are mostly exported to Taiwan.

23
Table 11. Tuna fishery product exports by volume and value (Source: NFA records; values in USD; frozen shark and frozen tuna weights are dressed; the 2005 figures may be incomplete; dried shark fins are not included)
Chilled tuna Frozen tuna Canned tuna Loins tuna Fish meal Shark meat (frozen)
Shark fins (frozen)
TOTAL (USD Million)
Year Mt value Mt Value Mt Value Mt Value Mt Value Mt Value Mt Value
2001 1,857 8.2 35, 106 22.4 9,858 17.6 - - 1,438 0.5 1,618 0.8 151 1.2 50.7
2002 2,106 8.4 33, 960 30.4 12,214 23.4 - - 1,670 0.6 1,330 0.5 112 0.8 64.1
2003 2,092 9.3 31, 294 16.5 13,753 28 - - 1,791 0.7 1, 312 0.5 86 0.5 55.5
2004 2,111 9.6 13, 235 8.4 15, 638 36.2 1, 749 1 3, 113 1.2 756 0.3 135 1.1 57.8
2005 866 3.5 16, 798 8.5 14, 543 38.5 12, 927 6.8 3, 530 1.3 1, 271 0.4 171 1.3 60.3
5. Onshore developments Infrastructure Under the Asian Development Bank (ADB) Fisheries Development Project, two wharves to primarily support longline fishery development were built in Kavieng and Lombrum (Manus) respectively. The former with an associated fish processing facility also completed. The Manus wharf was completed and opened in December 2003. A net mending facility is under construction which is associated with the wharf. Manus is well placed with respect to access to Guam, a primary entrepot for fresh tuna to Japan. Further wharves are planned under forthcoming fishery development projects in three other locations. An airport chillier facility (60t capacity), to allow consolidation and storage of chilled fish prior to export, was completed at the end of 2003 and is now in operation in Port Moresby. Net repair facilities are available in Lae and Madang (Vidar) and have been proposed for at least one other location. Processing The RD tuna cannery, established in Madang in 1997, continues to enhance production capacity with daily throughput of 150t now being achieved. Plans have been announced for the construction of a second larger cannery/loining plant at Vidar, north of Madang (200t/day), in association with a 2,000t cold storage facility. A can making factory is under construction to compliment the cannery. The South Seas Tuna Wewak loining plant (200t/day capacity), was completed in early 2004 and is currently operating at 100mt/day. The proposed Frabelle cannery (100t/day) in Lae, with the associated 600t cold storage and ice plant is in operation having been commission in March 2006. One other smaller fish processing plants in Lae by Frescomer (PNG) is in operation in Lae. A 60mt/day canning and loin plant is under construction in east New Britain. This project has PNG equity with a majority of Chines Taipei interest.

24
6. Future prospects and developments Under the Government’s export driven economic growth and recovery strategy, further onshore development is being encouraged, as a condition of access. Approval for the construction of a second loining plant (60t/day) in Madang is in the final stages, and interest has been expressed in additional smaller plants in at least two other locations. Proximity to the resource seems to be becoming a major factor influencing investment in onshore processing facilities in PNG, along with the prospect of improved access to key markets. Should all of these plants come to fruition, up to 175,000t of raw material per annum might be required. Assuming that at least one third of this might be sourced outside PNG waters, locally sourced material (125,000t) would still represent only about half of the projected sustainable yield from PNG waters, assuring sustainability of supply and leaving room for further expansion. Some projections see tuna export values reaching USD 250 million (K One billion) within the next five years. Further development of the longline fishery is currently constrained by logistical factors, particularly freight availability, high freight costs and high fuel cost, and growth in this industry is now stagnant. Access to foreign longline vessels is likely to be allowed on a limited basis if the domestic longline industry continues to be stagnant. The nominal longline TAC of 10,000t (yellowfin and bigeye) remains some distance off. The future development of the handline fishery (which has attracted considerable interest) will be closely monitored and regulated, whereas artisanal tuna fishery development will be encouraged under forthcoming projects and as an adjunct to onshore developments. The planned development of “frozen smoked” processing plants is seen as a positive development for the longline and handline sector, as it will preclude in part the need for increasingly expensive airfreight. Other opportunities for value-adding to tuna products exist, and landing of by-catch by all vessels landing or transhipping is being encouraged. In order to realise the full potential of the Tuna Fishery in PNG, the Government in partnership with the Fishing Industry is working on a project to build a Marine Industrial Park to carter for the fishing industry. This will be build in Madang.