Tsunami. Tsunami Map Tsunami Videos 02k&list=PL8110EA7D41928E46 (Tsunami Awareness 3:17) .
Upload
ethelbert-arnoldCategory
view
221download
0
Tsunami in Indiana: Emerging K-12 School Funding Issues
Armstrong Teacher Educator Program Presentation
Terry Spradlin
April 28, 2010
2
About the Center for Evaluation & Education Policy
• The Center for Evaluation & Education Policy (CEEP) is a
client-focused, self-funded research center associated with the School of Education at Indiana University
• CEEP provides a wide range of evaluation and nonpartisan policy research services to policymakers, governmental entities, and non-profit organizations
• CEEP is continually looking for new opportunities to help inform, influence, and shape the development of P-16 education policy not only in Indiana, but across the nation

3
CEEP Associates focus their broad spectrum of experience and capabilities to produce high impact
within the following "Areas of Excellence":
• Educational Evaluation
oEarly Childhood Education Evaluation
oLiteracy Evaluation
oMath, Science and Technology Evaluation
• Education Policy Research & Technical Assistance
• Health, Human Services & Community Development Evaluation
Table of Contents
I. State Revenue Trends
II. School Budgets and Referenda in Indiana
III. School Funding Lawsuit
IV. Federal Stimulus Dollars in Indiana
V. Indiana and the Race to the Top (RTTP/R2T)
VI. Federal School Improvement Grant
VII. Investing in Innovation Fund (i3)
4

I. State Revenue Trends
5
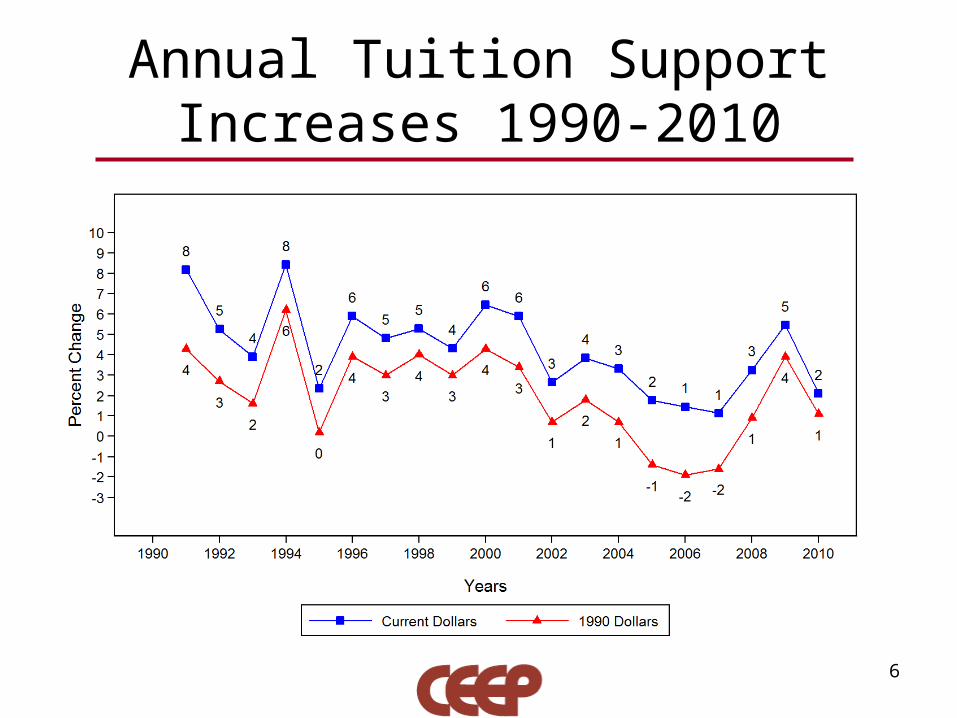
Annual Tuition Support Increases 1990-2010
6

Increase in Total Tuition Support From 1990 to Current Year
7
1990 1991 1992 1993 1994 1995 1996 1997 1998 1999 2000 2001 2002 2003 2004 2005 2006 2007 2008 2009 2010
Current Dollars
NaN 8.19349411384916
13.8844008434692
18.3471065398609
28.3345646437277
31.3621453380554
39.0973494948155
45.7775380519882
53.4726579065905
60.0806661422582
70.4135828160
22
80.4532499254375
85.2274969175693
92.3375978210471
98.7383927589486
102.240305944854
105.173751852121
107.515541664
53
114.263470366
59
125.953347734447
130.717286021448
1990 Dollars
NaN 4.27902012752364
7.07136737481
92
8.79952937727
65
15.4982651451359
15.7862259570081
20.2944081581028
23.9086198004397
28.8853070274984
32.6928598659302
38.4610360380
18
43.2378522512874
44.2650893841309
46.8329401762667
47.8708279456461
45.8032374269686
43.0687207173436
40.8456917571051
42.0439537147967
47.6373904577713
49.2498366977916
10
30
50
70
90
110
130
Pe
rce
nt
Ch
ange

Indiana 2009-2011 Biennium Budget
• In May 2009, the Indiana Legislature passed the 2009-2011 biennium budget which called for:– General Fund Expenditures of $27.684 billion– Projected Revenue of $26.746 billion
• The budget deficit is to be paid through reserve funds.
• The revenue forecast breakdown for the biennium as of May 2009:– Forecast 2009: $12.932 billion (-1.1% decrease from 2008 revenue)– Forecast 2010: $13.143 billion (1.6% increase from 2009 forecast)– Forecast 2011: $13.660 billion (3.9% increase from 2010 forecast)
8

Indiana Updated Revenue Forecast
• In December 2009, the state made an updated forecast of 2010 and 2011 revenues.
• Newly projected revenue for 2010 was $12.076 billion, representing a 6.4% decrease from actual 2009 revenue and a 7.9% decrease from the May 2009 projection.
• Revenue projections for 2011 are $12.835 billion, a 5.8% decrease from the original May 2009 forecast.
9
Original Revenue Forecast - May
Updated Revenue Forecast - Dec. Percent Change
2010 $13.115 billion $12.076 billion -7.9%
2011 $13.632 billion $12.835 billion -5.8%

Nationwide State Tax Revenue Trends
• Through the first 8 months of FY 2010:– 25 states reported personal income tax collections below
their latest targets– 23 states had general sales tax revenues below their most
recent forecasts
• 21 states already project budget gaps of at least $64.7 billion in FY 2013
• Since the recession began in December of 2007, states will have addressed budget gaps in excess of $531 billion
10
Falling Revenues
• Until March 2010, Indiana faced 17 consecutive months of lower-than-forecast tax revenue collections.
• In the first nine months of FY10, revenues were $867 million less than projected, representing a 9.4% decrease from FY09 which itself saw a 7.4% decrease from FY08.
11

Indiana Budget Reductions
• In December 2009, Gov. Daniels began announcing budget reductions to cope with the falling revenues.– 10% in executive branch agencies– 6% in higher education ($150 million)– 4.5% in public school funding ($300 million)
• In April 2010, state agencies have been asked for an additional 5% reduction, for a total 15% reduction in their budgets for the FY11 which begins on July 1.
• One hopeful sign: March 2010 tax revenue collections increased $7 million, or 0.8%, from March 2009.– This is $2 million above the original revenue forecast in May 2009;– And is $48 million above the revised revenue forecast in Dec. 2009.
12

House Enrolled Act No. 1367
• The 2010 Indiana General Assembly passed House Enrolled Act (HEA) 1367 to allow school corporations greater flexibility in conducting inter-fund transfers.
• The Act specifies that an amount equal to 5% of a school corporation’s Capital Projects Fund levy may be transferred (except from Debt Service and Racial Balance Funds).
• However, a corporation whose employees will not receive a general wage and salary increase for the 2010-11 school year may transfer an amount up to 10% of the school corporation’s Capital Projects Fund Levy to the General Fund. (WLSC)
13

II. School Budgets and School Referenda in Indiana
14

School Budget Cuts
• School corporations across the state are looking to more substantial budget reduction measures including faculty and staff reductions, building closures, program reductions or eliminations, and operating and construction referenda to close budget deficits.
• The following slides describe approved or proposed reductions in selected school corporations across the state.
15
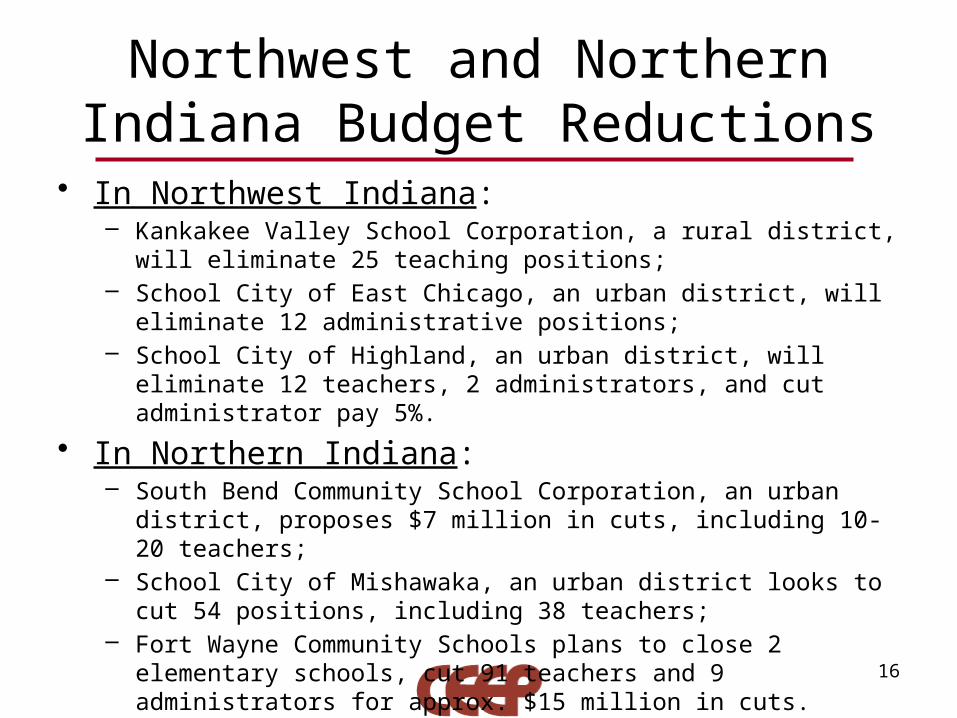
Northwest and Northern Indiana Budget Reductions
• In Northwest Indiana:– Kankakee Valley School Corporation, a rural district, will eliminate 25 teaching
positions;– School City of East Chicago, an urban district, will eliminate 12 administrative
positions;– School City of Highland, an urban district, will eliminate 12 teachers, 2
administrators, and cut administrator pay 5%.
• In Northern Indiana:– South Bend Community School Corporation, an urban district, proposes $7
million in cuts, including 10-20 teachers;– School City of Mishawaka, an urban district looks to cut 54 positions, including
38 teachers;– Fort Wayne Community Schools plans to close 2 elementary schools, cut 91
teachers and 9 administrators for approx. $15 million in cuts.
16

Indianapolis Area Budget Reductions
• Indianapolis Public Schools proposed cutting 80 teachers, 15 high school administrators, 20 custodians, and 20 school resource officers.
• In other metropolitan districts:– M.S.D. of Perry Township looks to cut 43 teachers;– M.S.D. of Lawrence Township plans to cut 25 teaching positions;– M.S.D. of Decatur Township looks to cut 62 teachers;– M.S.D. of Warren Township plans to close 2 elementary schools and
eliminate 10 teaching position.
17
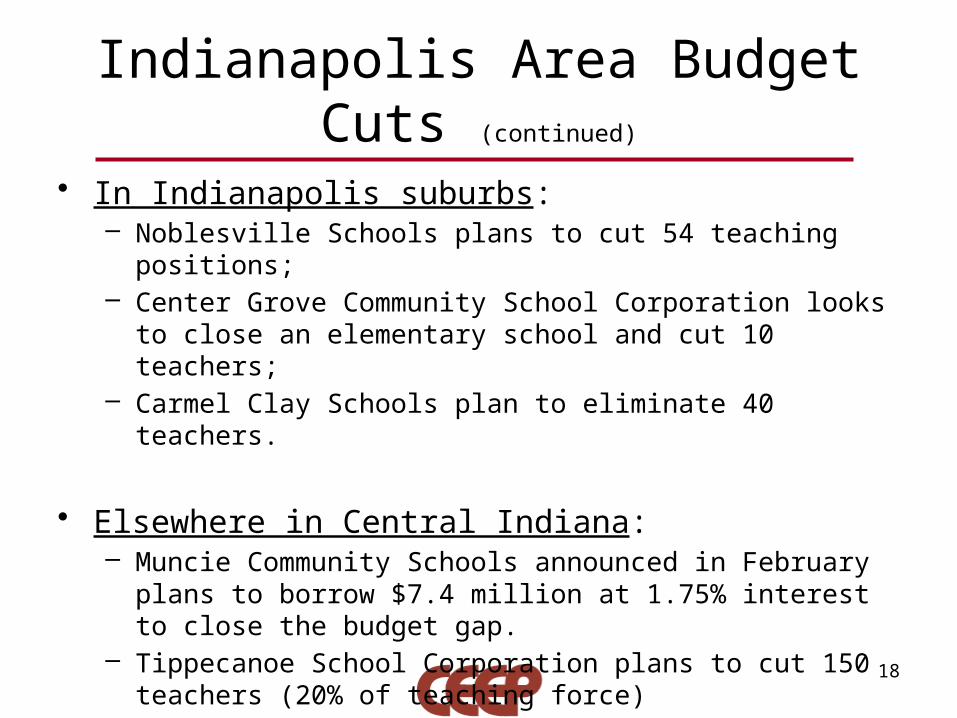
Indianapolis Area Budget Cuts (continued)
• In Indianapolis suburbs:– Noblesville Schools plans to cut 54 teaching positions;– Center Grove Community School Corporation looks to close an
elementary school and cut 10 teachers;– Carmel Clay Schools plan to eliminate 40 teachers.
• Elsewhere in Central Indiana:– Muncie Community Schools announced in February plans to borrow
$7.4 million at 1.75% interest to close the budget gap.– Tippecanoe School Corporation plans to cut 150 teachers (20% of
teaching force)
18

Southern Indiana Budget Cuts
• Vigo County School Corporation, an urban district, announced recently it plans to make approximately $4.7 million in reductions.
• New Albany-Floyd County Consolidated School Corporation, a suburban district, has plans to close 4 schools (losing 70 teachers) and to cut assorted administrative positions.
• Monroe County Community School Corporation, an urban district, announced plans to eliminate 88 teachers.
• Richland-Bean Blossom School Corporation, a suburban district, plans to cut 17.5 teachers and close its alternative school.
19

School Referenda
• In lieu or in addition to budget cuts, some school corporations are pursuing General Fund or construction referenda.
20
General fund Referenda Scheduled for May 4th
School Corporation Amount Being Sought
Western Boone School Corporation An additional $0.19 per $100 assessed property value for 7 years
Carmel Clay School Corporation An additional $0.16 per $100 assessed property value for 7 years ($12 million)
Noblesville School CorporationAn additional $0.2115 per $100 assessed property value for 7 years ($5 million per
year)
West Lafayette Community School Corporation
An additional $0.43 per $100 assessed property value for 7 years

School Referenda (continued)
21
General Fund Referenda Scheduled for May 4th (continued)
School Corporation Amount Being Sought
MSD of Washington Township An additional $0.08 per $100 assessed property value for 7 years
School Town of Speedway An additional $0.59 per $100 assessed property value for 7 years
Clark Community School Corporation An additional $0.24 per $100 assessed property value for 7 years
Eastern Hancock County Community School Corporation
An additional $0.1657 per $100 assessed property value for 7 years
MSD of Mt. Vernon An additional $0.251 per $100 assessed property value for 7 years
School Referenda (continued)
22
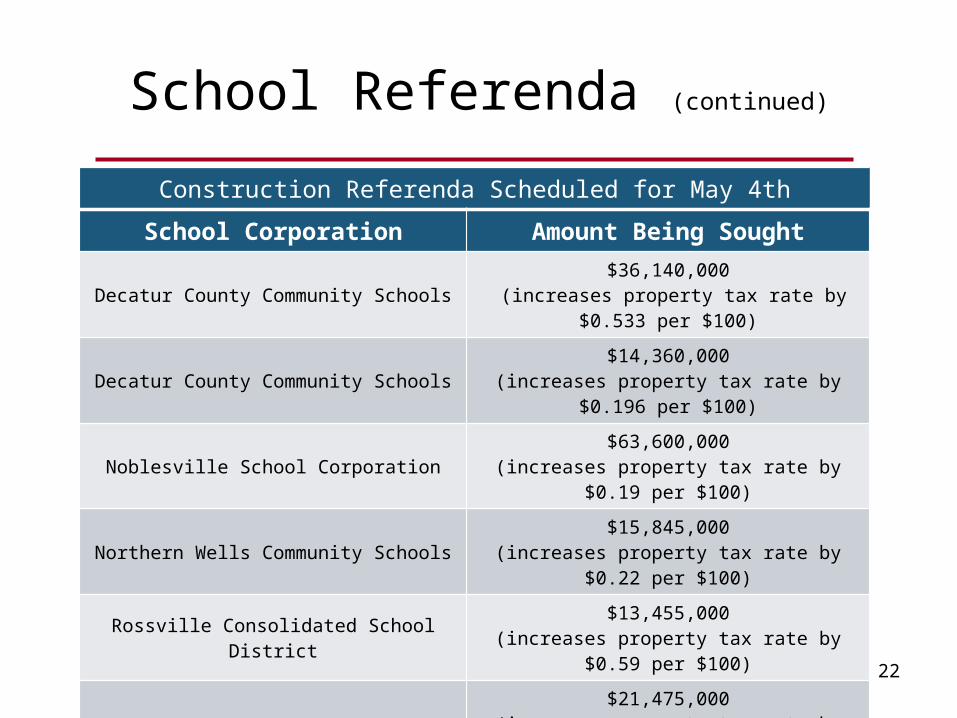
Construction Referenda Scheduled for May 4th
School Corporation Amount Being Sought
Decatur County Community Schools $36,140,000 (increases property tax rate by $0.533 per $100)
Decatur County Community Schools $14,360,000(increases property tax rate by $0.196 per $100)
Noblesville School Corporation $63,600,000(increases property tax rate by $0.19 per $100)
Northern Wells Community Schools $15,845,000(increases property tax rate by $0.22 per $100)
Rossville Consolidated School District $13,455,000(increases property tax rate by $0.59 per $100)
MSD of Pike Township$21,475,000
(increases property tax rate by $0.00 per $100 due to retiring of current debt)
Rennselaer Central Schools Corporation $14,835,000(increases property tax rate by $0.2278 per $100)

23
November 2, 2010
Center GroveGeneral Fund Referendum

24
School Funding in Center Grove
General Fund
CapitalProjects
Trans-portation
BusReplace
-ment
Debt Service
Bond Severance
$6.9 M $3.2 M $0.9 M $12.8 M $1.1 M$43.1 M

25
• On March 17, the Board approved raising $3,160,000 per year for 7 years for a total of approximately $3,300,000.
• This will add $0.15 per $100 of Assessed Valuation to the school corporation tax rate.
• This will be in addition to the school corporation’s normal tuition support.
• This will increase taxes for a home with an assessed valuation of $200,000 by $147 per year or $12.22 per month.
Dollars Raised via a GFR

26
Tax Impact Calculator

Johnson County 2010 Tax Rate Comparison
Greenwood
Nineveh
Center Grove
Edinburgh
Franklin
Clark Pleasant
$0.0000 $0.5000 $1.0000 $1.5000 $2.0000
$0.8391
$0.9143
$1.0214
$1.2741
$1.5481
$1.9236
0.15
27

28
• Balance the budget and maintain our current programs as per board direction
• Provide additional positions that will work directly with students. (Examples include: Teachers, Classroom Assistants, Support Personnel)
• Maintain opportunities for students in the area of instructional technology
• Save jobs• Absorb possible future reductions in state funding
Purposes of GFR Dollars

III. School Funding Lawsuit
29

Hamilton Southeastern Schools, et al. v. Daniels
• On February 23, 2010, three suburban corporations and parents of students attending these corporations filed a lawsuit in the Hamilton Superior Court:– Hamilton Southeastern Schools– Middlebury Community Schools– Franklin Township Community School Corporation
• Plaintiffs contend that state funding system disproportionately effects their school corporations and favors urban corporations– Denies students a uniform education as provided for in the
State Constitution
30

Issue in Contention : Average Daily Membership
• Adjusted average daily membership (ADM) – Allows school corporations to choose between the actual
ADM for the current year or the average ADM of three previous years when calculating tuition support
– Corporations with increasing enrollments use their actual ADM, while corporations with declining enrollments use the adjusted (artificially higher) ADM
– Plaintiffs contend that this is disproportionately shifting state revenue from corporations with rising enrollments to corporations with declining enrollments
31

Issue in Contention: Complexity Index
• Complexity Index– Increases the amount of funding a school corporation
receives based on the number of students who qualify for free or reduced price lunch in the corporation• In 2009 the Complexity Index was $2,400 per eligible
student– Plaintiffs argue that the Complexity Index creates non-
uniformity and disparate allocation of educational resources
32

Issue in Contention: Reduction in Per-Pupil Funding and Restoration Grants
• The state of IN reduced base-line per-pupil funding across all corporations from $4,825 in 2009 to $4,550 in 2010– Plaintiffs suggest that this reduction impacts students
attending some corporations more so than students in other corporations
• Restoration Grant limits the change in dollars per-pupil a school corporation receives– Corporations with reductions beyond the specified range
are eligible to apply for grant funding– Plaintiffs contend that this unjustly shifts funding away
from their corporations
33

Issue in Contention: Property Tax Law
• State prohibition on using property tax revenues for general school expenses– Plaintiffs argue that this provision prohibits their
corporations from using local resources to provide students with the same funding amount other corporations are receiving under the state formula
34

The Precedent of Bonner v. Daniels
• Plaintiffs contended that state’s school funding formula is insufficient to provide an adequate education to all students
• Violation of Education, Due Course of Law, and Equal Privileges and Immunities Clauses of the State Constitution
• In a 4-1 decision, the Indiana State Supreme Court dismissed the case on June 2, 2009– Court stated that the plaintiffs claims, even if found true,
were not sufficient to establish an enforceable duty on the State
35

IV. Federal Stimulus Dollars and Education in Indiana
36

Federal Stimulus and Indiana
• As of March 30, 2010 Indiana has received $1.7 billion in stimulus funding
37
Category Funding Received
State Fiscal Stabilization Funds $1,006,920,810
Title I, Part A- Supporting Low Income Schools $168,676,901
IDEA Grants, Parts B &C- Improving Special Education Programs $272,485,196
Education Technology Grants $10,921,523
Vocational Rehabilitation Funds $12,335,350

Federal Stimulus and Indiana
38
Category Funding Received
Independent Living Services Fund $1,009,807
McKinney- Vento Homeless Assistance Funds $959,295
Pell Grant Funds $221,986,138
Work Study Funds $4,334,715
Total Funding $1,699,629,735
(Continued)

Indiana Stimulus Specifics
• Of the state fiscal stabilization funds received by Indiana $610,100,000 went into the school funding formula
• For most programs receiving stimulus funding, the funding will expire after two years, however, for some programs, such as Title I, the funding will last for 27 months
• Phase II of the state’s application has been given approval by the federal government– Allocation amounts and dispersal timeline have yet to be
established
39

V. Indiana and the Race to the Top
40

Indiana’s Race to the Top Application
• In January 2010 Indiana submitted a Race to the Top application for $500 million
• Indiana’s application scored 355.6 out of 500 possible points• Ranking the state 23rd out of 41 states• The 15 states and Washington, D.C. chosen as finalists had
scores of at least a of 400• States chosen for funding had scores of
– Delaware 454.6 points– Tennessee 444.2 points
• Delaware will receive $107 million and Tennessee will be awarded $502 million
41

Race to the Top Scores by Selection Criteria Categories
42
Indiana Delaware Tennessee
State Success Factors (125) 92.4 119.4 112
Standards and Assessments (70) 64 68.8 68.4
Data Systems to Support Instruction (47) 32.8 47 43.6
Great Teachers and Leaders (138) 85 119.2 114
Turning Around the Lowest-Achieving Schools (50) 39.2 42.8 48
General (55) 42.2 42.4 43.2
Subtotal (485) 355.6 439.6 429.2
Emphasis on STEM (15) 0 15 15
Total (500) 355.6 454.6 444.2

At a Glance: State Success Factors, Standards /Assessments, and Data Systems
43
Indiana Delaware Tennessee
Securing local education agencies commitment (45)
35.4 45 44.2
Ensuring the capacity to implement (20) 14.8 18.2 18.4
Improving outcomes (25) 15.4 22.2 15.8
Supporting transition to enhanced standards and high-quality assessments (20)
15.2 19.4 18.6
Fully implementing a statewide longitudinal data system (24)
14.4 24 24

At a Glance: Great Teachers and Leaders
44
Indiana Delaware Tennessee
Providing high-quality pathways for aspiring teachers and principals (21)
9.2 17.2 15
Developing evaluation systems (15) 10.2 12.8 13.6Using evaluations to inform key decisions (28) 15.4 24 24.4
Ensuring equitable distribution in high-poverty or high-minority schools (15)
9.2 12.4 10.2
Ensuring equitable distribution in hard-to-staff subjects and specialty areas (10)
6.6 8.8 8.2
Improving the effectiveness of teacher and principal preparation programs (14)
8.4 11.4 12.6
Providing effective support to teachers and principals (20)
12.8 19 15

At a Glance: Turning Around the Lowest Achieving Schools and General
45
Indiana Delaware Tennessee
Turning around the persistently lowest-achieving schools (35)
24.2 28.4 33
Making education funding a priority (10) 7 7.6 8.6
Ensuring successful conditions for high performing charter and other innovative schools (40)
31.6 31 30

Why Tennessee and Delaware
46
• Secretary of Education Arne Duncan said that no one factor was decisive
• Many factors set them apart from the rest of the field– Statewide buy-in from unions and other stakeholders– Dedication to turning around low performing schools– Commitment to installing teacher evaluation systems
linked to student achievement– Emphasis on STEM education– Illustrated capacity to implement reforms– Using evaluations to inform decisions– Fully implementing statewide longitudinal data systems

Strengths of Indiana’s Application
• The state is making progress in narrowing the achievement gap and increasing graduation rates.
• Judges praised Governor’s Teaching Corps of Excellence and Lead Indiana programs for producing more equitable distribution in the state’s neediest schools.
• The state scored well in ensuring successful conditions for high-performing charter schools and other innovative schools.
47

Weakness of Indiana’s Application
• Perceived lack of buy-in from local teachers’ unions– Questioned whether state could implement a teacher
evaluation system under local bargaining agreements• Inadequate alternative pathways for teachers to enter the
classroom• Professional Development approaches were questioned• Longitudinal Data System not fully implemented• Lack of a demonstrated commitment to STEM education• Cap on enrollment at virtual charter school
48
Second Round Funding
• Approximately $3 Billion is available for second round funding
• Indiana had the option to revise it’s application and apply for the second round of Race to the Top Funding by June 1, 2010.
• Indiana would have been competing for an award of between $150 to $250 million
49

Indiana’s Decision Not to Apply
• On Thursday April 22, Dr. Bennett, Indiana Superintendent of Public Instruction, announced that the state will not submit an application for Phase II funding in the Race to the Top competition
• Without support from the state’s teachers unions the application would not be competitive
• The president of the Indiana State Teachers Association (ISTA), the state’s largest teachers’ union, declined to meet with Superintendent Bennett after a highly public feud, prompting the state’s decision to not apply
50

Next Steps
• Indiana will continue to implement the state’s road map for educational reform (Fast Forward) as provided for in its Race to the Top application even without receiving federal funding
51
VI. Indiana Awarded Federal School Improvement Grant
52

Federal Grant for Turnaround Efforts
• Indiana received a grant of $61 million from funding made available to states this spring from the 2009 budget and American Recovery and Reinvestment Act
• This grant funding is to support turnaround efforts of persistently low performing schools.
• 100 Indiana schools, which educate 50,000 of the state’s students, have failed to make Adequate Yearly Progress (AYP) for 6 consecutive years
• 23 of these schools are on track for state takeover in 2011-12
53

Federal Grant for Turnaround Efforts
• Grant funding will be distributed to low achieving schools on a competitive basis
• Purpose of the funding is to support reforms that fall under one of four models:– Turnaround Model – Restart Model– School Closure Model– Transformation Model
54

Four Models
• Turnaround Model – Assess and replace staff, reform curriculum, extend
learning time, etc. • Restart Model
– Convert to charter school or reopen under an education management organization
• School Closure Model– Close school and have students attend higher achieving
schools• Transformation Model
– Replace principal and implement comprehensive reform 55

VII. Investing in Innovation Fund
56

Innovation Grants
• The Investing in Innovation Fund (i3) was established under the American Recovery and Reinvestment Act
• Local Education Agencies (LEAs) and Non-Profit Organizations in partnership with at least one LEA are eligible to apply
• Purpose of the grant program is to allow those eligible to:– Expand and develop innovative practices– Create partnerships with the private sector and the
philanthropic community– Identify and document best practices
57

Grant Categories
• Three categories of competitive grants:– Scale-up grants (proven programs ready to expand)
• Up to $50 million in available funds• Up to 5 awards will be given
– Validation grants (programs that need additional research or increased organizational capacity)• Up to $30 million in available funds• Up to 100 awards
– Development grants (try innovative program ideas)• Up to $5 million in available funds• Up to 100 awards
58

Absolute Priority Areas
• Proposals must address at least one of four priority areas:– Support effective teachers and leaders– Improve the use of data– Complement the implementation of high standards and
high-quality assessments– Turn around persistently low-performing schools
59

Competitive Proposal Preference
• Preference will be given to proposals that address:– Early learning outcomes– College access and success– Special education and limited English proficient students– Schools in rural districts
60

Innovation Grant Details
• Approximately $650 million are available• Applications are due May 11, 2010• There have been 2,500 letters of intent• Funding duration is three to five years• U.S. Department of Education will obligate all funding by
September 30, 2010• CEEP working with four clients to prepare proposals
61

Resources• “What kept us from top in race?” Indiana Education Insight. Volume 14, No.
7 April 5, 2010• Race to the Top: Panel Review by Applicant. U.S. Department of Education.
http://www2.ed.gov/programs/racetothetop/phase1-applications/index.html
• U.S. Department of Education. America Recovery and Reinvestment Act State Fact Sheets. March 30, 2010. http://www2.ed.gov/policy/gen/leg/recovery/state-fact-sheets/index.html
• U.S. Department of Education. Investing in Innovation Fund (I3). http://www2.ed.gov/programs/innovation/index.html
• U.S. Department of Education. School Improvement Fund. http://www2.ed.gov/programs/sif/index.html
• i3--- Investing in Innovation: American Recovery and Reinvestment Act. College Board Fact Sheet. 2010.
62
Resources Continued
• Hamilton Southeastern Schools, et al. v. Daniels Petition to the Hamilton Superior Court. Filed February 23, 2010. Available at: http://www.schoolfunding.info/news/litigation/IndianaComplaint.pdf
• Fact Sheet: Litigation in Indiana. National Access Network, Teachers College, Columbia University. April 2010. Available at: http://www.schoolfunding.info/states/in/lit_in.php3
• Michael, R.S., Spradlin, T., & Carson, F. (2009). Changes in Indiana School Funding. Education Policy Brief, Vol. 7, No. 2. Bloomington, IN: Center for Evaluation and Education Policy.
• National Conference of State Legislatures. States Keep a Close Watch on April Tax Collections. April 14, 2010. Available at: http://www.ncsl.org/PressRoom/StateBudgetUpdateMarch2010/tabid/20151/Default.aspx
63
CEEP Contact Information
Terry E. Spradlin, MPAAssociate Director for Education Policy
1900 East Tenth StreetBloomington, Indiana 47406-7512
812-855-4438Fax: 812-856-5890http://ceep.indiana.edu
64