
Truckee Corridor Study AreasPredicted PSD Increment Impact HA83 SO2, PM10, and NO2 NO2 Annual 34.1...
40
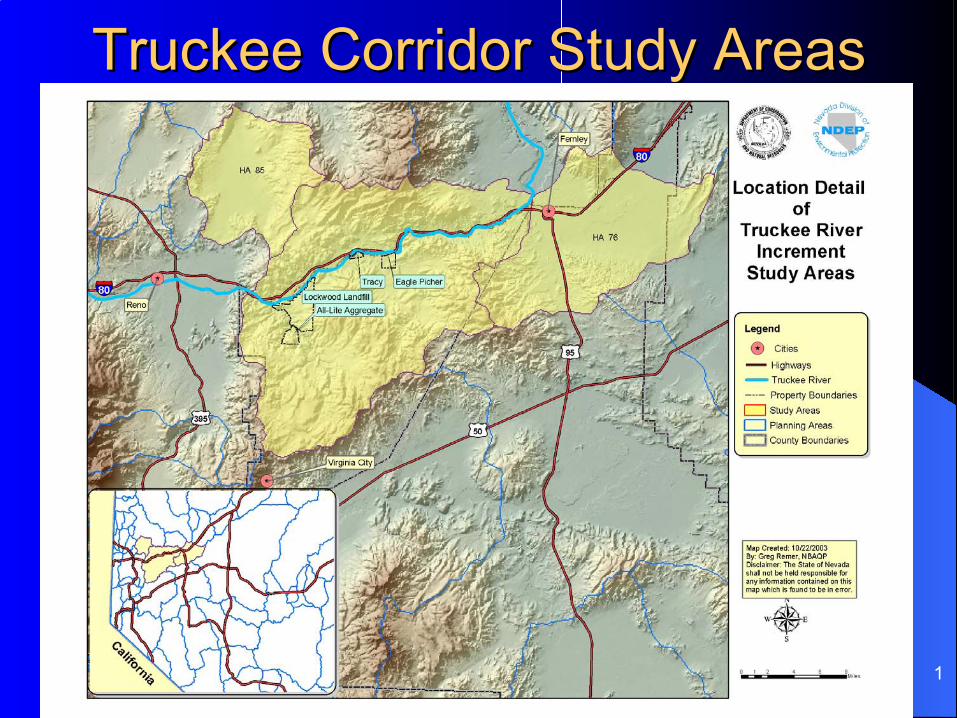
1 Truckee Corridor Study Areas Truckee Corridor Study Areas
Transcript of Truckee Corridor Study AreasPredicted PSD Increment Impact HA83 SO2, PM10, and NO2 NO2 Annual 34.1...
1
Truckee Corridor Study AreasTruckee Corridor Study Areas

2
IntroductionIntroduction
Original Workshop (November 1999)Significant GrowthAdditional Potential for GrowthNeed for Future Planning
Much of the analysis is complete and we are here to present the results

3
Background Background
PSD is a federal requirement and stands for “Prevention of Significant Deterioration”Increment is a component of the PSD program Increment standards are changes in concentrationabove what’s already there when a large source submits an application
NAAQS
BACTIncrement
Other Impacts

4
5
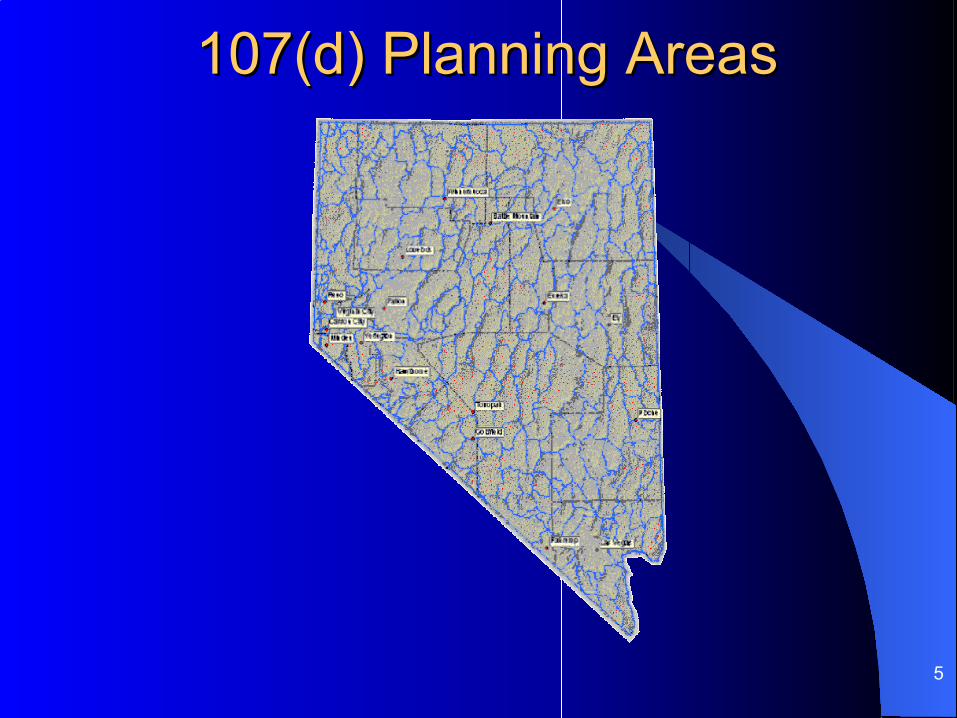
107(d) Planning Areas107(d) Planning Areas

7
Truckee Corridor Study AreasTruckee Corridor Study Areas
8
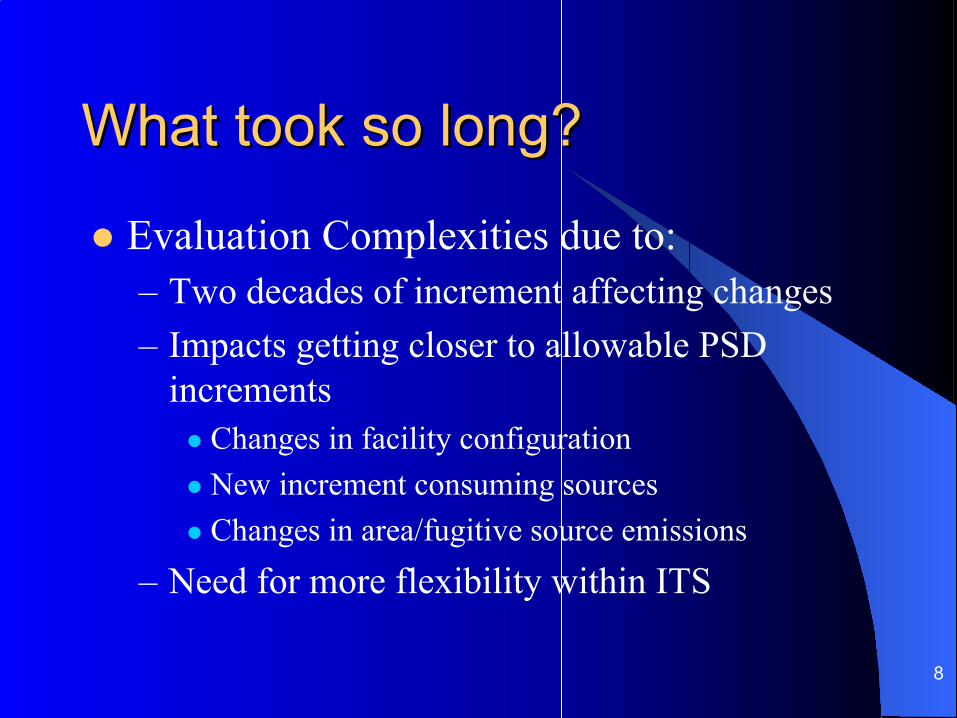
Evaluation Complexities due to:– Two decades of increment affecting changes– Impacts getting closer to allowable PSD
incrementsChanges in facility configurationNew increment consuming sourcesChanges in area/fugitive source emissions
– Need for more flexibility within ITS
What took so long?What took so long?
9
Increment Study ResultsIncrement Study Results

10
Emissions Included in AnalysesEmissions Included in Analyses
– Point Sources– Major sources, of 100 tpy or greater, in and within
50 kilometers of the planning area– Industrial sources in the planning area
– Fugitive Area Sources– Railroad, and mobile emissions within planning
area– Miscellaneous source emissions within planning
area

11
Pollutants ModeledPollutants Modeled
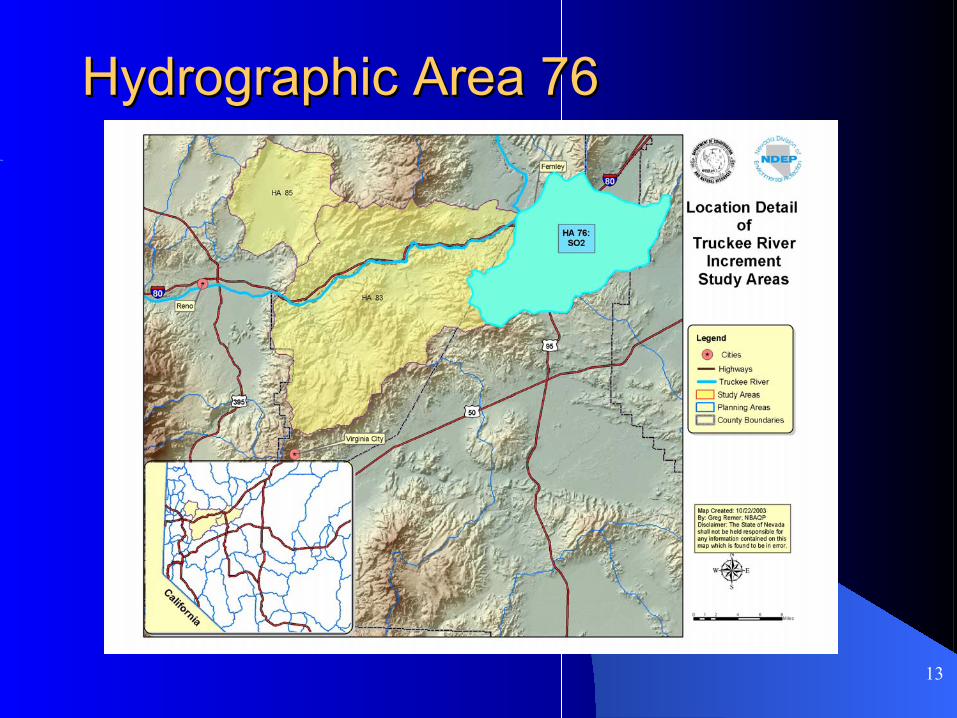
Hydrographic Area 76 - SO2
Hydrographic Area 83 - SO2, NO2 and PM10
Hydrographic Area 85 - SO2
12
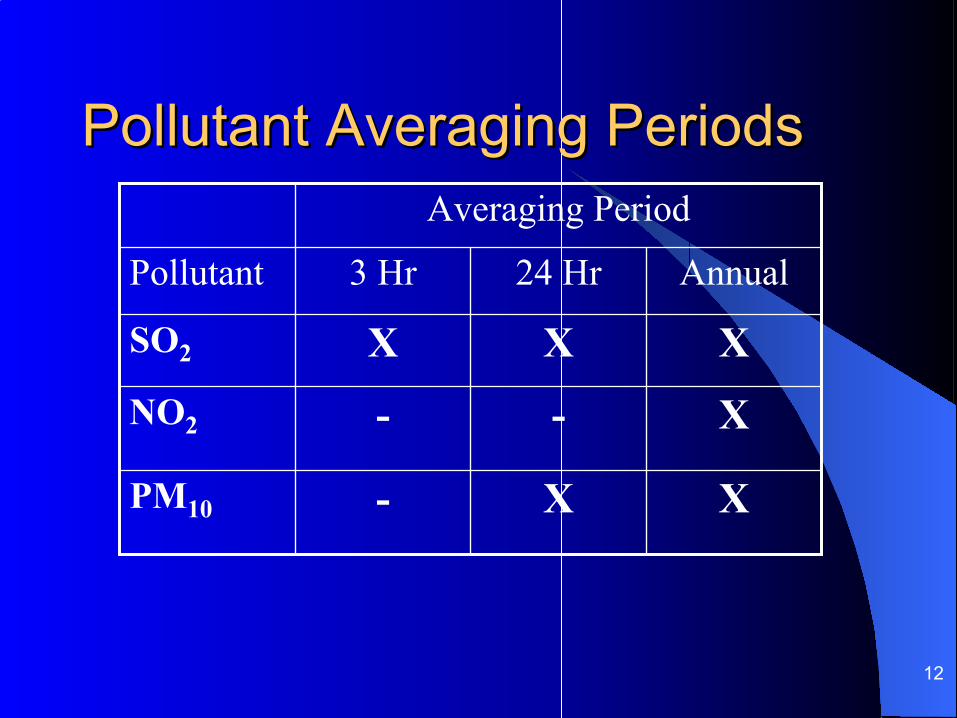
Pollutant Averaging PeriodsPollutant Averaging Periods
Annual24 Hr3 HrPollutant
X--NO2
XX-PM10
XXXSO2
Averaging Period
13
Hydrographic Area 76Hydrographic Area 76

14
Dispersion Modeling ResultsDispersion Modeling Results
Predicted PSD Increment ImpactHA 76
204.6Annual
916.324-Hour1
51222.43-Hour1
SO2 PSD Increment(µg/m3)
Predicted SO2 Increment
(µg/m3)
Averaging Period
1 Value presented is highest second high value.

15
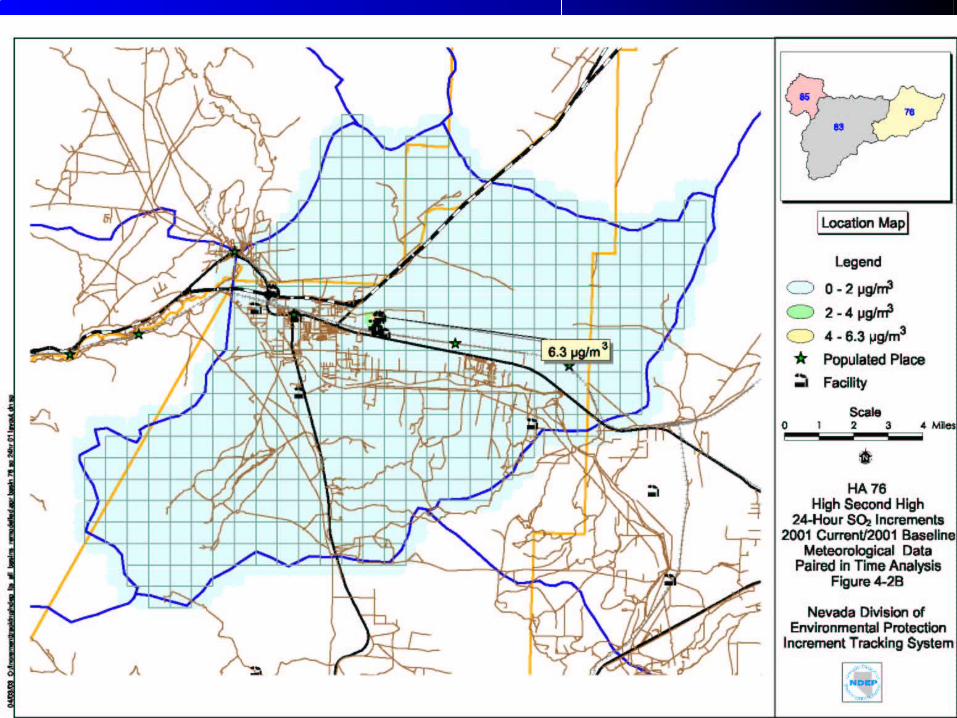
Modeling ResultsModeling ResultsHigh Second High HA76 S0High Second High HA76 S022 33--Hour IncrementHour Increment
512 512 µµg/mg/m33
16
Modeling ResultsModeling ResultsHigh Second High HA76 S0High Second High HA76 S022 2424--Hour IncrementHour Increment
91 91 µµg/mg/m33

17
Modeling ResultsModeling ResultsMaximum HA76 S0Maximum HA76 S022 Annual IncrementAnnual Increment
20 20 µµg/mg/m33

18
Hydrographic Area 85Hydrographic Area 85
19
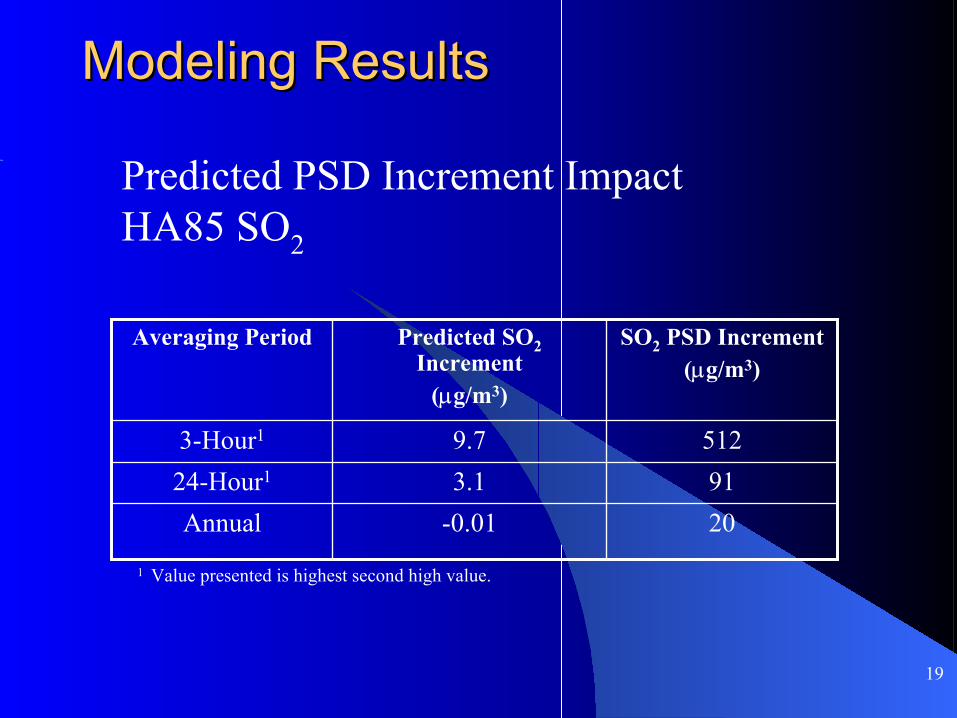
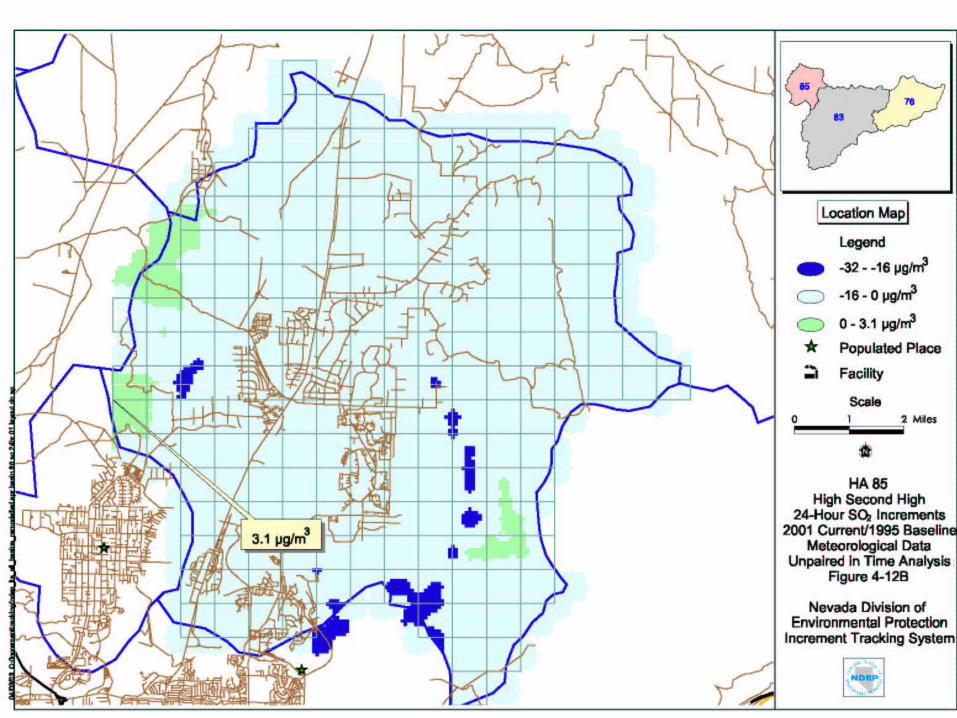
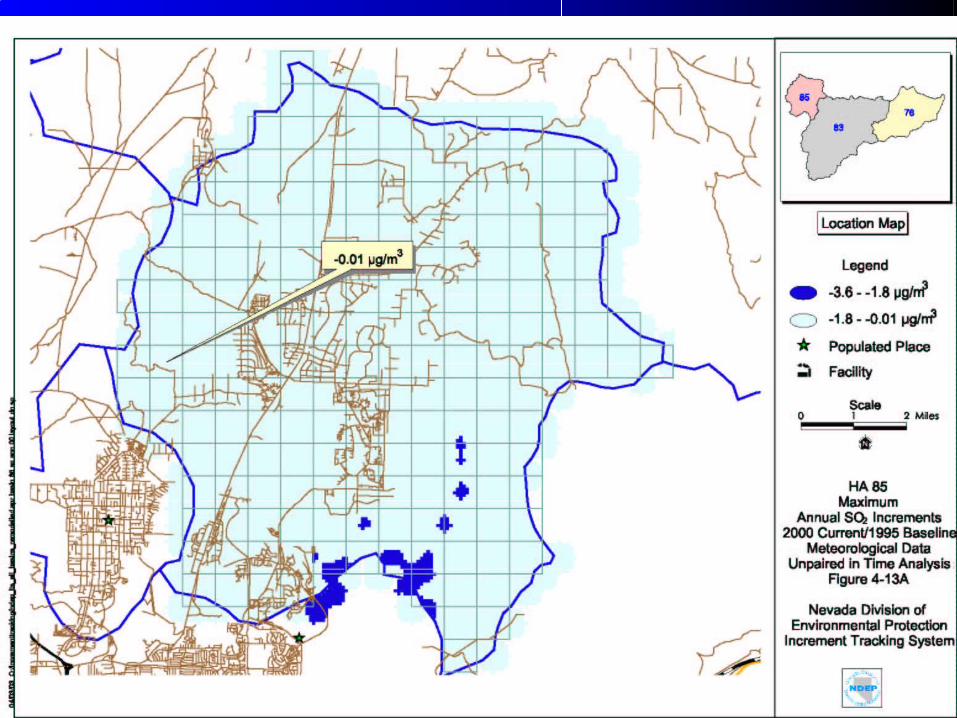
Modeling ResultsModeling Results
Predicted PSD Increment Impact HA85 SO2
20-0.01Annual913.124-Hour1
5129.73-Hour1
SO2 PSD Increment(µg/m3)
Predicted SO2 Increment
(µg/m3)
Averaging Period
1 Value presented is highest second high value.

20
Modeling ResultsModeling ResultsHigh Second High HA85 S0High Second High HA85 S022 33--Hour Increment ContoursHour Increment Contours
512 512 µµg/mg/m33
21
Modeling ResultsModeling ResultsHigh Second High HA85 S0High Second High HA85 S022 2424--Hour Increment Hour Increment ContoursContours
91 91 µµg/mg/m33
22
Modeling ResultsModeling ResultsMaximum HA85 S0Maximum HA85 S022 Annual Increment ContoursAnnual Increment Contours
20 20 µµg/mg/m33

23
Hydrographic Area 83Hydrographic Area 83

24
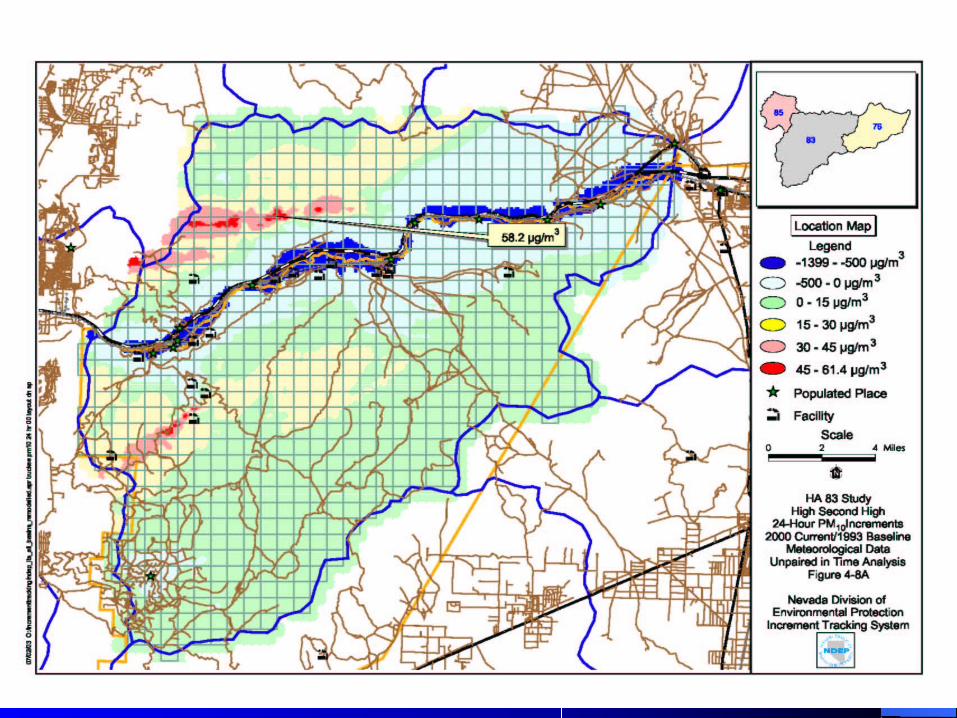
Modeling ResultsModeling Results
Predicted PSD Increment ImpactHA83 SO2, PM10, and NO2
2534.1AnnualNO2
1716.7Annual3058.224-Hour1PM10
200.02Annual9141.524-Hour1
51282.33-Hour1SO2
PSD Increment
(µg/m3)
Predicted Increment
(µg/m3)Averaging
PeriodPollutant
1 Value presented is Highest second high value. 2 NO2 results are based on screening level conversion factor of 0.75 to convert NOx to NO2.

25
Modeling ResultsModeling ResultsHigh Second High HA83 S0High Second High HA83 S022 33--Hour Increment Hour Increment ContoursContours
512 512 µµg/mg/m33

26
Modeling ResultsModeling ResultsHigh Second High HA83 S0High Second High HA83 S022 2424--Hour Increment Hour Increment ContoursContours
91 91 µµg/mg/m33

27
Modeling ResultsModeling ResultsMaximum HA83 S0Maximum HA83 S022 Annual Increment ContoursAnnual Increment Contours
20 20 µµg/mg/m33
28
Modeling ResultsModeling ResultsHigh Second High HA83 PMHigh Second High HA83 PM1010 2424--Hour Hour Increment ContoursIncrement Contours
30 30 µµg/mg/m33

29
Modeling ResultsModeling ResultsMaximum HA83 PMMaximum HA83 PM1010 Annual Annual Increment ContoursIncrement Contours
17 17 µµg/mg/m33

30
Modeling ResultsModeling ResultsMaximum HA83 N0Maximum HA83 N022 Annual Increment ContoursAnnual Increment Contours
25 25 µµg/mg/m33

31
Summary of ResultsSummary of ResultsHA 76 & 85HA 76 & 85
HA 76 & 85 - Modeled values are less than allowable increments.

32
Summary of ResultsSummary of ResultsHA 83HA 83
HA 83 - Modeled values of SO2 less than allowable increment.Modeled values of PM10, annual – near allowable increment. Modeled values indicate increment to be exceeded in select regions for:– PM10, 24-hr– NO2, Annual
33
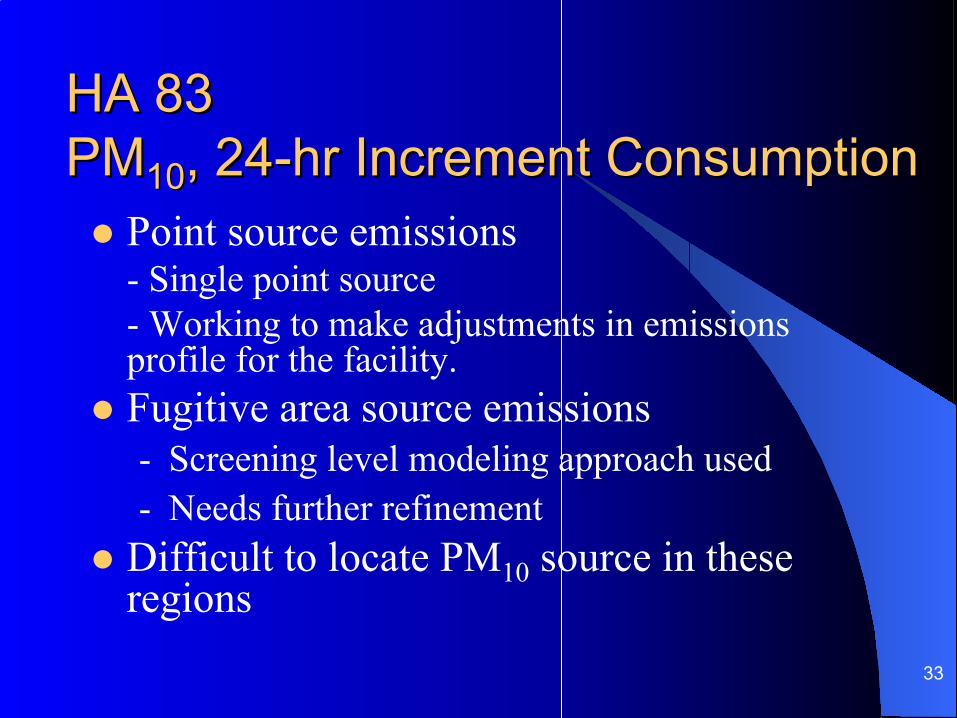
HA 83HA 83PMPM1010, 24, 24--hr Increment Consumptionhr Increment Consumption
Point source emissions- Single point source- Working to make adjustments in emissions profile for the facility.Fugitive area source emissions- Screening level modeling approach used- Needs further refinement
Difficult to locate PM10 source in these regions

34
35
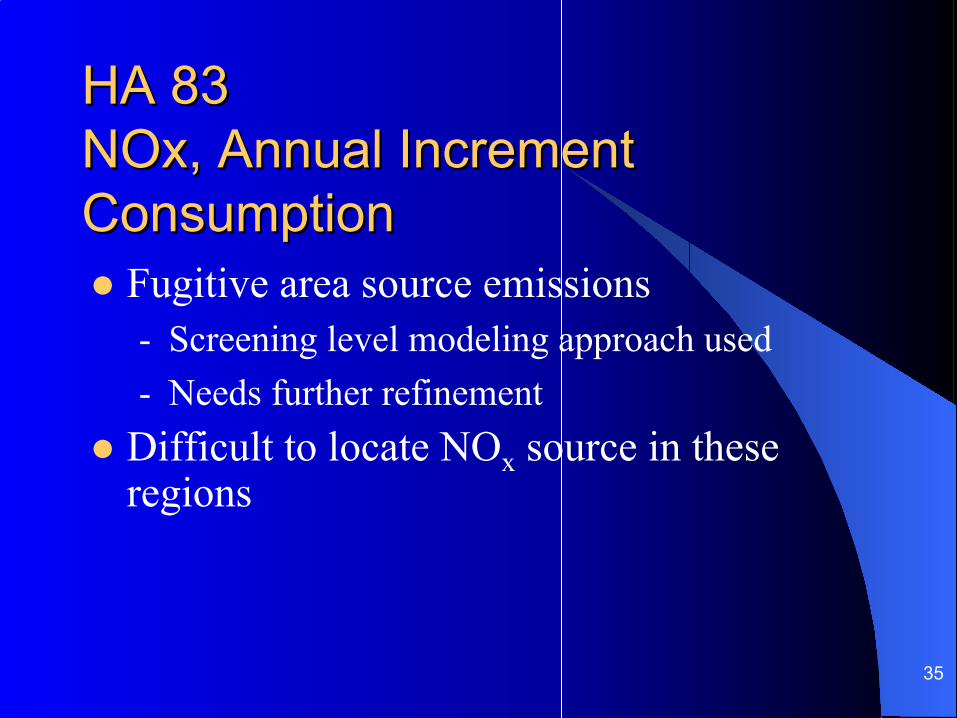
HA 83HA 83NOxNOx, Annual Increment , Annual Increment ConsumptionConsumption
Fugitive area source emissions- Screening level modeling approach used- Needs further refinement
Difficult to locate NOx source in these regions

36

37
Increment Tracking SystemIncrement Tracking SystemCustomizable 3-Dimensional Map of Modeled Pollutant Impacts
38
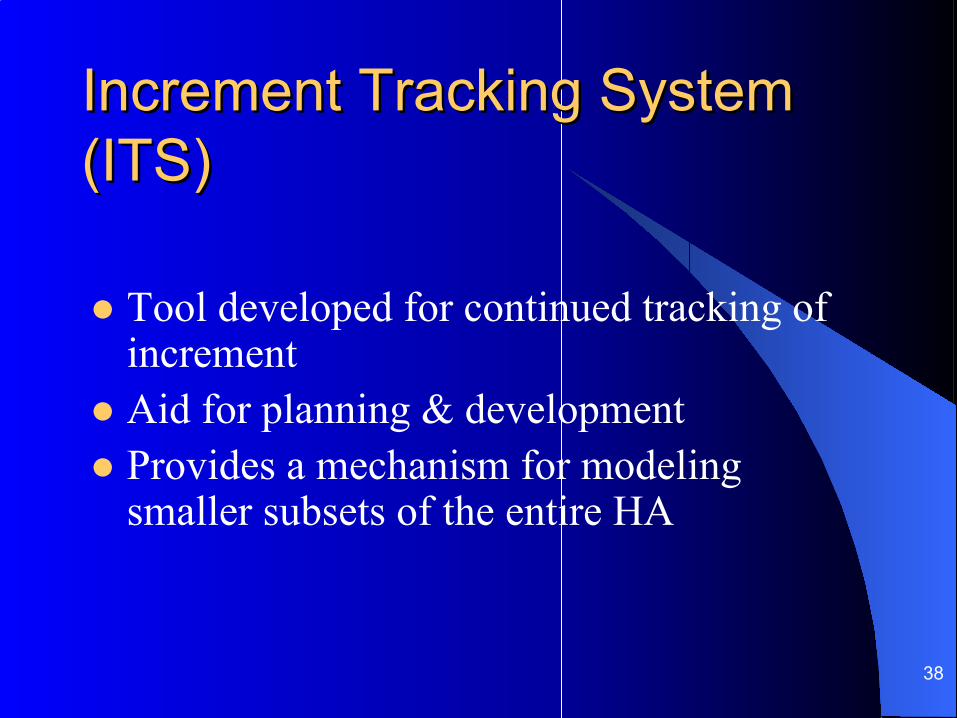
Increment Tracking SystemIncrement Tracking System(ITS)(ITS)
Tool developed for continued tracking of incrementAid for planning & developmentProvides a mechanism for modeling smaller subsets of the entire HA
39
Where to Get More InformationWhere to Get More Information
BAQP Web Site (www.ndep.nv.gov/baqp)
Nevada Air Regulations (http://www.leg.state.nv.us/NAC/NAC-445B.html)
Title 40 CFR Part 52.21PSD Workshop Manual (http://www.epa.gov/ttn/nsr/gen/wkshpman.pdf)
Plain English Guide to the Clean Air Act (http://www.epa.gov/oar/oaqps/peg_caa/pegcaain.html)

40
Important TermsImportant Terms
“Increment” – The maximum allowable increase in a pollutant’s concentration over the baseline concentration (40 CFR Part 52.21(c)).
“Baseline Concentration” – That ambient concentration level which exists in the baseline area at the time of the applicable minor source baseline date (40 CFR Part 52.21(b)(13)(i)).
“Baseline Area” – Any intrastate area (and every part thereof) designated as attainment or unclassifiable under section 107(d)(1)(D) or (E) of the Act in which a major source establishes the minor source baseline date (40 CFR Part 52.21(b)(15)(i)).
“Major Source” – Any specified category of stationary source which emits or has the potential to emit 100 ST/yr of any single pollutant; OR any other stationary source not specified which emits or has the potential to emit 250 ST/yr of any single pollutant. (40 CFR Part 52.21(b)(1)(i)).
“Minor Source Baseline Date” – The date on which a major stationary source or major modification subject to the PSD permitting requirements submits a complete application.

41
Questions?Questions?