Tropical Cyclone Quantitative Precipitation Forecasting · Tropical Cyclone Quantitative...
35
Tropical Cyclone Quantitative Precipitation Forecasting Russell Pfost Meteorologist-in-Charge National Weather Service Weather Forecast Office Miami, Florida
Transcript of Tropical Cyclone Quantitative Precipitation Forecasting · Tropical Cyclone Quantitative...

Tropical CycloneQuantitative Precipitation
Forecasting
Russell PfostMeteorologist-in-ChargeNational Weather ServiceWeather Forecast Office
Miami, Florida

Turn Around, Don’t Drown!
Even in Florida, people drive into ditches and canals!

Turn Around, Don’t Drown!
Sometimes with DISASTROUS results!

Tropical Cyclone Rainfall
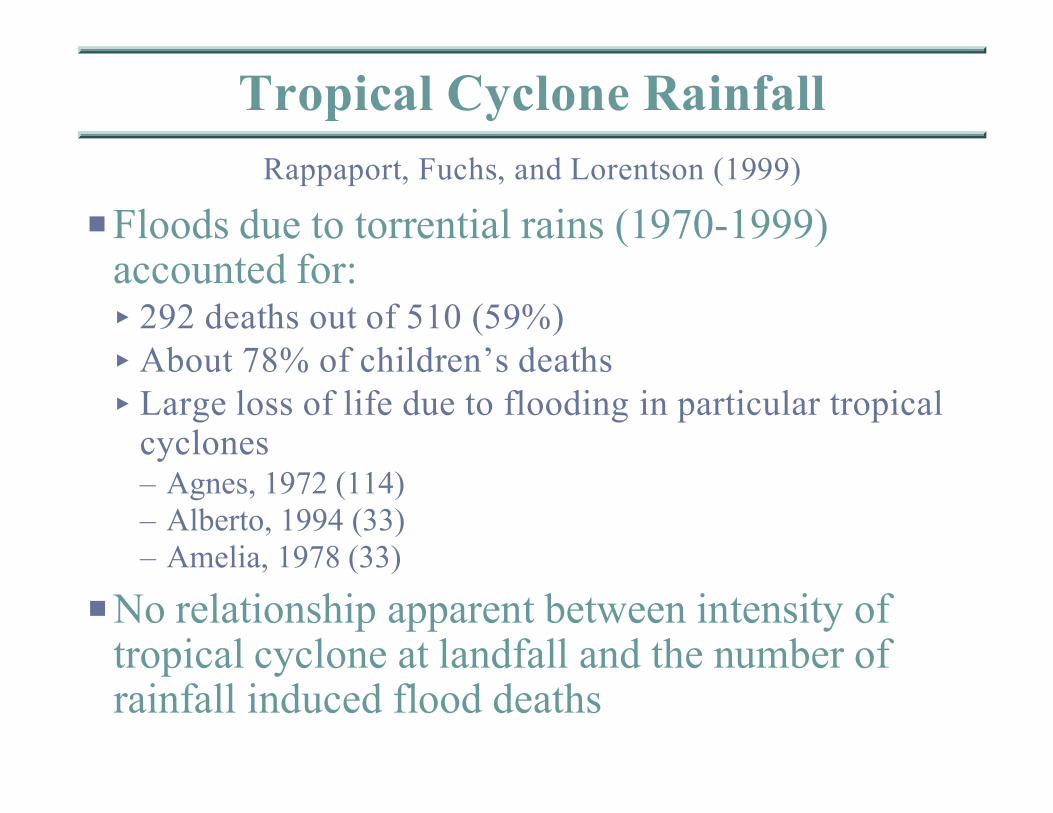
Rappaport, Fuchs, and Lorentson (1999)
PFloods due to torrential rains (1970-1999)accounted for:< 292 deaths out of 510 (59%)< About 78% of children’s deaths< Large loss of life due to flooding in particular tropical
cyclones– Agnes, 1972 (114)– Alberto, 1994 (33)– Amelia, 1978 (33)
PNo relationship apparent between intensity oftropical cyclone at landfall and the number ofrainfall induced flood deaths
Tropical Cyclone Rainfall
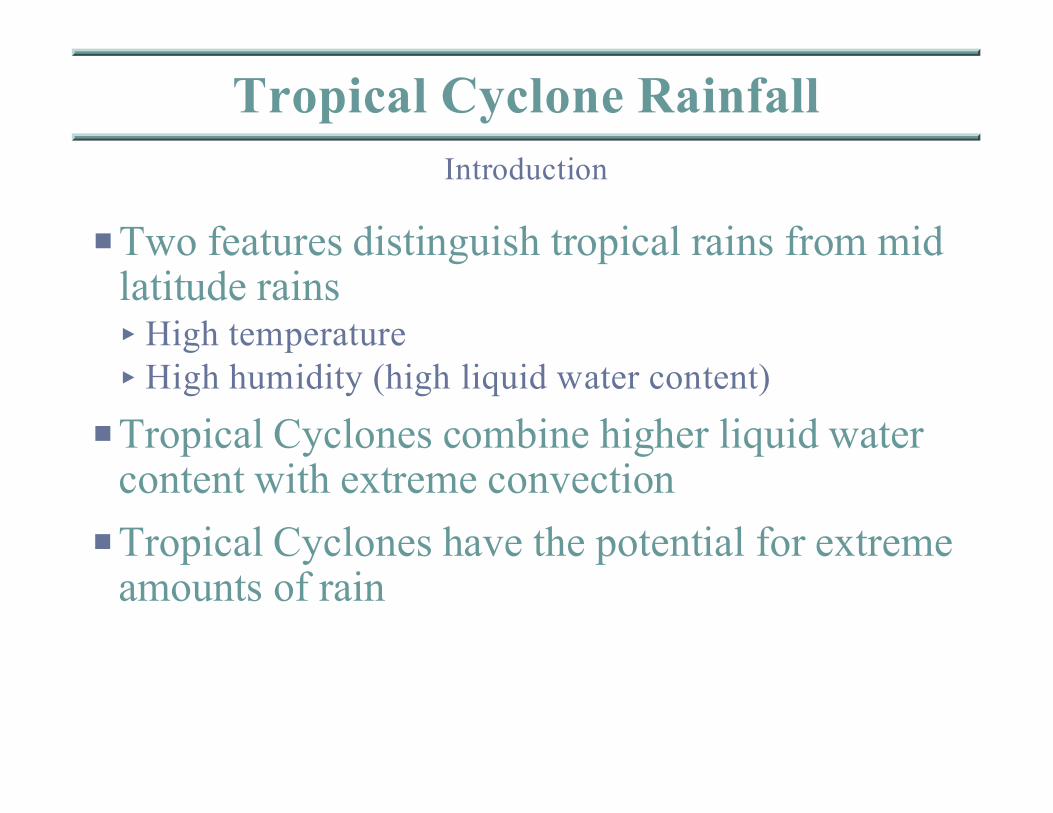
Introduction
PTwo features distinguish tropical rains from midlatitude rains< High temperature< High humidity (high liquid water content)
PTropical Cyclones combine higher liquid watercontent with extreme convection
PTropical Cyclones have the potential for extremeamounts of rain

Tropical Cyclone PrecipitationFactors to Consider
PMost rain occurs in the high wind area - estimatesare that not more than 50% is caught
PMovement, progression, size
PWidely differening values reported worldwide(trace to more than 100 inches (typhoon))
POccurrence often in late stages away from tropics
PLogarithmic distribution with radius
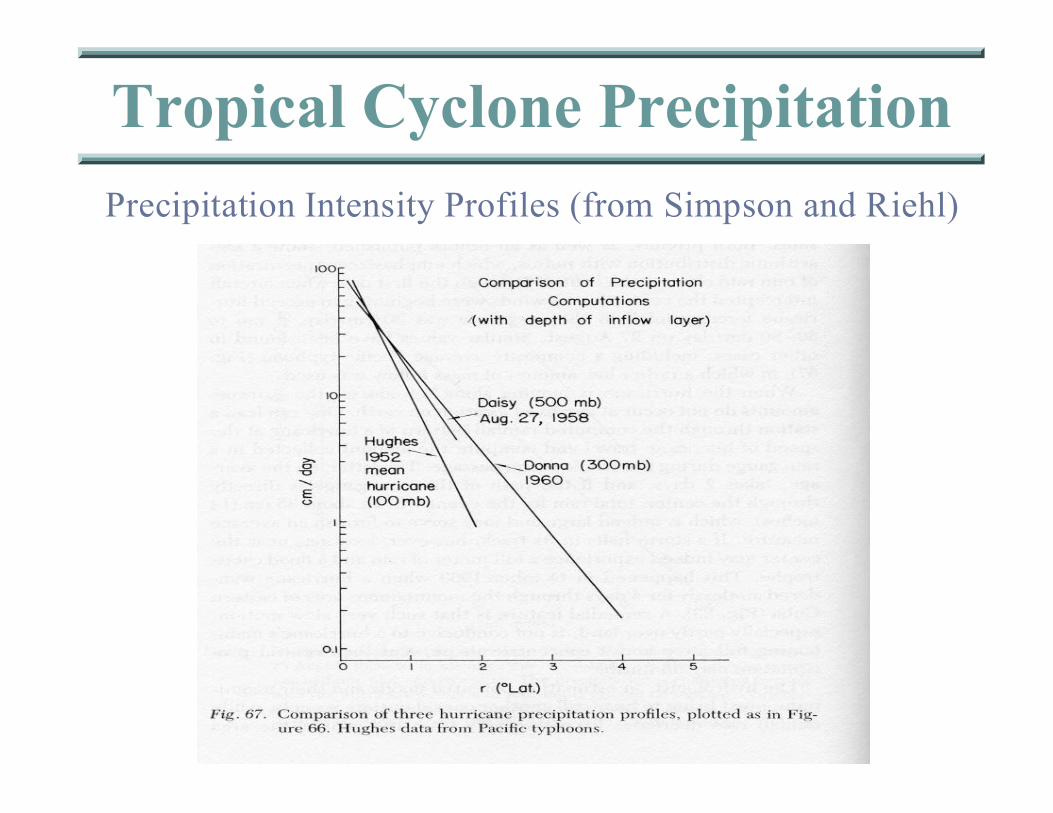
Tropical Cyclone Precipitation
Precipitation Intensity Profiles (from Simpson and Riehl)
Tropical Cyclone Rainfall
Characteristics
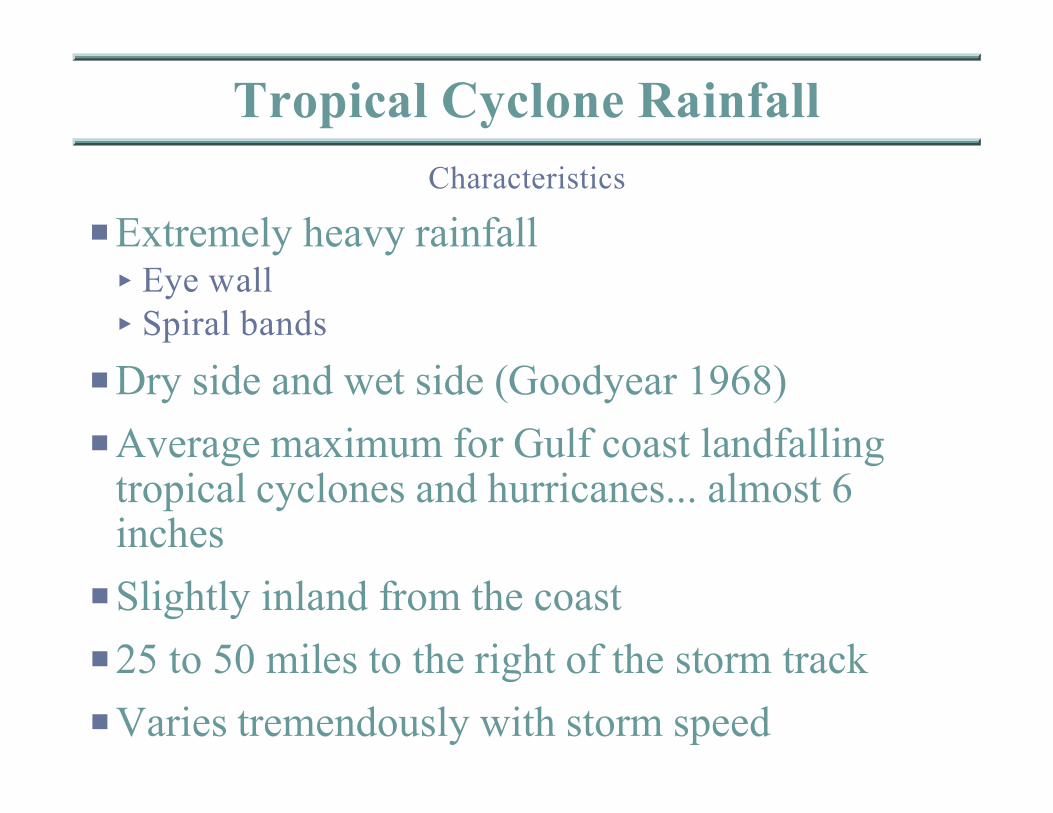
PExtremely heavy rainfall< Eye wall< Spiral bands
PDry side and wet side (Goodyear 1968)
PAverage maximum for Gulf coast landfallingtropical cyclones and hurricanes... almost 6inches
PSlightly inland from the coast
P25 to 50 miles to the right of the storm track
PVaries tremendously with storm speed

Average 48 hr Rainfall
46 Gulf coast tropical storms and hurricanes

Tropical Cyclone Rainfall PatternsTorrential Rains
PTypically 5 to 12 inches of rain in a hurricane
PVaries greatly depending on storm speed and size
PExtreme rainfall rates< 1.3 inches of rain in 10 minutes at Miami 1947< 6 inches of rain in one hour near Ft. Lauderdale 1947< 6 inches of rain in one hour at Hialeah 1947< 16.4 inches of rain in a few hours near Blountstown in
1926< 38.7 inches of rain in 24 hours at Yankeetown in 1950< 43 inches of rain in 24 hours at Alvin, TX, in 1979

Tropical Storm Alberto
July 1994
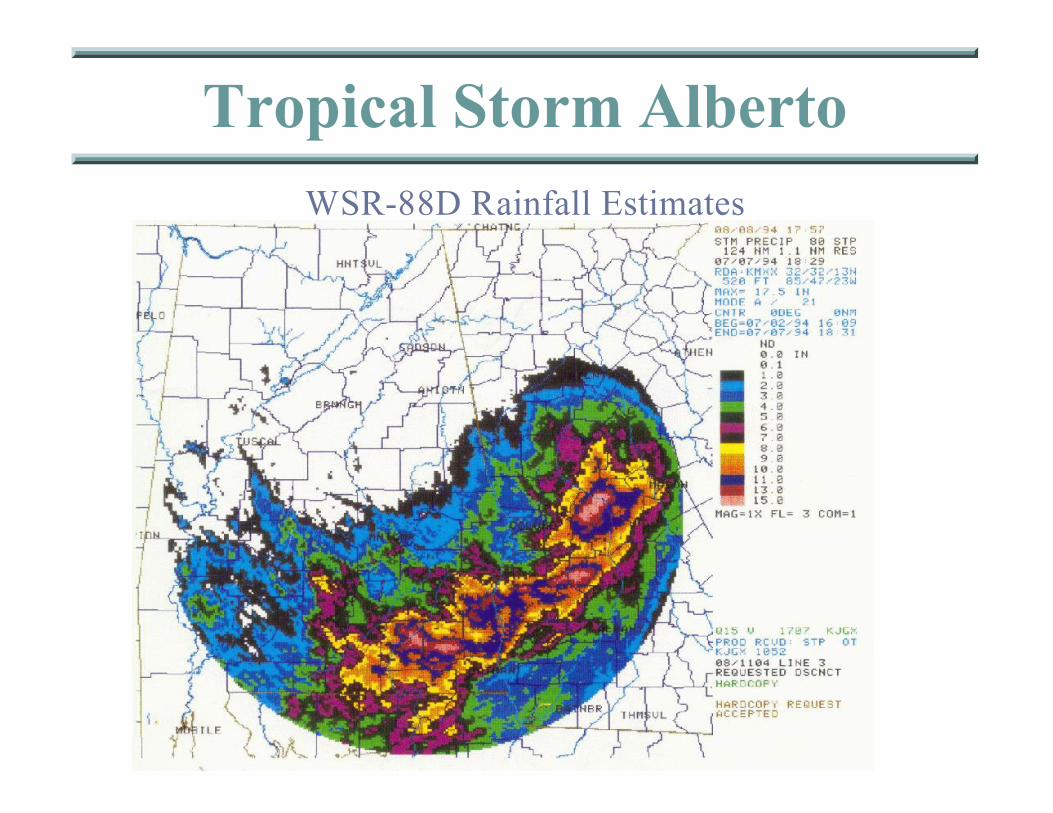
Tropical Storm Alberto
WSR-88D Rainfall Estimates

WSR-88D Doppler Radar
Factors to Remember
PReflectivity-Rainfall Relationships Z-R< Used to be only TWO authorized Z-Rs
– Standard Z-R Z=300R^1.4– Pretty good for thunderstorms and “normal” convection– Terrible for “low topped warm” convection
– Tropical Z-R Z=250R^1.2– Works for purely tropical cases– In some storms overestimates– New research suggests the tropical Z-R is too heavy handed
< When using WSR-88D rainfall estimates, especiallyfor tropical cyclones, find out which Z-R is in use!– Standard Z-R will grossly underestimate tropical rains– Tropical Z-R will grossly overestimate normal convection
especially north of 30 degrees N.

Hurricane Irene
WSR-88D Rainfall Estimates

Oct.3,2000 DisturbanceAnother Flood Episode for South Florida
What was the difference?
Irene 1999 event and the Oct. 3, 2000, disturbance event
POct. 3 more localized to Miami-Dade County
PMore rain (up to 17.5 inches, mostly 14-16 max)
PShorter time period (most fell in less than 18hours)
PUrban setting
PTrain echo effect over a localized area
PDrainage poor in areas that used to be a swamp

TRAIN ECHO EFFECT

Tropical Cyclone Rainfall PatternsDry or low-rainfall hurricanes
PUsually fast moving
P1941 Miami hurricane dropped less than .5 inch
PAndrew 1992 produced 7.5 inches at TamiamiAirport in Miami, but most amounts less than 4inches

Tropical Cyclone Rainfall PatternFlooding
PMany of Florida’s disastrous floods are the resultof tropical cyclone rainfall< Hurricane Dora 1964 - 23.73 inches at Mayo...
disastrous flooding N Florida including Live Oak< October 1924 hurricane - 23.22 inches at Marco
Island...flooding lasted for days< September-October 1948 - widespread flooding around
Lake Okeechobee (Clewiston, LaBelle) lasted for days< Tropical Storm Alberto 1994 - Apalachicola River< Tropical Storm Jerry 1995 - Collier County< Hurricane Irene 1999 - Southeast Florida

Hurricane Danny
Example of a stalled coastal storm

Hurricane Danny
Stalled coastal storm

Hurricane Danny
Rainfall Analysis

Kraft Rule of Thumb (old)1960s
PEstimated Maximum Rainfall for hurricanesaffecting the U.S. Gulf of Mexico coast
PMax Precipitation = 100 / Speed (kts)< Example... Andrew max precip forecast 100/17.5 = 5.7
inches< Actual max was 7.5 inches at Tamiami Airport< Good for a first guesstimate

Extreme Rainfall
Northern Gulf Coast LCH-AQQ

Extreme Rainfall
Florida Peninsula AQQ-JAX

Extreme RainfallRegression Results
PRemove Outliers below 6 knots movement
PGulf Coast landfall R = -0.039(movement) + 9.75< Standard deviation 3.3 inches
PFlorida landfall R = -0.063(movement) + 9.37< Standard deviation 3.2 inches

Extreme Rainfall Distribution
Florida Landfalls

Position of Extreme RainfallWhat have we learned?
PGulf Coast and Florida Peninsula Landfalls< 50 miles west (left) and up to 100 miles east (right) and
up to 100 miles inland of landfall spot< Approximately 9-10 inches +/- 3 inches in RFQ (6 kt
<movement<30 kt)< At least double forecast amounts movement less than 6
kt
PGreatest extreme rainfall threat usually removedfrom the track of the center of the tropicalcyclone
PTendency of public to focus on track of the center
NWS Guidance for Tropical Cyclone Rainfall
Primarily the Responsibility of the WFO
PNHC and HPC provide general QPF
PLocal WFO provides specifics down to thecounty level< Coordination with local Water Districts and Corps of
Engineers< Flood Watches< River Flood and Flash Flood Warnings< Short Term Forecast Updates and Flood Statements
based on WSR-88D trends< GET THE MESSAGE TO THE PUBLIC

FLOOD WATCHUncommon Product for Florida
PConditions are favorable for heavy rains andflooding during the watch period< Soil moisture high< Ground water level high< High runoff potential< Large amounts of rainfall likely< Poor drainage< Canals or rivers high and little capacity left to handle
more runoff
PMake preparations now for future flood problems

Urban Flood AdvisoryIntermediate Product
PProduct Issued for nuisance type flooding rains
PFlooding of underpasses and low lying areas
PFlooding of normally poorly drained areas
P Issued as a Flood Statement (FLS)

FLASH FLOOD WARNING
Uncommon Emergency Product
PFlooding is imminent or has been reported
PMeans that water will be or is now enteringhomes and businesses
PRequires immediate action to protect life andproperty
PDangerous driving conditions
PMost deaths due to floods are because peopleinsist on attempting to drive through flood waters
PDoesn’t take much water depth to float vehicles

South Florida afterHurricane Irene
Sun-Sentinel online

National Weather Service
Weather Forecast Office11691 SW 17th StreetMiami, Florida 33165
305-229-4502
http://miamiweather.infoEn español http://eltiempoenmiami.info