Trocaire College 2015 Fact Book with KPIs · Key Performance Indicators (KPIs) ... Total Loan Debt...
39
Fact Book 2015 – 2016 Prepared by: Dr. Dana Bagwell August, 2016 Note: The bulk of the information in this document reflects information from the 2015 - 2016 academic year. In some instances the data reflects the prior year data – because certain metrics have a lag of up to one year or more.
Transcript of Trocaire College 2015 Fact Book with KPIs · Key Performance Indicators (KPIs) ... Total Loan Debt...

Fact Book
2015 – 2016
Prepared by: Dr. Dana Bagwell
August, 2016
Note: The bulk of the information in this document reflects information from
the 2015 - 2016 academic year. In some instances the data reflects the
prior year data – because certain metrics have a lag of up to one year or
more.

Purpose
The purpose of the Trocaire College Fact Book is to provide college constituents with a regular and timely look at key measures of institutional effectiveness over the past several years. The main indicators presented include trends in student enrollment, student and faculty demographics, retention, graduation, job placement, and examination pass rates. In addition, student satisfaction data, derived from several surveys, and institutional monetary measures are presented. The Fact Book is typically updated annually by the Office of Assessment and Research and is made available to the internal college community. This Fact Book was finalized in August, 2016. The majority of the information reflects information from the 2015 - 2016 academic year but there is occasionally a lag of up to one year or more for some data metrics.
Contributing Data
Data were originally drawn from the college’s internal data system, the Comprehensive Academic Management System (CAMS). However, in order to calculate the majority of the indicators, data from the mid-semester census “Snapshots” (derived from CAMS data) are used. Snapshots are taken each fall on October 15 and in spring on March 15. Where appropriate, data reported within this Fact Book match data reported to the federal government’s Integrated Postsecondary Education Data System (IPEDS). IPEDS data are mandated to be reported to the federal government, and such data are made available to the public in various forms and on various government-sponsored web sites. Please note that data within this Fact Book may not match data in other reports as definitions and the time point in the semester when the data were drawn, among other factors, may impede direct comparison. Many offices across the college also contributed data to this report, including the Career Center within Student Affairs (Six Months Post-Graduation Survey), the Student Affairs Office (Graduating Students Survey) and the Human Resources Office (faculty and staff demographics).
Questions/Comments
Please address any questions or comments to:
Dr. Nicole Tomasello, Office of Assessment and Research [email protected]

P a g e | iii
Table of Contents
List of Tables .......................................................................................................................... iv List of Figures .......................................................................................................................... v Key Performance Indicators (KPIs) ........................................................................................ vii
I. AN INTRODUCTION TO TROCAIRE COLLEGE ........................................................ 8
Mission and Vision Statements .................................................................................... 8
II. TROCAIRE COLLEGE—PEOPLE, STRUCTURE, AND FINANCES ........................... 9
II.1. Board of Trustees ................................................................................................. 9 Trocaire College Board of Trustees – As of Spring 2015 .................................. 9 II.2. Administration of Trocaire College ...................................................................... 10 The President’s Council .................................................................................. 10 II.3. Faculty and Staff ................................................................................................... 9 II.4. Finances ............................................................................................................. 10 Operating Revenue, Expenses, and Surplus/Loss .......................................... 10 Tuition .............................................................................................................. 10
III. STUDENTS ................................................................................................................ 11
III.1. Enrollment .......................................................................................................... 11 Unduplicated enrollment……………………………………………………………..11 Fall Enrollment ................................................................................................ 11 Student Age .................................................................................................... 15 Prior Academic Performance .......................................................................... 15 Placement Tests……………………………………………………………………...16 Transitional Studies Program .......................................................................... 18 Student Residence .......................................................................................... 19 III.2. Retention ............................................................................................................ 21 III.3. Graduation ......................................................................................................... 22 Degrees Conferred: 2011 to 2015 ................................................................... 22 Graduation Within 150% of Normal Time ........................................................ 23 Graduates at Six Years Post-Initial Enrollment at Trocaire ................... 24 Average Time to Credential: Degree Programs and Certificate Programs ............................................................................. 25 III.4. First-Time Pass Rates on Licensing Examinations ............................................ 26 Nursing A.A.S. Licensing Exam: NCLEX-RN ................................................... 26 Practical Nursing Licensing Exam: NCLEX-PN ............................................... 28 Radiologic Technology Licensing Exam: ARRT Examination………………….. 29 Massage Therapy Licensing Exam: Massage Therapy Examination .............. 30 III.5. Job Placement/Continuing Education ................................................................ 30 III.6. Student Finances ............................................................................................... 31 Unmet Financial Need of Students: Tuition Minus Pell and TAP ..................... 31 Total Loan Debt Among Graduates ................................................................. 32 III.7. Student Satisfaction ........................................................................................... 34
IV. GLOSSARY OF TERMS ............................................................................................ 38
P a g e | iv
List of Tables
Table
1. Gender and Race of Faculty and Staff: Fall 2015............................................................... 9
2. Unduplicated Enrollment in Academic Programs: Fall 2015 ............................................ 14
3. Degrees and Certificates Conferred: 2011 to 2015 ......................................................... 23
4. Results of Six-Month Post-Graduation Employment Survey: 2010 to 2013 .................... 31

P a g e | v
List of Figures
Figure
1. Operating Surplus/Loss Compared to Total Revenue: 2011 to 2015 .............................. 10
2. Unduplicated Student Enrollment: Fall, Spring, and Summer Semesters ....................... 12
3. Unduplicated Total and Matriculated Fall Enrollment in Academic Programs:
Fall 2011 to Fall 2015 ............................................................................................... 13
4. Age of Trocaire Students: Fall 2011 to Fall 2015 ............................................................ 15
5. Average High School GPA Among First-Time Freshmen and Transfer
Students: Fall 2011 to Fall 2015 ................................................................................ 16
6. ACCUPLACER® Scaled Scores of First-Time Freshmen: 2011 to 2015 ......................... 17
7. ACCUPLACER® Scaled Scores of Transfer Students: 2011 to 2015 .............................. 18
8. Percent (of total enrollment) of Students Enrolled in Transitional Studies
Coursework: 2011 to 2015 ......................................................................................... 19
9. Sample of Student Residences Enrolled During Fall 2015 .............................................. 20
10. Fall-To-Fall Retention of First-Time Freshman by Enrollment
Status: Fall 2010 to Fall 2015 .................................................................................... 21
11. Fall-To-Fall Retention of All Students by Race/Ethnicity: Fall 2010 to Fall 2015 ............ 22
12. IPEDS Graduation Rates Among Full-Time, First-Time Freshman
Within 150% of Normal Time: 2010 to 2014 ............................................................... 24
13. Graduation Rates Among Full-Time, First-Time Freshman Six Years
Post-Initial Enrollment by Race: 2011 to 2015 ........................................................... 25
14. Average Time to Credential, in Years, by Full-Time, First-Time
Freshman and Transfer Students: 2010 to 2014 ....................................................... 26
15. Nursing A.A.S. First-Time Pass Rates on NCLEX-RN Licensing
Exam: 2011 to 2015 ................................................................................................... 27
16. Practical Nursing First-Time Pass Rates on NCLEX-PN Licensing
Exam: 2011 to 2015 ................................................................................................... 28
17. Radiologic Technology First-Time Pass Rates on ARRT
Exam: 2011 to 2015 ................................................................................................... 29
18. Massage Therapy First-Time Pass Rates on Massage Therapy
Exam: 2011 to 2015 ................................................................................................... 30

P a g e | vi
List of Figures (continued)
19. Unmet Financial Need of Students who Received the Maximum Pell Grant
and Maximum TAP Award: 2010 to 2015 .................................................................. 32
20. Average Total Loan Debt for Trocaire Graduates: 2010 to 2015 .................................... 33
21. Currently Enrolled Student Satisfaction: Quality of Instruction and
Value of Courses ....................................................................................................... 34
22. Currently Enrolled Student Satisfaction: Quality of Trocaire Services, Satisfaction With
Campus Facilities, and Satisfaction With Additional Areas ......................................... 35
23. Graduating Students Satisfaction: Student Satisfaction With Their
Overall Experience ..................................................................................................... 36
24. Graduating Students Satisfaction: Quality of Trocaire Services ..................................... 37
25. Graduating Students Satisfaction: Quality of Classroom and
Laboratory Facilities ................................................................................................... 37

P a g e | vii
Key Performance Indicators (KPIs)
The Assessment and Planning and Student Affairs Committee of the Board of Trustees requested in 2009 that a group of Key Performance Indicators (KPIs) be developed and reported on annually. At first, the KPIs were reported separately to the Board, but now the KPIs are integrated into the Fact Book.
1. Unduplicated Student Enrollment: Fall, Spring, and Summer Semesters .................. 12
2.1. Fall-To-Fall Retention of First-Time Freshman by Enrollment Status: Fall 2010 to Fall 2015 ................................................................................... 21
2.2. Fall-To-Fall Retention of All Students by Race/Ethnicity: Fall 2010 to Fall 2015……...22
3.1. IPEDS Graduation Rates Among Full-Time, First-Time Freshman
Within 150% of Normal Time: 2010 to 2014 ............................................................... 24
3.2. Graduation Rates Among Full-Time, First-Time Freshman Six Years Post-Initial Enrollment by Race: 2011 to 2015 .......................................................... 25
3.3. Average Time to Credential, in Years, by Full-Time, First-Time Freshman and Transfer Students: 2010 to 2014 ...................................................... 26
4.1. Nursing A.A.S. First-Time Pass Rates on NCLEX-RN Licensing Exam: 2011 to 2015 .................................................................................................. 27
4.2. Practical Nursing First-Time Pass Rates on NCLEX-PN Licensing Exam: 2011 to 2015 .................................................................................................. 28
4.3. Radiologic Technology First-Time Pass Rates on ARRT Exam: 2011 to 2015 .................................................................................................. 29
4.4. Massage Therapy First-Time Pass Rates on Massage Therapy Exam: 2011 to 2015 .................................................................................................. 30
5. Results of Six-Month Post-Graduation Employment Survey: 2010 to 2013 ............... 31
6. Operating Surplus/Loss Compared to Total Revenue: 2011 to 2015 ........................ 10
7.1. Unmet Financial Need of Students who Received the Maximum Pell Grant and Maximum TAP Award: 2010 to 2015 .................................................................. 32
7.2. Average Total Loan Debt for Trocaire Graduates: 2010 to 2015 .............................. 33
8.1.a. Currently Enrolled Student Satisfaction: Quality of Instruction and Value of Courses ....................................................................................................... 34
8.1.b. Currently Enrolled Student Satisfaction: Quality of Trocaire Services ........................ 35
8.1.c. Currently Enrolled Student Satisfaction: Satisfaction With Campus Facilities ............ 35
8.2.a. Graduating Students Satisfaction: Student Satisfaction With Their Overall Experience ..................................................................................................... 36
8.2.b. Graduating Students Satisfaction: Quality of Trocaire Services ................................. 37
8.2.c. Graduating Students Satisfaction: Quality of Classroom and Laboratory Facilities ………………….37
TROCAIRE COLLEGE – FACT BOOK
P a g e | 8
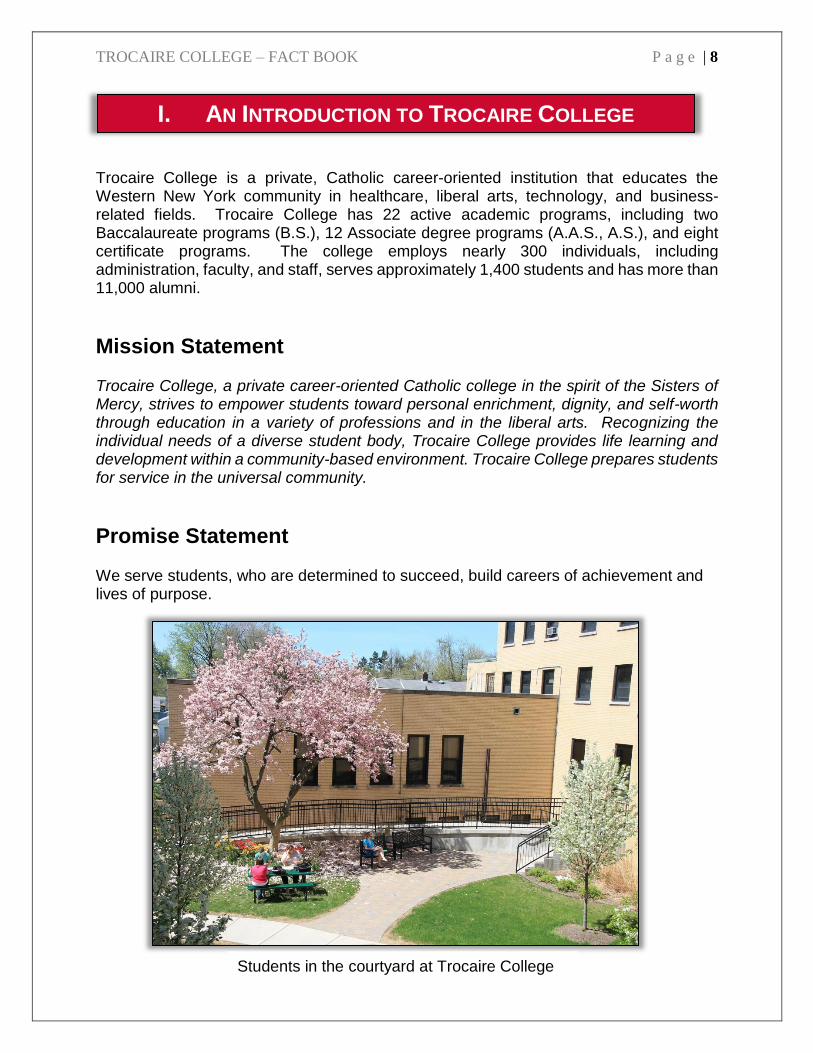
Trocaire College is a private, Catholic career-oriented institution that educates the Western New York community in healthcare, liberal arts, technology, and business-related fields. Trocaire College has 22 active academic programs, including two Baccalaureate programs (B.S.), 12 Associate degree programs (A.A.S., A.S.), and eight certificate programs. The college employs nearly 300 individuals, including administration, faculty, and staff, serves approximately 1,400 students and has more than 11,000 alumni.
Mission Statement Trocaire College, a private career-oriented Catholic college in the spirit of the Sisters of Mercy, strives to empower students toward personal enrichment, dignity, and self-worth through education in a variety of professions and in the liberal arts. Recognizing the individual needs of a diverse student body, Trocaire College provides life learning and development within a community-based environment. Trocaire College prepares students for service in the universal community.
Promise Statement We serve students, who are determined to succeed, build careers of achievement and lives of purpose.
I. AN INTRODUCTION TO TROCAIRE COLLEGE
Students in the courtyard at Trocaire College

TROCAIRE COLLEGE – FACT BOOK
P a g e | 9
Governing bodies of Trocaire College include the Board of Trustees and the President’s Council.
II.1. Board of Trustees The trustees of Trocaire College represent a wide variety of education, healthcare, business professionals, and Sisters of Mercy. The articles of incorporation of the college and by-laws require that a minimum of one-fourth but less than a majority of the members shall be Sisters of Mercy. Trocaire College Board of Trustees – as of Spring 2016
Jonathan T. Swiatkowski, C.P.A., Board Chair
Siobhan C. Smith, Board Vice Chair
Sharon Prise Azurin, Esq.
G. Richard Braen, M.D.
Sister JoAnne Courneen, R.S.M.,
Sister Mary Jeanne Thomas Danahy, R.S.M.
Bassam M. Deeb, Ph.D.
Thomas J. Gamble, Ph.D.
Brian A. Gould
Michele A. Ladouceur ‘01
Teresa A. Lawrence, Ph.D.
Sister Diane Matje, R.S.M.
James Notaro, Ph.D.
Sister Eileen O’Connor, R.S.M.
William A. Paladino
Thomas J. Quatroche, Jr., Ph.D.
Cynthia M. Rich
Nancy J. Sheehan, Esq.
Thomas H. Waring, Jr.
II. TROCAIRE COLLEGE – PEOPLE, STRUCTURE, AND FINANCES

TROCAIRE COLLEGE – FACT BOOK
P a g e | 10
II.2. Administration of Trocaire College
Dr. Bassam M. Deeb, President, is the Chief Executive Officer of Trocaire College. Assisting President Deeb with college operations are members of the college administration who serve on the President’s Council.
The President’s Council
Council Member1 Role
Tony Funigiello, M.A. Chief Student Affairs Officer
Jack J. Hudack, B.A. Vice President for Finance
Richard T. Linn, Ph.D. Vice President for Academic Affairs and Planning
Jacqueline Matheny, M.S. Chief Enrollment Officer
Janet Peters, M.S. Chief Human Resources Officer
Pamela Witter, B.A. Vice President, Development and Community Engagement
1alphabetical by last name
II.3. Faculty and Staff Trocaire College employs 286 full-time/part-time staff and full-time/part-time faculty. The majority (average 80.3%) of faculty and staff are female, and most (average 93.2%) faculty and staff are Caucasian (see Table 2).
Table 1. Gender and Race of Faculty and Staff: Spring 2016
Gender
Race
N %
Female
%
Male
%
Unknown
%
Caucasian
%
Minority
%
Unknown
Full-Time Faculty
46 76.0% 24.0% 0%
95.6% 4.4% 0%
Part-Time Faculty
147 76.0% 24.0% 0%
89.0% 11.0% 2.1%
Full-Time Staff
77 75.3% 24.7% 0%
88.3% 11.7% 0%
Part-Time Staff
16 93.7% 6.3% 0%
100.0% 16.7% 0%

TROCAIRE COLLEGE – FACT BOOK
P a g e | 11
II.4. Finances
Operating Revenue, Expenses, and Surplus/Loss.
The institution’s operating surplus/loss is equal to the total operating revenue minus all expenses. Trocaire has recorded budget surpluses for each of the previous five years (see Figure 1).
Figure 1. Operating Surplus/Loss Compared to Total Revenue: 2010 to 20151
Tuition The college depends on tuition, in large measure, for revenue generation. Tuition charges for a full-time student for the 2015-2016 academic year (fall and spring semesters) were $15,970, an increase from $15,500 in 2014-2015. Part-time tuition costs were $660 per credit hour. Increases in tuition have generally occurred to offset increases in expenses.
$0
$2,000,000
$4,000,000
$6,000,000
$8,000,000
$10,000,000
$12,000,000
$14,000,000
$16,000,000
$18,000,000
$20,000,000
$22,000,000
2011 2012 2013 2014 2015
Total Revenue Total Expenses Surplus
1Key Performance Indicator – 6.

TROCAIRE COLLEGE – FACT BOOK
P a g e | 12
Trocaire is a tuition-driven institution significantly dependent on student enrollment. Within this section, the reader will find data on student enrollment numbers, as well as information on student demographics (sex, age, race/ethnicity), and student characteristics (new student status, prior academic performance, academic program, and full-time status). Recruiting, enrolling, and retaining students is integral to Trocaire’s Mission. To fulfill its Mission, Trocaire seeks to retain students from one semester to another, help them complete their program of study, and ensure students graduate within a timely manner. Under the section, Retention, are data on fall-to-fall retention of students. Under Graduation, we present various ways of looking at student program completion and graduation. It is important to note that the varied definitions of retention and graduation (e.g., within federally-mandated IPEDS, New York State mandated HEDs reports, etc.) dictate which numbers and at what time in the semester such numbers are utilized in calculations. However, since these mandated measures are frequently based upon only the entering class of first-time freshmen, and since Trocaire typically enrolls many more transfer students than first-time freshmen, other measures of student outcomes have been calculated in an attempt to provide a more balanced perspective on student achievement.
It is expected that Trocaire students will master the relevant skills of their degree, earn a respected credential, and also procure the knowledge and skills necessary for employment post-graduation. To ensure that it is meeting its Mission to prepare students for a career and service in the universal community, the college monitors not only retention and graduation rates, but also licensing examination pass rates, and post-graduation job placement. Data for these areas are in the sections entitled First-Time Pass Rates on Licensing Examinations and Job Placement/Continuing Education. This chapter also provides data on student finances focusing, in particular, on the financial commitment students make to attend Trocaire. Lastly, data from various surveys provide information on student’s satisfaction with Trocaire.
III.1. Enrollment
Unduplicated Enrollment by Academic Year.
Approximately 1,300 unique students are enrolled in the college each fall and spring semester. Figure 2 depicts the unduplicated twelve month enrollment as reported to IPEDS for the listed years. Unduplicated figures across a specified time frame count students only once, even if they enrolled in both the fall and spring semesters. As can been seen, unduplicated figures for an academic year fall generally in the range of 1,900 students.
III. STUDENTS

TROCAIRE COLLEGE – FACT BOOK
P a g e | 13
Figure 2. Unduplicated Student Enrollment: Fall, Spring, and Summer Semesters1
Fall Enrollment.
The fall enrollment headcount is comprised of both the number of new students (including first-time freshmen and transfer students), as well as the number of continuing students. Figure 3 shows the numbers of students enrolled at the college each fall from 2011 through 2015. Figure 3 provides unduplicated totals for both matriculated and the combination of matriculated and non-matriculated students. Matriculated students are those enrolled in one of Trocaire’s degree or certificate programs. Non-matriculated students include students auditing courses, as well as high school students who are taking some college courses for credit while still enrolled in high school. In general, fall enrollment numbers have declined from fall 2011 to fall 2015. For example, whereas slightly more than 1,400 students were matriculated in fall 2011, in fall 2015 the number of matriculated students had dropped to 1,230. These declines in enrollment were generally similar to declines experienced by most area colleges and universities. In fall 2015, Trocaire students were largely female (87.4%), Caucasian (68.8%), and older (average age 26.2 years) than traditional-aged college students.
FALL 2009 -SUMMER 2010
FALL 2010 -SUMMER 2011
FALL 2011 -SUMMER 2012
FALL 2012 -SUMMER 2013
FALL 2013 -SUMMER 2014
1538
1961 19171889 1860
Enro
llme
nt
Tota
l
1Key Performance Indicator – 1.

TROCAIRE COLLEGE – FACT BOOK
P a g e | 14
Figure 3. Unduplicated Total and Matriculated Fall Enrollment in Academic Programs: Fall 2011 to Fall 2015
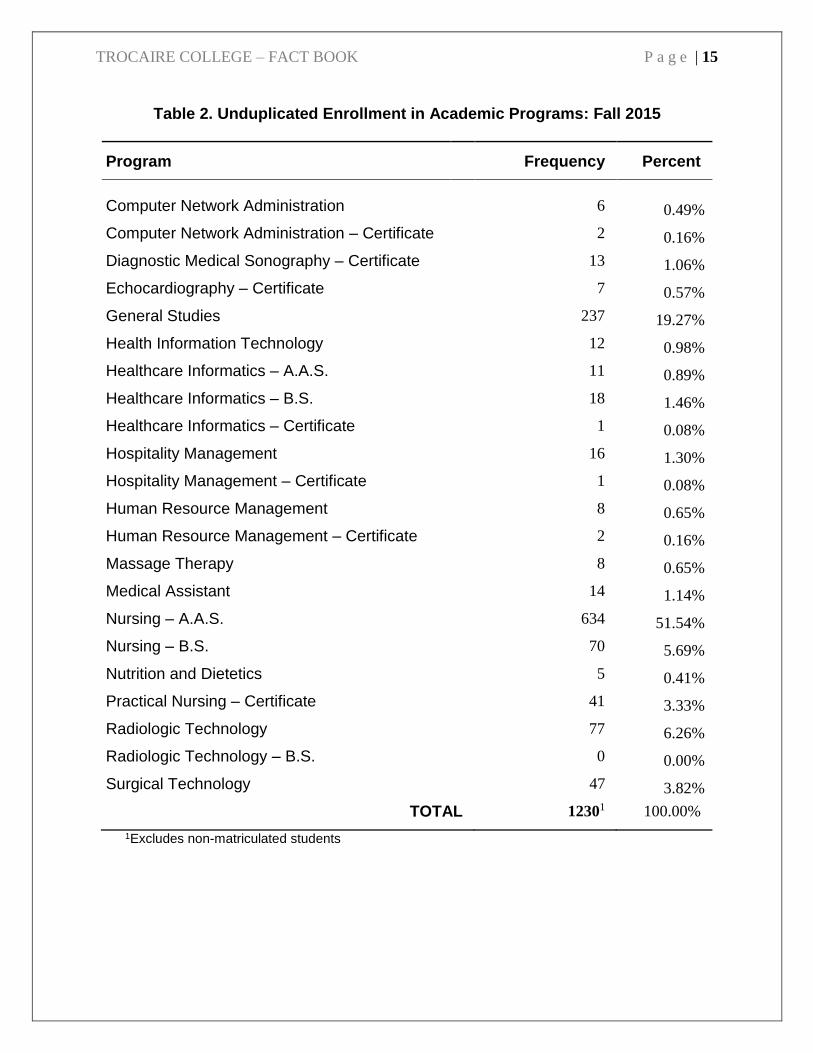
Most students at Trocaire are enrolled in health-related programs. Table 2 details the fall 2015 enrollment numbers by academic program where Nursing A.A.S. (n = 634) is the largest program at Trocaire. In fact, the Nursing A.A.S. program enrollment accounts for a little over one-half of the total enrollment at Trocaire (see Table 2). The large number of students in General Studies primarily reflects students with outstanding prerequisite coursework who enter General Studies prior to moving into their academic program of choice. Very few students who start in General Studies actually graduate from this program.
TROCAIRE COLLEGE – FACT BOOK
P a g e | 15
Table 2. Unduplicated Enrollment in Academic Programs: Fall 2015
Program Frequency Percent
Computer Network Administration 6 0.49%
Computer Network Administration – Certificate 2 0.16%
Diagnostic Medical Sonography – Certificate 13 1.06%
Echocardiography – Certificate 7 0.57%
General Studies 237 19.27%
Health Information Technology 12 0.98%
Healthcare Informatics – A.A.S. 11 0.89%
Healthcare Informatics – B.S. 18 1.46%
Healthcare Informatics – Certificate 1 0.08%
Hospitality Management 16 1.30%
Hospitality Management – Certificate 1 0.08%
Human Resource Management 8 0.65%
Human Resource Management – Certificate 2 0.16%
Massage Therapy 8 0.65%
Medical Assistant 14 1.14%
Nursing – A.A.S. 634 51.54%
Nursing – B.S. 70 5.69%
Nutrition and Dietetics 5 0.41%
Practical Nursing – Certificate 41 3.33%
Radiologic Technology 77 6.26%
Radiologic Technology – B.S. 0 0.00%
Surgical Technology 47 3.82%
TOTAL 12301 100.00%
1Excludes non-matriculated students

TROCAIRE COLLEGE – FACT BOOK
P a g e | 16
Student Age.
The majority of Trocaire students are nontraditional—defined as over the age of 22 years. For example, across the past five fall semesters, the average age of Trocaire students was nearly 27 years of age (26.6 years). Figure 4 depicts the percentages of certain age categories from fall 2011 to fall 2015. Although Figure 4 shows that the majority of students are aged 23 or older, the figure also demonstrates that almost 1/3 of the enrolled student body is aged 22 or lower. This pattern indicates that the college attracts a mix of both traditional and non-traditional-aged students, but that the non-traditional-aged students predominate.
Figure 4. Age of Trocaire Students: Fall 2011 to Fall 2015
Prior Academic Performance – High School GPA and GED.
To evaluate a prospective student’s likelihood to succeed, the college requests information about their prior academic performance. For most traditional students, the commonly available measure of prior academic performance is the student’s high school Grade Point Average (GPA). The average high school GPA of new entering students—including transfer students and first-time freshman—has remained at or slightly above 80 (i.e., a grade of “B”). Figure 5 displays the trends in average GPA from fall 2011 through fall 2015.
0%
10%
20%
30%
40%
50%
60%
70%
80%
90%
100%
FALL 2011 FALL 2012 FALL 2013 FALL 2014 FALL 2015
22 Years & Below 23-35 Years 36 Years & Above

TROCAIRE COLLEGE – FACT BOOK
P a g e | 17
Figure 5. Average High School GPA Among First-Time Freshmen and Transfer Students: Fall 2011 to Fall 2015
Some students, and particularly those who are non-traditional, may not have completed high school and may not be able to provide a high school GPA. In lieu of a traditional high school diploma, these students must take and pass the General Education Development Tests (GED). At Trocaire, approximately 5% of first-time freshman hold the GED credential rather than having a high school diploma. Nationally, 95% of colleges and universities accept the GED credential for students who otherwise meet the qualifications for admission. Those passing the GED tests have demonstrated a level of knowledge equal to or greater than 40% of graduating high school seniors. Placement Tests. Incoming students, particularly those without prior college experience, are required to complete placement tests to ensure that they are ready for college-level work. The number and type of tests may depend upon the academic program the student wishes to enter, as well as the student’s prior academic experience. Trocaire uses the ACCUPLACER© tests produced by the College Board as its placement exams. In particular:
All incoming students are required to complete the ACCUPLACER© arithmetic subtest.
Any student without prior post-high school coursework is required to complete the Reading, Sentence Skills, and Arithmetic ACCUPLACER© subtests.
TROCAIRE COLLEGE – FACT BOOK
P a g e | 18
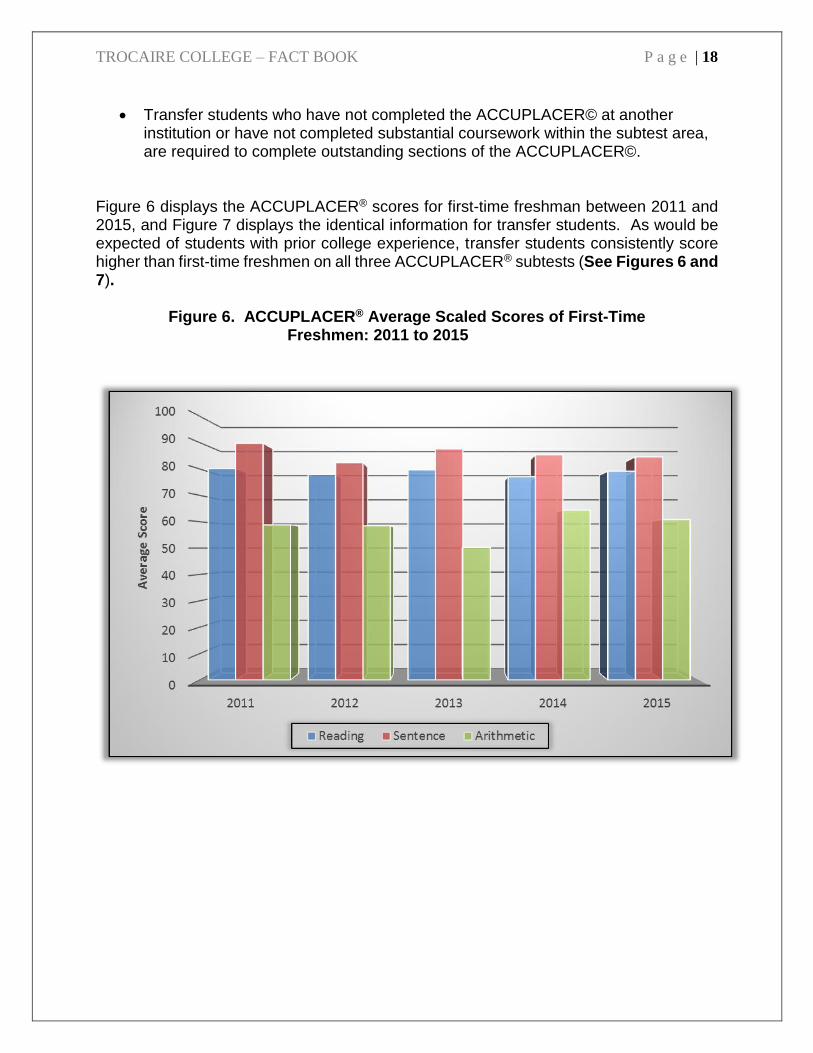
Transfer students who have not completed the ACCUPLACER© at another institution or have not completed substantial coursework within the subtest area, are required to complete outstanding sections of the ACCUPLACER©.
Figure 6 displays the ACCUPLACER® scores for first-time freshman between 2011 and 2015, and Figure 7 displays the identical information for transfer students. As would be expected of students with prior college experience, transfer students consistently score higher than first-time freshmen on all three ACCUPLACER® subtests (See Figures 6 and 7).
Figure 6. ACCUPLACER® Average Scaled Scores of First-Time Freshmen: 2011 to 2015

TROCAIRE COLLEGE – FACT BOOK
P a g e | 19
Figure 7. ACCUPLACER® Average Scaled Scores of Transfer Students:
2011 to 2015
Transitional Studies Program
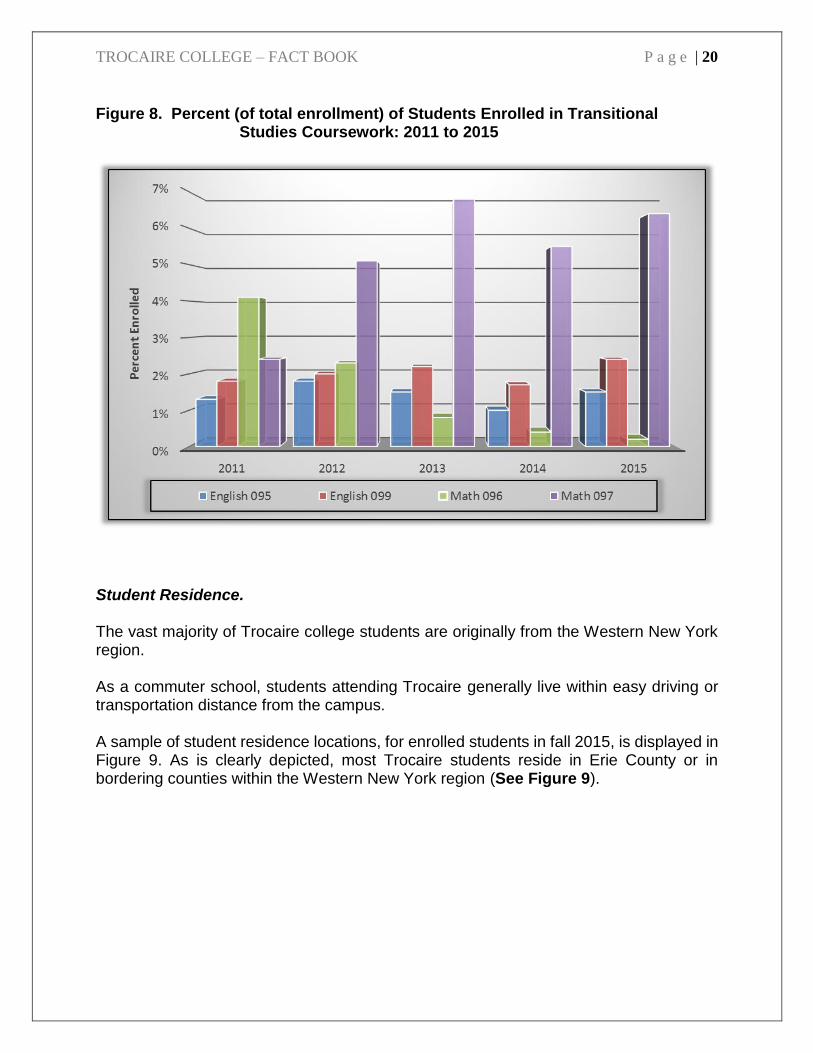
The results of ACCUPLACER© are used to identify students who need remediation in the assessed areas. Trocaire offers remedial coursework within its Transitional Studies Program for students scoring below the subtest cutoffs. Each year, a small group of students attend remedial courses where they receive personalized instruction designed to prepare them for college-level coursework. Students who attend two or more remedial education courses are automatically enrolled into the Transitional Studies Program. Figure 8 displays the percentage of students enrolled in at least one remedial course between 2011 and 2015.
TROCAIRE COLLEGE – FACT BOOK
P a g e | 20
Figure 8. Percent (of total enrollment) of Students Enrolled in Transitional
Studies Coursework: 2011 to 2015
Student Residence. The vast majority of Trocaire college students are originally from the Western New York region. As a commuter school, students attending Trocaire generally live within easy driving or transportation distance from the campus. A sample of student residence locations, for enrolled students in fall 2015, is displayed in Figure 9. As is clearly depicted, most Trocaire students reside in Erie County or in bordering counties within the Western New York region (See Figure 9).

TROCAIRE COLLEGE – FACT BOOK
P a g e | 21
Fig
ure
9.
Sam
ple
of
Stu
den
t R
esid
en
ce
s E
nro
lled
Du
rin
g F
all
201
5

TROCAIRE COLLEGE – FACT BOOK
P a g e | 22
III.2. Retention Recruiting and enrolling students is important, but to fulfill its mission, Trocaire aims to retain students until they graduate. Students enrolled in a fall term and who either graduated or reenrolled in the subsequent fall term are counted as “retained”. To measure success in this area, two different measures of retention rates are calculated:
1. The first retention rate is the official federal IPEDS rate, and reflects only first-time students enrolled in one fall and still enrolled in the subsequent fall. The average fall-to-fall retention of full-time, first-time freshman was 58% for the years 2010-2015. The average retention of part-time, first-time freshman from fall 2008 through fall 2015 was 63% (see Figure 10).
2. The second retention rate is based upon the status of all students – not just first-time. For example, whereas in the first retention rate transfer students are not counted, in this second rate all students enrolled in one fall semester are included and then tracked to see if they have returned (or graduated) by the subsequent fall. Fall-to-fall retention of all students averages to nearly 68% (67.9%). The retention of African American students, conversely, was between 50% (in 2013-2014) and 65.3% (in 2012-2013) while the retention of Caucasian students, during the same time points was 68.7% and 82.5% (see Figure 11).
Figure 10. Fall-to-Fall Retention of First-Time Freshman by Enrollment Status: Fall 2010 to Fall 20151
0%
10%
20%
30%
40%
50%
60%
70%
80%
90%
100%
FALL 2010 TO FALL 2011
FALL 2011 TO FALL 2012
FALL 2012 TO FALL 2013
FALL 2013 TO FALL 2014
FALL 2014 TO FALL 2015
58%61%
58%63%
59%
69%65%
48%
63% 62%
Pe
rce
nt
Ret
ain
ed
Full-Time, First-Time Freshman Part-Time, First-Time Freshman
1Key Performance Indicator – 2.1.

TROCAIRE COLLEGE – FACT BOOK
P a g e | 23
Figure 11. Fall-to-Fall Retention of All Students by Race/Ethnicity: Fall 2010 to Fall 20151
III.3. Graduation
There are many indicators of how well a college facilitates student program completion and graduation, which are keys to students’ future successes. Four measures are:
1. The “outputs” of the college – the number of degrees/certificates conferred by each program, by year;
2. The federal IPEDS graduation rate, calculated as the percentage of each fall cohort of full-time, first-time freshmen who graduate within 150% of normal time;
3. A calculation of how long (in years) it took Trocaire graduates to achieve their credential; and,
4. The percentage of students who graduated within 6 years after beginning at Trocaire.
Degrees Conferred: 2011 to 2015. Over the past five years (2011-2015), 384 degrees and certificates were conferred each year, on average, to Trocaire students. Nursing and Practical Nursing graduates account for approximately 68% (68.1%) of the credentials conferred each year (see Table 3).
0.0%
10.0%
20.0%
30.0%
40.0%
50.0%
60.0%
70.0%
80.0%
90.0%
100.0%
FALL 2010 TO FALL 2011
FALL 2011 TO FALL 2012
FALL 2012 TO FALL 2013
FALL 2013 TO FALL 2014
FALL 2014 TO FALL 2015
Pe
rce
nt
Re
tain
ed
Caucasian Other African American
1Key Performance Indicator – 2.2.

TROCAIRE COLLEGE – FACT BOOK
P a g e | 24
Table 3. Degrees and Certificates Conferred: 2011 to 2015
Degree Program
Graduation Year
2011 2012 2013 2014 2015
Computer Network Administration 3 3 0 6 0
Computer Network Administration (Cert.) 6 1 6 2 1
Diagnostic Medical Sonography (Cert.) 10 10 11 9 9
Echocardiography (Cert.) 6 8 8 5 7
General Studies 2 2 8 8 2
Health Information Technology 5 4 6 4 6
Healthcare Informatics 0 0 0 3 1
Healthcare Informatics (Cert.) 0 0 0 3 3
Hospitality Management 14 18 14 9 8
Hospitality Management (Cert.) 0 0 0 0 1
Human Resource Management 4 6 4 3 1
Human Resource Management (Cert.) 2 3 2 2 1
Liberal Arts and Sciences 1 1 0 0 0
Massage Therapy 3 3 3 3 6
Massage Therapy (Cert.) 0 0 3 2 1
Medical Assistant 1 3 6 2 3
Nursing 132 198 227 219 194
Nursing – B.S. 0 5 10 10 25
Nutrition and Dietetics 0 7 2 2 5
Practical Nursing (Cert.) 62 73 86 73 51
Radiologic Technology 27 39 31 32 35
Radiologic Technology – B.S. 0 6 2 0 0
Surgical Technology 20 13 9 9 12
TOTALS 301 403 435 406 372
Graduation Within 150% of Normal Time.
The IPEDS graduation rates are calculated as the percentage of first-time freshmen who complete their program within 150% of normal or expected time to program completion. This equates to 6 years for a Bachelor’s degree, 3 years for an Associate’s degree and 1.5 years for most certificate programs. Note that these data reflect the graduation rates of only full-time, first-time freshmen within a specified entering cohort and as such represent a fairly small portion of the student body attending during any fall cohort at Trocaire, which typically has a higher proportion of part-time and transfer students.
Nonetheless, since this rate is part of the national IPEDS data set, it is important for Trocaire to calculate and track it.

TROCAIRE COLLEGE – FACT BOOK
P a g e | 25
The IPEDS graduation rates for full-time, first-time freshmen who graduate within 150% of normal time has varied across the past five years (see Figure 12), with a low of 22% and a high of 30%. The reporting timeframe for 150% graduation rates is defined by a six year look-back period (corresponding to 150% of the normal time to completion of a four-year degree). Therefore, the information shown in Figure 12 reflects that status of graduates from a particular entering cohort at six years post entry. Note that only graduates of bachelor’s programs are credited if they have completed their programs within six years. Associate degree students must have completed their programs within three years, and certificate students must have completed their programs within 1.5 years, in order to be credited with having graduated within 150% of time.
Figure 12. IPEDS Graduation Rates Among Full-Time, First-Time Freshman Within 150% of Normal Time: 2010 to 20141
1Key Performance Indicator – 3.1.
Graduates at Six Years Post-Initial Enrollment at Trocaire.
In addition to the IPEDS graduation rate, a second graduation rate is calculated. In this second rate, all first-time full-time freshmen who entered during a particular fall semester are evaluated to determine if they graduated within 6 years. This rate provides a sense of how successful students are with graduating over a longer span than 150% of normal completion time, as it includes Associate degree students who
2010 (2004 COHORT)*
2011 (2005 COHORT)*
2012 (2006 COHORT)*
2013 (2007 COHORT)*
2014 (2008 COHORT)*
22%
30%
27%
30%
26%
Pe
rce
nt
Gra
du
ated
TROCAIRE COLLEGE – FACT BOOK
P a g e | 26
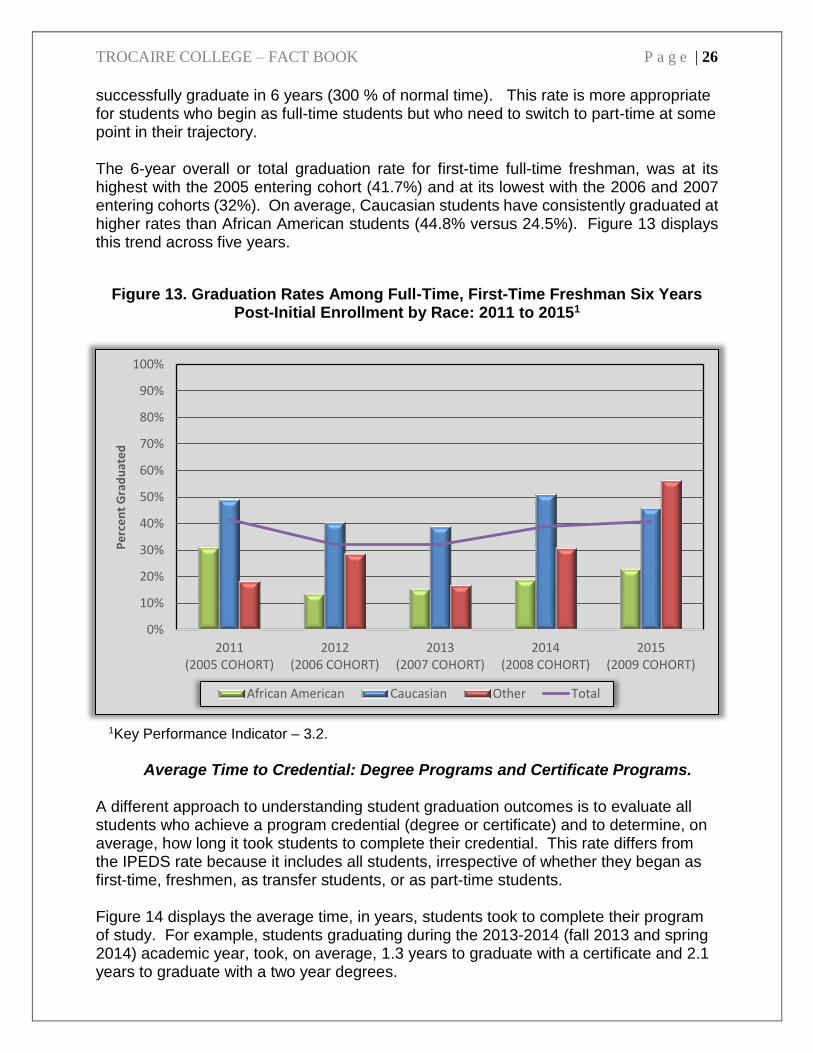
successfully graduate in 6 years (300 % of normal time). This rate is more appropriate for students who begin as full-time students but who need to switch to part-time at some point in their trajectory. The 6-year overall or total graduation rate for first-time full-time freshman, was at its highest with the 2005 entering cohort (41.7%) and at its lowest with the 2006 and 2007 entering cohorts (32%). On average, Caucasian students have consistently graduated at higher rates than African American students (44.8% versus 24.5%). Figure 13 displays this trend across five years.
Figure 13. Graduation Rates Among Full-Time, First-Time Freshman Six Years
Post-Initial Enrollment by Race: 2011 to 20151
1Key Performance Indicator – 3.2. Average Time to Credential: Degree Programs and Certificate Programs.
A different approach to understanding student graduation outcomes is to evaluate all students who achieve a program credential (degree or certificate) and to determine, on average, how long it took students to complete their credential. This rate differs from the IPEDS rate because it includes all students, irrespective of whether they began as first-time, freshmen, as transfer students, or as part-time students. Figure 14 displays the average time, in years, students took to complete their program of study. For example, students graduating during the 2013-2014 (fall 2013 and spring 2014) academic year, took, on average, 1.3 years to graduate with a certificate and 2.1 years to graduate with a two year degrees.
0%
10%
20%
30%
40%
50%
60%
70%
80%
90%
100%
2011(2005 COHORT)
2012(2006 COHORT)
2013(2007 COHORT)
2014(2008 COHORT)
2015(2009 COHORT)
Pe
rce
nt
Gra
du
ate
d
African American Caucasian Other Total

TROCAIRE COLLEGE – FACT BOOK
P a g e | 27
Figure 14. Average Time to Credential, in Years, by Full-Time, First-Time
Freshman and Transfer Students: 2010 to 20141
III.4. First-Time Pass Rates on Licensing Examinations
Graduates of four of Trocaire’s academic programs must take licensing exams in order to be employed in their fields. New York State tracks the pass rates of each student, within each separate program, but considers only on the first attempt at taking the exam as a success (collectively, these are known as ‘first time pass rates). First-time pass rate data for Trocaire students on these exams are presented over the past five years (2011-2015) in Figures 15 – 18.
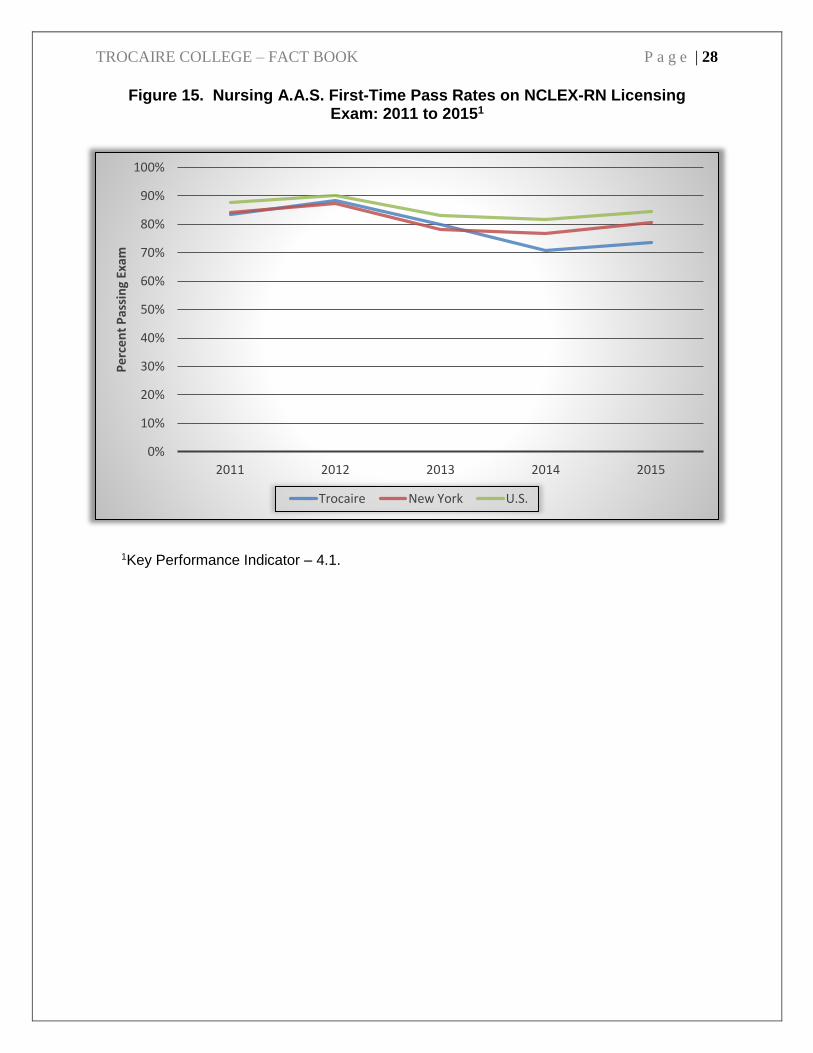
Nursing A.A.S. Licensing Exam: NCLEX-RN. Figure 15 displays the NCLEX-RN pass rates across the past five years (2011-2015). In 2012 and 2013, the Nursing A.A.S. students exceeded the New York State average passing rate. The Nursing pass rates were lower than New York State and the national average in years 2011-2015; however, the pass rates have increased from 2014 to 2015.
0.0
0.5
1.0
1.5
2.0
2.5
FALL 2010 TO SPRING 2011
FALL 2011 TO SPRING 2012
FALL 2012 TO SPRING 2013
FALL 2013 TO SPRING 2014
FALL 2014 TO SPRING 2015
Ye
ars
First-Time Freshmen - AAS Transfer Students - AAS
First-Time Freshmen - Certificate Transfer Students - Certificate
Overall Average
1Key Performance Indicator – 3.3.
TROCAIRE COLLEGE – FACT BOOK
P a g e | 28
Figure 15. Nursing A.A.S. First-Time Pass Rates on NCLEX-RN Licensing Exam: 2011 to 20151
0%
10%
20%
30%
40%
50%
60%
70%
80%
90%
100%
2011 2012 2013 2014 2015
Pe
rce
nt
Pas
sin
g Ex
am
Trocaire New York U.S.
1Key Performance Indicator – 4.1.
TROCAIRE COLLEGE – FACT BOOK
P a g e | 29
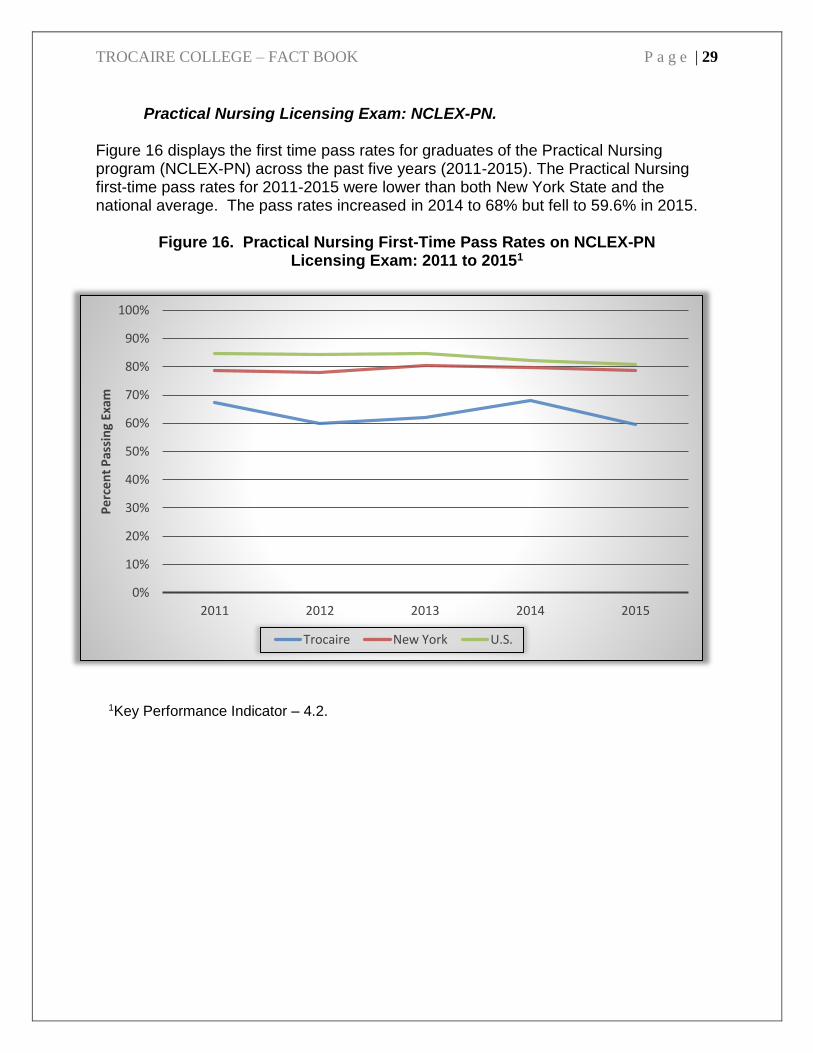
Practical Nursing Licensing Exam: NCLEX-PN.
Figure 16 displays the first time pass rates for graduates of the Practical Nursing program (NCLEX-PN) across the past five years (2011-2015). The Practical Nursing first-time pass rates for 2011-2015 were lower than both New York State and the national average. The pass rates increased in 2014 to 68% but fell to 59.6% in 2015.
Figure 16. Practical Nursing First-Time Pass Rates on NCLEX-PN Licensing Exam: 2011 to 20151
1Key Performance Indicator – 4.2.
0%
10%
20%
30%
40%
50%
60%
70%
80%
90%
100%
2011 2012 2013 2014 2015
Pe
rce
nt
Pas
sin
g Ex
am
Trocaire New York U.S.

TROCAIRE COLLEGE – FACT BOOK
P a g e | 30
Radiologic Technology Licensing Exam: ARRT Examination.
The Radiologic Technology students have exceeded the national average passing rate over the past five years (2011-2015). Figure 17 displays the ARRT Examination pass rates across the past five years (2011-2015).

TROCAIRE COLLEGE – FACT BOOK
P a g e | 31
Massage Therapy Licensing Exam: Massage Therapy Examination. Figure 18 displays the Massage Therapy Examination pass rates across the past five years (2011-2015).The Massage Therapy Exam results exceeded the New York State and National averages in 2011, 2013, and 2015. Most years, however, within the displayed five year window (2011-2015), have fluctuated, in part, due to a small number of enrolled students in the massage therapy program. For example, if two students pass an exam, Trocaire celebrates a 100% pass rate. However, if one of these students fails, the pass rate decreases to 50%.
Figure 18. Massage Therapy First-Time Pass Rates on Massage Therapy
Exam: 2011 to 20151
III.5. Job Placement/Continuing Education
The Career Center at Trocaire conducts a survey of graduate outcomes at six months post-graduation. The survey is initially administered online, then by mail, and, as necessary, by phone. Despite these efforts, completion rates can be challenging.
The post-graduation survey asks graduates about their employment status (Employed in any field of work; Employed in the field in which they earned their degree, etc.) as well as whether they are pursuing additional education.
0%
10%
20%
30%
40%
50%
60%
70%
80%
90%
100%
2011 2012 2013 2014 2015
Trocaire New York U.S.
1Key Performance Indicator – 4.4.
TROCAIRE COLLEGE – FACT BOOK
P a g e | 32
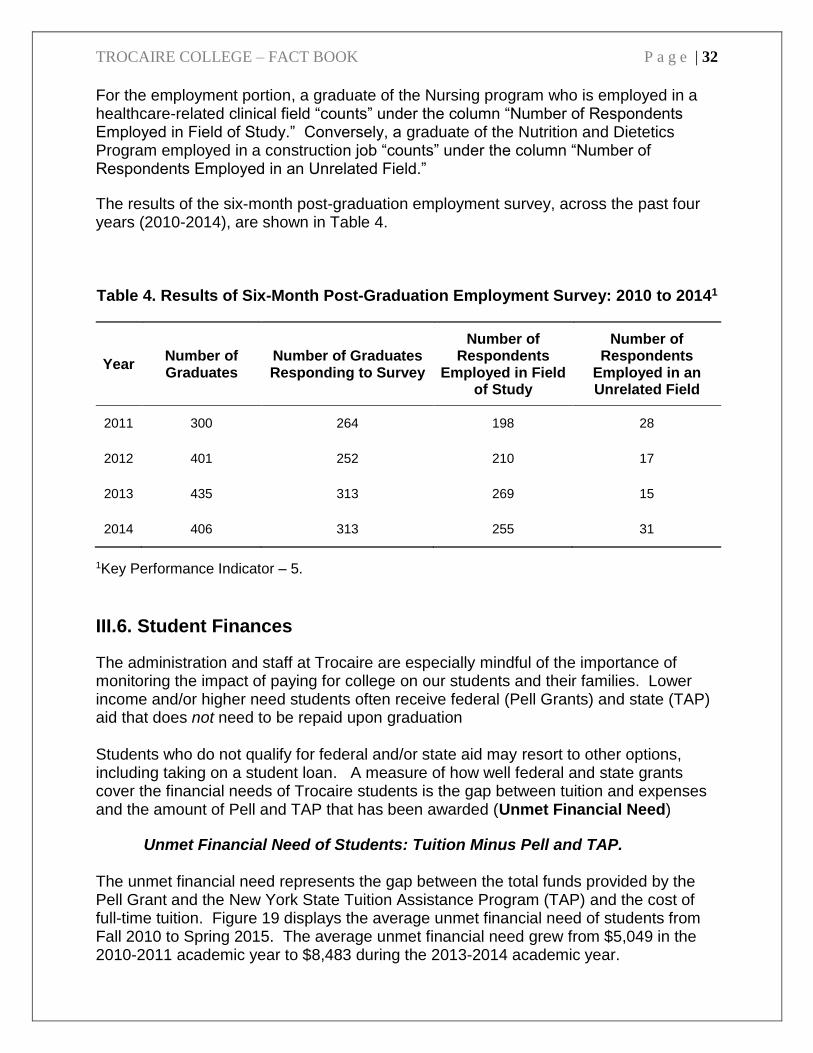
For the employment portion, a graduate of the Nursing program who is employed in a healthcare-related clinical field “counts” under the column “Number of Respondents Employed in Field of Study.” Conversely, a graduate of the Nutrition and Dietetics Program employed in a construction job “counts” under the column “Number of Respondents Employed in an Unrelated Field.”
The results of the six-month post-graduation employment survey, across the past four years (2010-2014), are shown in Table 4. Table 4. Results of Six-Month Post-Graduation Employment Survey: 2010 to 20141
Year Number of Graduates
Number of Graduates Responding to Survey
Number of Respondents
Employed in Field of Study
Number of Respondents
Employed in an Unrelated Field
2011 300 264 198 28
2012 401 252 210 17
2013 435 313 269 15
2014 406 313 255 31
1Key Performance Indicator – 5.
III.6. Student Finances
The administration and staff at Trocaire are especially mindful of the importance of monitoring the impact of paying for college on our students and their families. Lower income and/or higher need students often receive federal (Pell Grants) and state (TAP) aid that does not need to be repaid upon graduation Students who do not qualify for federal and/or state aid may resort to other options, including taking on a student loan. A measure of how well federal and state grants cover the financial needs of Trocaire students is the gap between tuition and expenses and the amount of Pell and TAP that has been awarded (Unmet Financial Need)
Unmet Financial Need of Students: Tuition Minus Pell and TAP. The unmet financial need represents the gap between the total funds provided by the Pell Grant and the New York State Tuition Assistance Program (TAP) and the cost of full-time tuition. Figure 19 displays the average unmet financial need of students from Fall 2010 to Spring 2015. The average unmet financial need grew from $5,049 in the 2010-2011 academic year to $8,483 during the 2013-2014 academic year.

TROCAIRE COLLEGE – FACT BOOK
P a g e | 33
The amount of tuition and fees charged by the college, as well as the amount allotted by the federal Pell Grant program and TAP impacts the financial gap of students each year.
Figure 19. Unmet Financial Need of Students who Received the Maximum Pell
Grant and Maximum TAP Award: 2010 to 20151
Total Loan Debt Among Graduates.
Not all students are eligible for financial aid, and even those who are experience a gap between financial aid funding and college costs. Such students often need to take out loans. Figure 20 displays the total loan debt among Trocaire graduates from Fall 2010 to Spring 2015. Among students receiving financial loans, the total loan debt has increased over the past five years (See Figure 20). As can be seen, the average total loan debt at graduation rose from $22,721 in 2010-2011 to $26,606 in 2014 – 2015.
2010-2011 2011-2012 2012-2013 2013-2014 2014-2015
$5,049
$5,937
$7,232
$8,483$8,938
Un
me
t Fi
nan
cial
Ne
ed
1Key Performance Indicator – 7.1.

TROCAIRE COLLEGE – FACT BOOK
P a g e | 34
Figure 20. Average Total Loan Debt for Trocaire Graduates: 2010 to 20151
Loans that students receive from the federal government generally must be repaid upon graduation and some of these loans (particularly unsubsidized loans) begin accruing interest upon the disbursement date. If students don’t repay their government loans, they are considered to be in default. The government monitors student loan default rates and, if these rates go above certain thresholds, the government may impose sanctions and /or require additional financial reporting information. The college’s cohort student loan default rates have been as follows in recent years: Trocaire College National Average 4 Year Privates All institutions 2014 11.0% 7.0% 6.3% 2015 11.4% 13.7% 11.8%
FALL 2010 TO SPRING 2011
FALL 2011 TO SPRING 2012
FALL 2012 TO SPRING 2013
FALL 2013 TO SPRING 2014
FALL 2014 TO SPRING 2015
$22,721 $22,736$23,965
$22,276
$26,606
Ave
rage
Lo
an D
eb
t
1Key Performance Indicator – 7.2.

TROCAIRE COLLEGE – FACT BOOK
P a g e | 35
III.7. Student Satisfaction Students complete course evaluations towards the end of each semester, and within those evaluations are two general measures of satisfaction: 1). “My overall assessment of the quality of instruction is…” and 2) “The overall value of the course is…”. Results from the satisfaction questions from the course evaluations are shown in Figure 21. It is notable that these figures are based on a very large proportion of the current student body, so these numbers are very representative of our students.
Figure 21. Currently Enrolled Student Satisfaction: Quality of Instruction and
Value of Courses1
1Key Performance Indicator – 8.1.a. *Administered online Recently the college has employed a standard measure of student satisfaction - the Noel Levitz Student Satisfaction Inventory. This instrument was first administered to enrolled students in May 2015. The response rate was not high (24.6% response rate). Figure 22 displays responses from select categories in the Noel Levitz Student Satisfaction Inventory. Specifically, students rated their satisfaction with the eight broad categories of Trocaire services and campus climate. In total, the eight categories comprised 51 questions.
2011 2012 2013 2014* 2015*
4.22 4.25 4.22 4.153.98
4.22 4.22 4.21 4.12 4.06
Ave
rage
Res
po
nse
5 = Excellent, 4 = Very Good, 3 = Good, 2 = Fair, 1 = Poor .
Overall Quality of Instruction Overall Value of Course

TROCAIRE COLLEGE – FACT BOOK
P a g e | 36
As can be seen in Figure 22, the majority of the averaged ratings fell into the “Somewhat Satisfied” to “Satisfied” range, indicating general satisfaction of students with college services and the campus climate. One area, Safety and Security, fell into the "Neutral” to “Somewhat Satisfied” range, suggesting a possible area of concern.
Figure 22. Currently Enrolled Student Satisfaction: Quality of Trocaire Services1, Satisfaction With Campus Facilities2, and Satisfaction With Additional Areas
1Key Performance Indicator – 8.1.b. 2Key Performance Indicator – 8.1.c.
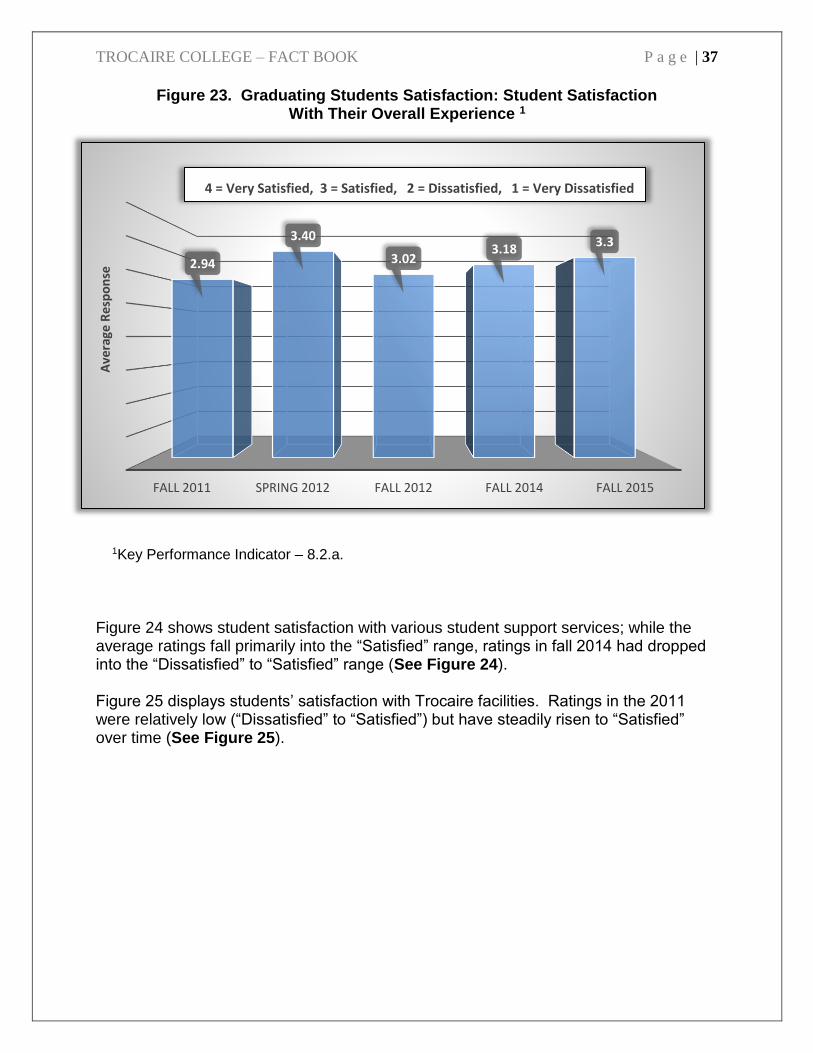
In addition to the Noel Levitz survey for currently enrolled students, the college administers a Graduating Students Survey at the end of each fall and spring semester, to assess student satisfaction with the various departments and services they may have utilized while at Trocaire. Figures 23, 24, and 25 display the responses from select questions as administered to graduating students across five years. In Figure 23, it is shown that students indicated “Satisfied” to “Very Satisfied” ratings of their overall experience while at Trocaire.
5.80
4.68
5.83 5.71 5.79 5.655.82 5.67
Ave
rage
Re
spo
nse
7 = Very satisfied, 6 = Satisfied, 5 = Somewhat satisfied, 4 = Neutral, 3 = Somewhat dissatified, 2 = Not very satified, 1 = Not satified at all
TROCAIRE COLLEGE – FACT BOOK
P a g e | 37
Figure 23. Graduating Students Satisfaction: Student Satisfaction With Their Overall Experience 1
Figure 24 shows student satisfaction with various student support services; while the average ratings fall primarily into the “Satisfied” range, ratings in fall 2014 had dropped into the “Dissatisfied” to “Satisfied” range (See Figure 24). Figure 25 displays students’ satisfaction with Trocaire facilities. Ratings in the 2011 were relatively low (“Dissatisfied” to “Satisfied”) but have steadily risen to “Satisfied” over time (See Figure 25).
FALL 2011 SPRING 2012 FALL 2012 FALL 2014 FALL 2015
2.94
3.40
3.023.18
3.3
Ave
rage
Re
spo
nse
4 = Very Satisfied, 3 = Satisfied, 2 = Dissatisfied, 1 = Very Dissatisfied .
1Key Performance Indicator – 8.2.a.

TROCAIRE COLLEGE – FACT BOOK
P a g e | 38
Figure 24. Graduating Students Satisfaction: Quality of Trocaire Services 1
1Key Performance Indicator – 8.2.b.
Figure 25. Graduating Students Satisfaction: Quality of Classroom and
Laboratory Facilities1
1Key Performance Indicator – 8.2.c.
FALL 2011 SPRING 2012 FALL 2012 FALL 2014 FALL 2016
2.6
3.1
2.8
3.2 3.2
2.5
3.22.9 3.0
3.2
Ave
rage
Res
po
nse
4 = Very Satisfied, 3 = Satisfied, 2 = Dissatisfied, 1 = Very Dissatisfied .
Classroom Facilities Laboratory Facilities

TROCAIRE COLLEGE – FACT BOOK
P a g e | 39
ACCUPLACER® – Assessment tests offered by the College Board, and administered at the college, in the areas of math, English, and reading (for more information, see http://www.collegeboard.com/student/testing/accuplacer). GED – General Education Development. Accepted within many colleges as equivalent to a high school diploma (for more information, see http://www.acenet.edu). IPEDS – The Integrated Postsecondary Education Data System is the nation’s comprehensive program for collecting data reported by postsecondary institutions. It is a part of the U.S. Department of Education’s National Center for Education Statistics (for more information, see http://nces.ed.gov/ipeds). Nontraditional Student – In general, a student over 24 years of age is considered nontraditional. For a comprehensive discussion on traditional versus nontraditional student status, see http://nces.ed.gov/pubs/web/97578e.asp. Snapshot – Data “Snapshots” taken mid-semester each fall term (on or about October 15) and each Spring term (on or about March 15). Snapshots are used to determine official student enrollment for federal IPEDS, this Fact Book, and many other reports.
IV. GLOSSARY OF TERMS