Trivandrum Study Report 2014 - WordPress.com · Trivandrum Study Report 2014 ... Consumer Price...
18
GOVERNMENT LED EXCLUSION OF URBAN POOR A Greater Contributor though a Lesser Recipient The objective of the study is to look into the economic contribution, standard of living and the service delivery by the government in informal settlements Trivandrum Study Report 2014 Society for Participatory Research in Asia 42 Tughlakabad Institutional Area, New Delhi - 110 062. Tel. : +91-11-2996 0931- 33 Fax: +91-11-2995 5183 Email: [email protected] Website: www.pria.org
-
Upload
nguyendang -
Category
Documents
-
view
213 -
download
0
Transcript of Trivandrum Study Report 2014 - WordPress.com · Trivandrum Study Report 2014 ... Consumer Price...
GOVERNMENT LED EXCLUSION OF URBAN POOR A Greater Contributor though a Lesser Recipient
The objective of the study is to look into the economic contribution, standard of living and the service
delivery by the government in informal settlements
Trivandrum Study Report 2014
Society for Participatory Research in Asia
42 Tughlakabad Institutional Area, New Delhi - 110 062. Tel. : +91-11-2996 0931- 33 Fax: +91-11-2995 5183 Email: [email protected] Website: www.pria.org

Pag
e1
DISCLAIMER
The conclusions derived in the study are purely on the basis of primary survey conducted. The data
documented are from the households of informal urban settlements. This study was conducted in 50
growing cities of India. This is a city level report, which talks about the present condition and status
of Urban poor living in respective cities. An attempt has been made to produce micro level city
findings. There are certain gaps and the conclusion derived cannot be comprehensive in nature
therefore.

Pag
e2
ACRONYMS
BSUP Basic Service Urban Project
GDP Gross Domestic Product
GSDP Gross State Domestic Product
PHED Public Health Engineering Department
PPP Public Private Partnership
SAM
CPI
Social Accountability Matrix
Consumer Price Index

Pag
e3
Table of Contents
I. Introduction (Pg. 4)
II. Purpose (Pg. 4)
III. Methodology (Pg. 4)
IV. Positive Role of Informal Settlers (Pg. 5)
V. Urban Poverty Gets its Due Recognition in Census 2011 (Pg. 5)
VI. Kerala Demographic Profile (Pg. 5)
VII. Slums in Kerala Census (Pg. 6)
VIII. Trivandrum District (Pg. 7)
IX. Governance of Trivandrum City (Pg.8)
X. Study Concluded by PRIA (Pg.8)
XI. Other Conclusions (Pg. 16)

Pag
e4
I. INTRODCUTION
The phenomenon of increased urbanization in India is facing one of its foremost challenges in the form of
disparity between redistribution of economic opportunity and growth. The centre of poverty is gradually
shifting towards urban centres and this situation is further worsened by already high population densities,
poor infrastructure and a general lack of effective housing policy and provisioning for the poor. The Census
of India 2011 suggests that 66% of all statutory towns in India have slums, with 17.4% of total urban
households currently residing. However, this estimate of slums takes into account certain criteria set by the
Census for a settlement to be featured as a slum. A large proportion of households who are living in similar
or poorer dwelling conditions than those living in slums have been omitted. This study encompasses all those
settlements that comply with the definition of slums (as given by the Census of India) as well as those with
similar or poorer dwelling conditions that those of slums as ‘Informal Settlements’, because these are
primarily dwelling units where most of the urban poor live. Interventions should be targeted at all these
informal settlements instead of only slums as defined by the Census, since the quality of life and
infrastructure in these informal settlements are similar to those of slums. ( PRIA, 2013)
II. PURPOSE OF THE REPORT
The objective of the present study is to look into the present conditions and status of informal
settlement households living in urban India. The primary reason for looking at this particular question is
to determine whether the informal settlement households, who normally form the poor strata of the urban
population, do contribute to the urban economy to a significant extent or not. If they do contribute to urban
economy, whether providing proper urban services to them should be treated as their legitimate right? For
greater comprehension, this study attempts to discover the role of informal settlement population as a
productive agent in urban economy, which is in contrast to the general notion that this section of population
is “burden to the city.” ( PRIA, 2013)
III. METHODOLOGY
A primary survey of 50 top cities in India was conducted to achieve the study objective. The survey captured
various socio-economic–demographic dimensions of urban informal settlements dwellers in these cities. A
total of about 5350 households and about 24500 individuals were covered in the survey. The focus of the
questionnaire was to capture information about income–expenditure, employment, nature of job, education,
living conditions and the similar information to understand the economic component of their life as well as
their standard of living. Subsequently, we construct a social accounting matrix (SAM) of India that includes
urban informal sector as a component. SAM is the best possible tool that takes into account the inter-linkages
among various economic agents within an economy. One of the advantages of that it can incorporate certain
sections of households into a framework whereby the impact of that section on the economy in terms of
contribution to income (GDP) as well as the multipliers can be computed, thus allowing precise
quantification of the informal settlement population’s contribution to urban economy. In addition, the study
also captures the perceptions of non-informal settlement households regarding the role of the target segment
of population in a city life. This qualitative analysis provides an understanding of the shadow cost of non-
existence of this section of population in the urban centres. ( PRIA, 2013)

Pag
e5
IV. POSITIVE ROLE OF INFORMAL SETTLERS
On the contrary to the general notions, the study suggests that informal settlement dwellers play positive roles
in urban economy as well as urban life apart from a few known adverse roles. Their contribution to urban
GDP, and some of the “difficult to replace” nature of jobs they are engaged in, makes them an integral
productive economic agent of the urban economy. Based on the Census of India 2011 data, as well as primary
survey data of informal settlements of 50 cities, the study also suggests that a large proportion of the
households do not even have access to the basic facilities. As the services provided to this section of
population are often considered as favour to the community rather than their basic right, the approach and
attitude of the authorities needs to be re-examined. Certainly the informal settlement dwellers deserve the
basic facilities that other urban dwellers enjoy as their right. This needs to be translated into policies by the
policy makers and opinion leaders of the country. ( PRIA, 2013)
V. URBAN POVERTY GETS ITS DUE RECOGNITION IN CENSUS 2011
No uniform methodology existed to identify urban poverty and states have been using their own parameters
to reach out for providing benefits. Census-2011 has attempted to enumerate socio-economy data also at
household level such as quality of housing, water, electricity, literacy, access to education etc. Hashim
Committee report (full citation) states that as per ninth plan document the features of urban poverty are:
proliferation of slums, increasing casualization of labour, fast growth of informal sector, increasing stress on
civic amenities, increasing education deprivation and health contingencies.
There is change in approach and indicators in the current census than the previous census. The census 2011
has released data for slum blocks in more details for the first time. In earlier Census, it was more at
demography level limiting the study to blocks having 20,000 populations. In Census 2011 slum blocks have
been identified based on living conditions irrespective of population size - poor quality of living based on
combination of factors such as dilapidation, faulty arrangements and design of such buildings, narrowness or
faulty arrangement of street, lack of ventilation, light, or sanitation facilities etc. (Planning Commission, 2012)
VI. KERALA DEMOGRAPHIC PROFILE
Kerala is located in the southern side of India bordered by Karnataka and Tamilnadu on north and western
side, Lakshadweep sea on western and southern side. It covers an area of 38,860 sqkm, having a population
of 3.34 crores. Kerala has witnessed lowest population growth and has the highest literacy rate and highest
sex ratio in the country.
Status of Urban Slums at National Level (Census 2011)
Out of 4041 towns in country slums have been reported from 63% of towns (1.08 lakh slum blocks in
2543 towns comprising 137.49 lakh households). 37072 slum blocks have been notified, 30846 have been
recognized and 40,309 have been identified.
17.4% of 789 lakh household in country are slum households. Andhra Pradesh tops the list with 35.7%,
Kerala has least slum households as percentage of total households with 1.5%.

Pag
e6
During oil boom significant population from Kerala went to Gulf countries for work and the remittance from
Gulf expatriate community has a significant contributin to state economy. Commercial crops such as rubber,
pepper, coconut, cashew, tea, coffee are important agriculture products. Fishery is an important sector due to
large coastline providing employment to large population. Kerala is also a leading tourist destination with
natural backwaters, beaches, ayurvedic medical centres. GSDP of state for 2013-14 is estimated at Rs 3.5 lakh
crores. Service sector contributes to 60% of economy, manufacturing sector 25% and agriculture sector 15%.
In Kerala it is not possible to distinguish rural areas from urban areas due to settlement patterns.
Urbanisation is not limited to designated towns and cities, as the entire state depicts a continuum of rural and
urban landscape.
Kerala has an overall population of 3.34 crores, with sex ratio of 1084 females per thousand males. Literacy
rate is 96% among males and 92% among females. 48% of population live in urban areas. The decadal
population growth has been 4.9%. Population in rural declined area by 26% and in urban area increased by
93%. This shows increasing rate of urbanization and shrinking of rural population. Population density is 860
per sq km as against 382 per sq km of India. (State Planning Board, Government of Kerala, 2013)
VII. STATUS OF SLUMS IN KERALA CENSUS-2011
Kerala slum household’s indicators from Census 2011
Kerala has the least number of slum households in India. 1.5% of households in Kerala are slum
households.
There are 54,849 slum households in Kerala. Out of which 63.03% is considered good, 31.33% is
livable and 5.64% is dilapidated.
81.71% slum households live in their own homes, 14.40% households live in rented homes and rest
3.89% live in other forms of home.
Households having number of dwelling rooms. 1.31% households have no exclusive rooms, 14.40%
households have one dwelling room, 30.10% households have two dwelling rooms and 54.20%
households live in three and above rooms.
79.39% have water source in their homes, 15.60% have water source in nearby area and rest 5.01%
of the household have to travel far off for water source.
53.21% of household have access to treated tap water, 4.74% tap water from untreated source,
0.73% hand pump, 1.60% tubewell and rest 39.73% use other sources of water.
In Kerala slums 96.41% of households have electricity. Other sources of lighting used are 3.33%
kerosene, 0.09% is solar energy, 0.07% is other oil is used, 0.05% have some other form of lighting.
Rest 0.06% household does not have any lighting system.
93.21% households have latrine facility within their homes. Out of which 15.58% of household have
piped latrine facility within their homes, 52.06% use septic tank, 25.57% have other forms of latrine

Pag
e7
facility within their house premises. 6.79% households have no latrine within their household. Out of
which 3.45% use public latrine and 3.34% openly defecate.
35.13% of Slum Households Kerala have electricity, tap Water and latrine within their home
premises.
63.55% of households use banking services
27.07% have radio, 82.72% have television, 8.88% have computer with internet, 10.95% have
computer without internet, 56.86% of the houses have mobile phones.
Type of houses 83.42% are permanent in nature, 12.38% are semi-permanent in nature, 3.15% are
temporary in nature and rest 1.04% are non-categorized.
VIII. TRIVANDRUM DISTRICT
Backdrop
Trivandrum district is densely populated with population of 33 lakhs with 54% urban population. The
decadal population growth is 2% with urban population growing by 62% and rural population decreasing by
29%. Sex ratio is 1087 females for every 1000 males. The population density is 1506 persons per sqkm.
(Trivandrum Municipal Corporation )
Trivandrum Urban
Trivandrum District has 8.28 lakh households. Out of 8.28 lakhs households 47.10% are rural and 52.9% are
urban. The status of Trivandrum urban is as follows:
4.38 lakh households are present in urban Trivandrum. Among them 68.03% are considered good
for living. 25.79% are considered in livable condition and 5.93% houses are considered dilapidated.
Out of 4.38 lakh households 86.07% have water source in their home itself. 8.4% households have
water source near their house and 5.25% of the households have to travel far for water source.
47.48% of households get treated tap water and rest 52.52% are a combination of untreated water,
well, river, canal, lake etc.
96% of the households get electricity. Other forms of lighting are 2.96% is kerosene, 0.07% use solar
energy and rest use other sources of lighting like other oils. 0.04% do not have any lighting facility.
96.34% of households have latrine facility within their home. Out of which 23.69% have piped sewer
system. 3.68% (16,129 households) donot have latrine facility within their homes. 34.96% (5,640) use
public latrines. 65.03% (10,489) households openly defecate.
Type of fuel for cooking. 55.93% use LPG/LNG, 41.09% use firewood, 0.45% use crop residue,
0.68% use biogas, 0.45% use Kerosene. Rest uses other sources for cooking.

Pag
e8
69.86% of the households avail banking facilities
35.84% have radio, 84.47% of the households have televisions. 13.24% of the houses have
computers with internet connection, 12.10% have computers without internet, 75.57% of the
households have only mobile, 18.72% have bicycle.
IX. LOCAL GOVERNANCE STRUCTURE OF TRIVANDRUM CITY
Trivandrum Municipal corporation caters to an area of 215 sqkm comprising population of 9.6 lakhs.
Population density in corporation area is about 2500 person per sqkm. It has 100 elected councillors
representing 100 wards. headed by an elected mayor. The wards are divided in 6 zones for operational
efficiency. There are 8 standing committees (Finance, Development, Welfare, Health, Public Works,
Taxation, Education & sports and Town Planning and Heritage).
X. STUDY CONDUCTED BY PRIA IN THE SLUMS OF TRIVANDRUM
PRIA Study Report
PRIA had conducted a study in 50 cities of India, where Trivandrum was also among them.
a) Key Findings
96% of families have Ration card thus indicating satisfactory use of Public Distribution System
Aadhar enrolment is 96% among the urban poor
93% people have voter id cards and have exercised their right to vote
Financial inclusion is low. 25% family in slums have savings account either in Bank or Postal
account. Credit facilities from financial institutes are negligible. Our sample showed that 57% have
debts, none have borrowed from Bank or micro finance organizations, 28% people have borrowed
from friends or relatives, 22% from MP, MLA or local leaders, 6% from money lenders.
27% families in slums are migrants, relocated from rural areas. 78% of migrant slum dwellers have
been living for more than 5 years.
Income levels are extremely low. Expenditure component on food is extremely high which shows
that their income level is just enough to sustain.
Spending on education is negligible. 32% of slums are illiterate in a state which has the best literacy
rate. State support may be needed for slum dwellers in education at all levels from primry school,
secondary school to tertiary education. In Trivandrum slums literacy rate is inverse of overall Kerala
literacy rate. The education level among slum dewllers is decreasing and very low.
Staying in slum areas, food items and intoxicants consume all the earnings. Relocating to far places
for rehabilitation and resettlement of slum dwellers may make their earning unsustainable unless their
job location also changes to nearby areas.

Pag
e9
b) Profiling of sample households
Demographic
Variable
Classification Proportion of
Respondents (%)
Gender Male 48
Female 52
Age Less than 20 29
20 – 39 48
40 – 59 18
Above 60 5
Educational
Qualification
Illiterate 32
Literate but did not complete Primary
school
33
Primary school completed but not
Middle school
19
Middle school completed but not
High school
13
Class 12 pass but not graduate 3
Source of
Earning/Livelihood
Industrial Worker 1
Skilled service worker 24
Unskilled service worker 76
Employment Status Self Employed 2
Regular/ Salaried Wage 19
Casual Labour 79

Pag
e10
c) Participation in elections
High percentage of urban poor participation in
all forms of elections.87, 93 and 80 percent of
urban slum dwellers have voted in the last
municipal, state legislative and lok sabha
elections. There is only 6% membership in
slum dwellers association, 13% membership in
youth associations and no membership of
women in any kind of women associations.
These membership associations are a platform
to voice for the urban poor. The participatory
forums need strengthening with higher
enrolments and interaction.
d) Expenditure pattern of Trivandrum slums Vs All India slums
Trivandrum city urban informal dwellers earn an average income of Rs 4291 per month out of which they
spend Rs 3872. The average savings of the households surveyed is Rs 419. Among all 67% households save
and rest do not.

Pag
e11
The urban slum dwellers of Trivandrum spend around 48%on food items, higher than All India average of
46.77% of urban slums. In entertainment Trivandrum slums spend 6.12% as against All India average of
2.17%. On education Trivandrum negligible amount as against All India average of 6.12%. Trivandrum
spends very high on house rents around 9.2% as against All India average of 4.45%. Rest of expenses are in
same proportion as the All India average.
e) Comparison with CPI of Kerala Urban Vs Trivandrum Slums
An attempt has been made to compare CPI of urban of Kerala with CPI of Trivandrum slums
S.No Groups Kerala Urban* Trivandrum
slums
I Food, beverages and tobacco
34.28
53.89
II Fuel and light
6.21 4.50

Pag
e12
III Clothing, Bedding and Footware 5.22 0.62
IV Housing
21.61
9.20
A Education
3.54
0.59
B Medical care
5.87
6.34
C Recreation and amusement (Entertainment)
1.80
6.12
D Transport and communication
11.17
6.23
E Personal care and effects.
(Purchase of personal vehicle and other
personal goods)
2.06 0.12
F Household requisites
(other articles)
7.40 8.2
G Others
Furniture and Fixtures
Utensils
Household appliances
Jewelry
Water charges
0.80 1.86
(Central Statistics Office, February 11, 2014)
The ones in red are important
From the above tables we can see large variance in some areas. Such as:
Trivandrum slums spend 53.89% of their expenditure on food and intoxicants against 34.28% by
Kerala urban average.
Trivandrum slums spend 9.20% on housing whereas Kerala urban spends 21.61% on housing.
Trivandrum slums spend negligible amount on education whereas Kerala urban spends 3.54% on
education.
Trivandrum slums spend slightly more on healthcare than Kerala urban.
Trivandrum slums spends a lot on entertainment and recreation activities at 6.12% as against Kerala
urban of 1.80%.
Trivandrum slums spend comparatively same as Kerala slums on many expenditure categories and much less
on education.
Pag
e13
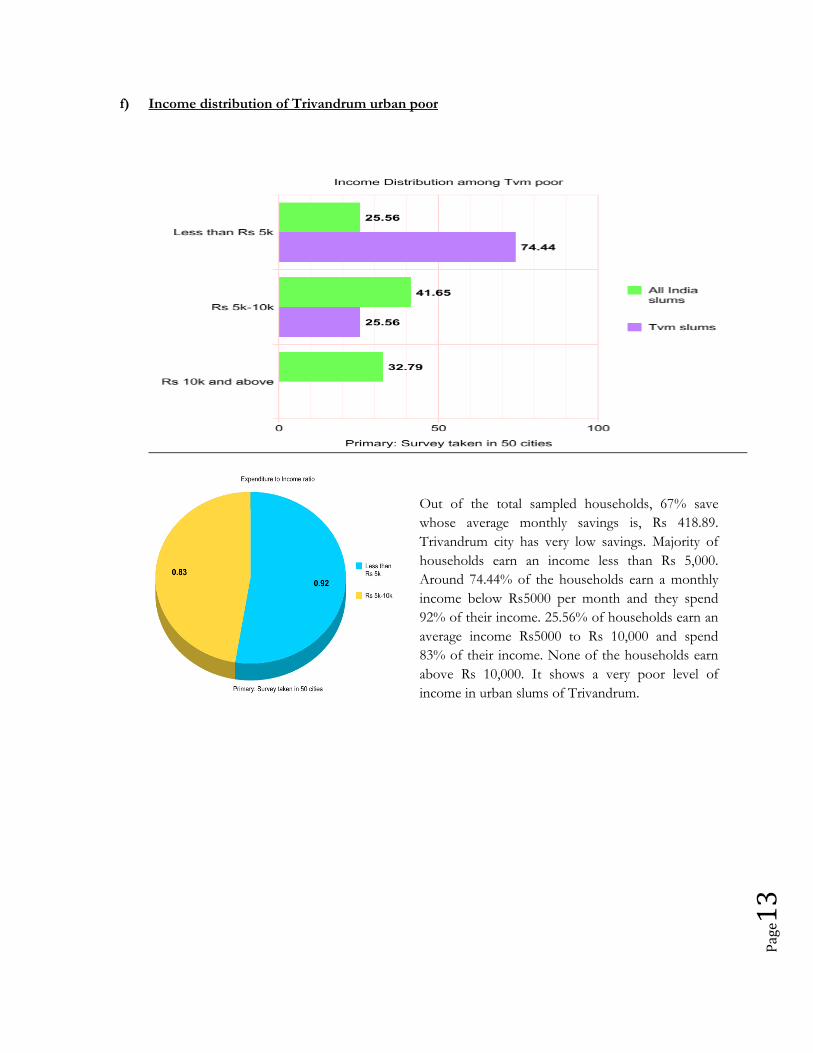
f) Income distribution of Trivandrum urban poor
Out of the total sampled households, 67% save
whose average monthly savings is, Rs 418.89.
Trivandrum city has very low savings. Majority of
households earn an income less than Rs 5,000.
Around 74.44% of the households earn a monthly
income below Rs5000 per month and they spend
92% of their income. 25.56% of households earn an
average income Rs5000 to Rs 10,000 and spend
83% of their income. None of the households earn
above Rs 10,000. It shows a very poor level of
income in urban slums of Trivandrum.

Pag
e14
g) Asset ownership amongTrivandrum urban poor
The ownership of assets in the form of availability of white goods like fans, mobile phones, vehicles, coolers,
computer, refrigerator etc all very limited. Amongst the surveyed households, 91% of them own an electric
fan. Second highest frequency of good among them is radio which is 83% and color Tv is only 63% of
households. Hardly does any household own any asset. This shows higher poverty level of slums of
Trivandrum.
h) Sources of Loan
56.8% of household have taken loan in the past one year. Among the debtors, 5.6% had taken loan from
money lenders or sahukars. 27.8% households had taken debt from friends and relatives, 22.2% households
had taken loan from local MLA or MP. Rest 1% has borrowed from other sources. None of the households
have taken loan from Banks or Microfinance institutions. Among the households surveyed, 14.4% of houses
have a savings account in bank, 11.1% of households have a post office account. The access to insurance
claims and access to financial services of Bank and Microfinance institutes is very low. The access to micro

Pag
e15
finance institutions seems highly negligible. Though a recent phenomenon households are not aware of the
role of microfinance. Microfinance status is nil where the sole intent of microfinance is to provide financial
assistance to the rural and the marginalized. Microfinance institutions and banks are missing out on a huge
opportunity by not tapping the potential of slums.
i) Status of various welfare benefits
In Trivandrum slums, only 1% of the people living in the households get old age pension, about Rs400 per
month. 4% of the slum dwellers get widow pension of Rs400 per month. Insignificant number of households
of 1% get disabled pension of Rs 500 per month. None of the families receive urban wage employment
scheme benefits norself-employment benefits. None of the household gets other benefit schemes like
housing assistance or skill training. 96% of the households have a ration card and use the PDS. Among them
40% have BPL type and 60% have APL type ration card. The various benefits availed through PDS on
consumption are 15kgs of sugar and 4litres of kerosene on an average per month. 96% of the slum
population has Aadhar cards (UID).
j) Land tenure status of Trivandrum Urban Poor
Land is an important economic resource and the ownership of such economic resource is important for every
family and household. Urban poor gets 60% of his source of income from the formal sector which he directly
and indirectly contributes to city level GDP. As an economic contributor he has the aspiration to land
ownership. In Trivandrum, 11% of the slum households have Patta as against 38% of All India slums. Patta is
an important document given by Tehsildar for land ownerships. 37% of households have possession
certificate of their lands against 13% in National average of slums. 52% households live in rented homes. Our
sample survey did not find slums in public or private land encroached slums which may indicate that cities are
not considered strong magnet for employment as compared to patterns in other states.

Pag
e16
The condition of housing of urban poor dwellers is 42% in Kachcha in nature and 47% semi pucca in nature
and 11% pucca in nature. This shows that in spite of slum dwellers possessing their own land rights their
housing condition is very bad and they have not invested significantly in building their dwellings.
k) Migration
Migration is becoming a serious issue for cities, but migration among slum dwellers seems low in Trivandrum.
The growing urbanization and employment opportunities have attracted many of the people away from their
home to earn basic livelihood. The demographics show that only 27% of households are migrants. 78% of
the migrants are staying from more than 5 years in their respective slums. 86% are intra city migrants from
different parts of Kerala to Trivandrum.. The 64% intra city migrants have come from rural parts of Kerala
and 22% had urban migration. The reasons of migration have been for employment and marriage purpose.
The interesting conclusion is that all 27% of migrants are seasonal in nature. That is, after earning sufficient
amount of income they want to move back to their rural set up.
XI. Other Conclusions
Comparing with Trivandrum urban average, slum income levels are extremely low just enough for
survival. Food constitutes bulk of their expenditure much above urban average.
Spending on transportation is low in absolute terms, indicating that their livelihood is generated from
nearby locations.
Dwellers have not spent on building their houses even after having possession documents,
indicating insufficient savings and low earning.
At existing lower salary level, slum dwellers may be considered an irreplaceable part of economy.
This is a complex issue having many dimensions. When the state recognizes this, it should ensure
that access to basic amenities of drinking water, sanitation, hyeigine, public health and education is
not compromised. Present level of investment in these needs to be augmented and expedited.
Pag
e17
Bibliography
PRIA. (2013). Economic Contribution of Urban Poor. New Delhi: Indicus .
Census. (2011). Census of India. Retrieved from http://www.censusindia.gov.in/
Central Statistics Office. (February 11, 2014). Consumer price index numbers - Separately for rural and urban areas and
also combined (rural plus urban). New Delhi : Ministry of Statistics and Programme Implementation,
Government of India .
Planning Commission. (2012). Report of the expert group to recommend the detailed methodology for identification of
families living BPL in urban areas. New Delhi: Government of India.
State Planning Board, Government of Kerala. (2013). Economic Review 2013. Thiruvananthapuram .
Trivandrum Municipal Corporation . (n.d.). Retrieved from http://www.corporationoftrivandrum.in/