Trinity India - 2016 - WordPress.com · Beautiful Homes Guide Water Proofing and Wallpaper business...
46
B&K Securities Conference Trinity India - 2016 Mumbai June 2, 2016
Transcript of Trinity India - 2016 - WordPress.com · Beautiful Homes Guide Water Proofing and Wallpaper business...
B&K Securities ConferenceTrinity India - 2016
Mumbai
June 2, 2016

Disclaimer
This presentation may contain statements which reflect Management’s
current views and estimates and could be construed as forward
looking statements. The future involves certain risks and uncertainties
that could cause actual results to differ materially from the current
views being expressed. Potential risks and uncertainties include such
factors as general economic conditions, foreign exchange fluctuations,
competitive product and pricing pressures and regulatory
developments.
Responses can only be given to questions which are not price
sensitive.
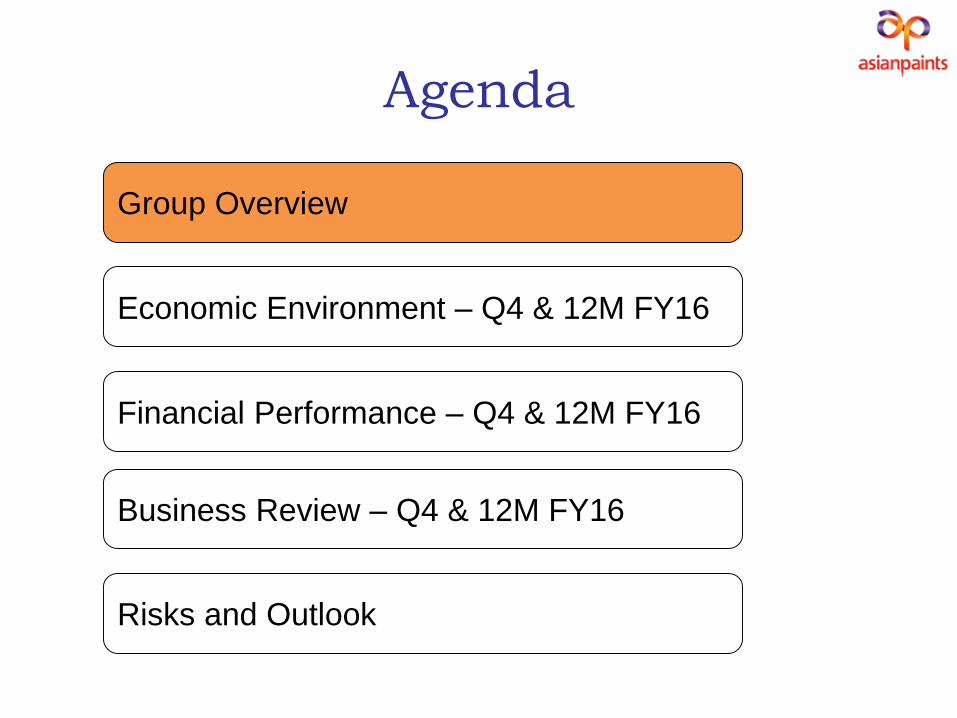
Economic Environment – Q4 & 12M FY16
Financial Performance – Q4 & 12M FY16
Business Review – Q4 & 12M FY16
Risks and Outlook
Agenda
Group Overview
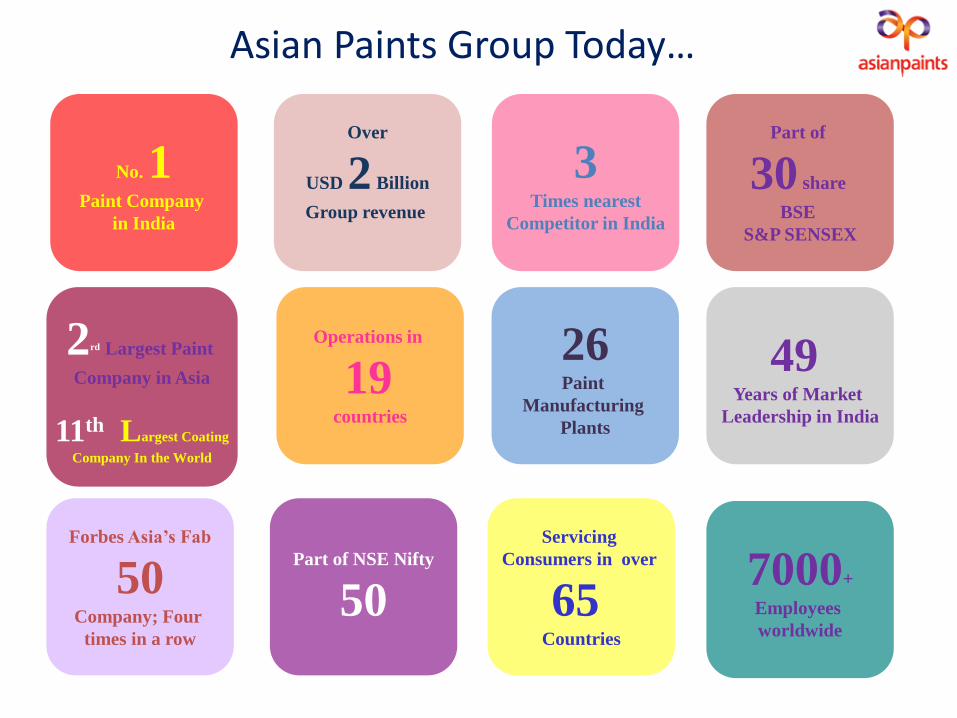
No. 1Paint Company
in India
Servicing
Consumers in over
65 Countries
Part of
30 share
BSE
S&P SENSEX
Over
USD 2 Billion
Group revenue
Operations in
19countries
49 Years of Market
Leadership in India
26Paint
Manufacturing
Plants
Forbes Asia’s Fab
50Company; Four
times in a row
3Times nearest
Competitor in India
2rd Largest Paint
Company in Asia
11th Largest Coating
Company In the World
7000+
Employees
worldwide
Part of NSE Nifty
50
Asian Paints Group Today…
-
2.0
4.0
6.0
8.0
10.0
12.0
14.0
16.0
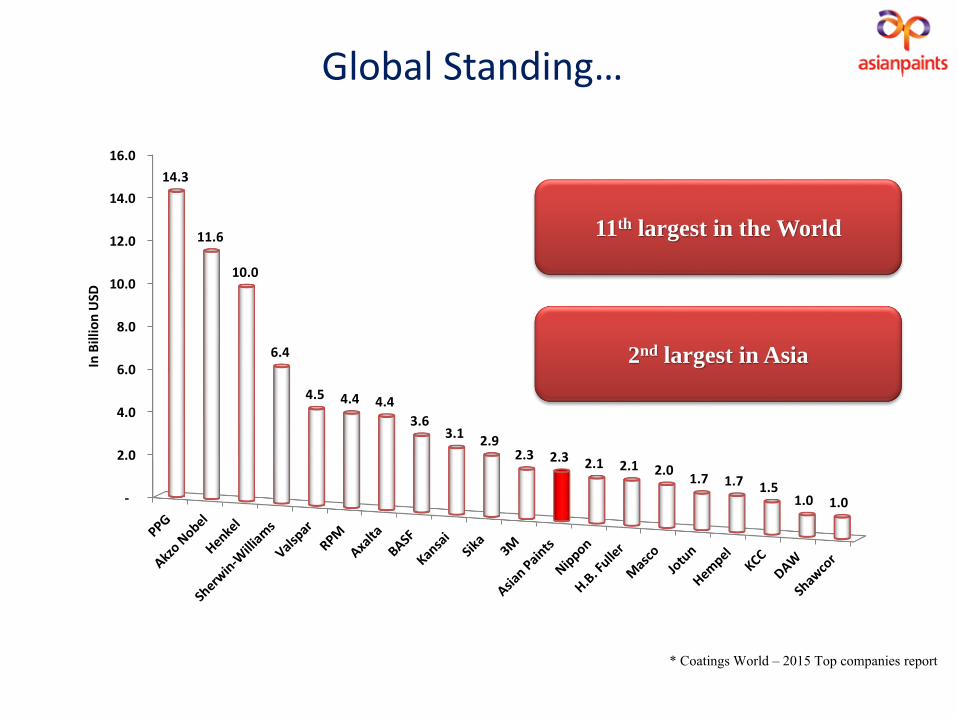
14.3
11.6
10.0
6.4
4.5 4.4 4.4
3.6 3.1
2.9 2.3 2.3 2.1 2.1 2.0
1.7 1.7 1.5 1.0 1.0
In B
illio
n U
SDGlobal Standing…
* Coatings World – 2015 Top companies report
2nd largest in Asia
11th largest in the World
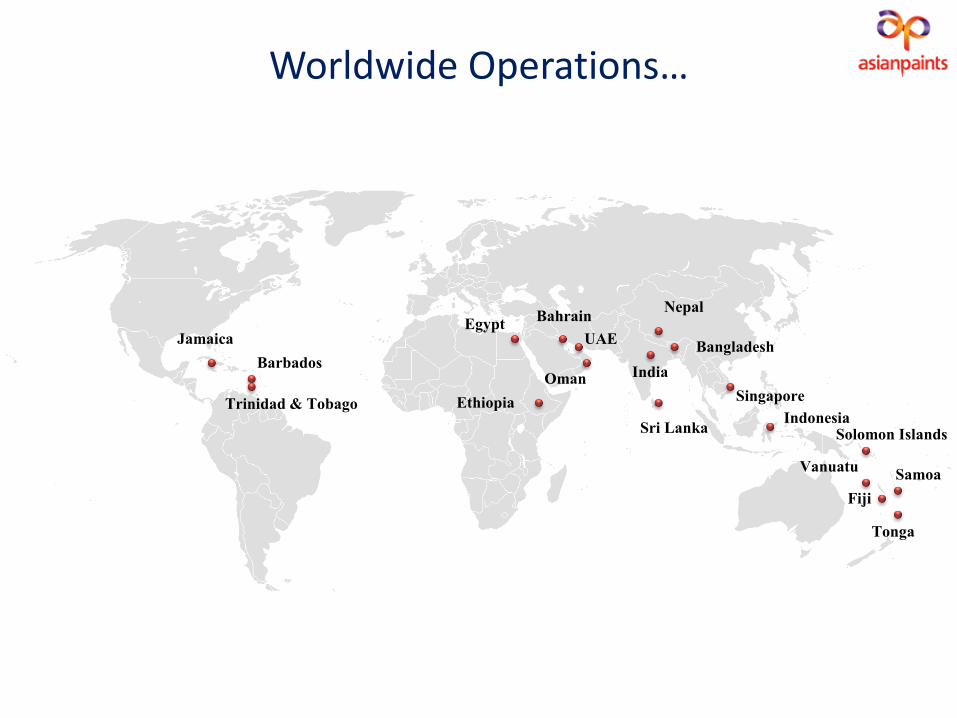
Worldwide Operations…
JamaicaBarbados
Trinidad & Tobago
Egypt
Oman
BahrainUAE
Nepal
India
Sri Lanka
Bangladesh
Singapore
Solomon IslandsVanuatu
FijiSamoa
Tonga
EthiopiaIndonesia
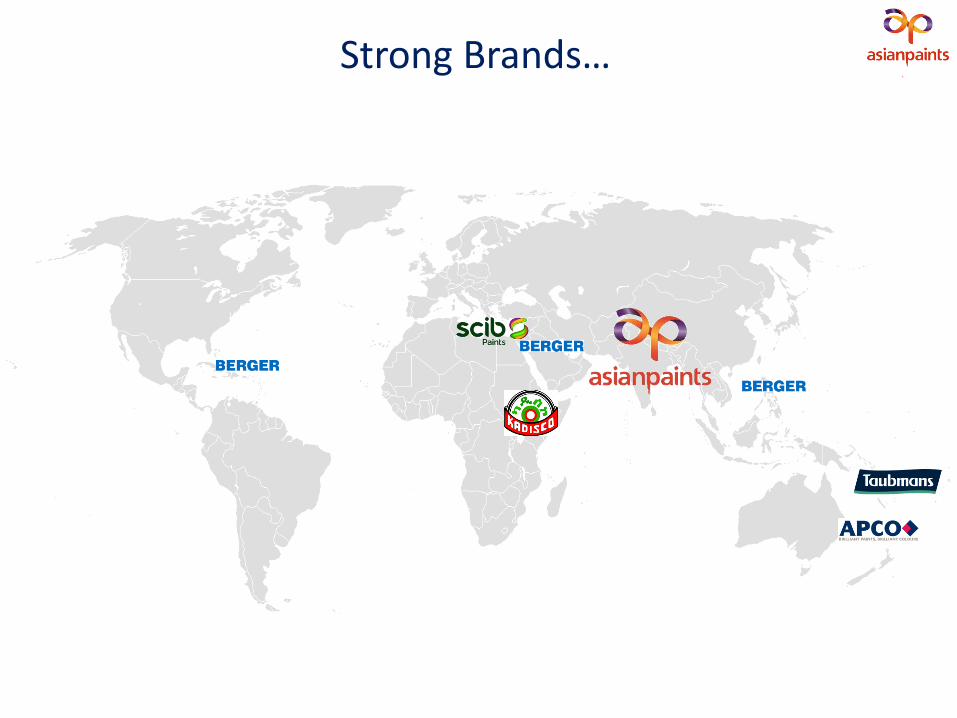
Strong Brands…
Aspiration…
“To be the fore runner of inspiring décor and to actively
empower customers to create their dream homes”

Belief in fostering the principles of trust and transparency
Ability to adapt itself to the changing environment
Dynamic professional management team focused towards delivering stakeholder
value with highest levels of corporate governance
Innovative strategies in the marketplace
Efficient manufacturing and logistics
Capabilities to effectively harness Information Technology to improve efficiency in
operations (SAP, i2, etc.)
Prudent management of financial resources
Focus on Research and Development (dedicated group R & D centre in India at
Turbhe near Mumbai)
Stand for…
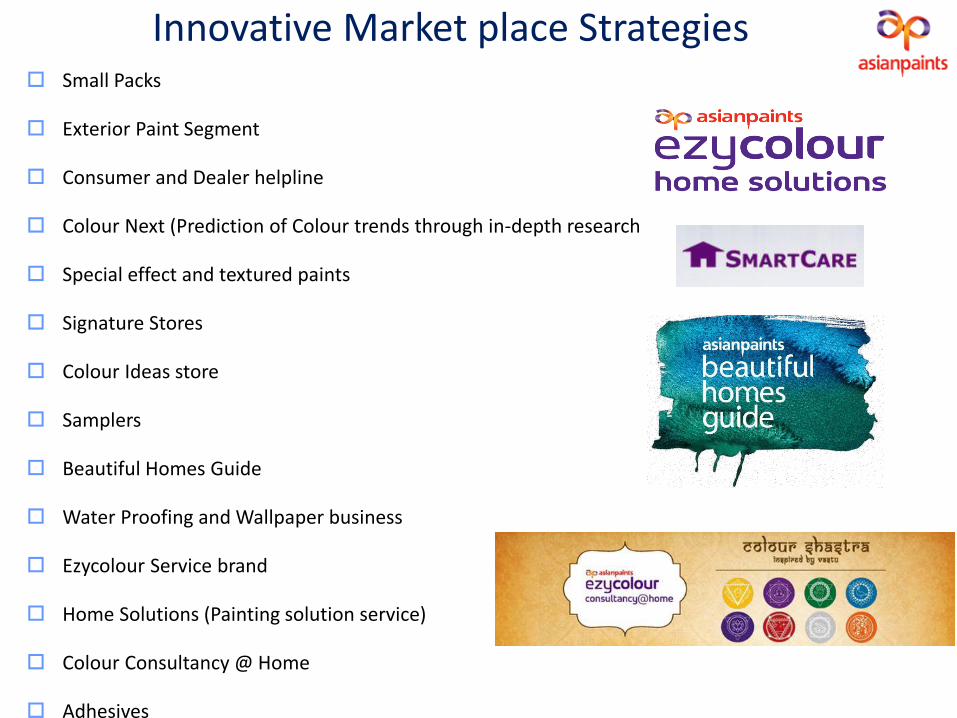
Innovative Market place Strategies Small Packs
Exterior Paint Segment
Consumer and Dealer helpline
Colour Next (Prediction of Colour trends through in-depth research
Special effect and textured paints
Signature Stores
Colour Ideas store
Samplers
Beautiful Homes Guide
Water Proofing and Wallpaper business
Ezycolour Service brand
Home Solutions (Painting solution service)
Colour Consultancy @ Home
Adhesives
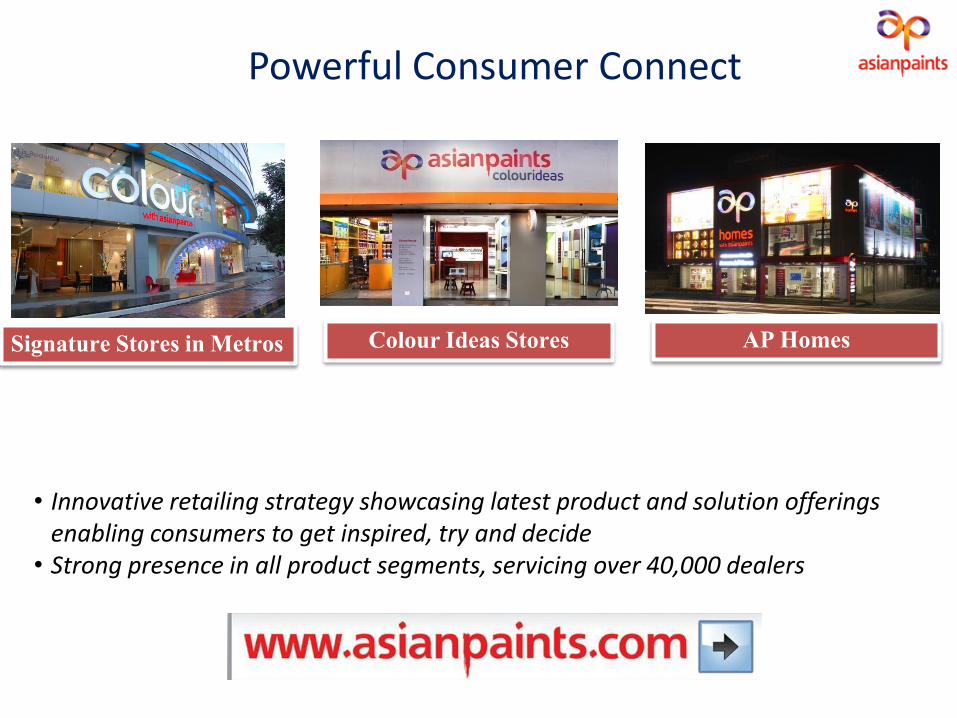
Powerful Consumer Connect
• Innovative retailing strategy showcasing latest product and solution offerings enabling consumers to get inspired, try and decide
• Strong presence in all product segments, servicing over 40,000 dealers
Signature Stores in Metros Colour Ideas Stores AP Homes
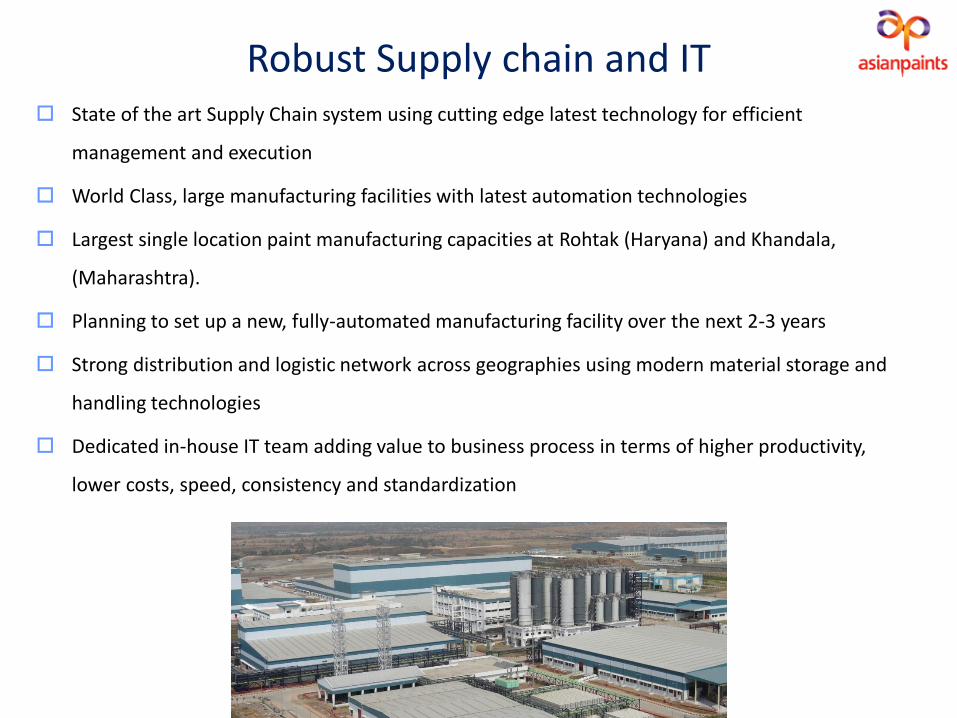
Robust Supply chain and IT State of the art Supply Chain system using cutting edge latest technology for efficient
management and execution
World Class, large manufacturing facilities with latest automation technologies
Largest single location paint manufacturing capacities at Rohtak (Haryana) and Khandala,
(Maharashtra).
Planning to set up a new, fully-automated manufacturing facility over the next 2-3 years
Strong distribution and logistic network across geographies using modern material storage and
handling technologies
Dedicated in-house IT team adding value to business process in terms of higher productivity,
lower costs, speed, consistency and standardization
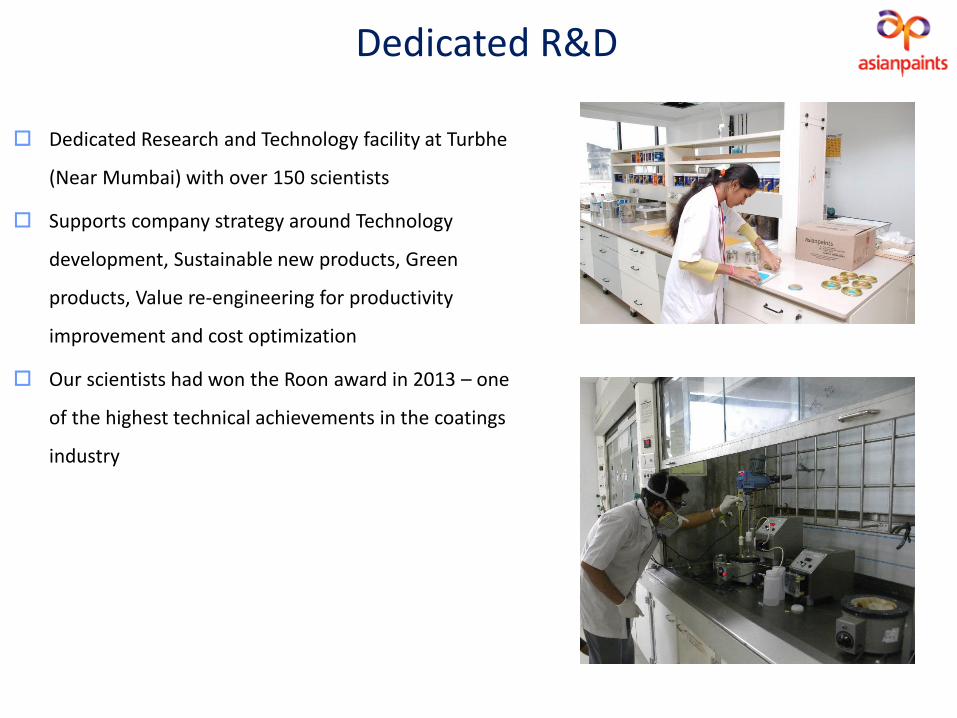
Dedicated R&D
Dedicated Research and Technology facility at Turbhe
(Near Mumbai) with over 150 scientists
Supports company strategy around Technology
development, Sustainable new products, Green
products, Value re-engineering for productivity
improvement and cost optimization
Our scientists had won the Roon award in 2013 – one
of the highest technical achievements in the coatings
industry
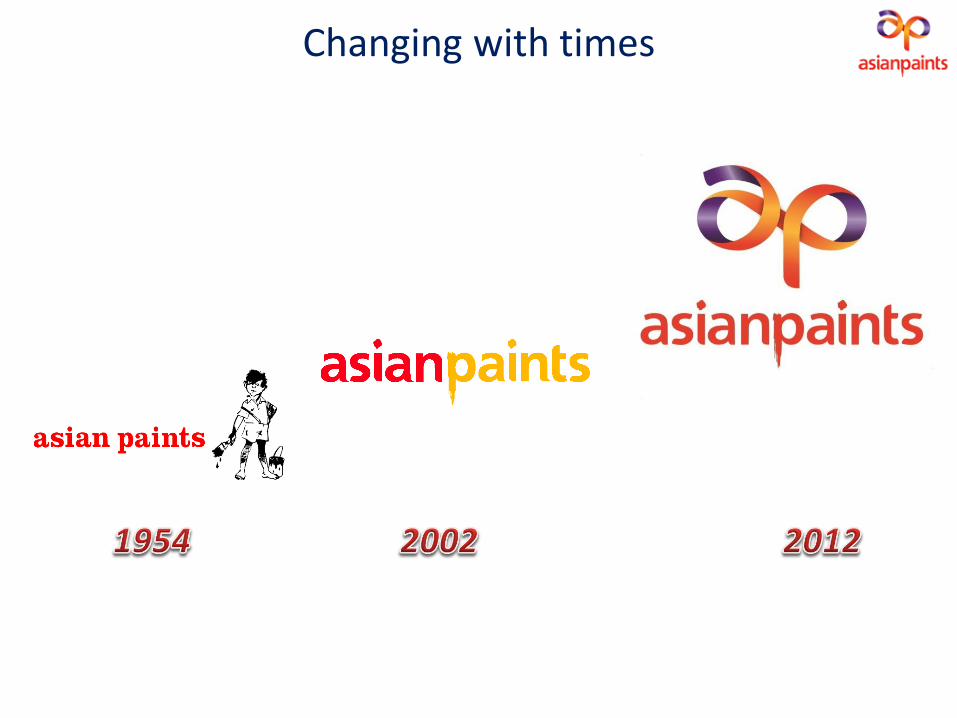
Changing with times
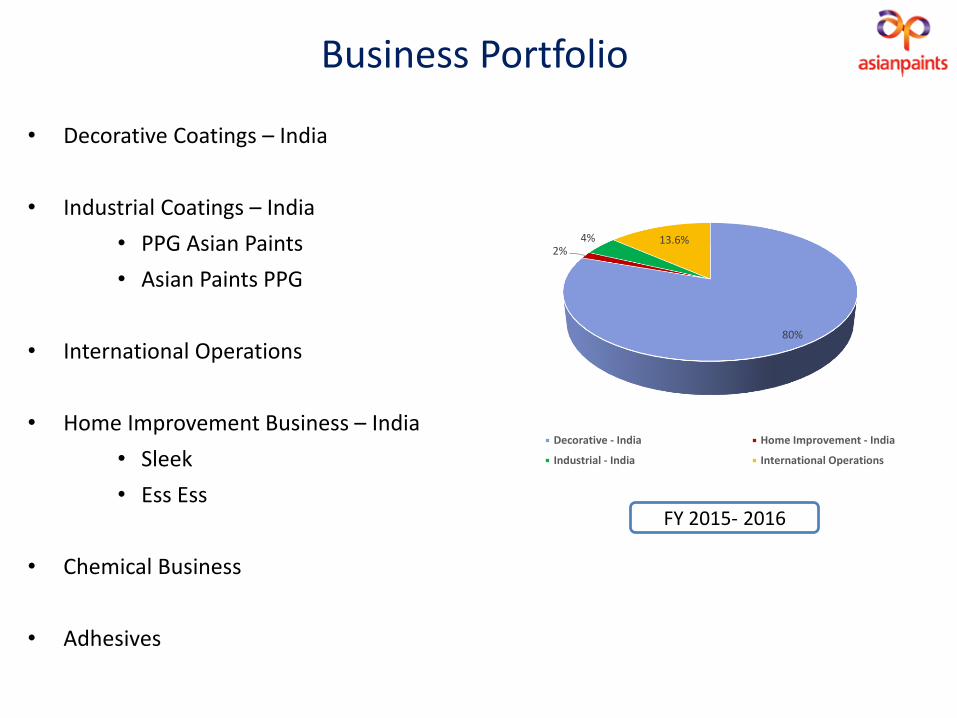
Business Portfolio
• Decorative Coatings – India
• Industrial Coatings – India
• PPG Asian Paints
• Asian Paints PPG
• International Operations
• Home Improvement Business – India
• Sleek
• Ess Ess
• Chemical Business
• Adhesives
FY 2015- 2016
80%
2%4% 13.6%
Decorative - India Home Improvement - India
Industrial - India International Operations
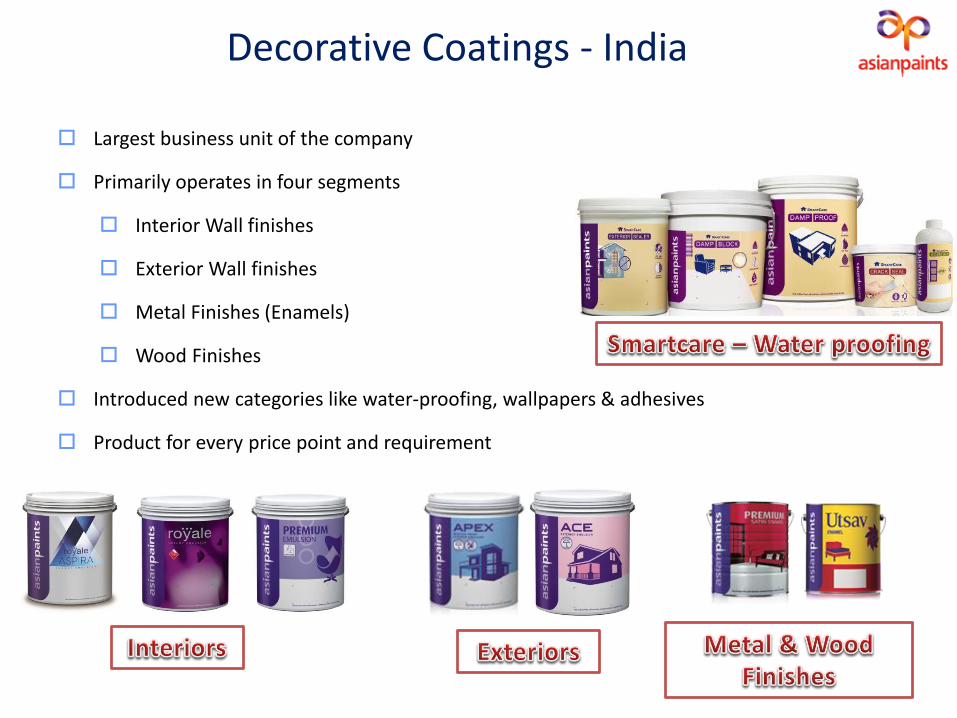
Decorative Coatings - India
Largest business unit of the company
Primarily operates in four segments
Interior Wall finishes
Exterior Wall finishes
Metal Finishes (Enamels)
Wood Finishes
Introduced new categories like water-proofing, wallpapers & adhesives
Product for every price point and requirement
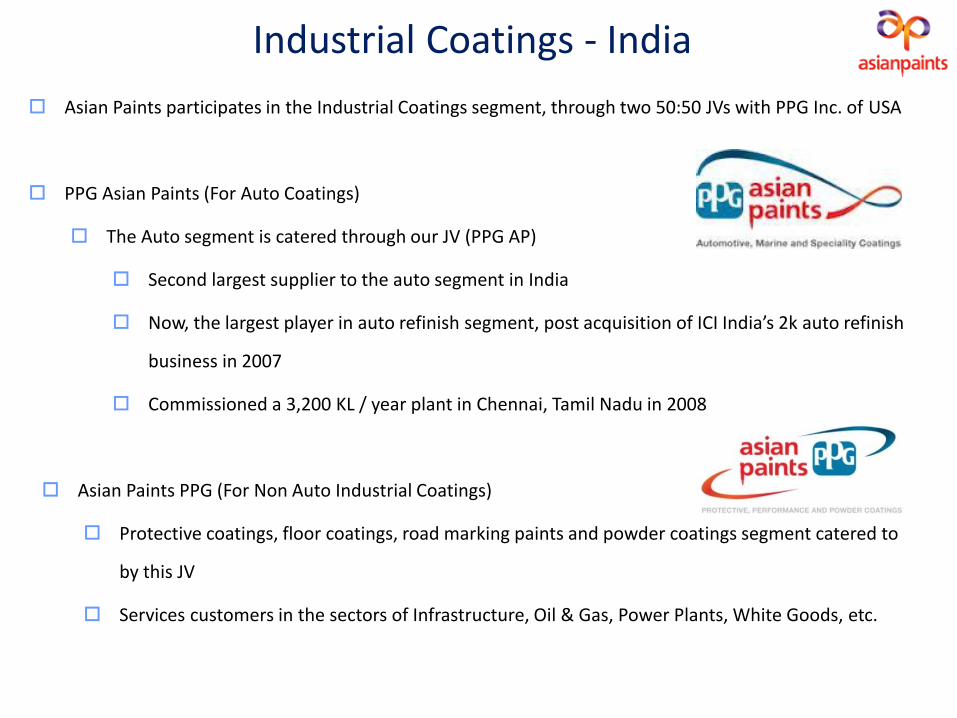
Industrial Coatings - India
Asian Paints participates in the Industrial Coatings segment, through two 50:50 JVs with PPG Inc. of USA
PPG Asian Paints (For Auto Coatings)
The Auto segment is catered through our JV (PPG AP)
Second largest supplier to the auto segment in India
Now, the largest player in auto refinish segment, post acquisition of ICI India’s 2k auto refinish
business in 2007
Commissioned a 3,200 KL / year plant in Chennai, Tamil Nadu in 2008
Asian Paints PPG (For Non Auto Industrial Coatings)
Protective coatings, floor coatings, road marking paints and powder coatings segment catered to
by this JV
Services customers in the sectors of Infrastructure, Oil & Gas, Power Plants, White Goods, etc.
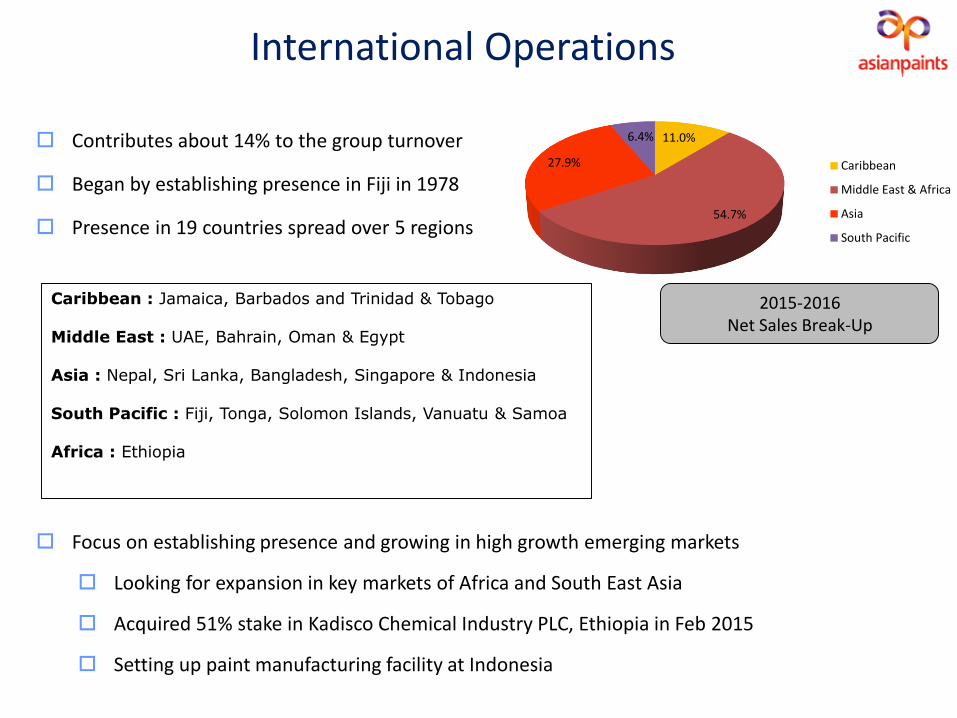
International Operations
Contributes about 14% to the group turnover
Began by establishing presence in Fiji in 1978
Presence in 19 countries spread over 5 regions
Focus on establishing presence and growing in high growth emerging markets
Looking for expansion in key markets of Africa and South East Asia
Acquired 51% stake in Kadisco Chemical Industry PLC, Ethiopia in Feb 2015
Setting up paint manufacturing facility at Indonesia
Caribbean : Jamaica, Barbados and Trinidad & Tobago
Middle East : UAE, Bahrain, Oman & Egypt
Asia : Nepal, Sri Lanka, Bangladesh, Singapore & Indonesia
South Pacific : Fiji, Tonga, Solomon Islands, Vanuatu & Samoa
Africa : Ethiopia
11.0%
54.7%
27.9%
6.4%
Caribbean
Middle East & Africa
Asia
South Pacific
2015-2016Net Sales Break-Up

Home Improvement Business - India
In 2012, Asian Paints announced plans to consider opportunities in the area of Home Improvement
and Décor
Entered Kitchen space in India in Aug’13 by acquiring 51% stake in Sleek International
Sleek is a major organized player in the modern kitchen solution space with pan India
presence
Engaged in the business of manufacturing, selling and distributing kitchens, kitchen
components including wire baskets, cabinets, appliances, accessories etc.
Retail network of more than 30 showrooms including shop-in-shops and 250+ dealers
Entered the Bathroom fitting business in June’14 through acquisition of front end sales business
(including brands, network and sales infrastructure) of ESS ESS Bathroom products Pvt Ltd
ESS ESS is a prominent player in the bath business segment in India and has high quality
products in this segment

Chemicals
Asian Paints manufactures Phthalic Anhydride (PAN) and Pentaerythritol (Penta)
PAN manufactured in Gujarat and Penta in Tamil Nadu
More than 50% consumed internally
Contributes about 1% to the group’s consolidated revenue
Contribution to the group’s revenue has been continuously decreasing

Consistent performance…
0
2,000
4,000
6,000
8,000
10,000
12,000
14,000
16,000
2005-2006 2015-2016
3,021
15,534
Consolidated Net Sales and Operating Income ( ` Crores)
CAGR 17.8%
0
200
400
600
800
1,000
1,200
1,400
1,600
1,800
2005-2006 2015-2016
212
1,726
Net Profit (` Crores)
CAGR 23.3%
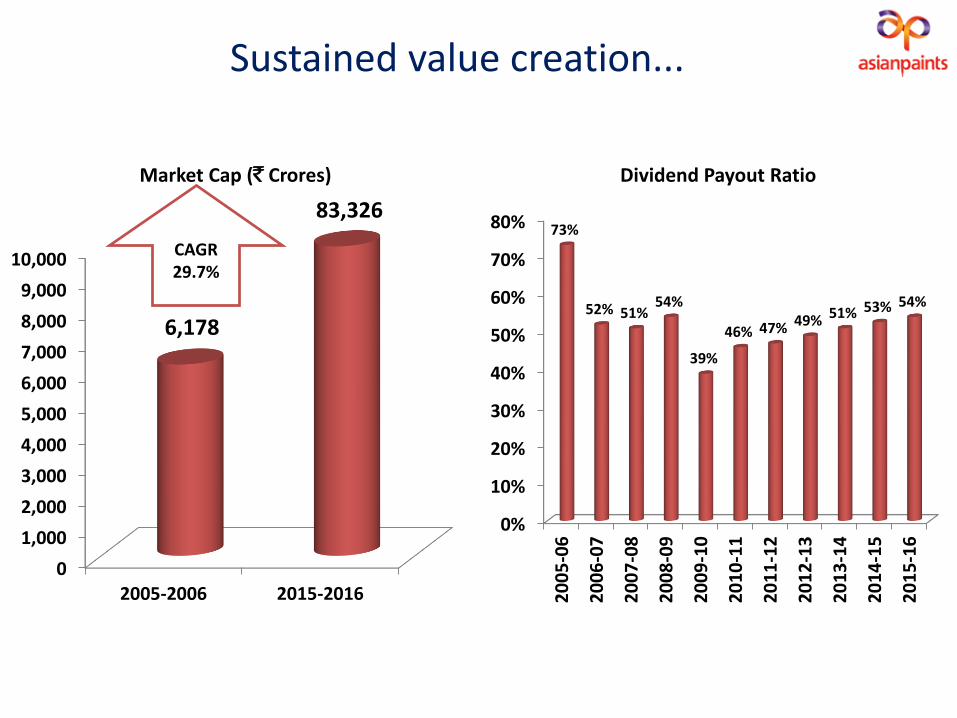
Sustained value creation...
0
1,000
2,000
3,000
4,000
5,000
6,000
7,000
8,000
9,000
10,000
2005-2006 2015-2016
6,178
83,326
Market Cap (` Crores)
CAGR 29.7%
0%
10%
20%
30%
40%
50%
60%
70%
80%
20
05
-06
20
06
-07
20
07
-08
20
08
-09
20
09
-10
20
10
-11
20
11
-12
20
12
-13
20
13
-14
20
14
-15
20
15
-16
73%
52% 51%54%
39%
46% 47% 49% 51% 53% 54%
Dividend Payout Ratio
Recent Accolades… Rated as the 5th most valuable Brand in India – Sept 2015 (Compiled by marketing and brand
consultancy Millward Brown and WPP Group)
Included in Forbes India’s List of “Super 50 companies in Inida’ in 2016
Felicitated as one of the ‘MOST IMPACTFUL COMPANIES OF THE DECADE’ by CNBC Awaaz in Jan
2015
Included in Forbes Magazine's - Asia's Fab 50 List of cos 4 years in a row from 2011
Ranked as the 4th most admired company in the FMCG Sector by Fortune India – Aug 2014
Presented with the Asian Centre for Corporate Governance & Sustainability Award for the Best
Governed Company in 2011
Asian Paints receives the Best Audit Committee Award from the Asian Centre for Corporate
Governance & Sustainability in 2011
“Sword of Honour" by the British Safety Council for all the paint plants in India, considered as the
pinnacle of achievement in safety across the world
Economic Environment – Q4 & 12M FY16
Financial Performance – Q4 & 12M FY16
Business Review – Q4 & 12M FY16
Risks and Outlook
Presentation structure
Group Overview
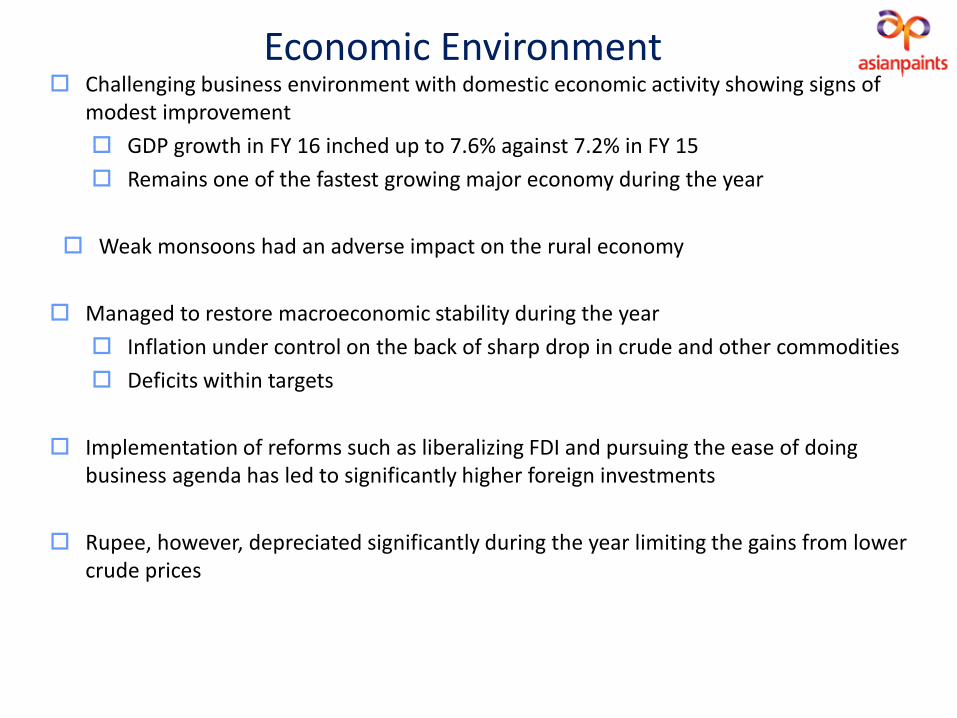
Economic Environment Challenging business environment with domestic economic activity showing signs of
modest improvement
GDP growth in FY 16 inched up to 7.6% against 7.2% in FY 15
Remains one of the fastest growing major economy during the year
Weak monsoons had an adverse impact on the rural economy
Managed to restore macroeconomic stability during the year
Inflation under control on the back of sharp drop in crude and other commodities
Deficits within targets
Implementation of reforms such as liberalizing FDI and pursuing the ease of doing business agenda has led to significantly higher foreign investments
Rupee, however, depreciated significantly during the year limiting the gains from lower crude prices
Economic Environment – Q4 & 12M FY16
Financial Performance – Q4 & 12M FY16
Business Review – Q4 & 12M FY16
Risks and Outlook
Presentation structure
Group Overview
Financials - Q4 & 12M FY16
27
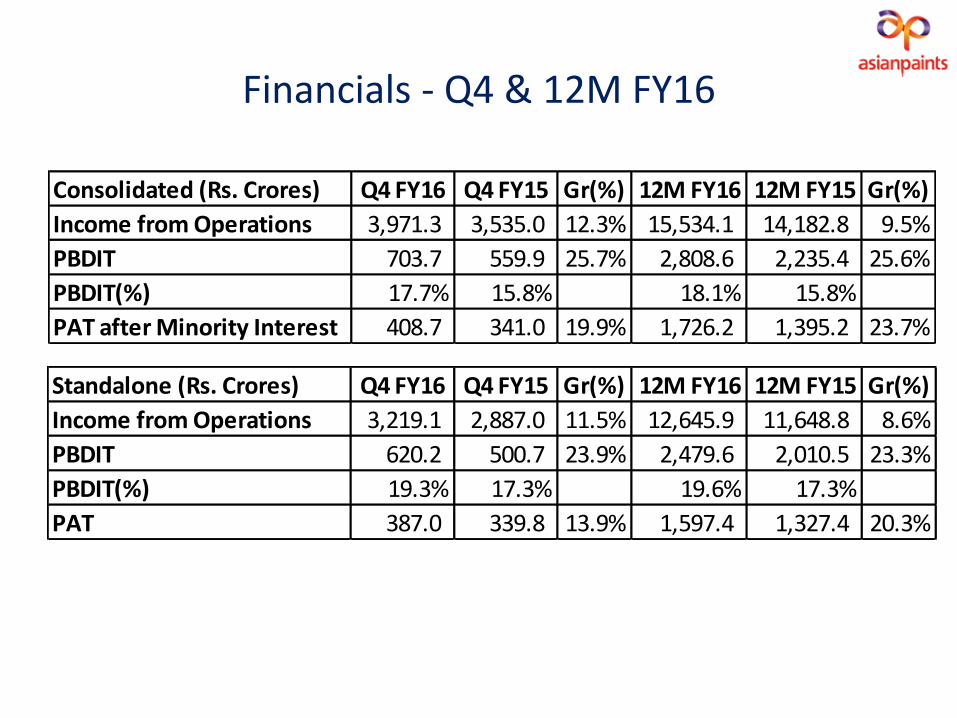
Consolidated (Rs. Crores) Q4 FY16 Q4 FY15 Gr(%) 12M FY16 12M FY15 Gr(%)
Income from Operations 3,971.3 3,535.0 12.3% 15,534.1 14,182.8 9.5%
PBDIT 703.7 559.9 25.7% 2,808.6 2,235.4 25.6%
PBDIT(%) 17.7% 15.8% 18.1% 15.8%
PAT after Minority Interest 408.7 341.0 19.9% 1,726.2 1,395.2 23.7%
Standalone (Rs. Crores) Q4 FY16 Q4 FY15 Gr(%) 12M FY16 12M FY15 Gr(%)
Income from Operations 3,219.1 2,887.0 11.5% 12,645.9 11,648.8 8.6%
PBDIT 620.2 500.7 23.9% 2,479.6 2,010.5 23.3%
PBDIT(%) 19.3% 17.3% 19.6% 17.3%
PAT 387.0 339.8 13.9% 1,597.4 1,327.4 20.3%
Gro
wth
ove
r La
st Y
ear
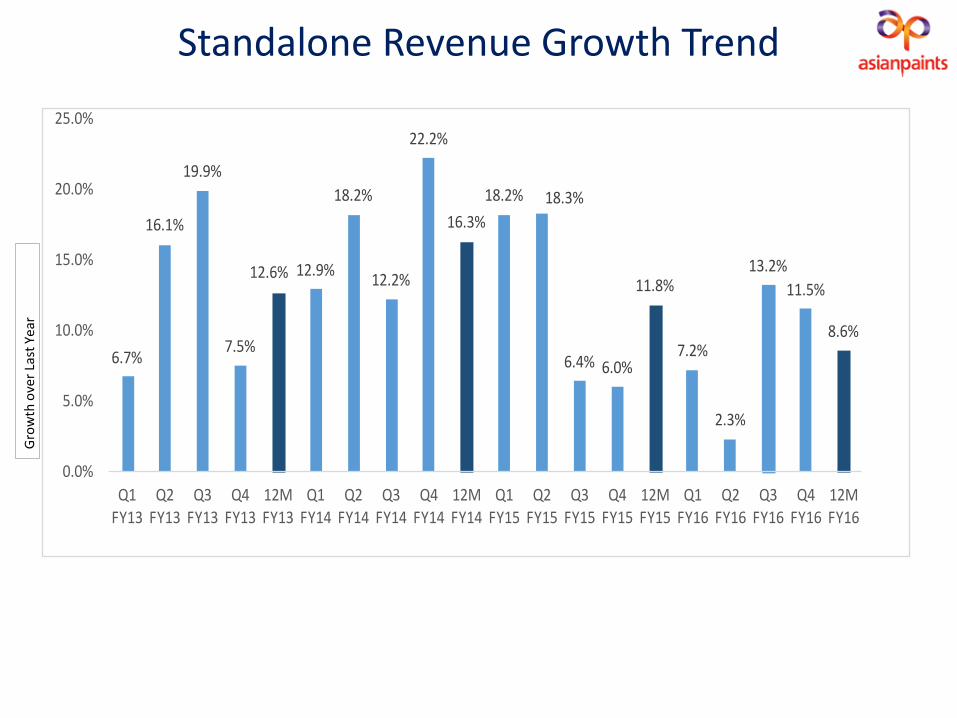
Standalone Revenue Growth Trend
28
6.7%
16.1%
19.9%
7.5%
12.6% 12.9%
18.2%
12.2%
22.2%
16.3%
18.2% 18.3%
6.4% 6.0%
11.8%
7.2%
2.3%
13.2%
11.5%
8.6%
0.0%
5.0%
10.0%
15.0%
20.0%
25.0%
Q1 FY13
Q2 FY13
Q3 FY13
Q4 FY13
12M FY13
Q1 FY14
Q2 FY14
Q3 FY14
Q4 FY14
12M FY14
Q1 FY15
Q2 FY15
Q3 FY15
Q4 FY15
12M FY15
Q1 FY16
Q2 FY16
Q3 FY16
Q4 FY16
12M FY16
In FY 2015-16
Total Dividend of Rs. 7.50 per share (750%)
Final dividend of Rs. 5.30 per share
Interim dividend of Rs. 2.20 per share
Payout ratio of 54.2% for the year (on standalone financials)
In FY 2014-15
Total Dividend of Rs. 6.10 per share (610%)
Final dividend of Rs. 4.30 per share
Interim dividend of Rs. 1.80 per share
Payout ratio of 52.6% for the year (on standalone financials)
Dividend
29
Economic Environment – Q4 & 12M FY16
Financial Performance – Q4 & 12M FY16
Business Review – Q4 & 12M FY16
Risks and Outlook
Presentation structure
Group Overview

Business Review : Q4 & 12M FY16
DECORATIVES BUSINESS
Decorative Paints business in India registered double digit volume growth for Q4 as well as for the full year
Good growth in the second half of the year, aided by very strong secondary demand in the festival season
Profitability improved mainly driven by lower material costs during the year
Cumulative price decrease of 2% for FY16 against increase of 0.39% in FY15
Price decrease of 2% effective 26th Feb’16
Continued focus on network expansion and opening new ‘Colour Ideas’ store
Over 300 ‘Colour Ideas’ stores across the country
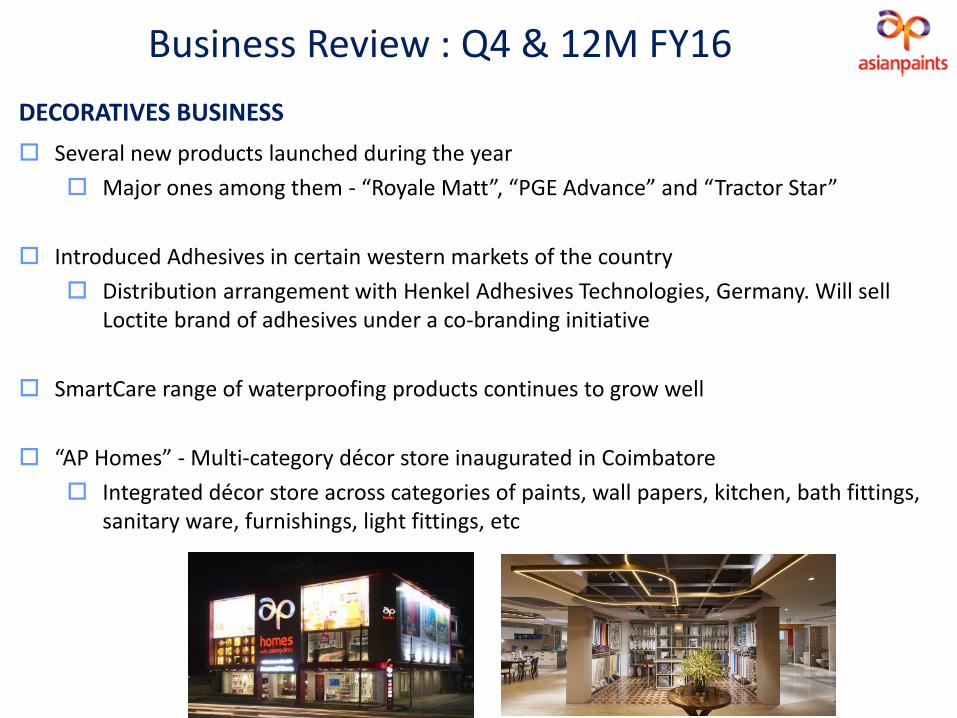
Business Review : Q4 & 12M FY16
DECORATIVES BUSINESS
Several new products launched during the year
Major ones among them - “Royale Matt”, “PGE Advance” and “Tractor Star”
Introduced Adhesives in certain western markets of the country
Distribution arrangement with Henkel Adhesives Technologies, Germany. Will sell Loctite brand of adhesives under a co-branding initiative
SmartCare range of waterproofing products continues to grow well
“AP Homes” - Multi-category décor store inaugurated in Coimbatore
Integrated décor store across categories of paints, wall papers, kitchen, bath fittings, sanitary ware, furnishings, light fittings, etc
Business Review : Q4 & 12M FY16
DECORATIVES BUSINESS
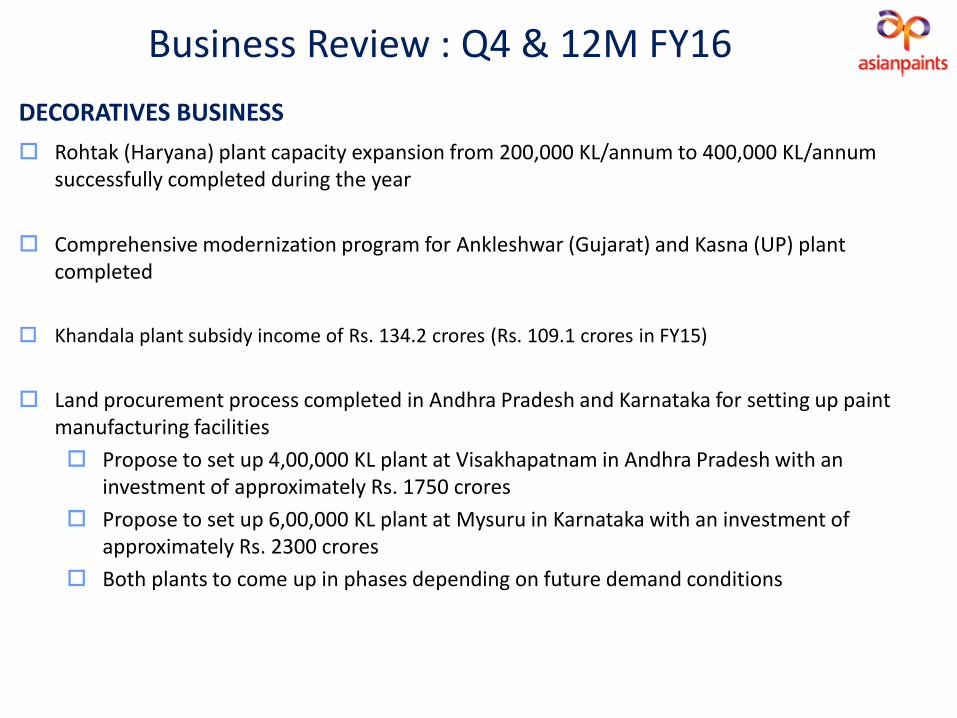
Rohtak (Haryana) plant capacity expansion from 200,000 KL/annum to 400,000 KL/annum successfully completed during the year
Comprehensive modernization program for Ankleshwar (Gujarat) and Kasna (UP) plant completed
Khandala plant subsidy income of Rs. 134.2 crores (Rs. 109.1 crores in FY15)
Land procurement process completed in Andhra Pradesh and Karnataka for setting up paint manufacturing facilities
Propose to set up 4,00,000 KL plant at Visakhapatnam in Andhra Pradesh with an investment of approximately Rs. 1750 crores
Propose to set up 6,00,000 KL plant at Mysuru in Karnataka with an investment of approximately Rs. 2300 crores
Both plants to come up in phases depending on future demand conditions

Business Review : Q4 & 12M FY16
INDUSTRIAL BUSINESS (PPG-AP)
Net sales grew by 3.8% to Rs. 1035.6 crores with PBIT of Rs. 93.1 crores in FY 16
Growth for the year led by Auto and Refinish segment
Falling raw material prices had a favorable impact
INDUSTRIAL BUSINESS (AP-PPG)
In FY16, Net Sales grew by 11.6% to Rs. 322.7 crores; PBIT at Rs. 7.1 crores
In particular, Road Marking segment witnessed good pick-up in demand during the year
Operating margins improved due to declining raw material prices
Note: Figures shown above are at 100%APL consolidated financials include 50% for both businesses
Business Review : Q4 & 12M FY16
INTERNATIONAL BUSINESS
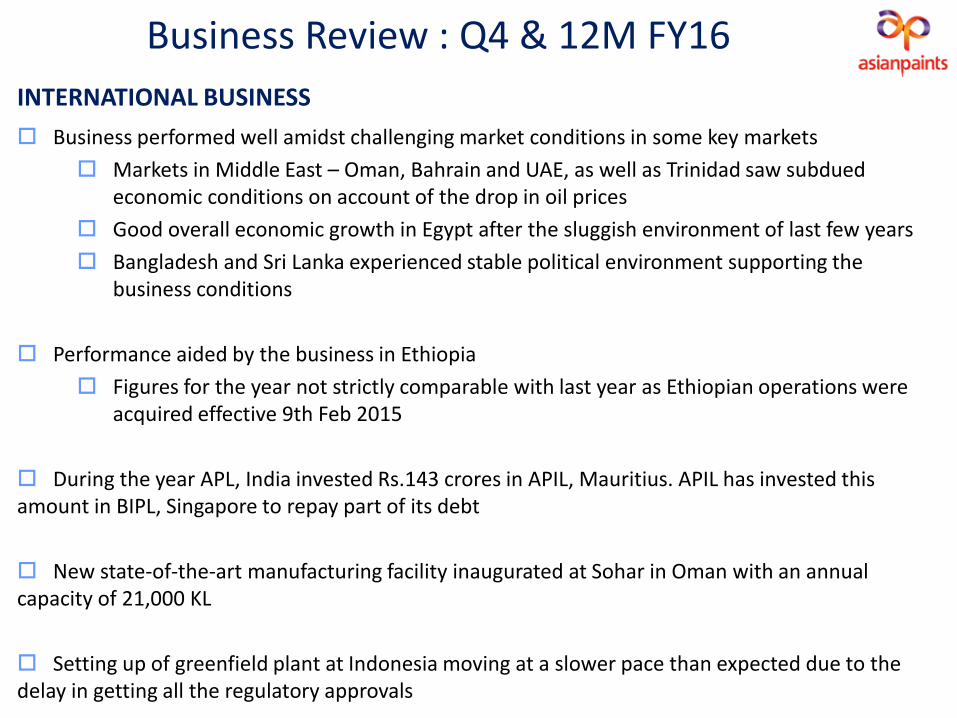
Business performed well amidst challenging market conditions in some key markets
Markets in Middle East – Oman, Bahrain and UAE, as well as Trinidad saw subdued economic conditions on account of the drop in oil prices
Good overall economic growth in Egypt after the sluggish environment of last few years
Bangladesh and Sri Lanka experienced stable political environment supporting the business conditions
Performance aided by the business in Ethiopia
Figures for the year not strictly comparable with last year as Ethiopian operations were acquired effective 9th Feb 2015
During the year APL, India invested Rs.143 crores in APIL, Mauritius. APIL has invested this amount in BIPL, Singapore to repay part of its debt
New state-of-the-art manufacturing facility inaugurated at Sohar in Oman with an annual capacity of 21,000 KL
Setting up of greenfield plant at Indonesia moving at a slower pace than expected due to the delay in getting all the regulatory approvals
INTERNATIONAL BUSINESS
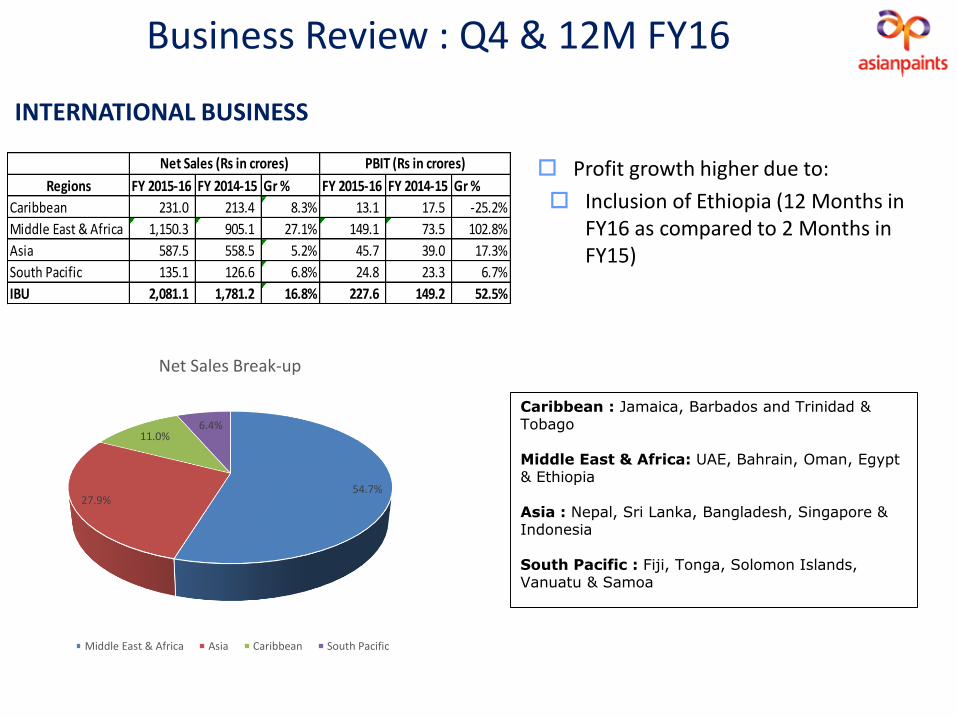
Caribbean : Jamaica, Barbados and Trinidad & Tobago
Middle East & Africa: UAE, Bahrain, Oman, Egypt & Ethiopia
Asia : Nepal, Sri Lanka, Bangladesh, Singapore & Indonesia
South Pacific : Fiji, Tonga, Solomon Islands, Vanuatu & Samoa
Profit growth higher due to:
Inclusion of Ethiopia (12 Months in FY16 as compared to 2 Months in FY15)
36
Regions FY 2015-16 FY 2014-15 Gr % FY 2015-16 FY 2014-15 Gr %
Caribbean 231.0 213.4 8.3% 13.1 17.5 -25.2%
Middle East & Africa 1,150.3 905.1 27.1% 149.1 73.5 102.8%
Asia 587.5 558.5 5.2% 45.7 39.0 17.3%
South Pacific 135.1 126.6 6.8% 24.8 23.3 6.7%
IBU 2,081.1 1,781.2 16.8% 227.6 149.2 52.5%
Net Sales (Rs in crores) PBIT (Rs in crores)
Business Review : Q4 & 12M FY16
54.7%27.9%
11.0%6.4%
Net Sales Break-up
Middle East & Africa Asia Caribbean South Pacific

Business Review: Q4 & 12M FY16 HOME IMPROVEMENT BUSINESS
SLEEK
Registered Net Sales of Rs. 134.7 crores in FY16; PBIT Loss of Rs. 19.0 crores during the year
Network expansion with addition of new distributors and dealers for the components business
Launched “Smart kitchen range” for easy installation and design
Pace of progress has been slower than that envisaged earlier, with weak consumer sentiment adding to the pressure
Have taken a provision for diminution in the value of the investment made in Sleek to the tune of Rs. 65.30 crores in Q3FY16 based on the assessment of the fair value of investment
Business Review: Q4 & 12M FY16 HOME IMPROVEMENT BUSINESS
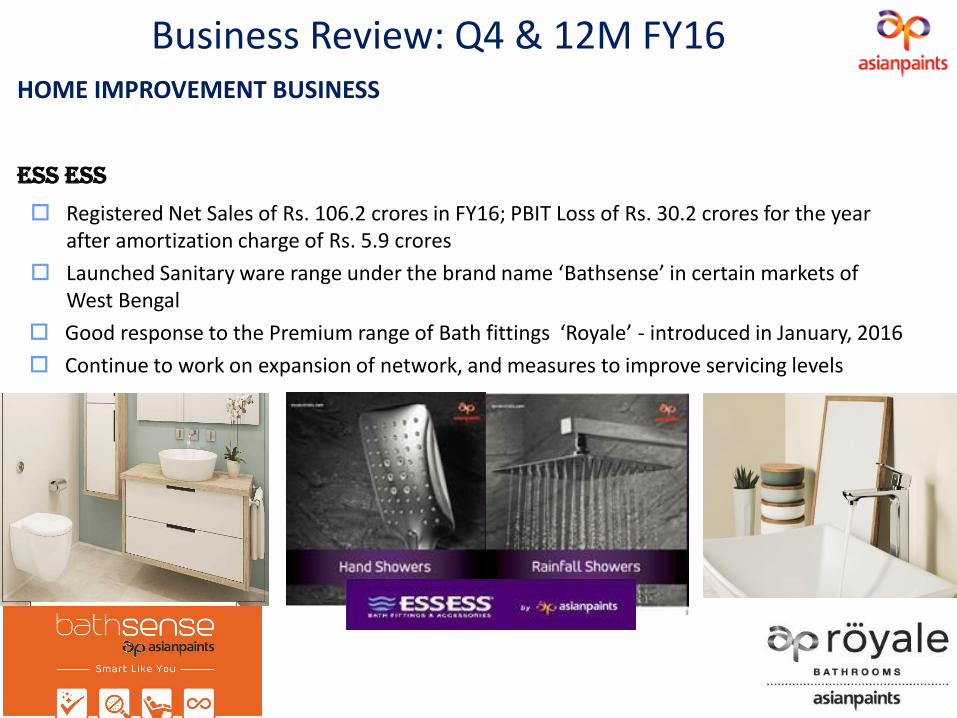
ESS ESS
Registered Net Sales of Rs. 106.2 crores in FY16; PBIT Loss of Rs. 30.2 crores for the year after amortization charge of Rs. 5.9 crores
Launched Sanitary ware range under the brand name ‘Bathsense’ in certain markets of West Bengal
Good response to the Premium range of Bath fittings ‘Royale’ - introduced in January, 2016
Continue to work on expansion of network, and measures to improve servicing levels

Economic Environment – Q4 & 12M FY16
Financial Performance – Q4 & 12M Y16
Business Review – Q4 & 12M FY16
Risks and Outlook
Presentation structure
Group Overview
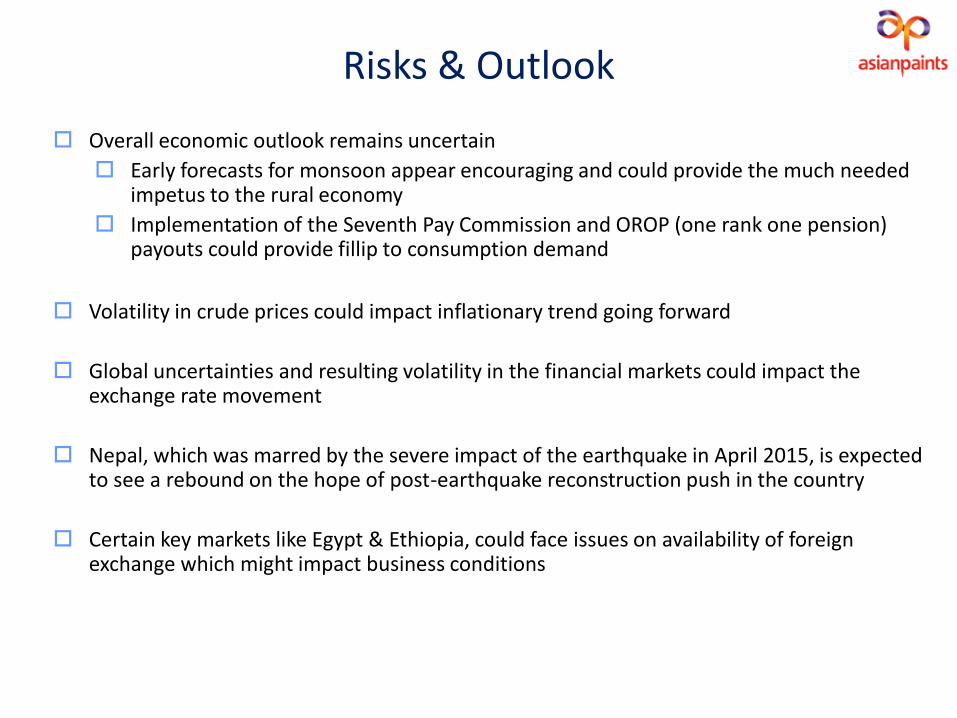
Risks & Outlook
Overall economic outlook remains uncertain
Early forecasts for monsoon appear encouraging and could provide the much needed impetus to the rural economy
Implementation of the Seventh Pay Commission and OROP (one rank one pension) payouts could provide fillip to consumption demand
Volatility in crude prices could impact inflationary trend going forward
Global uncertainties and resulting volatility in the financial markets could impact the exchange rate movement
Nepal, which was marred by the severe impact of the earthquake in April 2015, is expected to see a rebound on the hope of post-earthquake reconstruction push in the country
Certain key markets like Egypt & Ethiopia, could face issues on availability of foreign exchange which might impact business conditions

Thank you
42
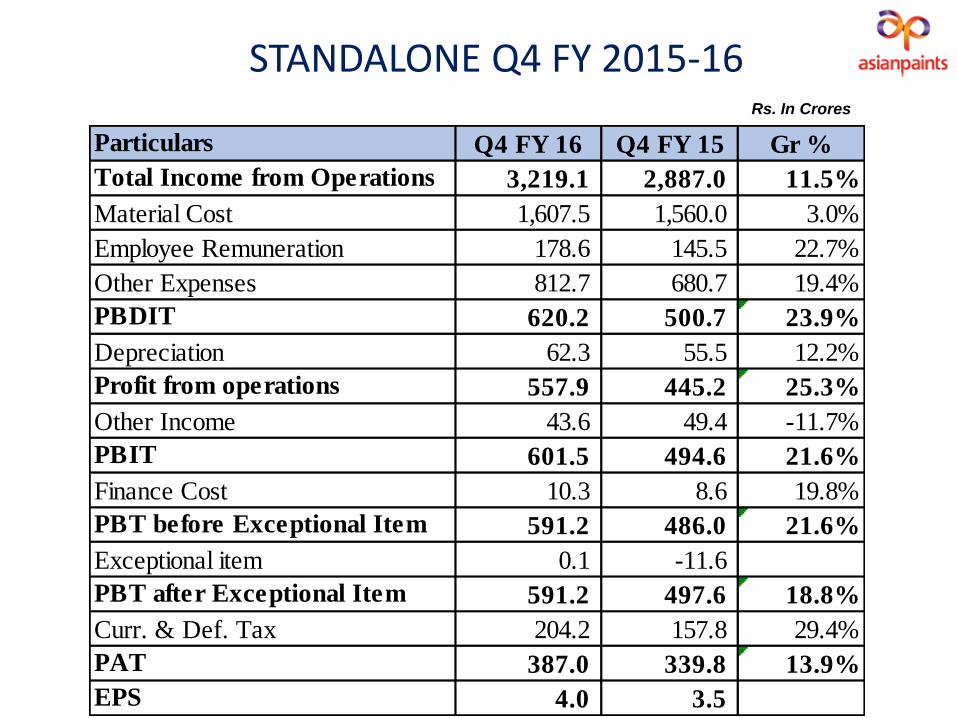
STANDALONE Q4 FY 2015-16
Particulars Q4 FY 16 Q4 FY 15 Gr %
Total Income from Operations 3,219.1 2,887.0 11.5%
Material Cost 1,607.5 1,560.0 3.0%
Employee Remuneration 178.6 145.5 22.7%
Other Expenses 812.7 680.7 19.4%
PBDIT 620.2 500.7 23.9%
Depreciation 62.3 55.5 12.2%
Profit from operations 557.9 445.2 25.3%
Other Income 43.6 49.4 -11.7%
PBIT 601.5 494.6 21.6%
Finance Cost 10.3 8.6 19.8%
PBT before Exceptional Item 591.2 486.0 21.6%
Exceptional item 0.1 -11.6
PBT after Exceptional Item 591.2 497.6 18.8%
Curr. & Def. Tax 204.2 157.8 29.4%
PAT 387.0 339.8 13.9%
EPS 4.0 3.5
Rs. In Crores

43
CONSOLIDATED Q4 FY 2015-16
Particulars Q4 FY 16 Q4 FY 15 Gr %
Total Income from Operations 3,971.3 3,535.0 12.3%
Material Cost 2,027.0 1,941.9 4.4%
Employee cost 276.6 216.4 27.8%
Other Expenses 964.0 816.8 18.0%
PBDIT 703.7 559.9 25.7%
Depreciation 75.3 67.2 12.1%
Proft from Operations 628.4 492.8 27.5%
Other Income 34.0 41.7 -18.4%
PBIT 662.4 534.4 24.0%
Finance Cost 14.8 10.2 44.9%
PBT before Exceptional Item 647.6 524.2 23.5%
Exceptional Item 0.0 2.4
PBT after Exceptional Item 647.6 521.8 24.1%
Curr. & Def Tax 225.4 169.8 32.7%
PAT before Minority interest 422.3 352.0 20.0%
Minority Share 13.5 11.0 22.7%
PAT to parent Shareholders 408.7 341.0 19.9%
EPS 4.3 3.6
Rs. In Crores
44
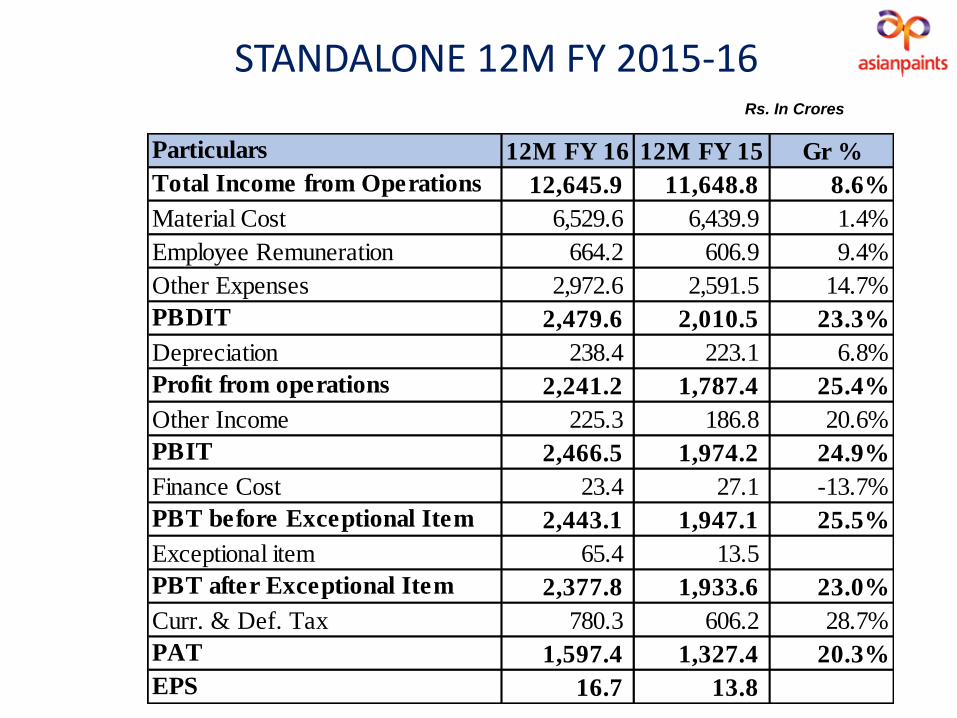
STANDALONE 12M FY 2015-16
Particulars 12M FY 16 12M FY 15 Gr %
Total Income from Operations 12,645.9 11,648.8 8.6%
Material Cost 6,529.6 6,439.9 1.4%
Employee Remuneration 664.2 606.9 9.4%
Other Expenses 2,972.6 2,591.5 14.7%
PBDIT 2,479.6 2,010.5 23.3%
Depreciation 238.4 223.1 6.8%
Profit from operations 2,241.2 1,787.4 25.4%
Other Income 225.3 186.8 20.6%
PBIT 2,466.5 1,974.2 24.9%
Finance Cost 23.4 27.1 -13.7%
PBT before Exceptional Item 2,443.1 1,947.1 25.5%
Exceptional item 65.4 13.5
PBT after Exceptional Item 2,377.8 1,933.6 23.0%
Curr. & Def. Tax 780.3 606.2 28.7%
PAT 1,597.4 1,327.4 20.3%
EPS 16.7 13.8
Rs. In Crores

45
CONSOLIDATED 12M FY 2015-16
Particulars 12M FY 16 12M FY 15 Gr %
Total Income from Operations 15,534.1 14,182.8 9.5%
Material Cost 8,205.6 7,971.5 2.9%
Employee cost 1,017.8 907.1 12.2%
Other Expenses 3,502.1 3,068.8 14.1%
PBDIT 2,808.6 2,235.4 25.6%
Depreciation 288.0 265.9 8.3%
Proft from Operations 2,520.6 1,969.5 28.0%
Other Income 200.7 169.7 18.3%
PBIT 2,721.4 2,139.2 27.2%
Finance Cost 40.5 34.8 16.5%
PBT before Exceptional Item 2,680.9 2,104.4 27.4%
Exceptional Item 52.5 27.6 90.2%
PBT after Exceptional Item 2,628.4 2,076.9 26.6%
Curr. & Def Tax 849.1 649.5 30.7%
PAT before Minority interest 1,779.3 1,427.3 24.7%
Minority Share 53.1 32.2 64.9%
PAT to parent Shareholders 1,726.2 1,395.2 23.7%
EPS 18.0 14.5
Rs. In Crores
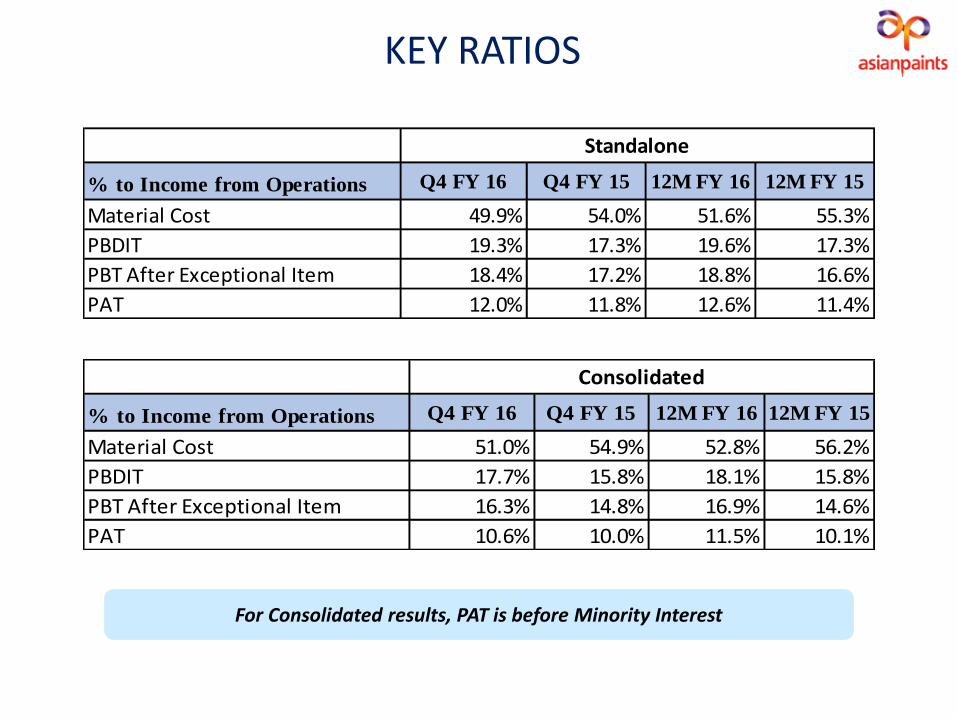
KEY RATIOS
46
% to Income from Operations Q4 FY 16 Q4 FY 15 12M FY 16 12M FY 15
Material Cost 49.9% 54.0% 51.6% 55.3%
PBDIT 19.3% 17.3% 19.6% 17.3%
PBT After Exceptional Item 18.4% 17.2% 18.8% 16.6%
PAT 12.0% 11.8% 12.6% 11.4%
Standalone
% to Income from Operations Q4 FY 16 Q4 FY 15 12M FY 16 12M FY 15
Material Cost 51.0% 54.9% 52.8% 56.2%
PBDIT 17.7% 15.8% 18.1% 15.8%
PBT After Exceptional Item 16.3% 14.8% 16.9% 14.6%
PAT 10.6% 10.0% 11.5% 10.1%
Consolidated
For Consolidated results, PAT is before Minority Interest