
Trends in the Agricultural Sector
80
Trends in the Agricultural Sector 2016
Transcript of Trends in the Agricultural Sector

Trends in the
Agricultural Sector
2016

ECONOMIC REVIEW FOR THE 12 MONTHS THAT ENDED ON 30 JUNE 2016
Volume of agricultural production 1 Producer prices of agricultural products 2 Gross value of agricultural production 2 Farming income 3 Expenditure on intermediate goods and services 5 Prices of farming requisites 5 Domestic terms of trade in agriculture (2010 = 1) 6 Contribution of agriculture to value added at basic prices 6 Capital assets and investment in agriculture 7 Farming debt 8 Cash flow of farmers 8 Consumption expenditure on food 9 Consumer prices 9 Imports and exports of agricultural products .10
BRANCHES OF THE INDUSTRY
Field crop husbandry
Maize 11 Sorghum 17 Wheat 20 Malting barley 23 Sunflower seed 26 Soya beans 29 Groundnuts 33 Canola 35 Cotton 38 Dry beans 40 Sugar 42
Horticulture
Deciduous fruit 45 Dried fruit 48 Viticulture 50 Subtropical fruit 52 Citrus fruit 55 Vegetables (excluding potatoes) 57 Tomatoes 60 Onions 62 Potatoes 64
Animal production
Livestock numbers 66 Red meat 70 Poultry 71 Milk 74 Wool 75 Mohair 77
2017
All rights reserved
Printed and published by the
Department of Agriculture, Forestry
and Fisheries
Pretoria
Obtainable from the
Department of Agriculture, Forestry
and Fisheries
Directorate Communication Services
Private Bag X144
PRETORIA 0001
ISSN 1026-0986
Trends in the
Agricultural Sector
2016
Contents Page No.

Trends in the Agricultural Sector 2016 Department of Agriculture, Forestry and Fisheries 1
Economic review for the 12 months that ended on 30 June 2016
Volume of agricultural production
The estimated volume of agricultural production in 2015/16 was 1,6% less than in 2014/15.
The field crop production volume decreased by 12,7%, mainly as a result of decreases in the production of
summer crops (maize and sorghum), winter crops (wheat and canola), as well as oilseed crops (soya beans
and groundnuts) and sugar cane. Maize production decreased by 2,9 million tons (27,6%) and sorghum by
36 800 tons (26,6%) from the previous season. Wheat production decreased by 311 377 tons (17,7%) and
canola by 27 270 tons (22,5%) from 2014/15. Soya beans production decreased by 319 750 tons (29,9%)
and groundnut production by 37 358 tons (53,0%) from 2014/15. The production of sugar cane decreased by
283 559 tons (1,9%) from 2014/15.
Horticultural production for 2015/16 decreased by 1,5% from the previous season, which can mainly be
attributed to decreases in the production of subtropical fruit, vegetables, citrus fruit and deciduous fruit. The
decrease in the production of mangoes by 34 687 tons (45,8%), bananas by 22 963 tons (5,4%) and
avocadoes by 15 411 tons (15,7%) led to a decrease in subtropical fruit production from 2014/15. The
decrease in the production of tomatoes by 96 248 tons (17,8%) mainly led to a decrease in the production of
vegetables compared to the previous season. In the case of citrus fruit, the production of oranges decreased
by 44 751 tons (2,5%) and grapefruit by 26 840 tons (6,4%) from 2014/15. Regarding deciduous fruit, wine
grapes production decreased by 49 399 tons (2,4%), apricots by 15 282 tons (31,1%) and peaches by 7 563
tons (3,9%) from 2014/15.
Animal production increased by 2,9%, mainly as a result of increases in the production of poultry meat (by
54 170 tons or 3,1%), as well as eggs (by 12 183 tons or 2,2%) from 2014/15.
80
85
90
95
100
105
110
115
120
2011/12 2012/13 2013/14 2014/15 2015/16
2010 =
100
Year
Volume index of agricultural production 2011/12–2015/16 (July to June)
Field crops Horticulture Animal products
Trends in the Agricultural Sector 2016 Department of Agriculture, Forestry and Fisheries 2
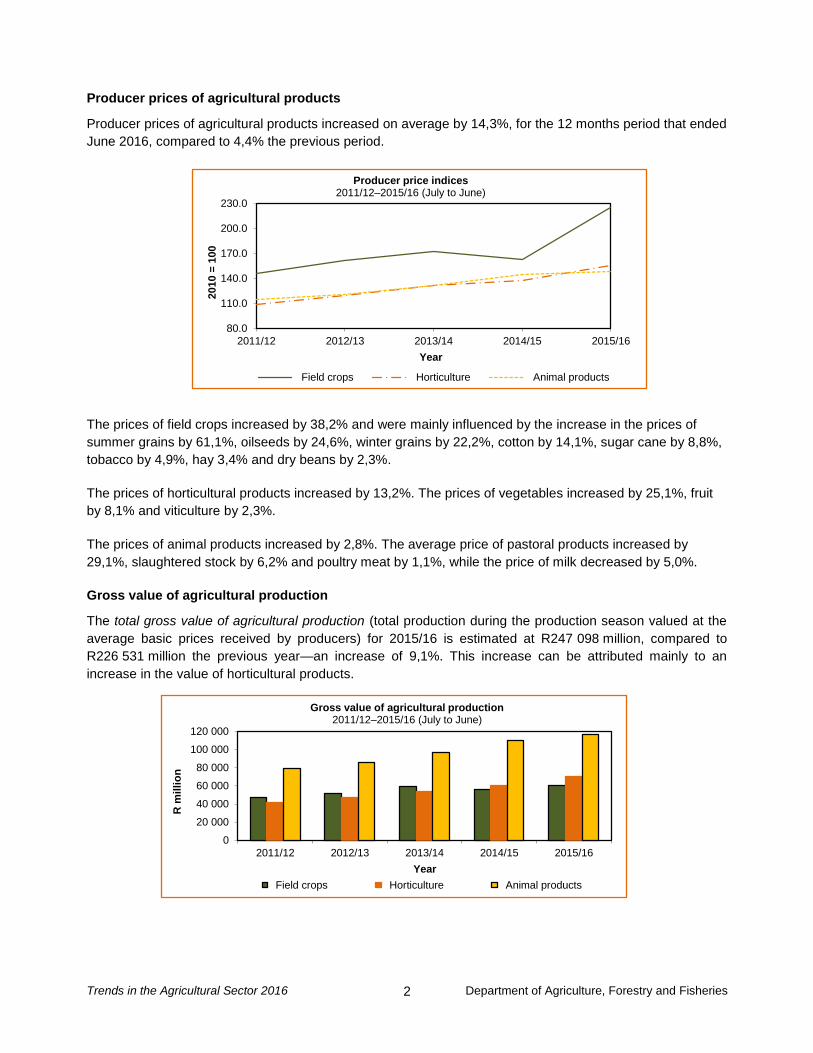
Producer prices of agricultural products
Producer prices of agricultural products increased on average by 14,3%, for the 12 months period that ended
June 2016, compared to 4,4% the previous period.
The prices of field crops increased by 38,2% and were mainly influenced by the increase in the prices of
summer grains by 61,1%, oilseeds by 24,6%, winter grains by 22,2%, cotton by 14,1%, sugar cane by 8,8%,
tobacco by 4,9%, hay 3,4% and dry beans by 2,3%.
The prices of horticultural products increased by 13,2%. The prices of vegetables increased by 25,1%, fruit
by 8,1% and viticulture by 2,3%.
The prices of animal products increased by 2,8%. The average price of pastoral products increased by
29,1%, slaughtered stock by 6,2% and poultry meat by 1,1%, while the price of milk decreased by 5,0%.
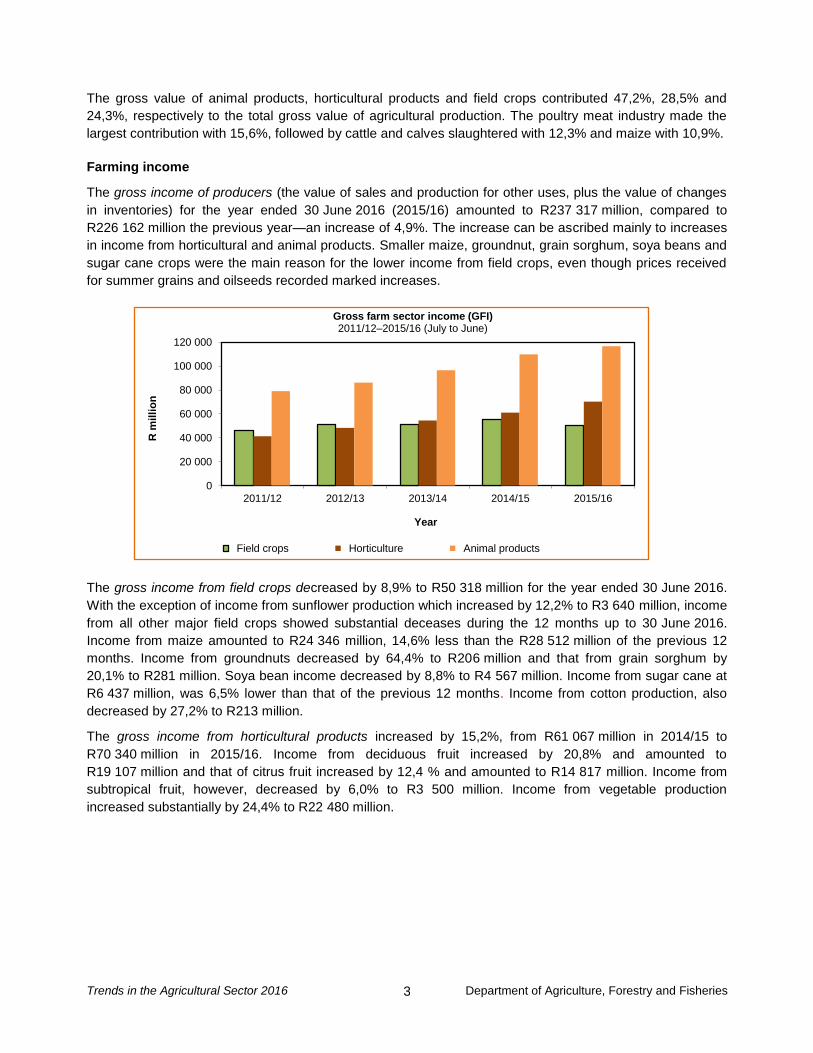
Gross value of agricultural production
The total gross value of agricultural production (total production during the production season valued at the
average basic prices received by producers) for 2015/16 is estimated at R247 098 million, compared to
R226 531 million the previous year—an increase of 9,1%. This increase can be attributed mainly to an
increase in the value of horticultural products.
80.0
110.0
140.0
170.0
200.0
230.0
2011/12 2012/13 2013/14 2014/15 2015/16
2010 =
100
Year
Producer price indices 2011/12–2015/16 (July to June)
Field crops Horticulture Animal products
0
20 000
40 000
60 000
80 000
100 000
120 000
2011/12 2012/13 2013/14 2014/15 2015/16
R m
illi
on
Year
Gross value of agricultural production 2011/12–2015/16 (July to June)
Field crops Horticulture Animal products
Trends in the Agricultural Sector 2016 Department of Agriculture, Forestry and Fisheries 3
The gross value of animal products, horticultural products and field crops contributed 47,2%, 28,5% and
24,3%, respectively to the total gross value of agricultural production. The poultry meat industry made the
largest contribution with 15,6%, followed by cattle and calves slaughtered with 12,3% and maize with 10,9%.
Farming income
The gross income of producers (the value of sales and production for other uses, plus the value of changes
in inventories) for the year ended 30 June 2016 (2015/16) amounted to R237 317 million, compared to
R226 162 million the previous year—an increase of 4,9%. The increase can be ascribed mainly to increases
in income from horticultural and animal products. Smaller maize, groundnut, grain sorghum, soya beans and
sugar cane crops were the main reason for the lower income from field crops, even though prices received
for summer grains and oilseeds recorded marked increases.
The gross income from field crops decreased by 8,9% to R50 318 million for the year ended 30 June 2016.
With the exception of income from sunflower production which increased by 12,2% to R3 640 million, income
from all other major field crops showed substantial deceases during the 12 months up to 30 June 2016.
Income from maize amounted to R24 346 million, 14,6% less than the R28 512 million of the previous 12
months. Income from groundnuts decreased by 64,4% to R206 million and that from grain sorghum by
20,1% to R281 million. Soya bean income decreased by 8,8% to R4 567 million. Income from sugar cane at
R6 437 million, was 6,5% lower than that of the previous 12 months. Income from cotton production, also
decreased by 27,2% to R213 million.
The gross income from horticultural products increased by 15,2%, from R61 067 million in 2014/15 to
R70 340 million in 2015/16. Income from deciduous fruit increased by 20,8% and amounted to
R19 107 million and that of citrus fruit increased by 12,4 % and amounted to R14 817 million. Income from
subtropical fruit, however, decreased by 6,0% to R3 500 million. Income from vegetable production
increased substantially by 24,4% to R22 480 million.
0
20 000
40 000
60 000
80 000
100 000
120 000
2011/12 2012/13 2013/14 2014/15 2015/16
R m
illi
on
Year
Gross farm sector income (GFI) 2011/12–2015/16 (July to June)
Field crops Horticulture Animal products
Trends in the Agricultural Sector 2016 Department of Agriculture, Forestry and Fisheries 4
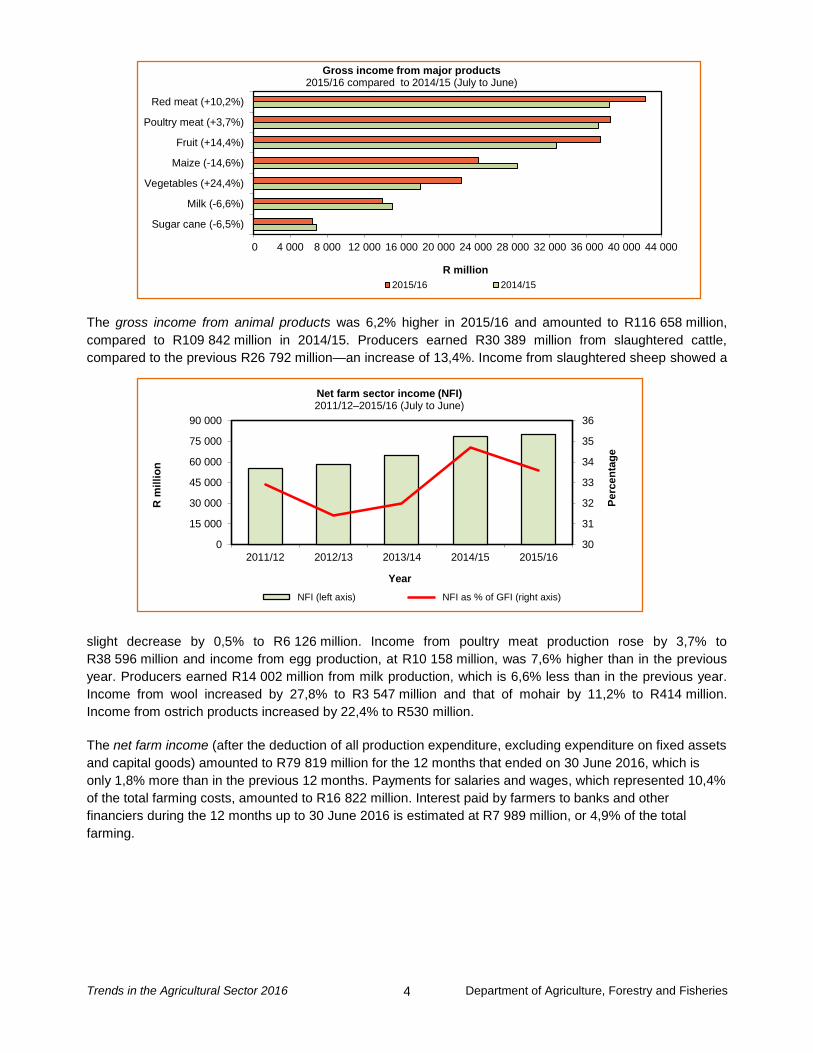
The gross income from animal products was 6,2% higher in 2015/16 and amounted to R116 658 million,
compared to R109 842 million in 2014/15. Producers earned R30 389 million from slaughtered cattle,
compared to the previous R26 792 million—an increase of 13,4%. Income from slaughtered sheep showed a
slight decrease by 0,5% to R6 126 million. Income from poultry meat production rose by 3,7% to
R38 596 million and income from egg production, at R10 158 million, was 7,6% higher than in the previous
year. Producers earned R14 002 million from milk production, which is 6,6% less than in the previous year.
Income from wool increased by 27,8% to R3 547 million and that of mohair by 11,2% to R414 million.
Income from ostrich products increased by 22,4% to R530 million.
The net farm income (after the deduction of all production expenditure, excluding expenditure on fixed assets
and capital goods) amounted to R79 819 million for the 12 months that ended on 30 June 2016, which is
only 1,8% more than in the previous 12 months. Payments for salaries and wages, which represented 10,4%
of the total farming costs, amounted to R16 822 million. Interest paid by farmers to banks and other
financiers during the 12 months up to 30 June 2016 is estimated at R7 989 million, or 4,9% of the total
farming.
0 4 000 8 000 12 000 16 000 20 000 24 000 28 000 32 000 36 000 40 000 44 000
Sugar cane (-6,5%)
Milk (-6,6%)
Vegetables (+24,4%)
Maize (-14,6%)
Fruit (+14,4%)
Poultry meat (+3,7%)
Red meat (+10,2%)
R million
Gross income from major products 2015/16 compared to 2014/15 (July to June)
2015/16 2014/15
30
31
32
33
34
35
36
0
15 000
30 000
45 000
60 000
75 000
90 000
2011/12 2012/13 2013/14 2014/15 2015/16
Perc
en
tag
e
R m
illi
on
Year
Net farm sector income (NFI) 2011/12–2015/16 (July to June)
NFI (left axis) NFI as % of GFI (right axis)

Trends in the Agricultural Sector 2016 Department of Agriculture, Forestry and Fisheries 5
Expenditure on intermediate goods and services
Intermediate expenditure refers to the value of goods and services that were purchased for
consumption as inputs during the production process.
Expenditure on intermediate goods and services increased by 6,8% to R128 458 million in 2015/16, from
R120 227 million in 2014/15. Farm feeds was the largest expenditure item, accounting for 29,0%, followed
by maintenance and repairs on machinery and implements by 13,8%, farm services by 12,4%, fuel by 8,9%,
animal health and crop protection and seed and plants by 6,3% each, fertilisers by 5,2%, packing material by
4,7% and building and fencing material by 3,9%.
Prices of farming requisites
Prices of farming requisites remained unchanged at 4,8% in 2015/16. The prices of tractors increased on
average by 11,6%, building material by 7,2%, animal health and plant protection by 5,5%, trucks by 5,4%,
feeds by 5,3%, maintenance and repairs by 5,1%, seeds by 5,0%, packaging material by 4,3%, fencing
material by 3,6% and fuel by 1,9%.
The combined index of machinery and implements’ prices increased by 6,7% for 2015/16. The price index of
materials for fixed improvements increased by 5,9% and the index of intermediate goods and services
increased by 4,5%.
8 000
16 000
24 000
32 000
40 000
2011/12 2012/13 2013/14 2014/15 2015/16
R m
illi
on
Year
Expenditure on intermediate goods and services 2011/12–2015/16 (July to June)
maintenance and repairs on machinery and implements Farm services Farm feeds Fuel
100
110
120
130
140
150
160
2011/12 2012/13 2013/14 2014/15 2015/16
2010 =
100
Year
Price indices of farming requisites 2011/12–2015/16 (July to June)
Machinery and implements Fixed improvements Intermediate goods and services

Trends in the Agricultural Sector 2016 Department of Agriculture, Forestry and Fisheries 6
Domestic terms of trade in agriculture (2010 = 1)
The terms of trade indicate the extent to which producer prices received by farmers kept pace with
the prices paid for farming requisites.
The terms of trade in agriculture showed an increase of 8,8%, from 1,02 in 2014/15 to 1,11 in 2015/16.
The terms of trade for field crops improved by 32,1% (from 1,12 to 1,48) and for horticultural products by
8,4% (from 0,95 to 1,03). The terms of trade for animal products weakened by 2,0%, from 1,00 to 0,98.
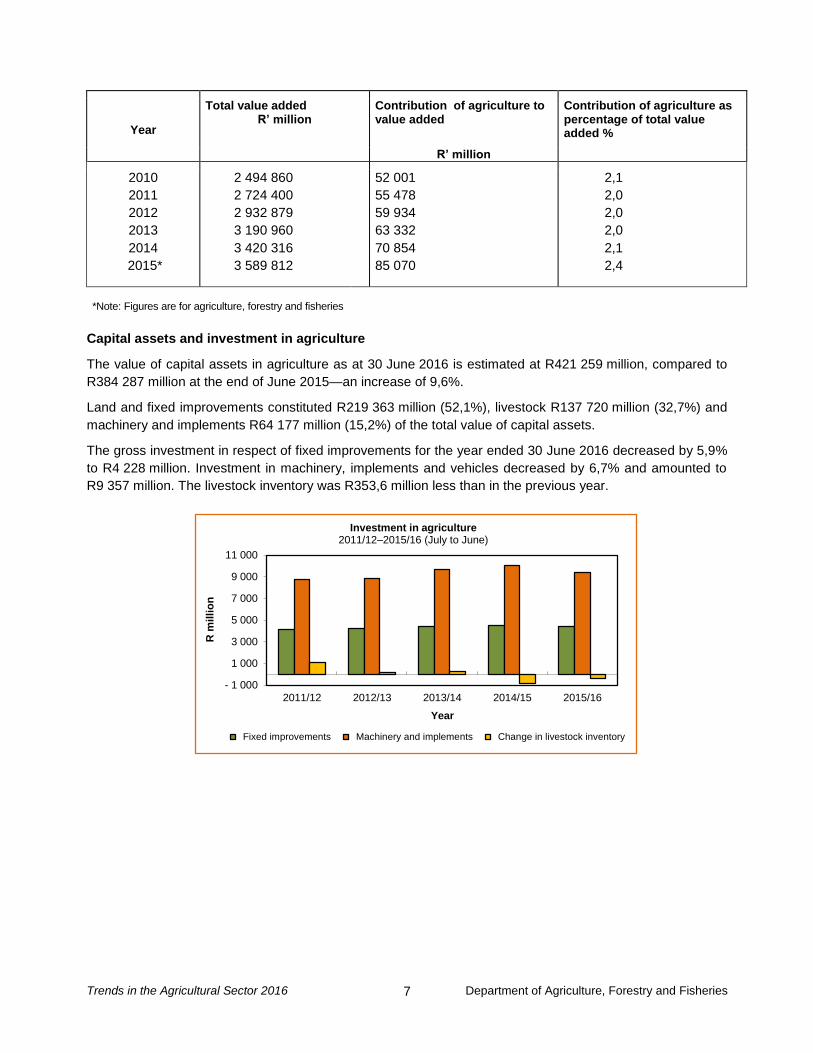
Contribution of agriculture, forestry and fisheries to value added at basic prices
Value added is the value of total output less the value of intermediate consumption during the
production period.
Agriculture, forestry and fisheries contribution to value added for the year ended 31 December 2015 is
estimated at R85 070 million. This represents 2,4% of the total value added to the economy.
100
110
120
130
140
150
160
2011/12 2012/13 2013/14 2014/15 2015/16
2010 =
100
Year
Price indices of machinery and implements 2011/12–2015/16 (July to June)
Tractors Implements Trucks
0.80
1.10
1.40
1.70
2011/12 2012/13 2013/14 2014/15 2015/16
2010 =
1
Year
Terms of trade in agriculture 2011/12–2015/16 (July to June)
Field crops Horticulture Animal production
Trends in the Agricultural Sector 2016 Department of Agriculture, Forestry and Fisheries 7
Year
Total value added R’ million
Contribution of agriculture to value added
Contribution of agriculture as percentage of total value added %
R’ million
2010
2011
2012
2013
2014
2015*
2 494 860
2 724 400
2 932 879
3 190 960
3 420 316
3 589 812
52 001
55 478
59 934
63 332
70 854
85 070
2,1
2,0
2,0
2,0
2,1
2,4
*Note: Figures are for agriculture, forestry and fisheries
Capital assets and investment in agriculture
The value of capital assets in agriculture as at 30 June 2016 is estimated at R421 259 million, compared to
R384 287 million at the end of June 2015—an increase of 9,6%.
Land and fixed improvements constituted R219 363 million (52,1%), livestock R137 720 million (32,7%) and
machinery and implements R64 177 million (15,2%) of the total value of capital assets.
The gross investment in respect of fixed improvements for the year ended 30 June 2016 decreased by 5,9%
to R4 228 million. Investment in machinery, implements and vehicles decreased by 6,7% and amounted to
R9 357 million. The livestock inventory was R353,6 million less than in the previous year.
- 1 000
1 000
3 000
5 000
7 000
9 000
11 000
2011/12 2012/13 2013/14 2014/15 2015/16
R m
illi
on
Year
Investment in agriculture 2011/12–2015/16 (July to June)
Fixed improvements Machinery and implements Change in livestock inventory
Trends in the Agricultural Sector 2016 Department of Agriculture, Forestry and Fisheries 8
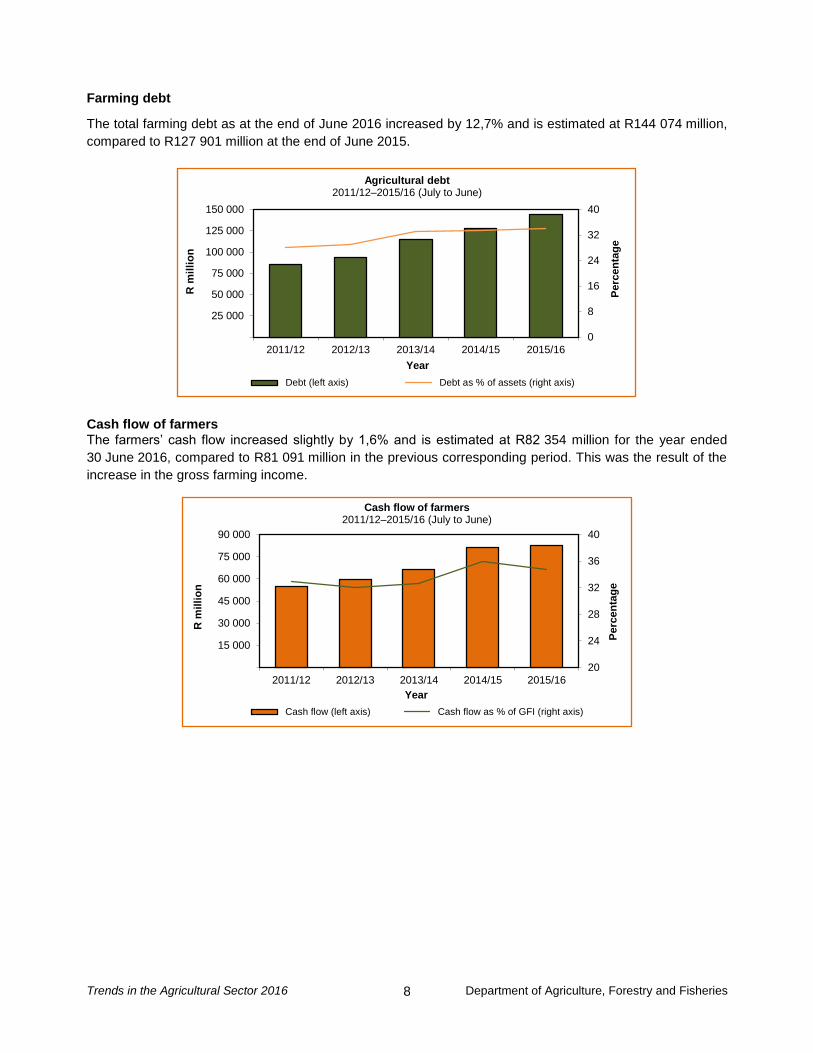
Farming debt
The total farming debt as at the end of June 2016 increased by 12,7% and is estimated at R144 074 million,
compared to R127 901 million at the end of June 2015.
Cash flow of farmers
The farmers’ cash flow increased slightly by 1,6% and is estimated at R82 354 million for the year ended
30 June 2016, compared to R81 091 million in the previous corresponding period. This was the result of the
increase in the gross farming income.
0
8
16
24
32
40
25 000
50 000
75 000
100 000
125 000
150 000
2011/12 2012/13 2013/14 2014/15 2015/16
Perc
en
tag
e
R m
illi
on
Year
Agricultural debt 2011/12–2015/16 (July to June)
Debt (left axis) Debt as % of assets (right axis)
20
24
28
32
36
40
15 000
30 000
45 000
60 000
75 000
90 000
2011/12 2012/13 2013/14 2014/15 2015/16
Perc
en
tag
e
R m
illi
on
Year
Cash flow of farmers 2011/12–2015/16 (July to June)
Cash flow (left axis) Cash flow as % of GFI (right axis)

Trends in the Agricultural Sector 2016 Department of Agriculture, Forestry and Fisheries 9
Consumption expenditure on food
The consumption expenditure on food for the year ended 30 June 2016 increased by 9,1% and amounted to
R587 220 million, compared to the R538 229 million of the previous year. Expenditure on meat increased by
9,4% to R203 481 million, on bread and grain products by 10,4% to R142 329 million and on fruit and
vegetables (including potatoes) by 13,3% to R80 667 million. Expenditure on milk, milk products and eggs
indicates an increase of 3,7% to R72 413 million and on sugar an increase of 16,7% to R7 421 million.
Expenditure on oils and fats shows a decrease of 6,2% to R11 617 million.
Meat represented 34% of the expenditure on the food component; bread and grains 26%; fruit and
vegetables (including potatoes) 14%; milk, milk products and eggs 11%; oils and fats 2%; sugar 1% and
other products (jam, chocolates, ice cream, table salt, herbs, coffee, tea, etc.) 12%.
Consumer prices
The consumer price index (with base year 2010 = 100) of all items increased by 5,5%, from 127,1 to 134,2,
during the year ended 30 June 2016. The CPI of food increased by 7,3%, from 134,8 to 144,6 and that of
non-food items increased by 5,2%, from 124,0 to 130,5.
Meat prices increased by 5,1%, from an index figure of 136,4 to 143,3, grain products by 9,7%, from 133,9 to
146,9, vegetables by 10,3%, from 132,1 to 145,8 and fruit by 6,8%, from 122,1 to 130,4. In the case of dairy
products and eggs, prices rose by 3,9%, from an index of 135,4 to 140,7. The prices of sugar and related
products increased by 9,8%, from 143,5 to 157,6.
0
40 000
80 000
120 000
160 000
200 000
2011/12 2012/13 2013/14 2014/15 2015/16
R m
illi
on
Year
Private consumption expenditure on major food items 2011/12–2015/16 (July to June)
Meat Bread and grains Vegetables and fruit Milk, milk products and eggs
Trends in the Agricultural Sector 2016 Department of Agriculture, Forestry and Fisheries 10
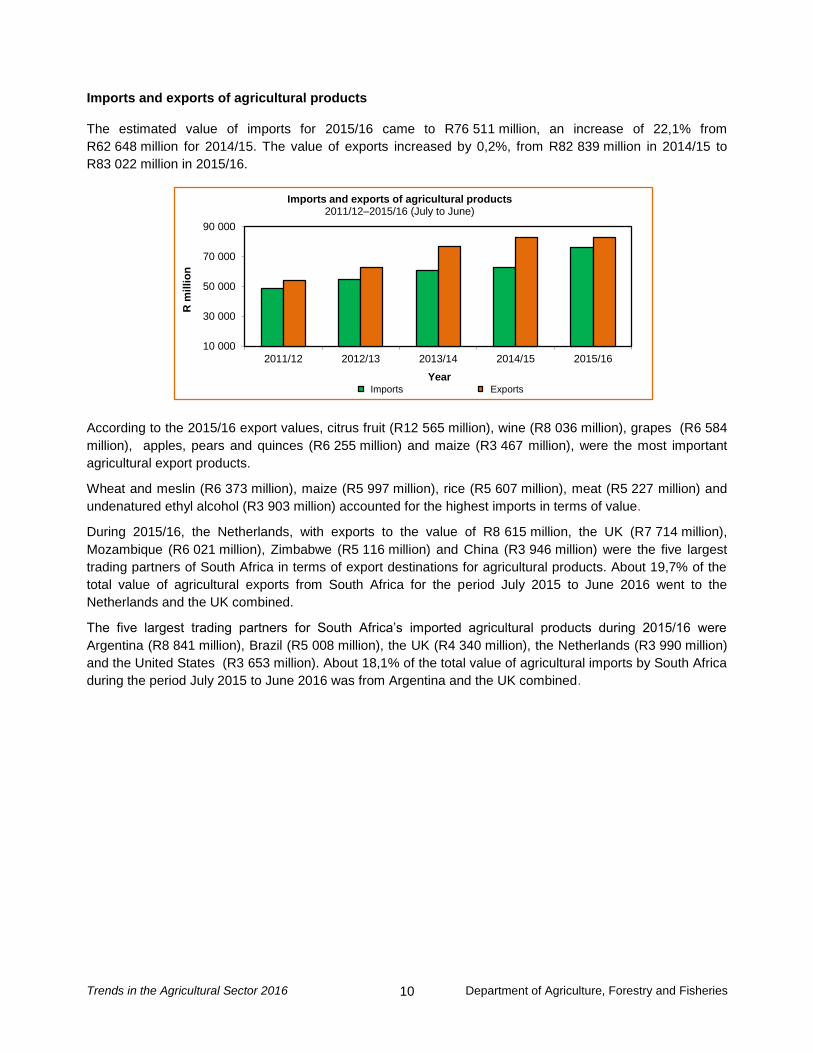
Imports and exports of agricultural products
The estimated value of imports for 2015/16 came to R76 511 million, an increase of 22,1% from
R62 648 million for 2014/15. The value of exports increased by 0,2%, from R82 839 million in 2014/15 to
R83 022 million in 2015/16.
According to the 2015/16 export values, citrus fruit (R12 565 million), wine (R8 036 million), grapes (R6 584
million), apples, pears and quinces (R6 255 million) and maize (R3 467 million), were the most important
agricultural export products.
Wheat and meslin (R6 373 million), maize (R5 997 million), rice (R5 607 million), meat (R5 227 million) and
undenatured ethyl alcohol (R3 903 million) accounted for the highest imports in terms of value.
During 2015/16, the Netherlands, with exports to the value of R8 615 million, the UK (R7 714 million),
Mozambique (R6 021 million), Zimbabwe (R5 116 million) and China (R3 946 million) were the five largest
trading partners of South Africa in terms of export destinations for agricultural products. About 19,7% of the
total value of agricultural exports from South Africa for the period July 2015 to June 2016 went to the
Netherlands and the UK combined.
The five largest trading partners for South Africa’s imported agricultural products during 2015/16 were
Argentina (R8 841 million), Brazil (R5 008 million), the UK (R4 340 million), the Netherlands (R3 990 million)
and the United States (R3 653 million). About 18,1% of the total value of agricultural imports by South Africa
during the period July 2015 to June 2016 was from Argentina and the UK combined.
10 000
30 000
50 000
70 000
90 000
2011/12 2012/13 2013/14 2014/15 2015/16
R m
illi
on
Year
Imports and exports of agricultural products 2011/12–2015/16 (July to June)
Imports Exports

Trends in the Agricultural Sector 2016 Department of Agriculture, Forestry and Fisheries 11
Branches of the industry
FIELD CROP HUSBANDRY
Maize
Maize is the most important grain crop in South Africa, being both the major feed grain and the staple food of the majority of the South African population. About 43% of maize produced in South Africa is white and the remaining 57% is yellow maize (2016). White maize is primarily used for human consumption, while yellow maize is mostly used for animal feed production.
The gross value of agricultural production is determined by the quantity produced and prices received by producers.
The largest contributor towards the gross value of field crops for the past five seasons is maize (48,0%), followed by sugar cane (13,2%), wheat (9,7%) and both soya beans and hay (7,4%). The gross value of maize for 2015/16 amounts to R27 556 million.
The two main white maize-growing provinces in South Africa, namely the Free State and North West provinces, produced about 69% of the white maize harvest in 2015, whereas the Free State and Mpumalanga provinces produced about 64% of the yellow maize harvest. This season (2016), following an El Niño-induced drought, the Free State and North West provinces produced only 58% of the white maize harvest as it experienced one of its poorest harvests in recent years, where a lack of rain had caused crop failures.
The contribution by provinces to maize production during the 2015/16 production season is depicted in the following figure.
White maize is generally produced in the western parts of the maize belt, while yellow maize is planted in the eastern parts.
Maize is planted during late spring/early summer, with optimal planting times in November and December. However, planting can start as early as October and extend to January. In a particular season, the rainfall pattern and other weather conditions determine the planting period as well as the length of the growing season. Most of the maize is harvested from late May up to the end of August.
The present ratio of areas planted is 52% white maize to 48% yellow maize. An estimated 8,1% of the area planted to white maize is under irrigation and 91,9% is dryland, while the estimate for yellow maize is 17,0% under irrigation and 83,0% dry land.
Western Cape 1%
Northern Cape 9% Free State
28%
Eastern Cape 1%
KwaZulu-Natal 7%
Mpumalanga 30%
Limpopo 4%
Gauteng 6%
North West 14%
Distribution of the maize crop 2015/16
Trends in the Agricultural Sector 2016 Department of Agriculture, Forestry and Fisheries 12
Area planted and production
During the past season, South Africa battled one of the worst droughts ever recorded that already started in early 2015.
The estimated area that South African commercial producers planted to maize during the 2015/16 season is 1,947 million ha. This is 26,6% or 706 100 ha less than the 2,653 million ha planted the previous season and also 26,2% or 692 000 ha less than the five-year average of 2,639 million ha planted up to 2014/15.
Commercial white and yellow maize plantings for 2015/16 were 1 014 750 ha and 932 000 ha, respectively. This represents a decrease of 29,9% for white maize and 22,6% for yellow maize.
The commercial maize crop for the 2015/16 production season is estimated to be 7,537 million tons, with an estimated yield of 3,87 t/ha. The production represents a decrease of 24,3% from the previous season (2014/15), which was estimated at 9,955 million tons. The main reason for the decrease in the production of maize is severe drought conditions in the major maize-producing areas. This is also the smallest crop since the 2006/07 production season, when the production was 7,125 million tons.
The production estimate for white maize is 3,254 million tons, which is 31,3% or 1,481 million tons less than the 4,735 million tons of 2015 and 47,5% or 2,948 million tons less than the average of the five years (6,201 million tons) up to 2015. The estimated yield for white maize is 3,21 t/ha, compared to 3,27 t/ha the previous season.
In the case of yellow maize, the production estimate for 2016 is 4,283 million tons, which is 18,0% or 936 900 tons less than the 5,220 million tons the previous season and 22,1% or 1,215 million tons less than the five-year average (5,498 million tons) up to 2015. The estimated yield for yellow maize was 4,60 t/ha, compared to 4,33 t/ha in 2015.
For the 2015/16 season, 97% of the deliveries of white maize were grade WM1, compared to 95% of the 2014/15 crop and 94% of the yellow maize deliveries were grade YM1, compared to 95% of the 2014/15 crop.
Plantings, production and yields of commercial maize from 2011/12 to 2015/16 are as follows:
Season 2011/12 2012/13 2013/14 2014/15 2015/16
Plantings (ha) 2 699 200 2 781 200 2 688 200 2 652 850 1 946 750
Production (t) 12 120 656 11 810 600 14 250 000 9 955 000 7 536 875
Yield (t/ha) 4,49 4,25 5,30 3,75 3,87
The estimated yield for maize is 3,87 t/ha for 2015/16, which is 3,2% or 0,12 t/ha more than the 3,75 t/ha
the previous season. Similar to the 2014/15 season, the dry conditions had a negative impact on the yields,
especially in the Free State and North West provinces.
The area planted to and production and producer prices of maize are depicted in the following graph:

Trends in the Agricultural Sector 2016 Department of Agriculture, Forestry and Fisheries 13
In South Africa, the breadbasket of the southern African region, the maize sector comprises both commercial and non-commercial farmers; the latter mostly in the Eastern Cape, Limpopo, Mpumalanga and northern KwaZulu-Natal provinces.
The area planted to maize by the non-commercial sector during 2015/16 is estimated at 266 130 ha, which comprises 191 225 ha of white maize and 74 905 ha of yellow maize. Production by the non-commercial sector is estimated at 435 740 tons; 286 175 tons of white maize and 149 565 tons of yellow maize. Maize grown by this sector is mainly for own use and contributes only approximately 6% to total production.
Prices
Since the deregulation of the South African agricultural market in 1996, the maize market has essentially been an open one in which a number of basic factors play a role in determining prices. These factors include:
International maize prices
Exchange rates
Local production (influenced by weather conditions and area planted)
Local consumption
Production levels in the Southern African Development Community region (South Africa is usually the main source of white maize for these countries in times of shortage)
Stock levels (both domestic and international)
Based on domestic stock levels, the domestic prices of maize fluctuate within a band that is determined by world prices, the exchange rate and local maize production. Because of the erratic weather conditions in the country, substantial variations in local production occur.
During periods of shortages, the rand price of maize tends to increase towards import parity, which is the international maize price plus transport and other costs, multiplied by the exchange rate. During surplus periods, the rand price tends to move towards export parity, which is the price of maize on the international market minus transport and other costs, multiplied by the exchange rate.
Currently, the prices of maize differ from one area to another and can fluctuate daily. Producers can manage their price risk by negotiating spot, contract or futures prices on SAFEX, based on market conditions.
The average producer price of maize increased by 47,8%, from R2 338,96/t in 2014/15 to R3 456,19/t in 2015/16, mostly because of the dry weather conditions that occurred in South Africa’s maize belt during the past summer season, reflecting the tighter supply situation.
The average producer prices of maize from 2011/12 to 2015/16 are as follows:
Season 2011/12 2012/13 2013/14 2014/15 2015/16
R/ton
Producer price 1 969,09 2 006,36 1 909,29 2 338,96 3 456,19
0
500
1 000
1 500
2 000
2 500
3 000
3 500
4 000
0
3 000
6 000
9 000
12 000
15 000
2011/12 2012/13 2013/14 2014/15 2015/16
R/t
on
'00
0 h
a/
ton
s
Maize: Area planted, production and producer prices 2011/12–2015/16
Area planted Production Producer price

Trends in the Agricultural Sector 2016 Department of Agriculture, Forestry and Fisheries 14
The South African maize market has matured considerably since the deregulation of marketing. Producers, traders and other intermediaries interact freely in the marketing of maize.
Supply and Demand
Most of the maize produced in South Africa is consumed locally; as a result, the domestic market is very important to the industry.
Considering the importance of food security, and against the background of uncertain maize stock positions and highly fluctuating maize prices over the past few years, the grain industry expressed the need for much improved information on intended imports or exports of grains and oilseeds. In addition, there was also a need for official supply and demand figures for the major grain and oilseed crops, as is common practice in many countries.
After many discussions, the Supply and Demand Estimates Committee (S&DEC) was established. The S&DEC is responsible for the monthly data collection, calculation and dissemination of relevant information. The supply of and demand for white maize, yellow maize, total maize, wheat, sorghum, sunflower seed and soya beans are determined with the assistance of the Crop Estimates Committee and the SA Grains Information Services (SAGIS), among others. The first official publication of the supply and demand estimates by the S&DEC was published on 28 June 2013.
Considering the 2016/17 marketing season (May to April), the total supply of maize is projected at 12,390 million tons (5,419 million tons white and 6,971 million tons yellow). This includes an opening stock (at 1 May 2016) of 2,471 million tons (1,308 million tons white and 1,163 million tons yellow), local commercial deliveries of 7,107 million tons (3,174 million tons white and 3,933 million tons yellow) and 2,700 million tons (850 000 tons white and 1,850 million tons yellow) maize imports.
The total demand, local and exports, for maize is projected at 11,253 million tons; 4,901 million tons of white and 6,352 million tons of yellow maize. The total local demand is projected at 10,313 million tons (4,321 million tons white and 5,992 million tons yellow). A projected export quantity of 940 000 tons (580 000 tons white and 360 000 tons yellow) is expected for the 2016/17 marketing season. The projected closing stock level by 30 April 2017 is estimated at 1,137 million tons (517 586 tons white and 619 345 tons yellow).
Trade balance
In the case of a product such as maize, millers (who are the main buyers of the maize crop) have the option of importing maize instead of buying locally produced maize. In a deregulated market, the decision whether to buy from domestic or foreign sources is influenced by, among other factors, transport costs, price and quality. When the product is imported, the exchange rate plays an important role in the actual rand price.
Depreciation in the value of the rand against relevant foreign currencies makes import products such as maize, wheat and oilseeds more expensive in rand terms, thereby providing some protection for South African farmers and an incentive to increase production in the longer term. However, if South African producers are unable to meet the needs of the processors, or if processors are uncertain about local supplies, foreign sources can be considered.
South African producers, on the other hand, will consider the export market if local processors are unwilling to pay the prevailing local market price. In this manner, the market sets “natural” floor and ceiling prices, i.e., a price band within which such products trade. The price-setting mechanism for these crops is the JSE Security Exchange of South Africa’s Agricultural Products Division.
Up to 21 October 2016, about 1,200 million tons of maize, of which white maize is 345 339 tons and yellow maize 854 385 tons, had been imported since May—approximately 44% of the estimated import requirement. About 95% of the white maize imports were imported from Mexico; whereas about 87% of the yellow maize imports were received from Argentina and 11% from Brazil. South Africa's corn conundrum stems from the fact that while yellow maize is widely grown elsewhere and easily sourced, white maize outside of the region can only be sourced from Mexico and the United States.
Despite the sizeable import requirement, it is still forecasted that South Africa has to export approximately 940 000 tons of maize, mostly white maize, mainly bound for the drought-affected neighbouring countries of Botswana, Lesotho, Namibia, Swaziland and Zimbabwe. Up until 21 October 2016, 374 757 tons had been exported since the start of the current marketing year, the bulk of which was delivered to Botswana (30%).

Trends in the Agricultural Sector 2016 Department of Agriculture, Forestry and Fisheries 15
The following graph shows the imports of maize to and exports from South Africa during the past five marketing seasons (May to April).
*Projection
As a result of the sharply lower production in 2016 due to the drought, South Africa was forced to import maize to make up the shortfall. Imports of maize are forecasted at 2,700 million tons for the 2016/17 marketing year (May/April). This is 736 390 tons above the volume imported in the previous year and a significant rise relative to the average. White maize accounts for 31% or 850 000 tons of the import requirement and yellow maize for 69% or 1,850 million tons. The projected white maize imports are the second highest amount since 1912.
Vulnerability and Food Security Assessments – SADC
The SADC 2016/17 regional food security and vulnerability situation, based on the results of the 2016 National Vulnerability Assessment Committee’s vulnerability assessments, indicate that every country in the region is expected to have a maize deficit during the 2016/17 marketing year, except Zambia and Tanzania. Zambia, which played an important regional role during the 2015/16 marketing year, has limited volumes of exportable maize surpluses. Tanzania is expected to export the majority of its maize surpluses to neighboring countries in East Africa.
The performance of the 2015/16 rainy season was among the worst in 30 years for many countries in Southern Africa. This was the second consecutive season of below-average maize production.
South Africa, the main regional maize exporter, will have a deficit during the 2016/17 marketing season. As regional maize production is not adequate to meet requirements, large and atypical supply gaps are anticipated. The impact of last year’s El Niño induced drought continues to be felt as an increased number of households across the region are facing significant food and livelihood protection gaps.
Southern Africa will likely experience a regional cereal deficit of approximately 6–10 million tons and a regional maize deficit of 5-6 million tons during the 2016/17 marketing season. While cereal imports from Tanzania, Zambia and other international markets will partially offset the shortfall, prices will likely increase – remaining significantly higher than the five-year averages due to below-average production and an associated increased demand for market purchases, limiting food access for poorer households. The combination of poor food access, availability of water and medical facility coverage and capacities could aggravate poor nutrition conditions among vulnerable populations, particularly malnourished children and HIV-affected individuals.
Approximately 18,3 million people in acutely drought-affected areas of Southern Africa will require emergency assistance between June 2016 and March 2017, according to the SADC Regional Humanitarian Appeal, formally launched on 26 July 2016.
Regional maize harvests for the current (2016/17) marketing year are estimated to be over 20% below-average, due to the El Niño-induced drought during the 2015/16 production year. Countries with significantly
0
500
1 000
1 500
2 000
2 500
3 000
2012/13 2013/14 2014/15 2015/16 2016/17*
'000 t
on
s
Marketing season
Maize imports and exports 2012/13–2016/17
Imports Exports

Trends in the Agricultural Sector 2016 Department of Agriculture, Forestry and Fisheries 16
below-average production for a second year in a row include Zimbabwe, Botswana, Lesotho, Swaziland and self-sufficient Malawi.
Current weather forecasts indicate near-equal chances for La Niña conditions for the next growing season, which could improve the regional supply context. The normal to above-normal rainfall expected over most areas in Southern Africa, combined with near-normal temperatures expected, suggest chances for a good agricultural season.
Prospects
In October 2016, the intended maize plantings of South African farmers were 2,47 million ha for the 2016/17 production season, which is 26,5% more than the 1,95 million ha planted during 2015/16.
Producers indicated that they intended to plant more maize for the 2016/17 season because of favourable weather forecasts for the new season, which will hopefully bring relief after the previous seasons’ drought conditions. However, the rainfall could still influence farmers’ decisions.
Applying a three-year average normal seasons’ yield of 4,40 t/ha to the intended plantings, the potential maize crop for the 2016/17 season is 10,80 million tons.
Maize tariff
The import tariff on maize is another domestic factor that could have an impact on the local price of maize. The import tariff on maize, as published in the Government Gazette of 8 December 2006, is zero.
World maize situation
According to the October 2016 report of the United States Foreign Agricultural Services, world maize production in 2016/17 (September to August) was forecast at 1,026 billion tons, which is 6,9% or 66,6 million tons more than the 959,1 million tons produced during 2015/16. The US contributed 37,3% (382,5 million tons), China 21,1% (216,0 million tons), Brazil 8,1% (83,5 million tons) and the EU 5,9% (60,3 million tons) to world production. The remaining 27,6% is made up by the Argentina, Ukraine, Mexico, India and South Africa, among others.
Global consumption in 2016/17 was expected to be 1,019 billion tons—60,9 million tons more than in the previous year. Global ending stocks at the end of October 2017 were expected to be 216,8 million tons, which is 6,8 million tons or 3,2% more than in the previous year.
Marketing, information and research
No statutory levies are applicable and the marketing of maize is free from statutory intervention.
The information function is performed by the Department of Agriculture, Forestry and Fisheries, through the Directorate: Statistics and Economic Analysis and Grain South Africa, which promote the interests of maize producers and SAGIS, a section 21 company funded by, among others, the maize industry.
Research is financed with income from the Maize Trust and performed by the Agricultural Research Council, the Council for Scientific and Industrial Research and other organisations.

Trends in the Agricultural Sector 2016 Department of Agriculture, Forestry and Fisheries 17
Sorghum
Plantings and production
Sorghum is an indigenous crop in Africa, while regarded as the fifth most important cereal in the world. There are two types of sorghum, namely bitter and sweet sorghum cultivars. Preference is given to the sweet cultivars. Bitter sorghum is planted in areas where birds are a problem because it contains tannin, which gives a bitter taste and consequently birds tend to avoid feeding on it.
Sorghum is mainly cultivated in low and erratic rainfall areas, especially on shallow and heavy clay soils. Sorghum is planted mainly between mid-October and mid-December. The rainfall pattern and other weather conditions of a particular season can determine the planting period as well as the length of the growing season to a large extent.
During the 2016 season (March to February), sorghum for commercial purposes was produced mainly in the Mpumalanga (47,2%) followed by Free State (34,0%), Limpopo (13,2%), and the North West (3,2%) provinces. An estimated 48 500 ha were planted to sorghum for commercial use, representing a decrease of 31,2% from the 70 500 ha planted for the 2015 season. This can be attributed to the expected establishment of a bioethanol production facility not having materialised, therefore farmers were no longer encouraged to expand their plantings, as well as the impact of the 2015/16 drought.
For the past five seasons, South Africa produced an average 164 640 tons of sorghum per annum, which is relatively small compared to domestic maize and wheat production.
During the 2016 production season, sorghum contributed only approximately 0,6% to the gross value of field crops. The estimated average annual gross value of sorghum for the five years up to 2015/16 amounts to R461 million.
The commercial sorghum crop for the 2016 season is estimated at 74 150 tons, which is 38,5% less than the 120 500 tons of the previous season and 55% less than the five-year average production of 164 640 tons up to 2015. The yield for 2016 is estimated at 1,53 t/ha, which is 38,8% less than the five-year average yield of 2,50 t/ha up to 2015.
Plantings, production and the yields of sorghum from 2012 to 2016 are as follows:
Season 2012 2013 2014 2015 2016
Plantings (ha)
Production (t)
Yield (t/ha)
48 550
135 500
2,79
62 620
147 200
2,35
78 850
265 000
3,36
70 500
120 500
1,71
48 500
74 150
1,53
The following graph shows the area planted to and the production of sorghum in South Africa.
20 000
40 000
60 000
80 000
100 000
50 000
100 000
150 000
200 000
250 000
300 000
2012 2013 2014 2015 2016
Hecta
res
To
ns
Area planted to and production of sorghum 2012–2016
Production Area planted

Trends in the Agricultural Sector 2016 Department of Agriculture, Forestry and Fisheries 18
The five-year average of sorghum produced by the non-commercial agricultural sector for its own use up to 2016 is assumed to be approximately 12 348 tons, which is about 6,5% of the total sorghum production in South Africa.
Consumption
Sorghum, like other grains, has two basic markets that it serves, i.e., the human component and the animal feed component. Sorghum is consumed mainly in the human food market and, as in the case of maize, consumers tend to replace sorghum-based products with preferred products as the household income increases.
Expectations are that a total of 244 792 tons of sorghum will be available for local consumption during the 2016/17 marketing season (March to February), compared to 278 212 tons the previous season. This comprises carry-over stocks as at 1 March 2016 amounting to 83 142 tons, plus producer deliveries of 83 142 tons at commercial structures and imports of 90 000 tons.
The projected commercial utilisation of sorghum for the 2016/17 marketing season is approximately 180 400 tons, of which 161 000 tons are for human consumption (malt, meal and other uses) and 9 500 tons are for animal feed (poultry, pet, pigeon and ostrich feeds). Other uses (released to end-consumers, withdrawn by producers, etc.) amounts to 9 900 tons. Projected exports during the 2016/17 marketing season are 19 000 tons.
Considering the above, carry-out stocks at 28 February 2017 are expected to be about 45 392 tons.
The following graph depicts the utilisation of sorghum in South Africa (marketing seasons):
*Projection
Producer prices
Local producer prices of sorghum increased by 48,3%, from R2 379,52/t in 2015 to R3 529,17/t in the 2016 season.
Season 2012 2013 2014 2015 2016
R/t
Producer price 2 675,01 2 691,62 2 626,78 2 379,52 3 529,17
0
20
40
60
80
100
120
2012/13 2013/14 2014/15 2015/16 2016/17
'0
00 t
on
s
Season
Utilisation of sorghum for the local market 2012/13–2016/17
Feed Malt Meal
Trends in the Agricultural Sector 2016 Department of Agriculture, Forestry and Fisheries 19
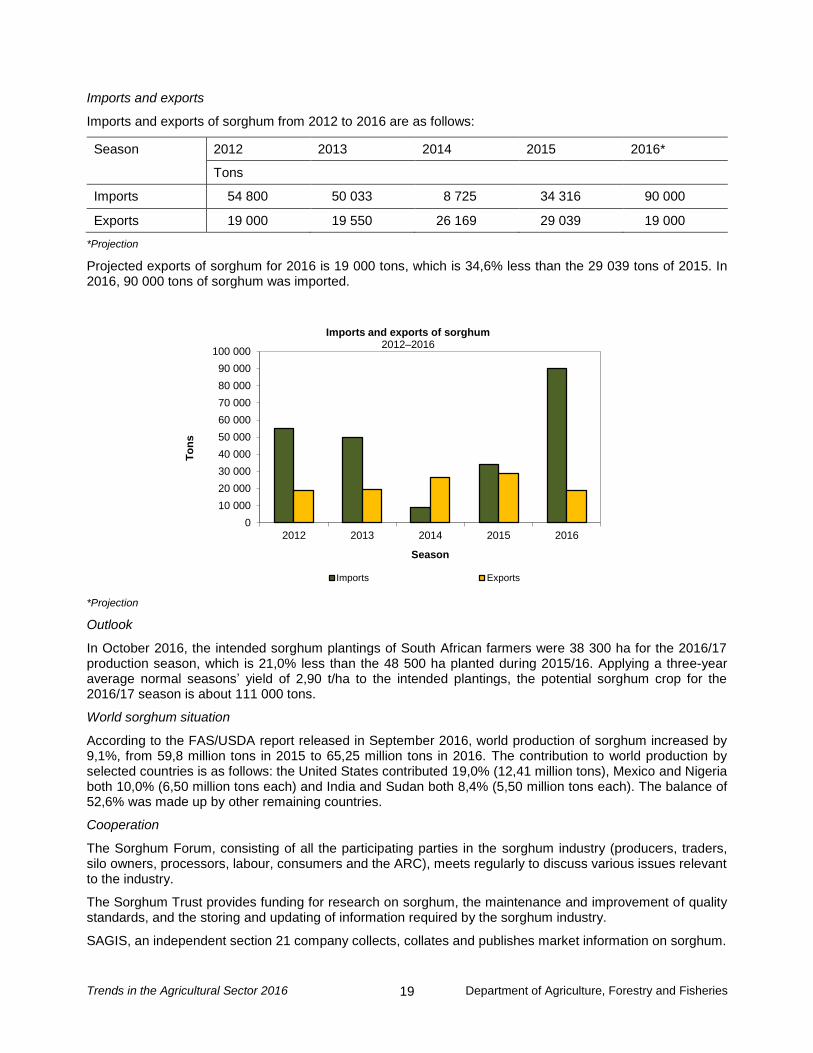
Imports and exports
Imports and exports of sorghum from 2012 to 2016 are as follows:
Season 2012 2013 2014 2015 2016*
Tons
Imports 54 800 50 033 8 725 34 316 90 000
Exports 19 000 19 550 26 169 29 039 19 000
*Projection
Projected exports of sorghum for 2016 is 19 000 tons, which is 34,6% less than the 29 039 tons of 2015. In 2016, 90 000 tons of sorghum was imported.
*Projection
Outlook
In October 2016, the intended sorghum plantings of South African farmers were 38 300 ha for the 2016/17 production season, which is 21,0% less than the 48 500 ha planted during 2015/16. Applying a three-year average normal seasons’ yield of 2,90 t/ha to the intended plantings, the potential sorghum crop for the 2016/17 season is about 111 000 tons.
World sorghum situation
According to the FAS/USDA report released in September 2016, world production of sorghum increased by 9,1%, from 59,8 million tons in 2015 to 65,25 million tons in 2016. The contribution to world production by selected countries is as follows: the United States contributed 19,0% (12,41 million tons), Mexico and Nigeria both 10,0% (6,50 million tons each) and India and Sudan both 8,4% (5,50 million tons each). The balance of 52,6% was made up by other remaining countries.
Cooperation
The Sorghum Forum, consisting of all the participating parties in the sorghum industry (producers, traders, silo owners, processors, labour, consumers and the ARC), meets regularly to discuss various issues relevant to the industry.
The Sorghum Trust provides funding for research on sorghum, the maintenance and improvement of quality standards, and the storing and updating of information required by the sorghum industry.
SAGIS, an independent section 21 company collects, collates and publishes market information on sorghum.
0
10 000
20 000
30 000
40 000
50 000
60 000
70 000
80 000
90 000
100 000
2012 2013 2014 2015 2016
To
ns
Season
Imports and exports of sorghum 2012–2016
Imports Exports

Trends in the Agricultural Sector 2016 Department of Agriculture, Forestry and Fisheries 20
The Southern African Grain Laboratory, incorporated under Section 21 (Association Not for Gain), analyses the quality of grain.
The Crop Estimates Committee plays an important role in providing up-to-date market information on which important decisions and actions can be based.
On a national basis, the ARC is responsible for research and development in the agricultural sector.
Wheat
In terms of value of production, wheat is the fourth most important field crop produced in South Africa. In the 2015/16 season, this crop contributed approximately 9% to the gross value of field crops. The average annual gross value of wheat for the past five years up to 2015/16 amounts to R5 297 million, compared to R26 095 million for maize, which is the most important field crop.
Wheat is mainly planted between mid-April and mid-June in the winter rainfall area and between mid-May and the end of July in the summer rainfall area. The crop is harvested from November to January. Most of the wheat produced in South Africa is bread wheat, with small quantities of durum wheat being produced in certain areas.
Wheat is generally classed as “hard” or “soft”. Hard wheat tends to have higher protein content than softer wheat and is used mainly for bread. Soft wheat, on the other hand, is more suitable for confectionery.
Areas planted and production
The estimated area planted to wheat for the 2016 season is 508 365 ha, which is 5,4% more than the 482 150 ha of the previous season. Of this area, 323 000 ha (64%) are in the Western Cape and 110 000 ha (22%) are in the Free State provinces. The main production areas for wheat remain the Western Cape and the Free State, with both areas showing increased production patterns.
For the 2016 production season, weather conditions across South Africa’s wheat growing areas have been fairly favourable.The Western Cape especially, which is the major wheat growing area in the RSA, received rainfall which is favourable for the wheat crop.
Early indications show that wheat farmers across the Southern Cape could receive above-average yields this season. The north-western regions of the province could see average to slightly below-average yields because rainfall was not evenly distributed during the pollination stages.
The areas planted to and production of wheat is depicted in the following graph.
Based on conditions prevailing towards the end of October 2016, the expected commercial wheat crop for 2016 was 1,734 million tons, of which 936 700 tons (54%) were from the Western Cape, 308 000 tons (18%) from the Free State and 252 000 tons (15%) from the Northern Cape provinces. The expected average yield was 3,41 t/ha.
0
200
400
600
800
1 000
0
500
1 000
1 500
2 000
2 500
2012 2013 2014 2015 2016
'000 h
a
'000 t
on
s
Wheat: area planted and production 2012–2016
Production Area planted

Trends in the Agricultural Sector 2016 Department of Agriculture, Forestry and Fisheries 21
Plantings, production and yields from 2012 to 2016 are as follows:
Season 2012 2013 2014 2015 2016
Plantings (ha) 511 200 505 500 476 570 482 150 508 365
Production (t) 1 870 000 1 870 000 1 750 000 1 440 000 1 733 980
Yield (t/ha) 3,66 3,70 3,67 2,99 3,41
Consumption
According to the Supply and Demand Estimates Committee (S&DEC), a total of 4,079 million tons of wheat (commercial) were available for local consumption during the 2015/16 marketing season (October to September). This comprised carry-over stocks as at 1 October 2015 of 596 823 tons, producer deliveries of 1,406 million tons, a surplus of 8 817 tons and imports of approximately 2,067 million tons.
The total demand for wheat for the 2015/16 marketing season is estimated at approximately 3,247 million tons, of which 68 525 tons were exported. Carry-out stocks as at 30 September 2016 are estimated to be 832 101 tons.
For the 2016/17 marketing season, the total supply of wheat is forecasted at 4,034 million tons (expected producer deliveries of 1,696 million tons, together with the carry-over stocks of 832 101 tons, a surplus of 6 000 tons and expected imports of 1,500 million tons). The demand for wheat (exports included) is estimated at 3,422 million tons. Carry-out stocks at the end of September 2017 are expected to amount to 611 781 tons.
Imports
South Africa, a net importer of wheat, relies on imports from Russia, Germany and United States, among others, to meet its domestic demand. During the 2015/16 season, approximately 65% of the wheat that was needed for domestic consumption (3,178 million tons) was imported, namely 2,1 million tons was imported.
Wheat imports from 2011/12 to 2015/16 are as follows:
Season 2011/12 2012/13 2013/14 2014/15 2015/16*
Tons
Imports 1 724 000 1 393 215 1 668 412 1 832 441 2 066 906
*Projection for the 2015/16 marketing season
Source: SAGIS
The following graph shows the imports of wheat during the past five seasons (October to September).
400
800
1 200
1 600
2 000
2 400
2011/12 2012/13 2013/14 2014/15 2015/16
'000 t
on
s
Season
Wheat imports 2011/12–2015/16
Imports

Trends in the Agricultural Sector 2016 Department of Agriculture, Forestry and Fisheries 22
Prices
The impact of the drought has been much less severe on wheat prices, given that South Africa typically trades at import parity in a normal year. Despite falling world prices, South African prices remain well supported by the combination of a weaker exchange rate and the variable import tariff triggered when the US Hard Red Winter wheat drops below $294.
The average producer price of wheat increased by 24%, from R3 052,85/ton in 2014/15 to R3 773,77/ton in 2015/16. South African wheat prices are supported by the depreciating exchange rate, as well as the variable import tariff, which is currently more than R1 500 per ton.
The average producer prices of wheat (grade 1) from 2011/12 to 2015/16 are as follows:
Season 2011/12 2012/13 2013/14 2014/15 2015/16
R/ton
Producer price 2 369,08 2 914,51 2 880,31 3 052,85 3 773,77
Marketing
The South African wheat market was deregulated on 1 November 1997 and wheat can therefore be traded freely. The only government intervention in the market is the tariff on wheat imports. On 22 August 2016, a new wheat tariff (R1 591,40/ton) was published in Government Gazette no.40223.
World wheat situation
Global production in 2016/17 is raised to a new record. Larger crops in Australia, Brazil, Canada, India, and Kazakhstan more than offset lower production in China and the EU. The US winter wheat crop remains mostly in a good conditions at this time of the season.
According to the October 2016 report of the United States Foreign Agricultural Services, world wheat production in 2016/17 (July to June) was forecasted at 744,4 million tons, which is 1,3% or 9,4 million tons more than the 735,0 million tons produced during 2015/16. According to expectations, the European Union would contribute 19% (143,2 million tons), China 17% (128,0 million tons), India 12% (90,0 million tons) and the US 8% (62,9 million tons) to world production during 2016/17. The balance of 44% is made up by the Russian Federation, Canada, Australia and the Ukraine, among others.
Global consumption was expected to be 735,7 million tons during 2016/17—24,3 million tons more than the previous year. Global ending stocks were expected to increase to 248,4 million tons by the end of June 2017, which is 8,7 million tons or 3,6% more than the previous year.
Research and information
The Winter Grains Trust is responsible for the allocation of funding and appraisal of relevant research projects in the winter grains industry. Since 1998, statutory levies on sales of winter cereals have been used to finance the Winter Grains Trust.
The ARC-Small Grain Institute in Bethlehem conducts the research on wheat and other winter grains.
The South African Grain Information Service (SAGIS), a section 21 company funded by, among others, the wheat industry, administers the information function for the wheat industry.
Accurate crop forecasts and estimates also play an important role by providing up-to-date information upon which important decisions and measures can be based. The crop estimates are a result of the collated inputs of, and consensus reached by, the various members of the Crop Estimates Committee.

Trends in the Agricultural Sector 2016 Department of Agriculture, Forestry and Fisheries 23
Malting barley
Plantings and production
Barley is one of the most important grain crops in South Africa, surpassed only by wheat and maize and is, following wheat, the most important small grain type.
The cultivation area for malting barley under dry land conditions is at present restricted to a very specific region, namely the Southern Cape, which stretches from Bot River in the west to Heidelberg in the east. It would not be economically viable to cultivate malting barley on dry land in an area that does not receive 350 mm of well-distributed rainfall during the growing season (April to October). At present, five varieties are recommended for malting barley production in the Southern Cape, viz. SabbiErica, SabbiNemesia, Disa, Agulhas and Hessekwa.
The concentration of the production of a relatively minor commodity, for instance malting barley, in a specific area, has various advantages, e.g. it facilitates transport, storage, control, extension and research, which also implies cost advantages.
However, because of the risk of unpredictable weather conditions in the Southern Cape, barley production has also been introduced to the cooler central irrigation areas in the Northern Cape. There are also farmers in other areas of South Africa, such as the North West, Limpopo and Free State provinces, who plant small quantities of malting barley under irrigation.
Malting barley under irrigation has a higher yield and is more stable than in the Southern Cape, where the crop is dependent on rainfall.
Barley is planted over a relatively short period of time (from three weeks in certain areas to five weeks in others). The earlier plantings generally have a higher yield potential. This results in greater yield increases with disease and pest control programmes in earlier plantings. Barley planted later than the optimum planting period is therefore at greater risk in terms of both yield and quality.
Barley is mainly used for the production of malt (for brewing beer), animal feed and pearl barley. However, the Crop Estimates Committee’s barley estimates only involve malting barley, therefore excluding barley for animal feed.
The area planted to malting barley for the 2016 season is estimated at 88 695 ha. This is a decrease of 5,4% or 5 035 ha from the plantings of 93 730 ha during 2015. It is also 4,3% or 3 642 ha more than the five-year average of 85 059 ha planted up to 2015. Of the 88 695 ha planted in 2016, 83 000 ha (94%) are in the Western Cape, 2 700 ha (3%) in the Northern Cape, 1 300 ha (1%) in Limpopo, 1 400 ha (2%) in the North West and only 285 ha (0.3%) in the Free State provinces.
A total crop of 291 595 tons of malting barley is expected for the 2016 season. This is a 12,1% decline than the estimated production of 332 000 tons in the previous season and 3,5% or 10 705 tons less than the average production of 302 300 tons per annum over the five years up to 2015. The expected average yield for 2016 is 3,29 t/ha.
50 000
60 000
70 000
80 000
90 000
100 000
100 000
150 000
200 000
250 000
300 000
350 000
400 000
2012 2013 2014 2015 2016
Hecta
res
To
ns
Season
Malting barley: area planted and production 2012–2016
Production Area planted

Trends in the Agricultural Sector 2016 Department of Agriculture, Forestry and Fisheries 24
Plantings, production and yield of malting barley from 2012 to 2016 are as follows:
Season 2012 2013 2014 2015 2016
Plantings (ha) 84 940 81 320 85 125 93 730 88 695
Production (t) 298 000 267 500 302 000 332 000 291 595
Yield (t/ha) 3,51 3,29 3,55 3,54 3,29
Consumption
The processing of barley into malt is done mainly in Caledon in the Southern Cape, but also in Alrode near Johannesburg. Malt barley is all about taste and is mainly used to flavour beer. It is also used around the world in many foods.
The total supply of malting barley for the 2015/16 marketing season (October to September) is estimated at 610 700 tons (imports included). Carry-over stocks as at 1 October 2015 amounted to 210 700 tons. Production for the 2015/16 season was 332 000 tons, while 68 000 tons were imported.
For the 2015/16 marketing season, the total demand for malting barley was estimated at 389 400 tons, including 4 000 tons of exports. Carry-out stocks at 30 September 2016 were 221 300 tons. This is about six times the required three-month pipeline stock of 45 600 tons.
For the 2016/17 marketing season, the total supply of malting barley is expected to be 583 400 tons, comprising the expected crop of 293 100 tons, carry-over stocks of 221 300 tons and expected imports of 69 000 tons. The domestic demand is estimated at 358 000 tons, including 2 500 tons of exports. Carry-out stocks at the end of September 2017 are expected to amount to 225 400 tons.
Producer prices and value of the crop
The average producer price of barley increased by 7%, from R2 403,72/ton in 2014 to R2 578,29/ton in 2015.
The average producer prices of malting barley from 2011 to 2015 are estimated to be as follows:
Season 2011 2012 2013 2014 2015
R/ton
Producer price 2 343,43 2 28008 2 590,59 2 403,72 2 578,29
The average annual gross value of malting barley for the past five years up to 2015/16 amounts to R791 million, compared to the R5 296 million of wheat and R26 094 million of maize.
Marketing
Malting barley is different from most, if not all, other agricultural commodities, as there is only one major buyer in South Africa, namely South African Breweries Maltings (SABM), which supplies its major shareholder, South African Breweries Limited (SAB) with malted barley. Barley producers have a guaranteed market (there is a written commitment to source locally) and fixed-price forward contracts. The malt barley industry is significant in South Africa’s national economy, with barley playing a crucial role in the crop rotation systems used by farmers.
Imports
Variability in rainfall can cause wide fluctuations in barley quality and yields in South Africa. Whenever the local crop has fallen short of requirements, South Africa depends on imports from Australia, France and the Ukraine.

Trends in the Agricultural Sector 2016 Department of Agriculture, Forestry and Fisheries 25
Barley and malt imports from 2011/12 to 2015/16 are as follows:
Season 2011/12 2012/13 2013/14 2014/15
2015/16
Tons
Imports – Barley 59 900 36 655 74 537 91 410 18 238
– Malt 69 600 109 208 117 721 111 779 65 194
Source: SAGIS
Outlook
The South African Breweries (SAB) has announced the construction of a new state-of-the-art malting plant in Alrode, Gauteng, as part of its continued efforts to support the local economy and to drive job creation.
The new plant will produce 130 000 tons of malted barley a year once it is completed in 2015. It will allow SAB to reduce the amount of barley it imports and will further its programme of developing the local agricultural sector by supporting small black farmers.
The construction of the new plant will allow SAB to reduce their exposure to volatile international markets and to replace a significant share of RSA’s imported malt and barley with locally produced barley.
SAB currently sources about 65% of its barley locally and, once the new malting plant is up and running, this will potentially increase to between 90% and 95%.
SAB currently has two malting plants; one at Caledon in the Western Cape, which malts about 180 000 tons of barley a year and one in Alrode, which malts about 40 000 tons a year. The existing Alrode plant is about 48 years old and is coming towards the end of its economic life. It will be decommissioned once the new plant is operational.
World barley situation
Global production in the 2016/17 marketing season is mainly driven by the larger crops in the European Union (60,3 million tons) and Russia (18,5 million tons).
According to the October 2016 report of the United States Foreign Agricultural Services, world barley production is estimated at 144,7 million tons for the 2016/17 marketing year, while global consumption is expected to be 146,6 million tons. Global ending stocks at the end of June 2017 are expected to be 23,6 million tons.
Research and information
The ARC-Small Grain Institute (SGI) in Bethlehem and the South African Barley Breeding Institute (Sabbi) near Caledon conducts research on and breeding of barley in South Africa, which is financed by statutory levies on barley sales.
The ARC-SGI is one of the crop institutes of the ARC which has, under the Agricultural Research Act of 1990 (Act No. 86 of 1990), the mandate to perform research, development and transfer of technology within the RSA to the advantage of all agricultural and agriculture-related industries and therefore improve the quality of life of all South Africans.
On the other hand, Sabbi's Research and Development mission is to ensure sustainable barley production for the benefit of the SAB, SABM and the producer through innovative research and development. Producers need better quality, higher yielding and more resistant varieties, as well as increased knowledge of enhanced agricultural production practices in order to be more competitive with global competitors.
The SAGIS, a section 21 company funded by, among others, the barley industry, administers the information function for the barley industry.

Trends in the Agricultural Sector 2016 Department of Agriculture, Forestry and Fisheries 26
Sunflower seed
Sunflower seed can be planted from the beginning of November to the end of December in the eastern parts of the production areas and up to the middle of January in the western part. Sunflowers grow best when planted in midsummer to ensure that less moisture is lost from the soil during the crucial growing phases. Compared to other crops, sunflower performs well under dry conditions. This is probably the main reason for the crop’s popularity in the marginal production areas of South Africa. A close link exists between the area planted to maize and the area planted to sunflower seed because farmers can easily switch to sunflower if the normal period for maize planting has passed.
Plantings and production
During the 2016 production season, the bulk of the crop was produced in the Free State (55,7%), North West (34,1%) and Limpopo (9,1%) provinces.
The contribution of sunflower seed to the gross value of field crops during the season is approximately 7,9%, compared to the 44,8% of maize, the largest contributor. The average annual estimated gross value of sunflower seed for the five years up to 2015/16 amounts to R3 382 million, compared to the R26 095 million of maize.
The annual plantings of sunflower show remarkable variation, from as low as 316 000 ha to 828 000 ha during the past two decades. The area planted to sunflower seed for commercial use during the 2016 season increased by 24,7% to 718 500 ha, from an estimated 576 000 ha the previous season. This is a 29,4% more than the five-year average of 555 140 ha up to 2015. The increase in the plantings of 2016 can mainly be attributed to the decrease in plantings of the other summer crops such as yellow maize, soya beans, groundnuts and dry beans.
Commercial seed production during 2016 was approximately 755 000 tons, which is 13,9% more than the previous season and 9,9% higher than the average of 686 800 tons for the previous five years. The increase in production can mainly be attributed to high yields. The average yield for 2016 is approximately 1,05 t/ha, which is 8,7% less than the 1,15 t/ha during the previous season and 15,3% less than the five-year average of 1,24 t/ha up to 2015. The decreased yield can be attributed to unfavourable production conditions that prevailed, following insufficient follow-up rainfall received during February/March 2016.
Non-commercial agriculture contributed an estimated 29 490 tons (3,9%) to the total sunflower seed production in South Africa during 2016.
According to the Baseline 2016 report by the Bureau for Food and Agricultural Policy (BFAP) of the University of Pretoria, the expansion in sunflower area in 2016 (24,7%) was offset to some extent by a decrease in average yields from 1,15 t/ha in 2015 to an expected 1,05 t/ha in 2016. Sunflower seed production is expected to reach 41,2 million tons in 2016, a 5% increase from 2015 levels on a slightly larger area. Therefore, total sunflower seed production is expected to amount to 730 000 tons, a 10% increase from 2015 levels. Going forward, an average increase in production of 1,4% per annum is expected over the outlook period to reach 820 000 tons in 2025, driven by an average annual yield improvement of just under 3% toward 2025. The production and crushing demand for sunflower seed is projected to remain in a fine balance over the course of the outlook period, with small volumes (less than 5% of domestic use) being
0
200
400
600
800
1 000
2012 2013 2014 2015 2016
'000
to
ns
Season
Area planted to and production of commercial sunflower seed 2012–2016
Production Area planted
Trends in the Agricultural Sector 2016 Department of Agriculture, Forestry and Fisheries 27
imported. Therefore, prices are expected to trade between import and export parity levels, largely derived from the price of oil and meal. Similar to the price of soya beans, the sunflower price is projected to trade sideways up until 2018 after which the price projected increases in line with parity price trends.
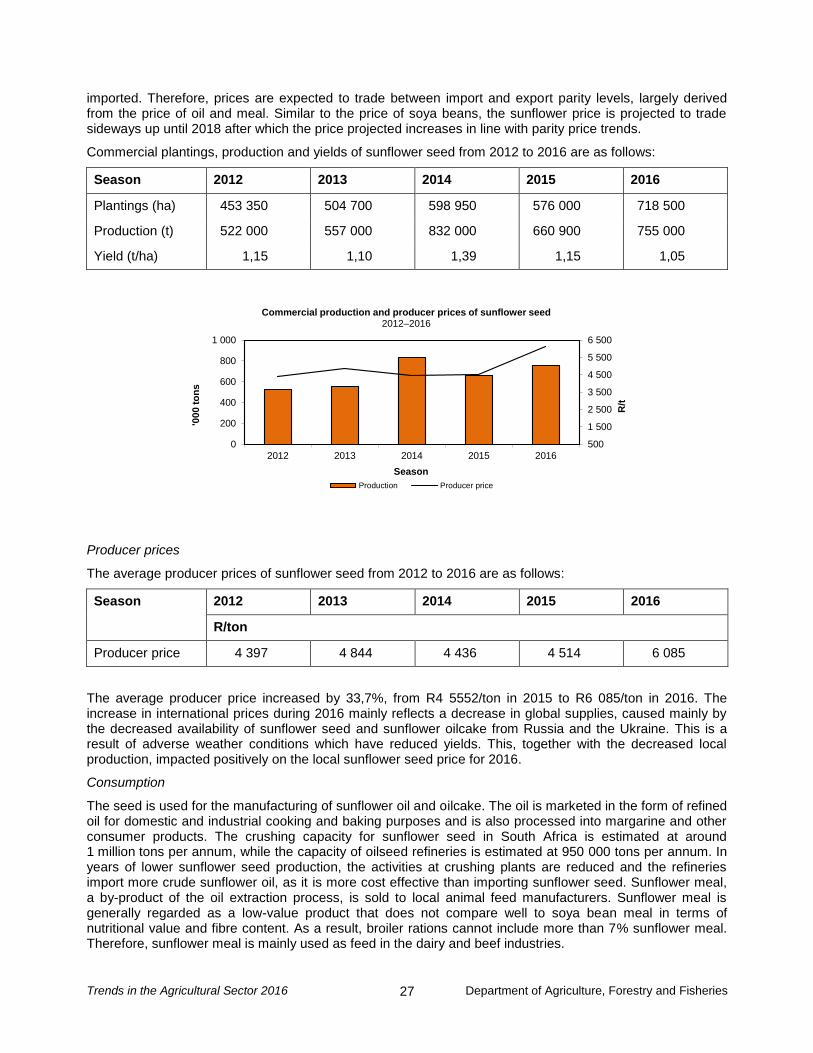
Commercial plantings, production and yields of sunflower seed from 2012 to 2016 are as follows:
Season 2012 2013 2014 2015 2016
Plantings (ha) 453 350 504 700 598 950 576 000 718 500
Production (t) 522 000 557 000 832 000 660 900 755 000
Yield (t/ha) 1,15 1,10 1,39 1,15 1,05
Producer prices
The average producer prices of sunflower seed from 2012 to 2016 are as follows:
Season 2012 2013 2014 2015 2016
R/ton
Producer price 4 397 4 844 4 436 4 514 6 085
The average producer price increased by 33,7%, from R4 5552/ton in 2015 to R6 085/ton in 2016. The increase in international prices during 2016 mainly reflects a decrease in global supplies, caused mainly by the decreased availability of sunflower seed and sunflower oilcake from Russia and the Ukraine. This is a result of adverse weather conditions which have reduced yields. This, together with the decreased local production, impacted positively on the local sunflower seed price for 2016.
Consumption
The seed is used for the manufacturing of sunflower oil and oilcake. The oil is marketed in the form of refined oil for domestic and industrial cooking and baking purposes and is also processed into margarine and other consumer products. The crushing capacity for sunflower seed in South Africa is estimated at around 1 million tons per annum, while the capacity of oilseed refineries is estimated at 950 000 tons per annum. In years of lower sunflower seed production, the activities at crushing plants are reduced and the refineries import more crude sunflower oil, as it is more cost effective than importing sunflower seed. Sunflower meal, a by-product of the oil extraction process, is sold to local animal feed manufacturers. Sunflower meal is generally regarded as a low-value product that does not compare well to soya bean meal in terms of nutritional value and fibre content. As a result, broiler rations cannot include more than 7% sunflower meal. Therefore, sunflower meal is mainly used as feed in the dairy and beef industries.
500
1 500
2 500
3 500
4 500
5 500
6 500
0
200
400
600
800
1 000
2012 2013 2014 2015 2016
R/t
'000
to
ns
Season
Commercial production and producer prices of sunflower seed 2012–2016
Production Producer price
Trends in the Agricultural Sector 2016 Department of Agriculture, Forestry and Fisheries 28
The South African Grain and Oilseeds Supply and Demand Estimates Committee (S&DEC) was established in 2013 by the National Agricultural Marketing Council. The Committee was formed to address the specific need for accurate information pertaining to the supply of and demand for the major grain and oilseed crops, namely white and yellow maize, wheat, sorghum, sunflower seed and soya beans.
The sunflower seed marketing season in South Africa commences on 1 March and ends on 28 February. The estimated sunflower seed crop of 755 000 tons for the 2016/17 marketing season, together with carry-over stocks of about 45 867 tons on 1 March 2016 and projected imports of 35 000 tons, leaves the domestic supply of commercial seed at an estimated 840 867 tons for the season.
In South Africa, sunflower seed is used almost exclusively (an estimated 98,3% or 740 000 tons in 2016) for oil and oilcake production. The estimated domestic demand of seed for the 2016 marketing year is approximately 761 250 tons, including 21 150 tons for human, animal and other consumption. The projected exports during 2016 are 200 tons. Carry-out stocks on 28 February 2017 are expected to be approximately 79 617 tons, which is 57,3% less than the 3-month pipeline stock of approximately 185 600 tons.
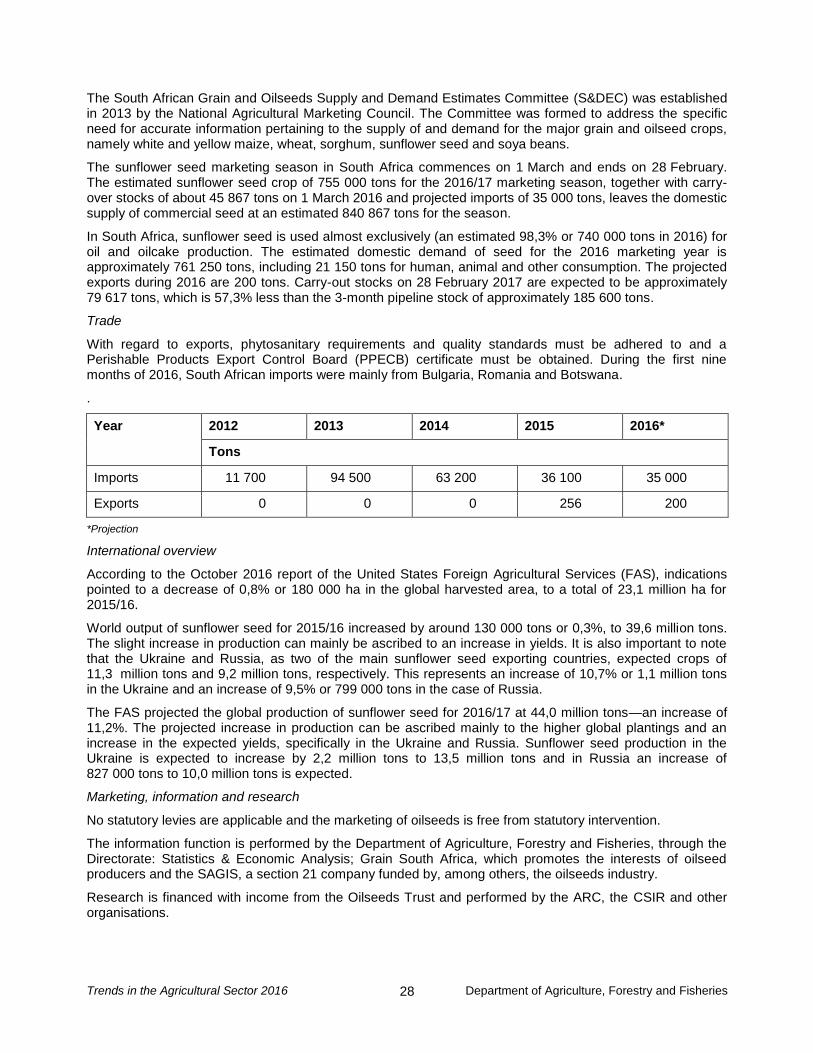
Trade
With regard to exports, phytosanitary requirements and quality standards must be adhered to and a Perishable Products Export Control Board (PPECB) certificate must be obtained. During the first nine months of 2016, South African imports were mainly from Bulgaria, Romania and Botswana.
.
Year 2012 2013 2014 2015 2016*
Tons
Imports 11 700 94 500 63 200 36 100 35 000
Exports 0 0 0 256 200
*Projection
International overview
According to the October 2016 report of the United States Foreign Agricultural Services (FAS), indications pointed to a decrease of 0,8% or 180 000 ha in the global harvested area, to a total of 23,1 million ha for 2015/16.
World output of sunflower seed for 2015/16 increased by around 130 000 tons or 0,3%, to 39,6 million tons. The slight increase in production can mainly be ascribed to an increase in yields. It is also important to note that the Ukraine and Russia, as two of the main sunflower seed exporting countries, expected crops of 11,3 million tons and 9,2 million tons, respectively. This represents an increase of 10,7% or 1,1 million tons in the Ukraine and an increase of 9,5% or 799 000 tons in the case of Russia.
The FAS projected the global production of sunflower seed for 2016/17 at 44,0 million tons—an increase of 11,2%. The projected increase in production can be ascribed mainly to the higher global plantings and an increase in the expected yields, specifically in the Ukraine and Russia. Sunflower seed production in the Ukraine is expected to increase by 2,2 million tons to 13,5 million tons and in Russia an increase of 827 000 tons to 10,0 million tons is expected.
Marketing, information and research
No statutory levies are applicable and the marketing of oilseeds is free from statutory intervention.
The information function is performed by the Department of Agriculture, Forestry and Fisheries, through the Directorate: Statistics & Economic Analysis; Grain South Africa, which promotes the interests of oilseed producers and the SAGIS, a section 21 company funded by, among others, the oilseeds industry.
Research is financed with income from the Oilseeds Trust and performed by the ARC, the CSIR and other organisations.

Trends in the Agricultural Sector 2016 Department of Agriculture, Forestry and Fisheries 29
Soya beans
Various soya bean cultivars have adapted quite well to South African conditions. Depending on prevailing local conditions, soya beans are usually planted in November and December. On ripening, the leaves turn yellow and the seeds’ moisture content decreases – from about 65% to 14% within 14 days – provided hot, dry weather occurs.
It is a relatively difficult crop to grow and not all areas are suitable for soya bean cultivation. The plants thrive in warm, fertile, clayish soil and are mainly cultivated under dry land conditions.
Soya beans contributed approximately 7,7% to the gross value of field crops during 2015/16. The estimated average annual gross value of soya beans for the past five seasons up to 2015/16 amounts to R4 208 million.
Plantings and production
The plantings of soya beans ranged between 68 000 and 687 300 ha over the past 20 years.
During the 2016 season, soya beans were grown primarily in Mpumalanga (240 000 or 47,7%), the Free State (174 000 ha or 34,6%) and KwaZulu-Natal (28 000 ha or 5,8%) provinces.
During the 2016 season, an estimated 502 800 ha were planted for commercial use, compared to an estimated 687 300 ha the previous season. This represents a decrease of 26,8% and is 3,2% less than the five-year average of 519 340 ha up to 2015. The decrease in plantings can mainly be attributed to an increase in the plantings of other summer crops, specifically sunflower seed.
The crop of an estimated 741 550 tons in 2016 (the lowest since 2012) represents a decrease of 30,7% from the 2015 crop of 1 070 million tons. It is also 10,9% lower than the average of 832 500 tons for the five years up to 2015. The average yield of 1,47 t/ha is 5,8% less than the 1,56 t/ha of the previous season.
Seasonal rains arrived several weeks late during the latter part of 2015, delaying the start of the planting season. Limited follow-up rains were received during 2016 as severe drought conditions persisted and extremely high temperatures were experienced, which all impacted negatively on soya bean yields.
Plantings, production and yields of soya beans from 2012 to 2016 are as follows:
Season 2012 2013 2014 2015 2016
Plantings (ha) 472 000 516 500 502 900 687 300 502 800
Production (t) 650 000 784 500 948 000 1 070 000 741 550
Yield (t/ha) 1,38 1,52 1,89 1,56 1,47
In October 2016, the intended soya bean plantings of South African farmers were estimated to be 516 000 ha for the 2017 season, which is 2,6% more than the 502 800 ha planted during 2015/16. This is expected to be the fourth largest soya bean plantings on record.

Trends in the Agricultural Sector 2016 Department of Agriculture, Forestry and Fisheries 30
Producer prices
The main influences on soya bean prices include the level of soya production in South America, the demand for imported soya in China, marine freight rates and the rand/dollar exchange rate.
The average local producer price of soya beans for 2016 is approximately R6 217/ton, which is 31,4% more than the price for 2015. The higher price was mainly driven by limited local stocks as a result of the smaller expected soya bean crop for 2016. The price support was also partially due to the weakening of the rand. Local soya bean prices are, among other factors, influenced by international soya bean and vegetable oil prices.
The average producer prices of soya beans from 2012 to 2016 are as follows:
Year 2012 2013 2014 2015 2016
R/ton
Producer price 3 684 4 692 5 549 4 732 6 217
Consumption
Following an extensive consultation process, the South African Grain and Oilseeds Supply and Demand Estimates Committee (S&DEC) was established in 2013 by the National Agricultural Marketing Council. The Committee was formed to address the specific need for accurate information that relates to grain imports and exports to be made available timely to all stakeholders. In addition, there was also a need for the release of official supply and demand figures for the major grain and oilseed crops, namely, white and yellow maize, wheat, sorghum, sunflower seed and soya beans. The first official publication of the supply and demand estimates by the S&DEC was published on 28 June 2013.
The soya bean marketing season in South Africa commences on 1 March and ends on 28 February. An estimated total of 1,105 million tons of soya beans were available for utilisation during the 2016 marketing season. It comprises carry-over stocks on 1 March 2016 amounting to 89 128 tons, the estimated production (excluding retentions by producers) of 709 550, a surplus of 6 000 tons and projected imports of 300 000 tons.
In South Africa, soya beans are mainly used for animal feed. The local demand for soya bean meal, as the
preferred source of protein for animal feed, has increased in correlation with the increase in poultry production in South Africa and more than doubled over the past decade. As local production of soya bean meal was limited in the past, almost all of the local consumption had to be imported. With the expansion of the local soya bean crushing industry and soya bean production, imports as a percentage of local consumption is expected to show a decreasing trend.
200 000
400 000
600 000
800 000
1 000 000
200 000
400 000
600 000
800 000
1 000 000
1 200 000
2012 2013 2014 2015 2016
he
cta
res
ton
s
Area planted to and production of soya beans 2012–2016
Production Area planted

Trends in the Agricultural Sector 2016 Department of Agriculture, Forestry and Fisheries 31
The local commercial consumption of soya beans for 2016 is projected at 1,010 million tons—105 000 tons for feed (full-fat soya), 880 000 tons for oil and oilcake and 25 000 tons for human consumption. Other consumption is estimated at 13 000 tons.
The projected exports during 2016 are 6 500 tons. Carry-over stocks on 28 February 2017 are expected to be approximately 75 178 tons.
The following graph illustrates the commercial consumption of soya beans.
Trade
During the first seven months of 2016, South African exports of soya beans were mainly to Zimbabwe, Mozambique and Botswana. South African imports for the mentioned period were mainly from Paraguay, Ethiopia and Zambia.
The imports and exports of soya beans from 2012 to 2016 are as follows:
Year 2012 2013 2014 2015 2016*
Tons
Imports 300 3 300 103 000 125 000 300 000
Exports 152 600 15 400 600 4 700 4 500
*Projected
International overview
Economically, the soya bean is the most important legume in the world, providing good-quality vegetable protein for millions of people and animals, as well as ingredients for numerous chemical products. From the end of the 20
th century up to the present, the crop has played an important role in helping to alleviate world
hunger.
According to the World Agricultural Supply and Demand Estimate (WASDE) report released in October 2016, world production of soya beans decreased by 2,1%, from 319,8 million tons for the 2014/15 season to 313,0 million tons for 2015/16. The slight decrease in world production can mainly be attributed to the smaller crops in the India, Argentina and China. The United States contributed 34,1% (106,9 million tons), Brazil 30,8% (96,5 million tons), Argentina 18,1% (56,8 million tons), China 3,7% (11,6 million tons), Paraguay 2,9% (9,0 million tons) and India 2,3% (7,1 million tons) to world production. The balance of 8,0% (25,1 million tons) is made up by, amongst others, the EU-27, Canada, Japan, Mexico and Southeast Asia (which includes Indonesia, Malaysia, the Philippines, Vietnam and Thailand).
Outlook
According to the Baseline 2016 outlook by the Bureau for Food and Agricultural Policy (BFAP) of the University of Pretoria, the domestic soya bean area is projected to sustain its increasing trend over the baseline period, as summer grain producers progressively incorporate more soya bean production as part of their crop rotation practices. By 2025, the area under soya bean cultivation is expected to be just under 1 million ha and production is projected to exceed 2,2 million tons.
200
400
600
800
1 000
1 200
2012 2013 2014 2015 2016
'00
0 t
on
s
Commercial consumption of soya beans 2012–2016
Human consumption Full-fat soya Crushed for oil and oilcake
Trends in the Agricultural Sector 2016 Department of Agriculture, Forestry and Fisheries 32
The local oilseed crushing industry has rapidly expanded its capacity over the past few seasons. However, with many new crushing plants coming online, utilisation rates have remained low due to technical challenges in a number of newly constructed plants, as well as a shortage of domestically produced soya beans. While some soya bean imports have been forthcoming over the past two seasons, domestic soya bean prices remain well below import parity levels, as they are derived from the price of oil and oilcake. Crushing margins come under immense pressure when the cost of beans increases to import parity levels. However, over the course of the next decade, utilisation rates are projected to improve and with domestic soya bean production still expanding, only a limited amount of soya beans will occasionally be imported.
In order to reach the industry benchmark utilisation rate of 80% over the next few years, a fine balance will need to be maintained between positive crushing margins and the need to import soya beans to ensure consistent supply to local crushers and allow maximum capacity utilisation. By 2025, more than 2,1 million tons of soya beans are projected to be crushed domestically, implying that both the dedicated soya crushing plants and the dual capacity plants will be utilised for soya beans, at the benchmark rate of 80%. Accounting for some full fat soya utilised in the animal feed market and stock changes implies that only 3% of the soya beans required to fulfil domestic crushing demand is projected to be imported by 2025.
The October WASDE report projected the global production of soya beans for the 2016/17 marketing season at a record 333,2 million tons—an increase of 6,5%. In addition to the USA, increases are also projected for Brazil, Argentina, China, India, Paraguay and the EU-27, where relative prices favour soya beans over maize. The USA’s soya bean production is expected to increase by 9,3 million tons to 116,2 million tons, followed by Brazil with an increase of 5,5 million tons to 102,0 million tons, Argentina with an increase of 200 000 tons to 57,0 million tons, China with an increase of 900 000 tons to 12,5 million tons, India with an increase of 2,6 million tons to 9,7 million tons, Paraguay with an increase of 200 000 tons to 9,2 million tons, and the EU-27 with an increase of 1,8 million tons to 20,7 million tons.
Research and information
Locally, research on soya beans is performed by the ARC, the CSIR and other organisations financed by income from the Oil and Protein Seeds Development Trust.
The information function is performed by the Department of Agriculture, Forestry and Fisheries through the Directorate: Statistics and Economic Analysis, by Grain South Africa and by the SAGIS, a section 21 company funded by the four grain trusts. SAGIS collects, collates and publishes highly factual and reliable market information (stocks, imports, exports, producer deliveries and consumption) once a month.
Accurate crop forecasts and estimates also play an important role by providing up-to-date information, upon which important decisions and measures can be based. The crop estimates are a result of the collated inputs of and consensus reached by the various members of the Crop Estimates Committee.

Trends in the Agricultural Sector 2016 Department of Agriculture, Forestry and Fisheries 33
Groundnuts
Plantings and production
The normal planting time for groundnuts is mid-October to mid-November. Groundnuts are mainly produced in the north-western regions of South Africa, namely the western and north-western Free State province and the North West and Northern Cape provinces.
During the 2015/16 production season, 42,0% of the plantings were in the North West, 28,8% in the Free State and 22,1% in the Northern Cape provinces.
Groundnuts contributed approximately 0,5% to the value of local field crops in 2015/16, while the average annual gross value of groundnuts for the five years up to 2015/16 amounts to approximately R501 million.
An estimated 22 600 ha were planted to groundnuts for commercial use, compared to 58 000 ha planted during 2014/15. This represents a decrease of 61,0% and is 56,1% lower than the average of 51 525 ha planted during the five years up to 2014/15.
An estimated commercial crop of 18 850 tons of groundnuts was produced during 2015/16. This represents a decrease of 69,7% from the 2014/15 crop of 62 300 tons. The 2015/16 crop is 68,7% less than the five-year average of 60 310 tons up to 2014/15. The average yield for 2015/16 was 0,83 t/ha, which is 22,4% less than the 1,07 t/ha of the previous season and 29,1% less than the five-year average of 1,17 t/ha up to 2014/15.
Plantings, production and the yield of groundnuts from 2011/12 to 2015/16 are as follows:
Season 2011/12 2012/13 2013/14 2014/15 2015/16
Plantings (ha) 45 450 46 900 52 125 58 000 22 600
Production (t) 59 000 41 500 74 500 62 300 18 850
Yield (t/ha) 1,30 0,88 1,43 1,07 0,83
Producer prices
Groundnuts are traditionally an export commodity and local prices are determined mainly by export parity.
The average producer prices of groundnuts from 2012/13 to 2016/17 marketing season were as follows:
Season 2012/13 2013/14 2014/15 2015/16 2016/17*
R/ton
Producer price 8 287 8 756 8 234 7 582 9 409
*Preliminary
20 000
40 000
60 000
80 000
100 000
120 000
10 000
20 000
30 000
40 000
50 000
60 000
70 000
80 000
2011/12 2012/13 2013/14 2014/15 2015/16
Hecta
res
To
ns
Season
Area planted to and production of groundnuts 2011/12–2015/16
Production Area planted

Trends in the Agricultural Sector 2016 Department of Agriculture, Forestry and Fisheries 34
The average producer price for groundnuts shows an increase of 24,1%, from R7 582/ton in 2015/16 to R9 409/ton in 2016/17. The increase in producer prices can mainly be attributed to the decline in the local production of groundnuts as a result of unfavourable production conditions due to drought experienced in the past season, as well as high volumes of imports.
Trade balance
The SA Groundnut Forum has requested all role players to comply with legally prescribed standards for permissible levels of chemical residue on groundnuts destined for export in order to maintain the market share of South African groundnuts, especially in the European Union and Japan. These regulations are based on the principle of critical good agricultural practices (CGAP).
Imports of groundnuts to and exports from South Africa during the five marketing seasons (March to February) up to 2016/17 are as follows:
Season 2012/13 2013/14 2014/15 2015/16 2016/17*
Tons
Imports 17 800 29 000 11 300 14 600 50 000
Exports 15 300 10 400 12 100 15 400 10 000
*Projections
It is expected that the South African groundnuts imports could reach 50 000 tons in the 2016/17 marketing season, which is the highest volume on record as far back as in 1998. During the first six months of the mentioned marketing season, South African imports of groundnuts were mainly from Argentina, Brazil, Mozambique, Malawi, China and Zambia.
The expected groundnuts exports shows a decrease of 35,1%, from 15 400 tons in 2015/16 to 10 000 tons in 2016/17. The major export destinations for South African groundnuts are Mozambique, Japan, the Netherlands, Belgium and Zimbabwe.
Consumption
An estimated total of 81 050 tons of groundnuts will be available for utilisation during the 2016/17 marketing season. Carry-over stocks on 1 March 2016 amounted to 12 200 tons and the estimated production is 18 850 tons. Projected imports amount to approximately 50 000 tons.
In South Africa, groundnuts are mainly consumed in two forms, i.e., as edible nuts and processed peanut butter. The local commercial consumption of groundnuts for 2016/17 is estimated at 57 400 tons—1 600 tons for oil and oilcake, 29 600 tons for peanut butter, 25 800 tons for the direct edible market and 400 tons as pods. Other consumption (released to end consumers, seed, etc.) amounts to 6 700 tons. The projected exports during 2015 are 10 000 tons. Carry-over stocks on 28 February 2017 are expected to be approximately 6 950 tons.
Direct edible market 45%
Crushed for oil and oilcake
3%
Peanut butter 47%
Pods 1%
Other uses 4%
Utilisation of groundnuts for the local market 2016/17
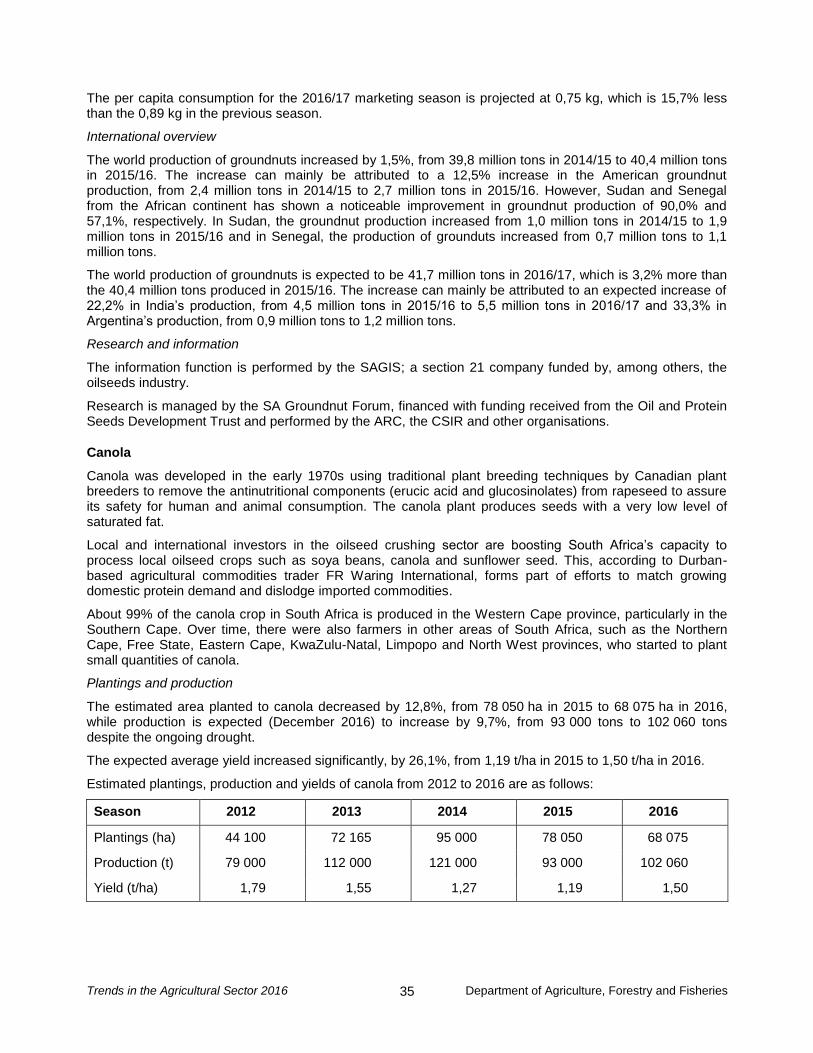
Trends in the Agricultural Sector 2016 Department of Agriculture, Forestry and Fisheries 35
The per capita consumption for the 2016/17 marketing season is projected at 0,75 kg, which is 15,7% less than the 0,89 kg in the previous season.
International overview
The world production of groundnuts increased by 1,5%, from 39,8 million tons in 2014/15 to 40,4 million tons in 2015/16. The increase can mainly be attributed to a 12,5% increase in the American groundnut production, from 2,4 million tons in 2014/15 to 2,7 million tons in 2015/16. However, Sudan and Senegal from the African continent has shown a noticeable improvement in groundnut production of 90,0% and 57,1%, respectively. In Sudan, the groundnut production increased from 1,0 million tons in 2014/15 to 1,9 million tons in 2015/16 and in Senegal, the production of grounduts increased from 0,7 million tons to 1,1 million tons.
The world production of groundnuts is expected to be 41,7 million tons in 2016/17, which is 3,2% more than the 40,4 million tons produced in 2015/16. The increase can mainly be attributed to an expected increase of 22,2% in India’s production, from 4,5 million tons in 2015/16 to 5,5 million tons in 2016/17 and 33,3% in Argentina’s production, from 0,9 million tons to 1,2 million tons.
Research and information
The information function is performed by the SAGIS; a section 21 company funded by, among others, the oilseeds industry.
Research is managed by the SA Groundnut Forum, financed with funding received from the Oil and Protein Seeds Development Trust and performed by the ARC, the CSIR and other organisations.
Canola
Canola was developed in the early 1970s using traditional plant breeding techniques by Canadian plant breeders to remove the antinutritional components (erucic acid and glucosinolates) from rapeseed to assure its safety for human and animal consumption. The canola plant produces seeds with a very low level of saturated fat.
Local and international investors in the oilseed crushing sector are boosting South Africa’s capacity to process local oilseed crops such as soya beans, canola and sunflower seed. This, according to Durban-based agricultural commodities trader FR Waring International, forms part of efforts to match growing domestic protein demand and dislodge imported commodities.
About 99% of the canola crop in South Africa is produced in the Western Cape province, particularly in the Southern Cape. Over time, there were also farmers in other areas of South Africa, such as the Northern Cape, Free State, Eastern Cape, KwaZulu-Natal, Limpopo and North West provinces, who started to plant small quantities of canola.
Plantings and production
The estimated area planted to canola decreased by 12,8%, from 78 050 ha in 2015 to 68 075 ha in 2016, while production is expected (December 2016) to increase by 9,7%, from 93 000 tons to 102 060 tons despite the ongoing drought.
The expected average yield increased significantly, by 26,1%, from 1,19 t/ha in 2015 to 1,50 t/ha in 2016.
Estimated plantings, production and yields of canola from 2012 to 2016 are as follows:
Season 2012 2013 2014 2015 2016
Plantings (ha) 44 100 72 165 95 000 78 050 68 075
Production (t) 79 000 112 000 121 000 93 000 102 060
Yield (t/ha) 1,79 1,55 1,27 1,19 1,50

Trends in the Agricultural Sector 2016 Department of Agriculture, Forestry and Fisheries 36
The areas planted to and production of canola is depicted in the following graph.
The planting of canola as an alternative to small grain crops has become an important part of crop rotation practices in the Western Cape province. It is particularly the herbicide resistant cultivars that make it possible for canola to be included in crop rotation systems with wheat in many regions. In such crop rotation systems, canola usually causes an increase in the yields of the subsequent crops. Where wheat was planted after canola, increases of up to 25% in yields have been observed. One of the reasons for this is the deep taproot system of canola, which acts as a ‘’biological plough’’ to facilitate root penetration for the crop planted after canola. This then improves infiltration of rain water and reduces water runoff and surface erosion. In addition, canola has a biofumigation effect on the soil, which reduces the manifestation of pests and diseases in the soil. Just prior to harvest time, the canola plants drop a large volume of plant material that assists with the biofumigation but also returns a considerable quantity of nutrients and organic material to the soil.
Consumption
Canola oil is the healthiest commodity oil available to consumers, the food service industry and food processors. Canola oil contains the least amount of saturated fat (7%) of any common edible oil, with the remaining 93% being healthy monounsaturated and polyunsaturated fats. The polyunsaturated fats in canola oil are essential omega-3 and omega-6 fatty acids. The omega-3, alpha-linolenic acid, may help prevent heart attacks and strokes. The omega-6, linoleic acid, is important for the brain and essential for the growth and development of infants.
Canola meal is used as an animal feed for dairy cows, pigs and poultry. Its unique characteristics are especially valuable in the dairy industry, where it has been shown that by including 20% canola meal in a feed ration improves milk production by one litre per cow per day.
Canola is primarily used for the manufacturing of canola oil and oilcake. On the local market, canola competes with other oilseeds such as sunflower seed and soya beans. The market for soft oils (oils that are liquid at room temperature), including canola oil, is a huge one and applications for this market are typically bottled oil for household use, soft margarine, mayonnaise, salad oil and various industrial uses.
For the 2015/16 marketing season (October to September), 143 310 tons of canola were available for local consumption. This comprised of carry-over stocks as from 1 October 2015 amounting to 50 310 tons and domestic production of 93 000 tons. During the same period, there were no imports or exports of canola. Total demand for canola for the 2015/16 marketing season was approximately 130 500 tons, while carry-out stocks on 30 September 2016 were approximately 12 810 tons.
For the 2016/17 marketing season, total supply of canola is estimated at 114 870 tons (the estimated canola crop of 102 060 tons, together with carry-over stocks of 12 810 tons). Domestic demand for canola is estimated at 109 600 tons while carry-out stocks at the end of September 2017 is expected to reach 6 270 tons. Furthermore, during the same season, 1 000 tons of canola was imported while no canola was exported during the season.
0
20 000
40 000
60 000
80 000
100 000
0
25 000
50 000
75 000
100 000
125 000
150 000
2012 2013 2014 2015 2016
Hecta
res
To
ns
Canola: Area planted and production 2012–2016
Production Area planted

Trends in the Agricultural Sector 2016 Department of Agriculture, Forestry and Fisheries 37
Prices
As a large percentage of the local demand for vegetable oil is imported, the international oilseed prices largely determine the local prices of oilseeds, and therefore also the price of soya bean oilcake. The price of canola oil is based on the local price of sunflower oil and soya bean oilcake. Prices paid to producers vary, depending on the protein content and whether it is delivered for the feed market or to be crushed for oil.
The average producer prices of canola from 2011 to 2015 are as follows:
Season 2011 2012 2013 2014 2015
R/ton
Producer price 4 600,00 4 760,00 4 650,79 4 750,00 4 749,89
The average producer price of canola decreased by a marginal 0.002%, from R4 750,00/ton in 2014 to R4 749,89/ton in 2015. The marginal decrease in the 2015 canola price is due to a complex consideration of a number of variables including the import price of substitutes, international canola prices as well as the local and international protein prices.
International overview
Global canola production has grown rapidly over the past 40+ years, rising from the sixth largest oil crop to the second largest.
Production of world canola/rapeseed is forecasted to reach 67,61 million tons in 2016/17, approximately 1,99 million tons (36.5%) less than 69,61million tons recorded in 2015/16. This is despite the little change in area planted in 2016. According to the USDA, the potential drop in global production comes after farmers harvested 33,56 million ha planted with rapeseed in 2015/16, the lowest acreage devoted to the crop since 2010/11.
Australian canola production’s forecast is to increase to 3,44 million tons in 2016, up from 3,098 million tons in 2015 following good rains. The planted area increased by 10% due to improved gross margins, driving overall improved prospects. USDA forecasts the 2016/17 area harvested for Canada rapeseed to reach 7,7 million ha, approximately 4,3% down from 2015/16. The European Union rapeseed outlook for 2016/17 is not overly optimistic while the area planted is expected to be slightly down from last year, approximately 6% less than the recent average. Meanwhile, planted areas in Ukraine suffered due to extreme dry weather conditions and as a result, harvest volumes are expected to be cut by up to one-third this year, before factoring any potential gains or losses to yields.
Nonetheless, though there is a modest rise in Australia's production forecast in 2016/17, lower Canadian and Ukrainian output will result in a further decrease in exports from this year's reduced level. Rapeseed exports are forecast to reach 12,6 million tons in 2016/17, approximately 3,0 million tons below the peak level reached in 2013/14. Global ending stocks are also expected to decline by 1,5 million tons from this year's projected 3,4 million tons. Rapeseed supplies in the EU will continue to be tight leading to a further reduction in crushing while ending stocks, relative to use, are forecast to reach the lowest level since 2003/04
Research and information
The Western Cape Department of Agriculture conducts research and cultivar trials on canola. The Protein Research Foundation (PRF) funds this research and it is the task of the canola working group of the PRF to promote the local canola industry.
The information function for canola is performed by the SAGIS; a section 21 company funded by, among others, the oilseeds industry.

Trends in the Agricultural Sector 2016 Department of Agriculture, Forestry and Fisheries 38
Cotton
In South Africa, cotton is grown in the warm regions of the Limpopo, Mpumalanga, Northern Cape, North West and KwaZulu-Natal provinces where minimum night temperatures are at least 15
°C during the growing
season. Cotton is planted mainly during October, although planting can be done until the second half of November.
The cotton industry is labour intensive and provides work for roughly one worker per hectare of cotton planted. Oil extracted from cotton seed can be used for cooking and salad dressings. Extracted seed can also be used as a fertiliser or as feed for livestock, poultry and fish.
Area planted and production
The total area planted to cotton in South Africa for the 2015/16 production season is estimated at 8 353 ha, which is a decrease of 45,9% from the 15 428 ha of the previous season. The area planted to cotton reached its peak during the 1987/88 production season, when an estimated 181 676 ha were planted. Since then, plantings have decreased substantially.
Source: Cotton SA
Yields per hectare under irrigation are up to seven times higher than on dry land. An estimated average yield of 4 689 kg/ha seed cotton was realised on irrigated land during the 2015/16 production season, compared to 635 kg/ha realised on dry land.
During 2015/16, an estimated 30,0% of the total area planted to cotton was on dry land, as against 43% the previous season. The area under irrigation also decreased by 33,5% from 2014/15 to 2015/16. High prices for summer grains resulted in many farmers opting to plant maize instead.
The domestic production of cotton lint for the 2015/16 marketing season (April to March) is estimated at 53 146 bales of 200 kg each, which is an decrease of 43,4% from the 93 922 bales produced during the 2014/15 season.
As part of the cotton industry’s objective to broaden participation by emerging farmers, a training programme has been established by Cotton SA and other stakeholders, including the private sector and government. Lack of knowledge and expertise among small-holder cotton farmers are major constraints that impede success in the emerging cotton farming sector. More than a thousand small-holder farmers have attended these training courses.
0
20 000
40 000
60 000
80 000
100 000
6 000
8 000
10 000
12 000
14 000
16 000
18 000
2011/12 2012/13 2013/14 2014/15 2015/16
200 k
g b
ale
s
Hecta
res
Season
Area planted to cotton and production of cotton lint in the RSA 2011/12–2015/16
Production Area planted

Trends in the Agricultural Sector 2016 Department of Agriculture, Forestry and Fisheries 39
Areas planted to cotton and the production of cotton lint for the 2011/12 to 2015/16 production seasons by the RSA and Swaziland compare as follows:
RSA
Production season 2011/12 2012/13 2013/14 2014/15 2015/16*
Total RSA plantings (ha) 9 397 6 827 7 458 15 428 8 353
Dryland (ha) 2 166 3 871 2 892 6 636 2 510
Irrigation (ha) 7 231 2 956 4 566 8 792 5 843
Production of cotton lint (200 k
bales) from RSA-grown cotton 60 319 26 027 43 703 93 922 53 146
Swaziland
Production season 2011/12 2012/13 2013/14 2014/15 2015/16*
Total Swaziland plantings (ha) 3 600 3 600 4 000 1 700 800
Dryland (ha) 3 600 3 600 4 000 1 700 800
Irrigation (ha) 0 0 0 0 0
Production of cotton lint (200 kg
bales) from Swaziland-grown
cotton 3 730 4 500 4 500 1 550 600
* Estimates (September 2016)
Source: Cotton SA
World cotton production for 2015/16 is forecasted by the International Cotton Advisory Committee (ICAC) to increase by around 7% from the previous season. Production in India, the world’s largest cotton producing country is expected to remain at 5,8 million tons while production in China is expected to decline by 4%. The ICAC expects production in the USA and Pakistan to increase by around 26%, respectively. World cotton consumption should remain unchanged.
Prices
The average producer price for seed cotton (lint and seed derived from the boll of the cotton plant before it is ginned) for the 2015/16 marketing season (April to March) was 765 c/kg, while the price for 2015/16 is projected at 800 c/kg—an increase of 4,6%. In South Africa, the price of cotton normally emulates global price trends.
The average South African producer prices for seed cotton and cotton lint compare as follows:
Marketing year 2012/13 2013/14 2014/15 2015/16 2016/17*
c/kg
Seed cotton 509 480 500 765 800
Cotton lint 1 508 1 674 1 855 1 903 2000
*Projections
Consumption
Consumption of cotton lint by RSA and Swaziland spinners for the 2016/17 marketing year is estimated at 95 000 bales of 200 kg, compared to the 106 295 bales of the 2015/16 year—a decrease of 10,6%.
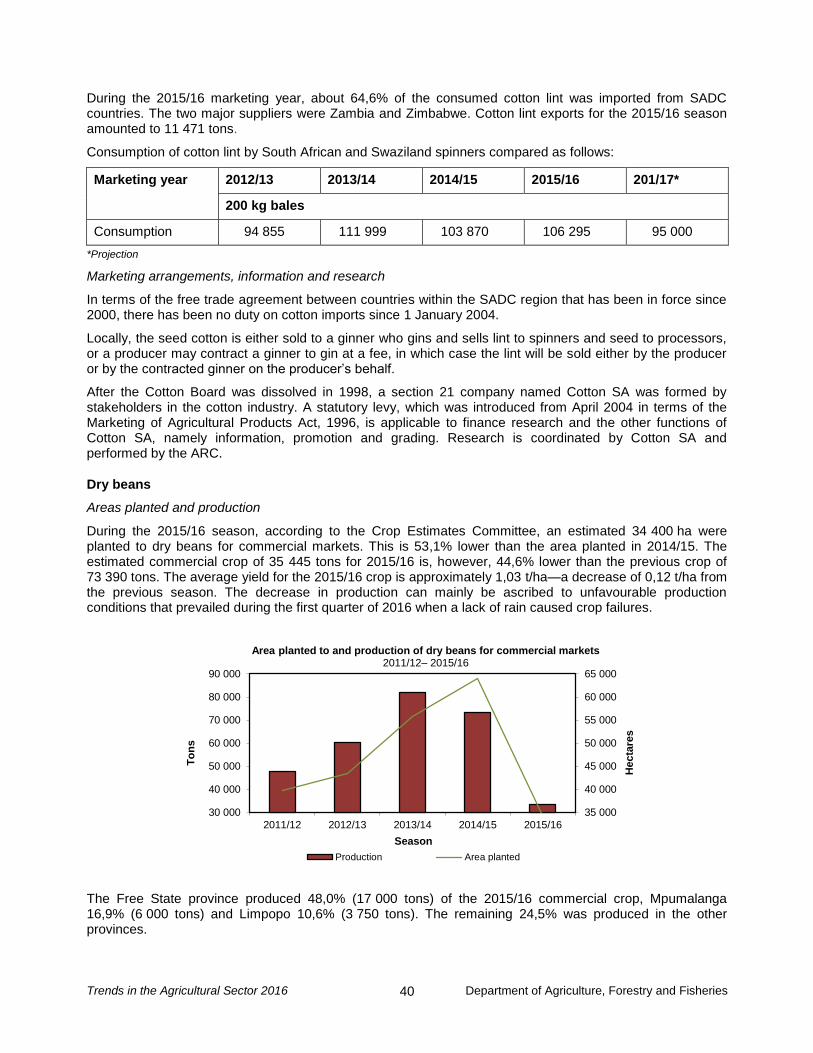
Trends in the Agricultural Sector 2016 Department of Agriculture, Forestry and Fisheries 40
During the 2015/16 marketing year, about 64,6% of the consumed cotton lint was imported from SADC countries. The two major suppliers were Zambia and Zimbabwe. Cotton lint exports for the 2015/16 season amounted to 11 471 tons.
Consumption of cotton lint by South African and Swaziland spinners compared as follows:
Marketing year 2012/13 2013/14 2014/15 2015/16 201/17*
200 kg bales
Consumption 94 855 111 999 103 870 106 295 95 000
*Projection
Marketing arrangements, information and research
In terms of the free trade agreement between countries within the SADC region that has been in force since 2000, there has been no duty on cotton imports since 1 January 2004.
Locally, the seed cotton is either sold to a ginner who gins and sells lint to spinners and seed to processors, or a producer may contract a ginner to gin at a fee, in which case the lint will be sold either by the producer or by the contracted ginner on the producer’s behalf.
After the Cotton Board was dissolved in 1998, a section 21 company named Cotton SA was formed by stakeholders in the cotton industry. A statutory levy, which was introduced from April 2004 in terms of the Marketing of Agricultural Products Act, 1996, is applicable to finance research and the other functions of Cotton SA, namely information, promotion and grading. Research is coordinated by Cotton SA and performed by the ARC.
Dry beans
Areas planted and production
During the 2015/16 season, according to the Crop Estimates Committee, an estimated 34 400 ha were planted to dry beans for commercial markets. This is 53,1% lower than the area planted in 2014/15. The estimated commercial crop of 35 445 tons for 2015/16 is, however, 44,6% lower than the previous crop of 73 390 tons. The average yield for the 2015/16 crop is approximately 1,03 t/ha—a decrease of 0,12 t/ha from the previous season. The decrease in production can mainly be ascribed to unfavourable production conditions that prevailed during the first quarter of 2016 when a lack of rain caused crop failures.
The Free State province produced 48,0% (17 000 tons) of the 2015/16 commercial crop, Mpumalanga 16,9% (6 000 tons) and Limpopo 10,6% (3 750 tons). The remaining 24,5% was produced in the other provinces.
35 000
40 000
45 000
50 000
55 000
60 000
65 000
30 000
40 000
50 000
60 000
70 000
80 000
90 000
2011/12 2012/13 2013/14 2014/15 2015/16
Hecta
res
To
ns
Season
Area planted to and production of dry beans for commercial markets 2011/12– 2015/16
Production Area planted

Trends in the Agricultural Sector 2016 Department of Agriculture, Forestry and Fisheries 41
Production in the provinces and their share of the 2015/16 dry bean crop are as follows:
Province Production (t) Share in crop (%)
Mpumalanga 6 000 16,9
Free State 17 000 48,0
Gauteng 2 500 7,1
North West 2 400 6,8
KwaZulu-Natal 2 640 7,4
Limpopo 3 750 10,6
Western Cape 150 0,4
Eastern Cape 375 1,1
Northern Cape 630 1,8
Total 35 445 100,0
The estimated gross value of dry beans for the 2015/16 season amounts to R510 million, 42,3% lower than the previous season.
The contribution of different types of dry beans to total production in 2015/16 is estimated to be as follows: Light speckle kidney beans 63%, White pea beans 33%, large white kidney 3% and other dry beans, mainly cariocas, 1%.
The most extensive seed production takes place in the Lowveld area of Mpumalanga, followed by the Limpopo and Northern Cape provinces.
In an attempt to improve profitability for producers and to meet the increase in protein demand, new cultivars with higher yields has been developed by the Dry Bean Producers’ Organisation in cooperation with the ARC’s Grain Crops Institute. These cultivars are suited to most soil types, have greater resistance to diseases and can be grown successfully in different areas. The average yield for dry bean production during the five years up to 2015/16 is 1,03 t/ha.
Consumption
An estimated 92 250 tons of dry beans is expected to be consumed locally during the 2016/17 marketing season (April to March). This represents a decrease of 50,2% from 2015/16. The projected per capita consumption for 2016/17 is 1,26 kg, which is 50,7% less than in 2015/16.
Due to the local demand being substantially higher than local production, large quantities of dry beans are imported each year, mainly from China.
According to the Dry Bean Producers’ Organisation, the quantities of dry beans produced, imported and consumed from 2012/13 to 2016/17 were as follows:
20 000
60 000
100 000
140 000
180 000
2012/13 2013/14 2014/15 2015/16 2016/17
To
ns
Marketing season
Production, imports and consumption of dry beans 2012/13–2016/17
Production Imports Consumption

Trends in the Agricultural Sector 2016 Department of Agriculture, Forestry and Fisheries 42
Marketing season 2012/13 2013/14 2014/15 2015/16 2016/17
Tons
Production 47 698 60 600 82 129 73 330 33 745
Imports 105 929 75 147 74 982 67 500 67 500
Consumption 153 627 135 747 157 111 140 830 101 245
Producer prices
The average prices received by producers for dry beans from 2011/12 to 2015/16 are as follows:
Production season 2011/12 2012/13 2013/14 2014/15 2015/16
R/t
Producer price 10 217 12 058 12 277 10 957 12 965
Research and information
The Dry Bean Producers’ Organisation is the national commodity organisation promoting the interests of the dry bean producers in the country. The main objectives of the organisation are to provide production and market information, support product and market research and ensure the supply of disease-free certified seed to producers.
Sugar
Sugar cane is a ratoon crop, which means that after cropping, new shoots emerge from the roots. It yields up to 10 crops from the original rootstock, after which it is uprooted and the field is replanted. This is done on a rotational basis, with approximately 10% of the area under cane being replanted each season. Planting usually coincides with the first spring rains.
In the cooler production areas, sugar cane is harvested 18 to 24 months after resprouting. Late harvesting maximises growth and the sucrose content of the cane. In the coastal areas, where the crop grows faster, it is harvested at an average age of approximately 12 months, usually from April to December.
Industry overview
The sugar cane growing industry in South Africa is administered by the South African Cane Growers’ Association, established in 1927. The industry is regulated in terms of the Sugar Act and the Sugar Industry Agreement, which are binding on all sugar cane growers and producers of sugar products.
The cane growing sector comprises approximately 22 500 registered sugar cane growers farming predominantly in KwaZulu-Natal (KZN) and Mpumalanga, with some farming operations in the Eastern Cape.
Sugar is manufactured by six milling companies with 14 sugar mills operating in the cane growing regions.
The South African sugar industry is one of the most cost-competitive producers of high-quality sugar. The industry combines sugar cane production and production of sugar (raw or refined), syrup and some by-products.
Employment within the industry is estimated at 429 000 people (direct and indirect) and the industry has produced an average of approximately 2,2 million tons of sugar per season during the past five seasons.
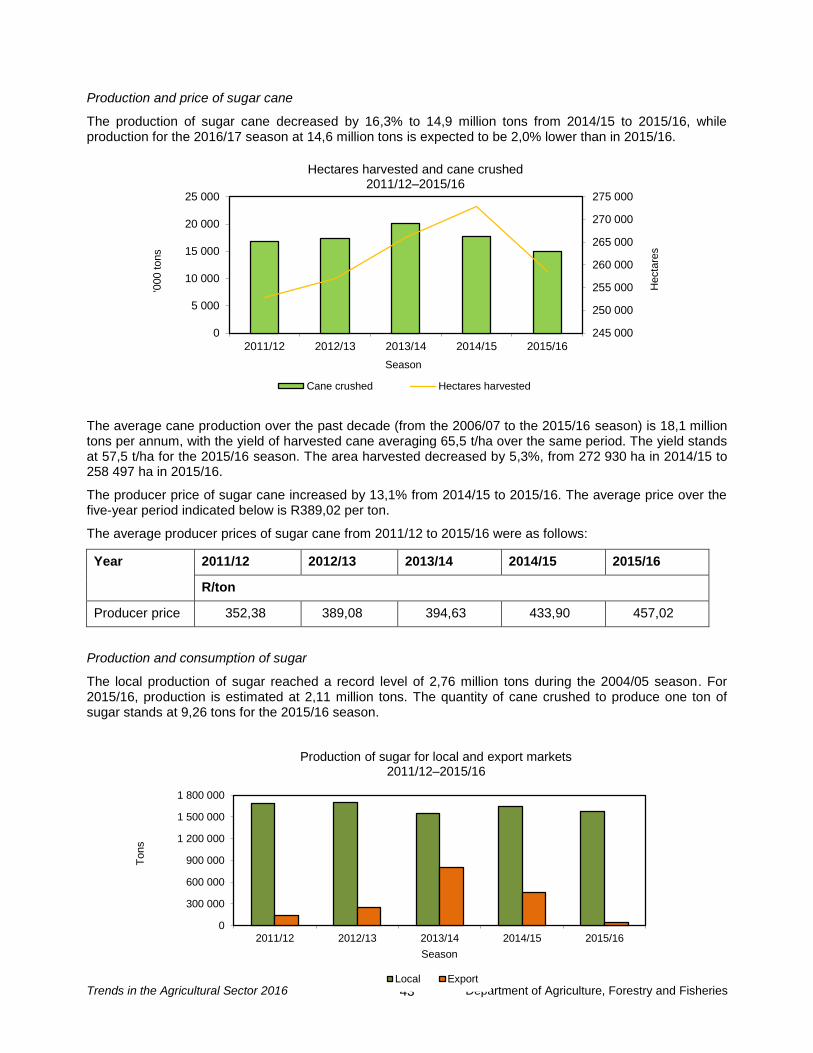
Trends in the Agricultural Sector 2016 Department of Agriculture, Forestry and Fisheries 43
Production and price of sugar cane
The production of sugar cane decreased by 16,3% to 14,9 million tons from 2014/15 to 2015/16, while production for the 2016/17 season at 14,6 million tons is expected to be 2,0% lower than in 2015/16.
The average cane production over the past decade (from the 2006/07 to the 2015/16 season) is 18,1 million tons per annum, with the yield of harvested cane averaging 65,5 t/ha over the same period. The yield stands at 57,5 t/ha for the 2015/16 season. The area harvested decreased by 5,3%, from 272 930 ha in 2014/15 to 258 497 ha in 2015/16.
The producer price of sugar cane increased by 13,1% from 2014/15 to 2015/16. The average price over the five-year period indicated below is R389,02 per ton.
The average producer prices of sugar cane from 2011/12 to 2015/16 were as follows:
Year 2011/12 2012/13 2013/14 2014/15 2015/16
R/ton
Producer price 352,38 389,08 394,63 433,90 457,02
Production and consumption of sugar
The local production of sugar reached a record level of 2,76 million tons during the 2004/05 season. For 2015/16, production is estimated at 2,11 million tons. The quantity of cane crushed to produce one ton of sugar stands at 9,26 tons for the 2015/16 season.
245 000
250 000
255 000
260 000
265 000
270 000
275 000
0
5 000
10 000
15 000
20 000
25 000
2011/12 2012/13 2013/14 2014/15 2015/16
Hecta
res
'000 tons
Season
Hectares harvested and cane crushed 2011/12–2015/16
Cane crushed Hectares harvested
0
300 000
600 000
900 000
1 200 000
1 500 000
1 800 000
2011/12 2012/13 2013/14 2014/15 2015/16
Tons
Season
Production of sugar for local and export markets 2011/12–2015/16
Local Export

Trends in the Agricultural Sector 2016 Department of Agriculture, Forestry and Fisheries 44
Marketing
The sugar Act of 1978 and the Sugar Industry Agreement (SIA 2000), endorse a regulatory provision within which the pricing of refined sugar in South Africa take place. The combination of the regulatory provisions allows the sugar industry to maintain a domestic sugar price that is at or near the import parity price including the tariff that eradicates price discrimination and anti-competitive practises within the industry. With sugar prices pushed up close to import parity price, the country’s sugar industry can maximise profit that will impact positively on the economy.
South Africa continues to be one of the world’s most cost competitive producers of high quality sugar and the key drivers of excellence is its export infrastructure, world-renowned agriculture, industry research platforms and efficient industry organisation.
The raw sugar exports are handled at the Sugar Terminal in Durban. The terminal provides storage and handling facilities for the Sugar Industry’s export production of bulk raw and bagged (raw and refined) sugar. It also houses a unique molasses mixing plant which coats bulk raw sugar at the time of loading to produce variable levels of quality, as specified by the international buyers.
A total of 46 826 tons of sugar were produced for the international market during the 2015/16 season, which is a substantial decrease of 89,8% from the preceding season. The rising input costs, including transport and fuel, the uncertainty regarding land reform and persistent drought in the some cane producing regions, attributed to these decreases. The revenue from sugar export sales during 2015/16 is estimated at R380 million.
The total supply of 1,65 million tons of sugar to the Southern African Customs Union (SACU) during 2015/16 represents a decrease of 4,6% from the 1,64 million tons supplied in 2014/15.
The local production and sales of sugar to the SACU from 2011/12 to 2015/16 were as follows:
Year 2011/12 2012/13 2013/14 2014/15 2015/16
‘000 tons
Production 1 822 1 951 2 344 2 108 1 620
Sales to SACU 1 685 1 702 1 543 1 649 1 574
Unfavorable climate conditions
The country has experienced the worst drought in 30 years and most of agricultural commodities will produce less due to the prevailing drought. Weather experts have attributed the dry and persistent heat to the El Niño phenomenon. The South African Weather Services reported the country received below average rain of 400 mm during 2015 as compared to 600 mm in 2014. Many irrigation sugar cane farmers in Mpumalanga did not have sufficient water to meet the high rate of evaporation.
Proposed Sugar Tax
The government has proposed a Sugar-Sweetened Beverages (SSBs) Tax with the aim to combat obesity. The South African sugar industry has a view that insufficient consideration has been given to the full impact of the imposition of sugar tax. It has been reported that the SSBs sector purchase 620 000 tons of sugar annually, making it the leading buyer of locally-produced sugar. Furthermore, the Beverage Association of South Africa (BevSA), as the main role player in the market, has warned that the proposed sugar tax could trigger at least 72 000 job losses and undermines the industry’s ability to compete globally.
Research, training and other information
In order to improve the quality of the cane produced and the profitability of cane production, the South African Sugarcane Research Institute is tasked with developing new sugar cane varieties and the improvement of crop management and farming systems, which are then made available to cane farmers. The information includes improving soil quality, minimising the occurrence of pests and diseases, and research on the optimal choice in the use of fertilisers, water and ripening and weed control agents.
Currently, modern biotechnological approaches are deployed to develop systems for rapid bulking and distribution of high-quality cane seed and investigate the biological basis of sucrose accumulation in sugar

Trends in the Agricultural Sector 2016 Department of Agriculture, Forestry and Fisheries 45
cane, with a view to enhance the process. The quality of cane deliveries to the mills is determined by the Cane Testing Services, while Umthombo Agricultural Finance provides assistance for small-scale cane farmers with regard to credit and savings facilities.
HORTICULTURE
Deciduous fruit
Production areas
The main deciduous fruit producing areas of South Africa are situated in the Western and Eastern Cape provinces, mostly in areas where warm, dry summers and cold winters prevail. According to the HORTGRO Tree Census of 2015, the area under deciduous fruit production during the 2015 season is estimated at 80 740 ha.
Production
Although some producers grow fruit both for processing (canning, juice and drying) as well as fresh consumption, it is estimated that in South Africa there are about 2 300 producers of fruit for fresh consumption,1 246 producers of dry and table grapes, 925 producers of stone fruit and 706 producers of pome fruit.
The production per fruit type, which excludes dried fruit, over the past five seasons compares as follows:
Fruit type 2011/12 2012/13 2013/14 2014/15 2015/16
Tons
Apples 789 452 880 866 796 364 912 131 949 354
Pears 336 770 367 498 401 267 394 112 418 443
Table grapes 275 274 258 473 245 352 286 205 293 797
Peaches and nectarines 182 300 173 048 146 864 196 038 188 476
Apricots 58 080 52 529 41 348 49 198 33 915
Plums 61 176 75 733 69 833 75 038 75 664
Total 1 703 052 1 808 147 1 701 028 1 912 722 1 959 649
The production of deciduous fruit increased by 2,5%, from 1,913 million tons in 2014/15 to 1,960 million tons in 2015/16. Pears showed an increase of 6,2%, followed by apples with 4,1%, table grapes by 2,7% and plums with an increase of 0,8%. The production of apricots showed a huge decrease of 31,1%, followed by peaches and nectarines with a decrease of 3,9%.
Marketing
During 2015/16, deciduous fruit contributed approximately 27,2% to the gross value of horticultural products.
Approximately 348 662 tons of deciduous fruit were sold locally on the major fresh produce markets, other markets and directly to retailers during the 2015/16 season, representing a decrease of 1,6% from the 354 481 tons sold during the 2014/15 season.

Trends in the Agricultural Sector 2016 Department of Agriculture, Forestry and Fisheries 46
The average prices realised for deciduous fruit on the major fresh produce markets during the period 2011/12 to 2015/16 were as follows:
Fruit type 2011/12 2012/13 2013/14 2014/15 2015/16
R/ton
Apples 5 258 5 700 5 817 5 911 6 327
Pears 4 841 5 351 5 567 5 952 6 531
Table grapes 7 937 9 135 10 602 12 027 12 121
Peaches and nectarines 8 166 9 444 11 054 11 618 13 474
Apricots 6 364 6 552 8 078 9 340 12 559
Plums 5 194 4 984 5 881 6 594 7 902
The price of apricots showed the biggest increase at 34,5%, followed by plums with 19,8%, peaches and nectarines with 16,0%, pears with 9,7% and apples with 7,0%, while the price of table grapes showed an increase of only 0,8%.
The exporting of deciduous fruit is a major earner of foreign exchange for South Africa. During the 2015/16 season (October to September), about 50,1% of deciduous fruit produced was exported and approximately 80,0% of the gross value from deciduous fruit came from export earnings. Total exports amounted to 982 119 tons. This represents an increase of 7,3% from the 914 966 tons exported during 2014/15.
The following graph indicates deciduous fruit export destinations during 2015.
Intake of deciduous fruit for processing
During 2015/16, about 628 868 tons of deciduous fruit produced were utilised for processing—a decrease of 2,2% from the 643 275 tons processed during 2014/15.
European countries
49,6%
Eastern Europe and Central Asia
4,0%
East Asia and Pacific 12,8%
Other 5,6%
West Africa and SADC
16,5%
South Asia 2,6%
Middle East 8,9%
Deciduous fruit export destinations 2015

Trends in the Agricultural Sector 2016 Department of Agriculture, Forestry and Fisheries 47
The following graph indicates the contribution of deciduous fruit types to total deciduous fruit taken in for processing during 2015/16.
Over the past five seasons, most of the deciduous fruit was processed into juice, except for apricots and peaches, which were used mostly for canning.
During 2015/16, approximately 98,7% of apples taken in for processing was used for juice and 1,3% was used for canning, while 65,1% of pears was used for juice and 34,9% was canned. Producers received an average of R1 729 and R1 289 per ton for apples used for canning and for juice, respectively. In the case of pears used for canning and for juice, producers received an average of R2 521 and R1 382 per ton, respectively.
Domestic consumption
Local per capita consumption and total consumption of deciduous fruit over the past five years were as follows:
Season 2011/12 2012/13 2013/14 2014/15 2015/16
Per capita consumption (kg/year) 11,59 11,19 11,07 12,14 10.99
Total consumption (‘000 tons) 606 593 598 667 615
Prospects
Over the last five years, the industry has experienced significant growth in the area planted to almost all fruit types, with the exception of apricots and cling peaches. The rate of decrease in the number of cling peach plantings has also stabilised. The increase in newly established orchards and the replacement of old orchards has resulted in growth in the total production.
Because of the large number of young orchards, this trend is expected to increase over the next five years by 5% to 8%, depending on the fruit type.
The 2015/16 season was 5-10 days earlier than the previous two production seasons.
Apples 47,9%
Apricots 4,5% Pears
25,0%
Peaches 21,9%
Grapes 0,3%
Plums 0,4%
Deciduous fruit taken in for processing 2015/16
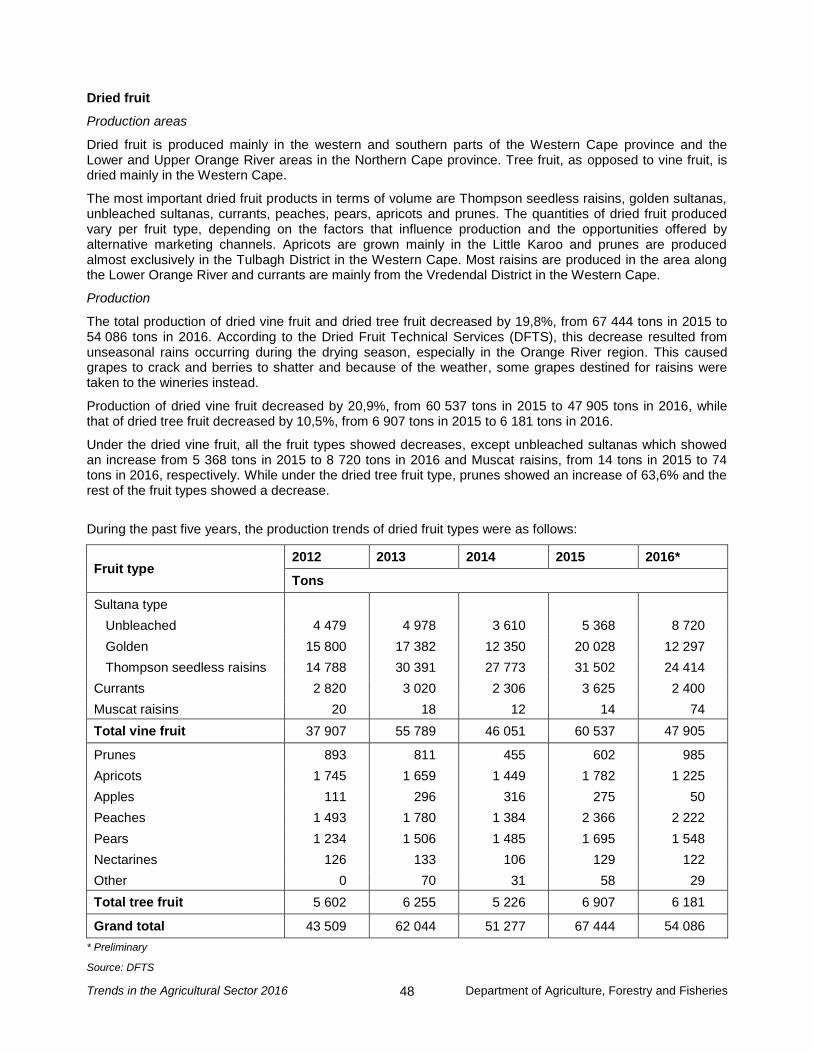
Trends in the Agricultural Sector 2016 Department of Agriculture, Forestry and Fisheries 48
Dried fruit
Production areas
Dried fruit is produced mainly in the western and southern parts of the Western Cape province and the Lower and Upper Orange River areas in the Northern Cape province. Tree fruit, as opposed to vine fruit, is dried mainly in the Western Cape.
The most important dried fruit products in terms of volume are Thompson seedless raisins, golden sultanas, unbleached sultanas, currants, peaches, pears, apricots and prunes. The quantities of dried fruit produced vary per fruit type, depending on the factors that influence production and the opportunities offered by alternative marketing channels. Apricots are grown mainly in the Little Karoo and prunes are produced almost exclusively in the Tulbagh District in the Western Cape. Most raisins are produced in the area along the Lower Orange River and currants are mainly from the Vredendal District in the Western Cape.
Production
The total production of dried vine fruit and dried tree fruit decreased by 19,8%, from 67 444 tons in 2015 to 54 086 tons in 2016. According to the Dried Fruit Technical Services (DFTS), this decrease resulted from unseasonal rains occurring during the drying season, especially in the Orange River region. This caused grapes to crack and berries to shatter and because of the weather, some grapes destined for raisins were taken to the wineries instead.
Production of dried vine fruit decreased by 20,9%, from 60 537 tons in 2015 to 47 905 tons in 2016, while that of dried tree fruit decreased by 10,5%, from 6 907 tons in 2015 to 6 181 tons in 2016.
Under the dried vine fruit, all the fruit types showed decreases, except unbleached sultanas which showed an increase from 5 368 tons in 2015 to 8 720 tons in 2016 and Muscat raisins, from 14 tons in 2015 to 74 tons in 2016, respectively. While under the dried tree fruit type, prunes showed an increase of 63,6% and the rest of the fruit types showed a decrease.
During the past five years, the production trends of dried fruit types were as follows:
Fruit type 2012 2013 2014 2015 2016*
Tons
Sultana type
Unbleached 4 479 4 978 3 610 5 368 8 720
Golden 15 800 17 382 12 350 20 028 12 297
Thompson seedless raisins 14 788 30 391 27 773 31 502 24 414
Currants 2 820 3 020 2 306 3 625 2 400
Muscat raisins 20 18 12 14 74
Total vine fruit 37 907 55 789 46 051 60 537 47 905
Prunes 893 811 455 602 985
Apricots 1 745 1 659 1 449 1 782 1 225
Apples 111 296 316 275 50
Peaches 1 493 1 780 1 384 2 366 2 222
Pears 1 234 1 506 1 485 1 695 1 548
Nectarines 126 133 106 129 122
Other 0 70 31 58 29
Total tree fruit 5 602 6 255 5 226 6 907 6 181
Grand total 43 509 62 044 51 277 67 444 54 086
* Preliminary
Source: DFTS

Trends in the Agricultural Sector 2016 Department of Agriculture, Forestry and Fisheries 49
Marketing
The Perishable Products Export Control Board (PPECB) is responsible for inspection of the exported dried fruit to ensure adherence to quality standards. Exporters are required to obtain a PPECB export certificate. More than 50% of South African dried fruit production is exported.
The following two charts depict dried fruit export destinations during 2015 and exports from 2011 to 2015, respectively.
East Asia and Pacific 19%
European countries 44%
Eastern Europe and Central Asia
7%
SADC 7%
NAFTA countries 10%
Other 13%
Dried fruit export destinations 2015
40
50
60
70
80
90
100
0
15 000
30 000
45 000
60 000
75 000
2011 2012 2013 2014 2015%
To
ns
Year
Dried fruit exports 2011–2015
Exports Exports as % of production

Trends in the Agricultural Sector 2016 Department of Agriculture, Forestry and Fisheries 50
Cabernet Sauvignon 6,0%
Chardonnay 5,9%
Pinotage 5,9%
Sauvignon Blanc 7,6%
Shiraz 7,5%
Merlot 4,2%
Colombar 19,4%
Chenin Blanc 23,1%
Other 20,4%
Grape varieties used for total wine- and juice-making 2015
Viticulture
South Africa is the eighth-largest wine producer in the world, with a contribution of 4,1% to the world’s wine production in 2015. The area under wine grape vineyards is estimated at 98 597 ha, which is 0,9% less than the 99 470 ha of the previous year.
The wine industry is labour intensive and provides employment to approximately 270 000 people directly and indirectly. The number of primary wine grape producers in South Africa is estimated at 3 232.
Wine is produced mainly in the Western Cape Province and along parts of the Orange River in the Northern Cape Province.
Production
Wine production, including rebate and distilling wine, juice and concentrate for non-alcoholic beverages from 2011 to 2015, is as follows:
Year 2011 2012 2013 2014 2015
Gross million litres
Wine production 1 013 1 097 1 157 1 181 1 154
During 2015, the production of wine fell by 2,5%. Approximately 67,5% of the wine grapes utilised for wine-making purposes were white and 32,5% were red.
The use of different varieties of grapes during 2015 is depicted in the following graph.
Income of producers
The production of wine grapes and income of producers from 2011 to 2015 are as follows:
Year 2011 2012 2013 2014 2015
Wine-grape production
(‘000 tons) 1 306 1 414 1 498 1 520 1 477
Income of producers
(R million) 3 594 4 131 4 821 4 727 4 793
The producers’ income decreased by 1,4% during 2015, mainly as a result of a decrease in wine exports, which fell by 0,6%.
Total quantities of wine exported during the past five years are as follows:

Trends in the Agricultural Sector 2016 Department of Agriculture, Forestry and Fisheries 51
Africa and Middle East 5,3%
EU and the rest of Europe 77,4%
USA and Canada 7,4%
Far East, Australia and New Zealand
4,7%
Other countries, 5,2%
Wine ( packaged and bulk) export destinations 2015
Year 2011 2012 2013 2014 2015
‘000 litres
Natural wine 350 415 408 911 517 405 414 835 412 444
Fortified wine 349 275 283 349 311
Sparkling wine 6 650 8 032 7 897 7 473 7 272
Total 357 414 417 218 525 585 422 657 420 027
During 2015, 43,4% of the total wine produced was exported, compared with 44,1% during 2014.
The following graph depicts wine export destinations during 2015.
Consumption
The per capita consumption of wine on the domestic market from 2011 to 2015 is as follows:
Year 2011 2012 2013 2014 2015
ℓ per capita
Natural wine 6,16 6,18 6,18 6,55 6,97
Fortified wine 0,65 0,64 0,62 0,61 0,61
Sparkling wine 0,17 0,16 0,15 0,15 0,15
Total 6,98 6,98 6,95 7,31 7,73
Information and administration
The SA Wine Industry Information and Systems NPC (SAWIS), a non-profit company under control and direction of the South African Wine industry, is inter alia responsible for the collection, processing and dissemination of industry information and for the administration of the industry’s Wine of Origin system.

Trends in the Agricultural Sector 2016 Department of Agriculture, Forestry and Fisheries 52
Subtropical fruit
Measured in terms of value of production, the subtropical fruit industry earned R3 500 million in 2015/16—a decrease of 6,5% on the 2014/15 figure of R3 742 million.
Production and production areas
The cultivation of some types of subtropical fruit is only possible in certain specific areas of the country because of particular climatic requirements. In general, subtropical fruit types need warmer conditions and are sensitive to large temperature fluctuations and frost. The best areas for the production of these types of fruit in South Africa are in the Limpopo, Mpumalanga and KwaZulu-Natal provinces. Fruit types such as granadillas and guavas are also grown in the Western Cape, while pineapples are cultivated in the Eastern Cape and KwaZulu-Natal.
The total production area of avocados in 2015/16 is estimated at approximately 16 000 ha, mangoes at 7 000 ha, and litchis at 1 700 ha.
The production of subtropical fruit from 2011/12 to 2015/16 is as follows:
Fruit type 2011/12 2012/13 2013/14 2014/15 2015/16
’000 tons
Avocados 88,1 87,0 97,7 98,2 82,8
Bananas 371,3 392,3 463,4 424,4 401,4
Pineapples 108,7 96,8 96,7 95,8 98,9
Mangoes 65,1 52,6 57,6 75,7 41,0
Papayas 12,7 14,9 13,7 15,9 11,1
Granadillas 0,5 0,8 0,7 0,7 0,7
Litchis 7,8 5,6 8,3 8,3 7,5
Guavas 23,7 33,6 31,6 31,9 30,2
The total production of subtropical fruit decreased by 10,3%, from 750 736 tons in 2014/15 to 673 537 tons in 2015/16. Production of pineapples rose by 3,2% while granadillas remains constant. However the production of mangoes dropped by 45,8%, papayas by 30,2%, avocados by 15,7%, litchis by 9,6%, bananas by 5,4% and guavas by 5,3%.
Bananas, pineapples and avocados contributed 59,6%, 14,7% and 12,3%, respectively to the total production of subtropical fruit during the 2015/16 season.
1 500
2 000
2 500
3 000
3 500
4 000
500
560
620
680
740
800
2011/12 2012/13 2013/14 2014/15 2015/16
R m
illi
on
'000 t
on
s
Year
Production of and producers' income from subtropical fruit 2011/12–2015/16
Series2 Series3

Trends in the Agricultural Sector 2016 Department of Agriculture, Forestry and Fisheries 53
Domestic sales
During 2015/16, the largest contributors to the sales of subtropical fruit on the major fresh produce markets were bananas (77,3%), avocados (8,2%) and pineapples (6,8%), followed by mangoes (4,3%), papayas (2,3%) and guavas, litchis and granadillas combined (1,2%).
The quantities of litchis and granadillas sold on the major fresh produce markets increased during 2015/16, while the quantities of avocados, bananas, pineapples, mangoes, papayas and guavas decreased.
Total quantities of subtropical fruit sold on the major fresh produce markets (year ending 30 June) are as follows:
Fruit type 2011/12 2012/13 2013/14 2014/15 2015/16
Tons
Avocados 20 395 26 699 27 157 30 611 25 537
Bananas 222 248 235 189 277 633 254 355 240 444
Pineapples 21 978 23 236 23 793 22 945 21 241
Mangoes 14 891 17 982 15 335 16 253 13 306
Papayas 7 756 9 619 8 720 9 983 7 076
Granadillas 439 631 526 466 481
Litchis 1 987 1 317 1 100 989 1 369
Guavas 2 343 2 491 1 652 2 346 1 713
Total 292 037 317 164 355 916 337 948 311 167
Intake for processing
During 2015/16 (July to June), pineapples accounted for 56,4% of the total intake of subtropical fruit types for processing. The other two main contributors to the processing industry were guavas (21,2%) and mangoes (17,1%).
The quantities of avocados, bananas, pineapples, granadillas and litchis taken in for processing increased during 2015/16, while the intake of mangoes, papayas and guavas decreased.
Fruit type 2011/12 2012/13 2013/14 2014/15 2015/16
Tons
Avocados 5 767 6 161 6 359 4 101 4 127
Bananas 895 359 674 425 648
Pineapples 81 753 68 522 67 743 68 076 73 410
Mangoes 46 533 30 272 38 105 53 627 22 248
Papayas 2 068 1 528 1 518 2 102 1 043
Granadillas 0 21 111 98 102
Litchis 1 555 575 268 689 1 026
Guavas 20 896 30 658 29 581 29 035 27 608
Total 159 467 138 096 144 359 158 153 130 212

Trends in the Agricultural Sector 2016 Department of Agriculture, Forestry and Fisheries 54
Exports
From 2014/15 to 2015/16, total exports of subtropical fruit decreased by 16,0%, from 70 828 tons to 59 494 tons and the average export price increased by 3,9%, from R16 484/t to R17 124/t.
The main subtropical fruit type being exported is avocados. During 2015/16, exports of avocados contributed 82,4% to the total value of exports of subtropical fruit. Other types that were exported were mangoes and pineapples
Marketing and research Research is largely funded through the relevant growers’ associations. Organisations that carry out industry-funded research include the ARC-Institute for Tropical and Subtropical Crops (ITSC), universities and private research organisations.
Prospects
The litchi and mango crop for the 2016/17 season will be higher than they were in 2015/16, avocado crop will approximately be 10% smaller than the 2016 crop
3 000
6 000
9 000
12 000
15 000
18 000
25 000
35 000
45 000
55 000
65 000
75 000
2011/12 2012/13 2013/14 2014/15 2015/16
R/t
on
To
ns
Year
Quantity and average price of sutropical fruit exported 2011/12–2015/16
Series2 Series3
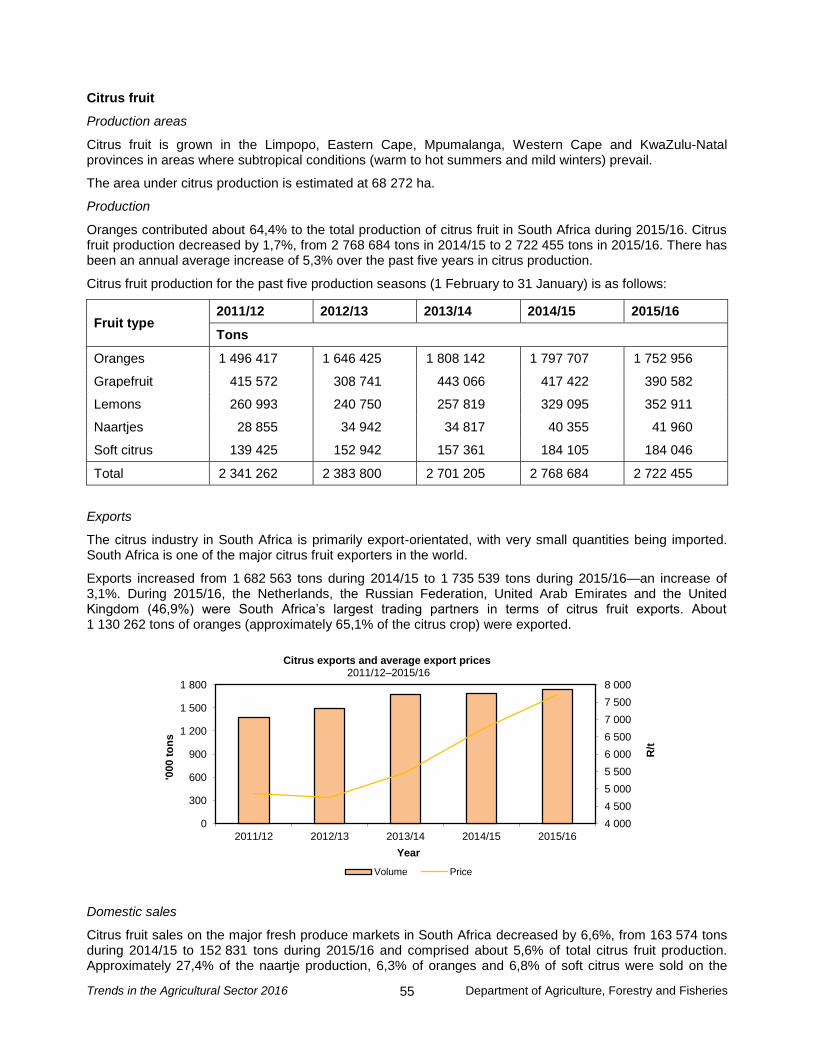
Trends in the Agricultural Sector 2016 Department of Agriculture, Forestry and Fisheries 55
Citrus fruit
Production areas
Citrus fruit is grown in the Limpopo, Eastern Cape, Mpumalanga, Western Cape and KwaZulu-Natal provinces in areas where subtropical conditions (warm to hot summers and mild winters) prevail.
The area under citrus production is estimated at 68 272 ha.
Production
Oranges contributed about 64,4% to the total production of citrus fruit in South Africa during 2015/16. Citrus fruit production decreased by 1,7%, from 2 768 684 tons in 2014/15 to 2 722 455 tons in 2015/16. There has been an annual average increase of 5,3% over the past five years in citrus production.
Citrus fruit production for the past five production seasons (1 February to 31 January) is as follows:
Fruit type 2011/12 2012/13 2013/14 2014/15 2015/16
Tons
Oranges 1 496 417 1 646 425 1 808 142 1 797 707 1 752 956
Grapefruit 415 572 308 741 443 066 417 422 390 582
Lemons 260 993 240 750 257 819 329 095 352 911
Naartjes 28 855 34 942 34 817 40 355 41 960
Soft citrus 139 425 152 942 157 361 184 105 184 046
Total 2 341 262 2 383 800 2 701 205 2 768 684 2 722 455
Exports
The citrus industry in South Africa is primarily export-orientated, with very small quantities being imported. South Africa is one of the major citrus fruit exporters in the world.
Exports increased from 1 682 563 tons during 2014/15 to 1 735 539 tons during 2015/16—an increase of 3,1%. During 2015/16, the Netherlands, the Russian Federation, United Arab Emirates and the United Kingdom (46,9%) were South Africa’s largest trading partners in terms of citrus fruit exports. About 1 130 262 tons of oranges (approximately 65,1% of the citrus crop) were exported.
Domestic sales
Citrus fruit sales on the major fresh produce markets in South Africa decreased by 6,6%, from 163 574 tons during 2014/15 to 152 831 tons during 2015/16 and comprised about 5,6% of total citrus fruit production. Approximately 27,4% of the naartje production, 6,3% of oranges and 6,8% of soft citrus were sold on the
4 000
4 500
5 000
5 500
6 000
6 500
7 000
7 500
8 000
0
300
600
900
1 200
1 500
1 800
2011/12 2012/13 2013/14 2014/15 2015/16
R/t
'000 t
on
s
Year
Citrus exports and average export prices 2011/12–2015/16
Volume Price

Trends in the Agricultural Sector 2016 Department of Agriculture, Forestry and Fisheries 56
fresh produce markets.
The average prices realised on the major fresh produce markets during the period 2011/12 to 2015/16 were as follows:
Fruit type 2011/12 2012/13 2013/14 2014/15 2015/16
R/ton
Oranges 1 763 1 912 2 075 2 231 2 541
Grapefruit 2 082 2 306 2 336 3 113 3 887
Lemons 3 244 4 754 5 550 6 771 7 247
Naartjes 4 681 4 966 5 785 6 131 6 341
Soft citrus 4 099 3 751 4 368 4 717 4 940
Processing
Approximately 25,1% of the total citrus fruit production was taken in for processing during 2015/16. Citrus fruit taken in for processing decreased by 10,3%, from 760 337 tons in 2014/15 to 682 000 tons in 2015/16.
Consumption
Per capita consumption of citrus fruit from 2011 to 2015 was as follows:
Year 2011 2012 2013 2014 2015
kg/year
Per capita consumption 16,51 15,49 18,48 19,50 17,29
Research
Citrus Research International (CRI) is mandated by the Citrus Growers’ Association of Southern Africa (CGA) to maximise the long-term global competitiveness of the Southern African citrus growers through the development, support, coordination and provision of research and technical services. The CRI is a division of the CGA and research funding is primarily derived from levies on citrus exports.

Trends in the Agricultural Sector 2016 Department of Agriculture, Forestry and Fisheries 57
Vegetables (excluding potatoes)
General
Vegetables are produced in most parts of the country. However, in certain areas farmers tend to concentrate on specific crops; for example, green beans are grown mainly in Kaapmuiden, Marble Hall and Tzaneen, green peas mainly in George and Vaalharts, onions mainly in Caledon, Pretoria and Brits and asparagus mainly in Krugersdorp and Ficksburg.
Production
From 2014/15 to 2015/16 (July–June), the total production of vegetables (excluding potatoes) increased by 1,0%, from 2 832 480 tons to 2 859 745 tons. Concerning the major vegetable types in terms of volumes produced, the production of carrots rose by 12 080 tons or 6,0%, tomatoes by 13 060 tons or 2,4%, onions by 12 264 tons or 1,8% and that of green mealies rose by 4 592 tons or 1,3%. The production of pumpkins decreased by 2 000 tons or 0,9% and that of cabbage decreased by 7 298 tons or 5,0%.
The production of vegetables (excluding potatoes) in South Africa for the period 2011/12 to 2015/16 com-pares as follows:
Year 2011/12 2012/13 2013/14 2014/15 2015/16
’000 tons
Tomatoes 545 527 538 547 561
Onions 625 596 619 675 687
Green mealies and
sweet corn 347 361 362 373 378
Cabbages 141 136 146 146 139
Pumpkins 244 247 245 256 254
Carrots 178 183 184 202 214
Other 591 592 593 633 627
Total 2 671 2 642 2 687 2 832 2 860
Relative importance of major vegetable types
The relative importance of the major vegetable types, according to gross value of production during the 12 months up to 30 June 2016, is depicted in the following graph:
Squashes 5%
Green mealies
43%
Carrots 5%
Cabbage 3%
Pumpkins 4%
Tomatoes 21%
Onions 19%
Relative importance of major vegetable types, based on gross value of production
2015/16
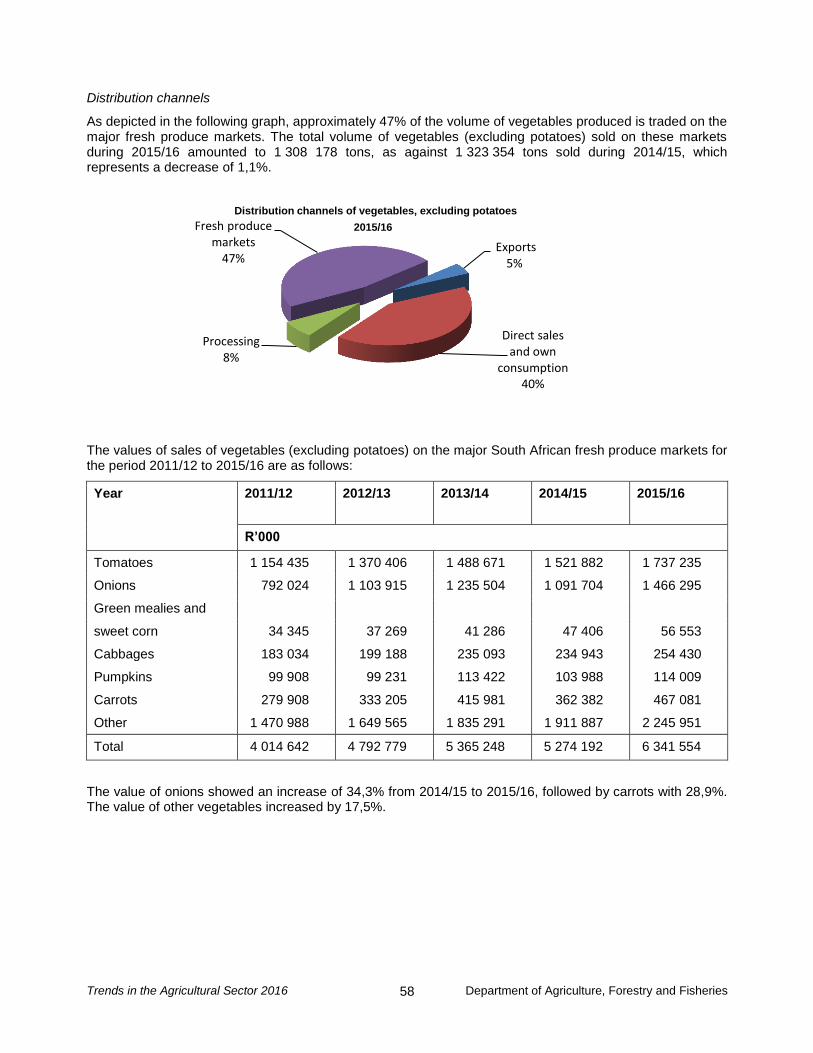
Trends in the Agricultural Sector 2016 Department of Agriculture, Forestry and Fisheries 58
Distribution channels
As depicted in the following graph, approximately 47% of the volume of vegetables produced is traded on the major fresh produce markets. The total volume of vegetables (excluding potatoes) sold on these markets during 2015/16 amounted to 1 308 178 tons, as against 1 323 354 tons sold during 2014/15, which represents a decrease of 1,1%.
The values of sales of vegetables (excluding potatoes) on the major South African fresh produce markets for the period 2011/12 to 2015/16 are as follows:
Year 2011/12 2012/13 2013/14
2014/15 2015/16
R’000
Tomatoes 1 154 435 1 370 406 1 488 671 1 521 882 1 737 235
Onions 792 024 1 103 915 1 235 504 1 091 704 1 466 295
Green mealies and
sweet corn 34 345 37 269 41 286 47 406 56 553
Cabbages 183 034 199 188 235 093 234 943 254 430
Pumpkins 99 908 99 231 113 422 103 988 114 009
Carrots 279 908 333 205 415 981 362 382 467 081
Other 1 470 988 1 649 565 1 835 291 1 911 887 2 245 951
Total 4 014 642 4 792 779 5 365 248 5 274 192 6 341 554
The value of onions showed an increase of 34,3% from 2014/15 to 2015/16, followed by carrots with 28,9%. The value of other vegetables increased by 17,5%.
Exports 5%
Direct sales and own
consumption 40%
Processing 8%
Fresh produce markets
47%
Distribution channels of vegetables, excluding potatoes
2015/16

Trends in the Agricultural Sector 2016 Department of Agriculture, Forestry and Fisheries 59
Prices
The average prices of vegetables realised on the fresh produce markets for the period 2011/12 to 2015/16 were as follows:
Year 2011/12 2012/13 2013/14 2014/15 2015/16
R/ton
Tomatoes 4 149,03 5 053,83 5 263,31 5 425,62 6 467,98
Onions 2 190,74 3 304,34 3 568,16 2 872,62 3 799,97
Green mealies and
sweet corn 10 920,92 10 115,97 9 951,96 12 221,46 16 148,94
Cabbages 1 724,75 1 950,37 2 176,56 2 173,01 2 484,68
Pumpkins 1 789,03 1 805,69 2 262,87 1 854,47 2 236,84
Carrots 2 624,12 3 012,99 3 746,35 2 958,48 3 708,10
Other 3 186,30 3 900,66 4 281,01 3 985,91 4 847,62
Of the major vegetable types, the price of onions and green mealies showed an increase of 32,3% and 32,1%, respectively, from 2014/15 to 2015/16. The price of carrots, pumpkins, tomatoes, and cabbage also showed an increase of 25,3%, 20,6%, 19,2% and 14,3%, respectively. There was no decrease in prices for major vegetables.
Consumption
The importance of vegetables in a healthy diet is being strongly promoted by all the stakeholders in the fresh produce marketing chain. The per capita consumption of fresh vegetables was 43,26 kg during 2015/16, approximately 8,4% lower than the 47,23 kg of 2014/15.
3 000
3 500
4 000
4 500
5 000
5 500
6 000
6 500
0
30 000
60 000
90 000
120 000
150 000
180 000
Jul. Aug. Sep. Oct. Nov. Dec. Jan. Feb. Mar. Apr. May Jun.
R/t
on
To
ns
Month
Monthly volumes sold and prices realised for all vegetables, excluding potatoes, traded on the major fresh produce markets
2015/16
Volume Price

Trends in the Agricultural Sector 2016 Department of Agriculture, Forestry and Fisheries 60
Tomatoes
Production and value
Production of tomatoes increased by 2,4%, from 547 467 tons in 2014/15 (July to June) to 560 418 tons during 2015/16.
The gross value of production increased by 15,8%, from R2 101 million in 2014/15 to R2 433 million in 2015/16.
Sales
Sales on fresh produce markets constituted approximately 47,9% and direct sales approximately 25,9% of the total volume of tomato sales.
Owing to the geographic distribution and production of tomatoes, a sufficient volume of good quality tomatoes is normally being produced almost throughout the year to meet the daily demand.
The quantity of tomatoes sold on the 19 major fresh produce markets decreased by 4,3%, from 280 542 tons in 2014/15 to 268 509 tons in 2015/16.
Tshwane 18%
Johannesburg 49%
Cape Town 11%
Durban 7%
Other markets 15%
Tomato sales on the major fresh produce markets 2015/16
1 000
1 400
1 800
2 200
2 600
100
200
300
400
500
600
2011/12 2012/13 2013/14 2014/15 2015/16
R m
illi
on
'00
0 t
on
s
Year
Production and value of tomatoes 2011/12–2015/16
Production Gross value

Trends in the Agricultural Sector 2016 Department of Agriculture, Forestry and Fisheries 61
Prices
The average price of tomatoes sold on the major fresh produce markets increased by 19,3%, from R5 424,79 per ton during 2014/15 to R6 469,89 per ton during 2015/16. The increase was mainly the result of a decrease in volumes being offered. Tomatoes are subjected to large seasonal price fluctuations, therefore, there is a high price risk involved.
Exports*
The quantity of tomatoes exported increased slightly by 0,9%, from 13 398 tons in 2014/15 to 13 513 tons in 2015/16. Approximately 95,0% of total tomato exports were to Mozambique during 2015/16 and 3,3% to Angola and Zambia.
*Source: Customs and Excise
2 500
3 500
4 500
5 500
6 500
7 500
8 500
0
5 000
10 000
15 000
20 000
25 000
30 000
Jul. Aug. Sep. Oct. Nov. Dec. Jan. Feb. Mar. Apr. May June
R/t
on
To
ns
Month
Monthly sales and prices of tomatoes on major fresh produce markets 2015/16
Quantity Price
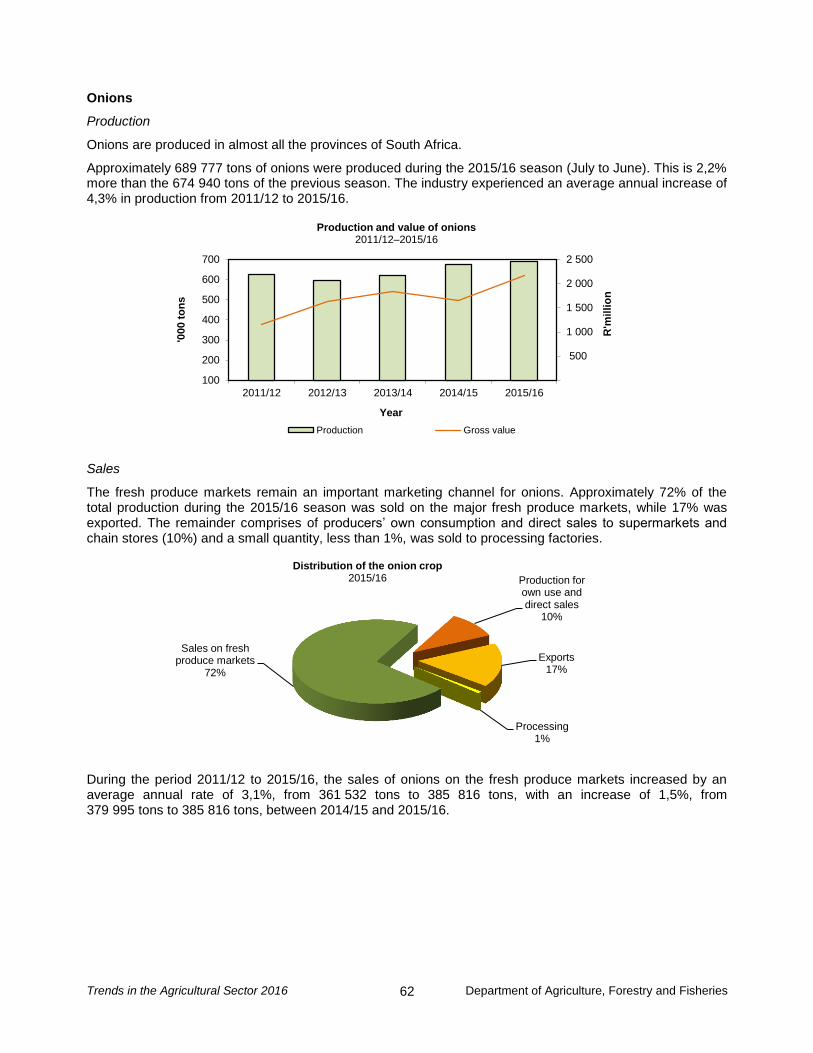
Trends in the Agricultural Sector 2016 Department of Agriculture, Forestry and Fisheries 62
Onions
Production
Onions are produced in almost all the provinces of South Africa.
Approximately 689 777 tons of onions were produced during the 2015/16 season (July to June). This is 2,2% more than the 674 940 tons of the previous season. The industry experienced an average annual increase of 4,3% in production from 2011/12 to 2015/16.
Sales
The fresh produce markets remain an important marketing channel for onions. Approximately 72% of the total production during the 2015/16 season was sold on the major fresh produce markets, while 17% was exported. The remainder comprises of producers’ own consumption and direct sales to supermarkets and chain stores (10%) and a small quantity, less than 1%, was sold to processing factories.
During the period 2011/12 to 2015/16, the sales of onions on the fresh produce markets increased by an average annual rate of 3,1%, from 361 532 tons to 385 816 tons, with an increase of 1,5%, from 379 995 tons to 385 816 tons, between 2014/15 and 2015/16.
Sales on fresh produce markets
72%
Production for own use and direct sales
10%
Exports 17%
Processing 1%
Distribution of the onion crop 2015/16
500
1 000
1 500
2 000
2 500
100
200
300
400
500
600
700
2011/12 2012/13 2013/14 2014/15 2015/16
R'm
illi
on
'000 t
on
s
Year
Production and value of onions 2011/12–2015/16
Production Gross value

Trends in the Agricultural Sector 2016 Department of Agriculture, Forestry and Fisheries 63
Prices
The average price of onions sold on the fresh produce markets decreased by 32,3%, from R2 873 per ton in 2014/15 to R3 800 per ton in 2015/16. This was mainly the result of an increase in the volumes of onions supplied on the markets.
Processing
Approximately 1% of the total production of onions was taken in for processing during the 2015/16 season. There has been an increase in the total processing of onions since the 2011/12 season, when 3 122 tons were taken in for processing, to 4 655 tons in the 2015/16 season. During 2015/16, about 78,8% was canned and the remaining 21,2% was frozen.
Exports*
During the 2015/16 season, the volume of onions exported represented approximately 13,2% of the total onion crop. The volume of exports increased by 6,7%, from 85 273 tons in 2014/15 to 90 965 tons during 2015/16.
* Source: Customs and Excise
1 000
1 600
2 200
2 800
3 400
4 000
100 000
160 000
220 000
280 000
340 000
400 000
2011/12 2012/13 2013/14 2014/15 2015/16
R/t
on
To
ns
Year
Sales of onions on the fresh produce markets 2011/12–2015/16
Volume Average price

Trends in the Agricultural Sector 2016 Department of Agriculture, Forestry and Fisheries 64
Potatoes
There are 16 distinct potato-production regions in South Africa, which are spread throughout the country. The main regions are situated in the Free State, Western Cape, Limpopo and Mpumalanga provinces. Potatoes are planted at different times because of climate differences in the production areas, resulting in fresh potatoes being available throughout the year. In the early 1990s, there was a major shift in production from dryland to irrigation and currently almost 80% of plantings are under irrigation.
Area planted
Plantings for 2015 were 53 933 ha, which was 4,9% higher than the 51 435 ha of the previous year.
Production
In 2015, the average yield was approximately 4 611 x 10-kg pockets per hectare, compared to 4 370 x 10-kg pockets per hectare in 2014, which is an increase of 5,5%.
Sales
The major fresh produce markets remain an important channel for the sale of potatoes.
During 2015, approximately 117 million x 10-kg pockets of potatoes were sold on the major fresh produce markets, as against 106 million in 2014—an increase of 10,4%. The Johannesburg Fresh Produce Market remains the biggest outlet, followed by the Tshwane, Cape Town and Durban markets. During the five years from 2011 to 2015, potato sales on the major fresh produce markets on average showed an increase of approximately 3,7%.
Fresh produce markets
47%
Processed 18%
Direct trade 21% Seed
8%
Exports 6%
Utilisation of the potato crop 2015
2 100
2 200
2 300
2 400
2 500
2 600
30
35
40
45
50
55
2011 2012 2013 2014 2015
'00
0 t
on
s
'00
0 h
a
Year
Production of and area planted to potatoes 2011–2015
Area planted Production

Trends in the Agricultural Sector 2016 Department of Agriculture, Forestry and Fisheries 65
Prices
Between 2011 and 2015, potato prices realised on the major fresh produce markets increased significantly by an average of 4,6% per annum, from R2 591 per ton in 2011 to R2 855 per ton in 2015.
The average price decreased by 16,7%, from R3 428 per ton in 2014 to R2 855 per ton in 2015.
Processing
During 2015, approximately 18,2% of the total potato production was taken in for processing. About 98,7% of these potatoes were processed into potato chips, both fresh and frozen. The remaining 1,3% was used for canning and other purposes. The processing of potatoes showed an increase of 10,6%, from 408 438 tons in 2014 to 451 899 tons in 2015.
Exports*
More than 99 094 tons, approximately 4,0% of total local potato production, was exported during 2015. The quantities of potatoes exported increased by 6,5% from 2014. During 2015, 98,2% of total potato exports went to SADC, East and Southern Africa and Western Africa. Exports showed an average annual increase of 19,0% from 2011 to 2015.
*Source: Customs and Excise
Consumption
The total gross human consumption of potatoes increased by 11,8% to 2 105 million tons during 2015 and the per capita consumption increased by 9,8% to about 38,30 kg.
Year 2011 2012 2013 2014 2015
Total production (‘000 tons) 2 197 2 229 2 174 2 247 2 487
Gross human consumption (‘000 tons) 1 875 1 888 1 833 1 883 2 105
Per capita consumption (kg p.a.) 36,21 36,11 34,59 34,85 38,30
Prospects
It is expected that there will be a 13,3% decrease in the production of potatoes in 2016, to a total crop of approximately 215,5 million x 10-kg pockets with the area of 52 994ha.
2 500
2 750
3 000
3 250
3 500
700
800
900
1 000
1 100
1 200
2011 2012 2013 2014 2015
R/t
on
'00
0 t
on
s
Year
Potato sales and prices on the major fresh produce markets 2011–2015
Volume Average price

Trends in the Agricultural Sector 2016 Department of Agriculture, Forestry and Fisheries 66
ANIMAL PRODUCTION
Livestock numbers
Approximately 80% of the agricultural land in South Africa is suitable mainly for extensive livestock farming. However, livestock is also found in areas where the animals are kept in combination with other farming enterprises.
Due to the drought that has affected the country, the area involved in cattle, sheep and goat farming, which is approximately 590 000 km
2 has been negatively affected. Representing 53% of all agricultural land in the
country, this badly affected grazing area has resulted in pockets of livestock mortality in provinces such as the Eastern Cape, while poor livestock conditions were recorded in the Free State. Commercial sheep farms also occur in other areas such as the Kgalagadi, the winter rainfall area and the grasslands of Mpumalanga, as well as the eastern Free State and KwaZulu-Natal, with challenges of wild animals and stock-theft threatening the successful farming thereof.
The past couple of years have seen below normal rainfall in most provinces, impacting the availability of fodder and grazing, resulting in farmers having to supplement with feed. As such, it is logical that a good correlation would exist between rainfall and the size of the national herd, particularly cattle.
Cattle
Cattle are found throughout the country, but mainly in the Eastern Cape, KwaZulu-Natal, Free State and North West provinces. Herd sizes vary according to type of cattle. In the case of dairy cattle, it varies between less than 50 and 300 (averaging approximately 110). Beef cattle herds range from fairly small (less than 20 head of cattle) to large farms and feedlots (more than 4 000 head). Vryburg, which is in the North West province, has been found to have some of the largest cattle herds in South Africa. The production of weaners for the feedlot industry is the most frequent form of cattle farming in South Africa, such that feedlots account for approximately 75% of all beef produced in the country.
The total number of cattle in South Africa at the end of August 2016 is estimated at 13,57 million, comprising various international dairy and beef cattle breeds as well as indigenous breeds such as the Afrikaner and the Nguni. The number is approximately 0,88% lower than the estimate of 13,69 million as at the end of August 2015. Beef cattle contribute approximately 80% of the total number of cattle in the country, while dairy cattle make up the remaining 20%. Holstein-Friesian, Jersey, Guernsey and Ayrshire are the four major dairy breeds found in South Africa.
Cattle numbers per province since 2012 were estimated to be as follows:
Province 2012 2013 2014 2015 2016*
’000 (August)
Western Cape 567 575 564 558 553
Northern Cape 507 498 503 502 510
Free State 2 306 2 298 2 304 2 279 2 271
Eastern Cape 3 267 3 284 3 338 3 321 3 284
KwaZulu-Natal 2 729 2 726 2 740 2 683 2 657
Mpumalanga 1 462 1 453 1 438 1 399 1 379
Limpopo 1 055 1 067 1 055 1 016 1 009
Gauteng 258 255 254 248 244
North West 1 737 1 706 1 719 1 688 1 663
Total 13 888 13 862 13 915 13 694 13 570
* Preliminary

Trends in the Agricultural Sector 2016 Department of Agriculture, Forestry and Fisheries 67
There are various breeders’ organisations representing most international and indigenous cattle breeds. Most of the organisations are affiliated to the South African Studbook and Animal Improvement Association. The Milk Producers’ Organisation (MPO) is the most prominent producer organisation in the South African dairy sector. The Red Meat Producers’ Organisation (RPO) and the National Emergent Red Meat Producers’ Organisation (NERPO) represent producers in the commercial and emerging agricultural sectors, respectively.
Sheep
Although sheep farms are found in all provinces, these are concentrated in the more arid parts of the country. The total number of sheep in South Africa at the end of August 2016 were estimated at 23,71 million, 0,96% lower than the estimated 23,94 million as at the end of August 2015. For August 2016, the largest numbers of sheep were estimated to be in the Eastern Cape (29%), Northern Cape (25%), Free State (20%) and Western Cape (12%) provinces.
Flock sizes vary between less than 50 and 1 800 animals. Sheep flocks in the Eastern, Western and Northern Cape provinces tend to be much larger than those in the other provinces.
The animals are kept mainly for wool and mutton production and the industry is therefore represented by organisations from the mutton as well as the wool industry. The sheep industry also has various breeders’ associations, with the Dorper Sheep Breeders’ Society of South Africa and Merino SA being the most prominent.
Western Cape 4%
Northern Cape 4%
Free State 17%
Eastern Cape 24%
KwaZulu-Natal 20%
Mpumalanga 10%
Limpopo 7%
Gauteng 2%
North West 12%
Distribution of cattle by province August 2016* (%)
Western Cape 12% Northern Cape
25%
Free State 20%
Eastern Cape 29%
KwaZulu-Natal 3%
Mpumalanga 7%
Limpopo 1%
Gauteng 0%
North West 3%
Distribution of sheep by province August 2016* (%)

Trends in the Agricultural Sector 2016 Department of Agriculture, Forestry and Fisheries 68
In the Western Cape, the inland Karoo and the Overberg produce wool and mutton and also the pedigree Merino breeding stock.
The number of sheep in the various provinces since 2012 was estimated to be as follows:
Province 2012 2013 2014 2015 2016*
’000 (August)
Western Cape 2 861 2 924 2 818 2 800 2 778
Northern Cape 6 083 6 188 5 995 5 956 5 893
Free State 4 768 4 822 4 773 4 727 4 692
Eastern Cape 7 085 7 026 6 987 6 967 6 924
KwaZulu-Natal 764 757 755 747 729
Mpumalanga 1 782 1 772 1 772 1 739 1 717
Limpopo 262 264 258 254 245
Gauteng 102 102 99 99 97
North West 685 673 666 649 635
Total 24 392 24 528 24 123 23 938 23 710
*Preliminary Goats
Goats are found mainly in the Eastern Cape, Limpopo, KwaZulu-Natal and North West provinces. Estimates indicate that there was an increase of 1,0% in the number of goats, from 5,872 million in August 2015 to 5,933 million in August 2016.
*Preliminary
Flocks of goats intended for meat production are usually smaller than sheep flocks, averaging approximately 300 goats per farm. Angora goats are kept primarily for mohair production, while Boer goats are mainly for meat production. According to the SA Milch Goat Breeders’ Society, there are also farmers who have adopted a market differentiating strategy by producing goat’s milk and these are increasing in numbers.
Western Cape 216 500 Northern Cape
513 950
Free State 235 050
Eastern Cape 2 249 200 KwaZulu-Natal
810 850
Mpumalanga 89 750
Limpopo 1 093 900
Gauteng 40 100
North West 683 350
Distribution of goats by province August 2016*

Trends in the Agricultural Sector 2016 Department of Agriculture, Forestry and Fisheries 69
Pigs
Pigs are found predominantly in the Limpopo, North West, Gauteng and Western Cape provinces. There are approximately 400 commercial pork producers and 19 stud breeders in South Africa. As of August 2016, it is estimated that pig numbers have increased by 1,1%, to 1,540 million, from 1,523 million in August 2015.
*Preliminary
The South African Pork Producers’ Organisation (SAPPO) is the official mouthpiece of pork producers in South Africa. The organisation is primarily concerned with administration, liaison with government, the promotion of pork and pork products and matters of national interest, such as health and research.
The total number of employees in the formal pork production industry in South Africa is estimated to be approximately 10 000, comprising about 4 000 farm workers and 6 000 workers in the processing and abattoir sectors.
Western Cape 171 400
Northern Cape 26 860
Free State 124 370
Eastern Cape 93 650
KwaZulu-Natal 152 530
Mpumalanga 125 530
Limpopo 362 180
Gauteng 165 620
North West 317 870
Distribution of pigs by province August 2016*

Trends in the Agricultural Sector 2016 Department of Agriculture, Forestry and Fisheries 70
Red meat
The red meat industry is one of the most important growing industries in the South African agricultural sector. It contributed approximately 17,1% to the gross value of agricultural production in the RSA during 2015/16. While sheep farming is mainly extensive, a large percentage of beef animals are supplied by feedlots.
Livestock slaughterings
It is estimated that the total number of cattle slaughtered increased by 5,7%, pigs slaughtered by 2,4% and sheep (including lambs) slaughtered decreased by 4,2% from 2014/15 to 2015/16.
Commercial slaughterings of red-meat-producing livestock types over the past five years were as follows:
Year 2011/12 2012/13 2013/14 2014/15 2015/16
Cattle 2 280 476 2 374 057 2 648 405 2 838 344 2 998 733
Sheep and lambs 4 111 421 4 772 301 5 281 651 5 466 996 5 236 472
Pigs 2 474 009 2 551 753 2 655 338 2 732 297 2 797 127
Auction prices
The prices for red meat are mainly determined by the interaction between demand and supply (the latter two are affected by the level of the consumers’ disposable income, the prices of substitute products and import parity prices, etc.). In the case of mutton, for example, the level of wool prices also influences the domestic supply of mutton.
The average producer price of beef for 2015/16 amounted to R35,17/kg (average for all classes on all auction markets), which represents an increase of 8,1% from the average price of R32,54/kg for 2014/15.
In view of the ever-strong influence of international trade on the local mutton industry, both the cyclical and
seasonal price patterns for mutton were influenced by imports. The average producer price for mutton and lamb increased by 3,5%, from R51,42/kg in 2014/15 to R53,21/kg in 2015/16.
The average producer price for pork decreased by 0,3%, from R22,33/kg in 2014/15 to R22,25/kg in 2015/16.
Imports
Imports of red meat increased by 4,3%, from 32 468 tons in 2014/15 to 33 879 tons in 2015/16 (7,6% lower than the average of approximately 36 673 tons for the five years up to 2015/16).
Beef imports amounted to 3 059 tons, which is an increase of 108,8% from the 1 465 tons imported during 2014/15 and 49,6% lower than the five-year average of 4 577 tons up to 2015/16.
0
1 000
2 000
3 000
4 000
5 000
6 000
2011/12 2012/13 2013/14 2014/15 2015/16
c/k
g
Year
Average producer prices of beef, mutton and pork 2011/12–2015/16 (July to June)
Beef Mutton and lamb Pork

Trends in the Agricultural Sector 2016 Department of Agriculture, Forestry and Fisheries 71
Imports of pork amounted to 25 070 tons, a decrease of 8,3% from the 27 354 tons imported during 2014/15 and 8,0% lower than the five-year average of 27 253 tons up to 2015/16.
Imports of mutton during 2015/16 amounted to 5 750 tons—an increase of 57,6% from the 3 648 tons imported the previous year and 18,7% higher than the average of 4 843 tons for the five years up to 2015/16.
Consumption
Consumption of beef and veal showed an increase of 4,7%, from 1 023 000 tons in 2014/15 to 1 071 000 tons in 2015/16; that of mutton increased by 0,3%, from 192 600 tons to 193 100 tons and that of pork increased by 2,8%, from 254 380 tons to 261 570 tons.
Poultry
The poultry industry consists of three distinct, separate branches, namely the day-old chick supply industry, the broiler industry and the egg industry. The Southern African Poultry Association (SAPA) represents both commercial and non-commercial poultry farmers within these three branches.
This article focuses on the broiler industry and the egg industry, as the chick supply industry makes an input into both.
Broiler industry
The broiler industry continues to dominate the agricultural sector in South Africa as the main supplier of animal protein.
Production
The distribution of broiler birds (including broiler breeders) per province is as follows: North West province 24,9%, Mpumalanga 22%, the Northern and Western Cape 18,6%, KwaZulu-Natal 12,1%, Gauteng 8,2%, the Eastern Cape 5,8%, the Free State 5,5% and Limpopo 2,9%.
0
10 000
20 000
30 000
40 000
2011/12 2012/13 2013/14 2014/15 2015/16
To
ns
Year
Imports of red meat 2011/12–2015/16
Beef Mutton and lamb Pork
0
200
400
600
800
1 000
1 200
2011/12 2012/13 2013/14 2014/15 2015/16
'000 t
on
s
Year
Consumption of red meat 2011/12–2015/16
Beef and veal Mutton Pork
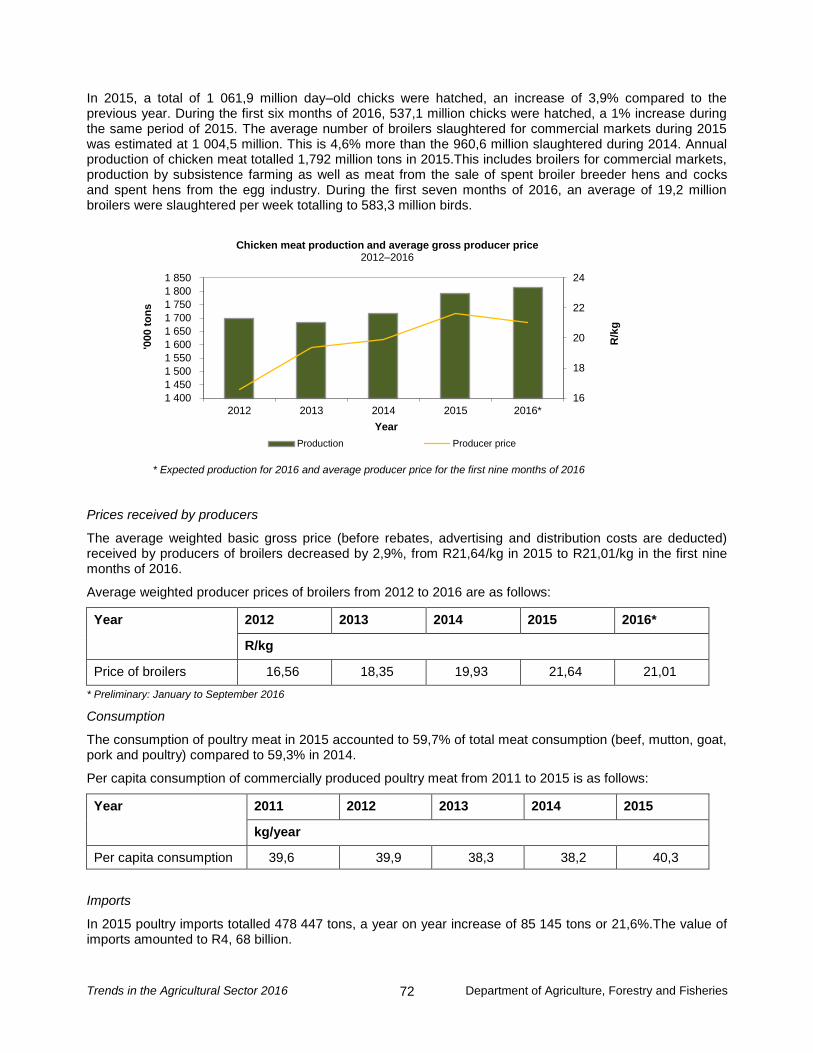
Trends in the Agricultural Sector 2016 Department of Agriculture, Forestry and Fisheries 72
In 2015, a total of 1 061,9 million day–old chicks were hatched, an increase of 3,9% compared to the previous year. During the first six months of 2016, 537,1 million chicks were hatched, a 1% increase during the same period of 2015. The average number of broilers slaughtered for commercial markets during 2015 was estimated at 1 004,5 million. This is 4,6% more than the 960,6 million slaughtered during 2014. Annual production of chicken meat totalled 1,792 million tons in 2015.This includes broilers for commercial markets, production by subsistence farming as well as meat from the sale of spent broiler breeder hens and cocks and spent hens from the egg industry. During the first seven months of 2016, an average of 19,2 million broilers were slaughtered per week totalling to 583,3 million birds.
* Expected production for 2016 and average producer price for the first nine months of 2016
Prices received by producers
The average weighted basic gross price (before rebates, advertising and distribution costs are deducted) received by producers of broilers decreased by 2,9%, from R21,64/kg in 2015 to R21,01/kg in the first nine months of 2016.
Average weighted producer prices of broilers from 2012 to 2016 are as follows:
Year 2012 2013 2014 2015 2016*
R/kg
Price of broilers 16,56 18,35 19,93 21,64 21,01
* Preliminary: January to September 2016
Consumption
The consumption of poultry meat in 2015 accounted to 59,7% of total meat consumption (beef, mutton, goat, pork and poultry) compared to 59,3% in 2014.
Per capita consumption of commercially produced poultry meat from 2011 to 2015 is as follows:
Year 2011 2012 2013 2014 2015
kg/year
Per capita consumption 39,6 39,9 38,3 38,2 40,3
Imports
In 2015 poultry imports totalled 478 447 tons, a year on year increase of 85 145 tons or 21,6%.The value of imports amounted to R4, 68 billion.
16
18
20
22
24
1 400
1 450
1 500
1 550
1 600
1 650
1 700
1 750
1 800
1 850
2012 2013 2014 2015 2016*
R/k
g
'000 t
on
s
Year
Chicken meat production and average gross producer price 2012–2016
Production Producer price

Trends in the Agricultural Sector 2016 Department of Agriculture, Forestry and Fisheries 73
Brazil was the main country of origin of imports in 2015, accounting for 50,4%, or 241 180 tons of total poultry imports into South Africa. The Netherlands was the second largest importer with 13%, followed by Belgium with 7,4%. Argentina and Spain were at fourth and fifth position with 5,8% and 5,7% of imports respectively. During 2015 an estimated 22% of local consumption of poultry meat consisted of imported poultry meat.
Prospects
The broiler industry is under immense strain mainly as a result of the flood of imports mostly from Brazil and the EU. Many smaller producers have closed their farms. In addition large agribusinesses are scaling back their operations. The spending power of the consumer remains a concern with the outlook for economic growth and job creation unlikely to improve soon. Higher grain and oilseed plantings, however, could contribute to a slight reduction in feed cost during the second half of 2017.
Egg industry
Based on information provided by SAPA, the distribution of layers per province is as follows: Gauteng 25,0%, Northern and Western Cape 24,0%, Free State 12,3%, KwaZulu-Natal 10,4%, North West 10,0%, Mpumalanga 9,1%, Limpopo 6,1% and Eastern Cape 3,1%
The number of layers increased by 2,1% from 24,34 million in 2014 to 24,85 million in 2015. The size of the national flock is expected to decrease by 0,1% during 2016 to 24,83 million layers.
The average price received by egg producers during the first nine months of 2016 was only 2,9% higher than the average price received during the same period of 2015.
The average weighted producer prices of eggs from 2012 to 2016 are as follows:
Year 2012 2013 2014 2015 2016*
R/dozen
Price of eggs 9,37 10,25 11,20 11,54 11,87
* Preliminary: January to September 2016
Production
Egg production showed a year on year increase of 2,0% in 2015. The average number of cases produced per week was 407 770 compared to 399 585 case per week in 2014. The total production of eggs for human consumption in 2015 was 637,9 million dozens or 21,3 million cases.
* Expected production for 2016 and average producer price for the first nine months of 2016
9
10
11
12
400 000
450 000
500 000
550 000
600 000
650 000
700 000
2012 2013 2014 2015 2016*
R/d
oz.
'000 d
oz.
Year
Production of eggs and prices received by producers 2012–2016
Production Producer price

Trends in the Agricultural Sector 2016 Department of Agriculture, Forestry and Fisheries 74
Consumption
The per capita consumption in 2015 was 150,3 eggs compared to 146,9 eggs in 2014. Considerable scope exists for the per capita consumption to increase, because eggs are still a relatively cheap source of protein. During the 2015 year, 507 784 tons of eggs were consumed. This amounted to 12% of the total protein (beef, mutton, goat, pork, poultry and eggs) consumption.
Prospects
Rising inputs costs, especially poultry feed, have put margins under pressure. Retailers continue to exert price squeezes on producers. A number of smaller egg farms have closed as a result of all these factors. As a result of the poor economic outlook and high unemployment level, demand is expected to remain subdued.
Milk
Milk is produced in nearly all regions of South Africa. However, the coastal areas are more suitable because of mild temperatures and good rainfall, ensuring good-quality natural and artificial pastures.
According to the Milk Producers’ Organisation (MPO), the estimated number of commercial milk producers in the country decreased by 8,2% from 1 834 in January 2015 to 1 683 in January 2016.
In 2015, the Eastern Cape province contributed 30,6% to total milk production, Western Cape (26,5%), KwaZulu-Natal (25,7%), Free State (6,1%), North West (4,7%), Gauteng (2,9%) and Mpumalanga (2,1%), with the remaining two provinces contributing 1,4%.
Milk production in South Africa makes a very small contribution to world milk production (approximately 0,5%). However, in terms of the value of agricultural production, it is currently the seventh largest agricultural industry in the country. The gross value of milk produced during 2015, including milk for the producer’s own consumption and on-farm usage, is estimated at R14 357 million, which is 3,4% higher than the R13 890 million produced in 2014.
Milk production in South Africa is usually in line with the demand and shortages are rarely reported every year. The production of milk during the first nine months of 2016 showed a decrease of 1,8% and is estimated at 2 162 million litres, compared to 2 202 million litres during the corresponding period in 2015. Commercial milk production increased to 3 051 million litres or by 6,1% in 2015, from 2 875 million litres in 2014.
Western Cape 26.5%
Eastern Cape 30.6%
KwaZulu Natal 25.7%
Free State 6.1%
North West 4.7%
Gauteng 2.9%
Mpumalanga 2.1%
Other 1.4%
Production by province (2015)

Trends in the Agricultural Sector 2016 Department of Agriculture, Forestry and Fisheries 75
The local commercial production figures of milk from 2012 to 2016 are shown in the following graph.
*Preliminary: January to September
Imports and exports
According to Milk Producers’ Organisation (MPO), South Africa imported 69 354 tons of dairy products in 2015, compared to 40 205 tons imported in 2014, which is an increase of 72,5%. Although the local milk production increased in 2015, the increase in imports was mainly a result of a growth in demand. The exports of dairy products dropped by 13,8% in 2015 and amounted to 61 296 tons, from 71 109 tons in 2014.
Prices
The average producer price of milk for the first nine months of 2016 is R4,47/ℓ, compared to R4,29/ℓ during the same period in 2015, an increase of 4,2%. The increase in price can be attributed to a growth in demand during the first nine months of 2016.
Production season 2012 2013 2014 2015
2016*
c/ℓ
Average producer price 344 374 426 415 447
* Preliminary: January to September 2015
Prospects
It is expected that milk production will increase in the remaining three months of 2016 (October to December) due to favourable weather conditions. The producer prices are also expected to increase as a result of the continued growth in demand.
Wool
Areas of production
Wool is produced throughout South Africa; however, the main production areas are in the drier regions of the country. Based on annual sales of producer lots, the Eastern Cape was the largest wool-producing province during 2015/16 with 12,9 million kg, followed by the Free State with 7,1 million kg, the Western Cape with 6,8 million kg, the Northern Cape with 5,0 million kg and Mpumalanga with 1,9 million kg, while 1,1 million kg were produced in the remaining four provinces.
South Africa's neighbour, Lesotho, which markets its wool in South Africa, produced 5,4 million kg.
Production
South Africa, like Australia, produces mainly apparel wool, while the bulk of the wool of the other major producers, such as New Zealand, China, Uruguay and Argentina, is the coarse type used in the manufacturing of carpets and interior textiles. The main fibres competing with wool are cotton and man-made fibres such as polyester, nylon and acrylic.
Wool production in South Africa, Lesotho and Namibia remained more or less the same as 2014/15 at 49,8 million kg in 2015/16 .
1 000
1 500
2 000
2 500
3 000
2012 2013 2014 2015 2016*
Mil
lio
n lit
res
Year
Local production of milk 2012–2016

Trends in the Agricultural Sector 2016 Department of Agriculture, Forestry and Fisheries 76
Marketing
An excess of 90% of all greasy wool sold in South Africa is traded by means of weekly auctions taking place from August to June. Normally, there is considerable volatility in prices during and between auctions. The price of wool is determined by a complex set of variables, including the level of the market in Australia on a specific day, exchange rate fluctuations, quantities offered for sale at auctions, the specific demand for different wool types at various times, the extent and timing of contract commitments by local buyers for delivery to clients and the prevailing economic conditions in wool-consuming countries.
South Africa produces mainly a Merino clip, which comprises more than 80% of all lots offered for sale. Mean fibre diameter is the major price determinant for Merino wool, with finer micron categories normally commanding a premium over medium and strong wool.
Marketing arrangements
Wool marketing in South Africa is free from statutory intervention. Wool is traded primarily via the open-cry auction system. Alternative selling mechanisms, such as contract growing, forward deliveries and futures, have not been established in the South African wool industry.
The global price for apparel wool is determined in Australia, where the largest volumes of wool are traded. South Africa, with its small clip, is therefore a market follower or price-taker.
Numerous sellers and few buyers are typical of wool auctions. Buyers normally have to compete for wool over a number of auctions to make up processing batches to meet their clients’ contract specifications in terms of price, quantity and delivery date. Contracts in foreign currencies, such as the euro or the US dollar, have to be converted into buying limits in rand and the buyer carries the risk.
Cape Wools of South Africa promotes the interests of the South African wool industry. It is a non-profit company established and owned by farmers and other directly-affected industry groups registered with the Wool Forum, which represents all role players in the industry. The Board of Directors proportionately represents these groups. Cape Wools started operating on 1 September 1997.
The Minister of Agriculture, Forestry and Fisheries has granted approval for the introduction of statutory measures for the collection of information, including statistics for the wool industry, enabling Cape Wools to create a wool statistics databank from which a national market indicator and other information regarding the industry can be made available locally as well as internationally.
Cape Wools’ service portfolio comprises market information and statistics; research and development; transfer of wool production and promotion of wool. Cape Wools is funded by the Wool Trust from funds transferred from the former Wool Board.
Exports
Wool is an export product with approximately 98% of total production being shipped overseas in either greasy or semi-processed form (scoured and wool top). Main export destinations for the year under review were China, the Czech Republic and Italy.
During 2015/16, the major export destinations for South African wool were as follows:
40
50
60
70
80
40
42
44
46
48
50
52
2011/12 2012/13 2013/14 2014/15 2015/16
R/k
g
Mil
lio
n k
g
Season
RSA wool production (including Lesotho and Namibia) and average price 2011/12–2015/16
Production Average price for greasy wool

Trends in the Agricultural Sector 2016 Department of Agriculture, Forestry and Fisheries 77
Wool shipments to the five top export destinations – July 2015 to June 2016
Country
Greasy Scoured Top and noils Total % of total FOB value
Value R1 000
Volume Kg
Value R1 000
Volume Kg
Value R1 000
Volume Kg
Value R1 000
China/Macau/ Hong Kong
2 568 414 31 928 958 67 050 454 306 1 688 12 205 2 637 151 63,5
Czech Republic 607 501 6 924 385 0 0 0 0 607 501 14,6
Italy 244 060 1 567 772 75 115 560 455 200 253 1 188 415 519 428 12,5
India 162 953 1 830 967 2 694 38 875 0 0 165 647 4,0
Germany 0 0 30 392 269 62 588 402 193 92 980 2,2
Outlook
Global economic conditions, the availability of apparel wool and exchange rates will, to a large extent, determine sales and prices for domestic wool producers. Global economic growth is projected to remain subdued before it is expected to revive during 2017. On the other hand, there is evidence that demand from China, the world’s largest wool consumer, may pick up as a result of attempts to move to a consumer-led economy in that country.
Mohair
Production
Mohair production in South Africa mainly occurs in the Eastern Cape province as well as the adjacent part of the Western Cape province.
South Africa produces approximately 52% of the world mohair clip. In realising the responsibility involved in being the most reliable source of mohair, Mohair South Africa was established to perform functions aimed at the advancement of the entire mohair industry. Through selective breeding and farming techniques, the Angora goat farmer plays a crucial role in promoting the constant availability of quality natural fibres.
South Africa’s mohair production showed a downward trend up to 2011, when production was 2,2 million kg. For the first time in 23 years, production showed an increase during the 2012 calendar year. This can mainly be attributed to producers keeping their old animals longer because of good mohair prices and also favourable grazing conditions. During 2015, production showed a slight increase of 1,2% to 2,5 million kg.
Production of mohair by South Africa during the period 2011 to 2015 is as follows:
Year 2011 2012 2013 2014 2015
Million kg
Production 2,2 2,3 2,4 2,5 2,5
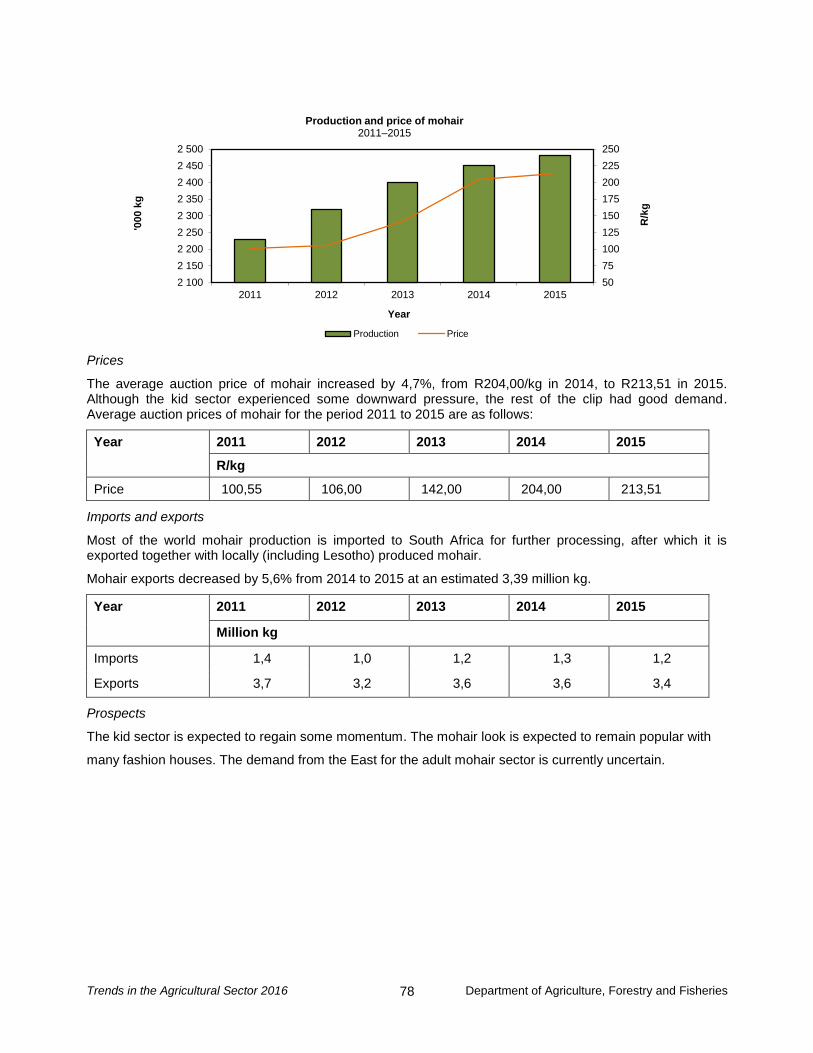
Trends in the Agricultural Sector 2016 Department of Agriculture, Forestry and Fisheries 78
Prices
The average auction price of mohair increased by 4,7%, from R204,00/kg in 2014, to R213,51 in 2015. Although the kid sector experienced some downward pressure, the rest of the clip had good demand. Average auction prices of mohair for the period 2011 to 2015 are as follows:
Year 2011 2012 2013 2014 2015
R/kg
Price 100,55 106,00 142,00 204,00 213,51
Imports and exports
Most of the world mohair production is imported to South Africa for further processing, after which it is exported together with locally (including Lesotho) produced mohair.
Mohair exports decreased by 5,6% from 2014 to 2015 at an estimated 3,39 million kg.
Year 2011 2012 2013 2014 2015
Million kg
Imports 1,4 1,0 1,2 1,3 1,2
Exports 3,7 3,2 3,6 3,6 3,4
Prospects
The kid sector is expected to regain some momentum. The mohair look is expected to remain popular with
many fashion houses. The demand from the East for the adult mohair sector is currently uncertain.
50
75
100
125
150
175
200
225
250
2 100
2 150
2 200
2 250
2 300
2 350
2 400
2 450
2 500
2011 2012 2013 2014 2015
R/k
g
'000 k
g
Year
Production and price of mohair 2011–2015
Production Price


