U.S. Agricultural Trade: Trends, Composition, Direction ... · U.S. Agricultural Trade: Trends,...
56
CRS Report for Congress Prepared for Members and Committees of Congress U.S. Agricultural Trade: Trends, Composition, Direction, and Policy Charles E. Hanrahan Senior Specialist in Agricultural Policy Carol Canada Information Research Specialist Beverly A. Banks Acquisitions Assistant July 29, 2011 Congressional Research Service 7-5700 www.crs.gov 98-253
Transcript of U.S. Agricultural Trade: Trends, Composition, Direction ... · U.S. Agricultural Trade: Trends,...

CRS Report for CongressPrepared for Members and Committees of Congress
U.S. Agricultural Trade: Trends, Composition, Direction, and Policy
Charles E. Hanrahan Senior Specialist in Agricultural Policy
Carol Canada Information Research Specialist
Beverly A. Banks Acquisitions Assistant
July 29, 2011
Congressional Research Service
7-5700 www.crs.gov
98-253
U.S. Agricultural Trade: Trends, Composition, Direction, and Policy
Congressional Research Service
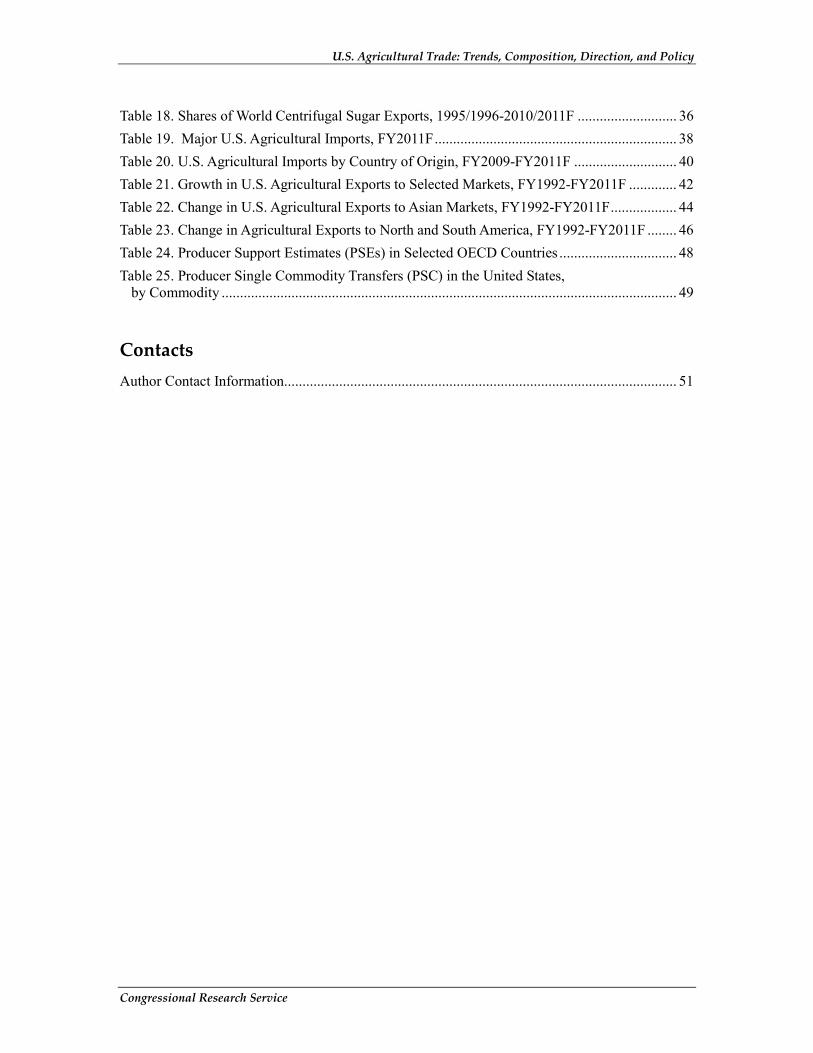
Summary U.S. agricultural exports, imports, and the agricultural trade surplus are expected by the U.S. Department of Agriculture (USDA) to reach record levels in FY2011. FY2011 U.S. farm exports are forecast by the U.S. Department of Agriculture to reach $137 billion, while agricultural imports are expected to reach $93 billion. The agricultural trade surplus is projected to be $44 billion. Exports of high-value products (e.g., fruits, vegetables, meats, wine and beer) have increased since the early 1990s and now account for 60% of total U.S. agricultural exports. Exports of bulk commodities (e.g., soybeans, wheat, and feed grains) remain significant.
Leading markets for U.S. agricultural exports are China, Canada, Mexico, Japan, the European Union (EU), South Korea, and Taiwan. The United States in 2011 is forecast to be the world’s leading exporter of corn, wheat, soybeans, and cotton. The U.S. share of world beef exports, which declined after the 2003 discovery of a case of “mad cow disease” in the United States, is recovering as more countries have re-opened their markets to U.S. product. The United States, European Union, Australia, and New Zealand are dominant suppliers of dairy products in global agricultural trade. New Zealand and the United States are the main suppliers of nonfat dry milk to world markets, while the EU is the leading supplier of cheeses.
China has been among the fastest-growing markets for U.S. agricultural exports. Agricultural exports to Canada and Mexico, both partners of the United States in the North American Free Trade Agreement (NAFTA), have also grown rapidly.
Most U.S. agricultural imports are high-value products, including fruits, nuts, vegetables, wine, and beer. The biggest import suppliers are NAFTA partners Canada and Mexico, and the EU. Together these three are forecast to provide more than 50% of total U.S. agricultural imports in FY2011. Brazil, Australia, Indonesia, New Zealand, and Colombia are also important suppliers of agricultural imports to the United States.
According to estimates by the Organization for Economic Cooperation and Development (OECD), the United States provides the third-lowest amount of government policy-generated support to its agricultural sector among OECD countries. The United States’ average applied tariff for agricultural products is estimated by the World Trade Organization to be 8.9%, a little more than twice the average applied tariff for non-agricultural products. Export subsidies, export credit guarantees, and market development programs are among the programs used by the United States to promote U.S. agricultural exports. The United States also provides U.S. agricultural commodities to developing countries as food aid for emergency relief or use in nonemergency development activities.

U.S. Agricultural Trade: Trends, Composition, Direction, and Policy
Congressional Research Service
Contents U.S. Agricultural Exports, Imports, and Trade Balance .................................................................. 1 Shares of U.S. Crop Production Exported: Selected Commodities ................................................. 3 Shares of U.S. Livestock Products Exported: Selected Commodities............................................. 5 Composition of U.S. Agricultural Exports: Major Commodity Components.................................. 7 Composition of U.S. Agricultural Exports: Bulk, Consumer-Ready, and Intermediate
Product Exports ............................................................................................................................ 9 Major Country Markets for U.S. Agricultural Exports .................................................................. 11 World Export Market Shares: Crops.............................................................................................. 13 World Market Shares: Livestock and Dairy................................................................................... 23 World Market Shares: Sugar.......................................................................................................... 35 Major U.S. Agricultural Imports.................................................................................................... 37 U.S. Agricultural Imports by Country of Origin............................................................................ 39 Regional Market Growth in U.S. Agricultural Exports ................................................................. 41 Growth in U.S. Agricultural Exports to Asian Markets ................................................................. 43 Growth in Agricultural Exports to North and South America ....................................................... 45 U.S. Agricultural and Trade Policies ............................................................................................. 47
Domestic Support .................................................................................................................... 47 Trade Measures........................................................................................................................ 50 Food Aid .................................................................................................................................. 50
Figures Figure 1. U.S. Agricultural Exports, Imports, and the Trade Balance, FY1998-FY2011F.............. 1 Figure 2. U.S. Agricultural Exports: Share of U.S. Production Exported,
1990/1991-2010/2011F................................................................................................................. 3 Figure 3. U.S. Agricultural Exports: Shares of U.S. Livestock Products Exported, 1990-
2011F ............................................................................................................................................ 5 Figure 4. U.S. Agricultural Exports of Major Commodities, FY2011F .......................................... 7 Figure 5. U.S. Agricultural Exports, FY1990-FY2010:
Bulk, Consumer-Oriented, and Intermediate Product Exports ..................................................... 9 Figure 6. Major Country Markets for U.S. Exports, FY2009-FY2011F ....................................... 11 Figure 7. Shares of World Exports of Wheat and Wheat Products, 2010/2011F........................... 13 Figure 8. Shares of World Exports of Rice, 2010/2011F ............................................................... 15 Figure 9. Shares of World Exports of Corn, 2010/2011F .............................................................. 17 Figure 10. Shares of World Exports of Soybeans, 2010/2011F ..................................................... 19 Figure 11. Shares of World Exports of Cotton, 2010/2011F.......................................................... 21 Figure 12. Shares of World Exports of Beef and Veal, 2011F ....................................................... 23

U.S. Agricultural Trade: Trends, Composition, Direction, and Policy
Congressional Research Service
Figure 13. Shares of World Pork Exports, 2011F .......................................................................... 25 Figure 14. Shares of World Poultry Meat Exports, 2011F............................................................. 27 Figure 15. Shares of World Nonfat Dry Milk Exports, 2011F....................................................... 29 Figure 16. Shares of World Cheese Exports, 2011F ...................................................................... 31 Figure 17. Shares of World Butter Exports, 2011F........................................................................ 33 Figure 18. Shares of World Centrifugal Sugar Exports, 2010/2011F ............................................ 35 Figure 19. Major Agricultural Imports by Commodity, FY2011F................................................. 37 Figure 20. U.S. Agricultural Imports by Country of Origin, FY2009-FY2011F........................... 39 Figure 21. Growth in U.S. Agricultural Exports, FY1992-FY2011F ........................................... 41 Figure 22. Growth in Agricultural Exports to Asian Markets, FY1992-FY2011F ........................ 43 Figure 23. Change in Agricultural Exports to North and South America,
FY1992-FY2011F....................................................................................................................... 45 Figure 24. Producer Support Estimates (PSEs) in Selected OECD Countries .............................. 48 Figure 25. Producer Single Commodity Transfers (PSCs): Selected Commodities in the
United States............................................................................................................................... 49
Tables Table 1. U.S. Agricultural Exports and Imports, FY1988-FY2011F ............................................... 2 Table 2. U.S. Agricultural Exports: Shares of U.S. Crop Production Exported, 1990/1991-
2010/2011F................................................................................................................................... 4 Table 3. U.S. Agricultural Exports: Shares of U.S. Production of Livestock Exported,
1990-2011F................................................................................................................................... 6 Table 4. U.S. Agricultural Exports of Major Commodities, FY2011F ............................................ 8 Table 5. U.S. Agricultural Exports, FY1990-FY2010: Total, Bulk, Consumer-Ready, and
Intermediate Product Exports ..................................................................................................... 10 Table 6. Major Country Markets for U.S. Agricultural Exports, FY2009-FY2011F..................... 12 Table 7. Shares of World Exports of Wheat and Wheat Products, 1995/1996-2010/2011F .......... 14 Table 8. Shares of World Exports of Rice, 1994/1995-2010/2011F .............................................. 16 Table 9. Shares of World Exports of Corn, 1995/1996-2010/2011F.............................................. 18 Table 10. Shares of World Exports of Soybeans, 1995/1996-2010/2011F .................................... 20 Table 11. Shares of World Exports of Cotton, 1995/1996-2010/2011F......................................... 22 Table 12. Shares of World Exports of Beef and Veal, 1995-2011F ............................................... 24 Table 13. Shares of World Pork Exports, 1994-2011F................................................................... 26 Table 14. Shares of World Total Poultry Meat Exports, 1994-2011F ............................................ 28 Table 15. Shares of World Nonfat Dry Milk Exports, 1995-2011F ............................................... 30 Table 16. Shares of World Cheese Exports, 1994-2011F............................................................... 32 Table 17. Shares of World Butter Exports, 1994-2011F ................................................................ 34
U.S. Agricultural Trade: Trends, Composition, Direction, and Policy
Congressional Research Service
Table 18. Shares of World Centrifugal Sugar Exports, 1995/1996-2010/2011F ........................... 36 Table 19. Major U.S. Agricultural Imports, FY2011F.................................................................. 38 Table 20. U.S. Agricultural Imports by Country of Origin, FY2009-FY2011F ............................ 40 Table 21. Growth in U.S. Agricultural Exports to Selected Markets, FY1992-FY2011F ............. 42 Table 22. Change in U.S. Agricultural Exports to Asian Markets, FY1992-FY2011F.................. 44 Table 23. Change in Agricultural Exports to North and South America, FY1992-FY2011F ........ 46 Table 24. Producer Support Estimates (PSEs) in Selected OECD Countries ................................ 48 Table 25. Producer Single Commodity Transfers (PSC) in the United States,
by Commodity ............................................................................................................................ 49
Contacts Author Contact Information........................................................................................................... 51

U.S. Agricultural Trade: Trends, Composition, Direction, and Policy
Congressional Research Service 1
U.S. Agricultural Exports, Imports, and Trade Balance • According to USDA, FY2011 agricultural exports are forecast to reach $137
billion, well above the fiscal 2008 record level of $115 billion. Increased demand for commodities as the global economy recovers from recession is a major reason for the increase in FY2011 exports.
• U.S. agricultural imports are forecast to reach $93 billion—a new record high—in FY2011, a $14 billion increase over FY2010 agricultural imports.
• The expected $44 billion U.S. agricultural trade surplus for FY2011 is well above FY2008’s all-time high of $36 billion.
Figure 1. U.S. Agricultural Exports, Imports, and the Trade Balance, FY1998-FY2011F
1988 1990 1992 1994 1996 1998 2000 2002 2004 2006 2008 20100
20
40
60
80
100
120
140
Exports
Imports
Source: U.S. Department of Agriculture. Economic Research Service. F = Forecast
Trade Balance
U.S. Agricultural Trade: Trends, Composition, Direction, and Policy
Congressional Research Service 2
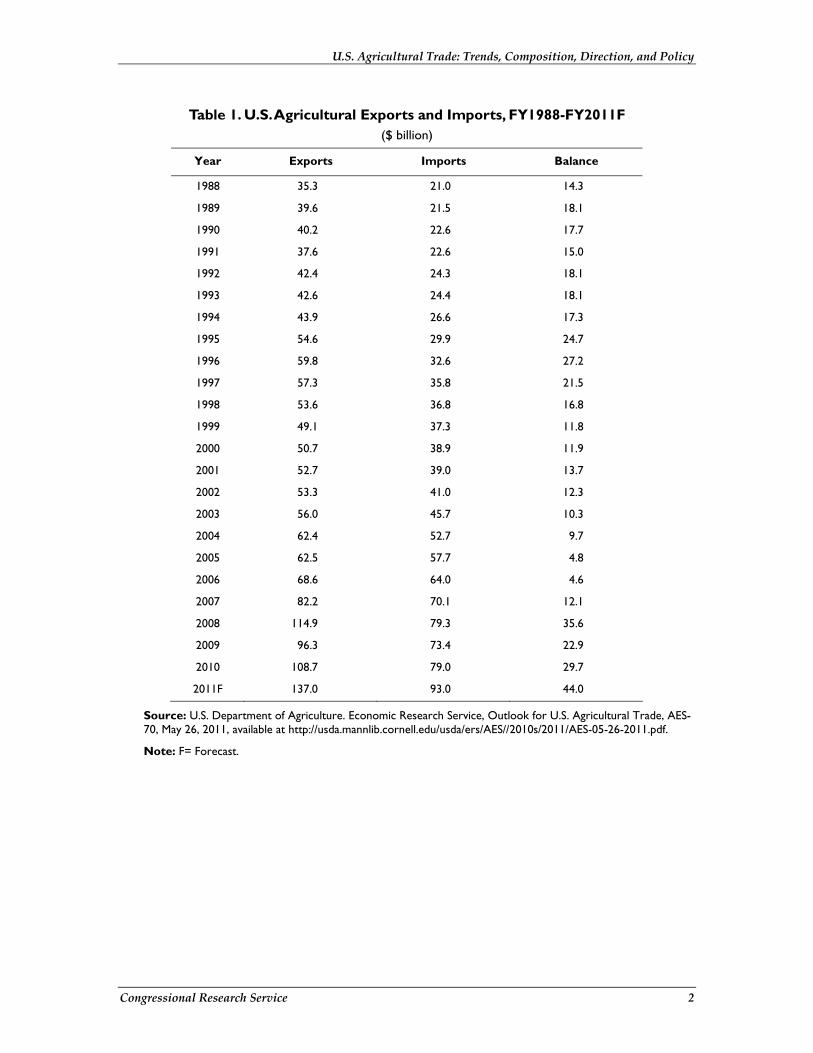
Table 1. U.S. Agricultural Exports and Imports, FY1988-FY2011F ($ billion)
Year Exports Imports Balance
1988 35.3 21.0 14.3
1989 39.6 21.5 18.1
1990 40.2 22.6 17.7
1991 37.6 22.6 15.0
1992 42.4 24.3 18.1
1993 42.6 24.4 18.1
1994 43.9 26.6 17.3
1995 54.6 29.9 24.7
1996 59.8 32.6 27.2
1997 57.3 35.8 21.5
1998 53.6 36.8 16.8
1999 49.1 37.3 11.8
2000 50.7 38.9 11.9
2001 52.7 39.0 13.7
2002 53.3 41.0 12.3
2003 56.0 45.7 10.3
2004 62.4 52.7 9.7
2005 62.5 57.7 4.8
2006 68.6 64.0 4.6
2007 82.2 70.1 12.1
2008 114.9 79.3 35.6
2009 96.3 73.4 22.9
2010 108.7 79.0 29.7
2011F 137.0 93.0 44.0
Source: U.S. Department of Agriculture. Economic Research Service, Outlook for U.S. Agricultural Trade, AES-70, May 26, 2011, available at http://usda.mannlib.cornell.edu/usda/ers/AES//2010s/2011/AES-05-26-2011.pdf.
Note: F= Forecast.

U.S. Agricultural Trade: Trends, Composition, Direction, and Policy
Congressional Research Service 3
Shares of U.S. Crop Production Exported: Selected Commodities • In 2010/2011, a forecast 58.2% of the U.S. wheat crop will be exported, while
15.8% of the U.S. corn crop will move into world markets.
• The export share of soybeans is forecast to be 47.8% in 2010/2011. Tight world stocks of oilseeds and strong foreign demand have pushed soybean exports up.
• Cotton’s export share in 2010/2011 is forecast to be 86%. Cotton is the United States’ most export-dependent field crop.
Figure 2. U.S. Agricultural Exports: Share of U.S. Production Exported, 1990/1991-2010/2011F
1990-1994 1995-1999 2000-2004 2005-2010 2010/11F0
20
40
60
80
100
WheatCornCottonSoybeans
Source: U.S. Department of Agriculture. Economic Research Service.

U.S. Agricultural Trade: Trends, Composition, Direction, and Policy
Congressional Research Service 4
Table 2. U.S. Agricultural Exports: Shares of U.S. Crop Production Exported, 1990/1991-2010/2011F
(percent)
Year Wheat Corn Cotton Soybeans
1990/91 38.4 22.1 50.3 28.9
1991/92 65.5 21.4 37.7 34.4
1992/93 55.5 17.7 32.1 35.2
1993/94 50.8 20.6 42.5 31.5
1994/95 51.5 23.0 47.8 33.4
1995/96 56.9 28.1 42.9 39.1
1996/97 44.0 19.9 36.2 37.2
1997/98 41.9 16.2 39.9 32.5
1998/99 41.8 21.0 30.9 29.4
1999/00 47.1 20.7 39.8 36.7
2000/01 46.2 19.2 39.2 36.1
2001/02 49.6 19.6 54.2 36.8
2002/03 51.7 18.0 69.1 37.9
2003/04 50.3 19.0 75.4 36.1
2004/05 48.4 15.1 62.1 35.1
2005/06 47.3 19.9 74.0 30.6
2006/07 50.5 20.3 60.0 34.9
2007/08 61.4 18.3 71.0 43.3
2008/09 39.8 15.5 103.5 43.1
2009/10 40.0 15.0 98.8 44.7
2010/11F 58.2 15.8 86.0 47.8
Source: Calculated by CRS using data from the U.S. Department of Agriculture’s Foreign Agricultural Service Production, Supply and Distribution Online database, http://www.fas.usda.gov/psdonline/psdHome.aspx.
Note: F = Forecast.

U.S. Agricultural Trade: Trends, Composition, Direction, and Policy
Congressional Research Service 5
Shares of U.S. Livestock Products Exported: Selected Commodities • U.S. livestock products are much less export-dependent than crops.
• Beef exports, which grew from around 4% of production in 1990 to almost 10% by 2003, have slowly recovered from export bans on U.S. beef following the 2003 discovery of a BSE-infected cow in the United States. The beef export share of production in 2011 is forecast to be 8.7%.
• Pork exports as a share of production have grown substantially, from 1.6% in 1990 to a forecast 20.8% in 2011.
• Poultry’s export share of production has almost tripled since 1990, from 6.2% to a forecast 18.1% in 2011.
Figure 3. U.S. Agricultural Exports: Shares of U.S. Livestock Products Exported, 1990-2011F
1990-1994 1995-1999 2000-2004 2005-2009 2010 2011F0
5
10
15
20
25BeefPorkPoultry
Source: U.S. Department of Agriculture. Economic Research Service.

U.S. Agricultural Trade: Trends, Composition, Direction, and Policy
Congressional Research Service 6
Table 3. U.S. Agricultural Exports: Shares of U.S. Production of Livestock Exported, 1990-2011F
Year Beef Pork Poultry
1990 4.4 1.6 6.2
1991 5.1 1.8 6.4
1992 5.7 2.4 7.1
1993 5.5 2.6 8.9
1994 6.5 3.1 12.1
1995 7.1 4.4 15.7
1996 7.2 5.7 16.9
1997 8.3 6.0 16.3
1998 8.3 6.5 15.8
1999 9.0 6.6 15.6
2000 9.1 6.8 16.3
2001 8.6 8.0 18.0
2002 8.9 8.2 15.1
2003 9.5 8.6 15.2
2004 1.9 10.6 14.2
2005 2.8 12.9 14.9
2006 4.3 14.2 14.8
2007 5.4 14.3 16.5
2008 7.0 20.0 19.1
2009 7.4 17.8 19.4
2010 8.8 20.2 18.0
2011F 8.7 20.8 18.1
Source: Calculated by CRS using data from the U.S. Department of Agriculture’s Foreign Agricultural Service Production, Supply and Distribution Online database, http://www.fas.usda.gov/psdonline/psdHome.aspx.
Note: F = Forecast.

U.S. Agricultural Trade: Trends, Composition, Direction, and Policy
Congressional Research Service 7
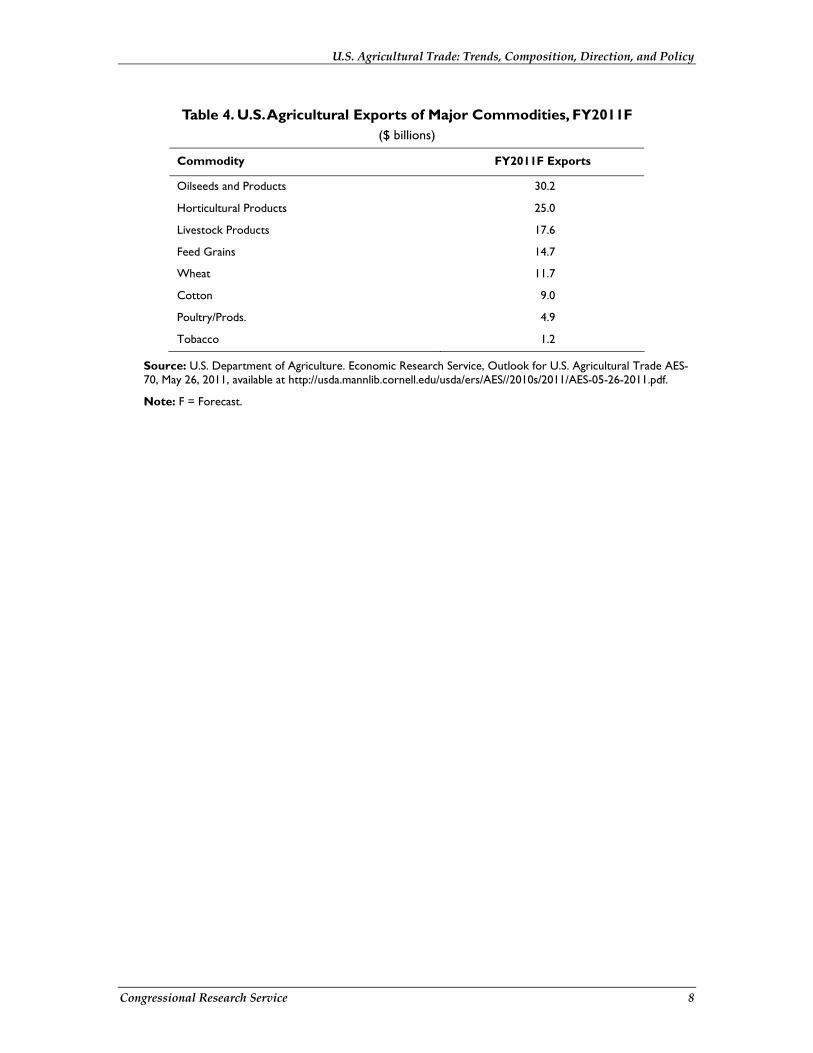
Composition of U.S. Agricultural Exports: Major Commodity Components • The United States exports a wide range of agricultural products, including
horticultural products, field crops, livestock products, and poultry.
• Oilseeds (mainly soybeans) and oilseed products (mainly meal and oil)—with a forecast value of $30.2 billion in FY2011—are the largest commodity component of U.S. agricultural exports.
• Horticultural product exports (fruits, vegetables, tree nuts, and their preparations)—forecast to be $25 billion in FY2011—comprise the second-largest commodity category of U.S. agricultural exports in FY2011.
• Livestock and poultry products together would amount to more than $21 billion in FY2011.
• Field crop exports (including feed grains, wheat, cotton, and tobacco) are forecast to account for almost $37 billion of U.S. agricultural exports in FY2011.
Figure 4. U.S. Agricultural Exports of Major Commodities, FY2011F
1.2
4.9
9
11.7
14.7
17.6
25
30.2
$ Billion
Tobacco
Poultry/Prods.
Cotton
Wheat
Feed Grains
Livestock Products
Horticultural Products
Oilseeds and Products
0 5 10 15 20 25 30 35
Source: U.S. Department of Agriculture. Economic Research Service. F = Forecast
U.S. Agricultural Trade: Trends, Composition, Direction, and Policy
Congressional Research Service 8
Table 4. U.S. Agricultural Exports of Major Commodities, FY2011F ($ billions)
Commodity FY2011F Exports
Oilseeds and Products 30.2
Horticultural Products 25.0
Livestock Products 17.6
Feed Grains 14.7
Wheat 11.7
Cotton 9.0
Poultry/Prods. 4.9
Tobacco 1.2
Source: U.S. Department of Agriculture. Economic Research Service, Outlook for U.S. Agricultural Trade AES-70, May 26, 2011, available at http://usda.mannlib.cornell.edu/usda/ers/AES//2010s/2011/AES-05-26-2011.pdf.
Note: F = Forecast.

U.S. Agricultural Trade: Trends, Composition, Direction, and Policy
Congressional Research Service 9
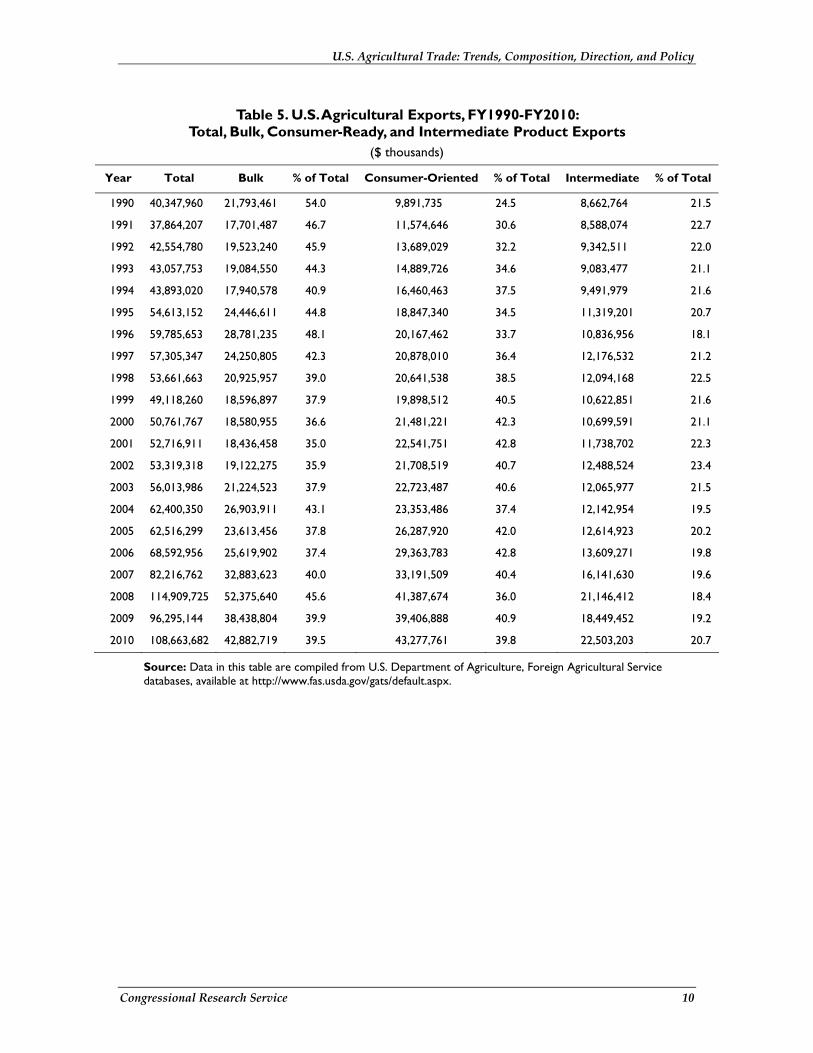
Composition of U.S. Agricultural Exports: Bulk, Consumer-Ready, and Intermediate Product Exports • Bulk agricultural exports include products like wheat, coarse grains, cotton, and
soybeans.
• Intermediate products have been processed to some extent and include products like wheat flour, soybean oil, and feeds.
• Consumer-ready products include both processed products such as breakfast cereals and products such as fresh fruits and vegetables, meat and dairy products, and wine and beer.
• Until 1990, bulk agricultural exports were the mainstay of U.S. farm export trade. The total of high-value (intermediate plus consumer-ready) products has exceeded the value of bulk agricultural exports in every fiscal year since FY1991.
• In FY2010, high-value exports accounted for 60.5% of total U.S. agricultural exports and bulk exports for 39.5%.
Figure 5. U.S. Agricultural Exports, FY1990-FY2010: Bulk, Consumer-Oriented, and Intermediate Product Exports
Source: U.S. Department of Agriculture. Foreign Agricultural Service.
1990 1992 1994 1996 1998 2000 2002 2004 2006 2008 20100
20
40
60
80
100
120
Intermediate Consumer-Oriented Bulk
U.S. Agricultural Trade: Trends, Composition, Direction, and Policy
Congressional Research Service 10
Table 5. U.S. Agricultural Exports, FY1990-FY2010: Total, Bulk, Consumer-Ready, and Intermediate Product Exports
($ thousands)
Year Total Bulk % of Total Consumer-Oriented % of Total Intermediate % of Total
1990 40,347,960 21,793,461 54.0 9,891,735 24.5 8,662,764 21.5
1991 37,864,207 17,701,487 46.7 11,574,646 30.6 8,588,074 22.7
1992 42,554,780 19,523,240 45.9 13,689,029 32.2 9,342,511 22.0
1993 43,057,753 19,084,550 44.3 14,889,726 34.6 9,083,477 21.1
1994 43,893,020 17,940,578 40.9 16,460,463 37.5 9,491,979 21.6
1995 54,613,152 24,446,611 44.8 18,847,340 34.5 11,319,201 20.7
1996 59,785,653 28,781,235 48.1 20,167,462 33.7 10,836,956 18.1
1997 57,305,347 24,250,805 42.3 20,878,010 36.4 12,176,532 21.2
1998 53,661,663 20,925,957 39.0 20,641,538 38.5 12,094,168 22.5
1999 49,118,260 18,596,897 37.9 19,898,512 40.5 10,622,851 21.6
2000 50,761,767 18,580,955 36.6 21,481,221 42.3 10,699,591 21.1
2001 52,716,911 18,436,458 35.0 22,541,751 42.8 11,738,702 22.3
2002 53,319,318 19,122,275 35.9 21,708,519 40.7 12,488,524 23.4
2003 56,013,986 21,224,523 37.9 22,723,487 40.6 12,065,977 21.5
2004 62,400,350 26,903,911 43.1 23,353,486 37.4 12,142,954 19.5
2005 62,516,299 23,613,456 37.8 26,287,920 42.0 12,614,923 20.2
2006 68,592,956 25,619,902 37.4 29,363,783 42.8 13,609,271 19.8
2007 82,216,762 32,883,623 40.0 33,191,509 40.4 16,141,630 19.6
2008 114,909,725 52,375,640 45.6 41,387,674 36.0 21,146,412 18.4
2009 96,295,144 38,438,804 39.9 39,406,888 40.9 18,449,452 19.2
2010 108,663,682 42,882,719 39.5 43,277,761 39.8 22,503,203 20.7
Source: Data in this table are compiled from U.S. Department of Agriculture, Foreign Agricultural Service databases, available at http://www.fas.usda.gov/gats/default.aspx.
U.S. Agricultural Trade: Trends, Composition, Direction, and Policy
Congressional Research Service 11
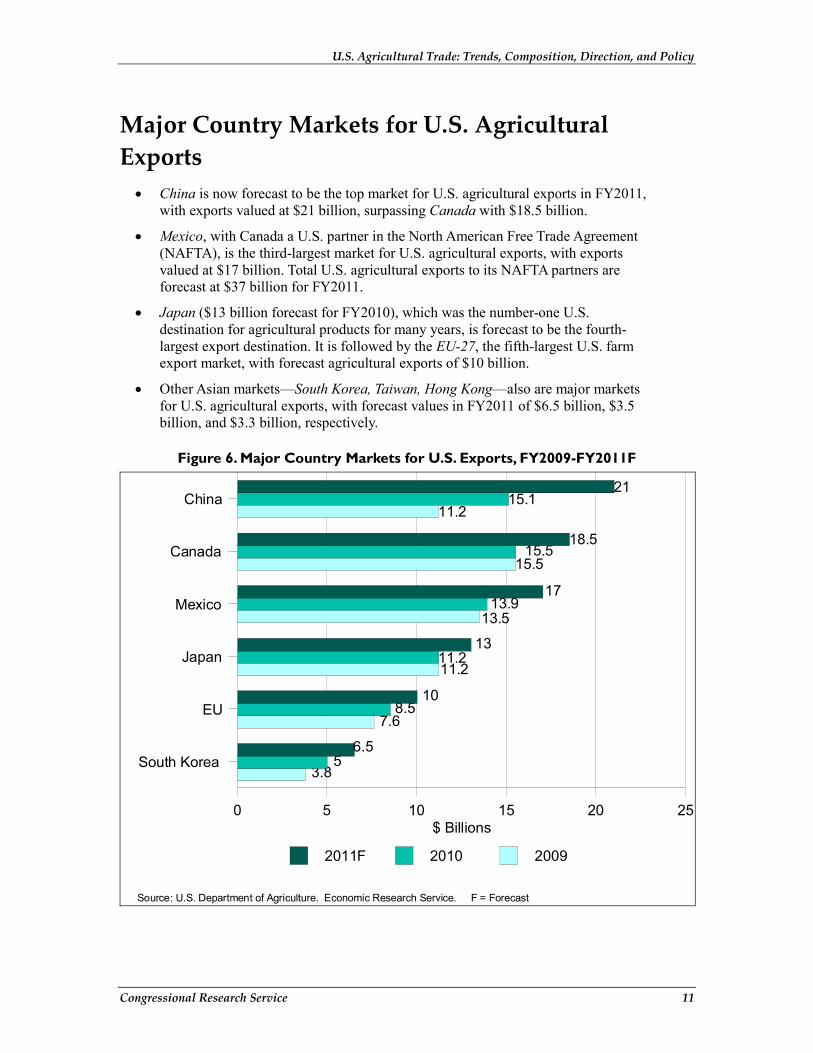
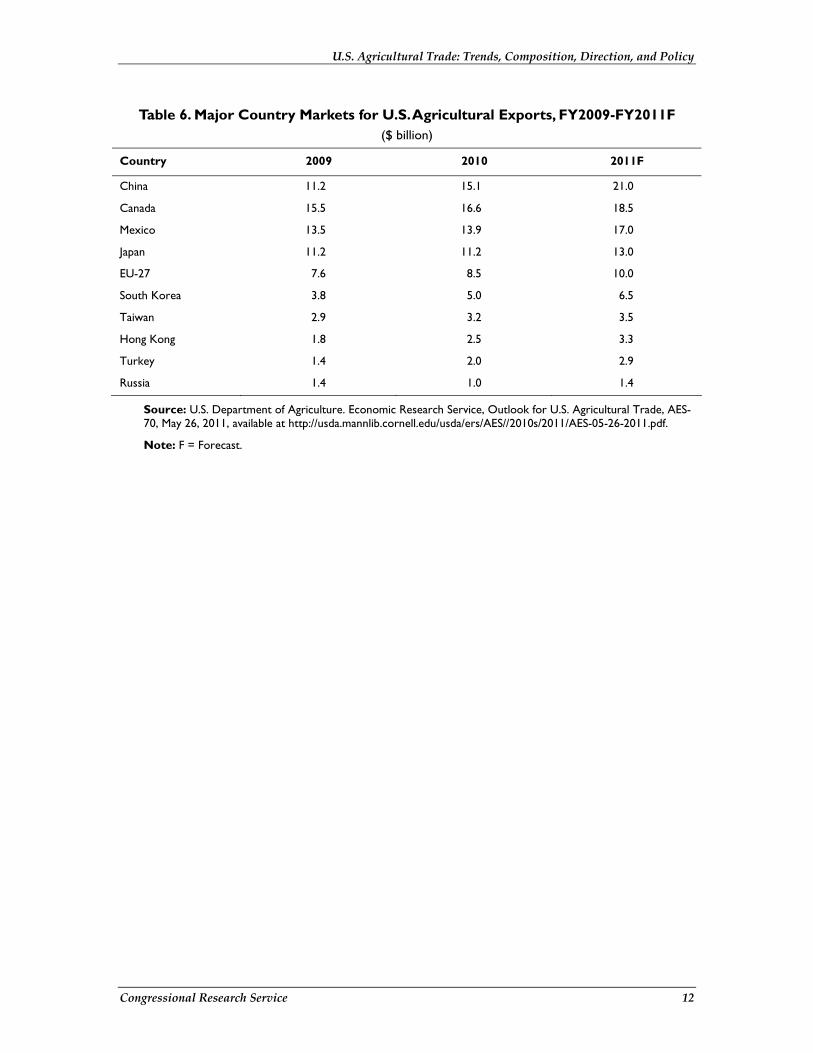
Major Country Markets for U.S. Agricultural Exports • China is now forecast to be the top market for U.S. agricultural exports in FY2011,
with exports valued at $21 billion, surpassing Canada with $18.5 billion.
• Mexico, with Canada a U.S. partner in the North American Free Trade Agreement (NAFTA), is the third-largest market for U.S. agricultural exports, with exports valued at $17 billion. Total U.S. agricultural exports to its NAFTA partners are forecast at $37 billion for FY2011.
• Japan ($13 billion forecast for FY2010), which was the number-one U.S. destination for agricultural products for many years, is forecast to be the fourth-largest export destination. It is followed by the EU-27, the fifth-largest U.S. farm export market, with forecast agricultural exports of $10 billion.
• Other Asian markets—South Korea, Taiwan, Hong Kong—also are major markets for U.S. agricultural exports, with forecast values in FY2011 of $6.5 billion, $3.5 billion, and $3.3 billion, respectively.
Figure 6. Major Country Markets for U.S. Exports, FY2009-FY2011F
3.8
7.6
11.2
13.5
15.5
11.2
5
8.5
11.2
13.9
15.5
15.1
6.5
10
13
17
18.5
21
$ Billions
South Korea
EU
Japan
Mexico
Canada
China
0 5 10 15 20 25
2011F 2010 2009
Source: U.S. Department of Agriculture. Economic Research Service. F = Forecast
U.S. Agricultural Trade: Trends, Composition, Direction, and Policy
Congressional Research Service 12
Table 6. Major Country Markets for U.S. Agricultural Exports, FY2009-FY2011F ($ billion)
Country 2009 2010 2011F
China 11.2 15.1 21.0
Canada 15.5 16.6 18.5
Mexico 13.5 13.9 17.0
Japan 11.2 11.2 13.0
EU-27 7.6 8.5 10.0
South Korea 3.8 5.0 6.5
Taiwan 2.9 3.2 3.5
Hong Kong 1.8 2.5 3.3
Turkey 1.4 2.0 2.9
Russia 1.4 1.0 1.4
Source: U.S. Department of Agriculture. Economic Research Service, Outlook for U.S. Agricultural Trade, AES-70, May 26, 2011, available at http://usda.mannlib.cornell.edu/usda/ers/AES//2010s/2011/AES-05-26-2011.pdf.
Note: F = Forecast.

U.S. Agricultural Trade: Trends, Composition, Direction, and Policy
Congressional Research Service 13
World Export Market Shares: Crops • Wheat: The United States is the major supplier of wheat and wheat products to the
world market, with a forecast export market share of 28.2% in marketing year 2010/2011. The EU (16.9%), Canada (14.1%), and Australia (12.1%) are major competitors in this market (see Figure 7 and Table 7).
• Rice: Thailand (33.1% export market share forecast for 2010/2011) is the world’s major rice exporter; but Vietnam (19.9%) has emerged as a major competitor. Both Pakistan’s and India’s export market shares in 2010/2011 are forecast to be 8%. The United States would be the world’s third-largest rice exporter with a forecast share in 2010/2011 of 11.4% (see Figure 8 and Table 8).
• Corn: The United States has the world’s largest export market for corn with a 2010/2011 forecast export share of 54.3% (see Figure 9 and Table 9). Since the mid-1990s, Brazil has increased its share of world corn exports, while China, an exporter of corn during most of the last 16 years, has lost export market share.
• Soybeans: The United States is forecast to be the world’s main supplier of soybeans to the world market in 2010/2011 with a share of 44%, down from 73% in 1995/1996. Over that same period, Brazil’s export market share has grown from 10.9% to 33.1%. (see Figure 10 and Table 10).
• Cotton: U.S. cotton exports are estimated to be 40.8% of the world total in 2010/2011. U.S. competitors include India (12.4%), Uzbekistan (9.1%), Australia (7.8%) and West/Central African countries (6.3%) (see Figure 11 and Table 11).
Figure 7. Shares of World Exports of Wheat and Wheat Products, 2010/2011F
Argentina6%
Australia 12%
Canada 14%
European Union 17%
United States28%
Rest of World17%
Ukraine3%
Russian Federation3%
Source: U.S. Department of Agriculture, Foreign Agricultural Service. Notes: F = Forecast.

U.S. Agricultural Trade: Trends, Composition, Direction, and Policy
Congressional Research Service 14
Table 7. Shares of World Exports of Wheat and Wheat Products, 1995/1996-2010/2011F
(percent)
Country 1995/96 1996/97 1997/98 1998/99 1999/00 2000/01 2001/02
Argentina 4.5 9.7 9.4 9.0 9.9 11.2 10.8
Australia 12.2 17.5 14.7 15.8 15.3 16.3 15.3
Canada 17.2 17.4 20.4 14.1 17.3 16.9 15.5
European Uniona 13.3 17.1 13.6 14.3 18.2 15.3 11.8
Russian Federation 0.2 0.7 1.1 1.6 0.5 0.7 4.0
Ukraine 1.4 1.2 1.3 4.6 1.7 0.1 5.1
United States 34.1 26.2 27.1 28.4 26.3 27.4 24.3
Rest of World 17.2 10.1 12.4 12.1 10.8 12.1 13.1
Country 2002/03 2003/04 2004/05 2005/06 2006/07 2007/08 2008/09
Argentina 5.9 7.1 11.9 7.3 10.6 8.8 6.0
Australia 10.2 14.6 13.9 13.3 9.7 6.4 9.4
Canada 8.8 15.0 13.3 13.7 16.7 14.2 13.0
European Uniona 17.0 9.5 12.9 13.8 11.9 10.5 17.7
Russian Federation 11.8 3.0 7.4 9.3 9.3 10.5 12.8
Ukraine 6.2 0.1 3.9 5.7 2.9 1.1 9.1
United States 21.2 31.0 25.0 23.7 21.5 29.4 18.9
Rest of World 18.9 19.7 11.7 13.1 17.3 19.1 13.0
Country 2009/2010E 2010/2011F
Argentina 3.9 5.6
Australia 10.2 12.1
Canada 14.1 14.1
European Uniona 16.5 16.9
Russian Federation 13.8 3.2
Ukraine 7.0 3.2
United States 18.0 28.2
Rest of World 16.5 16.7
Source: U.S. Department of Agriculture, Foreign Agricultural Service Production, Supply and Distribution Online database, http://www.fas.usda.gov/psdonline/psdHome.aspx.
Notes: July-June marketing year.
E = Estimate.
F = Forecast.
a. 1995/1996-1998/1999 data are EU-15 and 1990/2000 to present are EU-27.

U.S. Agricultural Trade: Trends, Composition, Direction, and Policy
Congressional Research Service 15
Figure 8. Shares of World Exports of Rice, 2010/2011F
China2% India
8%
Pakistan9%
Thailand33%
United States11%
Vietnam20%
Rest of World17%
Source: U.S. Department of Agriculture, Foreign Agricultural Service. Note: F = Forecast.

U.S. Agricultural Trade: Trends, Composition, Direction, and Policy
Congressional Research Service 16
Table 8. Shares of World Exports of Rice, 1994/1995-2010/2011F (percent)
Country 1994/95 1995/96 1996/97 1997/98 1998/99 1999/00 2000/01
China 0.2 1.3 5.0 13.5 10.9 13.0 7.6
India 20.0 18.6 11.1 16.9 11.1 6.4 7.9
Pakistan 8.5 8.5 9.4 7.2 7.4 8.9 9.9
Thailand 28.6 26.8 27.7 23.0 26.9 28.7 30.8
United States 14.6 13.3 12.2 11.5 10.7 12.5 10.2
Vietnam 11.1 15.4 17.6 13.7 18.4 14.8 14.5
Rest of World 17.1 16.1 17.0 14.2 14.7 15.8 19.0
Country 2001/02 2002/03 2003/04 2004/05 2005/06 2006/07 2007/08
China 7.1 9.4 3.2 2.3 4.2 4.2 3.3
India 23.9 16.1 11.7 16.2 15.6 19.8 11.4
Pakistan 5.8 7.1 7.3 10.5 12.3 8.5 10.3
Thailand 26.1 27.4 37.2 25.1 25.4 30.0 33.7
United States 11.6 13.8 11.2 13.3 11.2 9.4 10.8
Vietnam 11.7 13.8 15.8 17.9 16.2 14.2 15.6
Rest of World 13.9 12.5 13.6 14.8 15.0 14.0 14.9
Country 2008/09 2009/10E 2010/11F
China 2.7 2.0 2.0
India 7.3 6.3 8.0
Pakistan 10.9 12.8 8.8
Thailand 29.3 28.9 33.1
United States 10.2 12.3 11.4
Vietnam 20.3 21.6 19.9
Rest of World 19.3 16.1 16.9
Source: U.S. Department of Agriculture, Foreign Agricultural Service Production, Supply and Distribution Online database, http://www.fas.usda.gov/psdonline/psdHome.aspx.
Notes: July-June marketing year.
E = Estimate.
F = Forecast.

U.S. Agricultural Trade: Trends, Composition, Direction, and Policy
Congressional Research Service 17
Figure 9. Shares of World Exports of Corn, 2010/2011F
Argentina14%
Brazil11%
China0%
South Africa, Rep.3%
Ukraine6%
United States54%
Rest of World12%
Source: U.S. Department of Agriculture, Foreign Agricultural Service.
Note: F = Forecast.

U.S. Agricultural Trade: Trends, Composition, Direction, and Policy
Congressional Research Service 18
Table 9. Shares of World Exports of Corn, 1995/1996-2010/2011F (percent)
Country 1995/96 1996/97 1997/98 1998/99 1999/00 2000/01 2001/02
Argentina 10.7 15.3 20.2 11.4 12.3 16.1 11.8
Brazil 0.3 0.7 0.0 0.0 0.1 4.9 5.3
China 0.2 5.8 9.8 4.9 13.7 9.6 11.8
South Africa, Rep. 2.7 2.4 1.7 1.2 1.2 1.9 1.6
Ukraine 0.1 0.0 0.9 0.5 0.1 0.5 0.5
United States 81.4 70.0 59.9 75.7 68.4 63.7 64.9
Rest of World 4.5 5.7 7.5 6.3 4.3 3.3 4.1
Country 2002/03 2003/04 2004/05 2005/06 2006/07 2007/08 2008/09
Argentina 16.0 13.2 18.1 12.9 17.2 16.0 10.1
Brazil 4.1 7.4 1.9 3.4 8.8 8.0 8.6
China 19.8 9.6 10.0 4.5 5.8 0.6 0.2
South Africa, Rep. 1.5 1.0 2.0 1.7 0.5 1.1 2.5
Ukraine 1.1 1.6 3.1 3.0 1.1 2.1 6.5
United States 53.2 61.7 59.6 67.8 59.3 61.7 56.9
Rest of World 4.3 5.6 5.3 6.7 7.4 10.5 15.2
Country 2009/10E 2010/11F
Argentina 18.2 14.1
Brazil 9.3 10.9
China 0.2 0.2
South Africa, Rep. 1.7 2.7
Ukraine 5.4 6.0
United States 53.5 54.3
Rest of World 11.7 11.8
Source: U.S. Department of Agriculture, Foreign Agricultural Service Production, Supply and Distribution Online database, http://www.fas.usda.gov/psdonline/psdHome.aspx.
Notes: October-September marketing year.
E = Estimate.
F = Forecast.

U.S. Agricultural Trade: Trends, Composition, Direction, and Policy
Congressional Research Service 19
Figure 10. Shares of World Exports of Soybeans, 2010/2011F
Argentina11%
Brazil33%
Canada3%
Paraguay6%
United States44%
Rest of World3%
Source: U.S. Department of Agriculture, Foreign Agricultural Service.
Note: F = Forecast.

U.S. Agricultural Trade: Trends, Composition, Direction, and Policy
Congressional Research Service 20
Table 10. Shares of World Exports of Soybeans, 1995/1996-2010/2011F (percent)
Country 1995/96 1996/97 1997/98 1998/99 1999/2000 2000/01 2001/02
Argentina 6.6 2.1 7.2 8.1 9.0 13.6 11.3
Brazil 10.9 22.9 22.3 23.5 24.3 28.8 27.4
Canada 1.9 1.3 2.0 2.3 2.1 1.4 0.9
Paraguay 5.0 5.8 5.8 6.1 4.4 4.4 4.3
United States 73.0 65.6 60.5 57.7 58.2 50.5 54.7
Rest of World 2.5 2.3 2.2 2.3 2.0 1.3 1.3
Country 2002/03 2003/04 2004/05 2005/06 2006/07 2007/08 2008/09
Argentina 14.1 12.0 14.8 11.4 13.5 17.6 7.3
Brazil 32.1 36.4 31.1 40.8 33.1 32.2 39.0
Canada 1.2 1.6 1.7 2.1 2.4 2.2 2.6
Paraguay 5.0 4.8 4.6 3.2 5.5 5.8 2.9
United States 46.4 43.1 46.1 40.3 42.9 40.0 45.3
Rest of World 1.3 2.1 1.8 2.1 2.6 2.2 2.9
Country 2009/10E 2010/2011F
Argentina 14.1 11.2
Brazil 30.8 33.1
Canada 2.4 2.9
Paraguay 5.8 5.7
United States 44.0 44.0
Rest of World 2.8 3.1
Source: U.S. Department of Agriculture, Foreign Agricultural Service Production, Supply and Distribution Online database, http://www.fas.usda.gov/psdonline/psdHome.aspx.
Notes: Marketing year.
E = Estimate
F = Forecast

U.S. Agricultural Trade: Trends, Composition, Direction, and Policy
Congressional Research Service 21
Figure 11. Shares of World Exports of Cotton, 2010/2011F
Australia8% West/Central Africa
6%
India12%
United States41%
Uzbekistan9%
Rest of World24%
Source: U.S. Department of Agriculture, Foreign Agricultural Service.
Notes: West/Central Africa includes Benin, Burkina Faso, Cameroon, Central African Republic, Chad, Cote d’Ivoire, Mali, Niger, Senegal, and Togo.
F = Forecast.

U.S. Agricultural Trade: Trends, Composition, Direction, and Policy
Congressional Research Service 22
Table 11. Shares of World Exports of Cotton, 1995/1996-2010/2011F
Country 1995/96 1996/97 1997/98 1998/99 1999/00 2000/01 2001/02
Australia 5.3 8.9 10.1 12.9 11.8 14.9 10.7
West/Central Africaa 10.2 12.3 13.5 15.3 13.8 12.4 12.2
India 2.1 4.4 1.2 0.8 0.3 0.4 0.2
United States 28.1 25.6 28.1 18.3 24.8 25.7 37.7
Uzbekistan 16.5 17.0 17.1 16.2 15.5 13.2 12.0
Rest of World 37.8 31.8 30.0 36.5 33.9 33.4 27.1
Country 2002/03 2003/04 2004/05 2005/06 2006/07 2007/08 2008/09
Australia 8.7 6.5 5.7 6.4 5.7 3.1 4.0
West/Central Africaa 12.4 13.4 11.8 9.9 10.3 6.8 7.1
India 0.2 2.1 1.9 8.2 13.0 19.2 7.8
United States 39.1 41.4 41.2 39.4 34.6 35.0 44.1
Uzbekistan 11.2 9.3 11.3 10.7 12.0 10.8 10.0
Rest of World 28.4 27.3 28.1 25.4 24.4 25.1 26.9
Country 2009/10E 2010/11F
Australia 5.9 7.8
West/Central Africaa 6.4 6.3
India 18.4 12.4
United States 33.9 40.8
Uzbekistan 10.7 9.1
Rest of World 24.7 23.6
Source: U.S. Department of Agriculture, Foreign Agricultural Service Production, Supply and Distribution Online database, http://www.fas.usda.gov/psdonline/psdHome.aspx.
Notes: Marketing year.
E = Estimate.
F = Forecast.
a. Includes Benin, Burkina Faso, Cameroon, Central African Republic, Chad, Cote d’Ivoire, Mali, Niger, Senegal, and Togo.

U.S. Agricultural Trade: Trends, Composition, Direction, and Policy
Congressional Research Service 23
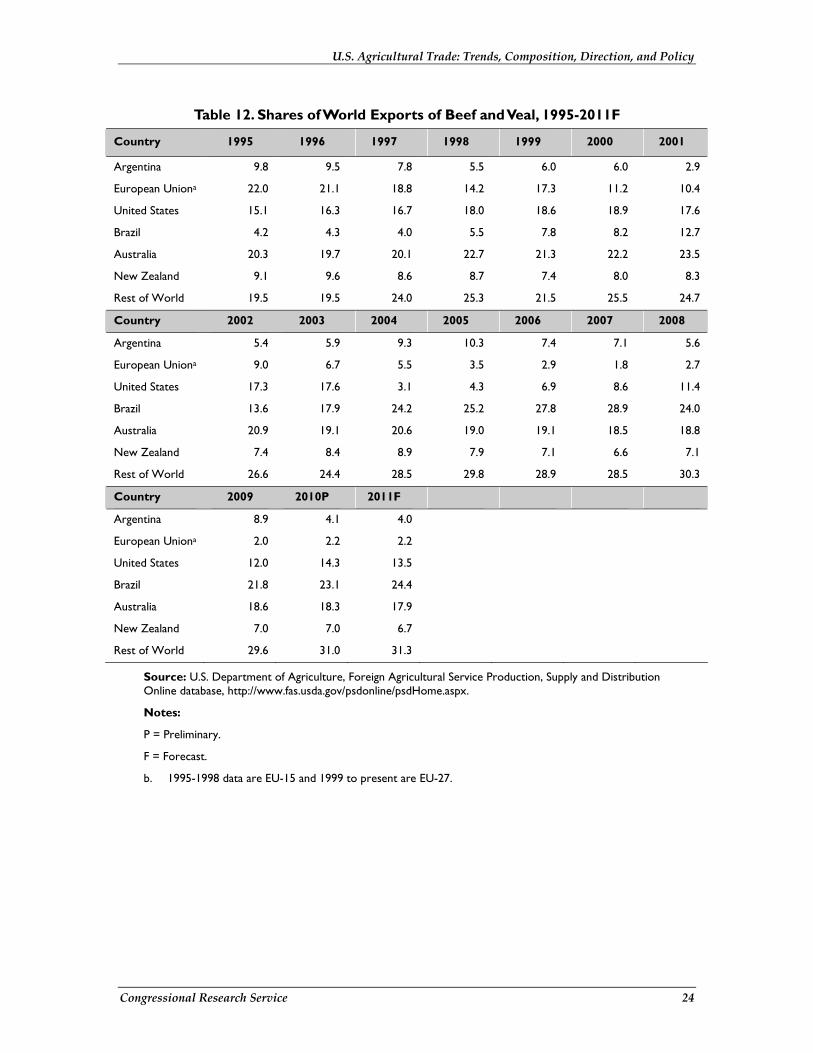
World Market Shares: Livestock and Dairy • Beef: Brazil, with 24.4% (forecast) of world exports in 2011, is the largest supplier
of beef to world markets. The U.S. share of world beef exports is forecast to be 13.5% in 2010. Lingering effects of mad cow disease continue to affect demand for U.S. beef in world markets; the U.S. share of world beef exports had reached 18.9% in 2000. (See Figure 12 and Table 12.)
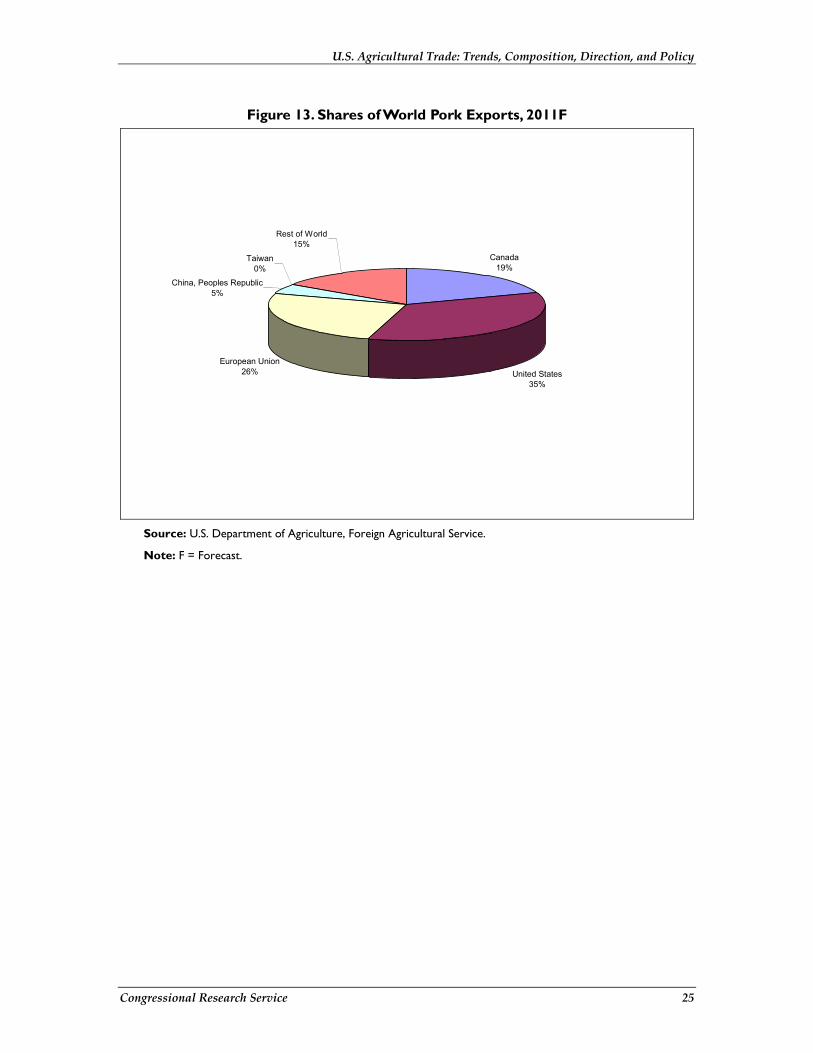
• Pork: The United States is forecast to have the largest export market share for pork (35%) in 2011. Main competitors for pork export market shares include the EU (25.5%) and Canada (19.4%). (See Figure 13 and Table 13.)
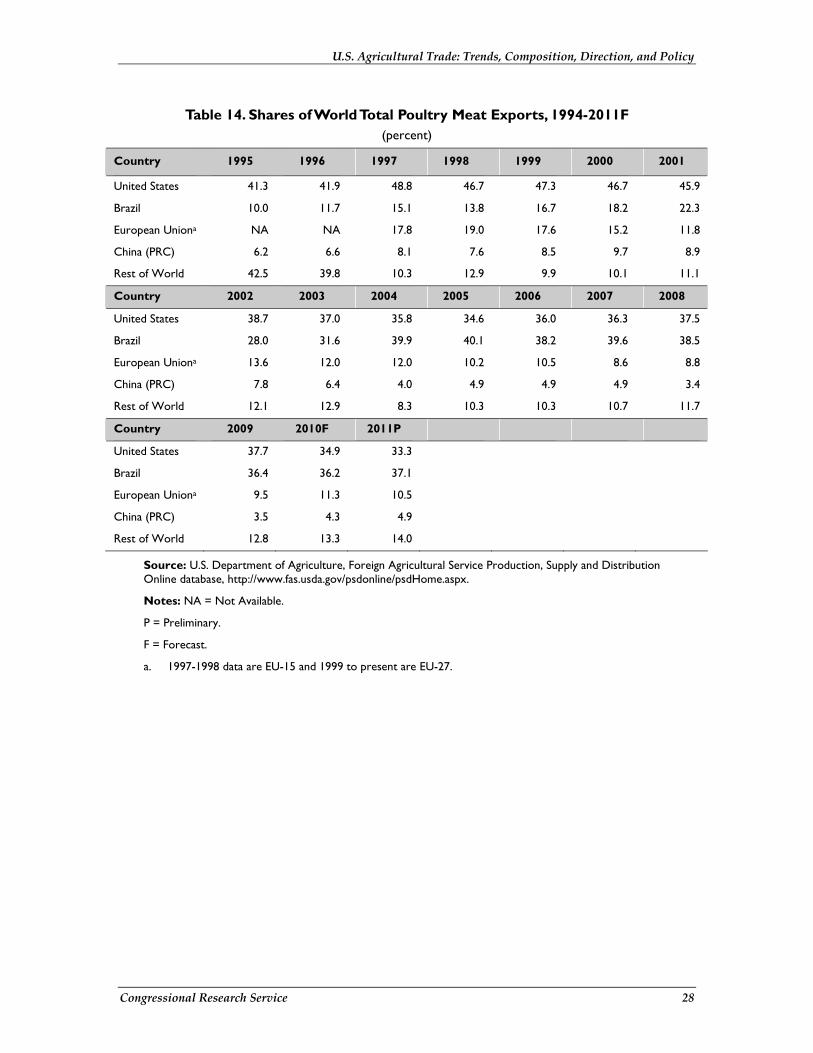
• Poultry: Brazil is the world’s leading supplier of poultry meat to the world market (37.1% forecast export market share for 2011). The United States, with 33.3% of world poultry meat exports, and the EU with 10.5% have lost market share to Brazil over the past decade. (See Figure 14 and Table 14.)
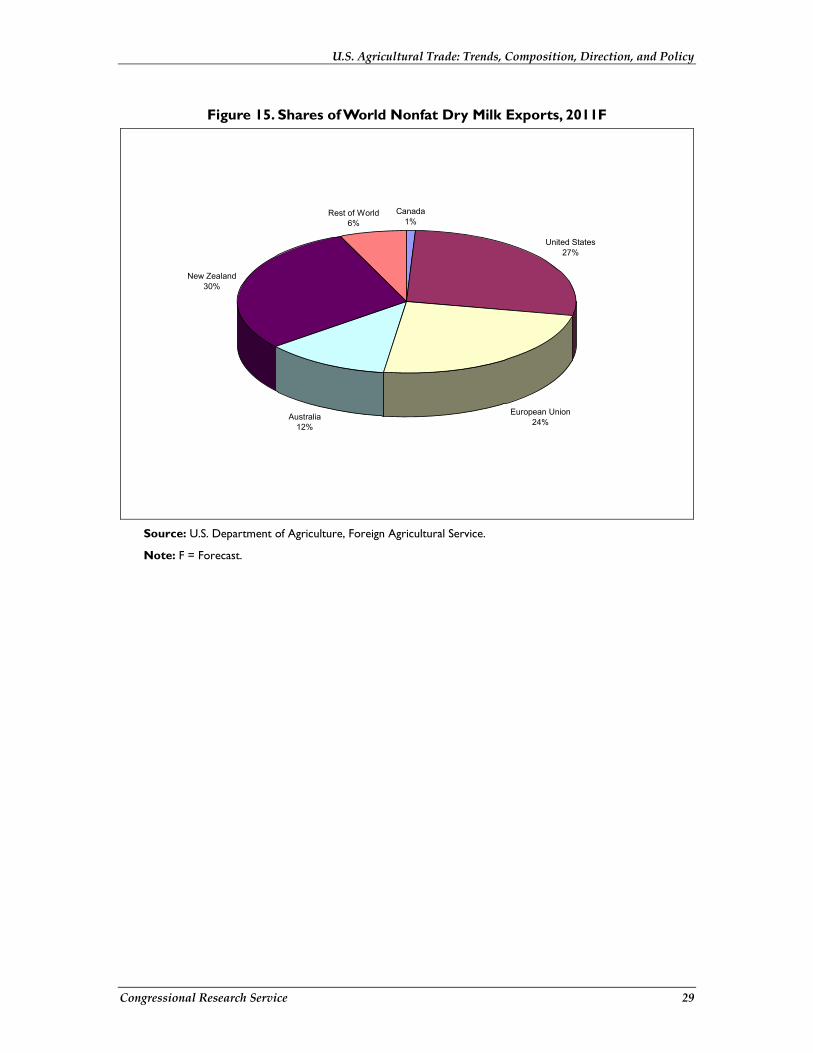
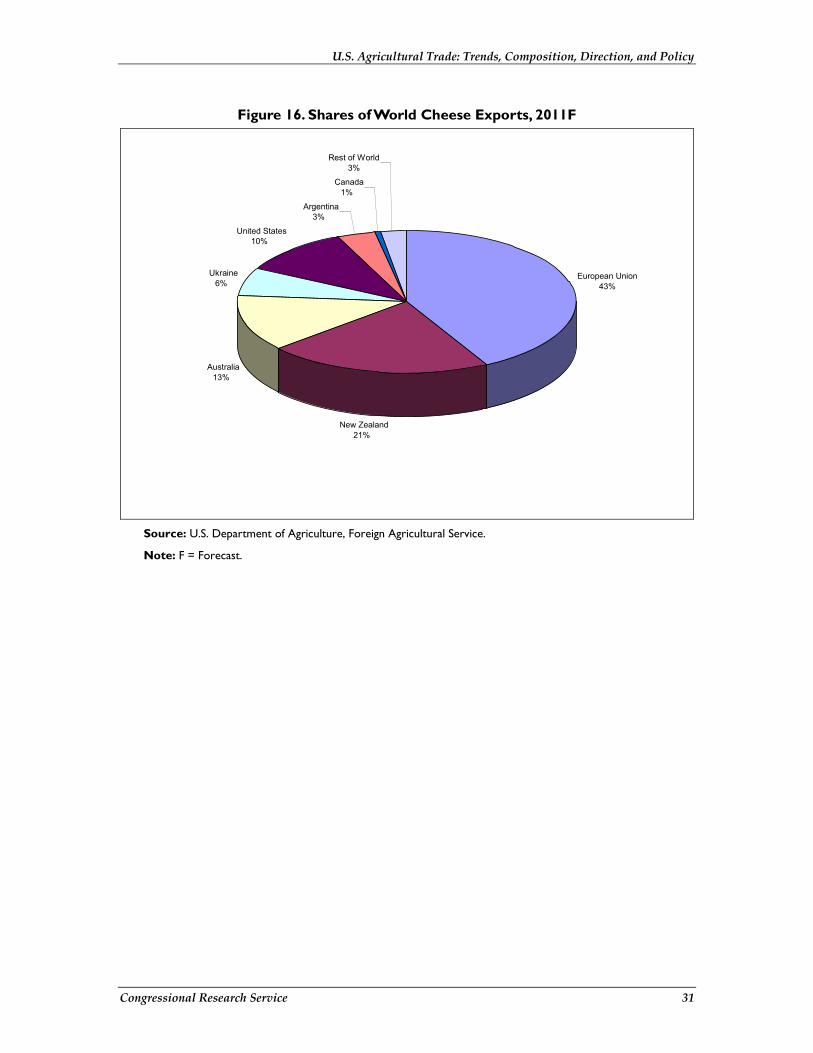
• Dairy Products: For 2011, New Zealand (29.4%) and the United States (27.4%) are forecast to be the leading suppliers of nonfat dry milk to world markets (see Figure 15 and Table 15). The EU (42.4%) is the leading supplier of cheese to world markets (see Figure 16 and Table 16), while New Zealand (58.5%) is the world’s largest exporter of butter (see Figure 17 and Table 17).
Figure 12. Shares of World Exports of Beef and Veal, 2011F
Argentina4%
European Union2% United States
14%
Brazil24%
Australia18%
New Zealand7%
Rest of World31%
Source: U.S. Department of Agriculture, Foreign Agricultural Service. Note: F = Forecast.
U.S. Agricultural Trade: Trends, Composition, Direction, and Policy
Congressional Research Service 24
Table 12. Shares of World Exports of Beef and Veal, 1995-2011F
Country 1995 1996 1997 1998 1999 2000 2001
Argentina 9.8 9.5 7.8 5.5 6.0 6.0 2.9
European Uniona 22.0 21.1 18.8 14.2 17.3 11.2 10.4
United States 15.1 16.3 16.7 18.0 18.6 18.9 17.6
Brazil 4.2 4.3 4.0 5.5 7.8 8.2 12.7
Australia 20.3 19.7 20.1 22.7 21.3 22.2 23.5
New Zealand 9.1 9.6 8.6 8.7 7.4 8.0 8.3
Rest of World 19.5 19.5 24.0 25.3 21.5 25.5 24.7
Country 2002 2003 2004 2005 2006 2007 2008
Argentina 5.4 5.9 9.3 10.3 7.4 7.1 5.6
European Uniona 9.0 6.7 5.5 3.5 2.9 1.8 2.7
United States 17.3 17.6 3.1 4.3 6.9 8.6 11.4
Brazil 13.6 17.9 24.2 25.2 27.8 28.9 24.0
Australia 20.9 19.1 20.6 19.0 19.1 18.5 18.8
New Zealand 7.4 8.4 8.9 7.9 7.1 6.6 7.1
Rest of World 26.6 24.4 28.5 29.8 28.9 28.5 30.3
Country 2009 2010P 2011F
Argentina 8.9 4.1 4.0
European Uniona 2.0 2.2 2.2
United States 12.0 14.3 13.5
Brazil 21.8 23.1 24.4
Australia 18.6 18.3 17.9
New Zealand 7.0 7.0 6.7
Rest of World 29.6 31.0 31.3
Source: U.S. Department of Agriculture, Foreign Agricultural Service Production, Supply and Distribution Online database, http://www.fas.usda.gov/psdonline/psdHome.aspx.
Notes:
P = Preliminary.
F = Forecast.
b. 1995-1998 data are EU-15 and 1999 to present are EU-27.
U.S. Agricultural Trade: Trends, Composition, Direction, and Policy
Congressional Research Service 25
Figure 13. Shares of World Pork Exports, 2011F
Canada19%
United States35%
European Union26%
China, Peoples Republic5%
Taiwan0%
Rest of World15%
Source: U.S. Department of Agriculture, Foreign Agricultural Service.
Note: F = Forecast.

U.S. Agricultural Trade: Trends, Composition, Direction, and Policy
Congressional Research Service 26
Table 13. Shares of World Pork Exports, 1994-2011F (percent)
Country 1995 1996 1997 1998 1999 2000 2001
Canada 15.5 13.6 14.4 14.7 17.0 21.4 22.7
United States 15.1 15.6 16.2 19.0 17.9 18.9 21.8
European Uniona 32.6 30.5 32.6 35.1 49.0 43.3 30.2
China 4.4 4.8 6.9 6.9 4.4 4.7 7.0
Taiwan 16.1 13.7 2.2 0.1 0.0 0.0 0.1
Rest of World 16.3 21.8 27.6 24.3 11.8 11.7 18.3
Country 2002 2003 2004 2005 2006 2007 2008
Canada 23.1 23.3 20.6 21.7 20.7 20.0 18.4
United States 19.6 18.7 21.0 24.2 26.0 27.6 34.4
European Uniona 26.6 27.3 27.6 22.8 24.6 24.9 28.1
China 8.2 9.5 11.4 10.0 10.4 6.8 3.6
Taiwan 0.1 0.0 0.0 0.0 0.0 0.0 0.0
Rest of World 22.5 21.1 19.4 21.3 18.3 20.7 15.4
Country 2009 2010P 2011F
Canada 19.9 19.2 19.4
United States 32.9 33.5 35.0
European Uniona 25.1 28.1 25.5
China 4.1 4.1 4.6
Taiwan 0.0 0.0 0.0
Rest of World 17.9 15.0 15.5
Source: U.S. Department of Agriculture, Foreign Agricultural Service Production, Supply and Distribution Online database, http://www.fas.usda.gov/psdonline/psdHome.aspx.
Notes: F = Forecast.
a. 1995-1998 data are EU-15 and 1999 to present are EU-27.

U.S. Agricultural Trade: Trends, Composition, Direction, and Policy
Congressional Research Service 27
Figure 14. Shares of World Poultry Meat Exports, 2011F
United States33%
Brazil37%
European Union11%
China, Peoples Republic5%
Rest of World14%
Source: U.S. Department of Agriculture, Foreign Agricultural Service.
Note: F = Forecast.
U.S. Agricultural Trade: Trends, Composition, Direction, and Policy
Congressional Research Service 28
Table 14. Shares of World Total Poultry Meat Exports, 1994-2011F (percent)
Country 1995 1996 1997 1998 1999 2000 2001
United States 41.3 41.9 48.8 46.7 47.3 46.7 45.9
Brazil 10.0 11.7 15.1 13.8 16.7 18.2 22.3
European Uniona NA NA 17.8 19.0 17.6 15.2 11.8
China (PRC) 6.2 6.6 8.1 7.6 8.5 9.7 8.9
Rest of World 42.5 39.8 10.3 12.9 9.9 10.1 11.1
Country 2002 2003 2004 2005 2006 2007 2008
United States 38.7 37.0 35.8 34.6 36.0 36.3 37.5
Brazil 28.0 31.6 39.9 40.1 38.2 39.6 38.5
European Uniona 13.6 12.0 12.0 10.2 10.5 8.6 8.8
China (PRC) 7.8 6.4 4.0 4.9 4.9 4.9 3.4
Rest of World 12.1 12.9 8.3 10.3 10.3 10.7 11.7
Country 2009 2010F 2011P
United States 37.7 34.9 33.3
Brazil 36.4 36.2 37.1
European Uniona 9.5 11.3 10.5
China (PRC) 3.5 4.3 4.9
Rest of World 12.8 13.3 14.0
Source: U.S. Department of Agriculture, Foreign Agricultural Service Production, Supply and Distribution Online database, http://www.fas.usda.gov/psdonline/psdHome.aspx.
Notes: NA = Not Available.
P = Preliminary.
F = Forecast.
a. 1997-1998 data are EU-15 and 1999 to present are EU-27.
U.S. Agricultural Trade: Trends, Composition, Direction, and Policy
Congressional Research Service 29
Figure 15. Shares of World Nonfat Dry Milk Exports, 2011F
Canada1%
United States27%
European Union24%Australia
12%
New Zealand30%
Rest of World6%
Source: U.S. Department of Agriculture, Foreign Agricultural Service.
Note: F = Forecast.

U.S. Agricultural Trade: Trends, Composition, Direction, and Policy
Congressional Research Service 30
Table 15. Shares of World Nonfat Dry Milk Exports, 1995-2011F (percent)
Country 1995 1996 1997 1998 1999 2000 2001
Canada 2.5 2.5 2.9 3.8 2.7 1.9 3.7
United States 9.5 2.4 11.3 11.5 14.4 8.5 7.7
European Uniona NA NA 27.3 19.4 24.4 27.1 22.3
Australia 10.9 12.8 19.8 22.1 15.9 15.2 17.5
New Zealand 9.7 11.5 20.7 21.8 13.6 10.5 15.6
Rest of World 67.4 70.8 18.0 21.4 29.1 36.7 33.3
Country 2002 2003 2004 2005 2006 2007 2008
Canada 3.7 2.4 1.1 0.5 1.2 1.1 1.0
United States 9.6 9.3 15.9 23.0 26.1 20.8 35.4
European Uniona 19.9 22.3 19.1 15.8 8.0 16.3 16.2
Australia 17.6 12.8 12.9 11.7 17.2 14.1 10.9
New Zealand 18.9 20.8 21.0 18.4 22.1 26.3 22.8
Rest of World 30.3 32.4 30.0 30.5 25.5 21.4 13.7
Country 2009 2010P 2011F
Canada 0.9 0.8 0.7
United States 22.1 28.5 27.4
European Uniona 20.1 27.2 24.3
Australia 14.5 9.7 11.8
New Zealand 35.4 27.6 29.4
Rest of World 7.0 6.2 6.5
Source: U.S. Department of Agriculture, Foreign Agricultural Service Production, Supply and Distribution Online database, http://www.fas.usda.gov/psdonline/psdHome.aspx.
Notes: NA = Not Available.
P = Preliminary.
F = Forecast.
a. 1997-1998 data are EU-15 and 1999 to present are EU-27.
U.S. Agricultural Trade: Trends, Composition, Direction, and Policy
Congressional Research Service 31
Figure 16. Shares of World Cheese Exports, 2011F
European Union43%
New Zealand21%
Australia13%
Ukraine6%
United States10%
Argentina3%
Canada 1%
Rest of World3%
Source: U.S. Department of Agriculture, Foreign Agricultural Service.
Note: F = Forecast.

U.S. Agricultural Trade: Trends, Composition, Direction, and Policy
Congressional Research Service 32
Table 16. Shares of World Cheese Exports, 1994-2011F
Country 1994 1995 1996 1997 1998 1999 2000 2001
European Uniona NA NA NA 51.0 46.2 45.2 31.1 30.8
New Zealandb 5.9 6.9 6.7 25.0 25.6 26.1 16.3 16.0
Australiac 4.1 4.5 4.3 13.3 16.6 18.7 14.4 13.9
Ukraine 0.2 0.2 0.1 0.2 0.4 0.7 0.8 2.0
United States 1.1 1.1 1.2 4.0 4.1 4.1 3.0 3.4
Argentina 0.6 0.5 0.4 2.0 1.9 2.2 1.4 1.1
Canada 0.3 0.6 0.6 2.4 3.0 2.7 1.2 1.2
Rest of World 87.8 86.2 86.6 2.0 2.2 0.3 31.8 31.5
Country 2002 2003 2004 2005 2006 2007 2008 2009
European Uniona 30.3 31.3 29.7 28.7 31.7 28.8 38.8 41.3
New Zealandb 16.7 16.9 16.4 15.2 15.1 16.7 22.4 23.5
Australiac 13.1 12.0 12.0 13.1 11.4 11.4 16.0 13.1
Ukraine 2.2 3.5 5.3 6.7 2.8 3.3 6.1 6.2
United States 3.3 3.0 3.5 3.3 4.0 5.4 10.4 8.7
Argentina 1.6 1.3 1.8 2.6 3.3 2.4 2.9 3.9
Canada 1.0 0.6 0.6 0.5 0.5 0.5 0.8 0.7
Rest of World 31.8 31.2 30.8 29.9 31.2 31.5 2.6 2.6
Country 2010P 2011F
European Uniona 42.5 42.4
New Zealandb 20.9 21.2
Australiac 12.1 12.9
Ukraine 6.2 6.5
United States 12.0 10.5
Argentina 3.3 3.4
Canada 0.7 0.6
Rest of World 2.3 2.5
Source: U.S. Department of Agriculture, Foreign Agricultural Service Production, Supply and Distribution Online database, http://www.fas.usda.gov/psdonline/psdHome.aspx.
Notes: NA = Not Available.
P = Preliminary.
F = Forecast.
a. 1997-1998 data are EU-15 and 1999 to present are EU-27.
b. Year ending May 31 of the year shown.
c. Year ending June 30 of the year shown.

U.S. Agricultural Trade: Trends, Composition, Direction, and Policy
Congressional Research Service 33
Figure 17. Shares of World Butter Exports, 2011F
New Zealand 59%European Union
21%
Australia9%
Rest of World4%
United States6%
Ukraine0%
Canada 1%
Source: U.S. Department of Agriculture, Foreign Agricultural Service.
Note: F = Forecast.

U.S. Agricultural Trade: Trends, Composition, Direction, and Policy
Congressional Research Service 34
Table 17. Shares of World Butter Exports, 1994-2011F (percent)
Country 1994 1995 1996 1997 1998 1999 2000 2001
New Zealanda 20.2 19.3 21.0 42.1 50.2 34.1 37.0 36.3
European Unionb NA NA NA 29.2 26.8 24.5 21.4 21.7
Australiac 7.1 6.9 6.6 14.8 16.7 14.3 15.2 12.9
Ukraine 1.7 5.6 8.4 7.9 1.6 1.0 3.4 5.5
Canada 0.2 0.5 1.1 1.6 1.9 1.3 1.1 1.7
United States 7.1 5.2 1.7 2.4 0.5 0.2 0.4 0.0
Rest of World 63.7 62.5 61.1 2.0 2.2 24.5 21.5 21.9
Country 2002 2003 2004 2005 2006 2007 2008 2009
New Zealanda 35.9 33.5 31.6 27.8 35.7 40.2 50.9 60.1
European Unionb 23.4 27.0 27.9 29.9 24.2 19.8 21.1 20.8
Australiac 12.7 9.2 5.9 6.2 8.0 7.3 8.0 10.2
Ukraine 1.5 1.5 3.3 2.1 1.8 0.4 0.8 0.1
Canada 1.7 1.0 1.3 1.8 1.8 1.2 0.1 0.4
United States 0.3 1.0 0.7 0.5 1.1 3.7 12.3 2.2
Rest of World 24.3 26.7 29.2 31.8 27.4 27.5 6.8 6.3
Country 2010P 2011F
New Zealanda 55.9 58.5
European Unionb 24.8 20.9
Australiac 8.2 9.1
Ukraine 0.1 0.1
Canada 1.2 1.3
United States 7.0 6.3
Rest of World 2.7 3.7
Source: U.S. Department of Agriculture, Foreign Agricultural Service Production, Supply and Distribution Online database, http://www.fas.usda.gov/psdonline/psdHome.aspx.
Notes: NA = Not Available.
P = Preliminary.
F = Forecast.
a. Year ending May 31 of the year shown.
b. 1997-1998 data are EU-15 and 1999 to present are EU-27.
c. Year ending June 30 of the year shown.
U.S. Agricultural Trade: Trends, Composition, Direction, and Policy
Congressional Research Service 35
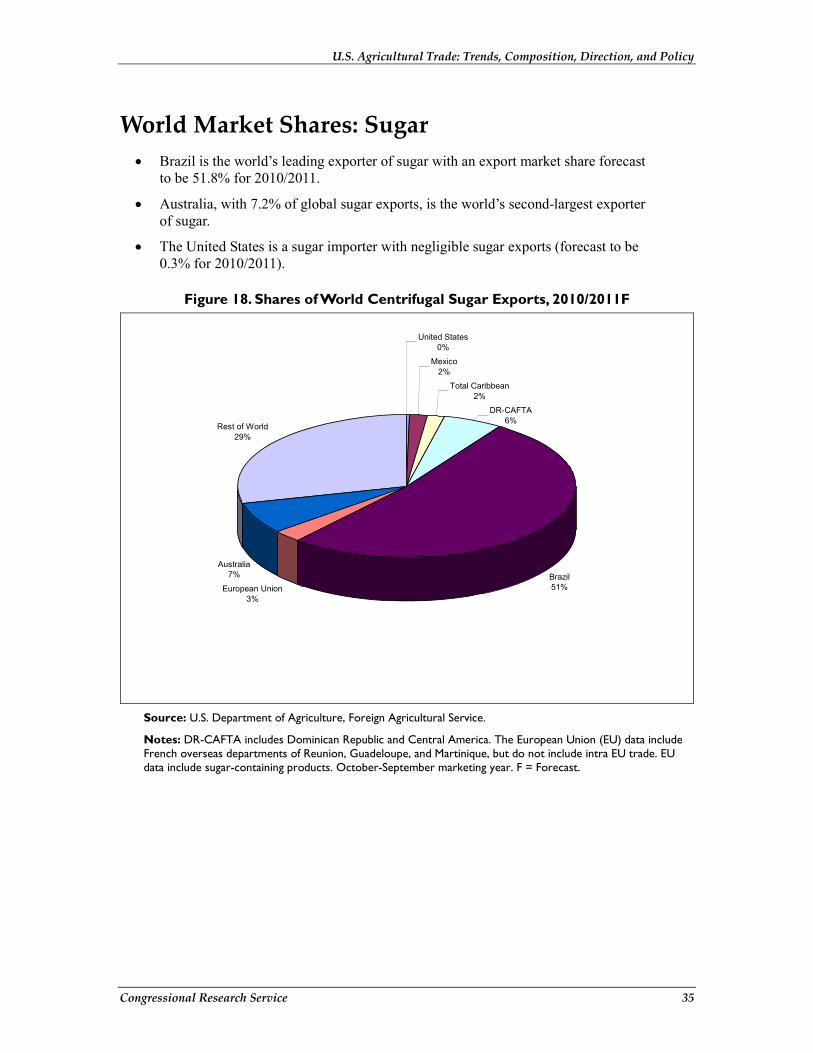
World Market Shares: Sugar • Brazil is the world’s leading exporter of sugar with an export market share forecast
to be 51.8% for 2010/2011.
• Australia, with 7.2% of global sugar exports, is the world’s second-largest exporter of sugar.
• The United States is a sugar importer with negligible sugar exports (forecast to be 0.3% for 2010/2011).
Figure 18. Shares of World Centrifugal Sugar Exports, 2010/2011F
United States0%
Mexico2%
Total Caribbean2%
DR-CAFTA 6%
Brazil51%European Union
3%
Australia7%
Rest of World29%
Source: U.S. Department of Agriculture, Foreign Agricultural Service.
Notes: DR-CAFTA includes Dominican Republic and Central America. The European Union (EU) data include French overseas departments of Reunion, Guadeloupe, and Martinique, but do not include intra EU trade. EU data include sugar-containing products. October-September marketing year. F = Forecast.
U.S. Agricultural Trade: Trends, Composition, Direction, and Policy
Congressional Research Service 36
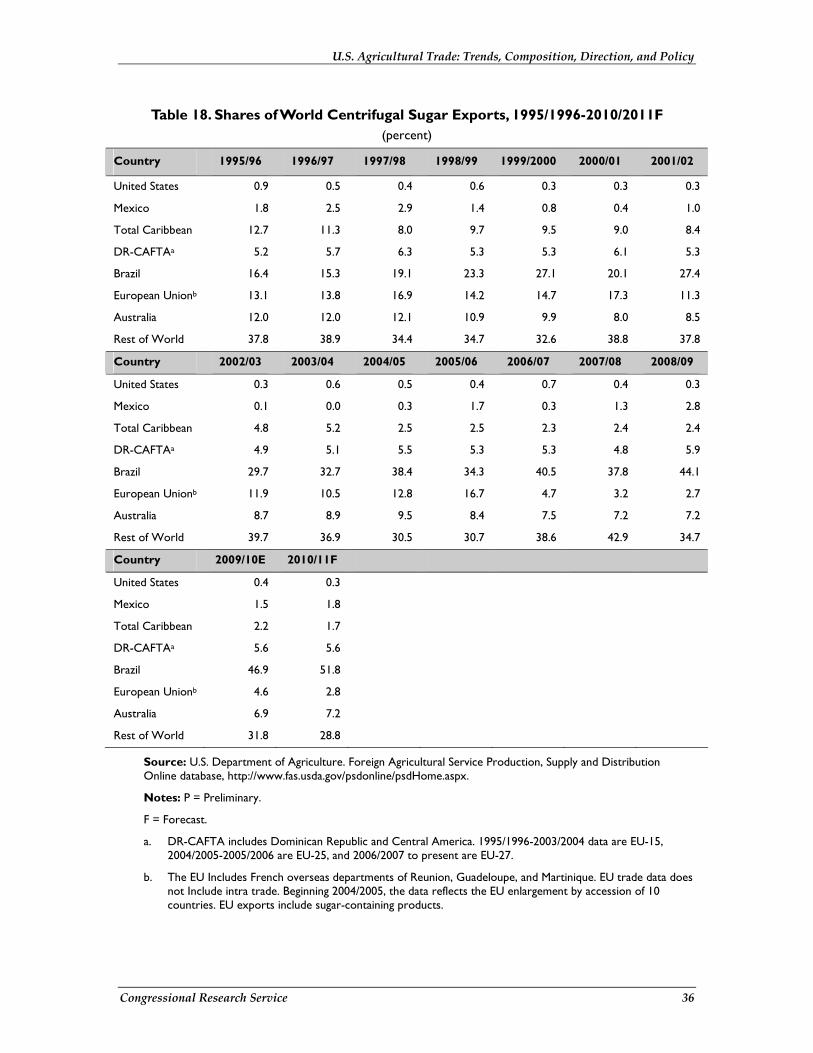
Table 18. Shares of World Centrifugal Sugar Exports, 1995/1996-2010/2011F (percent)
Country 1995/96 1996/97 1997/98 1998/99 1999/2000 2000/01 2001/02
United States 0.9 0.5 0.4 0.6 0.3 0.3 0.3
Mexico 1.8 2.5 2.9 1.4 0.8 0.4 1.0
Total Caribbean 12.7 11.3 8.0 9.7 9.5 9.0 8.4
DR-CAFTAa 5.2 5.7 6.3 5.3 5.3 6.1 5.3
Brazil 16.4 15.3 19.1 23.3 27.1 20.1 27.4
European Unionb 13.1 13.8 16.9 14.2 14.7 17.3 11.3
Australia 12.0 12.0 12.1 10.9 9.9 8.0 8.5
Rest of World 37.8 38.9 34.4 34.7 32.6 38.8 37.8
Country 2002/03 2003/04 2004/05 2005/06 2006/07 2007/08 2008/09
United States 0.3 0.6 0.5 0.4 0.7 0.4 0.3
Mexico 0.1 0.0 0.3 1.7 0.3 1.3 2.8
Total Caribbean 4.8 5.2 2.5 2.5 2.3 2.4 2.4
DR-CAFTAa 4.9 5.1 5.5 5.3 5.3 4.8 5.9
Brazil 29.7 32.7 38.4 34.3 40.5 37.8 44.1
European Unionb 11.9 10.5 12.8 16.7 4.7 3.2 2.7
Australia 8.7 8.9 9.5 8.4 7.5 7.2 7.2
Rest of World 39.7 36.9 30.5 30.7 38.6 42.9 34.7
Country 2009/10E 2010/11F
United States 0.4 0.3
Mexico 1.5 1.8
Total Caribbean 2.2 1.7
DR-CAFTAa 5.6 5.6
Brazil 46.9 51.8
European Unionb 4.6 2.8
Australia 6.9 7.2
Rest of World 31.8 28.8
Source: U.S. Department of Agriculture. Foreign Agricultural Service Production, Supply and Distribution Online database, http://www.fas.usda.gov/psdonline/psdHome.aspx.
Notes: P = Preliminary.
F = Forecast.
a. DR-CAFTA includes Dominican Republic and Central America. 1995/1996-2003/2004 data are EU-15, 2004/2005-2005/2006 are EU-25, and 2006/2007 to present are EU-27.
b. The EU Includes French overseas departments of Reunion, Guadeloupe, and Martinique. EU trade data does not Include intra trade. Beginning 2004/2005, the data reflects the EU enlargement by accession of 10 countries. EU exports include sugar-containing products.
U.S. Agricultural Trade: Trends, Composition, Direction, and Policy
Congressional Research Service 37
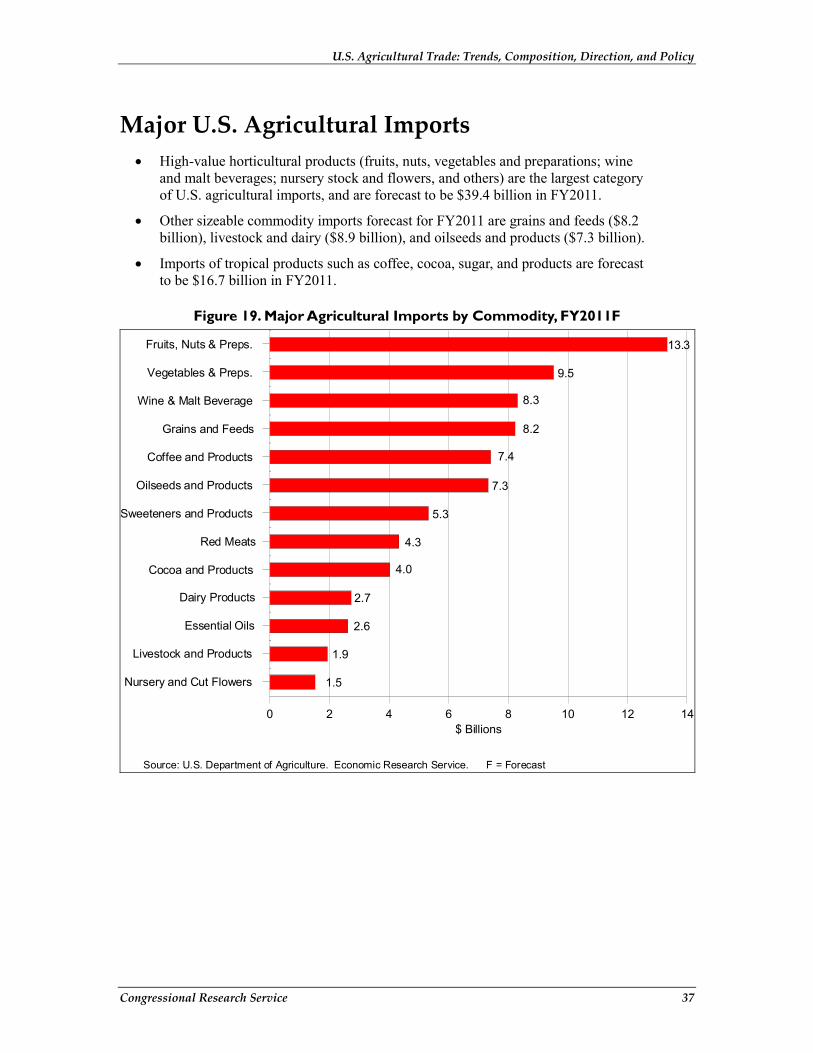
Major U.S. Agricultural Imports • High-value horticultural products (fruits, nuts, vegetables and preparations; wine
and malt beverages; nursery stock and flowers, and others) are the largest category of U.S. agricultural imports, and are forecast to be $39.4 billion in FY2011.
• Other sizeable commodity imports forecast for FY2011 are grains and feeds ($8.2 billion), livestock and dairy ($8.9 billion), and oilseeds and products ($7.3 billion).
• Imports of tropical products such as coffee, cocoa, sugar, and products are forecast to be $16.7 billion in FY2011.
Figure 19. Major Agricultural Imports by Commodity, FY2011F
1.5
1.9
2.6
2.7
4.0
4.3
5.3
7.3
7.4
8.2
8.3
9.5
13.3
$ Billions
Nursery and Cut Flowers
Livestock and Products
Essential Oils
Dairy Products
Cocoa and Products
Red Meats
Sweeteners and Products
Oilseeds and Products
Coffee and Products
Grains and Feeds
Wine & Malt Beverage
Vegetables & Preps.
Fruits, Nuts & Preps.
0 2 4 6 8 10 12 14
Source: U.S. Department of Agriculture. Economic Research Service. F = Forecast

U.S. Agricultural Trade: Trends, Composition, Direction, and Policy
Congressional Research Service 38
Table 19. Major U.S. Agricultural Imports, FY2011F ($ billions)
Commodity FY2011F
Fruits, Nuts & Preps. 13.3
Vegetables & Preps. 9.5
Wine & Malt Beverage 8.3
Grains and Feeds 8.2
Coffee and Products 7.4
Oilseeds and Products 7.3
Sweeteners and Products 5.3
Red Meats 4.3
Cocoa and Products 4.0
Dairy Products 2.7
Essential Oils 2.6
Livestock and Products 1.9
Nursery and Cut Flowers 1.5
Source: U.S. Department of Agriculture, Economic Research Service, Outlook for U.S. Agricultural Trade, AES-70, May 26, 2011, available at http://usda.mannlib.cornell.edu/usda/ers/AES//2010s/2011/AES-05-26-2011.pdf.
Note: F = Forecast.

U.S. Agricultural Trade: Trends, Composition, Direction, and Policy
Congressional Research Service 39
U.S. Agricultural Imports by Country of Origin • NAFTA partners Canada ($17.8 billion) and Mexico ($15.9 billion) and the EU-27
($14.5 billion) are forecast to be the source of more than 50% of total U.S. agricultural imports ($93 billion) in FY2011.
• Agricultural imports from Brazil are expected to reach a forecast $3.4 billion in FY2011; Indonesia is expected to ship $3.7 billion of farm products to the United States in FY2011.
• Australia, with whom the United States entered into a free trade agreement (FTA) in 2005, is forecast to provide the United States with $2.2 billion worth of agricultural imports in FY2011. Colombia, a prospective FTA partner, is forecast to ship $2.6 billion of farm products to the United States in FY2011.
Figure 20. U.S. Agricultural Imports by Country of Origin, FY2009-FY2011F
1.8
1.8
2.4
2
2.5
13.6
11.3
15.4
1.6
1.9
2.3
2.6
2.6
14.2
13
15.7
1.9
2.6
2.2
3.7
3.4
15.5
15.9
17.8
$ Billions
New Zealand
Colombia
Australia
Indonesia
Brazil
European Union
Mexico
Canada
0 5 10 15 20
2011F 2010 2009
Source: U.S. Department of Agriculture. Economic Research Service. F = Forecast

U.S. Agricultural Trade: Trends, Composition, Direction, and Policy
Congressional Research Service 40
Table 20. U.S. Agricultural Imports by Country of Origin, FY2009-FY2011F ($ billion)
Country FY2009 FY2010 FY2011F
Canada 15.4 15.7 17.8
Mexico 11.3 13.0 15.9
European Union 13.6 14.2 15.5
Brazil 2.5 2.6 3.4
Indonesia 2.0 2.6 3.7
Australia 2.4 2.3 2.2
Colombia 1.8 1.9 2.6
New Zealand 1.8 1.6 1.9
Source: U.S. Department of Agriculture, Economic Research Service, Outlook for U.S. Agricultural Trade, AES-70, May 26, 2011, available at http://usda.mannlib.cornell.edu/usda/ers/AES//2010s/2011/AES-05-26-2011.pdf.
Notes: F = Forecast.

U.S. Agricultural Trade: Trends, Composition, Direction, and Policy
Congressional Research Service 41
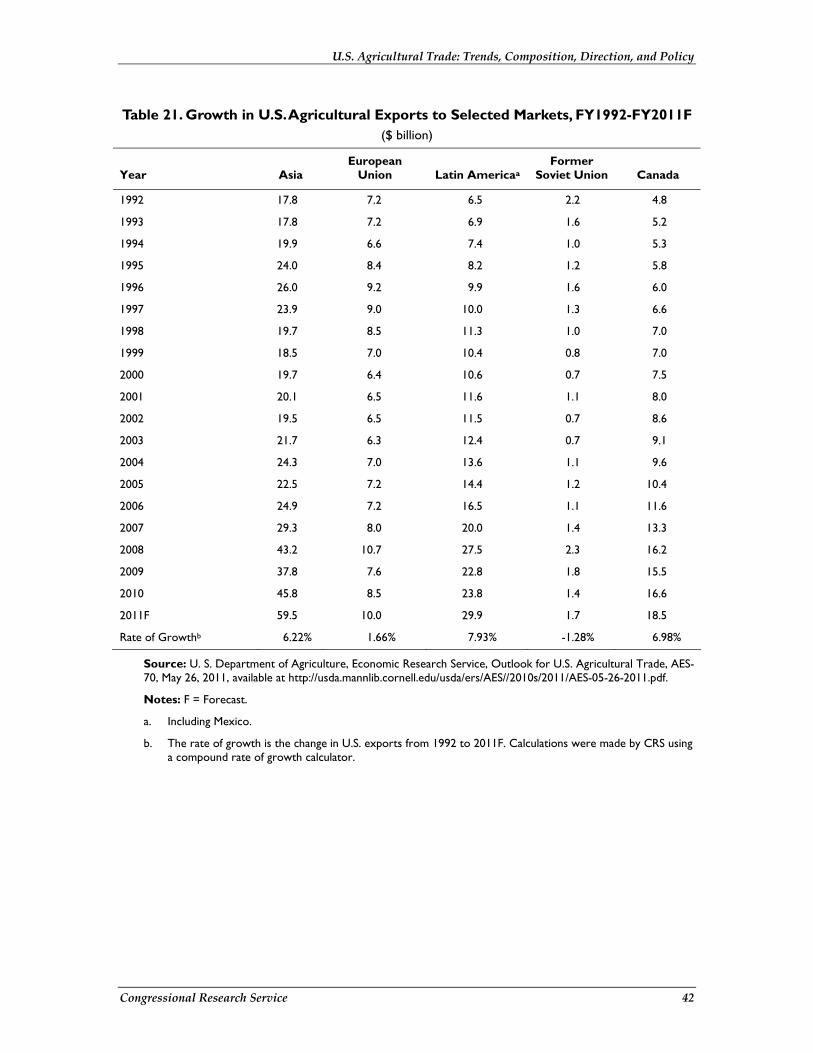
Regional Market Growth in U.S. Agricultural Exports • Economic growth in Asia has contributed to relatively consistent long-term growth
in U.S. agricultural exports to the region.
• Despite some year-to-year variation, the EU, the United States’ fifth-largest agricultural export market, has been a relatively stable market for U.S. agricultural exports with little growth since 1992.
• Agricultural exports to countries in the former Soviet Union have declined in value since the 1992 break-up of the USSR.
• Agricultural exports to Latin America, including Mexico, and to Canada have grown rapidly since the early 1990s due in part to geographic proximity and NAFTA, among other factors.
Figure 21. Growth in U.S. Agricultural Exports, FY1992-FY2011F
Source: U.S. Department of Agriculture. Economic Research Service. F = Forecast
1992 1994 1996 1998 2000 2002 2004 2006 2008 20100
20
40
60
80
100
120
Canada Former Soviet Union Latin AmericaEuropean Union Asia
U.S. Agricultural Trade: Trends, Composition, Direction, and Policy
Congressional Research Service 42
Table 21. Growth in U.S. Agricultural Exports to Selected Markets, FY1992-FY2011F ($ billion)
Year Asia European
Union Latin Americaa Former
Soviet Union Canada
1992 17.8 7.2 6.5 2.2 4.8
1993 17.8 7.2 6.9 1.6 5.2
1994 19.9 6.6 7.4 1.0 5.3
1995 24.0 8.4 8.2 1.2 5.8
1996 26.0 9.2 9.9 1.6 6.0
1997 23.9 9.0 10.0 1.3 6.6
1998 19.7 8.5 11.3 1.0 7.0
1999 18.5 7.0 10.4 0.8 7.0
2000 19.7 6.4 10.6 0.7 7.5
2001 20.1 6.5 11.6 1.1 8.0
2002 19.5 6.5 11.5 0.7 8.6
2003 21.7 6.3 12.4 0.7 9.1
2004 24.3 7.0 13.6 1.1 9.6
2005 22.5 7.2 14.4 1.2 10.4
2006 24.9 7.2 16.5 1.1 11.6
2007 29.3 8.0 20.0 1.4 13.3
2008 43.2 10.7 27.5 2.3 16.2
2009 37.8 7.6 22.8 1.8 15.5
2010 45.8 8.5 23.8 1.4 16.6
2011F 59.5 10.0 29.9 1.7 18.5
Rate of Growthb 6.22% 1.66% 7.93% -1.28% 6.98%
Source: U. S. Department of Agriculture, Economic Research Service, Outlook for U.S. Agricultural Trade, AES-70, May 26, 2011, available at http://usda.mannlib.cornell.edu/usda/ers/AES//2010s/2011/AES-05-26-2011.pdf.
Notes: F = Forecast.
a. Including Mexico.
b. The rate of growth is the change in U.S. exports from 1992 to 2011F. Calculations were made by CRS using a compound rate of growth calculator.

U.S. Agricultural Trade: Trends, Composition, Direction, and Policy
Congressional Research Service 43
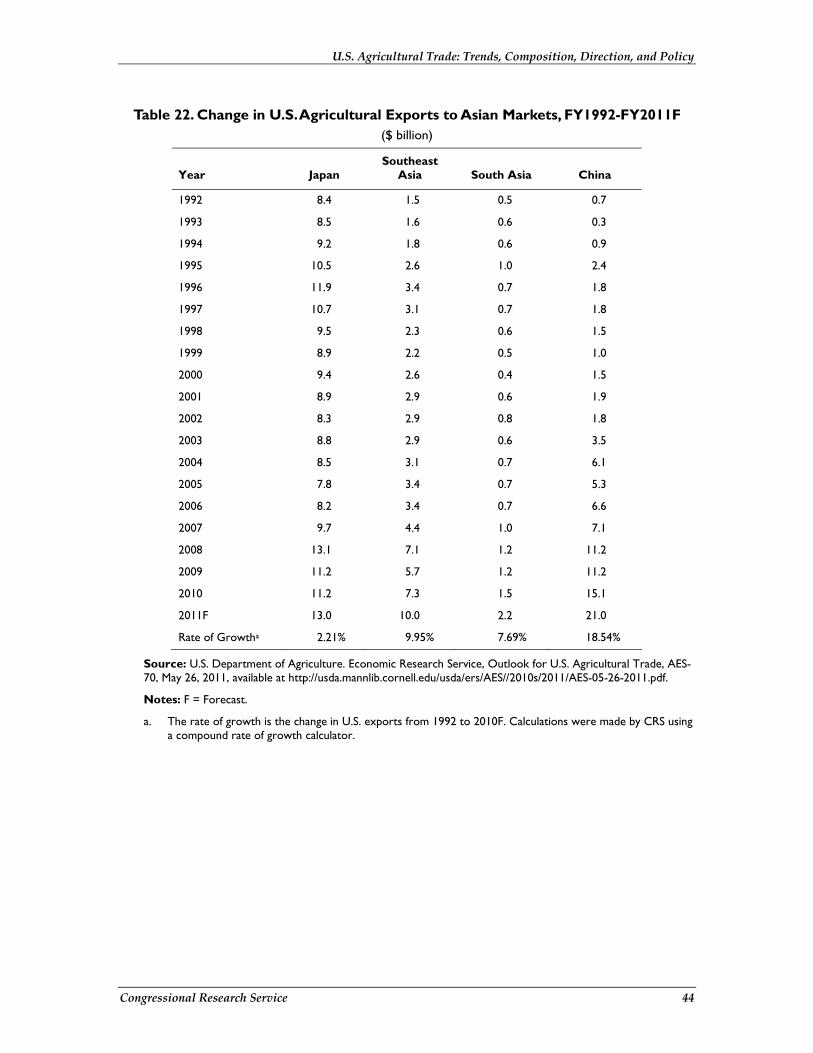
Growth in U.S. Agricultural Exports to Asian Markets • Like the EU, Japan also has been a relatively stable and slow-growing market for
U.S. agricultural exports.
• U.S. agricultural exports to China, fueled by rates of GDP growth in excess of 9%, have grown rapidly since the early 1990s (18.54%). FY2011 U.S. agricultural exports to China are forecast to be more than 10 times their value in FY2001, when China became a member of the World Trade Organization.
• Rapid income growth in Southeast Asia also has stimulated demand for U.S. agricultural exports since 1992.
• Agricultural exports to South Asia also have shown growth since 1992.
Figure 22. Growth in Agricultural Exports to Asian Markets, FY1992-FY2011F
Source: U.S. Department of Agriculture. Economic Research Service. F = Forecast
1992 1994 1996 1998 2000 2002 2004 2006 2008 20100
10
20
30
40
50
China South AsiaSoutheast Asia Japan
U.S. Agricultural Trade: Trends, Composition, Direction, and Policy
Congressional Research Service 44
Table 22. Change in U.S. Agricultural Exports to Asian Markets, FY1992-FY2011F ($ billion)
Year Japan Southeast
Asia South Asia China
1992 8.4 1.5 0.5 0.7
1993 8.5 1.6 0.6 0.3
1994 9.2 1.8 0.6 0.9
1995 10.5 2.6 1.0 2.4
1996 11.9 3.4 0.7 1.8
1997 10.7 3.1 0.7 1.8
1998 9.5 2.3 0.6 1.5
1999 8.9 2.2 0.5 1.0
2000 9.4 2.6 0.4 1.5
2001 8.9 2.9 0.6 1.9
2002 8.3 2.9 0.8 1.8
2003 8.8 2.9 0.6 3.5
2004 8.5 3.1 0.7 6.1
2005 7.8 3.4 0.7 5.3
2006 8.2 3.4 0.7 6.6
2007 9.7 4.4 1.0 7.1
2008 13.1 7.1 1.2 11.2
2009 11.2 5.7 1.2 11.2
2010 11.2 7.3 1.5 15.1
2011F 13.0 10.0 2.2 21.0
Rate of Growtha 2.21% 9.95% 7.69% 18.54%
Source: U.S. Department of Agriculture. Economic Research Service, Outlook for U.S. Agricultural Trade, AES-70, May 26, 2011, available at http://usda.mannlib.cornell.edu/usda/ers/AES//2010s/2011/AES-05-26-2011.pdf.
Notes: F = Forecast.
a. The rate of growth is the change in U.S. exports from 1992 to 2010F. Calculations were made by CRS using a compound rate of growth calculator.

U.S. Agricultural Trade: Trends, Composition, Direction, and Policy
Congressional Research Service 45
Growth in Agricultural Exports to North and South America • Growth in U.S. agricultural trade with Canada and Mexico, both NAFTA trading
partners, and with Latin America has been particularly strong since 1992.
• U.S. agricultural exports to Canada are forecast to be $18.5 billion in FY2011.
• U.S. agricultural exports to Mexico are expected to be $17 billion in FY2011.
• U.S. agricultural exports to Latin America (excluding Mexico) are expected to reach $12.9 billion in FY2011, up from $9.9 billion in FY2010.
Figure 23. Change in Agricultural Exports to North and South America, FY1992-FY2011F
Source: U.S. Department of Agriculture. Economic Research Service. F = Forecast
1992 1994 1996 1998 2000 2002 2004 2006 2008 20100
20
40
60
80
100
NAFTA MexicoCanada Latin America ex. Mexico

U.S. Agricultural Trade: Trends, Composition, Direction, and Policy
Congressional Research Service 46
Table 23. Change in Agricultural Exports to North and South America, FY1992-FY2011F
($ billion)
Year Latin America
ex. Mexico Canada Mexico NAFTA
1992 2.8 4.8 3.7 8.5
1993 3.3 5.2 3.7 8.9
1994 3.2 5.3 4.1 9.4
1995 4.5 5.8 3.7 9.5
1996 4.9 6.6 5.1 11.7
1997 4.9 6.6 5.1 11.7
1998 5.3 7.0 6.0 13.0
1999 4.7 7.0 5.7 12.7
2000 4.3 7.5 6.3 13.8
2001 4.3 8.0 7.3 15.3
2002 4.5 8.6 7.1 15.7
2003 4.8 9.1 7.6 16.7
2004 5.2 9.6 8.4 18.0
2005 5.2 10.4 9.3 19.7
2006 6.1 11.6 10.4 22.0
2007 7.7 13.3 12.3 25.6
2008 12.0 16.2 15.6 31.8
2009 9.3 15.5 13.5 29.0
2010 9.9 16.6 13.9 30.5
2011F 12.9 18.5 17.0 35.5
Rate of Growtha 7.94% 6.98% 7.92% 7.41%
Source: U.S. Department of Agriculture, Economic Research Service, Outlook for U.S. Agricultural Trade, AES-70, May 26, 2011, available at http://usda.mannlib.cornell.edu/usda/ers/AES//2010s/2011/AES-05-26-2011.pdf.
Notes: F = Forecast.
a. The rate of growth is the change in U.S. exports from 1992 to 2011F. Calculations were made by CRS using a compound rate of growth calculator.
U.S. Agricultural Trade: Trends, Composition, Direction, and Policy
Congressional Research Service 47
U.S. Agricultural and Trade Policies Domestic Support The Food, Conservation, and Energy Act of 2008 (P.L. 110-246, 2008 farm bill) was enacted into law in June 2008 and will govern most federal farm and food policies through 2012. The 2008 farm bill provides price and income support to U.S. agricultural producers through 2012. In addition, the farm bill authorizes programs for conservation, rural development, nutrition (domestic food assistance), trade, and food aid administered by USDA. Budgetary outlays for all U.S. agricultural programs were $129.5 billion in FY2010.1
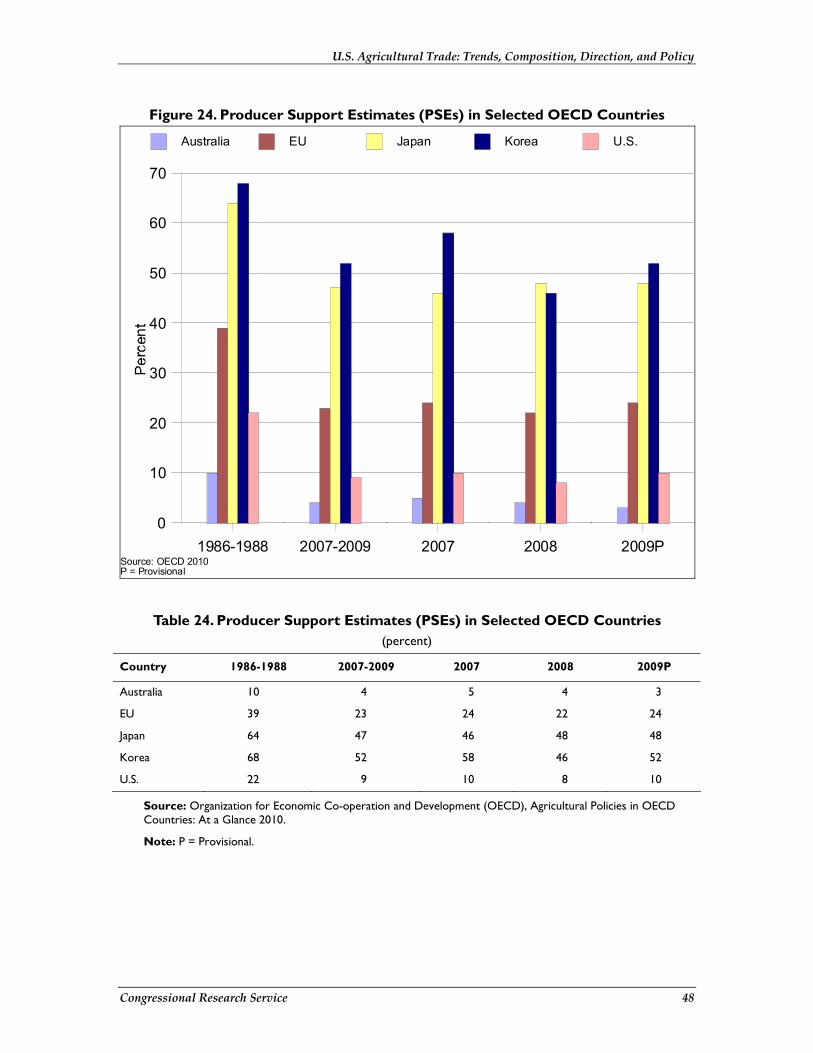
By one widely used measure, the producer support estimate (PSE) calculated by the Organization for Economic Cooperation and Development (OECD), the United States provided an estimated $30.6 billion in agricultural support to producers in 2009 (provisional estimate).2 PSEs measure assistance to producers in terms of the value of monetary transfers generated by agricultural policy. Transfers are paid by consumers or by taxpayers in the form of market price support, direct payments, or other support. They are a broader measure of support than direct government spending alone. The percentage PSE measures support in relation to gross farm receipts. As a percent of gross farm receipts, the PSE for the United States is 10% in 2009, the third-lowest among OECD countries (Figure 24, Table 24). OECD attributes an increase of 2% (over 2008) in the PSE expected for the United States for 2009 to an increase in market price support for dairy. Over a longer period, the trend in producer support in the United States has been downward, dropping from a PSE of 22% in 1986-1988 to 10% in 2009. Among U.S. commodities, sugar is the most highly subsidized product in the United States, with a provisional single commodity transfer estimated at 21% of the gross value of sugar production in 2009 (Figure 25, Table 25).
1 U.S. Department of Agriculture, at http://www.obpa.usda.gov/budsum/FY12budsum.pdf. 2 OECD countries include Australia, Canada, the European Union, Iceland, Japan, Korea, New Zealand, Norway, Switzerland, Turkey, and the United States.
U.S. Agricultural Trade: Trends, Composition, Direction, and Policy
Congressional Research Service 48
Figure 24. Producer Support Estimates (PSEs) in Selected OECD Countries
1986-1988 2007-2009 2007 2008 2009P0
10
20
30
40
50
60
70
Australia EU Japan Korea U.S.
Source: OECD 2010P = Provisional
Table 24. Producer Support Estimates (PSEs) in Selected OECD Countries (percent)
Country 1986-1988 2007-2009 2007 2008 2009P
Australia 10 4 5 4 3
EU 39 23 24 22 24
Japan 64 47 46 48 48
Korea 68 52 58 46 52
U.S. 22 9 10 8 10
Source: Organization for Economic Co-operation and Development (OECD), Agricultural Policies in OECD Countries: At a Glance 2010.
Note: P = Provisional.

U.S. Agricultural Trade: Trends, Composition, Direction, and Policy
Congressional Research Service 49
Figure 25. Producer Single Commodity Transfers (PSCs): Selected Commodities in the United States
1986-88 2007-2009 2007 2008 2009P-10
0
10
20
30
40
50
60
Wheat Corn RiceSoybeans Sugar MilkBeef and Veal
Source: OECD 2010P = Provisional
Table 25. Producer Single Commodity Transfers (PSC) in the United States, by Commodity
(percent)
Products 1986-1988 (Average) 2007-2009 2007 2008 2009P
Wheat 46.5 6.1 7.6 0.2 14.4
Corn 34.8 0.6 0.5 2.8 -0.5
Rice 50.2 0.6 0.7 0.4 1.1
Soybeans 1.7 1.8 0.6 5.6 -0.8
Sugar 55.9 27.3 34.1 26.3 20.8
Milk 34.9 13.0 24.8 0.0 14.3
Beef and Veal 1.1 0.0 0.0 0.0 0.0
Source: Organization for Economic Cooperation and Development (OECD), Agricultural Policies in OECD Countries: At a Glance 2010.
Note: P = Provisional.

U.S. Agricultural Trade: Trends, Composition, Direction, and Policy
Congressional Research Service 50
Trade Measures With agricultural exports totaling $137 billion in FY2011, the United States is the world’s largest exporter of agricultural products. The United States applies tariffs and tariff quotas3 to products entering the United States from abroad. According to the World Trade Organization (WTO), the United States average applied tariff for agricultural products is 8.9%, which is slightly above the average applied U.S. tariff for non-agricultural products (4%), but relatively low compared to other WTO member countries.4 About 170 tariff lines (a tariff line is a product as described in a schedule or list of tariffs) are subject to tariff quotas, including beef, dairy products, and sugar. The average in-quota tariff was 9.1% in 2007, while the out-of-quota was 42%.5
Under the WTO Agreement on Agriculture, the United States made export subsidy reduction commitments for 13 commodities.6 The 2008 farm bill repealed authority for the Export Enhancement Program (EEP), which was used to fund subsidies for those products, with the exception of dairy products. Export subsidies, in the form of cash bonuses, can be provided to exporters of dairy products under the Dairy Export Incentive Program (DEIP), which was reauthorized in the 2008 farm bill through 2012. Prior to its repeal, no expenditures were made for EEP from FY2002. Spurred by declining prices for dairy products in 2008-2009, USDA announced in May 2009 DEIP allocations for nonfat dry milk, butter fat, and cheeses. DEIP bonuses of $19 million were awarded in FY2009. In FY2010, DEIP bonuses of $2 million were awarded.
A federally chartered public corporation operated by USDA, the Commodity Credit Corporation (CCC), makes credit guarantees available to private financial institutions who finance the purchase of U.S. agricultural exports. Under the GSM-102, the CCC guarantees repayment of credit made available to finance U.S. agricultural exports on credit terms of up to three years. Exporters tallied $3.1 billion of agricultural exports under the GSM-102 program. The CCC also operates the Facilities Guarantee Program (FGP), which guarantees credit to U.S. banks that finance export sales of U.S. goods and services that are used to improve agricultural export-related facilities in emerging markets (storage, processing, and handling facilities).
Export market development programs, the Market Access Program (MAP), and the Foreign Market Development Program (FMDP) assist producer groups, associations, and firms with promotional and other activities.
Food Aid The United States is the world’s leading supplier of food aid. It provides more than half of the global total.
3 A tariff quota is defined by WTO as a trade measure applied at the border where quantities inside a quota are charged lower import duty rates than those outside (which can be high). 4 WTO, Trade Policy Review: United States 20108, p. 90, available at http://www.wto.org/english/tratop_e/tpr_e/tp_rep_e.htm#bycountry. 5 Ibid, p. 81. 6 Wheat and wheat flour, coarse grains, rice, vegetable oils, butter and butter oil, skim milk powder, cheese, other milk products, bovine meat, pigmeat, poultry meat, live dairy cattle, and eggs.
U.S. Agricultural Trade: Trends, Composition, Direction, and Policy
Congressional Research Service 51
The United States provides food aid mainly through P.L. 480, also known as the Food for Peace Program. Wheat and wheat flour are the main commodities provided as food aid, but rice and vegetable oils are also important in P.L. 480 programs. Higher-value products are made available in special feeding programs. Responsibility for implementing food aid programs is shared by USDA and the U.S. Agency for International Development (AID).
P.L. 480 food aid is provided on a grant basis through Title II of the Food for Peace Act of 2008, the successor legislation of the Agricultural Trade and Development Assistance Act of 1954 (P.L. 480). Two other food aid programs are conducted under Section 416(b) of the Agricultural Act of 1949 and the Food for Progress Act of 1985. The former provides surplus CCC inventories, if available, as donations; the latter provides concessional credit terms or commodity donations to support emerging democracies or countries making free market economic reforms. A recently enacted food aid program, the McGovern-Dole School Food for Education Program, finances school feeding and child nutrition projects in poor countries.
Author Contact Information Charles E. Hanrahan Senior Specialist in Agricultural Policy [email protected], 7-7235
Beverly A. Banks Acquisitions Assistant [email protected], 7-3485
Carol Canada Information Research Specialist [email protected], 7-7619