
Trends and cyclical variation in the incidence of ... · 2003, 2004–2008 and 2009–2013. The...
10
ARTICLE Trends and cyclical variation in the incidence of childhood type 1 diabetes in 26 European centres in the 25 year period 1989–2013: a multicentre prospective registration study Christopher C. Patterson 1 & Valma Harjutsalo 2 & Joachim Rosenbauer 3 & Andreas Neu 4 & Ondrej Cinek 5 & Torild Skrivarhaug 6 & Birgit Rami-Merhar 7 & Gyula Soltesz 8 & Jannet Svensson 9 & Roger C. Parslow 10 & Conxa Castell 11 & Eugen J. Schoenle 12 & Polly J. Bingley 13 & Gisela Dahlquist 14 & Przemysława K. Jarosz-Chobot 15 & Dalė Marčiulionytė 16,17 & Edna F. Roche 18 & Ulrike Rothe 19 & Natasa Bratina 20 & Constantin Ionescu-Tirgoviste 21 & Ilse Weets 22 & Mirjana Kocova 23 & Valentino Cherubini 24 & Natasa Rojnic Putarek 25 & Carine E. deBeaufort 26 & Mira Samardzic 27 & Anders Green 28 Received: 14 August 2018 /Accepted: 28 September 2018 /Published online: 28 November 2018 # The Author(s) 2018 Abstract Aims/hypothesis Against a background of a near-universally increasing incidence of childhood type 1 diabetes, recent reports from some countries suggest a slowing in this increase. Occasional reports also describe cyclical variations in incidence, with periodicities of between 4 and 6 years. Methods Age/sex-standardised incidence rates for the 0- to 14-year-old age group are reported for 26 European centres (representing 22 countries) that have registered newly diagnosed individuals in geographically defined regions for up to 25 years during the period 1989–2013. Poisson regression was used to estimate rates of increase and test for cyclical patterns. Joinpoint regression software was used to fit segmented log-linear relationships to incidence trends. Results Significant increases in incidence were noted in all but two small centres, with a maximum rate of increase of 6.6% per annum in a Polish centre. Several centres in high-incidence countries showed reducing rates of increase in more recent years. Despite this, a pooled analysis across all centres revealed a 3.4% (95% CI 2.8%, 3.9%) per annum increase in incidence rate, although there was some suggestion of a reduced rate of increase in the 2004–2008 period. Rates of increase were similar in boys and girls in the 0- to 4-year-old age group (3.7% and 3.7% per annum, respectively) and in the 5- to 9-year-old age group (3.4% and 3.7% per annum, respectively), but were higher in boys than girls in the 10- to 14-year-old age group (3.3% and 2.6% per annum, respectively). Significant 4 year periodicity was detected in four centres, with three centres showing that the most recent peak in fitted rates occurred in 2012. Conclusions/interpretation Despite reductions in the rate of increase in some high-risk countries, the pooled estimate across centres continues to show a 3.4% increase per annum in incidence rate, suggesting a doubling in incidence rate within approx- imately 20 years in Europe. Although four centres showed support for a cyclical pattern of incidence with a 4 year periodicity, no plausible explanation for this can be given. Keywords Cyclical variation . Epidemiology . Incidence . Temporal change . Type 1 diabetes mellitus Introduction The increasing incidence of childhood type 1 diabetes has been well documented both in Europe, with an estimated an- nual increase of 3.9% (95% CI 3.6%, 4.2%) during the period 1989–2003 [1], and worldwide, with an estimated annual in- crease of 2.8% (95% CI 2.4%, 3.2%) in the period 1990–1999 [2]. Recent reports have, however, suggested a slowing or stabilisation in the rate of increase. Electronic supplementary material The online version of this article (https://doi.org/10.1007/s00125-018-4763-3) contains peer-reviewed but unedited supplementary material, which is available to authorised users. * Christopher C. Patterson [email protected] Extended author information available on the last page of the article Diabetologia (2019) 62:408–417 https://doi.org/10.1007/s00125-018-4763-3
Transcript of Trends and cyclical variation in the incidence of ... · 2003, 2004–2008 and 2009–2013. The...

ARTICLE
Trends and cyclical variation in the incidence of childhood type 1diabetes in 26 European centres in the 25 year period 1989–2013:a multicentre prospective registration study
Christopher C. Patterson1& Valma Harjutsalo2
& Joachim Rosenbauer3 & Andreas Neu4& Ondrej Cinek5 &
Torild Skrivarhaug6& Birgit Rami-Merhar7 & Gyula Soltesz8 & Jannet Svensson9
& Roger C. Parslow10& Conxa Castell11 &
Eugen J. Schoenle12 & Polly J. Bingley13 & Gisela Dahlquist14 & Przemysława K. Jarosz-Chobot15 &
Dalė Marčiulionytė16,17& Edna F. Roche18
& Ulrike Rothe19& Natasa Bratina20 & Constantin Ionescu-Tirgoviste21
&
Ilse Weets22 & Mirjana Kocova23 & Valentino Cherubini24 & Natasa Rojnic Putarek25 & Carine E. deBeaufort26 &
Mira Samardzic27 & Anders Green28
Received: 14 August 2018 /Accepted: 28 September 2018 /Published online: 28 November 2018# The Author(s) 2018
AbstractAims/hypothesis Against a background of a near-universally increasing incidence of childhood type 1 diabetes, recent reportsfrom some countries suggest a slowing in this increase. Occasional reports also describe cyclical variations in incidence, withperiodicities of between 4 and 6 years.Methods Age/sex-standardised incidence rates for the 0- to 14-year-old age group are reported for 26 European centres(representing 22 countries) that have registered newly diagnosed individuals in geographically defined regions for up to 25 yearsduring the period 1989–2013. Poisson regression was used to estimate rates of increase and test for cyclical patterns. Joinpointregression software was used to fit segmented log-linear relationships to incidence trends.Results Significant increases in incidence were noted in all but two small centres, with a maximum rate of increase of 6.6% perannum in a Polish centre. Several centres in high-incidence countries showed reducing rates of increase in more recent years.Despite this, a pooled analysis across all centres revealed a 3.4% (95% CI 2.8%, 3.9%) per annum increase in incidence rate,although there was some suggestion of a reduced rate of increase in the 2004–2008 period. Rates of increase were similar in boysand girls in the 0- to 4-year-old age group (3.7% and 3.7% per annum, respectively) and in the 5- to 9-year-old age group (3.4%and 3.7% per annum, respectively), but were higher in boys than girls in the 10- to 14-year-old age group (3.3% and 2.6% perannum, respectively). Significant 4 year periodicity was detected in four centres, with three centres showing that the most recentpeak in fitted rates occurred in 2012.Conclusions/interpretation Despite reductions in the rate of increase in some high-risk countries, the pooled estimate acrosscentres continues to show a 3.4% increase per annum in incidence rate, suggesting a doubling in incidence rate within approx-imately 20 years in Europe. Although four centres showed support for a cyclical pattern of incidence with a 4 year periodicity, noplausible explanation for this can be given.
Keywords Cyclical variation . Epidemiology . Incidence . Temporal change . Type 1 diabetesmellitus
Introduction
The increasing incidence of childhood type 1 diabetes hasbeen well documented both in Europe, with an estimated an-nual increase of 3.9% (95% CI 3.6%, 4.2%) during the period1989–2003 [1], and worldwide, with an estimated annual in-crease of 2.8% (95%CI 2.4%, 3.2%) in the period 1990–1999[2]. Recent reports have, however, suggested a slowing orstabilisation in the rate of increase.
Electronic supplementary material The online version of this article(https://doi.org/10.1007/s00125-018-4763-3) contains peer-reviewed butunedited supplementary material, which is available to authorised users.
* Christopher C. [email protected]
Extended author information available on the last page of the article
Diabetologia (2019) 62:408–417https://doi.org/10.1007/s00125-018-4763-3

In the USA, pooled data from five centres for children andadolescents under 20 years of age indicated a 1.8% (95% CI1.0%, 2.6%) annual increase during 2002–2012 after adjust-ment for age, sex and race or ethnic group [3], and a similarrate of increase of 1.3% (95% CI 0.0%, 2.5%) has been re-ported for the Canadian province of British Columbia in theperiod 2002–2013 [4]. In Australia, a non-significant annualincrease of 0.4% (95% CI −0.1%, 0.9%) was reported in theunder-15-year-old population during the period 2000–2011,although a significant increase of 1.2% (95% CI 0.4%,2.1%) was observed in the 10- to 14-year-old age group [5].Within Europe, no increase was found in Sweden during theperiod 2005–2007 despite a prolonged period of uniform in-crease during the previous 15 years [6]. Very similar levellingincidence rates, beginning at about the same time and with lon-ger periods of observation, were subsequently reported in twoother high-incidence Scandinavian countries, Finland [7] andNorway [8]. In contrast, a report from Zhejiang province in thelow-incidence region of China described a very rapid 12.0%(95%CI 7.6%, 16.6%) increase in annual incidence rate amongthose aged under 20 years during the period 2007–2013 [9].
There have also been reports in the literature of a cyclicalvariation in year-to-year incidence rates. The earliest reportwas from the Yorkshire regional registry in England duringthe period 1978–1990, which described a marked epidemicpattern with peaks at 4 year intervals [10]. A subsequent briefreport from a neighbouring area of north-east England in theperiod 1990–2007 described a 6 year cyclical pattern with anamplitude of ±25% [11], but there is no established register inthe region and no support for the claim of high ascertainment.
A sinusoidal cyclical pattern with peaks observed every5 years and an amplitude of ±14% has also been reported fromWestern Australia for the period 1985–2010 [12], and wassubsequently replicated in an Australia-wide analysis duringthe period 2000–2011 [5]. A report from five regions ofPoland during the period 1989–2012 using Fourier seriesmethods found a 5.33 year periodicity in rates, with an ampli-tude of ±8% [13].
To help clarify the recent trends in European incidencerates, an analysis of EURODIAB registry data from over84,000 children in 26 European centres representing 22 coun-tries is presented for the 25 year period 1989–2013, with sep-arate estimates of incidence rate increases derived in each offive subperiods. This dataset also provides an excellent oppor-tunity to investigate the claims of cyclical variation in inci-dence rates.
Methods
The establishment of the registries and case definition usedhas previously been described [14]. Type 1 diabetes was de-fined on the basis of a clinical diagnosis made by a physician,omitting cases that were secondary to other conditions (e.g.cystic fibrosis or high-dose corticosteroid treatment).Registries attempt to capture prospectively all newly diag-nosed individuals in a geographically defined region.Primary and secondary sources of ascertainment were record-ed for each child, and these were used to estimate complete-ness by capture–recapture methodology. The completeness
Diabetologia (2019) 62:408–417 409

findings for 1989–2008 have previously been reported as be-ing considerably in excess of 90% in most of the registries (asreported by ESM Table 2 from the 20 year report) [15]. Thegeographical coverage of the 26 registries is shown in Fig. 1and represents 23% of the estimated European childhood pop-ulation in 2011 (excluding Belarus, Ukraine and the RussianFederation). Ethics approval was obtained by individual cen-tres where required.
Incidence rates were obtained by dividing the numbers ofregistered children by annual population estimates.Standardisation of rates was obtained by the direct methodwith a standard population comprising equal numbers in eachof six subgroups defined by age group (0–4 years, 5–9 yearsand 10–14 years) and sex. Standard errors for the directlystandardised rates were also calculated [16]. Trends in annualincidence rates in each countrywere investigated in the 25 yearperiod using Poisson regression incorporating an adjustmentfor age group and sex. Comparisons of trends between agegroups and sexes were obtained within each country by incor-porating interactions into the Poisson regression model. TheJoinpoint regression analysis program version 4.2 (StatisticalMethodology and Applications Branch and Data ModelingBranch, National Cancer Institute, Bethesda, MD, USA) wasused to fit segmented regression lines to the logarithmicallytransformed directly standardised incidence rates, taking ac-count of their standard errors. Pooled estimates of rates ofincrease across all 26 centres were obtained using a mixed
effects Poisson regression model with centre treated as a ran-dom effect and age and sex as fixed effects.
Motivated by reports in the literature of 4, 5 and 6 yearcycles in incidence rate, sine and cosine terms representingsuch cycles were added to Poisson regression models for an-nual age-/sex-specific incidence rates, along with terms forage group and sex as well as the segmented log-linear trendswith year as identified by the Joinpoint analysis. The sine andcosine terms are similar to those described for the study ofseasonal variation in month-to-month counts [17] but wereadapted for the detection of cyclical variation in yearly rates.
Statistical analyses were performed in SPSS version 24(IBM Corp, Armonk, NY, USA) and Stata release 14(StataCorp, College Station, TX, USA). Unless otherwise stat-ed, hypothesis testing was performed at the 5% significancelevel (p < 0.05).
Results
Ascertainment rates remained in excess of 90% for most cen-tres, although data were not available for all of these (seeelectronic supplementary material [ESM] Table 1). Table 1shows the total numbers of children registered during the25 year period 1989–2013 in each of the 26 centres, and theage- and sex-standardised incidence rates (with standard er-rors) in the 5 year subperiods 1989–1993, 1994–1998, 1999–
Spain–Catalonia
FYR of Macedonia
Montenegro
UK–Northern
Ireland
Ireland
UK–Yorkshire
UK–Oxford
Norway
Sweden–Stockholm
County
Lithuania
Germany–Saxony
Belgium–Antwerp
Luxembourg
Germany–Baden-
Württemberg
Germany–North Rhine-
Westphalia
SwitzerlandAustria
Slovenia
Czechia
Denmark
Croatia–Zagreb
Poland–Katowice
Romania–Bucharest
Hungary–except Budapest
Finland
Italy–Marche
Fig. 1 Map of 26 participating EURODIAB centres (whole nations unless a region is specified). Administrative boundaries: ©EuroGeographics 2018;adapted with permission. FYR, Former Yugoslav Republic
410 Diabetologia (2019) 62:408–417
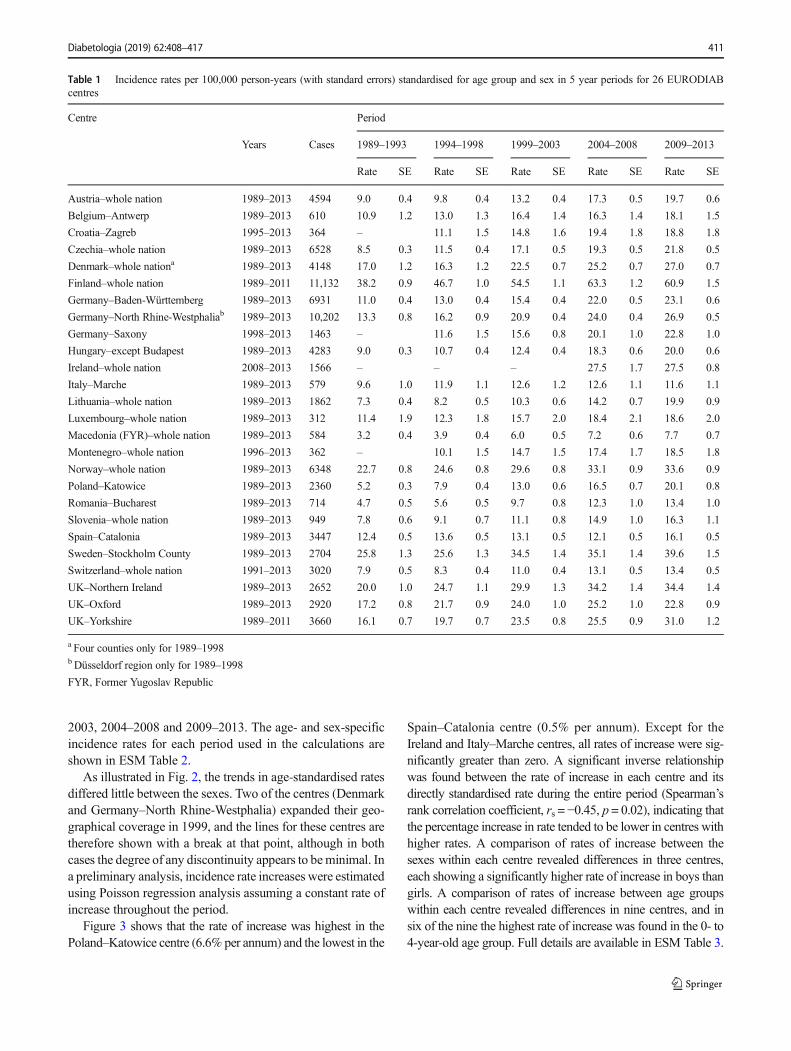
2003, 2004–2008 and 2009–2013. The age- and sex-specificincidence rates for each period used in the calculations areshown in ESM Table 2.
As illustrated in Fig. 2, the trends in age-standardised ratesdiffered little between the sexes. Two of the centres (Denmarkand Germany–North Rhine-Westphalia) expanded their geo-graphical coverage in 1999, and the lines for these centres aretherefore shown with a break at that point, although in bothcases the degree of any discontinuity appears to beminimal. Ina preliminary analysis, incidence rate increases were estimatedusing Poisson regression analysis assuming a constant rate ofincrease throughout the period.
Figure 3 shows that the rate of increase was highest in thePoland–Katowice centre (6.6% per annum) and the lowest in the
Spain–Catalonia centre (0.5% per annum). Except for theIreland and Italy–Marche centres, all rates of increase were sig-nificantly greater than zero. A significant inverse relationshipwas found between the rate of increase in each centre and itsdirectly standardised rate during the entire period (Spearman’srank correlation coefficient, rs = −0.45, p = 0.02), indicating thatthe percentage increase in rate tended to be lower in centres withhigher rates. A comparison of rates of increase between thesexes within each centre revealed differences in three centres,each showing a significantly higher rate of increase in boys thangirls. A comparison of rates of increase between age groupswithin each centre revealed differences in nine centres, and insix of the nine the highest rate of increase was found in the 0- to4-year-old age group. Full details are available in ESM Table 3.
Table 1 Incidence rates per 100,000 person-years (with standard errors) standardised for age group and sex in 5 year periods for 26 EURODIABcentres
Centre Period
Years Cases 1989–1993 1994–1998 1999–2003 2004–2008 2009–2013
Rate SE Rate SE Rate SE Rate SE Rate SE
Austria–whole nation 1989–2013 4594 9.0 0.4 9.8 0.4 13.2 0.4 17.3 0.5 19.7 0.6
Belgium–Antwerp 1989–2013 610 10.9 1.2 13.0 1.3 16.4 1.4 16.3 1.4 18.1 1.5
Croatia–Zagreb 1995–2013 364 – 11.1 1.5 14.8 1.6 19.4 1.8 18.8 1.8
Czechia–whole nation 1989–2013 6528 8.5 0.3 11.5 0.4 17.1 0.5 19.3 0.5 21.8 0.5
Denmark–whole nationa 1989–2013 4148 17.0 1.2 16.3 1.2 22.5 0.7 25.2 0.7 27.0 0.7
Finland–whole nation 1989–2011 11,132 38.2 0.9 46.7 1.0 54.5 1.1 63.3 1.2 60.9 1.5
Germany–Baden-Württemberg 1989–2013 6931 11.0 0.4 13.0 0.4 15.4 0.4 22.0 0.5 23.1 0.6
Germany–North Rhine-Westphaliab 1989–2013 10,202 13.3 0.8 16.2 0.9 20.9 0.4 24.0 0.4 26.9 0.5
Germany–Saxony 1998–2013 1463 – 11.6 1.5 15.6 0.8 20.1 1.0 22.8 1.0
Hungary–except Budapest 1989–2013 4283 9.0 0.3 10.7 0.4 12.4 0.4 18.3 0.6 20.0 0.6
Ireland–whole nation 2008–2013 1566 – – – 27.5 1.7 27.5 0.8
Italy–Marche 1989–2013 579 9.6 1.0 11.9 1.1 12.6 1.2 12.6 1.1 11.6 1.1
Lithuania–whole nation 1989–2013 1862 7.3 0.4 8.2 0.5 10.3 0.6 14.2 0.7 19.9 0.9
Luxembourg–whole nation 1989–2013 312 11.4 1.9 12.3 1.8 15.7 2.0 18.4 2.1 18.6 2.0
Macedonia (FYR)–whole nation 1989–2013 584 3.2 0.4 3.9 0.4 6.0 0.5 7.2 0.6 7.7 0.7
Montenegro–whole nation 1996–2013 362 – 10.1 1.5 14.7 1.5 17.4 1.7 18.5 1.8
Norway–whole nation 1989–2013 6348 22.7 0.8 24.6 0.8 29.6 0.8 33.1 0.9 33.6 0.9
Poland–Katowice 1989–2013 2360 5.2 0.3 7.9 0.4 13.0 0.6 16.5 0.7 20.1 0.8
Romania–Bucharest 1989–2013 714 4.7 0.5 5.6 0.5 9.7 0.8 12.3 1.0 13.4 1.0
Slovenia–whole nation 1989–2013 949 7.8 0.6 9.1 0.7 11.1 0.8 14.9 1.0 16.3 1.1
Spain–Catalonia 1989–2013 3447 12.4 0.5 13.6 0.5 13.1 0.5 12.1 0.5 16.1 0.5
Sweden–Stockholm County 1989–2013 2704 25.8 1.3 25.6 1.3 34.5 1.4 35.1 1.4 39.6 1.5
Switzerland–whole nation 1991–2013 3020 7.9 0.5 8.3 0.4 11.0 0.4 13.1 0.5 13.4 0.5
UK–Northern Ireland 1989–2013 2652 20.0 1.0 24.7 1.1 29.9 1.3 34.2 1.4 34.4 1.4
UK–Oxford 1989–2013 2920 17.2 0.8 21.7 0.9 24.0 1.0 25.2 1.0 22.8 0.9
UK–Yorkshire 1989–2011 3660 16.1 0.7 19.7 0.7 23.5 0.8 25.5 0.9 31.0 1.2
a Four counties only for 1989–1998bDüsseldorf region only for 1989–1998
FYR, Former Yugoslav Republic
Diabetologia (2019) 62:408–417 411

Mixed effects Poisson regression provided estimated ratesof increase in the pooled data from the 26 centres, as shown inTable 2. Overall, the annual rate of increase was estimated tobe 3.4% (95% CI 2.8%, 3.9%). Rates of increase were similarin boys and girls in the 0- to 4-year-old age group (3.7% and3.7% per annum, respectively) and in the 5- to 9-year-old age
group (3.4% and 3.7% per annum, respectively), but werehigher in boys than girls in the 10- to 14-year-old age group(3.3% and 2.6% per annum, respectively). The estimates ofoverall rate of increase by period suggested a slowing in2004–2008, but the rate of increase appeared to have almostreturned to previous levels in the 2009–2013 period.
6.6% (6.0%, 7.2%)
5.6% (4.6%, 6.7%)
5.5% (4.8%, 6.2%)
4.8% (3.6%, 6.0%)
4.7% (4.3%, 5.0%)
4.4% (4.0%, 4.8%)
4.4% (3.2%, 5.5%)
4.3% (3.9%, 4.7%)
4.2% (2.1%, 6.3%)
4.1% (3.8%, 4.5%)
3.9% (3.0%, 4.8%)
3.9% (1.9%, 5.8%)
3.2% (2.7%, 3.7%)3.2% (2.6%, 3.7%)
2.8% (2.3%, 3.4%)
2.7% (1.1%, 4.4%)
2.7% (2.4%, 3.0%)
2.6% (2.1%, 3.0%)
2.3% (1.2%, 3.5%)
2.3% (1.8%, 2.9%)
2.1% (1.7%, 2.4%)
1.8% (-1.1%, 4.8%)
1.6% (0.8%, 2.3%)
1.2% (0.7%, 1.7%)
0.8% (-0.3%, 2.0%)
0.5% (0.0%, 0.9%)
3.4% (2.8%. 3.9%)
Estimate (95% CI)
Poland−KatowiceRomania−Bucharest
LithuaniaMacedonia (FYR)
CzechiaAustria
Germany−SaxonyHungary−except Budapest
MontenegroGermany−Baden Württemberg
SloveniaCroatia−Zagreb
UK−YorkshireSwitzerland
UK−Northern IrelandLuxembourg
FinlandGermany−N. Rhine-Westphalia
Belgium−AntwerpSweden−Stockholm County
NorwayIreland
DenmarkUK−Oxford
Italy−MarcheSpain−Catalonia
Overall pooled (random effects)
-2 0 2 4 6 8
Rate of increase (%)Fig. 3 Estimated rates of annualincrease in type 1 diabetes in 26European centres. Rates ofincrease in individual centreswere derived from Poissonregression analyses withadjustment for age, sex, age × sexinteraction and inclusion of a log-linear term for year in the model.The overall pooled estimate wasderived from a Poisson regressionwith centre as a random effect.FYR, Former Yugoslav Republic;N., North
Inci
denc
e ra
te (
per
100,
000)
100
25
5
1 100
25
5
1 100
25
5
1 100
25
5
1 100
25
5
1
Austria Belgium (Antwerp) Croatia (Zagreb) Czechia Denmark Finland
Germany(Baden Württemberg)
Germany (North-Rhine Westphalia) Germany (Saxony)
Hungary(except Budapest) Ireland Italy (Marche)
Lithuania
(Northern Ireland)
Poland (Katowice)NorwayMontenegro
Switzerland(Stockholm County)
Macedonia (FYR)
Spain (Catalonia)Slovenia
Luxembourg
(Bucharest)
(Yorkshire)(Oxford)
UK
UK UK
Romania Sweden
19891993
19972001
20052009
20131989
19931997
20012005
2009
19891993
19972001
20052009
20131989
19931997
20012005
20092013
19891993
19972001
20052009
20131989
19931997
20012005
20092013
2013
Fig. 2 Trends in age-standardised incidence rates, plotted on a logarith-mic scale, by sex for type 1 diabetes in 26 European centres during 1989–2013. Blue lines, boys; red lines, girls. Breaks are shown for Denmarkand Germany (North Rhine-Westphalia) between 1998 and 1999 because
of increased coverage of these registers, but any discontinuities appear tobe very minor. Macedonia (FYR), Former Yugoslav Republic ofMacedonia
412 Diabetologia (2019) 62:408–417

The fitted Joinpoint segmented regression analyses for eachcentre are presented in ESM Fig. 1. The best fit for 18 of the 26centres throughout the periodwas a log-linear increase in the age-standardised rate. Six centres showed more rapid increases in anearly period followed by lower rates of increase in a later period.In two Central European centres (Czechia and Poland–
Katowice), the change took place in 2002, at roughly the sametime as in two UK centres (UK–Oxford in 2000 and UK–Northern Ireland in 2003). In two Scandinavian centres(Finland and Norway), the levelling off took place a little later,in the years 2005 and 2007, respectively. Only in a single centre(Lithuania) was an initially low rate of increase followed by aperiod after 1996 with a higher rate of increase. The final centre(Germany–Baden-Württemberg) showed a more complex pat-tern, with steady rates of increase in the early and late part ofthe 25 year period separated by a short period of more rapidincrease in 2001–2004.
Poisson regression results provided most support for a 4 yearperiodicity, with four centres giving likelihood ratio tests thatattained significance at the reduced p< 0.01 level (to allow formultiple testing) compared with none for a 5 year periodicity andtwo for a 6 year periodicity (tests of significance summarised inESM Table 4). Plots of the observed age-standardised annualincidence rates and the fitted rates for 4 year cycles are shownin Fig. 4 for these four centres. One of the four centres showed itsmost recent peak in fitted incidence rate in 2011 (Switzerland,with an amplitude of ±10% superimposed on the log-linear in-creasing trend), while the three remaining centres showed themost recent peaks in 2012 (Germany–North Rhine-Westphaliawith an amplitude of ±5%, Germany–Saxony with an amplitudeof ±15% and UK–Oxford with an amplitude of ±9%).
Discussion
Our analyses of individual centre results confirmed the recentslowing of incidence rate increases in some high-incidence
Sta
ndar
dise
d in
cide
nce
rate
(per
100
,000
per
son-
year
s)
Sta
ndar
dise
d in
cide
nce
rate
(per
100
,000
per
son-
year
s)
Sta
ndar
dise
d in
cide
nce
rate
(per
100
,000
per
son-
year
s)
Sta
ndar
dise
d in
cide
nce
rate
(per
100
,000
per
son-
year
s)
Year
Year
Year
Year
ba
5
10
15
20
25
30
35
0
5
10
15
20
25
30
35
c d
0
5
10
15
20
25
30
35
0
5
10
15
20
25
30
35
1989
1991
1993
1995
1997
1999
2001
2003
2005
2007
200920
1120
1319
8919
9119
9319
9519
9719
9920
0120
0320
0520
0720
0920
1120
13
1989
1991
1993
199519
9719
9920
0120
0320
0520
0720
0920
1120
1319
8919
9119
9319
9519
9719
9920
0120
0320
0520
0720
0920
1120
13
Fig. 4 Observed (continuous blueline) and fitted (red dashed line)standardised incidence rates (per100,000 person-years) obtainedby Poisson regression in fourcentres that showed significant(p < 0.01) 4 year periodicity whensuperimposed on long-termJoinpoint segmented regressiontrends: (a) Germany–NorthRhine-Westphalia;(b) Germany–Saxony; (c)Switzerland; (d) UK–Oxford
Table 2 Annual increases in incidence rate over a 25 year period pooledover centres as estimated by mixed effects Poisson regression in sub-groups defined by age group, sex and time period
Subgroup Annual increase (%) (95% CI)
Boys
0–4 years old 3.7 (3.0, 4.4)
5–9 years old 3.4 (2.7, 4.0)
10–14 years old 3.3 (2.8, 3.8)
0–14 years old 3.5 (2.9, 4.0)
Girls
0–4 years old 3.7 (2.9, 4.5)
5–9 years old 3.7 (3.2, 4.2)
10–14 years old 2.6 (2.2, 3.0)
0–14 years old 3.3 (2.8, 3.8)
Period
1989–1993 4.1 (2.7, 5.6)
1994–1998 3.2 (1.9, 4.5)
1999–2003 4.1 (3.1, 5.2)
2004–2008 1.1 (0.2, 2.1)
2009–2013 2.7 (1.7, 3.7)
1989–2013a 3.4 (2.8, 3.9)
a Overall time period
Diabetologia (2019) 62:408–417 413

areas such as Finland [7] and Norway [8], but using only datafrom Stockholm County we were unable to detect the samepattern that had previously been reported from Sweden [6].Two of the three centres from the UK, another country withhigh rates, also showed reducing rates of increase, althoughthese seemed to have begun a few years earlier than inScandinavia.
Our pooled estimates suggest that, despite some high-riskcountries showing some slowing in the rate of increase inrecent years, the overall pattern is still one of an approximately3% per annum increase, although with a possible temporaryslowing in the 2004–2008 period. As previously noted in our15 year analysis, the rate of increase in girls aged 10–14 yearsis less marked than in other age/sex subgroups [1].
Our analysis shows that, in the majority of centres, a steadylog-linear increase in rates with time provided a good descrip-tion of the temporal changes, with only a few (mainly high-incidence) areas showing some evidence of non-uniformity.The cyclical pattern in incidence observed in four of our 26centres is consistent with the earliest report of a 4 year cyclicalincidence pattern [10], but subsequent reports have described5 year or 6 year periodicities [11–13], for which we foundlittle support in our data.
No clear rationale for periodicity has yet been proposedand, to the authors’ knowledge, no climatological factor[18], viral infection [19] or other environmental exposurehas yet been firmly established that exhibits such a cyclicalpattern. Since autoimmunity and progressive beta cell destruc-tion typically start long before the clinical diagnosis of type 1diabetes, the periodicity in diagnosis could be indicative ofcycles of infectious disease that accelerate the diagnosis ratherthan initiate the disease. Regular cycles of infectious diseasesare well known from classic work done before population-wide vaccination for measles, an extremely contagious viraldisease of childhood; this research showed that, in an other-wise stable population, epidemic cyclicity depends on com-munity size [20].
It is also unclear why only a small proportion of the 26centres showed this periodicity and, although we acknowl-edge that power may be limited in smaller centres, it was notapparent in many of the largest centres that might be expectedto have had a high power to detect it. This could perhapssuggest that it may have more localised origins. What deter-mines this localisation remains enigmatic, as cyclical patternswere absent in Austria, Czechia and Germany–Baden-Württemberg, three large registers each with neighbouringareas where pronounced cyclical patterns were noted. It ispossible that not only the size of the population, but also itsspatial structure (i.e. the size of the communities, and theirmutual links) may play an important role in the ability of thehypothetical infectious accelerator to be transmitted [21].
To our knowledge, among autoimmune conditions, onlyincidence cycles in juvenile idiopathic arthritis have been
correlated to cycles of serologically confirmed microbialagents—in a Canadian study, peak incidences of arthritis wereconcurrent with peaks of Mycoplasma pneumoniae, whereasno such phenomenon was noted for the incidence of seroneg-ative (i.e. non-immune mediated) spondyloarthropathies [22].The recent report of a twofold risk of type 1 diabetes diagnosedby the age of 30 years among those with laboratory-confirmedpandemic influenza A (H1N1) [23] may stimulate interest inless consistent patterns of incidence peaks in type 1 diabetessince localised seasonal influenza epidemics (as opposed tomuch rarer pandemics) can occur at irregular intervals [24].
Most of the participating registers have maintained theircompleteness of coverage at levels in excess of 90% in themost recent 5 year period, but these estimates of completenessrely on an assumption of independence in the primary andsecondary sources that is very difficult to verify. As moresophisticated information systems for drug prescribing andclinical management become available, it seems likely thatthe traditional approach based on notification of individualnew diagnoses will give way to more automated approachesthat take advantage of these information systems.
Although it could be argued that the diagnosis of type 1diabetes should ideally be confirmed by the presence of oneor more specific autoimmune markers [25], this is seldom donein clinical practice, and we have therefore continued to use apragmatic definition of type 1 diabetes based on clinical judge-ment. A UK study found that all but 8 (3%) of 256 clinicallydiagnosed cases of type 1 diabetes in individuals aged 20 yearsor younger were positive for one or more of four antibodies[26], but the case for routine antibody testing at diagnosis is notcompelling [27]. Individuals diagnosed before 6 months of agenow tend to be routinely investigated for monogenic forms ofthe disease [28], but the number of such cases is very small.Findings in the literature on whether or not type 2 diabetes isbecoming more common in children and adolescents are incon-sistent [29–31], but the distinction between the two types ofdiabetes is generally not difficult in the paediatric age group.Furthermore, European studies [30–33] confirm that the rate oftype 2 diabetes is a small fraction of that of type 1 diabetes, andwe do not therefore feel that misclassification of type 2 diabetesrepresents a serious challenge to the validity of our findings.
The use of mixed effects Poisson regression, in which agegroup and sex are considered as fixed effects but centre istreated as a random effect, gives similar estimates of the in-crease in incidence rate to the more conventional fixed effectsanalysis that we have used in previous analyses; however,confidence limits for the mixed effects model tend to be ratherwider and should give a fairer reflection of uncertainty in theestimates of incidence rate increase. Taking into account theuncertainty associated with our overall incidence rate increaseof 3.4% (95% CI 2.8%, 3.9%), we may expect to see a dou-bling in European incidence in between 18 and 25 years if thetrends evident in the last 25 years are maintained.
414 Diabetologia (2019) 62:408–417

The steadily increasing number of children being diag-nosed with this chronic disease, which is associated withwell-documented, life-long increases in morbidity and mortal-ity, has important implications for those planning and deliver-ing healthcare. The limited success in identifying either envi-ronmental causes or gene–environment interactions that couldeventually lead to disease prevention means that efforts mustcontinue to improve quality of care to help reduce long-termcomplications and diabetes-related deaths. Key to this is theimprovement in glycaemic control that will be achieved notonly by more sophisticated methods of insulin delivery, butalso by an increased investment in services to support well-trained and dedicated care teams in sufficient numbers to meetthe growing needs of this group of children and their families.
The EURODIAB childhood type 1 diabetes registers, withtheir wide, population-based coverage of European regions ofdiffering incidence, and their high levels of case ascertain-ment, will continue to provide a valuable source of data formonitoring the future incidence of childhood type 1 diabetes.
Acknowledgements The authors acknowledge the Austrian DiabetesIncidence Study Group, the Belgian Diabetes Registry, the CzechChildhood Diabetes Register and the Czech Association of Parents andFriends of Diabetic Children, the Danish Study Group of Diabetes inChildhood and contributors to DanDiabKids, the Chronic DiseasePrevention Unit of the Finnish National Institute for Health andWelfare, the Baden-Württemberg Diabetes Incidence Registry(DIARY), the German Paediatric Surveillance Unit, DPV ScienceInitiative, Ulm University, the German Competence Network DiabetesMellitus and the German Center for Diabetes Research (DZD), theSaxonian Childhood Diabetes Register Group, the HungarianChildhood Diabetes Epidemiology Group, the Irish Childhood DiabetesNational Register, the Registry for Incidence of Diabetes in Italy (RIDI),the Lithuanian ChildhoodDiabetes Registry Study Group, the NorwegianChildhood Diabetes Study Group, the Catalan Epidemiology Type 1Diabetes Study Group, the Swedish Childhood Diabetes Study Group,the Managed Clinical Network for Paediatric Diabetes in NorthernIreland, the Bart’s–Oxford Study Group and the Yorkshire Register ofDiabetes in Children and Young People.
Data availability Much of the data generated or analysed during thisstudy are included in this article and its accompanying electronic supple-mentary material (ESM) files. Requests for further data should be sent tothe corresponding author.
Funding The following centres received support as listed: Austria centrefrom Sanofi and Novo-Nordisk, Czechia centre from the CzechMinistry ofHealth (grant 00064203), Germany–North Rhine-Westphalia centre fromthe German Federal Ministry of Education and Research, Ireland centrefrom the National Children’s Hospital Foundation, Norway centre fromthe South-Eastern Norway Regional Health Authority, Poland–Katowicecentre from theMedical University of Silesia (grants SUMKNW-1-083/K/6/K and SUM KNW-1-063/N/7/K, Sweden–Stockholm centre from theSwedish Research Council (project number 07531), UK–Oxford centrefrom Diabetes UK, UK–Yorkshire centre from the UK Department ofHealth and the Yorkshire and Humber Children and Young People’sDiabetes Network. IW was in receipt of a fellowship from the BelgianFund for Scientific Research. Funding to establish the collaboration wassupplied by European Community Concerted Action Program grants(BMH1-CT92-0043, BMH4-CT96-0577 and IC20-CT96-0070).
Duality of interest The authors declare that there is no duality of interestassociated with this manuscript.Contribution statement AG set up the collaboration and coordinated thegroup until 1998 and together with GD established the registration meth-odology. GS coordinated the group from1998 to 2009. CCP has coordinatedthe group since 2010, undertook the statistical analysis and wrote a first draftof the report. JR also contributed to the statistical analysis. The remainingauthors established and/or maintained the registration process in the differentcentres and validated the ascertainment level. All authors commented on adraft of the report and approved the final manuscript. CCP is the guarantor ofthis work.
Open Access This article is distributed under the terms of the CreativeCommons At t r ibut ion 4 .0 In te rna t ional License (h t tp : / /creativecommons.org/licenses/by/4.0/), which permits unrestricted use,distribution, and reproduction in any medium, provided you give appro-priate credit to the original author(s) and the source, provide a link to theCreative Commons license, and indicate if changes were made.
References
1. Patterson CC, Dahlquist GG, Gyürüs E et al (2009) Incidence trendsfor childhood type 1 diabetes in Europe during 1989–2003 andpredicted new cases 2005–20: a multicentre prospective registrationstudy. Lancet 373(9680):2027–2033. https://doi.org/10.1016/S0140-6736(09)60568-7
2. DIAMOND Project Group (2006) Incidence and trends of child-hood type 1 diabetes worldwide 1990–1999. Diabet Med 23(8):857–866. https://doi.org/10.1111/j.1464-5491.2006.01925.x
3. Mayer-Davis EJ, Lawrence JM, Dabelea D et al (2017)Incidence trends of type 1 and type 2 diabetes among youths,2002-2012. N Engl J Med 376(15):1419–1429. https://doi.org/10.1056/NEJMoa1610187
4. Fox DA, Islam N, Sutherland J, Reimer K, Amed S (2018) Type 1diabetes incidence and prevalence trends in a cohort of Canadianchildren and youth. Pediatr Diabetes 19(3):501–505. https://doi.org/10.1111/pedi.12566
5. Haynes A, Bulsara MK, Bower C, Jones TW, Davis EA (2015)Regular peaks and troughs in the Australian incidence of childhoodtype 1 diabetes mellitus (2000-2011). Diabetologia 58(11):2513–2516. https://doi.org/10.1007/s00125-015-3709-2
6. Berhan Y, Waernbaum I, Lind T, Möllsten A, Dahlquist G, theSwedish Childhood Diabetes Study Group (2011) Thirty years ofprospective nationwide incidence of childhood type 1 diabetes: theaccelerating increase by time tends to level off in Sweden. Diabetes60(2):577–581. https://doi.org/10.2337/db10-0813
7. Harjutsalo V, Sund R, Knip M, Groop PH (2013) Incidence of type1 diabetes in Finland. JAMA 310(4):427–428. https://doi.org/10.1001/jama.2013.8399
8. Skrivarhaug T, Stene LC, Drivvoll AK, Strøm H, Joner G,Norwegian Childhood Diabetes Study Group (2014) Incidence oftype 1 diabetes in Norway among children aged 0-14 years between1989 and 2012: has the incidence stopped rising? Results from theNorwegian Childhood Diabetes Registry. Diabetologia 57(1):57–62. https://doi.org/10.1007/s00125-013-3090-y
9. Wu HB, Zhong JM, Hu RYet al (2016) Rapidly rising incidence oftype 1 diabetes in children and adolescents aged 0-19 years inZhejiang, China, 2007 to 2013. Diabet Med 33(10):1339–1346.https://doi.org/10.1111/dme.13010
10. Staines A, Bodansky HJ, Lilley HE, Stephenson C, McNally RJ,Cartwright RA (1993) The epidemiology of diabetes mellitus in theUnited Kingdom: the Yorkshire Regional Childhood Diabetes
Diabetologia (2019) 62:408–417 415

Register. Diabetologia 36(12):1282–1287. https://doi.org/10.1007/BF00400806
11. McNally RJ, Court S, James PW et al (2010) Cyclical variation intype 1 childhood diabetes. Epidemiology 21(6):914–915. https://doi.org/10.1097/EDE.0b013e3181f38f3f
12. Haynes A, Bulsara MK, Bower C, Jones TW, Davis EA (2012)Cyclical variation in the incidence of childhood type 1 diabetes inWestern Australia (1985–2010). Diabetes Care 35(11):2300–2302.https://doi.org/10.2337/dc12-0205
13. Chobot A, Polanska J, Brandt A et al (2017) Updated 24-year trendof type 1 diabetes incidence in children in Poland reveals a sinusoi-dal pattern and sustained increase. Diabet Med 34(9):1252–1258.https://doi.org/10.1111/dme.13345
14. Green A, Gale EA, Patterson CC (1992) Incidence of childhood-onset insulin-dependent diabetes mellitus: the EURODIAB ACEstudy. Lancet 339(8798):905–909. https://doi.org/10.1016/0140-6736(92)90938-Y
15. Patterson CC, Gyürüs E, Rosenbauer J et al (2012) Trends in child-hood type 1 diabetes incidence in Europe during 1989–2008: evi-dence of non-uniformity over time in rates of increase. Diabetologia55(8):2142–2147. https://doi.org/10.1007/s00125-012-2571-8
16. Morris JA, Gardner MJ (1988) Calculating confidence intervals forrelative risks (odds ratios) and standardised ratios and rates. Br MedJ (Clin Res Ed) 296(6632):1313–1316. https://doi.org/10.1136/bmj.296.6632.1313
17. Stolwijk AM, Straatman H, Zielhuis GA (1999) Studying season-ality using sine and cosine functions in regression analysis. JEpidemiol Community Health 53(4):235–238. https://doi.org/10.1136/jech.53.4.235
18. Patterson CC, Gyürüs E, Rosenbauer J et al (2015) Seasonal vari-ation in month of diagnosis in children with type 1 diabetes regis-tered in 23 European centers during 1989-2008: little short-terminfluence of sunshine hours or average temperature. PediatrDiabetes 16(8):573–580. https://doi.org/10.1111/pedi.12227
19. CraigME, Nair S, Stein H, RawlinsonWD (2013) Viruses and type1 diabetes: a new look at an old story. Pediatr Diabetes 14(3):149–158. https://doi.org/10.1111/pedi.12033
20. Bartlett MS (1957) Measles periodicity and community size. J RStat Soc Ser A 120(1):48–70. https://doi.org/10.2307/2342553
21. Sun GQ, Jusup M, Jin Z, Wang Y, Wang Z (2016) Pattern transitionsin spatial epidemics: mechanisms and emergent properties. Phys LifeRev 19:43–73. https://doi.org/10.1016/j.plrev.2016.08.002
22. Oen K, Fast M, Postl B (1995) Epidemiology of juvenile rheuma-toid arthritis in Manitoba, Canada, 1975-92: cycles in incidence. JRheumatol 22(4):745–750
23. Ruiz PLD, Tapia G, Bakken IJ et al (2018) Pandemic influenza andsubsequent risk of type 1 diabetes: a nationwide cohort study.Diabetologia 61(9):1996–2004. https://doi.org/10.1007/s00125-018-4662-7
24. Chowell G, Miller MA, Viboud C (2008) Seasonal influenza in theUnited States, France, and Australia: transmission and prospects forcontrol. Epidemiol Infect 136(6):852–864. https://doi.org/10.1017/S0950268807009144
25. American Diabetes Association (2016) Classification and diagnosisof diabetes. Section 2. In Standards of medical care in Diabetes–2016. Diabetes Care 39(Suppl 1):S8–S16
26. Bingley PJ, Bonifacio E, Williams AJ, Genovese S, Bottazzo GF,Gale E (1997) Prediction of IDDM in the general population: strat-egies based on combinations of autoantibody markers. Diabetes46(11):1701–1710. https://doi.org/10.2337/diab.46.11.1701
27. Bingley PJ (2010) Clinical applications of diabetes antibody test-ing. J Clin Endocrinol Metab 95(1):25–33. https://doi.org/10.1210/jc.2009-1365
28. Craig ME, Jefferies C, Dabelea D, Balde N, Seth A, Donaghue KC(2014) Definition, epidemiology, and classification of diabetes inchildren and adolescents. Pediatr Diabetes 15(Suppl 20):4–17.https://doi.org/10.1111/pedi.12186
29. Fazeli Farsani S, van der AaMP, van der VorstMM, Knibbe CA, deBoer A (2013) Global trends in the incidence and prevalence oftype 2 diabetes in children and adolescents: a systematic reviewand evaluation of methodological approaches. Diabetologia 56(7):1471–1488. https://doi.org/10.1007/s00125-013-2915-z
30. Neu A, Feldhahn L, Ehehalt S et al (2018) No change in type 2diabetes prevalence in children and adolescents over 10 years: up-date of a population-based survey in South Germany. PediatrDiabetes 19(4):637–639. https://doi.org/10.1111/pedi.12622
31. Candler TP, Mahmoud O, Lynn RM, Majbar AA, Barrett TG,Shield JPH (2018) Continuing rise of type 2 diabetes incidence inchildren and young people in the UK. Diabet Med 35(6):737–744.https://doi.org/10.1111/dme.13609
32. Oester IM, Kloppenborg JT, Olsen BS, Johannesen J (2016) Type 2diabetes mellitus in Danish children and adolescents in 2014.Pediatr Diabetes 17(5):368–373. https://doi.org/10.1111/pedi.12291
33. O’Dea MI, O'Connell SM, O'Grady MJ (2017) Prevalence andcharacteristics of paediatric type 2 diabetes in the Republic ofIreland. Diabet Med 34(11):1603–1607. https://doi.org/10.1111/dme.13425
Affiliations
Christopher C. Patterson1& Valma Harjutsalo2
& Joachim Rosenbauer3 & Andreas Neu4& Ondrej Cinek5 &
Torild Skrivarhaug6& Birgit Rami-Merhar7 & Gyula Soltesz8 & Jannet Svensson9
& Roger C. Parslow10& Conxa Castell11 &
Eugen J. Schoenle12 & Polly J. Bingley13 & Gisela Dahlquist14 & Przemysława K. Jarosz-Chobot15 &
Dalė Marčiulionytė16,17& Edna F. Roche18
& Ulrike Rothe19& Natasa Bratina20 & Constantin Ionescu-Tirgoviste21
&
Ilse Weets22 &Mirjana Kocova23 & Valentino Cherubini24 & Natasa Rojnic Putarek25 & Carine E. deBeaufort26 &
Mira Samardzic27 & Anders Green28
1 Centre for Public Health and UKCRC Centre of Excellence for
Public Health Northern Ireland, Queen’s University Belfast,
Grosvenor Road, Belfast BT12 6BJ, UK
2 Folkhälsan Institute of Genetics, Folkhälsan Research Center,
Helsinki, Finland
3 German Diabetes Center, Institute of Biometrics and Epidemiology,
Leibniz Center for Diabetes Research at Heinrich Heine University
Düsseldorf, Düsseldorf, Germany
4 University Children’s Hospital, Tübingen, Germany
416 Diabetologia (2019) 62:408–417

5 Department of Pediatrics, Second Faculty of Medicine, Charles
University and University Hospital Motol, Prague, Czechia
6 Division of Adolescent and Paediatric Medicine, Institute of Clinical
Medicine, University of Oslo, Oslo University Hospital,
Oslo, Norway
7 Department of Pediatric and Adolescent Medicine, Medical
University of Vienna, Vienna, Austria
8 Department of Paediatrics, Medical School, University of Pécs,
Pécs, Hungary
9 Department of Paediatrics and Adolescent Medicine, Copenhagen
University Hospital, Herlev and Gentofte, Denmark
10 Leeds Institute of Cardiovascular and Metabolic Medicine,
University of Leeds, Leeds, UK
11 Department of Health, Government of Catalonia, Barcelona, Spain
12 Department of Endocrinology and Diabetology, University
Children’s Hospital, Zurich, Switzerland
13 Diabetes and Metabolism, Bristol Medical School, University of
Bristol, Bristol, UK
14 Department of Clinical Sciences, Paediatrics, University of Umeå,
Umeå, Sweden
15 Department of Children’s Diabetology, Medical University of
Silesia, Katowice, Poland
16 Institute of Endocrinology, Lithuanian University of Health
Sciences, Kaunas, Lithuania
17 Institute of Microbiology and Virology, Lithuanian University of
Health Sciences, Kaunas, Lithuania
18 Department of Paediatrics, Tallaght University Hospital, Trinity
College Dublin, The University of Dublin, Dublin, Ireland
19 Health Sciences/Public Health, Faculty of Medicine Carl Gustav
Carus, Technische Universität Dresden, Dresden, Germany
20 Diabetes and Metabolic Diseases, University Children’s Hospital,
Department of Endocrinology, Ljubljana, Slovenia
21 National Institute of Diabetes Nutrition andMetabolic Diseases, NC
Paulescu, Bucharest, Romania
22 Diabetes Research Center and Laboratory of Clinical Biology,
Brussels Free University–Vrije Universiteit Brussel, University
Hospital Brussels–Universitair Ziekenhuis Brussel,
Brussels, Belgium
23 Department of Endocrinology and Genetics, University Children’s
Hospital, Skopje, Republic of Macedonia
24 Division of Paediatric Diabetes, Azienda University Hospital,
Ancona, Italy
25 Department of Pediatric Endocrinology and Diabetes, University
Hospital Zagreb, Zagreb, Croatia
26 Department of Paediatric Diabetes and Endocrinology, University
of Luxembourg, Luxembourg, Luxembourg
27 Department of Endocrinology, Institute for Sick Children,
Podgorica, Montenegro
28 Odense Patient data Exploratory Network (OPEN), Odense
University Hospital/Department of Clinical Research, University of
Southern Denmark, Odense, Denmark
Diabetologia (2019) 62:408–417 417