
Tree Farm Licence #18 Timber Supply Analysis Information … · 2017-10-26 · Tree Farm Licence...
77
Tree Farm Licence #18 Timber Supply Analysis Information Package—Revised October 28, 2004 A project submitted by: Forest Ecosystem Solutions Ltd. #210 – 275 Fell Avenue North Vancouver BC V7P 3R5 tel. 604-998-2222 fax: 604-986-0361 Contacts: Chris Niziolomski, R.P.F. email: [email protected] Colin Mahony, F.I.T. email: [email protected] Submitted to: Dave Dobi, RPF Forestry & Planning Superintendent Canadian Forest Products Ltd. - Vavenby Division Vavenby, BC V0E 3A0 Tel: 250-676-1136 Email: [email protected]
Transcript of Tree Farm Licence #18 Timber Supply Analysis Information … · 2017-10-26 · Tree Farm Licence...

Tree Farm Licence #18
Timber Supply Analysis
Information Package—Revised
October 28, 2004
A project submitted by: Forest Ecosystem Solutions Ltd. #210 – 275 Fell Avenue North Vancouver BC V7P 3R5 tel. 604-998-2222 fax: 604-986-0361
Contacts: Chris Niziolomski, R.P.F.
email: [email protected] Colin Mahony, F.I.T. email: [email protected] Submitted to: Dave Dobi, RPF
Forestry & Planning Superintendent Canadian Forest Products Ltd. - Vavenby Division Vavenby, BC V0E 3A0 Tel: 250-676-1136 Email: [email protected]


Canadian Forest Products Ltd. TFL 18 MP #10 Information Package
Forest Ecosystem Solutions Ltd. #210 – 275 Fell Avenue, North Vancouver BC, Canada V7P 3R5 tel 604-998-2222 fax 604-986-0361
iii
TABLE OF CONTENTS
SUMMARY OF CHANGES TO THE INFORMATION PACKAGE ............................................. 1
TABLE OF ACRONYMS ......................................................................................................................... 2
1 INTRODUCTION .............................................................................................................................. 4
2 PROCESS ............................................................................................................................................ 5 2.1 DATA PREPARATION AND MISSING DATA .................................................................................. 5
3 TIMBER SUPPLY SCENARIOS AND SENSITIVITY ANALYSES ...................................... 6 3.1 BASE CASE ..................................................................................................................................... 6 3.2 SENSITIVITY ANALYSES ................................................................................................................ 6
4 MODEL ................................................................................................................................................ 8 LANDSCAPE DESIGN MODEL - FSOS ....................................................................................................... 8
5 FOREST RESOURCE INVENTORY ............................................................................................ 9 5.1 FOREST COVER INVENTORY ......................................................................................................... 9
5.1.1 Inventory Audit ...................................................................................................................... 9 5.1.2 Silvatech Forest Inventory Rectification Project ................................................................. 9 5.1.3 Other modifications to the forest cover inventory.............................................................. 10
5.2 FOREST RESOURCE INVENTORIES .............................................................................................. 11
6 DESCRIPTION OF THE LAND BASE ....................................................................................... 12 6.1 DEFINITION OF THE TIMBER HARVESTING LAND BASE ........................................................... 12
6.1.1 Overview .............................................................................................................................. 12 6.1.2 Non-Forest and Non-Productive Forest ............................................................................ 13 6.1.3 Existing Roads and Related Disturbances ......................................................................... 13 6.1.4 Non-commercial Cover ....................................................................................................... 14 6.1.5 Parks .................................................................................................................................... 15 6.1.6 Physically Inoperable .......................................................................................................... 15 6.1.7 Riparian Reserves and Management Zones ....................................................................... 15 6.1.8 Unstable Terrain ................................................................................................................. 16 6.1.9 Permanent Sample Plots ..................................................................................................... 16 6.1.10 Difficult regeneration .......................................................................................................... 16 6.1.11 Campsites/Recreation Areas ............................................................................................... 17 6.1.12 Cultural Heritage Resource Reductions ............................................................................ 17 6.1.13 Not-Satisfactorily Restocked Conditions ............................................................................ 17 6.1.14 Non-merchantable sites ....................................................................................................... 17 6.1.15 Wildlife Tree Retention ........................................................................................................ 20 6.1.16 Future Roads ....................................................................................................................... 21
6.2 DESCRIPTION OF THE TIMBER HARVESTING LAND BASE ........................................................ 23
7 INVENTORY AGGREGATION .................................................................................................. 24 7.1 MANAGEMENT ZONES AND MULTI-LEVEL OBJECTIVES .......................................................... 24 7.2 YIELD POPULATIONS AND ANALYSIS UNITS ............................................................................. 24
8 GROWTH AND YIELD ................................................................................................................. 27 8.1 GENERAL GROWTH AND YIELD ASSUMPTIONS ........................................................................ 27
8.1.1 Utilization Levels ................................................................................................................. 27 8.1.2 Volume Reductions .............................................................................................................. 27
Canadian Forest Products Ltd. TFL 18 MP #10 Information Package
Forest Ecosystem Solutions Ltd. #210 – 275 Fell Avenue, North Vancouver BC, Canada V7P 3R5 tel 604-998-2222 fax 604-986-0361
iv
8.2 VDYP VS. TIPSY FOR EXISTING STANDS ................................................................................. 28 8.3 NATURAL (UNMANAGED) STAND YIELD TABLES .................................................................... 29
8.3.1 Existing Natural Timber Volumes ...................................................................................... 29 8.3.2 Site Index Estimates for Natural Stands ............................................................................. 29 8.3.3 Decay, Waste and Breakage (DWB) .................................................................................. 29 8.3.4 IU Balsam Stands ................................................................................................................ 29 8.3.5 Analysis Units ...................................................................................................................... 29
8.4 MANAGED STAND YIELD TABLES ............................................................................................. 32 8.4.1 Site Index Estimates for Existing and Future Managed Stands ........................................ 32 8.4.2 Operational Adjustment Factors ........................................................................................ 33 8.4.3 Silviculture Management Regimes ..................................................................................... 33 8.4.4 Regeneration Delay ............................................................................................................. 33
8.5 EXISTING MANAGED STAND YIELD TABLES ............................................................................ 34 8.5.1 Existing Managed Timber Volumes ................................................................................... 34 8.5.2 Existing MSYT Analysis Units ............................................................................................ 34 8.5.3 Stand Assumptions ............................................................................................................... 34 8.5.4 Deciduous Stands <21 Years Old ...................................................................................... 36
8.6 FUTURE MANAGED STAND YIELD TABLES ............................................................................... 37 8.6.1 Genetic Gain Allowances .................................................................................................... 37 8.6.2 Regeneration Assumptions .................................................................................................. 37 8.6.3 Analysis Units for Future Managed Stands ....................................................................... 41 8.6.4 Not Satisfactorily Restocked (NSR) .................................................................................... 42
8.7 EXISTING TIMBER VOLUME CHECK ........................................................................................... 42
9 PROTECTION ................................................................................................................................. 43 9.1 UNSALVAGED LOSSES ................................................................................................................ 43
9.1.1 Bark Beetles and Windthrow .............................................................................................. 44 9.1.2 Fire ....................................................................................................................................... 45
10 INTEGRATED RESOURCE MANAGEMENT .................................................................... 46 10.1 MANAGEMENT ZONES AND FOREST COVER REQUIREMENTS ............................................. 46
10.1.1 Adjacent Cutblock Green-up and Patch Management ...................................................... 47 10.1.2 Visual Resources ................................................................................................................. 47 10.1.3 Lakeshore Management Zones ........................................................................................... 48 10.1.4 Biodiversity .......................................................................................................................... 50 10.1.5 Riparian Management Zones .............................................................................................. 51 10.1.6 Watershed Management ..................................................................................................... 52 10.1.7 Wildlife ................................................................................................................................. 53
10.2 TIMBER HARVESTING ............................................................................................................. 54 10.2.1 Harvest Scheduling Rules—Short Term ............................................................................. 54 10.2.2 Harvest Scheduling Rules—Long Term ............................................................................. 55 10.2.3 Minimum Harvest Age ........................................................................................................ 57 10.2.4 Initial Harvest Rate ............................................................................................................. 58 10.2.5 Harvest Flow Objectives ..................................................................................................... 58
11 REFERENCES.............................................................................................................................. 59
APPENDIX A: FINAL REPORT FOR INVENTORY RECTIFICATION .................................. 61
APPENDIX B: FINAL REPORT FOR IU BALSAM YIELD TABLES ........................................ 62
APPENDIX C: FUTURE REGENERATION ASSUMPTIONS ..................................................... 63

Canadian Forest Products Ltd. TFL 18 MP #10 Information Package
Forest Ecosystem Solutions Ltd. #210 – 275 Fell Avenue, North Vancouver BC, Canada V7P 3R5 tel 604-998-2222 fax 604-986-0361
v
APPENDIX D: EXISTING VOLUME CHECK BY AU ................................................................... 64
APPENDIX E: YIELD TABLES FOR NATURAL AND MANAGED STANDS ........................ 65
APPENDIX F: % DENUDATION AND VEG FOR INDIVIDUAL VISUAL POLYGONS ..... 67
APPENDIX G: % DENUDATION AND VEG FOR LMZS ............................................................ 69
Canadian Forest Products Ltd. TFL 18 MP #10 Information Package
Forest Ecosystem Solutions Ltd. #210 – 275 Fell Avenue, North Vancouver BC, Canada V7P 3R5 tel 604-998-2222 fax 604-986-0361
vi
LIST OF TABLES
Table 1: Sensitivity analyses ........................................................................................................................ 7 Table 2: Standard resource inventory status ............................................................................................ 11 Table 3: Timber harvesting land base determination. .............................................................................. 12 Table 4: Reductions for non-forest and non-productive forest ................................................................ 13 Table 5: Summary statistics for road classes 1 to 4, and averaged across all road classes in TFL 18
(Adapted from JS Thrower & Associates 2004). ....................................................................................... 14 Table 6: Reductions for existing roads...................................................................................................... 14 Table 7: Calculation of total riparian buffer widths for streams, lakes, and wetlands ........................... 15 Table 8: Reductions for unstable terrain ................................................................................................... 16 Table 9: Summary of the netdown for difficult regeneration .................................................................... 17 Table 10: Reductions for Non-merchantable stands ................................................................................. 18 Table 11: Area of currently non-merchantable stands by age class ........................................................ 18 Table 12: Future wildlife tree patch requirements .................................................................................... 21 Table 13: Calculation of the future roads reduction outside accessed (buffered) areas. ........................ 21 Table 14: Procedure for determining the future roads reduction inside currently accessed areas. ....... 22 Table 15: Age distribution of the THLB by area ....................................................................................... 23 Table 16: Criteria used to classify the productive land base into populations for development of
Analysis Units. ............................................................................................................................................. 25 Table 17: Utilization levels for both natural and managed stands........................................................... 27 Table 18: Delivered deciduous volume on TFL18 for the period 1998-2003 .......................................... 27 Table 19: Source of site index equations .................................................................................................. 29 Table 20:Summary statistics for the NSYT Analysis Units. Naming conventions are based on
population and productivity ........................................................................................................................ 31 Table 21: Adjusted Potential Site Index for Pl growing at elevations <1550m, by site series ............... 32 Table 22: Calculation of weighted average regeneration delay by BGC Variant................................... 34 Table 23: Average site index and species composition of the Existing MSYT Analysis Units ................ 35 Table 24: WinVDYP1.1 inputs and outputs for the yield table used to model the deciduous component
of MSYT analysis units ................................................................................................................................ 35 Table 25: Average attributes of the young (<21 year old) stands within Deciduous NSYT Analysis
Units. TIPSY inputs for the AU 116 (existing_mixed_medium) MSYT are also shown for comparison.
...................................................................................................................................................................... 36 Table 26: Genetic gain forecasts for seed stock ordered for TFL 18 for the 2004 sowing year. ............ 37 Table 27: Average species composition of the Future MSYT Analysis Units .......................................... 38 Table 28: Calculation of average stand attributes of the Future MSYT Analysis Units ......................... 39 Table 29: Calculation of Average Site index for Future MSYT Analysis Units, incorporating inventory
site index for stands located above 1550m elevation. ............................................................................... 40 Table 30: Summary of Analysis Unit yield tables derived by aggregating polygon Future MSYTs. ...... 41 Table 31: Area of current NSR by BGC Variant ....................................................................................... 42 Table 32: Existing inventory check. ........................................................................................................... 42 Table 33: Unsalvaged losses ..................................................................................................................... 43 Table 34: Salvage of timber volume that is susceptible or infested by bark beetle during the period
1999-2003 .................................................................................................................................................... 44 Table 35: Historic records of unsalvaged losses to fire (pre-1979 volume data not available) ............. 45 Table 36: Forest cover objectives – Base Case scenario ......................................................................... 46 Table 37: Calculation of percent denudation for each combination of VQC and VAC. ......................... 48 Table 38: Sample calculation of VEG tree height for visual quality polygons ........................................ 48 Table 39: Maximum allowable harvest guidelines for Lakeshore Management Zones. ......................... 49 Table 40: Summary of forest cover requirements for visual quality objectives in LMZs ........................ 50 Table 41: Calculation of the forest cover requirement within OGMAs of each BGC Variant ............... 51

Canadian Forest Products Ltd. TFL 18 MP #10 Information Package
Forest Ecosystem Solutions Ltd. #210 – 275 Fell Avenue, North Vancouver BC, Canada V7P 3R5 tel 604-998-2222 fax 604-986-0361
vii
Table 42: Mature seral forest cover requirements for riparian management zones (RMZs). ................ 51 Table 43: Summary of TFL18 watershed areas and equivalent clearcut area (ECA) thresholds .......... 52 Table 44: Default Hydrological Recovery Curve ...................................................................................... 53 Table 45: Area and volume summary of FDP blocks that will be fixed for harvest during the first period
of the planning horizon. .............................................................................................................................. 54 Table 46: Harvest Priority Multipliers used as weights for harvest scheduling. .................................... 54 Table 47: Minimum harvest age based on minimum merchantable volume (NSYTs) ............................. 57 Table 48: Minimum harvest age based on minimum merchantable volume (existing and future MSYTs)
...................................................................................................................................................................... 58 Table 49: Initial annual harvest rate .......................................................................................................... 58 Table 50: Volume yield summary for NSYT Analysis Units ...................................................................... 65 Table 51: Volume yield summary for Existing and Future MSYT Analysis Units ................................... 66
LIST OF FIGURES
Figure 1: Current harvesting performance with respect to stand volume reported in the forest cover
inventory ...................................................................................................................................................... 19 Figure 2: Age distribution by area ............................................................................................................. 23 Figure 3: Current age structure of the yield populations. ........................................................................ 26 Figure 4: THLB Area of stands established after 1960, and the proportion of this area reported as
planted in silviculture records. The period 1964-1971 shows a transition from natural to managed
stands. .......................................................................................................................................................... 28 Figure 5: average MSYTs assigned to Future MSYT Analysis Unit ........................................................ 41 Figure 6: illustration of the “relative productivity” concept. In this example, RPi is always negative, so
the stand would be a priority for harvest as soon as it reaches minimum harvest age. .......................... 56

Canadian Forest Products Ltd. TFL 18 MP #10 Information Package
Forest Ecosystem Solutions Ltd. #210 – 275 Fell Avenue, North Vancouver BC, Canada V7P 3R5 tel 604-998-2222 fax 604-986-0361
1
Summary of Changes to the Information Package
Several changes were made to the information package during review by MoF and MSRM. The
following table is a summary of the major changes to the methodology and documentation.
Section Pg. Topic Concerns Summary of changes
6.1.3 13 Existing roads Increased netdown for existing, proposed and
future roads base on a recently-completed
sampling program.
6.1.14.1 18 Non-
merchantable
Inadequate documentation of 125
m3/ha minimum merchantable volume.
Demonstrated average harvest in cutblocks as
low as 160 m3/ha, with individual stands as low
as 80 m3/ha inventory volume.
6.1.15.2 20 Future WTR Localized WTR Targets are not
available from MSRM-Kamloops.
Used the standard methodology for WTR
targets, scaled to 1% of the THLB. Reserves
buffered by 500m and LUPG table A3.1 used to
calculate targets.
8.2 28 Managed vs.
natural stands
Insufficient rationale for modeling all
stands <41 years old with TIPSY.
Documented planting since 1961 and transition
to widespread planting between 1964 and 1971.
Demonstrated low risk of error during the
transition period.
8.5.4 36 G&Y for
deciduous
stands
Canfor is responsible for ensuring free-
growing coniferous conditions on all
stands established after 1986.
Polygons <18 years old labelled in the
inventory as deciduous-leading will be grown
on a coniferous MSYT curve.
8.6.1 37 Genetic gain
allowances
Insufficient documentation of
proportion of seed stock in each
genetic class.
Provided proportion of seed stock in each
genetic class for 2004 sowing year. Also
provided more information on how genetic
worth is prorated into analysis units.
8.6.3 41 Analysis units
for future
stands
Future MSYTs are linked to site series
assumptions, and must be pro-rated
into TEM polygons, creating the need
for further aggregation.
Future MSYTs were pro-rated into TEM
polygons based on the decile proportion of each
site series in the polygon. The resulting unique
yield tables were then clustered into 10 analysis
units based on similarities in volume growth.
10.2.1 54 Harvest
scheduling
rules
“Relative poorest first” scheduling, an
innovative harvest rule recently developed by
FESL, will be used for the base case.
10.2.3 57 Minimum
Harvest Age
Culmination-based minimum harvest
ages were artificially constraining
harvest.
Minimum harvest ages were set to the
minimum merchantable volume (125 m3/ha) in
conjunction with changing to the “Relative
poorest first” scheduling rule.
6.1.8,
6.1.10
16 Terrain and
difficult regen
Insufficient documentation of
performance.
Added text.
8.4.2 33 OAF1 OAF1 was incorrectly set to 10%
during generation of the MSYTs.
Yield tables were redone using OAF1 of 15%.
All MSYT statistics reported in the information
package were updated.
Appendix E Yield Tables Volumes reported were total volume Table updated to show net volumes pro-rated
for close utilization of Pl. These are the yield
tables used for analysis.

Canadian Forest Products Ltd. TFL 18 MP #10 Information Package
Forest Ecosystem Solutions Ltd. #210 – 275 Fell Avenue, North Vancouver BC, Canada V7P 3R5 tel 604-998-2222 fax 604-986-0361
2
Table of Acronyms
AAC Allowable Annual Cut
AU Analysis Unit
BEC Biogeoclimatic Ecosystem Classification
BEO Biodiversity Emphasis Option
DBH Diameter at Breast Height
DFA Defined Forest Area
DIB Diameter Inside Bark
DWB Decay, Waste, and breakage
ECA Equivalent Clearcut Area
ESA Environmentally Sensitive Area
EVC Existing Visual Condition
FDP Forest Development Plan
FESL Forest Ecosystem Solutions Ltd.
FIZ Forest Inventory Zone
FPC Forest Practices Code
FSOS Forest Simulation Optimization System
GIS Geographic Information Systems
HLPO Higher Level Plan Order
ITG Inventory Type Group
LMZ Lakeshore Management Zone
LU Landscape Unit
LUPG Landscape Unit Planning Guide
MAI Mean Annual Increment
MHA Minimum Harvestable Age
MoF British Columbia Ministry of Forests
MP Management Plan
MPB Mountain Pine Beetle
MSRM British Columbia Ministry of Sustainable Resource Management
MSYT Managed Stand Yield Table
NCLB Non-Contributing Land Base
NSR Not Satisfactorily Restocked
NSYT Natural Stand Yield Table
OAF Operational Adjustment Factor
OGMA Old Growth Management Area
OGSI Old Growth Site Index
OPR Operational Planning Regulation
PSI Potential Site Index

Canadian Forest Products Ltd. TFL 18 MP #10 Information Package
Forest Ecosystem Solutions Ltd. #210 – 275 Fell Avenue, North Vancouver BC, Canada V7P 3R5 tel 604-998-2222 fax 604-986-0361
3
RMZ Riparian Management Zone
RRZ Riparian Reserve Zone
RVQC Recommended Visual Quality Class
SFMP Sustainable Forest Management Plan
SI50 Site Index for age 50
SIA Site Index Adjustment
SIBEC Site index Biogeoclimatic Ecological Classification
SMZ Special Management Zone
TEM Terrestrial Ecosystem Map
TFL Tree Farm Licence
THLB Timber Harvesting Land Base
TIPSY Table Interpolation Program for Stand Yields
TSA Timber Supply Area
TSIL Terrain Survey Intensity Level
TSR Timber Supply Review
UWR Ungulate Winter Range
VAC Visual Absorption Capacity
VDYP Variable Density Yield Prediction
VEG Visually Effective Green-up
WHA Wildlife Habitat Area
WTP Wildlife Tree Patch
WTR Wildlife Tree Retention

Canadian Forest Products Ltd. TFL 18 MP #10 Information Package
Forest Ecosystem Solutions Ltd. #210 – 275 Fell Avenue, North Vancouver BC, Canada V7P 3R5 tel 604-998-2222 fax 604-986-0361
4
1 Introduction
Canadian Forest Products Ltd. (Canfor) is currently preparing Management Plan #10 for Tree Farm
Licence #18 (TFL 18). As part of the management plan process, Canfor is responsible for preparing a
timber supply analysis showing the long-term, strategic timber supply for the land base. This
information package documents the procedures, assumptions, data and model to be used in the analysis.
Forest Ecosystem Solutions Ltd. (FESL) has been engaged to prepare the information package and
conduct the timber supply analysis on behalf of Canfor. This package follows the format of the
Provincial Guide for the Submission of Timber Supply Information Packages for Tree Farm Licences,
Version 4.
The purpose of this Timber Supply Analysis Information Package is to:
Provide a detailed account of the factors related to timber supply that the Chief Forester must
consider under the Forest Act when determining an allowable annual cut (AAC) and how these
factors will be applied in the timber supply analysis;
Provide a means for communication between staff from Canfor, Ministry of Forests, Ministry of
Sustainable Resource Management and Ministry of Water, Land, and Air Protection;
Provide staff of the different ministries with the opportunity to review data and information that
will be used in the timber supply analysis before it is initiated;
Ensure that all relevant information is accounted for in the analysis to an acceptable standard;
Reduce the risk of having analyses rejected because input assumptions and analysis methods were
not agreed upon in advance.
Analysis will use FESL’s Forest Simulation and Optimization System (FSOS), a spatial, time-step
forest estate simulation and heuristic model in conjunction with FESL’s data preparation and analysis
approach.
Upon acceptance by the Forest Analysis Branch, the assumptions used in this information package will
be used to guide the development of the timber supply analysis. During the analysis, various sensitivity
analyses, harvest flow alternatives, and management options will be tested to determine the influence of
various factors on harvest levels. All analyses and the final proposed option will be submitted to the
Chief Forester for determination of the AAC.
Canadian Forest Products Ltd. TFL 18 MP #10 Information Package
Forest Ecosystem Solutions Ltd. #210 – 275 Fell Avenue, North Vancouver BC, Canada V7P 3R5 tel 604-998-2222 fax 604-986-0361
5
2 Process
This information package will be included as an appendix to the Timber Supply Analysis Report of
TFL 18 Management Plan (MP) #10. Its contents reflect current legislation and policies. Where
feasible, comments from public and resource agency review of the previous management plan were
considered in preparing this information package.
Forest resource and land base data come from several inventories conducted by Canfor and provincial
resource ministries. This information has been compiled into a GIS database maintained by Canfor,
and is the source for all summaries in the information package, unless where otherwise stated.
The Ministry of Forests (Forest Analysis Branch) will review the technical details in this information
package. The Headwaters Forest District and the Southern Interior Forest Region will review the
analysis assumptions presented in this document.
2.1 Data Preparation and Missing Data
FESL created a master database with a complete resultant polygon list from spatial information through
a series of GIS overlays. In the master database each polygon has a unique identification number.
The data described in this document is only as reliable as the databases that were used to generate it.
Though the data is believed to be accurate, an exact match was not always possible between
overlapping coverages. Some had to be manipulated to approximate a best fit. Although the final
resultant is a close approximation of the actual landscape, caution should be used when viewing
geographic data results.
With the consent of Canfor, FESL may modify any data, netdown order or calculation in the future, if it
will enhance the accuracy of this analysis. Any modifications to the dataset will be documented in
subsequent versions of the information package.

Canadian Forest Products Ltd. TFL 18 MP #10 Information Package
Forest Ecosystem Solutions Ltd. #210 – 275 Fell Avenue, North Vancouver BC, Canada V7P 3R5 tel 604-998-2222 fax 604-986-0361
6
3 Timber Supply Scenarios and Sensitivity Analyses
This section describes the Base Case, sensitivity analyses, and management scenarios that will be
presented in the Timber Supply Analysis Report.
3.1 Base Case
The Base Case reflects best available knowledge about current management activities and forest
development in TFL 18. Major attributes of the base case are:
Time-step simulation using the proprietary timber supply model, FSOS;
Rectified forest cover inventory (FC1 format), projected to January 1, 2004 and updated for
depletions;
Spatially-explicit netdowns for riparian reserve zones;
Standard non-spatial wildlife tree retention assumptions;
TIPSY yields for stands younger than 41 years old;
Custom growth and yield assumptions for IU Balsam stands;
TEM-based potential site index for existing and future managed stands;
OAF1 of 15% and OAF2 of 5%;
Ecosystem-based regeneration assumptions using TEM;
Genetic gain for pine and spruce components of future stands, adjusted for ingress and proxy
species;
Unsalvaged losses of 3000 m3/yr;
Forest cover requirements for VQOs and Lakes LRUP management objectives;
Maximum 10% forest health harvests in OGMAs and Preservation VQOs;
Forest cover requirements for riparian management zones;
Harvest scheduling using the “relative poorest first” rule;
Minimum harvest ages based on minimum merchantable volume of 125 m3/ha; and
Fixed harvest of FDP blocks during the first period.
An epidemic infestation of mountain pine beetle is expected on TFL 18 in the next 5 years. FESL and
Canfor are currently developing a set of assumptions for modeling this infestation in timber supply
analysis. These assumptions may be incorporated into the base case or, alternately, investigated as a
separate management scenario.
3.2 Sensitivity Analyses
Sensitivity analyses are used to assess issues that have some degree of uncertainty associated with
them, and to test the impact of specific management policies. For the base case scenario, sensitivity
analyses test assumptions related to the land base alterations, growth and yield, forest cover
requirements and harvest objectives. Sensitivity analyses to be included in the analysis report are listed
in Table 1.

Canadian Forest Products Ltd. TFL 18 MP #10 Information Package
Forest Ecosystem Solutions Ltd. #210 – 275 Fell Avenue, North Vancouver BC, Canada V7P 3R5 tel 604-998-2222 fax 604-986-0361
7
Table 1: Sensitivity analyses
Category Sensitivity Analysis
Land base alterations
Model OGMAs as a 100% netdown reduction
Model No Harvest LMZs as a 100% netdown reduction
Apply riparian management zones as a partial netdown reduction
Remove netdown for future wildlife tree retention
Growth and yield
Standard VDYP methodology for IU Balsam Stands
Inventory site index for Managed Stand Yield Tables
Adjust existing stand volumes +/- 10%
Adjust regenerated stand volumes +/-10%
Exclude deciduous volume from harvest
Deciduous NSYTs for young deciduous stands
Forest cover requirements and harvest objectives
Adjust Lakeshore management zones +/- 1 Lake Class
"Relative oldest first" scheduling (MHA at 90% culmination age)
Turn off VQOs
Turn off OGMAs
Turn off all forest cover requirements
Turn off all forest cover requirements and productive forest netdowns
Increase minimum merchantable volume to 150 m3/ha
Canadian Forest Products Ltd. TFL 18 MP #10 Information Package
Forest Ecosystem Solutions Ltd. #210 – 275 Fell Avenue, North Vancouver BC, Canada V7P 3R5 tel 604-998-2222 fax 604-986-0361
8
4 Model
The following modeling software will be used in the timber supply analysis for TFL 18:
Landscape Design Model - FSOS
Model Name: FSOS Model Developer: Dr. Guoliang Liu
Model Development: UBC, Hugh Hamilton Limited, Forest Ecosystem Solutions Ltd.
Model Type: Landscape Design Model
FSOS (Forest Simulation Optimization System) uses C++ programming language and can be run with
both Windows 95 and higher operating systems. The model interfaces directly with Microsoft Access
for data management. Although FSOS has both simulation and heuristic (psuedo-optimization)
capabilities, the time-step simulation mode will primarily be used in this analysis. Time-step
simulation grows the forest based on growth and yield inputs and harvests resultant polygons based on
user-specified harvest rules and constraints that cannot be exceeded. Using “hard” constraints and
harvest rules instead of targets (as would be applied in the heuristic mode of FSOS) gives results that
are repeatable and more easily interpreted.
A formal comparison of FSOS and FSSIM using a benchmark dataset was performed and submitted to
the Ministry of Forests Timber Supply Branch in 1998 (Hugh Hamilton Limited 1998a). Acceptance
notification correspondence was provided to Dave Waddell (currently Systems Forester, MoF
Development & Policy Section) in September 1998, authorizing FSOS for use in Timber Supply
Analysis to support AAC determinations in British Columbia.
From GIS overlay, the land base is divided into resultant polygons, each with a unique set of attributes.
Constraints and harvest criteria are applied to each polygon based on these attributes. Constraints and
harvest criteria can be defined by analysis unit, forest type, forest age, silvicultural treatment, user
allocation, site index, non-timber resource objectives or any other parameter.
FSOS uses individual stand ages to project the current age structure of stands in the analysis area. As
stands age, they move into and out of age classes established as a basis for meeting target objectives.
Generally, FSOS runs utilize 5-year periods, as the output is intended to be operationally applicable
and reflect 5-year management plan objectives, but 1,10 or 20 year periods can easily be assigned. The
middle of the period (year 3 for 5-year periods) is used for reporting.
The planning horizon length can vary as required. FSOS can produce spatially and temporally explicit
plans over 20 years or for multiple rotations. A unique feature of FSOS is its ability to integrate
strategic, tactical and operational planning phases into one process. Analysis runs include harvest
timing and location for each period, as well as long-term sustainable harvest levels.
The reporting functions of FSOS are extensive. The data for each period is easily accessible for any
analysis unit, zone, polygon, landscape unit, etc. and gives an overview of the forest state at any point
in time. Species compositions, age structure, patch distribution, harvest scheduling, and many other
variables are tracked and reported by period. Reporting functions are highly effective for the direct
comparison of differing sensitivity analysis scenarios. FSOS is linked directly to the powerful ArcMap
environment for high-quality map production.

Canadian Forest Products Ltd. TFL 18 MP #10 Information Package
Forest Ecosystem Solutions Ltd. #210 – 275 Fell Avenue, North Vancouver BC, Canada V7P 3R5 tel 604-998-2222 fax 604-986-0361
9
5 Forest Resource Inventory
5.1 Forest Cover Inventory
A Vegetation Resources Inventory has not been performed in TFL 18. The forest cover inventory for
TFL 18 has undergone substantial spatial and thematic modification that improves its accuracy relative
to the inventory used in previous timber supply analyses. The modifications described below have
been reviewed and approved by MSRM – Kamloops.
5.1.1 Inventory Audit
MoF Resources Inventory Branch conducted an inventory audit of the TFL18 Forest Cover Inventory
in 1995 (BC MoF 1997). The ratio of means between the average stand volume of the audit and the
inventory was 91%. However, this difference was not significant at a confidence level of 95%,
meaning there is no statistical difference between the inventory and the audit. A sensitivity analysis
will be performed to test the impact of a +/-10% change in the inventory volume.
5.1.2 Silvatech Forest Inventory Rectification Project
A forest inventory rectification project was completed for TFL18 in December 2003 (Silvatech 2003b).
The following text from the final report of this project describes the rationale for the rectification and
the general approach used. The final report for the TFL 18 forest inventory rectification project is
included in Appendix A.
In early 2002, Slocan Forest Products- Vavenby Division (now Canfor) approached Silvatech
Consulting Ltd. (Silvatech) of Salmon Arm BC, to update forest cover history for Tree Farm
Licence 18, in advance of pending planning initiatives.
After a comprehensive review of the forest cover, Slocan and Silvatech agreed that prior to
conducting history updates, the spatial accuracy of the existing forest cover data should be
corrected. Once the forest cover map base was positionally rectified, opening and road updates
could then be added to the spatially correct forest cover map base. At the onset of the project, it
became apparent that spatial inaccuracies, inherent in the existing forest cover base mapping, were
the direct result of inadequate georeferencing (control) during the transfer of inventory lines from
the typed aerial photography to digital forest cover base mapping. These problems were then
compounded by several years of “rubber sheeting” (stretching) to make new linework fit the
positionally inaccurate forest cover base mapping.
Following the collection of all available information and after assessing the scope of the problem
and possible approaches, the recapture and control of the existing 1992 forest inventory photo
stratification (1974 photography) was selected as the most cost-effective solution. This process
included digitizing (monorestitution-MicrostationTM
) and the accurate georeferencing of the
inventory photos to established British Columbia TRIM control. Upon completion of the existing
forest cover rectification, the positionally correct base was then updated with post-1992 openings
and roads, using a combination of orthorectified 5 meter IRSTM
satellite imagery, 1996 ortho-
photography and information provided by Slocan, to update harvesting and road history to January
2002.
Upon completion of the spatial update, Slocan initiated the normalization of the forest cover
database to an MSRM standard format. In the latter stages of this process, a process was
developed to link Slocan- Vavenby’s internal silviculture record keeping system (Phoenix) and

Canadian Forest Products Ltd. TFL 18 MP #10 Information Package
Forest Ecosystem Solutions Ltd. #210 – 275 Fell Avenue, North Vancouver BC, Canada V7P 3R5 tel 604-998-2222 fax 604-986-0361
10
Ministry of Forests ISIS system to the Forest Cover database. From the updated FC database, a
process to update the spatial FC opening linework and labels followed.
5.1.3 Other modifications to the forest cover inventory
Overall, the quality of the forest inventory provided was high. However, a detailed evaluation of the
forest inventory provided identified some problem attributes for polygons that were previously updated
from Canfor’s Phoenix database. To correct and update the attributes for the polygons identified,
Canfor and FESL collaborated to verify and update selected forest cover attributes based on Canfor’s
Phoenix database. Identified problems included polygons where species composition, stocking class,
crown closure, and/or site index were missing.
For about five records, the decision was to change the linkage between the forest inventory and the
Phoenix database based on a visual comparison with a georeferenced digital aerial photography mosaic
(“air photos” hereafter) provided by Canfor. Occasionally, it was necessary to assign attributes from a
different Phoenix layer (rank not being 1) to the forest inventory as the visual comparison with the air
photos would clearly indicate that incorrect layer attributes had been assigned to the forest inventory.
In addition, for a total of 9 polygons no forest cover attributes were available. Forest inventory
attributes could be assigned to 4 polygons, but a further 5 polygons representing a total of about 20ha
remained without attributes.
5.1.3.1. Updates for depletions
Canfor had provided air photos current to August or September of 2003. These images were used to
further verify the inventory and the depletion coverages provided. A comparison of these sources
(depletion data was provided by both Canfor and by BCTS) identified further problems. This time, the
inventory and depletion data was compared to the information provided by the digital air photos, and
areas of conflict were identified, such as the inventory or depletion data indicating NSR but the air
photos showing mature forest.
While Canfor’s forest inventory, depletion coverage and 2004 Forest Development Plan matched the
air photos very well, the depletion and 2004 Forest Development Plan provided by BCTS was
associated with spatial shifts and other inaccuracies. In addition, while the two Forest Development
Plans contained often the same blocks, the shape and the attributes were not well matched. To correct
the problems introduced by updating the forest inventory from depletion data, the following decisions
were made:
Accept Canfor depletion data for blocks that exist in both depletion or Forest Development
Plans as correct (based on a visual check with the air photos);
Accept Canfor depletion data for NSR blocks even if the digital air photos show standing
timber, provided that the date of logging was after September 2003 (more recent than the air
photos); or
Where BCTS blocks could not be verified using the air photos and/or input from Dean
Christianson (BCTS Practices Forester, BC MoF), the decision was made to remove the BCTS
blocks.
5.1.3.2. Inventory projection
The updated forest cover inventory was projected to January 1, 2004 using BatchVDYP version 6.6d.
Volumes and heights for each polygon were interpolated from the output yield tables to ensure that
yields are precise to the current age of the stand. A current age (as of January 1, 2004 was calculated
Canadian Forest Products Ltd. TFL 18 MP #10 Information Package
Forest Ecosystem Solutions Ltd. #210 – 275 Fell Avenue, North Vancouver BC, Canada V7P 3R5 tel 604-998-2222 fax 604-986-0361
11
based on projected age for records that were not previously linked to Silvatech, and which had
remained projected to 2001. The current age for all other records, i.e. Phoenix records, was based on
the inventory age and the inventory reference age. With current age being available, together with all
other required key forest inventory attributes, volumes and heights were projected using BatchVDYP
version 6.6d, as indicated.
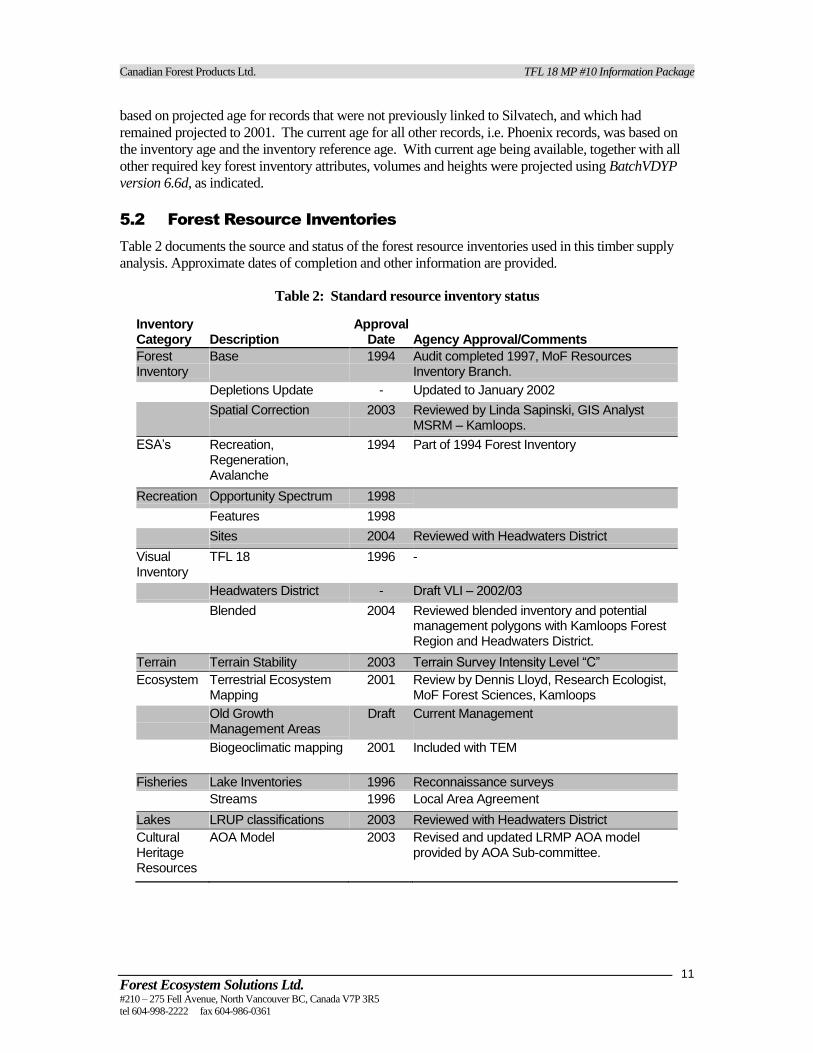
5.2 Forest Resource Inventories
Table 2 documents the source and status of the forest resource inventories used in this timber supply
analysis. Approximate dates of completion and other information are provided.
Table 2: Standard resource inventory status
Inventory Category Description
Approval Date Agency Approval/Comments
Forest Inventory
Base 1994 Audit completed 1997, MoF Resources Inventory Branch.
Depletions Update - Updated to January 2002
Spatial Correction 2003 Reviewed by Linda Sapinski, GIS Analyst MSRM – Kamloops.
ESA’s Recreation, Regeneration, Avalanche
1994 Part of 1994 Forest Inventory
Recreation Opportunity Spectrum 1998
Features 1998
Sites 2004 Reviewed with Headwaters District
Visual Inventory
TFL 18 1996 -
Headwaters District - Draft VLI – 2002/03
Blended 2004 Reviewed blended inventory and potential management polygons with Kamloops Forest Region and Headwaters District.
Terrain Terrain Stability 2003 Terrain Survey Intensity Level “C”
Ecosystem Terrestrial Ecosystem Mapping
2001 Review by Dennis Lloyd, Research Ecologist, MoF Forest Sciences, Kamloops
Old Growth Management Areas
Draft Current Management
Biogeoclimatic mapping 2001 Included with TEM
Fisheries Lake Inventories 1996 Reconnaissance surveys
Streams 1996 Local Area Agreement
Lakes LRUP classifications 2003 Reviewed with Headwaters District
Cultural Heritage Resources
AOA Model 2003 Revised and updated LRMP AOA model provided by AOA Sub-committee.
Canadian Forest Products Ltd. TFL 18 MP #10 Information Package
Forest Ecosystem Solutions Ltd. #210 – 275 Fell Avenue, North Vancouver BC, Canada V7P 3R5 tel 604-998-2222 fax 604-986-0361
12
6 Description of the Land Base
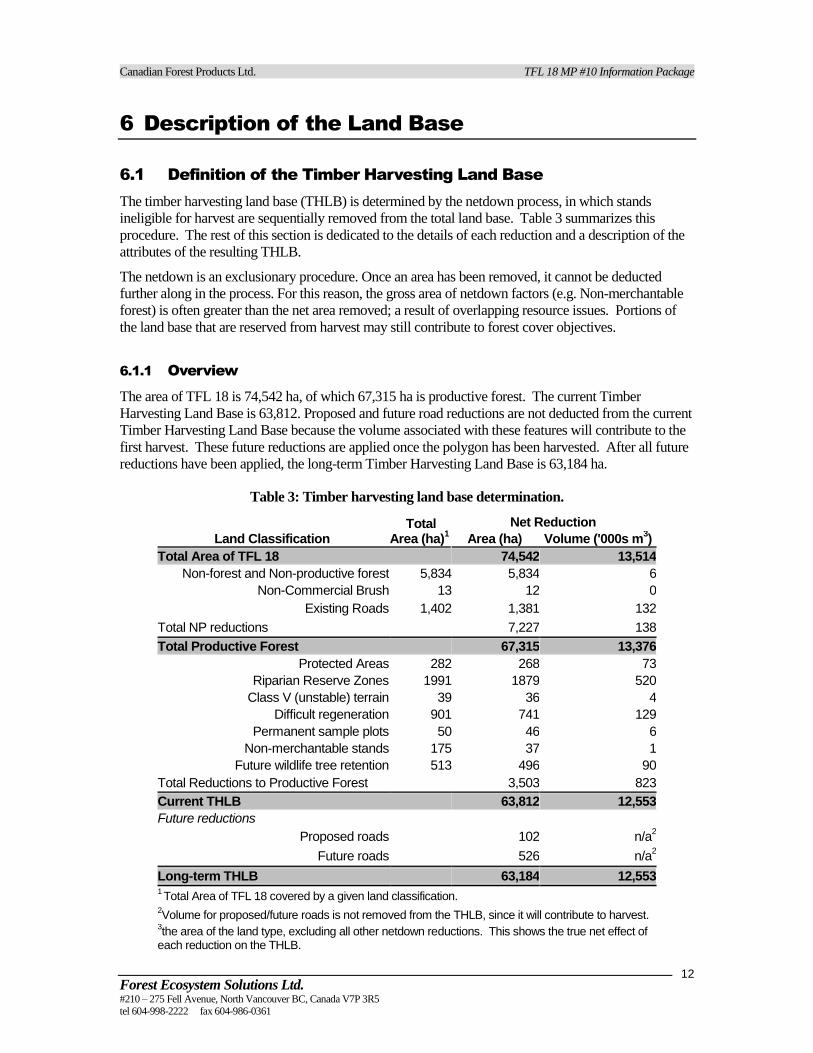
6.1 Definition of the Timber Harvesting Land Base
The timber harvesting land base (THLB) is determined by the netdown process, in which stands
ineligible for harvest are sequentially removed from the total land base. Table 3 summarizes this
procedure. The rest of this section is dedicated to the details of each reduction and a description of the
attributes of the resulting THLB.
The netdown is an exclusionary procedure. Once an area has been removed, it cannot be deducted
further along in the process. For this reason, the gross area of netdown factors (e.g. Non-merchantable
forest) is often greater than the net area removed; a result of overlapping resource issues. Portions of
the land base that are reserved from harvest may still contribute to forest cover objectives.
6.1.1 Overview
The area of TFL 18 is 74,542 ha, of which 67,315 ha is productive forest. The current Timber
Harvesting Land Base is 63,812. Proposed and future road reductions are not deducted from the current
Timber Harvesting Land Base because the volume associated with these features will contribute to the
first harvest. These future reductions are applied once the polygon has been harvested. After all future
reductions have been applied, the long-term Timber Harvesting Land Base is 63,184 ha.
Table 3: Timber harvesting land base determination.
Land Classification Total
Area (ha)1
Net Reduction
Area (ha) Volume ('000s m3)
Total Area of TFL 18 74,542 13,514
Non-forest and Non-productive forest 5,834 5,834 6
Non-Commercial Brush 13 12 0
Existing Roads 1,402 1,381 132
Total NP reductions 7,227 138
Total Productive Forest 67,315 13,376
Protected Areas 282 268 73
Riparian Reserve Zones 1991 1879 520
Class V (unstable) terrain 39 36 4
Difficult regeneration 901 741 129
Permanent sample plots 50 46 6
Non-merchantable stands 175 37 1
Future wildlife tree retention 513 496 90
Total Reductions to Productive Forest 3,503 823
Current THLB 63,812 12,553
Future reductions
Proposed roads 102 n/a2
Future roads 526 n/a2
Long-term THLB 63,184 12,553 1 Total Area of TFL 18 covered by a given land classification.
2Volume for proposed/future roads is not removed from the THLB, since it will contribute to harvest.
3the area of the land type, excluding all other netdown reductions. This shows the true net effect of
each reduction on the THLB.
Canadian Forest Products Ltd. TFL 18 MP #10 Information Package
Forest Ecosystem Solutions Ltd. #210 – 275 Fell Avenue, North Vancouver BC, Canada V7P 3R5 tel 604-998-2222 fax 604-986-0361
13
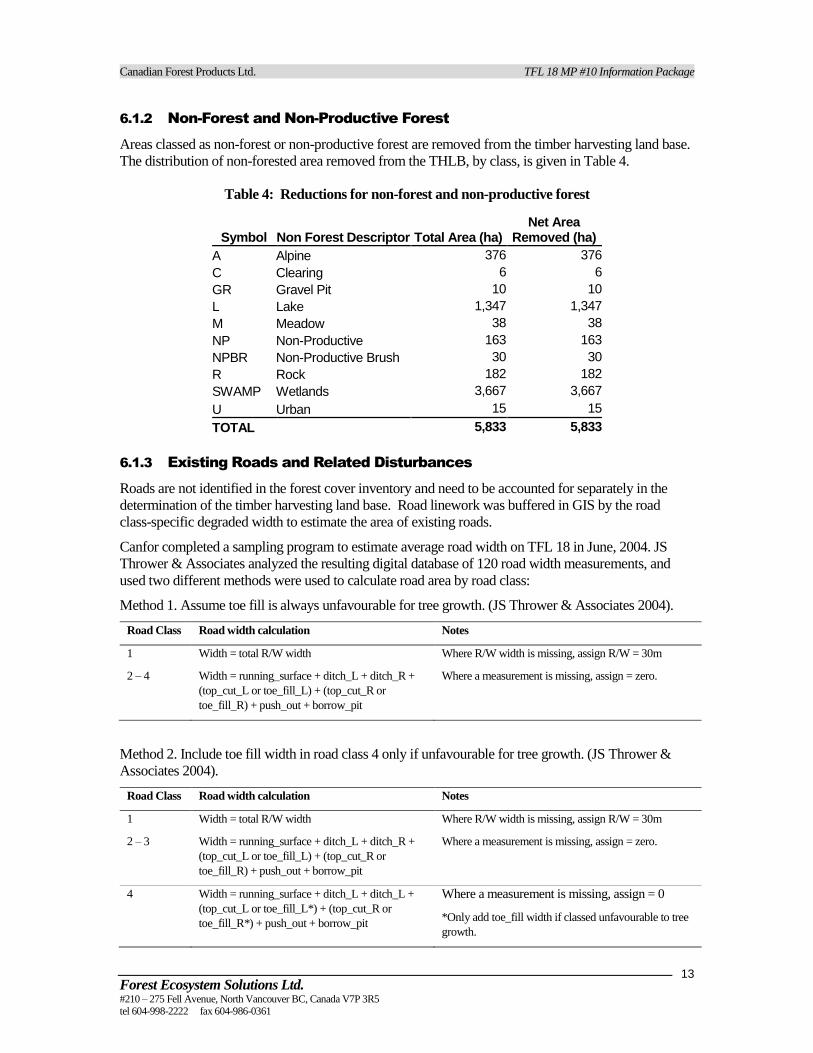
6.1.2 Non-Forest and Non-Productive Forest
Areas classed as non-forest or non-productive forest are removed from the timber harvesting land base.
The distribution of non-forested area removed from the THLB, by class, is given in Table 4.
Table 4: Reductions for non-forest and non-productive forest
Symbol Non Forest Descriptor Total Area (ha) Net Area
Removed (ha)
A Alpine 376 376
C Clearing 6 6
GR Gravel Pit 10 10
L Lake 1,347 1,347
M Meadow 38 38
NP Non-Productive 163 163
NPBR Non-Productive Brush 30 30
R Rock 182 182
SWAMP Wetlands 3,667 3,667
U Urban 15 15
TOTAL 5,833 5,833
6.1.3 Existing Roads and Related Disturbances
Roads are not identified in the forest cover inventory and need to be accounted for separately in the
determination of the timber harvesting land base. Road linework was buffered in GIS by the road
class-specific degraded width to estimate the area of existing roads.
Canfor completed a sampling program to estimate average road width on TFL 18 in June, 2004. JS
Thrower & Associates analyzed the resulting digital database of 120 road width measurements, and
used two different methods were used to calculate road area by road class:
Method 1. Assume toe fill is always unfavourable for tree growth. (JS Thrower & Associates 2004).
Road Class Road width calculation Notes
1 Width = total R/W width Where R/W width is missing, assign R/W = 30m
2 – 4 Width = running_surface + ditch_L + ditch_R +
(top_cut_L or toe_fill_L) + (top_cut_R or
toe_fill_R) + push_out + borrow_pit
Where a measurement is missing, assign = zero.
Method 2. Include toe fill width in road class 4 only if unfavourable for tree growth. (JS Thrower &
Associates 2004).
Road Class Road width calculation Notes
1 Width = total R/W width Where R/W width is missing, assign R/W = 30m
2 – 3 Width = running_surface + ditch_L + ditch_R +
(top_cut_L or toe_fill_L) + (top_cut_R or
toe_fill_R) + push_out + borrow_pit
Where a measurement is missing, assign = zero.
4 Width = running_surface + ditch_L + ditch_L +
(top_cut_L or toe_fill_L*) + (top_cut_R or
toe_fill_R*) + push_out + borrow_pit
Where a measurement is missing, assign = 0
*Only add toe_fill width if classed unfavourable to tree
growth.
Canadian Forest Products Ltd. TFL 18 MP #10 Information Package
Forest Ecosystem Solutions Ltd. #210 – 275 Fell Avenue, North Vancouver BC, Canada V7P 3R5 tel 604-998-2222 fax 604-986-0361
14
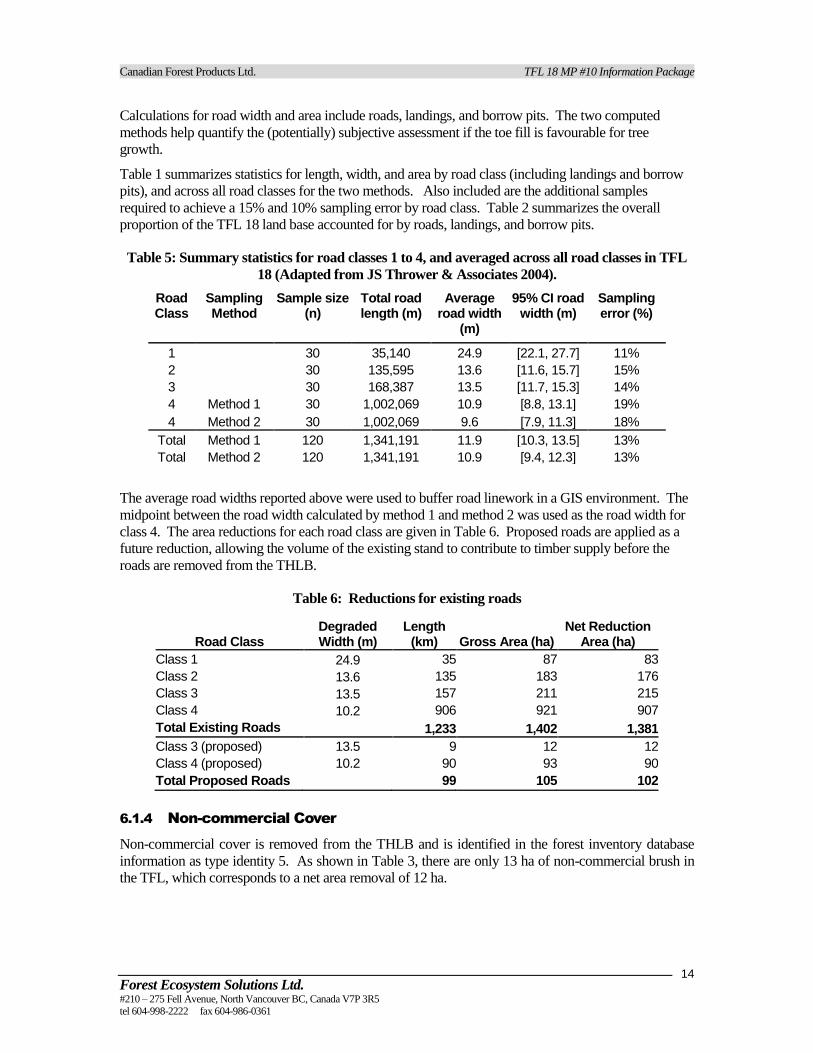
Calculations for road width and area include roads, landings, and borrow pits. The two computed
methods help quantify the (potentially) subjective assessment if the toe fill is favourable for tree
growth.
Table 1 summarizes statistics for length, width, and area by road class (including landings and borrow
pits), and across all road classes for the two methods. Also included are the additional samples
required to achieve a 15% and 10% sampling error by road class. Table 2 summarizes the overall
proportion of the TFL 18 land base accounted for by roads, landings, and borrow pits.
Table 5: Summary statistics for road classes 1 to 4, and averaged across all road classes in TFL
18 (Adapted from JS Thrower & Associates 2004).
Road Class
Sampling Method
Sample size (n)
Total road length (m)
Average road width
(m)
95% CI road width (m)
Sampling error (%)
1 30 35,140 24.9 [22.1, 27.7] 11%
2 30 135,595 13.6 [11.6, 15.7] 15%
3 30 168,387 13.5 [11.7, 15.3] 14%
4 Method 1 30 1,002,069 10.9 [8.8, 13.1] 19%
4 Method 2 30 1,002,069 9.6 [7.9, 11.3] 18%
Total Method 1 120 1,341,191 11.9 [10.3, 13.5] 13%
Total Method 2 120 1,341,191 10.9 [9.4, 12.3] 13%
The average road widths reported above were used to buffer road linework in a GIS environment. The
midpoint between the road width calculated by method 1 and method 2 was used as the road width for
class 4. The area reductions for each road class are given in Table 6. Proposed roads are applied as a
future reduction, allowing the volume of the existing stand to contribute to timber supply before the
roads are removed from the THLB.
Table 6: Reductions for existing roads
Road Class Degraded Width (m)
Length (km) Gross Area (ha)
Net Reduction Area (ha)
Class 1 24.9 35 87 83
Class 2 13.6 135 183 176
Class 3 13.5 157 211 215
Class 4 10.2 906 921 907
Total Existing Roads 1,233 1,402 1,381
Class 3 (proposed) 13.5 9 12 12
Class 4 (proposed) 10.2 90 93 90
Total Proposed Roads 99 105 102
6.1.4 Non-commercial Cover
Non-commercial cover is removed from the THLB and is identified in the forest inventory database
information as type identity 5. As shown in Table 3, there are only 13 ha of non-commercial brush in
the TFL, which corresponds to a net area removal of 12 ha.

Canadian Forest Products Ltd. TFL 18 MP #10 Information Package
Forest Ecosystem Solutions Ltd. #210 – 275 Fell Avenue, North Vancouver BC, Canada V7P 3R5 tel 604-998-2222 fax 604-986-0361
15
6.1.5 Parks
Taweel Park covers a total of 282 ha in the southern portion of the TFL, 268 ha of which is productive
forest. Although this protected area contributes to some forest cover objectives for TFL 18, it is not
available for timber harvesting and is excluded from the timber harvesting land base.
6.1.6 Physically Inoperable
Specific areas where harvesting is not practised for reasons of accessibility or worker safety are
described as physically inoperable. Due to the moderate terrain of TFL18, no area removals are
required for physical inoperability.
6.1.7 Riparian Reserves and Management Zones
Table 7 shows the calculation of total riparian management area buffer width by stream class. The
RMA buffer widths and basal area retention levels are consistent with the FPC Riparian Management
Area Guidebook. A GIS buffer function was used to determine the spatial distribution of riparian
reserve zones (RRZs) and riparian management zones (RMZs). Where buffers of different riparian
classes overlap, the larger buffer takes precedence.
Table 7: Calculation of total riparian buffer widths for streams, lakes, and wetlands
Riparian Class
Riparian Management Zones Riparian Reserve Zones
RMZ Width (m)
RMZ BA retention %
Total RMZ Area (ha)
net RMZ removals
(ha)
RRZ Width
(m)
Total RRZ Area (ha)
net RRZ removals (ha)
S1 20 50% 103 0 50 316 280
S2 20 50% 131 0 30 229 221
S3 20 50% 465 0 20 507 483
S4 30 25% 190 0 0 0 0
S5 30 25% 1,200 0 0 0 0
S6 20 5% 2,998 0 0 0 0
Streams 5,087 0 1,052 985
L1 40 25% 361 0 10 118 105
L3 30 25% 133 0 10 29 22
Lakes 494 0 147 127
W1 40 25% 1,503 0 10 495 480
W3 30 25% 949 0 0 0 0
W5 40 25% 975 0 10 297 287
Wetlands 3,427 0 792 767
Total RMA Reductions 9,008 1,990 1,879
6.1.7.1. Riparian reserve zones
Riparian reserve zones occupy a total area of 1990 ha of the TFL, and the entire area of riparian reserve
zones is removed from the timber harvesting land base. This corresponds to a net area removal of
1,879 ha.

Canadian Forest Products Ltd. TFL 18 MP #10 Information Package
Forest Ecosystem Solutions Ltd. #210 – 275 Fell Avenue, North Vancouver BC, Canada V7P 3R5 tel 604-998-2222 fax 604-986-0361
16
6.1.7.2. Riparian Management Zones
Riparian management zones occupy 9008 ha of the TFL. Consistent with the recommendations of the
Riparian Management Area Guidebook, various levels of harvesting retention are practised within
RMZs. However, partial retention in RMZs is not uniform: the amount of retention on any given site
depends on the state of adjacent stands, windfirmness, and riparian sensitivity to harvesting. stem
retention in RMZs will be modelled in this timber supply analysis as a forest cover requirement
(Section 10.1.5: Riparian Management Zones) to reflect the spatially and temporally dynamic nature of
retention in the RMZs of TFL18. Consequently there are no net area removals associated with RMZs.
6.1.8 Unstable Terrain
Terrain stability mapping has been completed for TFL 18 at a scale of 1:15,000 and a Terrain Survey
Intensity Level C (TSIL-C). It identified areas of potential (class IV) and active (class V) instability.
Percent reductions for these classes are based on an operational review completed by Canfor staff in
August 2004. Terrain polygons were plotted on a 1:40000 map depicting the harvest history, road
networks, terrain, and riparian features. Each class IV and V polygon was reviewed in relation to
geographic attributes to determine if current or readily available harvest methods could access and
harvest each polygon. Polygons were assessed for the likelihood that road access through the polygon
would be required. Very few of the areas mapped had past harvest history. Class IV terrain polygons
have a reasonable likelihood of being harvested, subject to timber values and on-site terrain assessment
results. Class V terrain polygons represent the landscape extreme on TFL 18, and are generally located
on gully headwalls or on steep slopes. Given the total area of these polygons, and the risks associated
with harvest and/or road construction on them, it is likely that any development incorporating these
polygons would remove them from the harvest area.
Based on this review, Class IV terrain was not removed from the THLB and Class V terrain was given
a full netdown. Netdown removals of unstable terrain are shown in Table 8.
Table 8: Reductions for unstable terrain
Slope Stability Class Description
Gross Area (ha)
% reduction to THLB
Net Reduction Area (ha)
I, II, or III Stable 73,568 0 0
IV Potentially unstable 935 0 0
V Unstable 38 100 36
6.1.9 Permanent Sample Plots
There are 198 permanent sample plots in TFL 18. These plots are part of an ongoing sampling
program that supplement provincial growth and yield data. To reflect harvest restrictions around PSPs
(Bob MacDonald, Growth & Yield Forester, MSRM, pers. comm..) a 50-m GIS buffer was created
around 64 plots classified as growth and yield PSPs. This corresponds to a total area of 50 ha and a net
THLB reduction of 45 hectares.
6.1.10 Difficult regeneration
The Environmentally Sensitive Areas (ESA) classification from the Forest Cover Inventory was used to
identify areas associated with a high probability of regeneration failure (ESA-P). As part of an
operational performance review conducted internally by Canfor, ESA P & SP polygons were plotted on
a 1:40000 map depicting the harvest history, road networks, terrain, and riparian features. Polygons

Canadian Forest Products Ltd. TFL 18 MP #10 Information Package
Forest Ecosystem Solutions Ltd. #210 – 275 Fell Avenue, North Vancouver BC, Canada V7P 3R5 tel 604-998-2222 fax 604-986-0361
17
were assessed for regeneration issues that may evolve if the area was harvested. It is clear that the
majority of ESA “high” polygons are at the ecological extremes of the TFL – generally cold, high
elevation, possibly colluvial rock, and either hygric or xeric site extremes. Harvest history is virtually
absent within the polygons reviewed.
Areas with high regeneration sensitivity (ESA1-P) are assumed to be avoided for harvest and receive a
100% reduction in the Netdown. Moderate regeneration sensitivity (ESA2-P) is assumed to be
addressed through modified silviculture practices rather than harvest avoidance, and is not included in
the netdown. Table 9 summarizes the netdown for sites associated with difficult regeneration.
Table 9: Summary of the netdown for difficult regeneration
ESAHIGH ESALOW Gross
Area (ha) % reduction to
THLB Net Reduction
Area (ha)
P 176 100% 170
SP1 724 100% 571
P 681 0% 0
SP 238 0% 0
Total 1,819 741
1SP indicates that the polygon has an ESA designation for both
sensitive soils (S) and difficult regeneration (P). Since sensitive soils are addressed through terrain stability mapping, and ESA-SP designation is equivalent to ESA-P.
6.1.11 Campsites/Recreation Areas
Although several campsites and recreation areas are located in TFL 18, no associated harvest
exclusions are expected. Visual quality management for recreation quality is addressed as a suite of
forest cover requirements (Section 10).
6.1.12 Cultural Heritage Resource Reductions
To date, no significant modifications to harvesting plans have been necessary for protection of cultural
heritage resources. Protection of these features in the future is expected to be accommodated using
riparian and wildlife tree reserves. Consequently, there are no associated area reductions to the timber
harvesting land base.
6.1.13 Not-Satisfactorily Restocked Conditions
Canfor is committed to prompt regeneration of all current NSR. As a result, NSR lands are not
excluded from the land base. A summary of the distribution on NSR lands is given in Section 8.6.4.
6.1.14 Non-merchantable sites
Various combinations of site index, tree species, and stand height were used in MP9 timber supply
analysis (Hugh Hamilton Ltd. 1998) to identify netdown reductions for low productivity sites and non-
merchantable stands. These criteria were deemed overly complicated and difficult to demonstrate
during the development of netdown assumptions for MP10. Canfor staff identified existing stand

Canadian Forest Products Ltd. TFL 18 MP #10 Information Package
Forest Ecosystem Solutions Ltd. #210 – 275 Fell Avenue, North Vancouver BC, Canada V7P 3R5 tel 604-998-2222 fax 604-986-0361
18
volume as the primary determinant of merchantability, and identified 125 m3/ha as the minimum
merchantable volume in TFL 18. Natural stand yield tables (Section 8: Growth and Yield) were used
to identify stands that are not projected to attain this threshold within the 250-year planning horizon.
These stands were removed from the Timber Harvesting Land Base. Stands less than 41 years old are
assumed to originate from timber harvesting and were maintained within the timber harvesting land
base. Table 10 summarizes reductions for non-merchantable stands.
Table 10: Reductions for Non-merchantable stands
Leading Species Current
Age
Projected Maximum Net
Volume Gross Area
(ha) Net Reduction
Area (ha)
Deciduous
>40 Years <125 m3/ha
11 11
Subalpine fir 89 19
Western redcedar 0 0
Douglas-fir 0 0
Lodgepole pine 67 0
Spruce 8 8
Total 175 38
The netdown reduction for non-merchantable stands is substantially less than the corresponding area in
the MP9 analysis. This is a result of using a dynamic attribute, natural stand yield table (NSYT)
volume, to define merchantability rather than static forest inventory attributes such as height, species,
and site index. As shown in Table 10, most stands are projected to attain volumes of greater than 125
m3/ha within the planning horizon. Nevertheless, many stands in the timber harvesting land base are
currently non-merchantable because their volume is below 125 m3/ha. These stands will be harvested
throughout the planning horizon as they become merchantable. Further discussion of merchantability
and minimum harvest ages is given in Section 10.2.3. A sensitivity analysis will test the timber supply
impact of increasing the volume threshold for minimum merchantability.
Table 11: Area of currently non-merchantable stands by age class
Age Class Productive Area (ha) Net Area (ha)
3 41-60 years 1 1
4 61-80 years 20 18
5 81-100 years 0 0
6 101-120 years 55 11
7 121-140 years 0 0
8 141-250 years 91 0
9 >250 years 8 8
Total 175 38
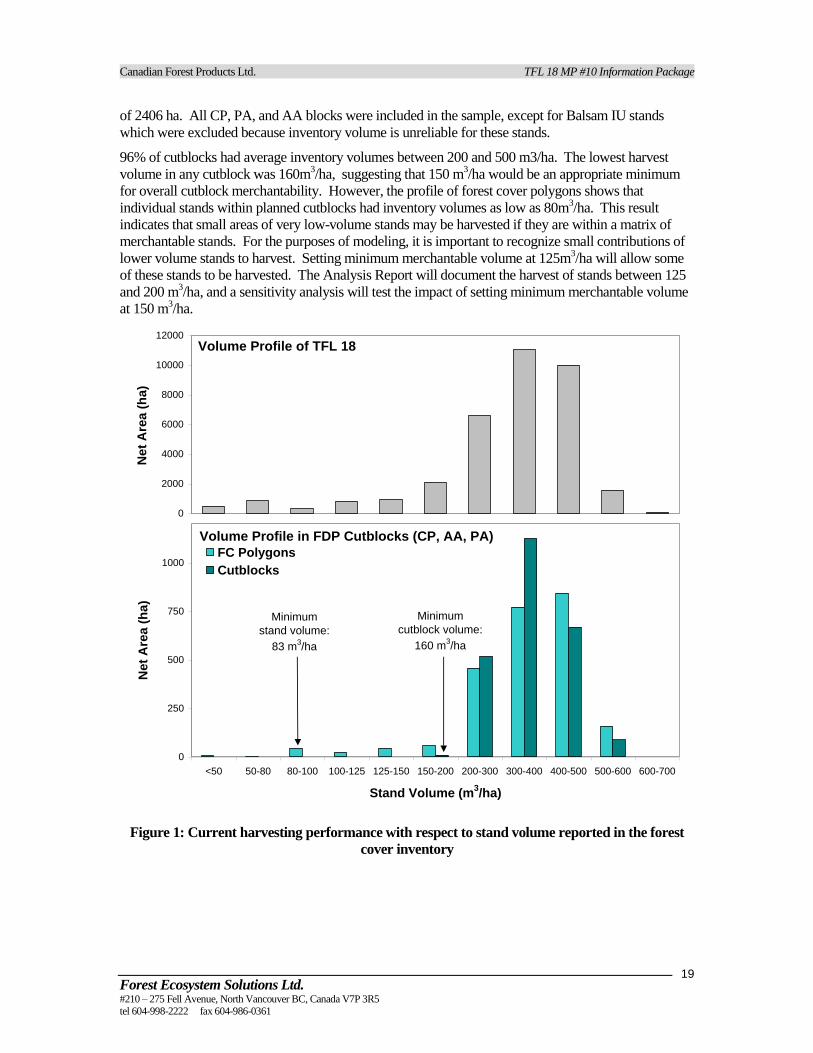
6.1.14.1. Performance
Figure 1 shows the volume profile of TFL 18, and the volume profile of planned cutblocks (CP, AA, or
PA status). Two cutblock profiles are shown: (1) the volume of individual forest cover polygons, and
(2) the average volume of each cutblock. The total sample size is 81 planned cutblocks with a net area
Canadian Forest Products Ltd. TFL 18 MP #10 Information Package
Forest Ecosystem Solutions Ltd. #210 – 275 Fell Avenue, North Vancouver BC, Canada V7P 3R5 tel 604-998-2222 fax 604-986-0361
19
of 2406 ha. All CP, PA, and AA blocks were included in the sample, except for Balsam IU stands
which were excluded because inventory volume is unreliable for these stands.
96% of cutblocks had average inventory volumes between 200 and 500 m3/ha. The lowest harvest
volume in any cutblock was 160m3/ha, suggesting that 150 m
3/ha would be an appropriate minimum
for overall cutblock merchantability. However, the profile of forest cover polygons shows that
individual stands within planned cutblocks had inventory volumes as low as 80m3/ha. This result
indicates that small areas of very low-volume stands may be harvested if they are within a matrix of
merchantable stands. For the purposes of modeling, it is important to recognize small contributions of
lower volume stands to harvest. Setting minimum merchantable volume at 125m3/ha will allow some
of these stands to be harvested. The Analysis Report will document the harvest of stands between 125
and 200 m3/ha, and a sensitivity analysis will test the impact of setting minimum merchantable volume
at 150 m3/ha.
0
250
500
750
1000
<50 50-80 80-100 100-125 125-150 150-200 200-300 300-400 400-500 500-600 600-700
Stand Volume (m3/ha)
Net
Are
a (
ha)
FC Polygons
Cutblocks
Minimum
cutblock volume:
160 m3/ha
Volume Profile in FDP Cutblocks (CP, AA, PA)
Minimum
stand volume:
83 m3/ha
0
2000
4000
6000
8000
10000
12000
Ne
t A
rea
(h
a)
Volume Profile of TFL 18
Figure 1: Current harvesting performance with respect to stand volume reported in the forest
cover inventory

Canadian Forest Products Ltd. TFL 18 MP #10 Information Package
Forest Ecosystem Solutions Ltd. #210 – 275 Fell Avenue, North Vancouver BC, Canada V7P 3R5 tel 604-998-2222 fax 604-986-0361
20
6.1.15 Wildlife Tree Retention
6.1.15.1. Existing wildlife tree patches
Canfor has left wildlife tree patches in all cutblocks since 1995 in accordance with the Biodiversity
Guidebook and the Landscape Unit Planning Guide. Based on a landscape-level analysis of WTP
requirements, Canfor has also designated a network of spatially explicit future wildlife tree patches
across TFL 18. However, the MSRM is scheduled to release new draft wildlife tree retention (WTR)
targets for the Kamloops LRMP area in early 2005. These new targets are expected to substantially
alter management for WTR in TFL 18, essentially nullifying the existing wildlife tree patches. To
ensure that the timber supply analysis is consistent with the management regime for the period of
Management Plan 10 (2005-2010), the netdown for wildlife tree retention will reflect only the
forthcoming MSRM targets. Consequently, there are no THLB removals associated with existing
wildlife tree patches.
6.1.15.2. Future wildlife tree retention
The methodology for determining area removals for wildlife tree retention was prescribed by Dave
Mcbeth (Planning Officer, MSRM Kamloops) in an email sent July 29, 2004. To determine the portion
of the TFL that requires wildlife tree retention (Zone A), a 500-meter GIS buffer was applied to
existing reserves (defined as >75% total reduction) that are age class 4 or greater. OGMAs were
included as existing reserves for the purpose of this exercise, even though they are modeled using forest
cover requirements rather than a netdown removal.
Draft WTR targets for the biogeoclimatic subzones of the Clearwater landscape unit were provided by
Susan Omelchuk, Sustainable Resource Management Planner, MSRM-Kamloops (pers. comm..
October 21, 2004). However, assumptions were required to address two areas of uncertainty around
the WTR requirements in TFL18:
1. The distribution of these targets within TFL18 as opposed to outside TFL18 is not yet
determined. Distribution was assumed to be even for the purposes of timber supply analysis,
meaning that the target for TFL18 is based on the proportion of each BGC subzone that occurs
within TFL18.
2. The proportion of these targets that is to be withdrawn from the THLB is not specified
for each BGC subzone. Overall, the THLB should provide 48.3% of the WTR targets in the
Clearwater LU. This percentage was applied to all BGC subzones, consistent with guidance
from Susan Omelchuk (pers. comm.. October 21, 2004).
Table 11 summarizes the process for determining the netdown for wildlife tree retention. Total WTR
targets for each BGC subzone were multiplied by 48.3% to estimate the THLB target. The THLB
target in TFL 18 was estimated by multiplying the Clearwater LU THLB target with the proportion of
the total area of each BGC subzone that is located within TFL18. This area was netted out of the
THLB by applying a uniform % reduction to Zone A—the THLB requiring wildlife tree patches.

Canadian Forest Products Ltd. TFL 18 MP #10 Information Package
Forest Ecosystem Solutions Ltd. #210 – 275 Fell Avenue, North Vancouver BC, Canada V7P 3R5 tel 604-998-2222 fax 604-986-0361
21
Table 12: Future wildlife tree patch requirements
BGC Subzone
Total area in Clearwater
LU (ha)
WTP area target (ha) % of total
area in TFL 18
THLB Target in
TFL18
Zone A—THLB
requiring WTR (ha)
WTR reduction
within Zone A Total THLB
1
ESSFdc 6,185 48 23 54% 13 1,232 1.0%
ESSFvv 2,054 0 0 100% 0 151 0.0%
ESSFwc 38,427 868 419 78% 325 6,678 4.9%
ICHmk 10,540 204 99 58% 57 1,566 3.7%
ICHmw 25,711 121 58 19% 11 2,456 0.5%
SBSdw 1,564 7 3 100% 3 49 6.9%
SBSmm 23,912 182 88 87% 76 2,174 3.5%
Total 108,393 1,430 691 63% 486 14,306 3.4% 1THLB target is assumed to be 48.3% of the total target (Susan Omelchuk, pers. Comm. October 21, 2004)
6.1.16 Future Roads
To estimate future access requirements (beyond proposed roads), road density in recent cutblocks is
extrapolated to the currently inaccessible timber harvesting land base. This procedure follows the steps
described below.
Step 1—Buffer the existing road network
To estimate the areas that are currently accessible with current and proposed roads, a 275-meter buffer
was applied to the current and proposed road network. This buffer width was estimated by Canfor
Staff and approximates the average yarding distance observed on the existing road network of TFL 18.
All logging roads were buffered because even though mainlines do not contribute to the future
reductions, they contribute to accessibility.
Step 2—Calculate future roads reduction outside the buffered area
The total length of each road class was determined within recent cutblocks (1999-2004). The average
degraded width for future roads is the average degraded width of existing class 2-4 roads. The
procedure for determining this average is shown in Table 13. For the purposes of this calculation, it is
assumed that current levels of deactivation and rehabilitation will persist into the future. This road
density was applied as a partial netdown to all areas outside the 275-m buffer.
Table 13: Calculation of the future roads reduction outside accessed (buffered) areas.
Class
Length in recent blocks (km)
Degraded width (m)
Area in-block
roads (ha)
Area of blocks
(ha)
Future road
density
1 0.5 24.9 1.3 9 14.4%
2 12.8 13.6 17.4 509 3.4%
3 19.4 13.5 26.2 601 4.4%
4 39.8 10.2 40.6 1402 2.9%
unroaded 0.0 0 0.0 693 0.0%
All 72 11.8 85 3,215 2.66%

Canadian Forest Products Ltd. TFL 18 MP #10 Information Package
Forest Ecosystem Solutions Ltd. #210 – 275 Fell Avenue, North Vancouver BC, Canada V7P 3R5 tel 604-998-2222 fax 604-986-0361
22
Step 3--Calculate future roads reduction inside the buffered area
In addition to future road requirements within non-accessed areas, a small reduction is required in the
currently accessed land base to account for access into the non-accessed areas. These non-accessed
areas are primarily small isolated patches surrounded by accessed areas. The procedure for calculating
the netdown reduction for access into non-buffered areas is summarized in Table 14.
Access roads are assumed to cross the 275-m buffer at an angle of 45 degrees, so each access road is
assumed to be 388 m long (the hypotenuse of a 275-m right triangle). The degraded width of these
access roads is assumed to be 11m. It was assumed that each non-buffered patches less than 100 ha in
size would require one access road, patches between 100 and 1000 ha would require 2 access roads,
and patches greater than 1000 ha would require 3 access roads.
The future road reduction was found by dividing the area of future access roads by the gross THLB
area inside the 275m buffer. The gross THLB is the sum of the total area of polygons that are wholly or
partially available for harvest. It excludes all polygons that have a 100% netdown reduction (e.g. parks)
but includes the total area of any polygons that have been partially netted down. The gross THLB is
used instead of the net THLB because the length of road required to access a polygon is assumed to be
independent of any partial reductions that apply to that polygon. The associated percent reduction is
applied to the currently accessed THLB.
Table 14: Procedure for determining the future roads reduction inside currently accessed areas.
Size of contiguous
non-accessed Patches
number of patches
number of access roads
required per patch
total number of
access roads
required
Area of Access
Roads (ha)
Area inside 275m
buffer (ha)
future road reduction within the
275m buffer (ha)
<100 ha 236 1 236
100-1000 ha 39 2 78
>1000 ha 5 3 15
Total 280 1.2 329 140 45761 0.31%

Canadian Forest Products Ltd. TFL 18 MP #10 Information Package
Forest Ecosystem Solutions Ltd. #210 – 275 Fell Avenue, North Vancouver BC, Canada V7P 3R5 tel 604-998-2222 fax 604-986-0361
23
6.2 Description of the Timber Harvesting Land Base
This section describes the attributes of the THLB. The age distributions by area and volume for the net
productive land base and the current timber harvesting land base are given in Table 15, and shown
graphically in Figure 2. Ages are projected to January 1, 2004.
0
5000
10000
15000
20000
0 1-20 21-40 41-60 61-80 81-100 101-120 121-140 141-250 >250
Age Class (years)
Are
a (
ha)
Productive forest
Current THLB
Figure 2: Age distribution by area
Table 15: Age distribution of the THLB by area
Age Class
THLB Net Area THLB Net Volume
ha % m3 %
0 NSR 1,567 2% 0 0%
1 1-20 years 15,464 24% 3,882 0%
2 21-40 years 5,406 8% 52,625 0%
3 41-60 years 2,968 5% 102,083 1%
4 61-80 years 3,321 5% 473,225 4%
5 81-100 years 4,074 6% 732,171 6%
6 101-120 years 4,289 7% 1,266,069 10%
7 121-140 years 5,932 9% 2,113,299 17%
8 141-250 years 16,087 25% 5,835,816 46%
9 >250 years 4,704 7% 1,973,198 16%
Total 63,812 100% 12,552,368 100%

Canadian Forest Products Ltd. TFL 18 MP #10 Information Package
Forest Ecosystem Solutions Ltd. #210 – 275 Fell Avenue, North Vancouver BC, Canada V7P 3R5 tel 604-998-2222 fax 604-986-0361
24
7 Inventory Aggregation
7.1 Management zones and Multi-Level Objectives
Multiple resource issues may be present on the same forest area. FSOS can accommodate multiple
overlapping resource layers, and therefore does not require that these layers be aggregated into
mutually exclusive management zones. A description of the overlapping resource management zones
is provided in Section 10—Integrated Resource Management.
7.2 Yield Populations and Analysis Units
Analysis Units are created in order to simplify modeling and interpretation by classifying the inventory
into a manageable number of groups with distinct growth and yield attributes. However, aggregating
stands into Analysis Units involves averaging of yield curves, and this can create biases in timber
supply dynamics. Stands that have fundamentally different roles in timber supply dynamics (e.g.
immature versus mature; constrained vs. non-constrained) are separated into exclusive populations to
ensure that they do not bias each other during weighted averaging. The process of defining populations
for aggregation facilitates yield table averaging while maintaining the integrity of timber supply
dynamics.
The following criteria were used to classify the productive land base into populations for development
of Analysis Units. The hierarchical classification of the inventory into populations is shown in Table
16.
Growth & Yield Model—Age is the primary criterion that distinguishes modeling with
TIPSY and modeling with VDYP. Stands greater than 40 years old are considered naturally
regenerated, while stands less than or equal to 40 years old are considered to have been
regenerated under managed conditions that makes them better suited to TIPSY modeling.
Intermediate Utilization (IU) Balsam stands are spruce and balsam leading stands that were
partially cut before 1980. Growth and yield of IU Balsam stands is modeled using a custom
methodology developed by JS Thrower and Associates Ltd.
Constrained/Non-Constrained—This criterion is designed to facilitate growth and yield
modeling of stands in the non-harvestable land base (100% netdown reduction) and stands that
are heavily constrained in OGMAs and No Harvest Lakeshore Management Zones. If the
constrained stands were not separated from the non-constrained stands, they would be given
equal weight in the averaging yields for Analysis Units even though their contribution to
timber supply is minor. This could bias timber supply projections.
Age—Stand growth is dynamic and variable during stand ages of 40-140 years, while growth
beyond this age range is characterized by gradual approach to a flat-line volume yield. To
avoid mutual bias effects during yield table aggregation, non-constrained VDYP stands are
split into immature (41-100 years old) and mature (>100 years) populations. Immature
NSYTs are aggregated based on yield table similarity in the 41-140 year range, while Mature
NSYTs are aggregated based on yields at age >140 years. This approach ensures that stands
are aggregated based on the section of the yield curve that they would likely get
harvested on (i.e. the >140 year section of the yield table is essentially irrelevant to 41-
100 year old stands).
Deciduous—TIPSY does not model growth and yield of deciduous species, and is not
calibrated for growth of minor coniferous cover in mixed stands. Stands leading in deciduous
tree species are modeled using VDYP and are isolated for this purpose in a separate
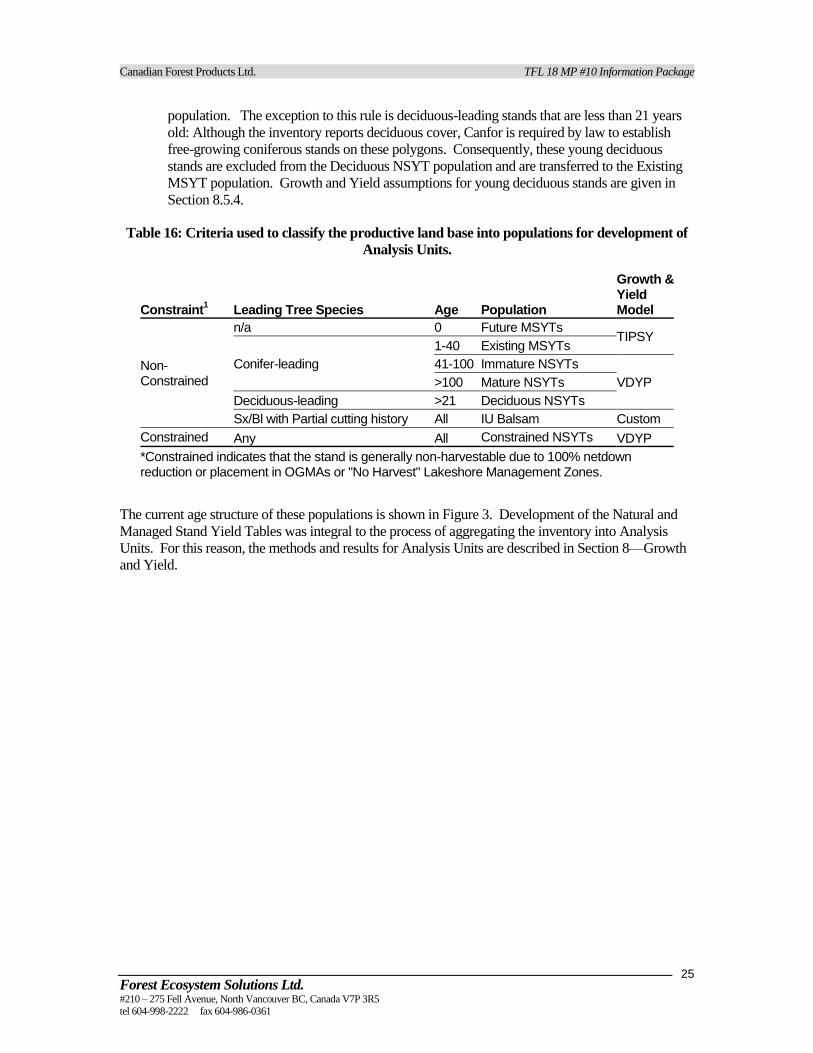
Canadian Forest Products Ltd. TFL 18 MP #10 Information Package
Forest Ecosystem Solutions Ltd. #210 – 275 Fell Avenue, North Vancouver BC, Canada V7P 3R5 tel 604-998-2222 fax 604-986-0361
25
population. The exception to this rule is deciduous-leading stands that are less than 21 years
old: Although the inventory reports deciduous cover, Canfor is required by law to establish
free-growing coniferous stands on these polygons. Consequently, these young deciduous
stands are excluded from the Deciduous NSYT population and are transferred to the Existing
MSYT population. Growth and Yield assumptions for young deciduous stands are given in
Section 8.5.4.
Table 16: Criteria used to classify the productive land base into populations for development of
Analysis Units.
Constraint1 Leading Tree Species Age Population
Growth & Yield Model
Non-Constrained
n/a 0 Future MSYTs TIPSY
Conifer-leading
1-40 Existing MSYTs
41-100 Immature NSYTs
VDYP >100 Mature NSYTs
Deciduous-leading >21 Deciduous NSYTs
Sx/Bl with Partial cutting history All IU Balsam Custom
Constrained Any All Constrained NSYTs VDYP
*Constrained indicates that the stand is generally non-harvestable due to 100% netdown reduction or placement in OGMAs or "No Harvest" Lakeshore Management Zones.
The current age structure of these populations is shown in Figure 3. Development of the Natural and
Managed Stand Yield Tables was integral to the process of aggregating the inventory into Analysis
Units. For this reason, the methods and results for Analysis Units are described in Section 8—Growth
and Yield.

Canadian Forest Products Ltd. TFL 18 MP #10 Information Package
Forest Ecosystem Solutions Ltd. #210 – 275 Fell Avenue, North Vancouver BC, Canada V7P 3R5 tel 604-998-2222 fax 604-986-0361
26
Figure 3: Current age structure of the yield populations.
Existing MSYTs
0
2000
4000
6000
8000
10000
12000
14000
16000
0 1-20 21-40 41-60 61-80 81-100 101-120 121-140 141-250 >250
Age Class (years)
Are
a (
ha
)
Productive forest
Current THLB
Constrained NSYTs
0
500
1000
1500
2000
2500
3000
3500
4000
4500
5000
0 1-20 21-40 41-60 61-80 81-100 101-120 121-140 141-250 >250
Age Class (years)
Are
a (
ha
)
Productive forest
Current THLB
Immature NSYTs
0
500
1000
1500
2000
2500
3000
3500
0 1-20 21-40 41-60 61-80 81-100 101-120 121-140 141-250 >250
Age Class (years)
Are
a (
ha
)
Productive forest
Current THLB
Deciduous NSYTs
0
100
200
300
400
500
600
700
0 1-20 21-40 41-60 61-80 81-100 101-120 121-140 141-250 >250
Age Class (years)
Are
a (
ha
)
Productive forest
Current THLB
Mature NSYTs
0
2000
4000
6000
8000
10000
12000
0 1-20 21-40 41-60 61-80 81-100 101-120 121-140 141-250 >250
Age Class (years)
Are
a (
ha
)
Productive forest
Current THLB
IU Balsam NSYTs
0
500
1000
1500
2000
2500
0 1-20 21-40 41-60 61-80 81-100 101-120 121-140 141-250 >250
Age Class (years)
Are
a (
ha
)
Productive forest
Current THLB
Deciduous <21 years old excluded from population
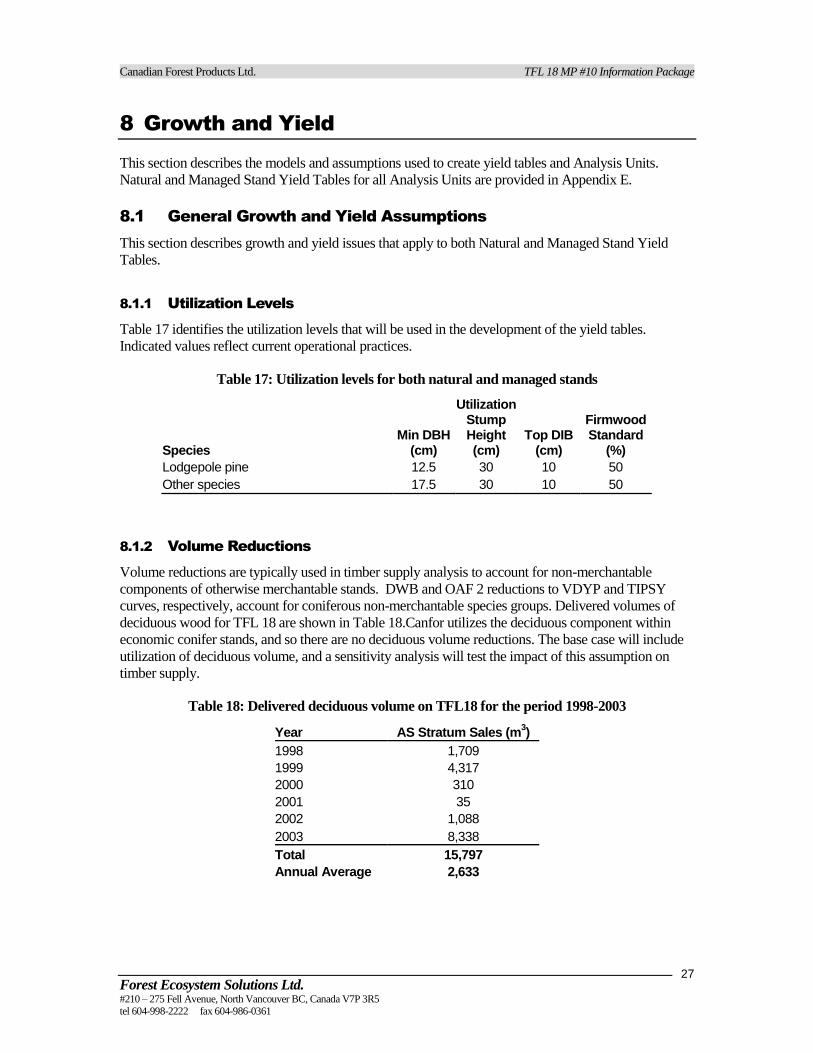
Canadian Forest Products Ltd. TFL 18 MP #10 Information Package
Forest Ecosystem Solutions Ltd. #210 – 275 Fell Avenue, North Vancouver BC, Canada V7P 3R5 tel 604-998-2222 fax 604-986-0361
27
8 Growth and Yield
This section describes the models and assumptions used to create yield tables and Analysis Units.
Natural and Managed Stand Yield Tables for all Analysis Units are provided in Appendix E.
8.1 General Growth and Yield Assumptions
This section describes growth and yield issues that apply to both Natural and Managed Stand Yield
Tables.
8.1.1 Utilization Levels
Table 17 identifies the utilization levels that will be used in the development of the yield tables.
Indicated values reflect current operational practices.
Table 17: Utilization levels for both natural and managed stands
Species
Utilization Firmwood Standard
(%) Min DBH
(cm)
Stump Height (cm)
Top DIB (cm)
Lodgepole pine 12.5 30 10 50
Other species 17.5 30 10 50
8.1.2 Volume Reductions
Volume reductions are typically used in timber supply analysis to account for non-merchantable
components of otherwise merchantable stands. DWB and OAF 2 reductions to VDYP and TIPSY
curves, respectively, account for coniferous non-merchantable species groups. Delivered volumes of
deciduous wood for TFL 18 are shown in Table 18.Canfor utilizes the deciduous component within
economic conifer stands, and so there are no deciduous volume reductions. The base case will include
utilization of deciduous volume, and a sensitivity analysis will test the impact of this assumption on
timber supply.
Table 18: Delivered deciduous volume on TFL18 for the period 1998-2003
Year AS Stratum Sales (m3)
1998 1,709
1999 4,317
2000 310
2001 35
2002 1,088
2003 8,338
Total 15,797
Annual Average 2,633

Canadian Forest Products Ltd. TFL 18 MP #10 Information Package
Forest Ecosystem Solutions Ltd. #210 – 275 Fell Avenue, North Vancouver BC, Canada V7P 3R5 tel 604-998-2222 fax 604-986-0361
28
8.2 VDYP vs. TIPSY for Existing Stands
VDYP is calibrated to project stands according to the average volume yields observed in british
Columbia. In contrast, TIPSY projects stand growth according to the full potential of the site. As a
result, VDYP returns lower volumes for a given species and site quality than TIPSY, and the decision
between models is an important one. Planting activity was the primary criterion used to determine the
age at which stands will be modeled with TIPSY. Figure 4 shows the net area of stands established
after 1960 and the proportion of this area reported as planted in silviculture records. Although these
data are not reliable for exact information, they can be used to draw some general conclusions.
Planting was first performed on a substantial proportion of harvested area in 1964, on stands that are
now 40 years old. After 1971, planting was consistently conducted on more than 50% of harvested
areas. This 7-year period can be considered a transition between natural and managed stand conditions.
The correct choice of model for these stands is ambiguous, and TIPSY was chosen under the
assumption that these stands may have received stand tending management during the 1970s and
1980s. The risk associated with an error in this assumption is small since stands in the 34-40 year age
range cover only 1,486 ha, which represents 6.6% of stands <40 years old and 2.3% of the net area of
TFL18.
0%
50%
100%
1961
1962
1963
1964
1965
1966
1967
1968
1969
1970
1971
1972
1973
1974
1975
1976
1977
1978
1979
1980
1981
1982
1983
1984
1985
1986
1987
1988
1989
1990
1991
1992
1993
1994
1995
43 42 41 40 39 38 37 36 35 34 33 32 31 30 29 28 27 26 25 24 23 22 21 20 19 18 17 16 15 14 13 12 11 10 9
Age and Stand Initiation Year
% P
lan
ted
0
500
1,000
1,500
2,000
Net
Are
a (
ha)
Figure 4: THLB Area of stands established after 1960, and the proportion of this area reported
as planted in silviculture records. The period 1964-1971 shows a transition from natural to
managed stands.

Canadian Forest Products Ltd. TFL 18 MP #10 Information Package
Forest Ecosystem Solutions Ltd. #210 – 275 Fell Avenue, North Vancouver BC, Canada V7P 3R5 tel 604-998-2222 fax 604-986-0361
29
8.3 Natural (Unmanaged) Stand Yield Tables
The following section describes the methods used to develop the natural stand yield tables that will be
used in the timber supply analysis for TFL 18. Natural stands are defined as all polygons that were
established 1963 or earlier (>40 years old), or leading in deciduous species.
8.3.1 Existing Natural Timber Volumes
Mature and unmanaged immature stand volumes reported in this information package were projected
to January 1, 2004 using BatchVDYP version 6.6d.
8.3.2 Site Index Estimates for Natural Stands
Site index estimates for Natural Stands are calculated within the Forest Cover Inventory based on
height and age. Table 19 describes the source of the site index equations utilized in VDYP, Version
6.6d to generate yield information for the TFL.
Table 19: Source of site index equations
Species Code Site Curve Reference
Lodgepole pine Pli Goudie (1984)
White spruce Sw Goudie (1984)
Douglas-fir Fdi Thrower and Goudie (1991)
Balsam Bl Kurucz (1982)
Western hemlock Hw Wiley (1978)
Western redcedar Cw Kurucz (1985)
Western white pine Pw Curtis et al. (1990)
Western larch Lw Milner (1989)
Trembling aspen At Alberta Forest Service (1985)
Paper birch Ep Alberta Forest Service (1985)
8.3.3 Decay, Waste and Breakage (DWB)
Inventory and yield table volumes generated using VDYP are net of DWB using forest inventory zone
(FIZ) G and loss factors for special cruise 318.
8.3.4 IU Balsam Stands
In his rationale for the MP9 AAC determination, the Chief Forester noted the uncertainty associated
with the growth and yield of residual spruce and balsam stands originating from Intermediate
Utilization (IU Balsam stands). To address these concerns, Canfor initiated a multi-year growth and
yield project in 2001 to support the timber supply analysis for MP10. This project culminated in the
development of custom yield tables for the IU Balsam population, which covers 12.5% of the
productive area TFL. The final report for the IU Balsam Yield curves, plus documentation of the
agency review and approval process, are attached as Appendix B.
8.3.5 Analysis Units
The yield tables created in BatchVDYP version 6.6d to project the inventory are also used as the basis
for timber supply modeling of natural stands. Given that there is one yield curve for every forest cover
Canadian Forest Products Ltd. TFL 18 MP #10 Information Package
Forest Ecosystem Solutions Ltd. #210 – 275 Fell Avenue, North Vancouver BC, Canada V7P 3R5 tel 604-998-2222 fax 604-986-0361
30
polygon, it is pragmatic to aggregate similar yield curves into Analysis Units. The objective of NSYT
aggregation was to reduce the number of yield tables to a manageable number while still maintaining
the spatial variability of productivity on the land base. The approach of compiling a yield table for each
forest cover polygon and using these to define the analysis unit ensures that variability of yields within
the Analysis Units is minimized. Development of the NSYT Analysis Units proceeded in the following
steps:
1. Polygons were classified in inventory populations (see Section 7—Inventory Aggregation);
2. Polygon NSYTs within each inventory population were mathematically aggregated into 5 or 6
Analysis Units based on their similarities in volume yield (K-means clustering);
3. Averaged NSYTs were calculated for each analysis unit. Productive area was used as the basis
for area weighting. Isolating the non-harvestable (non-THLB) polygons in the “Constrained”
population of yield tables means that the net area of the other populations is almost identical to
the productive area (see Figure 3 in Section 6.2). This approach ensures that there are minimal
aggregation errors associated with using productive area vs. net THLB area for area weighting.
Each NSYT Population was classified into 5 or 6 productivity groups, except for the IU Balsam
population, which was split into 12 groups. The higher refinement of the groupings in the IU Balsam
population is required because the origin of the curves in this population occurs throughout the 300-
year age range of the yield tables. This is an artefact of the methodology used to create the IU Balsam
(see Appendix B).

Canadian Forest Products Ltd. TFL 18 MP #10 Information Package
Forest Ecosystem Solutions Ltd. #210 – 275 Fell Avenue, North Vancouver BC, Canada V7P 3R5 tel 604-998-2222 fax 604-986-0361
31
Table 20:Summary statistics for the NSYT Analysis Units. Naming conventions are based on
population and productivity
NSYT Population Productivity Class AU Productive Area (ha)
Culmination MAI
(m3/ha/yr)
Maximum Volume (m
3/ha)
Constrained
Marginal 11 1,025 0.8 204
Very low 12 2,012 1.4 324
Low 13 1,891 2.0 405
Medium 14 1,805 2.4 459
High 15 1,470 3.0 520
Very high 16 393 3.9 593
Deciduous
Very low 21 79 0.8 144
Low 22 117 1.6 242
Medium 23 320 2.2 331
High 24 274 2.6 380
Very high 25 177 3.2 433
Immature
Very low 31 561 1.1 258
Low 32 2,040 1.8 381
Medium 33 1,060 2.4 427
High 34 1,345 3.0 490
Very high 35 368 4.1 575
IU Balsam n/a
41 565 1.1 288
42 101 0.7 326
43 914 3.6 338
44 17 0.5 342
45 638 1.3 348
46 651 1.6 393
47 2,159 2.1 402
48 1,746 2.4 413
49 43 4.9 458
50 1,219 3.3 459
51 378 3.8 500
52 43 2.2 500
Mature
Marginal 61 1,352 1.2 275
Very low 62 5,315 1.8 373
Low 63 7,411 2.3 425
Medium 64 5,113 2.7 485
High 65 3,780 3.5 538
Very high 66 1,001 3.9 658

Canadian Forest Products Ltd. TFL 18 MP #10 Information Package
Forest Ecosystem Solutions Ltd. #210 – 275 Fell Avenue, North Vancouver BC, Canada V7P 3R5 tel 604-998-2222 fax 604-986-0361
32
8.4 Managed Stand Yield Tables
This section describes the data sources and methods used to develop both existing and future managed
stand yield tables (MSYTs). Sections 8.5 and 8.6 describe methods that are specific to existing and
Future MSYTs, respectively.
8.4.1 Site Index Estimates for Existing and Future Managed Stands
As part of the Site Index Adjustment (SIA) project, Canfor has developed improved estimates of
potential site index (PSI) (J.S. Thrower & Associates Ltd. 2002). documentation of the agency review
and approval process is included in Appendix B. The yield tables for existing and future managed
stands incorporate PSI, except in stands >1550 meters in elevation where inventory site index is used.
The site index adjustment involves three major steps:
(1) Using expert judgement to make preliminary estimates of site index for each site series. This step
creates variability based on expert’s subjective understanding of how site index varies with site
series;
(2) Field sampling to measure the actual site index in regenerating young stands of known site series;
and
(3) Adjusting the preliminary estimates of potential site index based on the field sample. Because a
single adjustment factor is applied, this step corrects for bias in the preliminary estimates but does
not alter the pattern of variability between site series.
An adjustment equation was developed for Pl and applied to the target population of site series below
1550 meters in elevation (eqn. 1). MoF site index conversion equations were used to estimate the PSI
for Sx, Bl, and Fdi based on the PSI estimates for Pl. The adjusted PSI for Pl is shown for each site
series in Table 21.
[eqn. 1] adj. PSIPl = 1.047 * Prelim. PSIPl
Table 21: Adjusted Potential Site Index for Pl growing at elevations <1550m, by site series
Site Series ESSFwc2 ESSFdc2 SBSmm SBSdw1 ICHmk2 ICHmw3
01 18.8 18.3 22.0 22.0 22.0 22.0
02 13.6 12.6 14.7 15.7 16.8
03 16.8 16.8 17.8 17.8 17.8 19.9
04 17.8 17.8 20.9 19.9 23.0 20.4
05 17.8 17.8 19.4 20.9 24.6 22.0
06 19.4 19.9 21.5 23.6 19.9 23.0
07 20.9 18.8 23.0 22.5 25.1
08 17.8 16.8 19.9 25.1 20.9
09 12.6 12.6 19.9 12.6
10 11.5
91 13.6
93 18.8
94 17.8
Site Index is a species-specific measure, and a “common currency” must be established before finding
the average site index within a population that contains more than one leading species. To find the
average site index for each MSYT analysis unit, all site indices were first converted to Pl site index. Pl
was used as the site index reference species for all stands during data entry into WinTIPSY.

Canadian Forest Products Ltd. TFL 18 MP #10 Information Package
Forest Ecosystem Solutions Ltd. #210 – 275 Fell Avenue, North Vancouver BC, Canada V7P 3R5 tel 604-998-2222 fax 604-986-0361
33
8.4.1.1. Accounting for conflicts between TEM and the Forest Cover
Both Terrestrial Ecosystem Mapping and the Forest Cover Inventory are used to develop the yield
tables for this analysis. Non-productive areas such as lakes and rock outcrops are identified by both
Terrestrial Ecosystem Mapping and the Forest Cover Inventory. However, due to the subjectivity of air
photo delineation, there are some small discrepancies in the linework delineating non-productive areas.
To ensure consistency between the TEM and the forest cover inventory, the forest cover is used as the
sole basis for identification of non-productive areas. The distribution of productive site series in TEM
polygons was adjusted to avoid double counting of non-productive areas.
8.4.2 Operational Adjustment Factors
The TIPSY program allows the use of operational adjustment factors (OAFs) to reduce the gross
volumes of regenerated stands. There are two OAFs applied in TIPSY: OAF1 and OAF2. OAF1
allows for yield reductions associated with uneven spacing of crop trees (clumping), and endemic and
random loss. OAF2 allows for volume losses due to maturity, attributable to DWB factors. In the
construction of the MSYTs, standard OAFs were applied as follows:
OAF 1: 15% for all species; and
OAF 2: 5% for all species.
8.4.3 Silviculture Management Regimes
Spacing and fertilization are not practiced on TFL 18 at scales that warrant incorporation into managed
stand yield tables (Canfor, Management Plan 10, Section 4.6—Silviculture).
8.4.4 Regeneration Delay
Net Regeneration delay in timber supply analysis is the time gap between harvest and seedling
germination of post-harvest regenerating trees. Current practices regarding regeneration delay were
assessed from silviculture survey records for the period 1999-2003. A summary of the assessment of
regeneration delay is given in Table 22. The following general comments can be made about
regeneration delay on TFL 18:
Blocks planted with 1+0 stock achieve regenerated status after approximately 2 years.
Accounting for the age of the planted seedlings, this corresponds to a regeneration delay of one
year;
Blocks planted with 2+0 stock achieve regenerated status after approximately 1.5 years.
Accounting for the age of the planted seedlings, this corresponds to a regeneration delay of
zero years;
Blocks in the ESSF biogeoclimatic zone are predominantly planted with 2+0 stock. 2+0 stock
is also regularly planted in the SBSmm variant, but other biogeoclimatic units are
predominantly planted with 1+0 stock.
Regeneration delay for MSYT Analysis Units will reflect the weighted average net
regeneration delay of the biogeoclimatic units that make up the analysis unit.
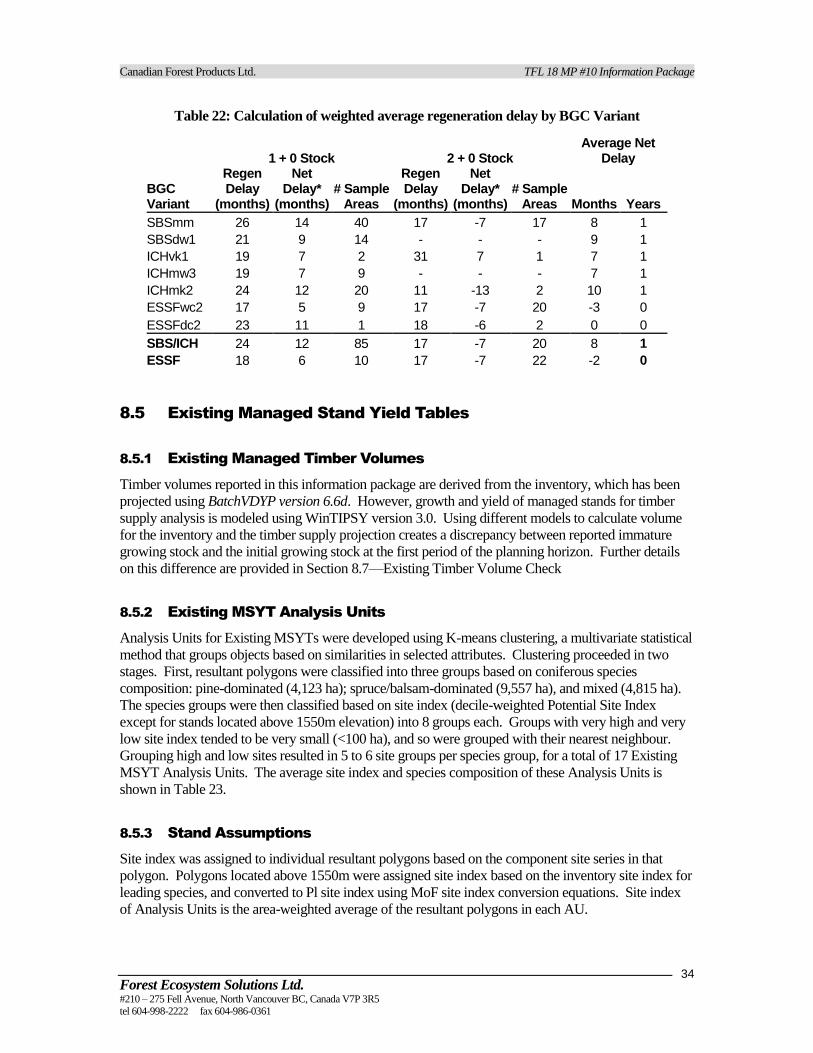
Canadian Forest Products Ltd. TFL 18 MP #10 Information Package
Forest Ecosystem Solutions Ltd. #210 – 275 Fell Avenue, North Vancouver BC, Canada V7P 3R5 tel 604-998-2222 fax 604-986-0361
34
Table 22: Calculation of weighted average regeneration delay by BGC Variant
1 + 0 Stock 2 + 0 Stock Average Net
Delay
BGC Variant
Regen Delay
(months)
Net Delay*
(months) # Sample
Areas
Regen Delay
(months)
Net Delay*
(months) # Sample
Areas Months Years
SBSmm 26 14 40 17 -7 17 8 1
SBSdw1 21 9 14 - - - 9 1
ICHvk1 19 7 2 31 7 1 7 1
ICHmw3 19 7 9 - - - 7 1
ICHmk2 24 12 20 11 -13 2 10 1
ESSFwc2 17 5 9 17 -7 20 -3 0
ESSFdc2 23 11 1 18 -6 2 0 0
SBS/ICH 24 12 85 17 -7 20 8 1
ESSF 18 6 10 17 -7 22 -2 0
8.5 Existing Managed Stand Yield Tables
8.5.1 Existing Managed Timber Volumes
Timber volumes reported in this information package are derived from the inventory, which has been
projected using BatchVDYP version 6.6d. However, growth and yield of managed stands for timber
supply analysis is modeled using WinTIPSY version 3.0. Using different models to calculate volume
for the inventory and the timber supply projection creates a discrepancy between reported immature
growing stock and the initial growing stock at the first period of the planning horizon. Further details
on this difference are provided in Section 8.7—Existing Timber Volume Check
8.5.2 Existing MSYT Analysis Units
Analysis Units for Existing MSYTs were developed using K-means clustering, a multivariate statistical
method that groups objects based on similarities in selected attributes. Clustering proceeded in two
stages. First, resultant polygons were classified into three groups based on coniferous species
composition: pine-dominated (4,123 ha); spruce/balsam-dominated (9,557 ha), and mixed (4,815 ha).
The species groups were then classified based on site index (decile-weighted Potential Site Index
except for stands located above 1550m elevation) into 8 groups each. Groups with very high and very
low site index tended to be very small (<100 ha), and so were grouped with their nearest neighbour.
Grouping high and low sites resulted in 5 to 6 site groups per species group, for a total of 17 Existing
MSYT Analysis Units. The average site index and species composition of these Analysis Units is
shown in Table 23.
8.5.3 Stand Assumptions
Site index was assigned to individual resultant polygons based on the component site series in that
polygon. Polygons located above 1550m were assigned site index based on the inventory site index for
leading species, and converted to Pl site index using MoF site index conversion equations. Site index
of Analysis Units is the area-weighted average of the resultant polygons in each AU.

Canadian Forest Products Ltd. TFL 18 MP #10 Information Package
Forest Ecosystem Solutions Ltd. #210 – 275 Fell Avenue, North Vancouver BC, Canada V7P 3R5 tel 604-998-2222 fax 604-986-0361
35
The deciduous component of Existing MSYTs is modeled in VDYP. Consequently, species
composition was separated into the coniferous and deciduous components of each polygon, and the
coniferous percents were adjusted to add up to 100 percent for input into TIPSY. The final Analysis
Unit yield table is the weighted average of the deciduous and coniferous yield tables modeled
separately in TIPSY and VDYP.
Table 23: Average site index and species composition of the Existing MSYT Analysis Units
Analysis Unit
Net Area
1
(ha)
Site Index (m)
Species Composition of Coniferous Component (%)
2
Total Conifer
% Total
Decid % Pl Sx Bl Fd Hw Cw
102 Existing Pine very low 157 15.3 92 3 5 0 100% 0%
103 Existing Pine low 682 17.9 92 5 3 0 97% 3%
104 Existing Pine medium 508 19.2 90 6 3 1 0 94% 6%
105 Existing Pine high 2,044 21.7 89 6 3 2 0 0 93% 7%
106 Existing Pine very high 732 22.5 86 7 3 2 1 92% 8%
107 Existing Spruce marginal 401 11.1 2 62 35 0 100% 0%
108 Existing Spruce very low 1,778 14.3 1 72 27 0 99% 0%
109 Existing Spruce low 1,973 18.1 3 70 25 1 0 99% 1%
110 Existing Spruce medium 2,671 19.0 2 77 20 0 0 99% 1%
111 Existing Spruce high 2,453 22.0 7 71 20 1 0 1 95% 5%
112 Existing Spruce very high 281 23.8 4 72 15 7 0 3 90% 3%
113 Existing Mixed marginal 43 13.5 40 42 12 6 98% 2%
114 Existing Mixed very low 381 17.8 37 34 17 7 1 5 99% 1%
115 Existing Mixed low 885 18.9 41 35 18 4 0 2 98% 2%
116 Existing Mixed medium 2,701 21.9 30 29 14 19 0 8 93% 6%
117 Existing Mixed high 631 22.6 33 29 18 17 0 4 93% 7%
118 Existing Mixed very high 175 24.1 29 24 21 19 0 7 95% 5% 1THLB area prorated to the decile proportion of each site series in TEM polygons.
2TIPSY models only coniferous species. The deciduous component is modeled separately in VDYP.
The final AU yield table is the weighted average of the deciduous and coniferous components.
Deciduous volumes are modeled using a single yield table that reflects the average attributes of
deciduous stands in TFL18. The WinVDYP1.1 inputs and outputs for this deciduous table are shown
in Table 24.
Table 24: WinVDYP1.1 inputs and outputs for the yield table used to model the deciduous
component of MSYT analysis units
Stand Attribute WinVDYP Input Stand Attribute WinVDYP Output
Species composition: At91Ep8Dr1 Culmination Volume (m3/ha) 176.0
Site Index (m) 20.3 Culmination Age (years) 86
Crown Closure 57% Culmination MAI (m3/ha/yr) 2.47
Stocking Class 0 Maximum Volume (m3/ha) 236.2
Utilization (cm) 12.5+
All Existing MSYTs are assumed to be planted, with subsequent ingress equivalent to an initial density
of 2000 stems per hectare (20-25% ingress). Regeneration delay was set at zero for all analysis units,
as inventory age should reflect age of germination.

Canadian Forest Products Ltd. TFL 18 MP #10 Information Package
Forest Ecosystem Solutions Ltd. #210 – 275 Fell Avenue, North Vancouver BC, Canada V7P 3R5 tel 604-998-2222 fax 604-986-0361
36
Zero genetic gain is assumed for Existing MSYT analysis units. Although recent planting programs
have incorporated genetically improved stock, associated genetic gains associated with Existing MSYT
analysis units are assumed to be insignificant for the purposes of timber supply analysis.
8.5.4 Deciduous Stands <21 Years Old
As noted in Section 7.2, Canfor is required by law to establish free-growing coniferous stands on
cutblocks harvested during and after 1987. Although the inventory may report leading deciduous
cover, these stands are more appropriately modeled using a conifer-leading TIPSY yield table.
The attributes of the deciduous-leading NSYT analysis units are shown in Table 25. Although
inventory site index was highly variable within the deciduous NSYT population, average Potential Site
Index is similar across all young deciduous AUs. The average conifer composition is also similar
across deciduous analysis units. Uniform site index and conifer composition means that all five
deciduous analysis units can justifiably be modeled using a single MSYT. Rather than creating a
special TIPSY curve for these stands, the MSYT for “existing_mixed_medium” analysis unit (AU 116)
was assigned to the young component of deciduous analysis units. Table 25 shows that the TIPSY
inputs for AU 116 are sufficiently close to the average attributes of the Deciduous NSYTs.
Table 25: Average attributes of the young (<21 year old) stands within Deciduous NSYT Analysis
Units. TIPSY inputs for the AU 116 (existing_mixed_medium) MSYT are also shown for
comparison.
Analysis Unit Net Area (ha)
Deciduous %
Average PSI (m)
Average Conifer Composition
(age <21 years only) Pl Sx Bl Fd Hw Cw
Deciduous_very low 28 36% 22.0 38% 11% 8% 38% 0% 6%
Deciduous_low 44 56% 21.8 55% 35% 2% 8% 0% 0%
Deciduous_medium 199 48% 22.1 35% 36% 12% 14% 1% 0%
Deciduous_high 208 49% 22.2 39% 30% 21% 10% 0% 0%
Deciduous_very high 123 50% 21.7 40% 33% 6% 21% 0% 0%
Deciduous Average 602 49% 22.0 39% 32% 13% 15% 0% 1%
Existing_mixed_medium 2,701 6% 21.9 30% 29% 14% 19% 0% 8%

Canadian Forest Products Ltd. TFL 18 MP #10 Information Package
Forest Ecosystem Solutions Ltd. #210 – 275 Fell Avenue, North Vancouver BC, Canada V7P 3R5 tel 604-998-2222 fax 604-986-0361
37
8.6 Future Managed Stand Yield Tables
8.6.1 Genetic Gain Allowances
As a result of an on-going tree improvement program, a volume increase is expected for stands
regenerating from genetically improved stock. The seed planning and registry (SPAR) system was
used to summarize the genetic worth of seedlings ordered for TFL18 in the 2004 sowing year. Table
26 shows the weighted average volume adjustments applied to Future MSYTs.
Table 26: Genetic gain forecasts for seed stock ordered for TFL 18 for the 2004 sowing year.
Species
Seed Planning
Zone
Seedlings requested (000's)
% improved seed
Genetic Worth* Class A Class B+ Class B Total
Pli PG 0 456.7 0 456.7 100% 3%
Sx PGN 400.7 0 0 400.7 100% 12%
400.7 456.7 0 857.4 100%
*Weighted average genetic worth for all seedlots
8.6.2 Regeneration Assumptions
Regeneration assumptions for future managed stands in previous timber supply analyses were linked to
the attributes of the harvested stand. Terrestrial Ecosystem Mapping provides the opportunity to assign
ecosystem-based regeneration assumptions to post-harvest regenerated stands in timber supply
modeling. FESL and Canfor staff collaborated to develop regeneration assumptions for each site series
on TFL 18 using silvicultural data and expert opinion of Canfor field staff. Site series-specific species
composition and stand density information are provided in Appendix C.
8.6.2.1. Yield Groups
There are 50 site series that contribute to timber supply in TFL18. To simplify the process of
developing yield tables, site series with similar TIPSY inputs were combined. Site series aggregation
produced 18 “yield groups” based on similarities in regeneration assumptions, namely species
composition, initial density, and productivity (Potential Site Index). The process of aggregation was
exploratory and included mathematical methods (hierarchical clustering) and subjective judgement.
Membership of site series in yield groups is given in Appendix C. Yield groups are labelled using the
letters a through r and are named after the site series with the largest net area.
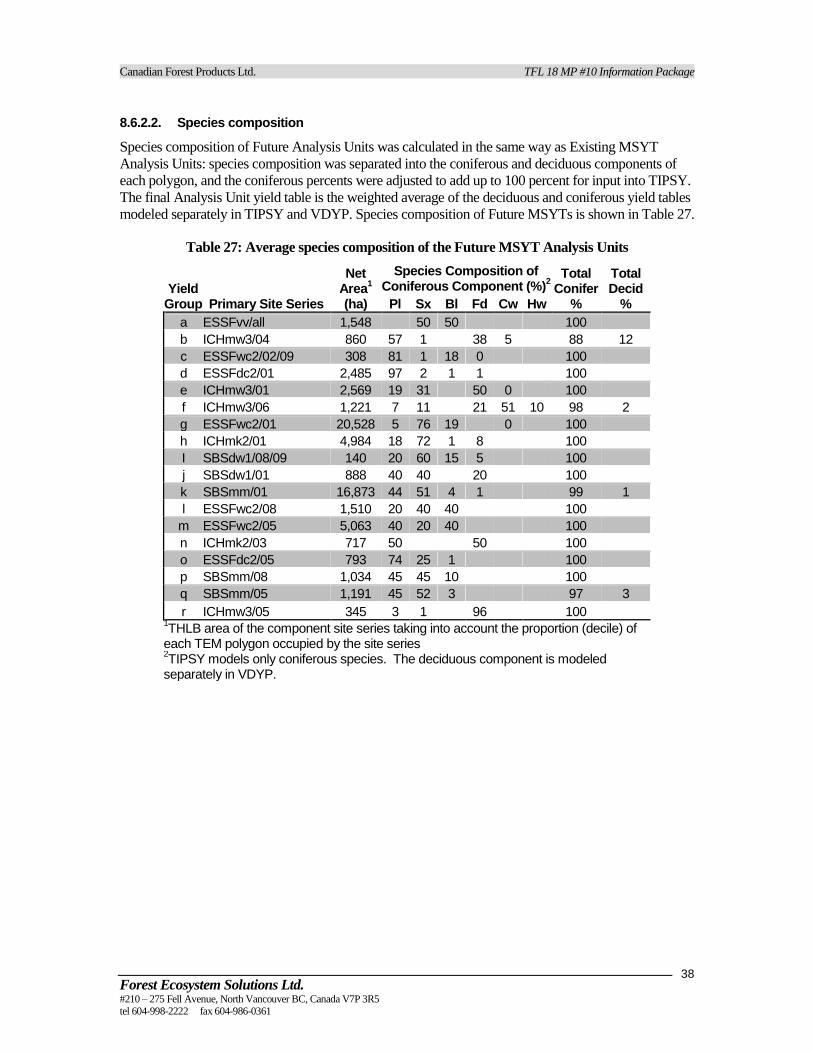
Canadian Forest Products Ltd. TFL 18 MP #10 Information Package
Forest Ecosystem Solutions Ltd. #210 – 275 Fell Avenue, North Vancouver BC, Canada V7P 3R5 tel 604-998-2222 fax 604-986-0361
38
8.6.2.2. Species composition
Species composition of Future Analysis Units was calculated in the same way as Existing MSYT
Analysis Units: species composition was separated into the coniferous and deciduous components of
each polygon, and the coniferous percents were adjusted to add up to 100 percent for input into TIPSY.
The final Analysis Unit yield table is the weighted average of the deciduous and coniferous yield tables
modeled separately in TIPSY and VDYP. Species composition of Future MSYTs is shown in Table 27.
Table 27: Average species composition of the Future MSYT Analysis Units
Yield Group Primary Site Series
Net Area
1
(ha)
Species Composition of Coniferous Component (%)
2
Total Conifer
%
Total Decid
% Pl Sx Bl Fd Cw Hw
a ESSFvv/all 1,548 50 50 100
b ICHmw3/04 860 57 1 38 5 88 12
c ESSFwc2/02/09 308 81 1 18 0 100
d ESSFdc2/01 2,485 97 2 1 1 100
e ICHmw3/01 2,569 19 31 50 0 100
f ICHmw3/06 1,221 7 11 21 51 10 98 2
g ESSFwc2/01 20,528 5 76 19 0 100
h ICHmk2/01 4,984 18 72 1 8 100
I SBSdw1/08/09 140 20 60 15 5 100
j SBSdw1/01 888 40 40 20 100
k SBSmm/01 16,873 44 51 4 1 99 1
l ESSFwc2/08 1,510 20 40 40 100
m ESSFwc2/05 5,063 40 20 40 100
n ICHmk2/03 717 50 50 100
o ESSFdc2/05 793 74 25 1 100
p SBSmm/08 1,034 45 45 10 100
q SBSmm/05 1,191 45 52 3 97 3
r ICHmw3/05 345 3 1 96 100 1THLB area of the component site series taking into account the proportion (decile) of
each TEM polygon occupied by the site series 2TIPSY models only coniferous species. The deciduous component is modeled
separately in VDYP.

Canadian Forest Products Ltd. TFL 18 MP #10 Information Package
Forest Ecosystem Solutions Ltd. #210 – 275 Fell Avenue, North Vancouver BC, Canada V7P 3R5 tel 604-998-2222 fax 604-986-0361
39
8.6.2.3. Stand Density and Regeneration Delay
Regeneration delay was calculated as the weighted average of the regeneration delay associated with
the biogeoclimatic variants in each analysis unit (see Table 22). Initial density was estimated based on
site series specific silviculture surveys and local knowledge of free growing stands. To facilitate
modeling of genetic gains from planted seedlings, all yield tables were modeled as “planted” in TIPSY,
but genetic worth was prorated to reflect the amount of ingress in each analysis unit. Regeneration
inputs for Future MSYT Analysis Units are summarized in Table 28.
Table 28: Calculation of average stand attributes of the Future MSYT Analysis Units
Yield Group
Primary Site Series
Regen Delay
(years)
Planted Density (sph)
Estimated % Ingress
2
Initial Density (sph)
1
Prorated genetic worth
Pl SxBl3
a ESSFvv/all 0 1500 0% 1500 3.0% 6.0%
b ICHmw3/04 1 1216 12% 1374 2.7% 10.6%
c ESSFwc2/02/09 0 1497 0% 1497 3.0% 0.4%
d ESSFdc2/01 0 1492 0% 1492 3.0% 8.5%
e ICHmw3/01 1 1200 42% 2083 1.7% 6.9%
f ICHmw3/06 1 1200 55% 2653 1.4% 5.4%
g ESSFwc2/01 0 1498 40% 2486 1.8% 5.8%
h ICHmk2/01 1 1224 56% 2791 1.3% 5.2%
I SBSdw1/08/09 1 1400 0% 1400 3.0% 9.6%
j SBSdw1/01 1 1400 21% 1770 2.4% 9.5%
k SBSmm/01 1 1400 34% 2110 2.0% 7.4%
l ESSFwc2/08 0 1500 0% 1500 3.0% 6.0%
m ESSFwc2/05 0 1500 68% 4634 1.0% 1.3%
n ICHmk2/03 1 1200 46% 2225 1.6%
o ESSFdc2/05 0 1500 0% 1500 3.0% 11.5%
p SBSmm/08 1 1400 0% 1400 3.0% 9.8%
q SBSmm/05 1 1400 53% 2953 1.4% 5.4%
r ICHmw3/05 1 1200 29% 1692 2.1% 8.5% 1the estimated initial density of crop trees based on silviculture records of total, well-spaced, and free-growing
density at free-growing age. 2The estimated proportion of the initial density that results from natural regeneration
3Sx is used as a proxy for Bl in TIPSY. However, Bl seedlings have no genetic gain and the genetic worth entered
into TIPSY must be reduced to account for the proportion of Sx that represents Bl. Therefore genetic worth of Sx is prorated both for ingress and for species composition.

Canadian Forest Products Ltd. TFL 18 MP #10 Information Package
Forest Ecosystem Solutions Ltd. #210 – 275 Fell Avenue, North Vancouver BC, Canada V7P 3R5 tel 604-998-2222 fax 604-986-0361
40
8.6.2.4. Site Index
Inventory site index is used for stands above the 1550m elevation boundary. Several Existing Managed
MSYT and Future MSYT Analysis Units cross the 1550m elevation boundary. Where this occurs, the
Analysis Unit site index is the average of inventory SI and PSI weighted by the relative area above and
below 1550m. A summary of this calculation for Future MSYT Analysis Units is shown in Table 29
Table 29: Calculation of Average Site index for Future MSYT Analysis Units, incorporating
inventory site index for stands located above 1550m elevation.
Yield Group Primary Site Series
PSI of Pl (m)
Average inventory Pl site index >1550m
% of net area >1550m
Weighted average
Reference Site Index (m)
a ESSFvv/all 13.8 100% 13.8
b ICHmw3/04 17.6 17.6
c ESSFwc2/02/09 16.3 14.9 40% 15.7
d ESSFdc2/01 16.6 14.3 50% 15.5
e ICHmw3/01 18.3 18.3
f ICHmw3/06 18.7 18.7
g ESSFwc2/01 16.9 14.9 35% 16.2
h ICHmk2/01 18.9 11.0 1% 18.7
I SBSdw1/08/09 20.1 20.1
j SBSdw1/01 19.5 19.5
k SBSmm/01 18.6 18.6
l ESSFwc2/08 16.5 13.6 30% 15.6
m ESSFwc2/05 16.6 15.2 47% 15.9
n ICHmk2/03 17.6 17.6
o ESSFdc2/05 15.3 14.3 65% 14.7
p SBSmm/08 19.6 19.6
q SBSmm/05 17.6 17.6
r ICHmw3/05 16.9 16.9

Canadian Forest Products Ltd. TFL 18 MP #10 Information Package
Forest Ecosystem Solutions Ltd. #210 – 275 Fell Avenue, North Vancouver BC, Canada V7P 3R5 tel 604-998-2222 fax 604-986-0361
41
8.6.3 Analysis Units for Future Managed Stands
Each site series is in a Yield Group and has an associated future MSYT. However, resultant polygons
in the TFL18 database have up to three site series in varying proportions, due to the conventions of
terrestrial ecosystem mapping. There are hundreds of combinations of yield groups in the database, so
pro-rating the yield groups into the resultant polygons produces hundreds of yield tables. To simplify
analysis, these tables were aggregated into analysis units using a similar method used for the NSYTs:
Polygon MSYTs were mathematically aggregated into 12 Analysis Units based on their similarities in
volume yield (K-means clustering), and net area-weighted average MSYTs were calculated for each
analysis unit. Aggregation results are shown in Table 30 and Figure 5.
Table 30: Summary of Analysis Unit yield tables derived by aggregating polygon Future MSYTs.
Analysis Unit Net Area (ha)
Culmination MAI
(m3/ha/yr)
Culmination Age (years)
Culmination Volume (m
3/ha)
Culmination Height (m)
201 Future_submarginal 82 0.7 100 69 5
202 Future_marginal 87 1.4 90 123 9
203 Future_very low 347 2.1 100 211 16
204 Future_low_late 4,671 2.7 100 271 21
205 Future_low_early 5,518 2.9 110 322 24
206 Future_medium_late 23,062 3.2 105 340 25
207 Future_medium_mid 4,753 3.3 95 315 25
208 Future_medium_early 23,146 4.0 85 340 24
209 Future_high 1,321 3.6 105 375 27
210 Future_very high 748 4.2 110 465 28
Average 63,734 3.46 97
0
100
200
300
400
500
600
700
800
900
0 60 120 180 240
Age (years)
Vo
lum
e (
m3/h
a)
Future_very high
Future_high
Future_medium_early
Future_medium_late
Future_medium_mid
Future_low_early
Future_low_late
Future_very low
Future_marginal
Future_submarginal
Figure 5: average MSYTs assigned to Future MSYT Analysis Unit

Canadian Forest Products Ltd. TFL 18 MP #10 Information Package
Forest Ecosystem Solutions Ltd. #210 – 275 Fell Avenue, North Vancouver BC, Canada V7P 3R5 tel 604-998-2222 fax 604-986-0361
42
8.6.4 Not Satisfactorily Restocked (NSR)
Canfor has successfully regenerated all backlog NSR (harvested pre-1987) in TFL 18. The net area of
current NSR is 1,520 ha. For the purposes of Timber Supply Analysis, all current NSR will be
regenerated according to the site series-based Future MSYT Analysis Units. A summary of current
NSR is provided in Table 31.
Table 31: Area of current NSR by BGC Variant
BGC variant Productive Area (ha) Net Area (ha)
ESSFdc2 80 80
ESSFvv 1 1
ESSFwc2 307 306
ICHmk2 270 270
ICHmw3 17 17
SBSdw1 266 266
SBSmm 585 580
Total 1,525 1,520
8.7 Existing Timber Volume Check
Aggregation of yield tables or inventory attributes into Analysis Units can create biases in reported
volumes if not done correctly. An existing timber volume check provides a simple means of verifying
that unacceptable biases have not been created during the creation of Analysis Units and their yield
tables. This check involves finding the interpolated volume of resultant polygons on their respective
analysis unit yield tables, and comparing this volume to the inventory. A total difference of less than
2% across the land base is generally considered acceptable.
Table 32: Existing inventory check.
Population
Productive volume (1000 m3) % Difference from
inventory Inventory AUs
NSR 0 0 n/a
Existing MSYTs 16 48 195%
Deciduous NSYTs 74 68 -7%
Immature NSYTs 900 907 0.8%
Mature NSYTs 8,926 8,764 -1.8%
IU Balsam 956 1,154 21%
Constrained NSYTs 2,520 2,481 -1.5%
Total 13,391 13,423 0.2%
The results of the existing timber volume check between the analysis unit volumes and the polygon-
specific inventory volumes are summarized by analysis unit populations in Table 32. Overall, there is a
0.2% difference between current volume reported in the inventory and calculated from the analysis unit
yield tables. Analysis unit volumes for Existing MSYTs are three times greater than the inventory.
This likely reflects the difference between stand modeling with TIPSY and potential site index (PSI) for
the Existing MSYTs, as opposed to VDYP and inventory site index used for inventory projection.
Immature NSYTs show a small overestimate, while deciduous, mature and constrained NSYTs tend to
slightly underestimate volume. Volume of IU Balsam AUs is 21% higher than the VDYP-generated
inventory: a result of the different methodology used to create the IU Balsam yield tables.

Canadian Forest Products Ltd. TFL 18 MP #10 Information Package
Forest Ecosystem Solutions Ltd. #210 – 275 Fell Avenue, North Vancouver BC, Canada V7P 3R5 tel 604-998-2222 fax 604-986-0361
43
9 Protection
9.1 Unsalvaged Losses
Unsalvaged losses result from natural events that are epidemic in origin. Endemic losses are accounted
for by operational adjustment factors (OAFs) in the managed stand yield tables and decay, waste, and
breakage (DWB) factors in the natural stand yield curves. Net available volume (i.e. the allowable
annual cut) will be determined by removing unsalvaged losses from modeled harvest levels. Table 33
shows unsalvaged losses on the TFL, which total 3000 m3/year.
Table 33: Unsalvaged losses
Agent Unsalvaged Loss (m3/year)
Fire 300
Bark beetles 2200
Windthrow 500
Spruce budworm 0
Other 0
Total 3000
The rationale for these estimates is given below. The primary unsalvaged epidemic losses in TFL 18
are insect infestations, windthrow, and fire. Bark Beetle infestations have escalated to epidemic levels,
and windthrow continues to be a major management issue due to the exposed position of the TFL.
Other agents that reduce the commercial productivity of the TFL, such as spruce budworm and root rot,
are endemic and are assumed to be adequately accounted for by standard adjustment factors in the yield
tables.

Canadian Forest Products Ltd. TFL 18 MP #10 Information Package
Forest Ecosystem Solutions Ltd. #210 – 275 Fell Avenue, North Vancouver BC, Canada V7P 3R5 tel 604-998-2222 fax 604-986-0361
44
9.1.1 Bark Beetles and Windthrow
Detection and salvage of windthrow and beetle-affected stands is aggressively practiced in TFL18 to
limit the impact and propagation of spruce beetle (IBS), balsam beetle (IBB) and, more recently,
mountain pine beetle (IBM). The extensive road system in TFL 18 allows for considerable salvage of
windthrow and beetle affected stands. In addition, windthrow generally occurs in standing timber at the
edge of cutblocks, and consequently there is a high salvage rate for windthrow. Table 34 shows the
volumes of susceptible or infested timber delivered (salvaged) during the last 5 years. Although
records of volume losses associated with bark beetle and windthrow are not available, Canfor estimates
that approximately 95% of the potential losses within the timber harvesting land base are salvaged. The
unsalvaged losses associated with windthrow and bark beetles are estimated as 5% of the 5-year
average salvage volume.
Table 34: Salvage of timber volume that is susceptible or infested by bark beetle during the
period 1999-2003
Susceptible and infested volume salvaged (m3)
Agent 1999 2000 2001 2002 2003 Total
Mountain Pine Beetle 16,451 16,451
Spruce beetle 113,757 19,595 2,636 61,590 197,578
Balsam Bark Beetle 3,178 3,178
Windthrow 17,515 1,927 26,422 2,052 47,916
Total 17,515 115,684 19,595 29,058 83,271 265,123
Five-year average 53,025
5% of Five-year average 2,651
Bark Beetles 2,172
Windthrow 479

Canadian Forest Products Ltd. TFL 18 MP #10 Information Package
Forest Ecosystem Solutions Ltd. #210 – 275 Fell Avenue, North Vancouver BC, Canada V7P 3R5 tel 604-998-2222 fax 604-986-0361
45
9.1.2 Fire
Table 35 summarizes volume salvage rates for TFL18 provided by the Fire Management Analysis &
Development Section of the BC Ministry of Forests. These data indicate that approximately 300 m3/yr
of mature timber was lost from TFL18 due to fire in the period 1979-2003. This corresponds to a 77%
volume salvage rate.
Table 35: Historic records of unsalvaged losses to fire (pre-1979 volume data not available)
Fire Year Fire
Number
Total Area Destroyed
(ha)
Total Volume
Destroyed (m
3)
Percent Salvage
Area Destroyed
within TFL 18 (ha)
Unsalvaged volume (m
3)
1979 K20038 383 109,472 28 0.4 82
1979 K20041 109 0 0 0.1 0
1979 C20006 15 310 50 0.1 1
1982 K10008 10 2,800 100 0.1 0
1983 K10003 16 9,402 0 0.1 59
1985 K10007 10 50 100 0.1 0
1985 K10097 398 39,714 0 0.1 10
1986 K10023 22 4,814 100 22 0
1986 K10046 8 2,547 74 0.1 8
1986 K10072 10 4,593 100 10 0
1986 K10073 20 1,500 100 20 0
1987 K10096 5 1,750 98 5 35
1987 K10098 5 500 0 0.3 33
1987 K10109 22 1,980 0 1 90
1987 K10122 12 3,600 99 12 36
1987 C40060 120 25,485 89 0.1 2
1987 C40060 8 320 0 0.1 4
1988 K10036 5 35 0 0 0
1989 K10012 2 500 90 0.1 3
1989 K10030 4 836 0 0.1 24
1989 K10057 15 4,500 99 15 45
1990 K10134 8 1,600 90 8 160
1990 K10141 16 6,400 60 16 2,560
1991 K10002 35 200 0 0.1 1
1992 K10002 3 105 0 0.1 4
2002 K10530 1 250 100 1 0
2003 C40469 60 7,200 25 60 5,400
Total 27 230,463 77% 172 8,557
Annual Rate 317
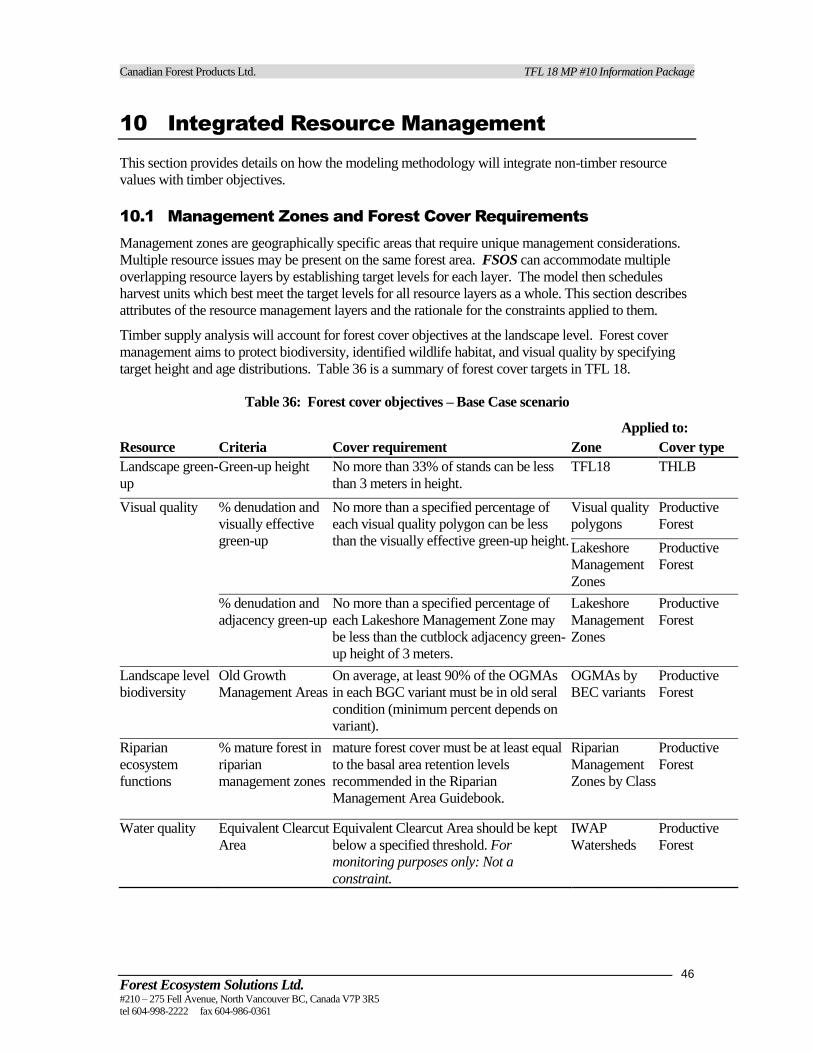
Canadian Forest Products Ltd. TFL 18 MP #10 Information Package
Forest Ecosystem Solutions Ltd. #210 – 275 Fell Avenue, North Vancouver BC, Canada V7P 3R5 tel 604-998-2222 fax 604-986-0361
46
10 Integrated Resource Management
This section provides details on how the modeling methodology will integrate non-timber resource
values with timber objectives.
10.1 Management Zones and Forest Cover Requirements
Management zones are geographically specific areas that require unique management considerations.
Multiple resource issues may be present on the same forest area. FSOS can accommodate multiple
overlapping resource layers by establishing target levels for each layer. The model then schedules
harvest units which best meet the target levels for all resource layers as a whole. This section describes
attributes of the resource management layers and the rationale for the constraints applied to them.
Timber supply analysis will account for forest cover objectives at the landscape level. Forest cover
management aims to protect biodiversity, identified wildlife habitat, and visual quality by specifying
target height and age distributions. Table 36 is a summary of forest cover targets in TFL 18.
Table 36: Forest cover objectives – Base Case scenario
Applied to:
Resource Criteria Cover requirement Zone Cover type
Landscape green-
up
Green-up height No more than 33% of stands can be less
than 3 meters in height.
TFL18 THLB
Visual quality % denudation and
visually effective
green-up
No more than a specified percentage of
each visual quality polygon can be less
than the visually effective green-up height.
Visual quality
polygons
Productive
Forest
Lakeshore
Management
Zones
Productive
Forest
% denudation and
adjacency green-up
No more than a specified percentage of
each Lakeshore Management Zone may
be less than the cutblock adjacency green-
up height of 3 meters.
Lakeshore
Management
Zones
Productive
Forest
Landscape level
biodiversity
Old Growth
Management Areas
On average, at least 90% of the OGMAs
in each BGC variant must be in old seral
condition (minimum percent depends on
variant).
OGMAs by
BEC variants
Productive
Forest
Riparian
ecosystem
functions
% mature forest in
riparian
management zones
mature forest cover must be at least equal
to the basal area retention levels
recommended in the Riparian
Management Area Guidebook.
Riparian
Management
Zones by Class
Productive
Forest
Water quality Equivalent Clearcut
Area
Equivalent Clearcut Area should be kept
below a specified threshold. For
monitoring purposes only: Not a
constraint.
IWAP
Watersheds
Productive
Forest
Canadian Forest Products Ltd. TFL 18 MP #10 Information Package
Forest Ecosystem Solutions Ltd. #210 – 275 Fell Avenue, North Vancouver BC, Canada V7P 3R5 tel 604-998-2222 fax 604-986-0361
47
10.1.1 Adjacent Cutblock Green-up and Patch Management
During 2003 Canfor participated in a FIA project to develop an approach to managing the biodiversity
targets for Patch Size distribution in the landscape units of the Headwaters Forest District. This report
was adopted in 2003 by the Headwaters Forest District as known information for operational planning.
Standard objectives for adjacent cutblock green-up may be overridden where necessary to achieve
patch size distribution targets.
The process of working towards a target patch size distribution is inherently spatial, and so will not be
directly incorporated into the non-spatial simulations for the Base Case. A landscape green-up
constraint will be used as a proxy for the reductions to harvesting flexibility associated with patch
management. This constraint specifies that no more than 33% of the total land base can be less than the
green-up height of 3 metres originally specified in Section 68(5) of the Operational Planning
Regulation (OPR).
10.1.2 Visual Resources
The area to be managed through established visual quality objectives is not defined for TFL 18. In
2001, Canfor initiated steps to clarify the linkages between visually sensitive areas (scenic areas) and
visual quality objectives (VQO’s) as set out in legislation, the Kamloops LRMP, and the Lakes LRUP.
In September, 2004 the Ministry of Forests – Headwaters Forest District, working with Canfor and the
Lakes LRUP sub-committee developed agreement on draft polygons for the management of visual
quality. The resolution of where VQO’s will likely be managed on TFL 18 brings much needed
certainty to both timber supply and the expectation of the general public regarding visual resource
management.
Once the visually sensitive areas (scenic areas) are defined and amended, it is Canfor’s objective to
manage the visual resource consistent with the “Acts and regulations”. This objective will be met using
visual resource design principles and guidance provided in Appendix 8 of the Kamloops LRMP in a
manner that minimizes timber supply impacts.
Pending further direction from the Ministry of Forests, assumptions around forest cover requirements
will be based on the VLI and follow the approach specified in the Procedures for Factoring Visual
Resources into Timber Supply Analyses (BC Ministry of Forests et al. 1998).
Visual absorption capacity (VAC) and Recommended Visual Quality Classes (RVQC) are defined for
69 visual quality polygons in TFL 18. Based on these two attributes, two visual forest cover
requirements—percent denudation and visually effective green-up—are determined separately for each
visual quality polygon.
10.1.2.1. Percent Denudation
The Procedures for Factoring Visual Resources into Timber Supply Analyses (BC Ministry of Forests
et al. 1998) specifies area-based percent denudation ranges for each visual quality class. For the
purpose of timber supply analysis in TFL 18, the VAC rating was used to refine the percent denudation
range to a single value for each combination of RVQC and VAC, as shown in Table 37. Percent
denudation values are consistent with Table 4 in the Procedures. Clearcutting is the silvicultural system
assumed for all visual quality analysis. Percent denudation applies to the crown forested land base,
which includes roads as well as all productive forested land.
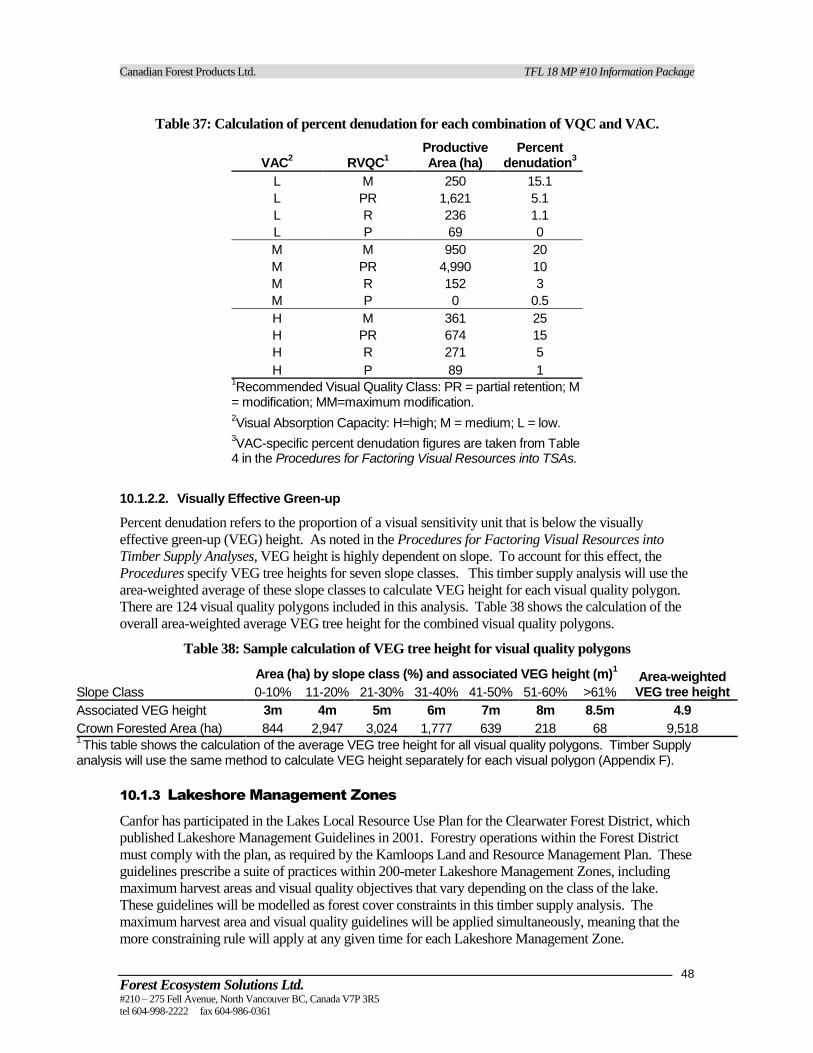
Canadian Forest Products Ltd. TFL 18 MP #10 Information Package
Forest Ecosystem Solutions Ltd. #210 – 275 Fell Avenue, North Vancouver BC, Canada V7P 3R5 tel 604-998-2222 fax 604-986-0361
48
Table 37: Calculation of percent denudation for each combination of VQC and VAC.
VAC2 RVQC
1
Productive Area (ha)
Percent denudation
3
L M 250 15.1
L PR 1,621 5.1
L R 236 1.1
L P 69 0
M M 950 20
M PR 4,990 10
M R 152 3
M P 0 0.5
H M 361 25
H PR 674 15
H R 271 5
H P 89 1 1Recommended Visual Quality Class: PR = partial retention; M
= modification; MM=maximum modification. 2Visual Absorption Capacity: H=high; M = medium; L = low.
3VAC-specific percent denudation figures are taken from Table
4 in the Procedures for Factoring Visual Resources into TSAs.
10.1.2.2. Visually Effective Green-up
Percent denudation refers to the proportion of a visual sensitivity unit that is below the visually
effective green-up (VEG) height. As noted in the Procedures for Factoring Visual Resources into
Timber Supply Analyses, VEG height is highly dependent on slope. To account for this effect, the
Procedures specify VEG tree heights for seven slope classes. This timber supply analysis will use the
area-weighted average of these slope classes to calculate VEG height for each visual quality polygon.
There are 124 visual quality polygons included in this analysis. Table 38 shows the calculation of the
overall area-weighted average VEG tree height for the combined visual quality polygons.
Table 38: Sample calculation of VEG tree height for visual quality polygons
Area (ha) by slope class (%) and associated VEG height (m)1 Area-weighted
VEG tree height Slope Class 0-10% 11-20% 21-30% 31-40% 41-50% 51-60% >61%
Associated VEG height 3m 4m 5m 6m 7m 8m 8.5m 4.9
Crown Forested Area (ha) 844 2,947 3,024 1,777 639 218 68 9,518 1 This table shows the calculation of the average VEG tree height for all visual quality polygons. Timber Supply
analysis will use the same method to calculate VEG height separately for each visual polygon (Appendix F).
10.1.3 Lakeshore Management Zones
Canfor has participated in the Lakes Local Resource Use Plan for the Clearwater Forest District, which
published Lakeshore Management Guidelines in 2001. Forestry operations within the Forest District
must comply with the plan, as required by the Kamloops Land and Resource Management Plan. These
guidelines prescribe a suite of practices within 200-meter Lakeshore Management Zones, including
maximum harvest areas and visual quality objectives that vary depending on the class of the lake.
These guidelines will be modelled as forest cover constraints in this timber supply analysis. The
maximum harvest area and visual quality guidelines will be applied simultaneously, meaning that the
more constraining rule will apply at any given time for each Lakeshore Management Zone.

Canadian Forest Products Ltd. TFL 18 MP #10 Information Package
Forest Ecosystem Solutions Ltd. #210 – 275 Fell Avenue, North Vancouver BC, Canada V7P 3R5 tel 604-998-2222 fax 604-986-0361
49
10.1.3.1. LMZ Maximum Harvest Guidelines
The lakes LRUP Lakeshore Management Guidelines specify recommendations for selection harvesting
and clearcutting including basal area retention, maximum cutblock size, and maximum area harvested
during each harvest pass. Selection harvesting is not currently practised in TFL 18 to any significant
degree, so guidelines for clearcuts will be applied in timber supply analysis. Table 39 shows the
harvest specifications from the Lakeshore Management Guidelines and the assumptions that will be
applied for timber supply analysis.
The harvest guidelines for clearcuts specify a maximum proportion of area that may be harvested
during each pass. “Area” is assumed to be productive forest area. “Pass” is the length of time required
for the clearcut areas to achieve 3-meter green-up, and is calculated as the average age that Future
MSYTs reach 3 meters in height in each LMZ.
The Lakeshore Management Guidelines state that harvesting is excluded from Class A LMZs "except
for the management of pests, disease, fire and other natural occurrences that threaten the integrity of
adjacent commercial timber stands and/or recreation site safety.” To account for these minor harvest
entries in timber supply analysis, a similar approach is taken for Class A and No Harvest LMZs as was
taken for OGMAs: no more than 10% of these zones can be less than the age of old growth specified in
the Landscape Unit Planning Guide (140 years in the ESSFvv/wc2 and 120 in all other BGC variants).
Table 39: Maximum allowable harvest guidelines for Lakeshore Management Zones.
Selection Systems Clearcuts Data Package Assumptions
1
Lakes LRUP Class
THLB Net Area (ha)
Minimum Basal Area Retention
Maximum harvest per pass (% of
area)
Maximum cutblock size (ha)
Maximum harvest per pass (% of
area)
Maximum harvest per pass (% of
area)
Duration of harvest
passes (years)
3
No Harvest 76 n/a n/a n/a 0% 10%2
120-140
A 287 n/a n/a n/a 0% 10%2 120-140
B 742 40% 50% 10 10-20% 20% 15-25
C 1,573 variable 50% 15 25% 25% 15-25
D 243 variable 70% 20 40% 40% 15-25
E 64 variable 100% 30 50% 50% 15-25 1Assumptions that will be applied as forest cover constraints for timber supply analysis.
2A small percentage of harvest is assumed for management of natural disturbance and safety.
3the duration of harvest passes is calculated separately for each LMZ based on BGC variant (for No
Harvest and Class A LMZs) and Future MSYT productivity (passes are defined by attainment of 3-meter green-up height.
10.1.3.2. LMZ Visual quality objectives
Table 40 gives a summary of forest cover requirements for visual quality objectives in Lakeshore
Management Zones. A visual absorption capacity of moderate (M) is assumed in all lakeshore
management zones. Some portions of LMZs are excluded from harvest, as specified in the Lakes
LRUP. These are modeled with a forest cover requirement of 100% stem retention (0% denudation).
Percent Denudation and VEG tree height are calculated using the same methods as the other visual
quality polygons, and a detailed summary of these calculations for individual Lakeshore Management
Zones is given in Appendix G.

Canadian Forest Products Ltd. TFL 18 MP #10 Information Package
Forest Ecosystem Solutions Ltd. #210 – 275 Fell Avenue, North Vancouver BC, Canada V7P 3R5 tel 604-998-2222 fax 604-986-0361
50
Table 40: Summary of forest cover requirements for visual quality objectives in LMZs
Lakes LRUP Class
Total Area (ha)
CFLB Area (ha) Visual Quality Objective
Percent Denudation
Average VEG tree
height
A 109 103 Preservation (P) 0.5% 3.4
B 318 315 Retention (R) 3% 3.5
C 803 788 Partial Retention (PR) 10% 3.5
D 1,698 1,640 Modification (M) 20% 3.5
E 261 255 Modification (M) 20% 3.1
No Harvest 70 68 No Harvest n/a n/a
Total 3,150 3,067 3.5
10.1.4 Biodiversity
To implement the biodiversity objectives of the Kamloops LRMP, and based on priorities set by
Government, the Ministry of Sustainable Resource Management (MSRM) created a biodiversity
working group in 2001. Canfor participated in this working group, which developed an implementation
strategy to meet the LRMP objectives while limiting the impact of landscape unit biodiversity
requirements to no more than 4% of the level of timber harvesting in the LRMP over the short and long
term. As part of this process, it was concluded that the 4% impact limitation specified in the Kamloops
LRMP includes all elements of biodiversity as defined in the Biodiversity Guidebook.
10.1.4.1. Landscape Units
TFL 18 falls within the Clearwater Landscape Unit (LU 18), as defined by the Kamloops LRMP. The
Clearwater Landscape Unit has been assigned a low biodiversity emphasis option as an outcome of the
Kamloops LRMP.
10.1.4.2. Old Growth Management Areas
During 2002 and 2003 a strategy was implemented to place Old Growth Management Areas (OGMAs)
on the landscape. Canfor led this process for the Clearwater Landscape Unit, and provided draft
OGMAs to MSRM in 2003. Canfor continues to work with MSRM to finalize OGMA placement.
However, the 2003 draft OGMAs will be used in the base case to model forest cover requirements for
old seral forest, as they currently represent the old growth management strategy for TFL 18.
OGMAs are managed as permanent reserves on TFL 18 and represent the most significant harvest
exclusion on TFL 18. However, they are not included in the netdown because a small portion (<10%)
of OGMAs may be harvested for forest health reasons. To model these management intrusions into
OGMAs over the planning horizon, an average 90% old seral forest cover requirement will be applied
to OGMAs. The forest cover requirement will be applied separately to OGMAs of each biogeoclimatic
(BGC) variant, so that the harvest is proportionately allocated across each variant. The forest cover
requirement for each variant is adjusted slightly for current susceptibility, defined as stands leading in
pine or spruce that are >140 years old. This allows a higher harvest level in variants with higher rates
of susceptibility. The forest cover requirements for OGMAs are shown in Table 41.
Spatial location of OGMAs is fixed throughout the planning horizon, and there is no replacement for
sanitation harvests that occur within OGMAs.

Canadian Forest Products Ltd. TFL 18 MP #10 Information Package
Forest Ecosystem Solutions Ltd. #210 – 275 Fell Avenue, North Vancouver BC, Canada V7P 3R5 tel 604-998-2222 fax 604-986-0361
51
Table 41: Calculation of the forest cover requirement within OGMAs of each BGC Variant
BGC Variant
CFLB Area (ha)
OGMA area (ha)
Pl/Sx >140 years old
(ha) Susceptible
%
Proportional allocation of 90% old seral forest cover requirement
Age definition of
old seral1
(years)
ESSFdc2 3,347 587 326 56% 91% 120
ESSFvv 2,042 835 406 49% 92% 140
ESSFwc2 29,270 2,752 1,718 62% 89% 140
ICHmk2 5,978 772 167 22% 96% 120
ICHmw3 4,907 277 87 31% 95% 120
SBSdw1 1,520 201 26 13% 98% 120
SBSmm 20,245 2,676 2,055 77% 87% 120
Total 67,309 8,100 4,786 59% 90% 1 Age definition of old seral consistent with KLRMP OGMA process agreement
10.1.5 Riparian Management Zones
Riparian management zones occupy 9008 ha of the TFL. Consistent with the recommendations of the
Riparian Management Area Guidebook, various levels of harvesting retention are practised within
RMZs. However, partial retention in RMZs is not uniform: the amount of retention on any given site
depends on the state of adjacent stands, windfirmness, and riparian sensitivity to harvesting. Stem
retention in RMZs will be modelled in this timber supply analysis as an old seral forest cover
requirement to reflect the spatially and temporally dynamic nature of retention in the RMZs of TFL18.
Mature seral forest cover requirements for riparian management zones are shown in Table 42. forest
cover targets are applied separately to each riparian class (i.e. S1, S2, L1, etc…) to ensure proportional
representation of mature forest in each riparian class. The minimum age at which a stand is eligible to
contribute to the forest cover target is the age of maturity for NDT3 climates, as defined in table 10 of
the Biodiversity Guidebook (BC MoF 1995).
Table 42: Mature seral forest cover requirements for riparian management zones (RMZs).
Riparian Class RMZ Width (m)
RMZ Area (ha)--PFLB
Forest cover requirement
Minimum age to meet cover target (years)
S1 20 103 50% 100
S2 20 131 50% 100
S3 20 465 50% 100
S4 30 190 25% 100
S5 30 1,200 25% 100
S6 20 2,998 5% 100
Streams 5,087
L1 30 361 25% 100
L3 30 133 25% 100
Lakes 494
W1 40 1,503 25% 100
W3 30 949 25% 100
W5 40 975 25% 100
Wetlands 3,427
Total RMA Reductions 9008

Canadian Forest Products Ltd. TFL 18 MP #10 Information Package
Forest Ecosystem Solutions Ltd. #210 – 275 Fell Avenue, North Vancouver BC, Canada V7P 3R5 tel 604-998-2222 fax 604-986-0361
52
10.1.6 Watershed Management
Gill Creek Watershed has been formall de-registered as a community watershed, and there
consequently are no special legal constraints on watershed management in TFL 18.
Headwaters District staff is in the process of reviewing the status of all watersheds in TFL 18.
This process is expected to be concluded in June, 2004 and any new direction provided will be
incorporated into timber supply analysis if it becomes available before the initiation of timber
supply analysis. In the event that no further direction is provided, modeled harvest through the
planning horizon will not be constrained by watershed objectives, but equivalent clearcut area
(ECA) of the watersheds of TFL18 will be monitored. Table 43 shows the threshold ECA
proportions that will be used to monitor watershed management in the timber supply
modeling.
Table 43: Summary of TFL18 watershed areas and equivalent clearcut area (ECA) thresholds
Watershed Name ECA Total Area
(ha) Productive Area (ha)
Net Area (ha) Reference*
n/a 1,014 963 718
Brookfield 30% 9,560 8,330 7,734 1
Canimred 35% 17,738 16,094 15,425 2
Gill 25% 1,329 1,108 1,057 3
Goodwin 35% 2,000 1,908 1,847 6
Italia 35% 5,745 5,140 4,927 6
Lolo 35% 96 82 81 6
Mann North 30% 12,487 11,161 10,537 4
Mann Residual 30% 7,753 7,057 6,667 4
Mann West 32% 4,700 4,343 4,080 4
Maury 35% 4,378 3,929 3,735 5
McKenzie 35% 608 570 557 6
Robinson 35% 1,813 1,596 1,532 6
Sock 35% 2,086 1,967 1,924 6
Wylie 35% 3,235 3,067 2,991 6
Total 74,541 67,314 63,812
*Source of "red-flag" ECA threshold
1. Level 2 Watershed Assessment of Brookfield Creek Watershed, March 1999
2. Canimred Creek Level 2 Watershed Assessment, 1999
3. Reconnaisance Watershed Assessment of Gill Creek Watershed, May 2000
4. Mann Creek Watershed Advisory Committee Minutes, October 25, 1999
5. Maury Creek Watershed Assessment Update, December, 2002
6. No Red Flag ECA Set - Set at 35% arbitrarily
Equivalent Clearcut Area (ECA) is essentially the proportion of the watershed that has been harvested,
with a reduction factor applied to account for hydrological recovery as harvest blocks regenerate. The
MoF is in the process of developing improved hydrological recovery curves that will apply to the
Headwaters District (Rita Winkler, MoF Research Hydrologist, pers. comm. October 2004), but these
numbers are not expected to be available at the initiation of analysis. In the absence of local
information, the standard recovery curve provided in the Watershed Assessment Procedure Guidebook
(BC MoF 1999, 28) will be used instead (Table 44). The heights required to calculate the recovery for
stands within the watershed will be based on MSYTs for each analysis unit.

Canadian Forest Products Ltd. TFL 18 MP #10 Information Package
Forest Ecosystem Solutions Ltd. #210 – 275 Fell Avenue, North Vancouver BC, Canada V7P 3R5 tel 604-998-2222 fax 604-986-0361
53
Table 44: Default Hydrological Recovery Curve
Average Stand Height (m)
% Recovery
0 - 2.9 m 0%
3.0 -4.9 m 25%
5.0 – 6.9 m 50%
7.0 – 8.9 75%
9.0 m + 90%
10.1.7 Wildlife
There are no forest cover requirements for individual wildlife species. The Kamloops LRMP
recognized an area of critical moose winter range covering 2126 ha of productive land in the lower
Mann creek watershed at the southern portion of TFL18. Although there are no forest cover
requirements for moose winter range, 20% of the productive area of this range is allocated to OGMAs.

Canadian Forest Products Ltd. TFL 18 MP #10 Information Package
Forest Ecosystem Solutions Ltd. #210 – 275 Fell Avenue, North Vancouver BC, Canada V7P 3R5 tel 604-998-2222 fax 604-986-0361
54
10.2 Timber Harvesting
10.2.1 Harvest Scheduling Rules—Short Term
Simulation models are rule-driven, and require harvest scheduling rules to control the order in which
stands are harvested. There are two measures taken in this analysis to ensure that simulated harvests in
the short term are consistent with current harvesting practices. First, Canfor’s FDP is used to allocate
harvests in the first five years (period 1: 2004-2008). Subsequently, harvest priority is assigned to
stands based on their assumed susceptibility to attack by mountain pine beetle. Once these stands have
been harvested, normal scheduling is resumed as described in Section 10.2.2.
10.2.1.1. Fixed FDP blocks
Cutblocks with category A approved/proposed or CP status will be fixed for harvest in the first period
of the planning horizon. These blocks, summarized in Table 45, are comprised of both Canfor and
BCTS forest development plans. The total volume of the fixed harvest corresponds to a harvest rate of
176,134 m3/yr, which is slightly less than the current allowable annual cut of 177,650 m
3/yr. FSOS will
harvest additional volume to make up the difference.
Table 45: Area and volume summary of FDP blocks that will be fixed for harvest during the first
period of the planning horizon.
Approval Status Description
Net Area (ha)
Net Volume (m3)
AA Approved Category "A" 1,713 606,725
CP Cutting permit issued 411 159,670
PA Proposed Category “A” 376 114,274
Total 2,499 880,668
Total/year during first 5-year period 500 176,134
10.2.1.2. Harvest priority based on susceptibility to beetle attack
Salvage of beetle-attacked pine stands is currently the primary consideration driving harvest in TFL18,
and it is desirable that timber supply modeling reflects this strategy in the short term. Canfor provided a
susceptibility rating based on the stand age and component of lodgepole pine (Table 46). Using this
rating system, polygons were assigned a harvest priority multiplier that increases the emphasis that a
stand receives within the scheduling rule (“relative poorest first” in the base case, described below).
This method gives harvesting flexibility to harvest lower priority stands if high priority stands are not
available. Appropriate harvest priority multipliers are shown in Table 46.
Table 46: Harvest Priority Multipliers used as weights for harvest scheduling.
Susceptibility Susceptibility Criteria Priority
Multiplier
Low
Pl 20-40%, Age Class 5 3
Pl 20-40%, Age Class 6 4
Pl 20-40%, Age Class 7 5
Pl 20-40%, Age Class 8 6
Pl 20-40%, Age Class 9 7
Medium Pl 40-60%, Age Class >4 12
High Pl >60%, Age Class >4 20

Canadian Forest Products Ltd. TFL 18 MP #10 Information Package
Forest Ecosystem Solutions Ltd. #210 – 275 Fell Avenue, North Vancouver BC, Canada V7P 3R5 tel 604-998-2222 fax 604-986-0361
55
10.2.2 Harvest Scheduling Rules—Long Term
It is difficult to predict harvest practices beyond the short term, so harvest scheduling rules are applied
in simulation models organize the timing of harvests. In order to understand the impacts of the timber
supply assumptions and constraints, it is important that these rules are able to structure the harvest in a
way that realizes the productive potential of the land base. Poorly designed harvest scheduling rules
contain inherent constraints to harvest, which can either reduce or exacerbate the effect of intended
constraints. Harvest scheduling is therefore fundamental to effective timber supply modeling.
“Relative poorest first” scheduling, an innovative harvest rule that has recently been developed by
FESL, will be used for the base case in this analysis. this scheduling rule provides a more systematic
and flexible approach to harvesting than other scheduling rules. Because “relative poorest first”
scheduling is recently developed, a sensitivity analysis will show base case harvest levels using the
more commonly used “relative oldest first” rule. The two rules are discussed in more detail below.
10.2.2.1. “Relative oldest first” scheduling
The “relative oldest first” rule is a commonly used rule that will be used as a sensitivity analysis against
relative poorest first scheduling. In this rule, the age of a stand is related to its minimum harvestable
age. Stands that have the greatest proportional difference between their actual age and their minimum
harvest age are given priority for harvest, subject to forest cover requirements.
One of the main drawbacks of the “relative oldest first” rule is it’s dependence on high minimum
harvest ages. Minimum harvest age has two roles in “relative oldest first” simulations: (1) Establish a
minimum merchantable age below which harvest is not allowed; and (2) Provide a target age for
harvest scheduling. These are conflicting roles. Setting minimum harvestable age at minimum
merchantability can negatively impact growing stock in the long term because it allows persistent
harvest below culmination age. On the other hand, setting MHA close to culmination age can constrain
the medium term because it exacerbates the shortage of available volume at pinch points. Harvest
flows are artificially constrained by the necessity to compromise between the two roles of MHA, which
limits the ability of “relative oldest first” scheduling to realize the productive potential of the land base.
10.2.2.2. “Relative poorest first” scheduling
“Relative poorest first” scheduling was designed to address the problems associated with the “relative
oldest first” rule. Specifically, it schedules harvests strategically to maximize yields from each polygon
and is independent of minimum harvest age. “Relative poorest first” scheduling provides a more
rational approach to harvest scheduling that better reflects the opportunities available to forest planners.
The premise of “relative poorest first” scheduling is that the productivity of the future stand is the best
indicator of when to harvest the existing stand on any given polygon. Culmination age is often thought
of as the optimal time to harvest a stand if you’re trying to maximize volume flows over the planning
horizon. However, harvesting the current stand at culmination age is optimal only if the existing stand
is on the same curve that it will regenerate to after harvest. This is not the case in TFL18: yields for
natural and existing managed stands are usually quite different from future managed stand yields. In
this situation, the culmination age of the existing stand is irrelevant to decisions of when to harvest that
stand. What matters is the growth rate of the existing stand relative to the maximum growth rate of the
future stand that it will regenerate to. A stand that is currently growing faster than the culmination
growth rate of the future stand should be deferred from harvest until its growth rate has dropped to the
level of the future stand. Conversely, a slow-growing stand that will be replaced by a fast-growing
future stand should be harvested as soon as possible. Scheduling harvests according to the culmination
volume of the regenerated stand instead of the existing stand can result in subtle increases in timber
supply because it attempts to maximize the average volume production on each polygon.
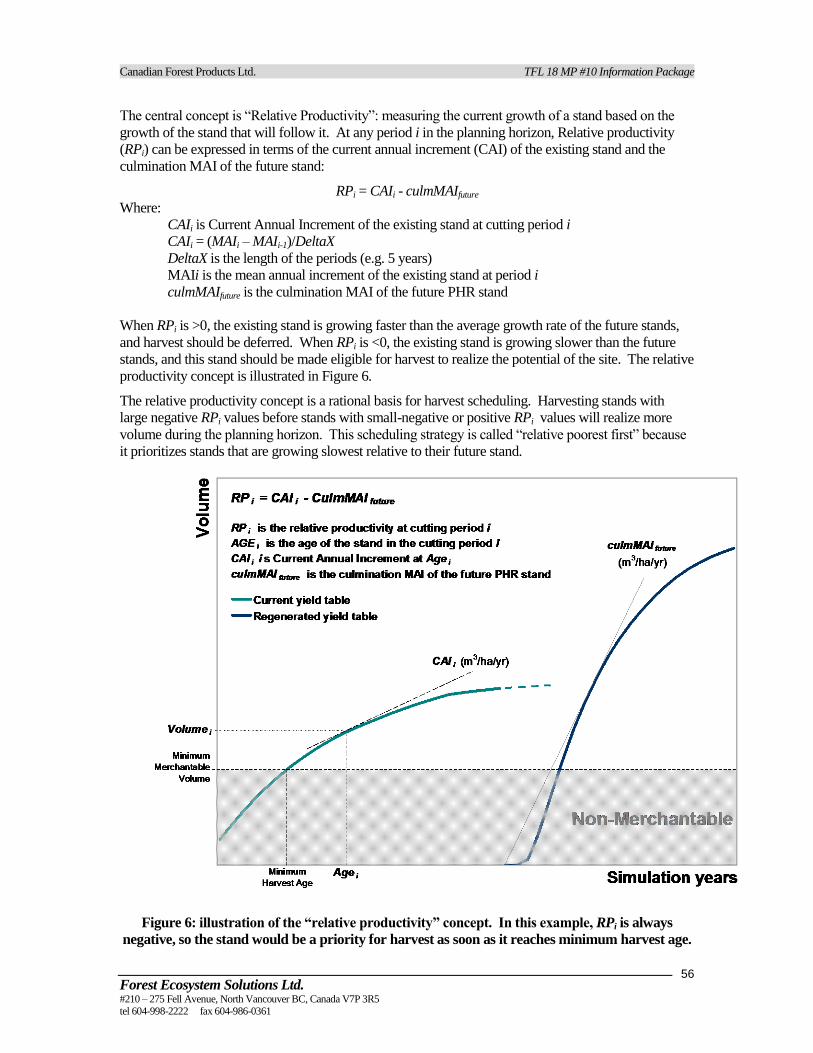
Canadian Forest Products Ltd. TFL 18 MP #10 Information Package
Forest Ecosystem Solutions Ltd. #210 – 275 Fell Avenue, North Vancouver BC, Canada V7P 3R5 tel 604-998-2222 fax 604-986-0361
56
The central concept is “Relative Productivity”: measuring the current growth of a stand based on the
growth of the stand that will follow it. At any period i in the planning horizon, Relative productivity
(RPi) can be expressed in terms of the current annual increment (CAI) of the existing stand and the
culmination MAI of the future stand:
RPi = CAIi - culmMAIfuture
Where:
CAIi is Current Annual Increment of the existing stand at cutting period i
CAIi = (MAIi – MAIi-1)/DeltaX
DeltaX is the length of the periods (e.g. 5 years)
MAIi is the mean annual increment of the existing stand at period i
culmMAIfuture is the culmination MAI of the future PHR stand
When RPi is >0, the existing stand is growing faster than the average growth rate of the future stands,
and harvest should be deferred. When RPi is <0, the existing stand is growing slower than the future
stands, and this stand should be made eligible for harvest to realize the potential of the site. The relative
productivity concept is illustrated in Figure 6.
The relative productivity concept is a rational basis for harvest scheduling. Harvesting stands with
large negative RPi values before stands with small-negative or positive RPi values will realize more
volume during the planning horizon. This scheduling strategy is called “relative poorest first” because
it prioritizes stands that are growing slowest relative to their future stand.
Figure 6: illustration of the “relative productivity” concept. In this example, RPi is always
negative, so the stand would be a priority for harvest as soon as it reaches minimum harvest age.

Canadian Forest Products Ltd. TFL 18 MP #10 Information Package
Forest Ecosystem Solutions Ltd. #210 – 275 Fell Avenue, North Vancouver BC, Canada V7P 3R5 tel 604-998-2222 fax 604-986-0361
57
10.2.3 Minimum Harvest Age
Minimum harvest age is the age at which stands become eligible for harvest. Traditionally, minimum
harvest age has been set at or just below culmination age. This can create inflexibilities in harvest
scheduling because stands are not available for harvest until they reach culmination age. This is an
artificial constraint because it is unlikely that a company would forego a merchantable stand during a
timber supply shortage simply because that stand is below culmination age.
An advantage of “relative poorest first” scheduling is that it is independent of minimum harvest age.
Minimum harvest age under this rule can be defined as the true “bare minimum” that Canfor would
harvest: the age at which each analysis unit reaches the minimum merchantable volume of 125 m3/ha.
Stands are targeted for harvest based on culmination age of future stands, but the model will be able to
harvest stands that are well below culmination age in order to meet volume targets during a brief timber
supply shortage. Using a “minimum merchantability” definition for minimum harvest age better
reflects the flexibilities available to forest planners in real harvest scheduling exercises.
Setting minimum harvest age below culmination age can allow growing stock to be depleted in the
long term. As part of base case development, timber flows will be tested over a planning horizon of
500 years to ensure long-term stability of the growing stock. Minimum harvest ages for NSYT and
MSYT analysis units are given in Table 47 and Table 48, respectively.
Table 47: Minimum harvest age based on minimum merchantable volume (NSYTs)
Analysis Unit
Age of Merchantability
(years) Analysis Unit
Age of Merchantability
(years)
11 Constrained_marginal 165 42 IU Balsam_2 275
12 Constrained_very low 105 43 IU Balsam_3 45
13 Constrained_low 80 44 IU Balsam_4 290
14 Constrained_medium 70 45 IU Balsam_5 180
15 Constrained_high 60 46 IU Balsam_6 140
16 Constrained_very high 50 47 IU Balsam_7 65
21 Deciduous_very low 170 48 IU Balsam_8 70
22 Deciduous_low 85 49 IU Balsam_9 30
23 Deciduous_medium 70 50 IU Balsam_10 45
24 Deciduous_high 65 51 IU Balsam_11 40
25 Deciduous_very high 55 52 IU Balsam_12 115
31 Immature_very low 120 61 Mature_marginal 115
32 Immature_low 85 62 Mature_very low 90
33 Immature_medium 65 63 Mature_low 75
34 Immature_high 55 64 Mature_medium 65
35 Immature_very high 45 65 Mature_high 50
41 IU Balsam_1 210 66 Mature_very high 55

Canadian Forest Products Ltd. TFL 18 MP #10 Information Package
Forest Ecosystem Solutions Ltd. #210 – 275 Fell Avenue, North Vancouver BC, Canada V7P 3R5 tel 604-998-2222 fax 604-986-0361
58
Table 48: Minimum harvest age based on minimum merchantable volume (existing and future
MSYTs)
Analysis Unit
Age of Merchantability
(years) Analysis Unit
Age of Merchantability
(years)
102 Existing Pine very low 60 201 Future_submarginal n/a
103 Existing Pine low 45 202 Future_marginal 95
104 Existing Pine medium 45 203 Future_very low 70
105 Existing Pine high 40 204 Future_low_late 60
106 Existing Pine very high 35 205 Future_low_early 70
107 Existing Spruce marginal 110 206 Future_medium_late 70
108 Existing Spruce very low 80 207 Future_medium_mid 60
109 Existing Spruce low 60 208 Future_medium_early 55
110 Existing Spruce medium 55 209 Future_high 60
111 Existing Spruce high 50 210 Future_very high 60
112 Existing Spruce very high 45
113 Existing Mixed marginal 80
114 Existing Mixed very low 55
115 Existing Mixed low 50
116 Existing Mixed medium 45
117 Existing Mixed high 45
118 Existing Mixed very high 40
10.2.4 Initial Harvest Rate
The initial harvest rate for the Base Case will be the current AAC for TFL 18 plus unsalvaged losses, as
shown in Table 49. Harvest rates reported in the analysis report will be net of unsalvaged losses.
Table 49: Initial annual harvest rate
Volume Allocation Harvest rate (m3/year)
Current AAC 177,650
Unsalvaged losses 3,000
Initial harvest level 180,650
10.2.5 Harvest Flow Objectives
Several harvest flow objectives will be incorporated into the Base Case:
Sustain even flow in the short and medium term until reductions are necessary for long-term
sustainability;
Where decreases in the harvest rate are necessary, volume harvested will decrease by no more
than 10% per ten-year period; and
Maintain even flow in the long term.

Canadian Forest Products Ltd. TFL 18 MP #10 Information Package
Forest Ecosystem Solutions Ltd. #210 – 275 Fell Avenue, North Vancouver BC, Canada V7P 3R5 tel 604-998-2222 fax 604-986-0361
59
11 References
B.C. Ministry of Forests, Forest Practices Branch. 1998. Procedures for factoring visual resources in
timber supply analyses. Victoria, B.C. REC-029.
BC Ministry of Forests 2002. Cruising Manual, Effective April 1, 2002. Victoria: Province of British
Columbia.
BC Ministry of Forests 2002. Tree Farm Licence 18—Rationale for Allowable Annual Cut (AAC)
Determination, Effective October 25, 2000. Issued to Slocan Forest Products Ltd. Victoria: Province of
British Columbia.
BC Ministry of Forests and Ministry of Environment, Lands and Parks 1995a. Biodiversity Guidebook.
Forest Practices Code of British Columbia. Victoria: Province of British Columbia.
BC Ministry of Forests and Ministry of Environment, Lands and Parks 1995b. Riparian Management
Area Guidebook. Forest Practices Code of British Columbia. Victoria: Province of British Columbia.
BC Ministry of Forests and Ministry of Environment, Lands and Parks 1999a. Landscape Unit
Planning Guide. Forest Practices Code of British Columbia. Victoria: Province of British Columbia.
BC Ministry of Forests and Ministry of Environment, Lands and Parks 1999b. Interior Watershed
Assessment Procedure Guidebook (IWAP), 2nd
edition. Forest Practices Code of British Columbia.
Victoria: Province of British Columbia.
BC Ministry of Forests and Ministry of Environment, Lands and Parks 1999c. Green-up Guidebook, 2nd
edition. Forest Practices Code of British Columbia. Victoria: Province of British Columbia.
Bulmer, C.E. and M. Krzic 2003. Soil properties and lodgepole pine growth on rehabilitated landings
in northeastern British Columbia. Can. J. Soil Sci. 83: 465-474.
Dobi, D. 2004. Tree Farm Licence #18. Management Plan #10 for the Term September 28, 2005 to
September 27, 2009. Canadian Forest Products Ltd., Vavenby Division. May 27, 2004.
Douglas, M.J., P.J. Courtin, C.E. Bulmer, and R.K. Scagel. 2003. Tree Growth on Regabilitated forest
Roads in Southwestern British Columbia: Year 8 Results. Research Section, Vancouver Forest Region,
BCMOF. Nanaimo, BC. Extension Note EN-017.
Forsite Consultants Ltd. 2003. A Biodiversity Patch Size Distribution analysis for the Clearwater Forest
District—Final Report. Contract report prepared for Licensees of the Clearwater Forest District. April
24, 2003.
GEOWEST Environmental Consultants Ltd. 2001. Terrestrial Ecosystem Mapping for Slocan TFL 18-
- Terrestrial Ecosystem Mapping with Expanded Legends for Terrestrial Ecosystem Units for Slocan
TFL 18. Contract report prepared for Slocan Forest Products. March 2001.
Hugh Hamilton Limited 1998a. A Comparison of FSOS and FSSIM Results for Timber Supply
Analysis Using a Benchmark Dataset. Submitted to the Timber Supply Branch
Hugh Hamilton Limited 1998b. Timber Supply Analysis Information Package—Tree Farm Licence
18. Submitted to the Timber Supply Branch, B.C. Ministry of Forests. December 14, 1998.
J.S. Thrower & Associates Ltd. 2003a. Gap Analysis and Strategic Recommendations for a Growth &
Yield Program for Slocan’s TFL18—Draft. Contract report prepared for Slocan Forest Products,
Project: SGV-006. March 17, 2003.
Canadian Forest Products Ltd. TFL 18 MP #10 Information Package
Forest Ecosystem Solutions Ltd. #210 – 275 Fell Avenue, North Vancouver BC, Canada V7P 3R5 tel 604-998-2222 fax 604-986-0361
60
J.S. Thrower & Associates Ltd. 2003b. Growth & Yield of Residual Balsam Stands on TFL 18.
Contract report prepared for Slocan Forest Products, Project: SGV-008. October 16, 2003.
J.S. Thrower & Associates Ltd. 2003c. Potential Site Index Estimates for the Mapjor commercial Tree
Species on Tree Farm Licence 18. Contract report prepared for Slocan Forest Products, Project: SGV-
125-003. March 13, 2002.
J.S. Thrower & Associates Ltd. 2004. Yield Table Projections for Residual Balsam Stands on Canadian
Forest Products Ltd. TFL 18. Contract report prepared for Canadian Forest Products, Project: SGV-
009. June 17, 2003.
Silvatech Consulting Ltd. 2003a. Selection and Mapping of Old Growth Management Areas
(OGMA)—Clearwater Landscape Unit. Contract report prepared for Slocan Forest Products, March
30, 2003.
Silvatech Consulting Ltd. 2003b. TFL 18 Forest Cover And Road Rectification Project. Contract report
prepared for Slocan Forest Products, December 15, 2003.

Canadian Forest Products Ltd. TFL 18 MP #10 Information Package
Forest Ecosystem Solutions Ltd. #210 – 275 Fell Avenue, North Vancouver BC, Canada V7P 3R5 tel 604-998-2222 fax 604-986-0361
61
Appendix A: Final Report for Inventory Rectification

Canadian Forest Products Ltd. TFL 18 MP #10 Information Package
Forest Ecosystem Solutions Ltd. #210 – 275 Fell Avenue, North Vancouver BC, Canada V7P 3R5 tel 604-998-2222 fax 604-986-0361
62
Appendix B: Final Report for IU Balsam Yield Tables
Summary of project timeline and approval process
Final Report

Canadian Forest Products Ltd. TFL 18 MP #10 Information Package
Forest Ecosystem Solutions Ltd. #210 – 275 Fell Avenue, North Vancouver BC, Canada V7P 3R5 tel 604-998-2222 fax 604-986-0361
63
Appendix C: Future regeneration assumptions
Yield
Group Site Series
Net
Decile
Area
(ha)
Pl Site
Index
(PSI) Ep At Hw Bl Cw Fd Pl Sx
Planting
Density
(sph)
Total
crop
density
at FG
(sph)
FG
Density of
Crop
Trees at
FG (sph)
TIPSY
FG
Density
Apprx
age at
FG
>40%
Ingress
a ESSFvv/01 1,042 13 50 50 1,500 1,000 900 950 15 No
a ESSFvv/02 42 12 50 50 1,500 900 900 900 20 No
a ESSFvv/03 163 13 50 50 1,500 1,000 900 950 20 No
a ESSFvv/04 297 12 50 50 1,500 900 900 900 20 No
a ESSFvv/92 5 11 50 0 50 1,500 1,000 900 950 15 No
b ICHmk2/02 51 16 50 50 1,200 2,000 900 1,450 14 No
b ICHmw3/02 29 17 50 50 1,200 1,000 800 900 14 No
b ICHmw3/03 19 20 50 50 1,200 1,100 900 1,000 14 No
b ICHmw3/04 691 20 15 5 20 50 1,200 1,897 918 1,408 11 No
b SBSdw1/03 12 18 40 60 1,400 1,500 800 1,150 14 No
b SBSdw1/04 57 20 40 50 10 1,400 1,800 850 1,325 12 No
c ESSFdc2/02 43 13 20 80 1,500 900 900 900 20 No
c ESSFdc2/08 13 17 6 85 9 1,500 1,000 900 950 20 No
c ESSFdc2/91 6 14 6 0 0 85 9 1,500 1,000 900 950 20 No
c ESSFwc2/02 134 14 20 80 1,500 900 900 900 20 No
c ESSFwc2/09 101 13 20 80 1,500 700 600 650 20 No
c SBSmm/02 10 15 10 90 1,400 700 600 650 14 No
d ESSFdc2/01 1,611 18 99 1 1,500 2,325 1,100 1,713 10 No
d ESSFdc2/03 30 17 100 1,500 1,500 1,120 1,310 15 No
d ESSFdc2/06 458 20 2 95 3 1,500 1,500 1,100 1,300 10 No
d ESSFdc2/07 187 19 4 90 6 1,500 1,300 1,000 1,150 15 No
d SBSmm/03 149 18 10 90 1,400 1,200 700 950 12 No
d SBSmm/04 49 21 10 90 1,400 3,000 800 1,900 12 Yes
e ICHmk2/04 120 23 10 40 50 1,200 3,000 1,000 2,000 10 Yes
e ICHmw3/01 2,450 22 50 20 30 1,200 3,252 923 2,088 13 Yes
f ICHmw3/06 699 23 10 50 25 5 10 1,200 5,360 845 3,103 9 Yes
f ICHmw3/07 488 25 5 10 50 15 10 10 1,200 3,224 971 2,098 11 Yes
f ICHmw3/08 35 21 20 45 10 25 1,200 2,000 800 1,400 14 No
g ESSFwc2/01 11,075 19 20 5 75 1,500 3,968 980 2,474 10.5 Yes
g ESSFwc2/03 846 17 15 10 75 1,500 5,183 925 3,054 10 Yes
g ESSFwc2/04 0 18 15 5 80 1,500 2,211 911 1,561 10 No
g ESSFwc2/06 4,418 19 18 2 80 1,500 3,744 923 2,334 10 Yes
g ESSFwc2/93 2,612 19 20 5 75 1,500 3,968 980 2,474 11 Yes
g ESSFwc2/94 1,448 18 15 10 75 1,500 5,183 925 3,054 10 Yes
g ICHmk2/06 128 20 10 10 20 60 1,200 3,500 1,000 2,250 14 Yes
h ESSFwc2/07 398 21 100 1,500 3,212 894 2,053 11 Yes
h ICHmk2/01 3,353 22 10 20 70 1,200 4,467 1,015 2,741 9 Yes
h ICHmk2/05 1,233 25 3 7 20 70 1,200 5,228 1,104 3,166 9 Yes
I SBSdw1/08 72 25 10 10 20 60 1,400 1,000 800 900 12 No
I SBSdw1/09 68 20 20 20 60 1,400 1,000 600 800 14 No
j SBSdw1/01 858 22 20 40 40 1,400 2,500 1,050 1,775 10 No
j SBSdw1/05 8 21 20 40 40 1,400 2,000 900 1,450 10 No
j SBSdw1/06 22 24 10 50 40 1,400 2,300 1,100 1,700 10 No
k SBSdw1/07 342 23 5 10 40 50 1,400 2,500 900 1,700 10 No
k SBSmm/01 10,281 22 2 2 2 44 44 1,400 3,520 1,001 2,261 10 Yes
k SBSmm/06 2,648 21 2 50 50 1,400 2,676 1,144 1,910 9 Yes
k SBSmm/07 3,602 23 10 40 50 1,400 2,783 949 1,866 9 Yes
l ESSFwc2/08 1,510 18 40 20 40 1,500 900 800 850 20 No
m ESSFwc2/05 5,063 18 40 40 20 1,500 8,187 1,080 4,634 10 Yes
n ICHmk2/03 717 18 50 50 1,200 3,500 950 2,225 12 Yes
o ESSFdc2/05 793 18 1 74 25 1,500 1,516 1,120 1,318 10 No
p SBSmm/08 1,034 20 10 45 45 1,400 1,500 800 1,150 14 No
q SBSmm/05 1,191 19 3 3 44 50 1,400 4,961 944 2,953 10 Yes
r ICHmw3/05 345 22 96 3 1 1,200 2,333 1,050 1,692 11 No

Canadian Forest Products Ltd. TFL 18 MP #10 Information Package
Forest Ecosystem Solutions Ltd. #210 – 275 Fell Avenue, North Vancouver BC, Canada V7P 3R5 tel 604-998-2222 fax 604-986-0361
64
Appendix D: Existing Volume Check by AU
Inventory AUs
11 Constrained_marginal 1,025 436 143,098 132,637 -7%
12 Constrained_very low 2,012 1,568 450,621 450,358 0%
13 Constrained_low 1,891 1,382 584,273 578,472 -1%
14 Constrained_medium 1,805 1,125 618,693 609,873 -1%
15 Constrained_high 1,470 1,003 536,681 527,833 -2%
16 Constrained_very high 393 289 186,182 182,224 -2%
21 Deciduous_very low 79 50 5,155 4,739 -8%
22 Deciduous_low 117 117 12,950 12,650 -2%
23 Deciduous_medium 320 304 23,188 19,867 -14%
24 Deciduous_high 274 273 18,264 17,601 -4%
25 Deciduous_very high 177 177 13,969 13,370 -4%
31 Immature_very low 561 561 32,878 33,417 2%
32 Immature_low 2,040 2,040 220,665 220,534 0%
33 Immature_medium 1,060 1,060 197,419 198,790 1%
34 Immature_high 1,345 1,345 327,261 333,678 2%
35 Immature_very high 368 368 121,597 121,015 0%
41 IU Balsam_1 565 554 144,012 102,214 -29%
42 IU Balsam_2 101 101 32,918 19,458 -41%
43 IU Balsam_3 914 904 5,996 107,575 1694%
44 IU Balsam_4 17 15 5,979 2,866 -52%
45 IU Balsam_5 638 634 181,038 121,861 -33%
46 IU Balsam_6 651 648 188,996 145,646 -23%
47 IU Balsam_7 2,159 2,104 153,809 250,063 63%
48 IU Balsam_8 1,746 1,702 182,107 231,755 27%
49 IU Balsam_9 43 40 0 3,886 #DIV/0!
50 IU Balsam_10 1,219 1,198 24,732 116,758 372%
51 IU Balsam_11 378 370 18,799 41,135 119%
52 IU Balsam_12 43 43 17,627 10,532 -40%
61 Mature_marginal 1,352 1,352 289,484 268,991 -7%
62 Mature_very low 5,315 5,315 1,654,944 1,625,971 -2%
63 Mature_low 7,411 7,411 2,672,252 2,613,008 -2%
64 Mature_medium 5,113 5,113 2,122,015 2,081,095 -2%
65 Mature_high 3,780 3,780 1,692,410 1,669,150 -1%
66 Mature_very high 1,001 1,001 494,813 505,599 2%
102 Existing Pine very low 157 157 0 2 4609%
103 Existing Pine low 682 682 21 296 1316%
104 Existing Pine medium 508 508 265 815 208%
105 Existing Pine high 2,044 2,044 498 12,101 2331%
106 Existing Pine very high 737 737 473 4,052 756%
107 Existing Spruce marginal 401 401 41 0 -100%
108 Existing Spruce very low 1,778 1,778 851 0 -100%
109 Existing Spruce low 1,973 1,973 1,035 257 -75%
110 Existing Spruce medium 2,671 2,671 1,261 1,132 -10%
111 Existing Spruce high 2,453 2,453 2,015 6,529 224%
112 Existing Spruce very high 281 281 248 2,351 848%
113 Existing Mixed marginal 43 43 0 0 -100%
114 Existing Mixed very low 396 392 138 303 119%
115 Existing Mixed low 885 885 638 421 -34%
116 Existing Mixed medium 2,701 2,701 8,042 14,868 85%
117 Existing Mixed high 631 631 770 3,593 367%
118 Existing Mixed very high 175 175 77 1,593 1971%
Analysis Unit
Productive
Area (ha) Net Area (ha)
Volume (1000's m3) % Difference
from inventory

Canadian Forest Products Ltd. TFL 18 MP #10 Information Package
Forest Ecosystem Solutions Ltd. #210 – 275 Fell Avenue, North Vancouver BC, Canada V7P 3R5 tel 604-998-2222 fax 604-986-0361
65
Appendix E: Yield Tables for Natural and Managed
Stands
Table 50: Volume yield summary for NSYT Analysis Units
Net Volume (m3/ha) at 20-year age intervals
Analysis Unit 0 20 40 60 80 100 120 140 160 180 200 220 240 260 280 300
11 Constrained_marginal 0 0 0 6 29 56 80 104 125 142 158 173 186 195 200 204
12 Constrained_very low 0 0 2 22 69 115 155 191 221 245 265 284 301 312 318 324
13 Constrained_low 0 0 9 52 126 187 237 279 311 334 352 368 382 393 399 405
14 Constrained_medium 0 0 18 84 167 234 288 333 366 389 407 423 437 447 454 459
15 Constrained_high 0 0 38 135 228 303 362 409 441 460 474 488 500 509 515 520
16 Constrained_very high 0 0 92 216 314 389 445 489 518 536 550 564 576 584 589 593
21 Deciduous_very low 0 0 0 12 45 74 97 114 123 129 132 136 140 142 143 144
22 Deciduous_low 0 0 11 68 121 163 192 211 222 227 231 235 238 240 241 242
23 Deciduous_medium 0 0 23 99 167 221 258 282 297 306 312 319 324 328 329 331
24 Deciduous_high 0 0 37 125 202 260 299 325 342 351 359 366 373 377 379 380
25 Deciduous_very high 0 0 63 165 253 318 359 385 402 410 416 422 427 431 432 433
31 Immature_very low 0 0 1 22 57 95 127 156 179 198 213 228 242 250 255 258
32 Immature_low 0 0 7 55 118 169 212 250 280 304 325 344 361 372 376 381
33 Immature_medium 0 0 32 111 184 243 291 331 358 375 387 400 412 420 424 427
34 Immature_high 0 0 64 160 240 304 355 396 423 440 450 463 475 483 487 490
35 Immature_very high 0 1 119 237 327 398 454 498 523 535 541 551 560 567 571 575
41 IU Balsam_1 0 0 0 0 0 0 0 0 1 30 91 158 211 253 293 327
42 IU Balsam_2 0 0 0 0 0 0 0 0 0 0 0 1 15 75 143 195
43 IU Balsam_3 13 42 108 176 229 273 312 349 383 413 438 460 475 479 482 484
44 IU Balsam_4 0 0 0 0 0 0 0 0 0 0 0 0 0 12 88 164
45 IU Balsam_5 0 0 0 0 0 0 0 12 65 140 204 253 294 332 366 396
46 IU Balsam_6 0 0 0 0 7 30 73 141 202 251 293 332 370 404 435 459
47 IU Balsam_7 1 13 56 115 170 214 254 292 326 358 386 412 430 439 443 446
48 IU Balsam_8 0 0 21 95 173 236 285 331 377 419 457 492 525 549 553 554
49 IU Balsam_9 12 93 193 267 322 368 406 436 460 482 500 515 520 525 528 531
50 IU Balsam_10 1 31 114 196 260 310 358 402 442 477 510 540 561 565 567 570
51 IU Balsam_11 0 33 132 225 298 355 407 456 500 538 574 606 633 638 641 643
52 IU Balsam_12 0 0 0 0 0 48 151 244 317 371 423 477 526 571 612 648
61 Mature_marginal 0 0 4 28 69 106 138 168 192 211 228 243 258 267 271 275
62 Mature_very low 0 0 6 42 105 160 205 245 275 299 318 335 351 361 367 373
63 Mature_low 0 0 19 84 160 221 271 311 341 362 377 393 406 415 421 425
64 Mature_medium 0 0 35 120 206 274 328 371 402 423 437 452 465 474 480 485
65 Mature_high 0 0 72 183 276 347 403 447 474 490 500 512 522 529 534 538
66 Mature_very high 0 0 55 187 299 387 453 506 545 574 597 619 638 649 654 658

Canadian Forest Products Ltd. TFL 18 MP #10 Information Package
Forest Ecosystem Solutions Ltd. #210 – 275 Fell Avenue, North Vancouver BC, Canada V7P 3R5 tel 604-998-2222 fax 604-986-0361
66
Table 51: Volume yield summary for Existing and Future MSYT Analysis Units
Net Volume (m3/ha) at 20-year age intervals
Analysis Unit 0 20 40 60 80 100 120 140 160 180 200 220 240 260 280 300
102 Existing Pine very low 0 0 40 143 221 278 315 337 351 362 370 376 382 379 379 379
103 Existing Pine low 0 0.9 90 214 299 347 380 401 414 426 429 428 426 424 424 424
104 Existing Pine medium 0 0.8 116 244 328 376 410 430 438 443 445 446 446 446 446 446
105 Existing Pine high 0 7.5 170 309 387 436 457 461 461 461 461 461 461 461 461 461
106 Existing Pine very high 0 10 185 325 408 449 464 465 465 465 465 465 465 465 465 465
107 Existing Spruce marginal 0 0 0 1.2 31 101 180 244 308 352 378 398 413 419 419 419
108 Existing Spruce very low 0 0 0 32 139 235 326 382 416 437 452 461 468 470 470 470
109 Existing Spruce low 0 0 9 137 275 380 431 464 482 487 487 485 484 482 482 482
110 Existing Spruce medium 0 0 17 167 317 408 454 481 494 493 490 492 492 492 492 492
111 Existing Spruce high 0 0.1 69 259 397 459 491 492 492 492 492 492 492 492 492 492
112 Existing Spruce very high 0 0 103 323 442 477 477 478 478 478 478 478 478 478 478 478
113 Existing Mixed marginal 0 0 4.8 47 129 204 266 314 342 359 371 381 389 391 391 391
114 Existing Mixed very low 0 0 33 160 274 360 406 438 460 475 480 484 487 486 486 486
115 Existing Mixed low 0 0.4 55 199 314 388 431 459 473 477 479 483 483 483 483 483
116 Existing Mixed medium 0 0.9 94 260 380 453 499 500 500 500 500 500 500 500 500 500
117 Existing Mixed high 0 1.2 110 280 396 459 482 482 482 482 482 482 482 482 482 482
118 Existing Mixed very high 0 2.9 140 327 441 479 481 481 481 481 481 481 481 481 481 481
201 Future_submarginal 0 0 9 33 54 69 79 84 88 91 93 93 93 93 93 93
202 Future_marginal 0 0 18 66 107 136 154 165 170 174 177 177 177 177 177 177
203 Future_very low 0 0 21 89 157 211 246 266 279 287 294 296 295 295 294 293
204 Future_low_late 0 0 34 126 209 271 312 336 353 364 372 378 377 377 376 376
205 Future_low_early 0 0 13 95 202 290 345 378 401 418 429 433 434 434 433 432
206 Future_medium_late 0 0 4 88 212 321 381 418 442 456 466 465 464 462 460 458
207 Future_medium_mid 0 0 28 142 253 331 381 417 442 455 466 473 476 477 477 476
208 Future_medium_early 0 0 48 195 318 390 430 456 469 471 472 472 471 470 470 470
209 Future_high 0 0 22 144 265 353 424 475 515 545 569 587 603 607 608 608
210 Future_very high 0 0 17 164 307 415 507 574 631 679 719 747 780 786 786 786

Canadian Forest Products Ltd. TFL 18 MP #10 Information Package
Forest Ecosystem Solutions Ltd. #210 – 275 Fell Avenue, North Vancouver BC, Canada V7P 3R5 tel 604-998-2222 fax 604-986-0361
67
Appendix F: % denudation and VEG for individual
visual polygons
Poly_ID
Crown Forested Area (ha) VAC
VQC/ VQO
% Denudation
Area (ha) by slope class (%) and associated VEG
height (m)1 Visually
Effective GreenUp Height, VEG (m)
0-10%
11-
20%
21-
30%
31-
40%
41-
50%
51-
60% >61%
3m 4m 5m 6m 7m 8m 8.5m
101 21 M PR 10.0% 8 27 36 28 2 0 0 4.7
122 8 M M 20.0% 19 6 2 0 0 0 0 3.3
123 12 M R 3.0% 29 7 0 0 0 0 0 3.1
124 5 M R 3.0% 14 0 0 0 0 0 0 3.0
17 250 L M 15.1% 58 397 331 201 82 86 75 4.9
21 180 M M 20.0% 36 513 192 9 0 0 0 4.2
22 144 M M 20.0% 5 135 166 153 208 152 10 5.8
23 7 M M 20.0% 1 9 18 3 0 0 0 4.7
25 137 H M 25.0% 0 44 380 207 100 12 0 5.4
26 81 M PR 10.0% 83 123 90 24 7 0 0 4.0
27 51 L PR 5.1% 89 64 23 1 0 0 0 3.5
28 886 L PR 5.1% 88 688 1165 1505 1131 236 87 5.5
30 100 M M 20.0% 16 181 110 118 44 8 0 4.8
31 14 L PR 5.1% 40 2 0 0 0 0 0 3.0
32 66 M M 20.0% 7 94 109 93 20 0 0 4.9
33 8 L R 1.1% 7 20 2 0 0 0 0 3.8
34 53 L PR 5.1% 13 152 53 0 0 0 0 4.1
34A 9 L PR 5.1% 13 21 0 0 0 0 0 3.6
35 16 L PR 5.1% 34 17 0 0 0 0 0 3.3
36 96 M M 20.0% 11 55 109 196 109 58 6 5.7
37 64 H M 25.0% 13 115 100 50 17 3 0 4.6
38 11 M PR 10.0% 21 15 0 0 0 0 0 3.3
39 23 H P 1.0% 48 29 1 0 0 0 0 3.3
42 823 M PR 10.0% 110 484 1300 1864 507 167 8 5.4
43' 22 L PR 5.1% 63 3 0 0 0 0 0 3.0
44 69 L P 0.0% 205 4 0 0 0 0 0 3.0
44A 20 L PR 5.1% 51 10 0 0 0 0 0 3.1
45 532 M PR 10.0% 54 1051 786 532 38 2 0 4.6
46 8 M M 20.0% 2 27 3 0 0 0 0 4.0
47 31 L PR 5.1% 50 34 4 13 13 8 0 3.9
48 65 H M 25.0% 20 165 81 4 5 0 0 4.2
55 10 L PR 5.1% 22 9 0 0 0 0 0 3.2
56 26 M PR 10.0% 5 94 5 0 0 0 0 4.0
67 217 M M 20.0% 44 455 325 109 35 0 0 4.5
68 175 L PR 5.1% 13 50 115 349 266 246 76 6.4
69 19 L R 1.1% 22 39 9 1 0 0 0 3.7
71 16 M PR 10.0% 0 60 5 0 0 0 0 4.1
72 8 M PR 10.0% 0 6 13 9 17 1 0 5.7
73 47 L PR 5.1% 110 33 10 0 0 0 0 3.3

Canadian Forest Products Ltd. TFL 18 MP #10 Information Package
Forest Ecosystem Solutions Ltd. #210 – 275 Fell Avenue, North Vancouver BC, Canada V7P 3R5 tel 604-998-2222 fax 604-986-0361
68
Poly_ID
Crown Forested Area (ha) VAC
VQC/ VQO
% Denudation
Area (ha) by slope class (%) and associated VEG
height (m)1 Visually
Effective GreenUp Height, VEG (m)
0-10%
11-
20%
21-
30%
31-
40%
41-
50%
51-
60% >61%
3m 4m 5m 6m 7m 8m 8.5m
74 33 M PR 10.0% 10 64 68 0 0 0 0 4.3
75 94 H M 25.0% 36 167 124 76 22 0 0 4.5
76 268 M PR 10.0% 120 342 502 180 75 7 0 4.6
77 264 L PR 5.1% 29 343 487 277 76 85 27 5.0
78 55 L R 1.1% 132 38 7 3 0 0 0 3.2
79 42 L R 1.1% 47 96 13 0 0 0 0 3.7
8 102 M M 20.0% 25 208 183 28 5 0 0 4.4
80 5 M M 20.0% 15 1 0 0 0 0 0 3.0
81 15 M M 20.0% 0 4 44 22 8 0 0 5.3
83 24 L PR 5.1% 27 19 40 11 0 0 0 4.1
84 3 M M 20.0% 0 2 7 1 3 0 0 5.3
VLI-033 8 M R 3.0% 1 24 10 0 0 0 0 4.2
VLI-034 38 M R 3.0% 19 71 64 7 0 0 0 4.2
VLI-036 26 H PR 15.0% 14 56 23 9 8 0 0 4.2
VLI-037 56 M R 3.0% 63 122 20 2 0 0 0 3.7
VLI-038 111 L R 1.1% 11 183 248 73 3 0 0 4.6
VLI-039 173 H PR 15.0% 0 57 204 487 176 82 11 5.9
VLI-040 66 H P 1.0% 13 102 136 53 1 0 0 4.6
VLI-041 13 M PR 10.0% 5 26 1 18 10 0 0 4.7
VLI-042 109 M PR 10.0% 10 48 198 228 78 18 23 5.5
VLI-043 530 M PR 10.0% 59 772 1137 445 98 15 0 4.8
VLI-044 271 H R 5.0% 43 246 377 471 152 90 72 5.4
VLI-046 289 H PR 15.0% 13 281 345 510 297 76 75 5.5
VLI-047 820 M PR 10.0% 98 875 1989 817 179 65 7 4.9
VLI-065 34 M R 3.0% 0 13 142 12 0 0 0 5.0
VLI-066 290 M PR 10.0% 19 506 716 82 1 0 0 4.6
VLI-085 548 M PR 10.0% 111 587 1187 527 190 92 4 4.9
VLI-086 186 H PR 15.0% 52 263 302 177 59 33 0 4.8
VLI-088 772 M PR 10.0% 144 1107 1133 741 440 200 80 5.0
VLI-089 89 M PR 10.0% 43 139 118 48 43 4 14 4.6

Canadian Forest Products Ltd. TFL 18 MP #10 Information Package
Forest Ecosystem Solutions Ltd. #210 – 275 Fell Avenue, North Vancouver BC, Canada V7P 3R5 tel 604-998-2222 fax 604-986-0361
69
Appendix G: % denudation and VEG for LMZs
LMZ ID
CFLB Area (ha) VAC
VQC/ VQO
% Denudation
Area (ha) by slope class (%) and associated
VEG height (m)1
Visually Effective Greenup Height, VEG (m)
0-
10%
11-
20%
21-
30%
31-
40%
41-
50%
51-
60% >61%
3m 4m 5m 6m 7m 8m 8.5m
164 53 M PR 10.0% 67 61 50 34 0 0 0 4.0
170 38 M PR 10.0% 65 59 12 0 0 0 0 3.5
175 198 M R 3.0% 389 258 24 11 0 0 0 3.4
183 39 M PR 10.0% 85 33 10 0 0 0 0 3.3
186 31 M M 20.0% 91 2 0 0 0 0 0 3.0
201 3 M XX 0.0% 10 1 0 0 0 0 0 3.0
214 27 M R 3.0% 81 2 0 0 0 0 0 3.0
219 92 M PR 10.0% 187 69 75 9 9 0 0 3.6
226 103 M R 3.0% 145 199 27 1 0 0 0 3.6
242 56 M R 3.0% 76 111 14 1 0 0 0 3.6
250 4 M XX 0.0% 7 10 1 0 0 0 0 3.5
269 61 M PR 10.0% 95 107 28 0 0 0 0 3.6
286 29 M PR 10.0% 67 32 0 0 0 0 0 3.3
290 28 M R 3.0% 73 19 0 0 0 0 0 3.2
336 2 M PR 10.0% 4 2 0 0 0 0 0 3.3
337 19 M PR 10.0% 42 23 0 0 0 0 0 3.3
340 1 M R 3.0% 2 0 0 0 0 0 0 3.0
344 27 M M 20.0% 21 48 38 6 0 0 0 4.1
360 62 M R 3.0% 169 42 1 0 0 0 0 3.2
371 25 M XX 0.0% 39 48 13 3 0 1 0 3.7
401 56 M PR 10.0% 72 116 21 0 0 0 0 3.7
406 1 M PR 10.0% 0 3 1 0 0 0 0 4.2
407 9 M PR 10.0% 0 33 4 0 0 0 0 4.1
410 29 M M 20.0% 66 22 7 2 0 0 0 3.3
416 1 M PR 10.0% 0 1 5 0 0 0 0 4.9
417 9 M PR 10.0% 2 18 22 0 0 0 0 4.4
419 23 M M 20.0% 18 60 13 0 0 0 0 3.9
428 46 M PR 10.0% 109 38 0 0 0 0 0 3.2
451 44 M PR 10.0% 29 67 88 6 0 0 0 4.2
556 30 M PR 10.0% 41 61 4 0 0 0 0 3.6
564 188 M PR 10.0% 327 269 101 3 0 0 0 3.6
592 22 M M 20.0% 65 0 0 0 0 0 0 3.0
593 49 M PR 10.0% 73 89 18 0 0 0 0 3.6
596 5 M XX 0.0% 13 4 0 0 0 0 0 3.2
607 22 M PR 10.0% 57 15 0 0 0 0 0 3.2
618 33 M PR 10.0% 54 40 33 0 0 0 0 3.7
626 25 M M 20.0% 28 49 25 0 0 0 0 3.8
627 3 M XX 0.0% 4 6 1 0 0 0 0 3.6
630 26 M PR 10.0% 50 30 15 0 0 0 0 3.5
633 45 M R 3.0% 114 36 2 0 0 0 0 3.2
637 17 M PR 10.0% 19 45 1 2 0 0 0 3.7

Canadian Forest Products Ltd. TFL 18 MP #10 Information Package
Forest Ecosystem Solutions Ltd. #210 – 275 Fell Avenue, North Vancouver BC, Canada V7P 3R5 tel 604-998-2222 fax 604-986-0361
70
LMZ ID
CFLB Area (ha) VAC
VQC/ VQO
% Denudation
Area (ha) by slope class (%) and associated
VEG height (m)1
Visually Effective Greenup Height, VEG (m)
0-
10%
11-
20%
21-
30%
31-
40%
41-
50%
51-
60% >61%
3m 4m 5m 6m 7m 8m 8.5m
638 22 M XX 0.0% 43 29 8 1 0 0 0 3.5
639 67 M PR 10.0% 66 141 49 5 2 0 0 3.9
647 59 M PR 10.0% 72 94 6 29 32 12 0 4.1
648 20 M M 20.0% 35 22 19 0 0 0 0 3.6
650 7 M XX 0.0% 18 6 0 0 0 0 0 3.2
669 39 M PR 10.0% 93 29 6 0 0 0 0 3.2
678 16 M PR 10.0% 30 26 0 0 0 0 0 3.4
684 27 M R 3.0% 50 43 0 0 0 0 0 3.4
685 22 M R 3.0% 60 10 1 0 0 0 0 3.1
688 182 M P 0.5% 499 55 15 0 0 0 0 3.1
696 34 M PR 10.0% 105 1 0 0 0 0 0 3.0
736 4 M XX 0.0% 11 0 0 0 0 0 0 3.0
745 19 M R 3.0% 41 25 0 0 0 0 0 3.3
753 21 M M 20.0% 45 22 5 0 0 0 0 3.4
764 100 M PR 10.0% 268 57 0 0 0 0 0 3.1
800 67 M PR 10.0% 153 76 0 0 0 0 0 3.3
801 51 M PR 10.0% 87 50 38 22 0 0 0 3.7
811 4 M XX 0.0% 6 5 2 0 0 0 0 3.6
826 29 M R 3.0% 40 64 2 0 0 0 0 3.6
831 148 M PR 10.0% 289 185 77 1 0 0 0 3.5
838 34 M PR 10.0% 13 52 63 24 6 3 0 4.6
841 32 M R 3.0% 32 87 0 0 0 0 0 3.7
857 73 M P 0.5% 202 27 1 0 0 0 0 3.1
867 26 M PR 10.0% 60 28 0 0 0 0 0 3.3
869 42 M PR 10.0% 117 21 0 0 0 0 0 3.1
880 4 M XX 0.0% 11 0 0 0 0 0 0 3.0
892 39 M PR 10.0% 119 0 0 0 0 0 0 3.0
897 4 M XX 0.0% 9 3 0 0 0 0 0 3.2
902 54 M PR 10.0% 104 86 4 0 0 0 0 3.4
909 1 M XX 0.0% 2 3 0 0 0 0 0 3.5
914 4 M XX 0.0% 11 0 0 0 0 0 0 3.0
935 56 M M 20.0% 131 57 2 0 0 0 0 3.3
950 25 M M 20.0% 77 3 0 0 0 0 0 3.0
967 49 M R 3.0% 54 110 21 2 0 0 0 3.7
991 39 M R 3.0% 68 57 9 0 0 0 0 3.5
1005 32 M R 3.0% 12 55 64 9 0 0 0 4.4
1018 53 M P 0.5% 10 66 127 51 0 0 0 4.7
1140 44 M M 20.0% 77 57 19 4 0 0 0 3.5


