
Appendix A: Accepted Timber Supply Analysis · TFL 44 – MP#5 Timber Supply Analysis Page i...
58
Appendix A: Accepted Timber Supply Analysis TFL 44 Management Plan #5
Transcript of Appendix A: Accepted Timber Supply Analysis · TFL 44 – MP#5 Timber Supply Analysis Page i...

Appendix A: Accepted Timber Supply Analysis
TFL 44 Management Plan #5


TFL 44 – MP#5 Timber Supply Analysis Page i
Executive Summary
This analysis examines timber supply projections for Tree Farm Licence 44 located on west-central Vancouver Island.
Woodstock, a pseudo-spatial harvest model, was used to model current management practices for protection and maintenance of ecological values and to estimate the residual timber potential through the year 2257.
After allowances for non-recoverable losses, the modelling of current management practice as set out in the associated Information Package suggests an AAC of 800,000 m3/year (a 4.5% reduction). This represents a reasonable harvest level that accommodates ecological and social concerns in the short and longer terms. The modelling suggests that a minimum of 26,400 ha (23%) of productive forest area will be maintained in old forests (>250 yrs) and a minimum 26,000,000 m3 of growing stock will be maintained on the timber harvesting landbase throughout the 250-year planning horizon. These forests are expected to contribute significantly to biodiversity conservation and complement protected areas within and adjacent to the Tree Farm Licence.

TFL 44 – MP#5 Timber Supply Analysis Page ii
This page intentionally left blank.
TFL 44 – MP#5 Timber Supply Analysis Page iii
TABLE OF CONTENTS EXECUTIVE SUMMARY...................................................................................................................................... I
1.0 INTRODUCTION ........................................................................................................................................1 1.1 BACKGROUND ......................................................................................................................................1 1.2 OBJECTIVE...........................................................................................................................................1 1.3 TIMBER SUPPLY MODEL........................................................................................................................2
2.0 CURRENT MANAGEMENT OR BASE CASE...........................................................................................4 2.1 WESTERN RED CEDAR AND YELLOW CEDAR PROJECTIONS..................................................................11
3.0 ALTERNATE HARVEST FLOWS............................................................................................................13 3.1 MAINTAIN CURRENT AAC FOR 20 YEARS .............................................................................................13 3.2 NON-DECLINING EVEN FLOW................................................................................................................14
4.0 SENSITIVITY ANALYSES .......................................................................................................................15 4.1 ADD MAA-NULTH TREATY RELATED LANDS...........................................................................................16 4.2 EXCLUDE IDENTIFIED FIRST NATIONS’ AREAS.......................................................................................18 4.3 MATURE STANDS YIELDS UNDERESTIMATED BY 10%.............................................................................20 4.4 MATURE STANDS YIELDS OVERESTIMATED BY 10%...............................................................................21 4.5 IMMATURE STANDS YIELDS UNDERESTIMATED BY 10%..........................................................................22 4.6 IMMATURE STANDS YIELDS OVERESTIMATED BY 10%............................................................................23 4.7 USE SIBEC SITE INDEX ESTIMATES.....................................................................................................25 4.8 REMOVE BENEFITS OF GENETIC GAIN ...................................................................................................27 4.9 REMOVE IMPACTS OF WESTERN FOREST STRATEGY ............................................................................28 4.10 EXCLUDE MARGINALLY ECONOMIC STANDS...........................................................................................30 4.11 EXCLUDE APPROXIMATELY ONE-HALF OF MATURE HELI THLB ...............................................................31 4.12 REMOVE ANNUAL HELI HARVEST CONSTRAINT.......................................................................................32 4.13 REDUCE THE PERCENT DISTURBED WITHIN EACH VQO POLYGON ..........................................................33 4.14 EXCLUDE STANDS CONTAINING “RED-LISTED” SITE SERIES ....................................................................35 4.15 REMOVE “STEEP” TERRAIN CONSTRAINTS.............................................................................................36 4.16 INCREASE MINIMUM HARVEST AGES BY 10 YEARS .................................................................................37 4.17 INCLUDE TWO YEARS OF CURRENT AAC ..............................................................................................38 4.18 SUMMARY OF SENSITIVITY IMPACTS .....................................................................................................39
5.0 BASE CASE EVOLUTION.......................................................................................................................40 5.1 ORIGINAL INFORMATION PACKAGE BASE CASE ....................................................................................40 5.2 REMOVE 2 YEARS OF CURRENT AAC FROM INITIAL HARVEST LEVEL.......................................................41 5.3 REVISED GROWING STOCK CONSTRAINT...............................................................................................42 5.4 FINAL BASE CASE...............................................................................................................................43
6.0 ANALYSIS SUMMARY AND PROPOSED AAC.....................................................................................44

TFL 44 – MP#5 Timber Supply Analysis Page iv
List of Tables TABLE 1 - BASE CASE HARVEST LEVELS ...............................................................................................5 TABLE 2 - HARVEST LEVELS WITH MAINTAINING CURRENT AAC FOR 20 YEARS......................................13 TABLE 3 – HARVEST LEVELS WITH NON-DECLINING EVEN FLOW ............................................................14 TABLE 4 – CURRENT MANAGEMENT SENSITIVITY ANALYSES ................................................................15 TABLE 5 – MAA-NULTH LANDS WITHIN TFL 44 .....................................................................................16 TABLE 6 – HARVEST LEVELS WITH MAA-NULTH TREATY RELATED LANDS ADDED ...................................17 TABLE 7 – HARVEST LEVELS WITH FIRST NATIONS’ AREAS REMOVED....................................................18 TABLE 8 – HARVEST LEVELS WITH INCREASED MATURE STANDS YIELDS................................................20 TABLE 9 – HARVEST LEVELS WITH REDUCED MATURE STANDS YIELDS ..................................................21 TABLE 10 – HARVEST LEVELS WITH INCREASED IMMATURE STANDS YIELDS...........................................22 TABLE 11 – HARVEST LEVELS WITH REDUCED IMMATURE STANDS YIELDS .............................................23 TABLE 12 – AVERAGE SITE INDEX ESTIMATES BY SPECIES ....................................................................25 TABLE 13 – HARVEST LEVELS WITH YIELDS BASED ON SIBEC VALUES..................................................25 TABLE 14 – HARVEST LEVELS WITH NO GENETIC GAIN ..........................................................................27 TABLE 15 – HARVEST LEVELS WITH NO FOREST STRATEGY IMPACTS.....................................................28 TABLE 16 – HARVEST LEVELS WITH MARGINALLY ECONOMIC STANDS EXCLUDED...................................30 TABLE 17 – HARVEST LEVELS WITH APPROXIMATELY ONE-HALF OF MATURE HELI THLB EXCLUDED .......31 TABLE 18 - HARVEST LEVELS WITH NO HELI CONSTRAINT .....................................................................32 TABLE 19 – MAXIMUM DISTURBANCE BY VQO CLASS ...........................................................................33 TABLE 20 - HARVEST LEVELS WITH MORE RESTRICTIVE VISUAL QUALITY MANAGEMENT .........................33 TABLE 21 - HARVEST LEVELS WITH RED-LISTED SITE SERIES EXCLUDED................................................35 TABLE 22 - HARVEST LEVELS WITHOUT “STEEP” TERRAIN CONSTRAINTS ...............................................36 TABLE 23 - HARVEST LEVELS WITH OLDER MINIMUM HARVEST AGES .....................................................37 TABLE 24 - HARVEST LEVELS WITH INCLUSION OF 2 YEARS OF CURRENT AAC ......................................38 TABLE 25 – SUMMARY OF SENSITIVITY ANALYSES HARVEST IMPACTS....................................................39 TABLE 26 – BASE CASE HARVEST LEVELS WITH ACCEPTED IP ASSUMPTIONS........................................40 TABLE 27 – BASE CASE HARVEST LEVELS WITHOUT INCLUSION OF 2 YEARS OF CURRENT AAC .............41 TABLE 28 – BASE CASE HARVEST LEVELS WITH REVISED GROWING STOCK CONSTRAINT .......................42 TABLE 29 –BASE CASE OPTIONS REVIEWED ........................................................................................43

TFL 44 – MP#5 Timber Supply Analysis Page v
List of Figures FIGURE 1 - TFL 44 ...............................................................................................................................3 FIGURE 2 - BASE CASE HARVEST SCHEDULE 2008-2257.......................................................................6 FIGURE 3 – STAND TYPES’ CONTRIBUTION TO BASE CASE HARVEST.......................................................7 FIGURE 4 - AGE CLASS DISTRIBUTION OF PRODUCTIVE FOREST AREA .....................................................8 FIGURE 5 - AGE CLASS DISTRIBUTION OF TIMBER HARVESTING LAND BASE ..............................................8 FIGURE 6 -THLB GROWING STOCK .......................................................................................................9 FIGURE 7 - HARVEST STATISTICS 2008 – 2257....................................................................................10 FIGURE 8 - VOLUME CONTRIBUTION FROM STANDS LESS THAN 60 YEARS OLD......................................11 FIGURE 9 – BASE CASE CEDAR VOLUME ESTIMATES OVER TIME ...........................................................12 FIGURE 10 – HARVEST LEVELS WITH MAINTAINING CURRENT AAC FOR 20 YEARS .................................13 FIGURE 11 – HARVEST LEVELS WITH NON-DECLINING EVEN FLOW.........................................................14 FIGURE 12 – HARVEST LEVELS WITH MAA-NULTH TREATY RELATED LANDS ADDED ...............................17 FIGURE 13 - HARVEST LEVELS WITH FIRST NATIONS’ AREAS REMOVED.................................................19 FIGURE 14 – HARVEST LEVELS WITH INCREASED MATURE STANDS YIELDS ............................................20 FIGURE 15 – HARVEST LEVELS WITH REDUCED MATURE STANDS YIELDS...............................................21 FIGURE 16 – HARVEST LEVELS WITH INCREASED IMMATURE STANDS YIELDS.........................................22 FIGURE 17 – HARVEST LEVELS WITH REDUCED IMMATURE STANDS YIELDS ...........................................23 FIGURE 18 – HARVEST LEVELS WITH YIELDS BASED ON SIBEC VALUES................................................26 FIGURE 19 – HARVEST LEVELS WITH NO GENETIC GAIN ........................................................................27 FIGURE 20 – HARVEST LEVELS WITH NO FOREST STRATEGY IMPACTS...................................................29 FIGURE 21 – HARVEST LEVELS WITH MARGINALLY ECONOMIC STANDS EXCLUDED.................................30 FIGURE 22 - HARVEST LEVELS WITH NO HELI CONSTRAINT....................................................................32 FIGURE 23 - HARVEST LEVELS WITH MORE RESTRICTIVE VISUAL QUALITY MANAGEMENT........................34 FIGURE 24 – HARVEST LEVELS WITH RED-LISTED SITE SERIES EXCLUDED.............................................35 FIGURE 25 – HARVEST LEVELS WITHOUT “STEEP” TERRAIN CONSTRAINTS.............................................36 FIGURE 26 – HARVEST LEVELS WITH OLDER MINIMUM HARVEST AGES...................................................37 FIGURE 27 – HARVEST LEVELS WITH INCLUSION OF 2 YEARS OF CURRENT AAC....................................38 FIGURE 28 - ACCEPTED INFORMATION PACKAGE BASE CASE SCHEDULE..............................................40 FIGURE 29 – BASE CASE SCHEDULE WITH 2 YEARS OF CURRENT AAC EXCLUDED ................................41 FIGURE 30 – BASE CASE SCHEDULE WITH REVISED GROWING STOCK CONSTRAINT ...............................42 FIGURE 31 - BASE CASE OPTIONS REVIEWED......................................................................................43

TFL 44 – MP#5 Timber Supply Analysis Page vi
Acknowledgements The signatory greatly appreciates the following for their contributions to the preparation of this document:
• Mike Fowler handled data preparation and yield table queries;
• Peter Kofoed provided valuable guidance and review comments.

TFL 44 – MP#5 Timber Supply Analysis Page 1
1.0 Introduction
1.1 Background
Tree Farm Licence (TFL) 44 is located on the west coast of central Vancouver Island in the
vicinity of the Alberni Inlet and Barkley Sound and is managed by Western Forest Products Inc.
(WFP). This analysis does not include areas recently removed from TFL 44 to create a
Community Forest for the City of Port Alberni (with an AAC of 18,682 m3); nor does it include
areas identified in the Maa-Nulth First Nations’ treaty settlement agreement; and it does not
include the areas that will eventually be removed from TFL 44 to create operating areas for BC
Timber Sales (BCTS) and the Huu-ay-aht First Nations – see Figure 1. All references to TFL 44
in this document refer to the portion of TFL 44 managed by WFP on an on-going basis (i.e.
excludes the BCTS, Huu-ay-aht and Maa-Nulth areas). The TFL encompasses 139,446 ha of
which 79,089 ha is estimated to be available for long term timber production. The allowable
annual cut (AAC) for this landbase is currently set at 942,268 m3 per year.
Note that the area deleted from TFL 44 on May 17, 2010 for Huu-ay-aht Community Forest #1
differs slightly from that indicated in Figure 1 – minor boundary adjustments were made such that
75 hectares less area was deleted, with an estimated 62 hectares of current THLB. This
difference in THLB area (to that used in the analysis) is too small to affect the results of the
analysis in any significant way. Figure 1 in the MP document indicates the actual area deleted for
this Community Forest.
1.2 Objective
The primary objective of this report is to estimate reasonably achievable timber flows for
consideration by the Provincial Deputy Chief Forester in making the determination of the
Allowable Annual Cut for the term of Management Plan #5. More specifically:
1. The management of non-timber values such as fish and wildlife habitat, biodiversity, visual quality, and terrain stability is accounted for. Protection of non-timber values will be satisfied by land base removals, rate-of-harvest constraints and/or by maintaining a percentage of the landbase in older stands.
2. Timber flow is estimated by considering harvestable inventory, growth potential of present and future stands, silvicultural treatments, potential timber losses, operational and legislative constraints.
3. Impacts of declining timber flow on community stability and employment are to be lessened by keeping rates of decline per decade as low as possible without inducing undue impacts on other values or long-term timber sustainability.

TFL 44 – MP#5 Timber Supply Analysis Page 2
1.3 Timber Supply Model
Timber supply optimizations were completed with Woodstock software developed by Remsoft. Woodstock is a pseudo-spatial supply model and is described in more detail in the associated Information Package (IP) from September 2009.
The inventory database was current to January 1, 2008 for harvesting depletion and silviculture treatments and assessments. The model was constructed using 50 5-year periods for a total optimization horizon of 250 years.
Analysis units (grouping of forest stands) and associated timber volume yield curve parameters are described in more detail in the associated IP.

TFL 44 – MP#5 Timber Supply Analysis Page 3
Figure 1 - TFL 44

TFL 44 – MP#5 Timber Supply Analysis Page 4
2.0 Current Management or Base Case
The Base Case (or Current Management option) includes the following assumptions and modelling parameters that are described in more detail in the associated IP (September 2009):
• The operable landbase of forested area accessible using conventional and non-conventional (helicopter) harvesting methods with restricted performance in the non-conventional landbase.
• Exclusion of uneconomic forest stands.
• Harvesting of both mature and immature stands.
• Silviculture to meet free growing requirements is carried out on all regenerated stands. Known tree improvement gains are applied to existing stands ≤ 10 years old and future regenerated stands.
• Visual quality objectives (VQOs) are modelled based on the VQOs established and made effective for the South Island Forest District on December 15, 2005 with upper range disturbance assumed.
• Green-up heights for cutblock adjacency are assigned based on Resource Management Zones established in the Vancouver Island Higher Level Plan. Special and General zones have a 3m green-up requirement while Enhanced zones have a 1.3m green-up height.
• Future Wildlife Tree and other stand-level retention within the THLB are accounted for by a percentage area reduction.
• Biodiversity and Landscape Units – Established Old Growth Management Areas (OGMAs) in Nitinat, Caycuse and Walbran landscape units are removed from the THLB. Also removed are draft OGMAs in Klanawa, Sarita, Corrigan (including small portions of China and Somass LUs), Great Central (including portion of Ash LU) and Henderson landscape units. For the Effingham landscape unit, old seral stage targets are applied to each biogeoclimatic variant based on the Order Establishing Provincial Non-Spatial Old Growth Objectives effective June 30, 2004 (NSOG). Mature seral targets are incorporated for the four Special Management Zones within TFL 44.
• Established Ungulate Winter Ranges (UWRs) and Wildlife Habitat Areas (WHAs) are removed from the THLB.
• Varying netdowns for terrain stability management depending on mapping type and relative climatic environment and applying a harvest limit on “steep” terrain within the high “relative landslide frequency” zone.
• Riparian management based on the FSP results/strategies and the targets within the Sustainable Forest Management Plan (SFMP) developed for Canadian Standards Association (CSA) certification standard CAN/CSA-Z809-2002.
• Minimum harvest age varies by site productivity and the minimum harvestable volume is 350m3 per hectare. Both minimum age and minimum volume requirements must be met before a stand can be harvested.

TFL 44 – MP#5 Timber Supply Analysis Page 5
• Restriction on volume sourced from heli operable stands and requirement to harvest second growth beginning in the first 5-year period.
• The accepted IP proposed that the initial harvest level be set at 869,700 m3. This was based on the first period of the analysis (2008 – 2012) including 2 years at the current AAC (after making an allowance for the contribution of the Maa-Nulth lands) and three years at the new AAC (see section 10.3.2 of the IP for more details). To simplify the process and to make the change in harvest levels more evident in this document, it was decided to not include 2 years at the current AAC within the initial harvest level. Instead an additional sensitivity was run to indicate the impact of including 2 years at the current AAC in the initial harvest level. (see section 4.17). Additionally, initial runs where the Maa-Nulth treaty lands are available for harvest indicated that those lands contribute approximately 105,000 m3/year to the current AAC (see section 4.1 for details). This is greater than the 55,000 m3/year referenced in the IP. The 55,000 m3 figure was estimated based on THLB inventory >60 years old under the MP #4 assumptions. The 105,000 m3 figure is based on modelled results under MP #5 assumptions. Therefore, the initial harvest level for the Base Case is set at 837,268 m3 (current AAC of 942,268 m3 less 105,000 m3 (apparent Maa-Nulth contribution)). Non-recoverable losses of 8,380 m3/year are added to this value.
• Woodstock is set up to maximize harvest volume over the entire 250-year analysis period subject to maintaining a stable conventionally operable growing stock on the THLB over the final 150 years. This is a change in constraint when compared to the accepted IP. Applying a constraint to achieve a stable long-term total THLB growing stock as per the IP results in a declining level of growing stock on the conventional portion of the THLB. This is due to the 50,000 m3/year heli harvest constraint causing inventory to accumulate on the heli THLB (i.e. heli THLB growth is greater than heli harvest). Therefore in order for the total THLB growing stock to be stable, the conventional growing stock must decline. This is not a sustainable situation.
The Base Case flow is presented in Table 1 and Figure 2. All harvest volume figures are net of non-recoverable losses of 8,380 m3/year.
Table 1 - Base Case Harvest Levels
Period Start Year
End Year
Annual Harvest
Volume (m3)
% Change from
Previous Period
1 2008 2012 837,268 0%1
2 - 50 2013 2257 806,600 -3.7%
1 The Period 1 harvest level is the same as the current AAC assuming that the Maa-Nulth lands contribute 105,000 m3 to the current AAC for the analysis landbase (942,268 m3). It is an 11% reduction from the current AAC of 942,268 m3.
TFL 44 – MP#5 Timber Supply Analysis Page 6
0
100,000
200,000
300,000
400,000
500,000600,000
700,000
800,000
900,000
1,000,000
1 (2008)
3 (2018)
5 (2028)
7 (2038)
9 (2048)
11 (2058)
13 (2068)
15 (2078)
17 (2088)
19 (2098)
21 (2108)
23 (2118)
25 (2128)
27 (2138)
29 (2148)
31 (2158)
33 (2168)
35 (2178)
37 (2188)
39 (2198)
41 (2208)
43 (2218)
45 (2228)
47 (2238)
49 (2248)
Period # (first year of period)
Ann
ual H
arve
st V
olum
e (m
3)
Total Conventional Heli
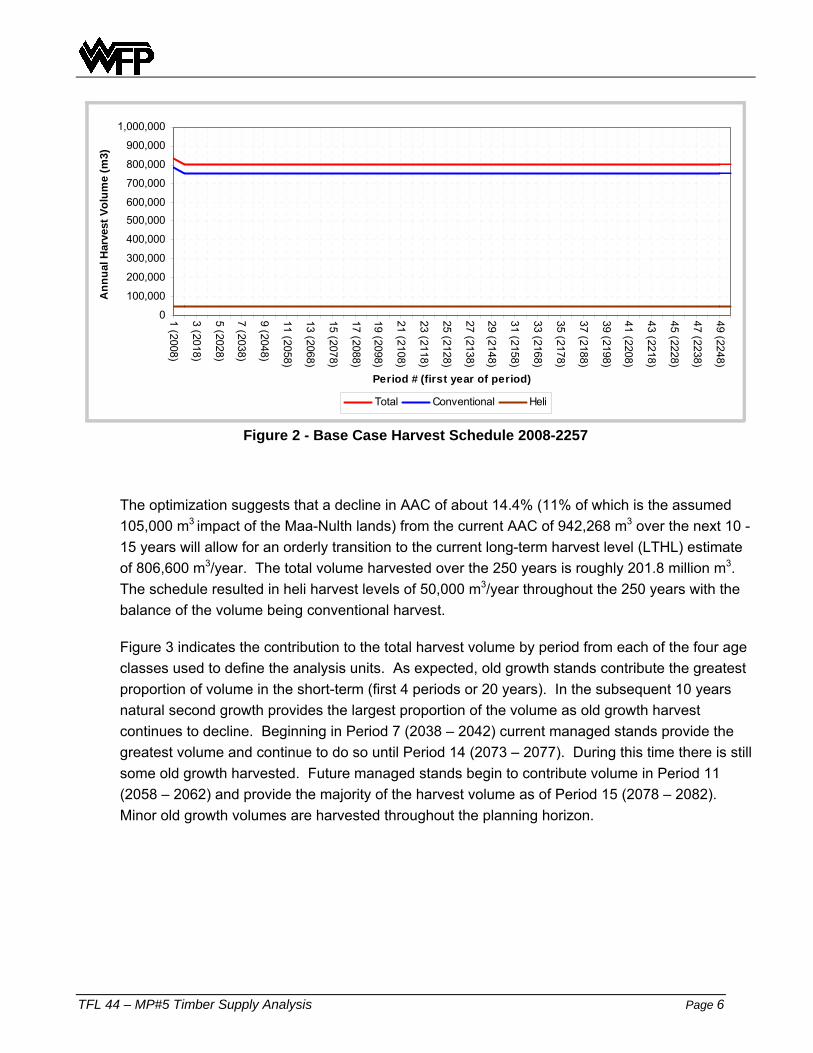
Figure 2 - Base Case Harvest Schedule 2008-2257
The optimization suggests that a decline in AAC of about 14.4% (11% of which is the assumed 105,000 m3 impact of the Maa-Nulth lands) from the current AAC of 942,268 m3 over the next 10 - 15 years will allow for an orderly transition to the current long-term harvest level (LTHL) estimate of 806,600 m3/year. The total volume harvested over the 250 years is roughly 201.8 million m3. The schedule resulted in heli harvest levels of 50,000 m3/year throughout the 250 years with the balance of the volume being conventional harvest.
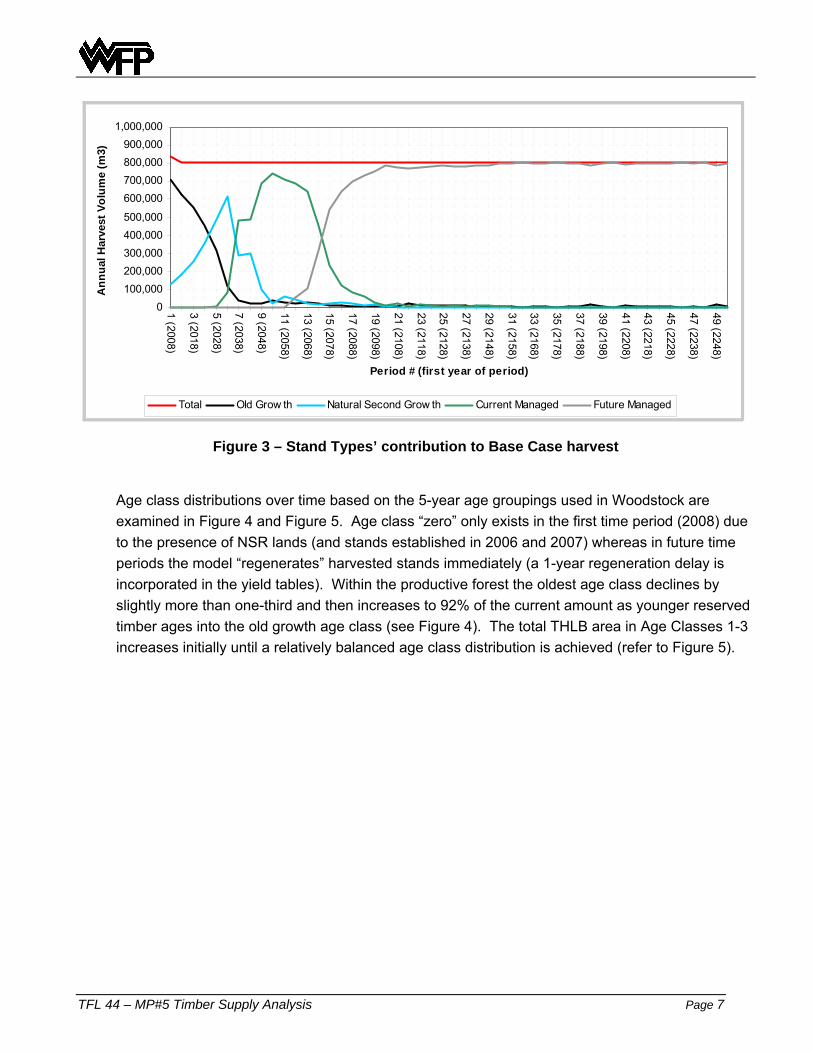
Figure 3 indicates the contribution to the total harvest volume by period from each of the four age classes used to define the analysis units. As expected, old growth stands contribute the greatest proportion of volume in the short-term (first 4 periods or 20 years). In the subsequent 10 years natural second growth provides the largest proportion of the volume as old growth harvest continues to decline. Beginning in Period 7 (2038 – 2042) current managed stands provide the greatest volume and continue to do so until Period 14 (2073 – 2077). During this time there is still some old growth harvested. Future managed stands begin to contribute volume in Period 11 (2058 – 2062) and provide the majority of the harvest volume as of Period 15 (2078 – 2082). Minor old growth volumes are harvested throughout the planning horizon.
TFL 44 – MP#5 Timber Supply Analysis Page 7
0100,000200,000300,000400,000500,000
600,000700,000800,000900,000
1,000,000
1 (2008)
3 (2018)
5 (2028)
7 (2038)
9 (2048)
11 (2058)
13 (2068)
15 (2078)
17 (2088)
19 (2098)
21 (2108)
23 (2118)
25 (2128)
27 (2138)
29 (2148)
31 (2158)
33 (2168)
35 (2178)
37 (2188)
39 (2198)
41 (2208)
43 (2218)
45 (2228)
47 (2238)
49 (2248)
Period # (first year of period)
Ann
ual H
arve
st V
olum
e (m
3)
Total Old Grow th Natural Second Grow th Current Managed Future Managed
Figure 3 – Stand Types’ contribution to Base Case harvest
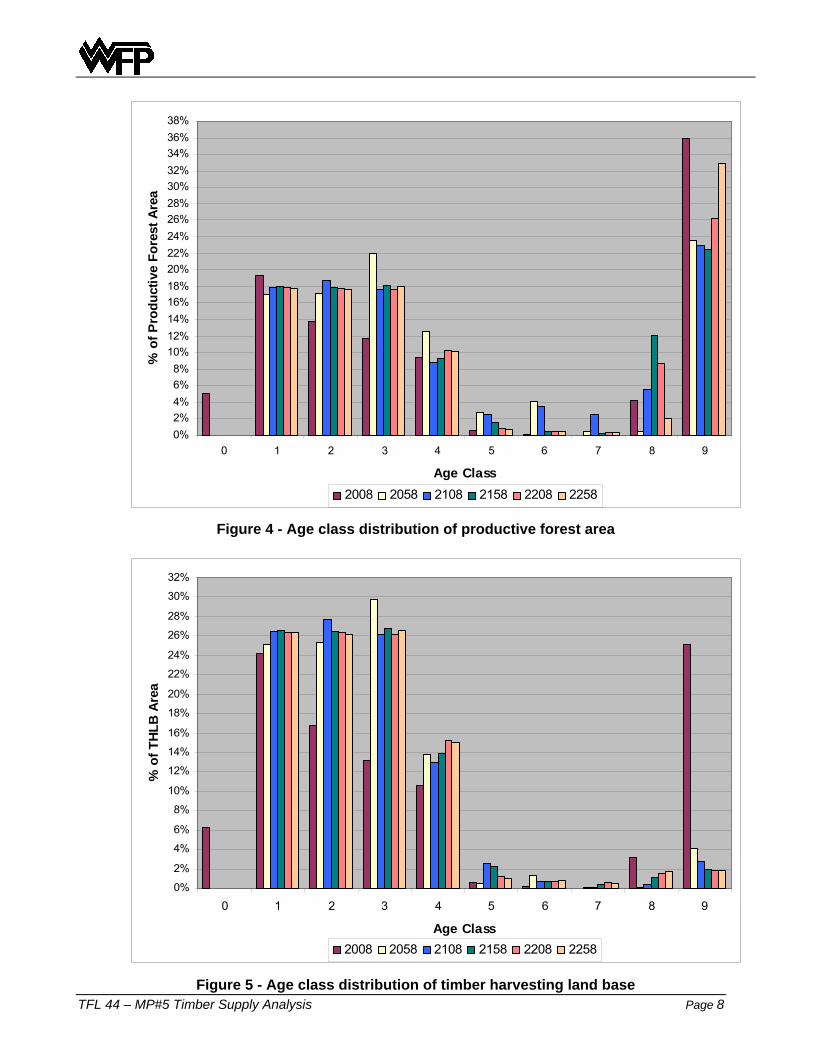
Age class distributions over time based on the 5-year age groupings used in Woodstock are examined in Figure 4 and Figure 5. Age class “zero” only exists in the first time period (2008) due to the presence of NSR lands (and stands established in 2006 and 2007) whereas in future time periods the model “regenerates” harvested stands immediately (a 1-year regeneration delay is incorporated in the yield tables). Within the productive forest the oldest age class declines by slightly more than one-third and then increases to 92% of the current amount as younger reserved timber ages into the old growth age class (see Figure 4). The total THLB area in Age Classes 1-3 increases initially until a relatively balanced age class distribution is achieved (refer to Figure 5).
TFL 44 – MP#5 Timber Supply Analysis Page 8
0%2%4%6%8%
10%12%14%16%18%20%22%24%26%28%30%32%34%36%38%
0 1 2 3 4 5 6 7 8 9
Age Class
% o
f Pro
duct
ive
Fore
st A
rea
2008 2058 2108 2158 2208 2258
Figure 4 - Age class distribution of productive forest area
0%
2%
4%
6%
8%
10%
12%
14%
16%
18%
20%
22%
24%
26%
28%
30%
32%
0 1 2 3 4 5 6 7 8 9
Age Class
% o
f TH
LB A
rea
2008 2058 2108 2158 2208 2258
Figure 5 - Age class distribution of timber harvesting land base
TFL 44 – MP#5 Timber Supply Analysis Page 9
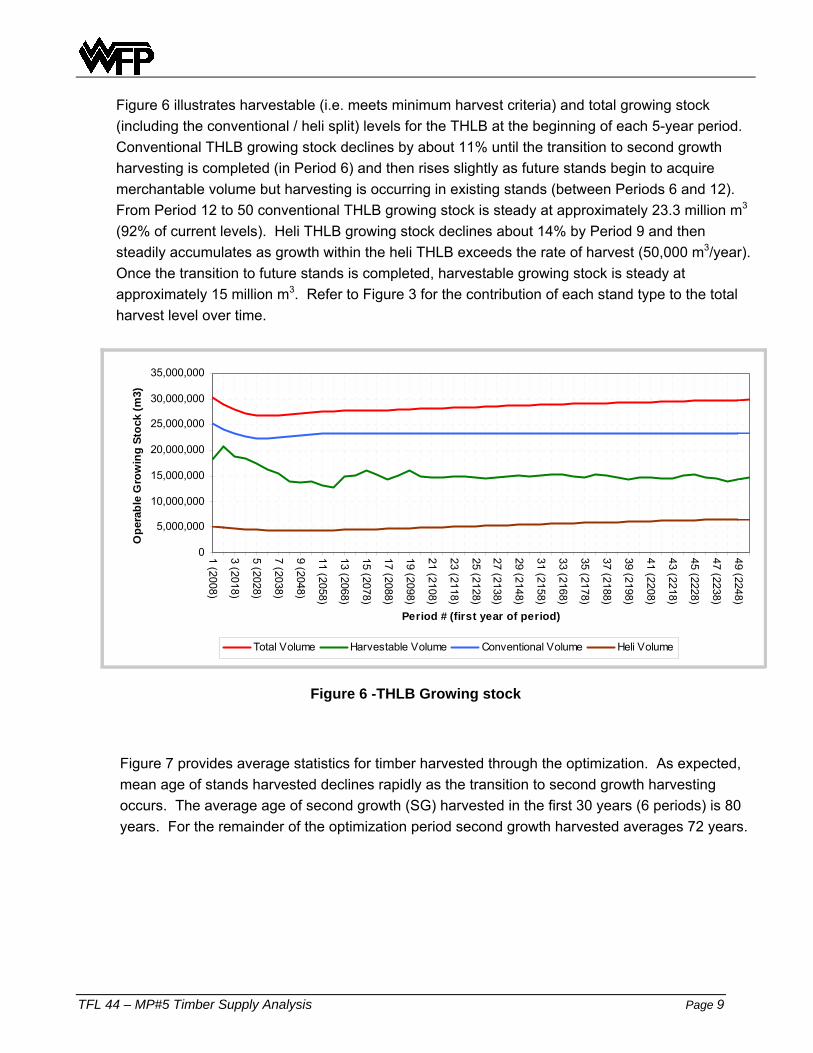
Figure 6 illustrates harvestable (i.e. meets minimum harvest criteria) and total growing stock (including the conventional / heli split) levels for the THLB at the beginning of each 5-year period. Conventional THLB growing stock declines by about 11% until the transition to second growth harvesting is completed (in Period 6) and then rises slightly as future stands begin to acquire merchantable volume but harvesting is occurring in existing stands (between Periods 6 and 12). From Period 12 to 50 conventional THLB growing stock is steady at approximately 23.3 million m3 (92% of current levels). Heli THLB growing stock declines about 14% by Period 9 and then steadily accumulates as growth within the heli THLB exceeds the rate of harvest (50,000 m3/year). Once the transition to future stands is completed, harvestable growing stock is steady at approximately 15 million m3. Refer to Figure 3 for the contribution of each stand type to the total harvest level over time.
0
5,000,000
10,000,000
15,000,000
20,000,000
25,000,000
30,000,000
35,000,000
1 (2008)
3 (2018)
5 (2028)
7 (2038)
9 (2048)
11 (2058)
13 (2068)
15 (2078)
17 (2088)
19 (2098)
21 (2108)
23 (2118)
25 (2128)
27 (2138)
29 (2148)
31 (2158)
33 (2168)
35 (2178)
37 (2188)
39 (2198)
41 (2208)
43 (2218)
45 (2228)
47 (2238)
49 (2248)
Period # (first year of period)
Ope
rabl
e G
row
ing
Stoc
k (m
3)
Total Volume Harvestable Volume Conventional Volume Heli Volume
Figure 6 -THLB Growing stock
Figure 7 provides average statistics for timber harvested through the optimization. As expected, mean age of stands harvested declines rapidly as the transition to second growth harvesting occurs. The average age of second growth (SG) harvested in the first 30 years (6 periods) is 80 years. For the remainder of the optimization period second growth harvested averages 72 years.

TFL 44 – MP#5 Timber Supply Analysis Page 10
400500600700800900
1,0001,1001,2001,3001,4001,5001,600
1 (2008)
3 (2018)
5 (2028)
7 (2038)
9 (2048)
11 (2058)
13 (2068)
15 (2078)
17 (2088)
19 (2098)
21 (2108)
23 (2118)
25 (2128)
27 (2138)
29 (2148)
31 (2158)
33 (2168)
35 (2178)
37 (2188)
39 (2198)
41 (2208)
43 (2218)
45 (2228)
47 (2238)
49 (2248)
Period # (first year of period)
ha o
r m3/
ha
0153045607590105120135150165180
year
s
Annual Harvest Area Volume/ha Average Age Avg SG Age
Figure 7 - Harvest Statistics 2008 – 2257
Annual area harvested fluctuates between 950 and 1,200 hectares for the first eight decades in conjunction with the decline in harvest volume and the varying yields available for old growth and natural and current managed second growth. Once the transition to future managed second growth harvesting is completed, annual area harvested generally fluctuates between 1,000 and 1,100 hectares. Merchantable volume per hectare remains relatively stable at around 780 m3/ha once the transition to future managed stands is made.
The minimum harvest age modelled for stands on high sites is 50 years. All other stands must be at least 60 to 90 years old depending on site quality (see Table 44 of the IP). High sites occupy 8.6% of the current THLB (see Table 26 of the IP). Figure 8 indicates the contribution of stands less than 60 years old to total annual harvest volume.

TFL 44 – MP#5 Timber Supply Analysis Page 11
0
10,000
20,000
30,000
40,000
50,000
60,000
70,000
1 (2008)
3 (2018)
5 (2028)
7 (2038)
9 (2048)
11 (2058)
13 (2068)
15 (2078)
17 (2088)
19 (2098)
21 (2108)
23 (2118)
25 (2128)
27 (2138)
29 (2148)
31 (2158)
33 (2168)
35 (2178)
37 (2188)
39 (2198)
41 (2208)
43 (2218)
45 (2228)
47 (2238)
49 (2248)
Period # (first year of period)
Ann
ual H
arve
st V
olum
e fr
om s
tand
s le
ss
than
60
year
s ol
d (m
3)
Figure 8 - Volume Contribution from Stands less than 60 years old
These young stands provide little volume in the short term. The largest contribution occurs in Period 14 (2073-2077) when they contribute approximately 7.7% of the total volume (62,000 m3). Over the entire optimization period these stands provide roughly 0.8% of the total volume.
2.1 Western Red Cedar and Yellow Cedar Projections
Traditional and cultural uses of cedar (red and yellow) are important to First Nations. Opportunities for accessing and managing cedar have been increased through the granting of tenures to First Nations and treaty processes. Within TFL 44 there is a significant volume of cedar.
Figure 9 indicates the estimated volume (at the beginning of each 5-year period) of red and yellow cedar on the THLB and within the total productive forest associated with the Base Case harvest schedule. These estimates are based on the red and yellow cedar component of natural stands and TIPSY curves generated for the cedar component of managed stands. The latter was done to account for the generally lower site index for Cw and Cy within managed stands – Cw and Cy usually grow slower than the other species (Ba, Fd and Hw). Therefore at average harvest ages Cw and Cy will usually contribute less to the stand volume than their proportion at the time of stand establishment. For example, when 30% of the trees planted in a stand are Cw, at harvest (70 years old) Cw may be only 18% of the volume (rather than 30%).

TFL 44 – MP#5 Timber Supply Analysis Page 12
0
2
4
6
8
10
12
14
1 3 5 7 9 11 13 15 17 19 21 23 25 27 29 31 33 35 37 39 41 43 45 47 49
Period #
mill
ions
of m
3
Productive Forest Cw Productive Forest Cy THLB Cw THLB Cy
Figure 9 – Base Case cedar volume estimates over time
As expected, the amount of cedar (red and yellow) on the THLB declines significantly over the first 30 years as the remaining old growth is harvested. During this time the amount of cedar within the total productive forest declines by about 23%; however the volume never falls below 8.9 million m3 (7.9 million m3 of Cw and 1.0 million m3 of Cy) – this indicates there is a large inventory of Cw and Cy within the non-contributing landbase (reserves and netdowns). The relative absence of Cw and Cy in the older second growth stands (mainly natural regeneration) also contributes to the decline (see Tables 31 and 32 in the IP for Cw/Cy distribution in these stands).
By period 7 (2038) cedar volumes begin to recover as managed stands with significant Cw and Cy components begin to acquire volume (see Tables 35 and 36 in the IP for Cw/Cy distribution in such stands). Total cedar volume equals the current volume by period 14 (2073) and averages in excess of 12.6 million m3 from then until the end of the schedule.
As the cedar within the non-contributing landbase will generally be older (due to no harvesting occurring) this cedar inventory would be more likely to contain a supply of larger trees suitable for canoes, buildings, carving, etc. (“monumental cedar”).

TFL 44 – MP#5 Timber Supply Analysis Page 13
3.0 Alternate Harvest Flows
This section examines two alternate flow scenarios.
3.1 Maintain current AAC for 20 years Table 2 and Figure 10 represent an attempt to maintain the initial harvest level (current AAC) for the first 20 years (4 periods). The results indicate that, compared to the Base Case, an additional 459,300 m3 (2.8%) can be harvested over the next 20 years with a total of approximately 384,500 m3 (2.4%) less being harvested over the following 20 years. The LTHL is approximately 350 m3/year (0.04%) lower such that over the entire 250 years the overall harvest volume is the same as the Base Case.
Table 2 - Harvest levels with maintaining current AAC for 20 years
Annual Harvest Volume (m3)
Period Start Year
End Year Base Case
Maintain current AAC
1 2008 2012 837,268 837,268 2 - 4 2013 2027 806,600 837,268
5 2028 2032 806,600 795,000 6 - 7 2033 2042 806,600 776.500
8 2043 2047 806,600 801,500 9 - 50 2048 2257 806,600 806,250
600,000
650,000
700,000
750,000
800,000
850,000
900,000
950,000
1,000,000
1 (2008)
3 (2018)
5 (2028)
7 (2038)
9 (2048)
11 (2058)
13 (2068)
15 (2078)
17 (2088)
19 (2098)
21 (2108)
23 (2118)
25 (2128)
27 (2138)
29 (2148)
31 (2158)
33 (2168)
35 (2178)
37 (2188)
39 (2198)
41 (2208)
43 (2218)
45 (2228)
47 (2238)
49 (2248)
Period # (First year of period)
m3/
yr
Maintain Current AAC for 20 Years Base Case
Figure 10 – Harvest levels with maintaining current AAC for 20 years
Alternatively it is possible to produce a schedule where the mid-term timber supply is greater (closer to the Base Case level) with a LTHL that is approximately 20,000 m3/year less than the LTHL of the Base Case. In this schedule the total harvest over the 250 years is approximately 823,000 m3 less than the Base Case.

TFL 44 – MP#5 Timber Supply Analysis Page 14
3.2 Non-declining even flow Table 3 and Figure 11 show the impact of immediately dropping to a non-declining even flow (NDEF) harvest level. The harvest level in Period 1 is about 29,400 m3/year (3.5%) less while the LTHL is approximately 1,300 m3/year, or 0.2%, higher.
Table 3 – Harvest levels with non-declining even flow
Annual Harvest Volume (m3) Period
Start Year
End Year Base Case NDEF
1 2008 2012 837,268 807,900 2 - 50 2013 2227 806,600 807,900
600,000
650,000
700,000
750,000
800,000
850,000
900,000
950,000
1,000,000
1 (2008)
3 (2018)
5 (2028)
7 (2038)
9 (2048)
11 (2058)
13 (2068)
15 (2078)
17 (2088)
19 (2098)
21 (2108)
23 (2118)
25 (2128)
27 (2138)
29 (2148)
31 (2158)
33 (2168)
35 (2178)
37 (2188)
39 (2198)
41 (2208)
43 (2218)
45 (2228)
47 (2238)
49 (2248)
Period # (First year of period)
m3/
yr
NDEF Base Case
Figure 11 – Harvest levels with non-declining even flow

TFL 44 – MP#5 Timber Supply Analysis Page 15
4.0 Sensitivity Analyses
Sensitivity analysis provides a measure of the upper and lower bounds of the Base Case harvest forecast, reflecting the uncertainty of assumptions made in the Base Case. By developing and testing a number of sensitivity issues, it is possible to determine which variables most affect results. This in turn facilitates the management decisions that must be made in the face of uncertainty. As Woodstock was used as an optimization tool to generate the Base Case, it is expected that the results will be sensitive to any changes to the inputs.
To allow meaningful comparison of sensitivity analyses, they are performed by varying (from the Base Case) only the assumption being evaluated.
In general, sensitivities with negative impacts were run with the goal of keeping the short term harvest as close as possible to the harvest in the Base Case. Where impacts were positive, flow request adjustments were made to (1) raise the short and medium term flow, and optionally (2) increase the long term harvest level.
Sensitivity issues are summarized in Table 4. The timber supply impacts are illustrated in Sections 4.1 through 4.18.
Table 4 – Current Management Sensitivity Analyses
Issue Sensitivity tested summary Section
Add Maa-Nulth Treaty related lands 4.1Landbase available for harvesting Exclude areas previously identified as culturally significant by
First Nations’ land-use planning processes 4.2
Mature yields underestimated by 10% 4.3
Mature yields overestimated by 10% 4.4
Immature yields underestimated by 10% 4.5
Immature stands yields overestimated by 10% 4.6
Growth and Yield
Use SIBEC Site Index estimates 4.7
Remove benefits of genetic gain 4.8Forest management / Silviculture Remove Western Forest Strategy impacts (area and yield) 4.9
Exclude marginally economic stands 4.10
Exclude 50% of mature heli area 4.11
Operability
Remove heli harvest constraint 4.12
Visual Quality Reduce the percent disturbed within each VQO polygon 4.13
Biodiversity Exclude stands containing “Red-listed” site series 4.14

TFL 44 – MP#5 Timber Supply Analysis Page 16
Issue Sensitivity tested summary Section
Terrain stability management
Remove “steep” terrain constraint 4.15
Minimum harvest age Increase minimum harvest ages by 10 years 4.16
Initial harvest level Include two years of current AAC 4.17
Summary Summary of sensitivity impacts 4.18
4.1 Add Maa-Nulth Treaty related lands The Maa-Nulth Designated Areas (B.C. Regulation 71/2007) are to become Maa-Nulth First Nations Lands under the terms of the Maa-Nulth First Nations Final Agreement dated December 9, 2006. This includes 11,684 ha within TFL 44 for the Huu-ay-aht, Uchucklesaht and Ucluelet First Nations. In addition, an area known as T’iitsk’in Paawats (Thunderbird’s Nest) on the west side of Henderson Lake, 2,120 ha of which is within TFL 44, will become a Provincial Protected Area on the effective date of the Maa-Nulth treaty. Table 5 provides the breakdown of these land areas.
Table 5 – Maa-Nulth lands within TFL 44
Landbase Total area
(ha)
Productive Forest Area
(ha)Operable Area
(ha) THLB Area
(ha)Designated Areas 11,684 11,067 10,892 8,869T’iitsk’in Paawats 2,120 1,583 1,484 818Total 13,804 12,650 12,376 9,687
As described in section 2.0 there is currently no AAC reduction in place for the designated areas; therefore, the current AAC for TFL 44 of 942,268 m3 includes the contribution of these lands. To determine the contribution of these lands several iterations were run. Firstly, the initial Base Case assumptions were used (including assuming a 55,000 m3 contribution from the Maa-Nulth lands) and a harvest schedule determined. Next, the Maa-Nulth lands were made available to the model and several runs were done with differing initial harvest levels until the resulting schedule “paralleled” the Base Case schedule. This indicated that, with the Maa-Nulth lands available, the initial harvest level could be in the order of 100,000 m3/year higher – implying the harvest level would be higher than the current AAC. To address this irregularity, the initial harvest level for this sensitivity was then set at the current AAC (942,268 m3/year) and a schedule determined. Next the Maa-Nulth lands were “removed” and a new Base Case schedule determined that “paralleled” this sensitivity.
Table 6 and Figure 12 indicate the final results whereby the difference between the two schedules remains somewhat consistent on a percentage basis.

TFL 44 – MP#5 Timber Supply Analysis Page 17
Table 6 – Harvest levels with Maa-Nulth treaty related lands added
Annual Harvest Volume (m3)
Period Start Year
End Year Base Case
Maa-Nulth lands added
1 2008 2012 837,268 942,268 2 - 50 2013 2257 806,600 910,600
600,000
650,000
700,000
750,000
800,000
850,000
900,000
950,000
1,000,000
1 (2008)3 (2018)5 (2028)
7 (2038)9 (2048)11 (2058)13 (2068)15 (2078)
17 (2088)19 (2098)21 (2108)23 (2118)25 (2128)
27 (2138)29 (2148)31 (2158)33 (2168)35 (2178)
37 (2188)39 (2198)41 (2208)43 (2218)45 (2228)
47 (2238)49 (2248)
Period # (First year of period)
m3/
yr
Include Maa-Nulth lands (incl. T. Paawats) Base Case
Figure 12 – Harvest levels with Maa-Nulth treaty related lands added
The AAC contribution from these lands is greater than the 55,000 m3/year referenced in the IP. The 55,000 m3 figure was estimated based on THLB inventory >60 years old under the MP #4 assumptions. The increased timber supply impact results from a higher estimate of THLB than the earlier estimate, higher sites than the average for TFL 44 and recognition of the inventory on the Maa-Nulth lands (not just the relatively small portion of stands greater than 60 years of age).
TFL 44 – MP#5 Timber Supply Analysis Page 18
4.2 Exclude Identified First Nations’ Areas During MP#4 considerable effort has been made by the licensee and First Nations whose traditional territories overlap TFL 44 to share information and gain a better appreciation of each other’s interests. One outcome of these efforts was the Hupacasath and the Ditidaht First Nations each provided spatial data for areas they consider culturally significant.
For the Hupacasath First Nation, areas were identified through a land use plan they developed for their territory. Phase 1 of the plan was released in June 2003 and included these components:
• identification of values important to the Hupacasath; • identification of Hupacasath Use Areas (HUA - zoning of their territory); • summaries of values present in each HUA; • three land use designations describing the level of development or protection appropriate
in each HUA (from the Hupacasath’s perspective); and • general objectives for management priorities within each land use designation.
One land use designation was labelled “Protected” with an objective of no industrial development. This designation was given to the Doran, Drinkwater/Della, Grassy, Maber/McBride, and Thunder HUAs, most of which fall within TFL 44.
The Hupacasath land use plan identifies red and yellow cedar as being important to the Hupacasath people and culture. Over a period of two years (2004-2006) the Hupacasath undertook a cedar needs and cedar supply analysis. As a result of this work, they identified areas that may be appropriate to supply their assumed needs. The suitability of some of these areas was field checked but most are identified based on inventory data alone.
This sensitivity removes the Protected HUAs and the cedar polygons from the THLB.
The Ditidaht First Nation has identified an area within their territory, the “Red Zone”, within which they do not want any harvesting to occur for cultural and treaty-related reasons. This sensitivity removes this area from the THLB.
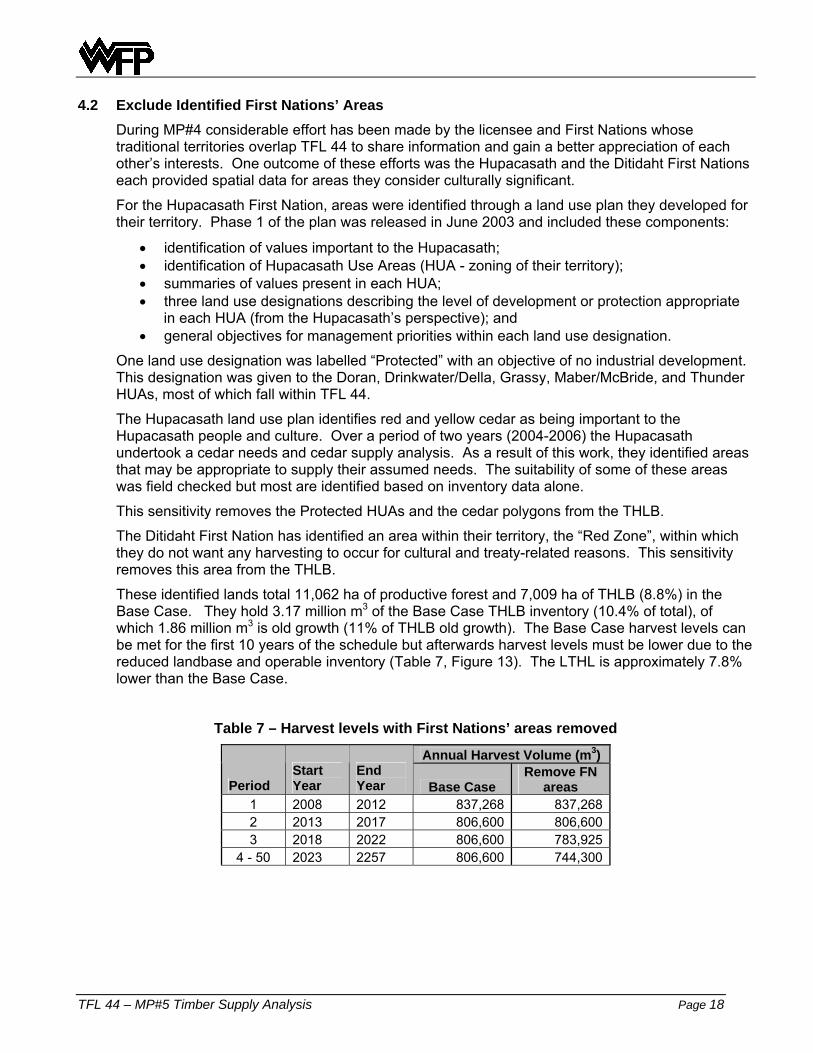
These identified lands total 11,062 ha of productive forest and 7,009 ha of THLB (8.8%) in the Base Case. They hold 3.17 million m3 of the Base Case THLB inventory (10.4% of total), of which 1.86 million m3 is old growth (11% of THLB old growth). The Base Case harvest levels can be met for the first 10 years of the schedule but afterwards harvest levels must be lower due to the reduced landbase and operable inventory (Table 7, Figure 13). The LTHL is approximately 7.8% lower than the Base Case.
Table 7 – Harvest levels with First Nations’ areas removed
Annual Harvest Volume (m3)
Period Start Year
End Year Base Case
Remove FN areas
1 2008 2012 837,268 837,268 2 2013 2017 806,600 806,600 3 2018 2022 806,600 783,925
4 - 50 2023 2257 806,600 744,300

TFL 44 – MP#5 Timber Supply Analysis Page 19
600,000
650,000
700,000
750,000
800,000
850,000
900,000
950,000
1,000,000
1 (2008)
3 (2018)
5 (2028)
7 (2038)
9 (2048)
11 (2058)
13 (2068)
15 (2078)
17 (2088)
19 (2098)
21 (2108)
23 (2118)
25 (2128)
27 (2138)
29 (2148)
31 (2158)
33 (2168)
35 (2178)
37 (2188)
39 (2198)
41 (2208)
43 (2218)
45 (2228)
47 (2238)
49 (2248)
Period # (First year of period)
m3/
yr
Remove First Nations Areas Base Case
Figure 13 - Harvest levels with First Nations’ areas removed As 17.2% of the volume removed is classified as heli operable (versus 16.2% for the TFL as a whole) and the annual heli harvest restriction is maintained at 50,000 m3/year, the LTHL is reduced by less than the 8.8% anticipated (based on the percentage of THLB removed). In other words, the annual heli harvest restriction lessens the impact of the removal of these lands.
To the extent that access to these First Nations’ areas is restricted there is a downward timber supply pressure.

TFL 44 – MP#5 Timber Supply Analysis Page 20
4.3 Mature stands yields underestimated by 10% The sensitivity of timber supply to mature stands (138 years and older) volume estimates was tested by increasing (this Section) and decreasing (Section 4.4) these volumes by 10%. The volumes in these stands are estimated from the average inventory volumes (average lines) after applying a reduction for cull (Z) grades and waste and breakage (see section 8.4 of the IP for more details).
The increased yields result in approximately 1.7 million m3 (5.6%) more inventory on the THLB today when compared to the Base Case. As it is mature volume it is available in the short-term: Table 8 and Figure 14 indicate the results of trying to maintain the initial harvest level as long as possible while achieving the same LTHL. The total volume harvested in the first 40 years is increased by approximately 1.06 million m3. The entire 1.7 million m3 of inventory added is not harvested due to the annual heli harvest volume restriction.
Table 8 – Harvest levels with increased mature stands yields
Annual Harvest Volume (m3)
Period Start Year
End Year Base Case
Higher mature yields
1 2008 2012 837,268 837,268 2 - 8 2013 2047 806,600 837,268
9 - 50 2048 2257 806,600 806,600
600,000
650,000
700,000
750,000
800,000
850,000
900,000
950,000
1,000,000
1 (2008)
3 (2018)
5 (2028)
7 (2038)
9 (2048)
11 (2058)
13 (2068)
15 (2078)
17 (2088)
19 (2098)
21 (2108)
23 (2118)
25 (2128)
27 (2138)
29 (2148)
31 (2158)
33 (2168)
35 (2178)
37 (2188)
39 (2198)
41 (2208)
43 (2218)
45 (2228)
47 (2238)
49 (2248)
Period # (First year of period)
m3/
yr
Mature Yields +10% Base Case
Figure 14 – Harvest levels with increased mature stands yields

TFL 44 – MP#5 Timber Supply Analysis Page 21
4.4 Mature stands yields overestimated by 10% This sensitivity removes 1.7 million m3 from the current operable inventory. These results (Table 9 and Figure 15) indicate the harvest levels achieved when setting the initial harvest level and the LTHL at the same amounts as the Base Case results. Total harvest in the first 35 years is reduced by 1.2 million m3 – less than the 1.7 million m3 removed from the inventory due to the annual heli harvest restriction (50,000 m3/year) mitigating the impact of the lower inventory volumes within the heli portion of the THLB.
Table 9 – Harvest levels with reduced mature stands yields
Annual Harvest Volume (m3)
Period Start Year
End Year Base Case
Lower mature yields
1 2008 2012 837,268 837,268 2 2013 2017 806,600 795,000 3 2018 2022 806,600 754,800
4 - 6 2023 2037 806,600 756,400 7 2038 2042 806,600 781,400
8 - 50 2043 2257 806,600 806,600
600,000
650,000
700,000
750,000
800,000
850,000
900,000
950,000
1,000,000
1 (2008)
3 (2018)
5 (2028)
7 (2038)
9 (2048)
11 (2058)
13 (2068)
15 (2078)
17 (2088)
19 (2098)
21 (2108)
23 (2118)
25 (2128)
27 (2138)
29 (2148)
31 (2158)
33 (2168)
35 (2178)
37 (2188)
39 (2198)
41 (2208)
43 (2218)
45 (2228)
47 (2238)
49 (2248)
Period # (First year of period)
m3/
yr
Mature Yields -10% Base Case
Figure 15 – Harvest levels with reduced mature stands yields Alternatively a harvest schedule that achieves short and mid-term harvest levels close to the Base Case levels with a lower LTHL is possible.
There is general comfort with the overall volume estimates for mature stands as the inventory has been upgraded and updated (see section 5.1 of the IP for details). A Ministry of Forests and Range (MoFR) audit done in the late 1990’s found no statistically significant differences.
TFL 44 – MP#5 Timber Supply Analysis Page 22
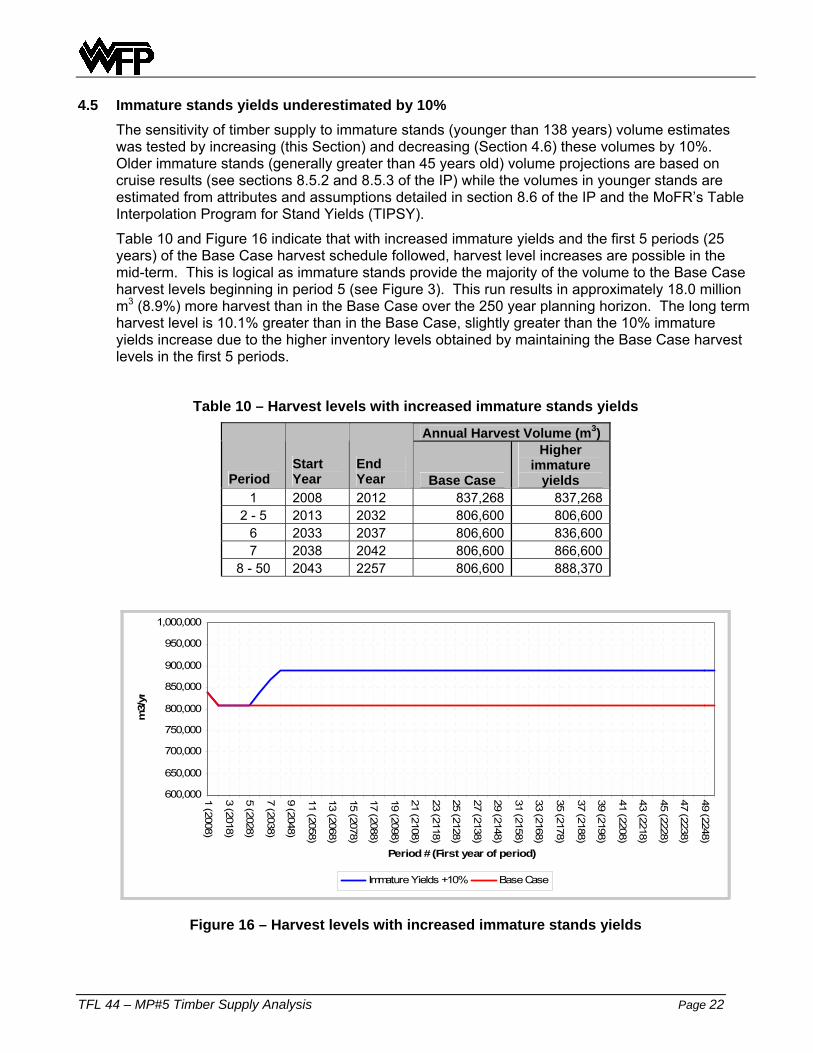
4.5 Immature stands yields underestimated by 10% The sensitivity of timber supply to immature stands (younger than 138 years) volume estimates was tested by increasing (this Section) and decreasing (Section 4.6) these volumes by 10%. Older immature stands (generally greater than 45 years old) volume projections are based on cruise results (see sections 8.5.2 and 8.5.3 of the IP) while the volumes in younger stands are estimated from attributes and assumptions detailed in section 8.6 of the IP and the MoFR’s Table Interpolation Program for Stand Yields (TIPSY).
Table 10 and Figure 16 indicate that with increased immature yields and the first 5 periods (25 years) of the Base Case harvest schedule followed, harvest level increases are possible in the mid-term. This is logical as immature stands provide the majority of the volume to the Base Case harvest levels beginning in period 5 (see Figure 3). This run results in approximately 18.0 million m3 (8.9%) more harvest than in the Base Case over the 250 year planning horizon. The long term harvest level is 10.1% greater than in the Base Case, slightly greater than the 10% immature yields increase due to the higher inventory levels obtained by maintaining the Base Case harvest levels in the first 5 periods.
Table 10 – Harvest levels with increased immature stands yields
Annual Harvest Volume (m3)
Period Start Year
End Year Base Case
Higher immature
yields 1 2008 2012 837,268 837,268
2 - 5 2013 2032 806,600 806,600 6 2033 2037 806,600 836,600 7 2038 2042 806,600 866,600
8 - 50 2043 2257 806,600 888,370
600,000
650,000
700,000
750,000
800,000
850,000
900,000
950,000
1,000,000
1 (2008)
3 (2018)
5 (2028)
7 (2038)
9 (2048)
11 (2058)
13 (2068)
15 (2078)
17 (2088)
19 (2098)
21 (2108)
23 (2118)
25 (2128)
27 (2138)
29 (2148)
31 (2158)
33 (2168)
35 (2178)
37 (2188)
39 (2198)
41 (2208)
43 (2218)
45 (2228)
47 (2238)
49 (2248)
Period # (First year of period)
m3/
yr
Immature Yields +10% Base Case
Figure 16 – Harvest levels with increased immature stands yields

TFL 44 – MP#5 Timber Supply Analysis Page 23
4.6 Immature stands yields overestimated by 10% With immature stands yields decreased by 10%, short term harvest levels need to decline in order to allow the transition to lower mid and long term harvest levels. A maximum decline rate of 5% per period can be managed. The long term harvest level is 77,300 m3/year (9.6%) lower than the Base Case results (see Table 11 and Figure 17). The long term harvest level is less than 10% lower due to the annual heli harvest restriction reducing the impact of the lower volumes within the heli portion of the THLB. Over the entire 250 year planning horizon, 18.4 million m3 (9.1%) less is harvested in this sensitivity.
Table 11 – Harvest levels with reduced immature stands yields
Annual Harvest Volume (m3)
Period Start Year
End Year Base Case
Lower immature
yields 1 2008 2012 837,268 837,268 2 2013 2032 806,600 806,600 3 2033 2037 806,600 768,150
4 - 50 2038 2257 806,600 729,300
600,000
650,000
700,000
750,000
800,000
850,000
900,000
950,000
1,000,000
1 (2008)
3 (2018)
5 (2028)
7 (2038)
9 (2048)
11 (2058)
13 (2068)
15 (2078)
17 (2088)
19 (2098)
21 (2108)
23 (2118)
25 (2128)
27 (2138)
29 (2148)
31 (2158)
33 (2168)
35 (2178)
37 (2188)
39 (2198)
41 (2208)
43 (2218)
45 (2228)
47 (2238)
49 (2248)
Period # (First year of period)
m3/
yr
Immature Yields -10% Base Case
Figure 17 – Harvest levels with reduced immature stands yields
Since 2003, nitrogen fertilization (post-establishment) has occurred on 1,345 ha in TFL 44. The fertilization treatments have mostly occurred on stands where Douglas fir is the leading species – averaging 70%. The stand age has varied with 58% of the initial application in stands aged 50 to 70 years of age and 42% in stands aged 30 to 45 years. The fertilization program has been contingent on government funding programs and is expected to continue in the next few years.
This fertilization was not incorporated into the yield tables; therefore, the mid-term timber supply may be slightly underestimated (by about 40,000 m3). Continued late-rotation fertilization of
TFL 44 – MP#5 Timber Supply Analysis Page 24
Douglas fir stands can help stands reach merchantable size in a shorter time and/or increase volume yields.
Fertilization also appears to have a carbon sequestration benefit in that more carbon is captured by the increased tree growth than is produced by the fertilizer manufacturing and application processes. With the increasing interest in carbon offsets this sequestration may provide an economic benefit that can be captured to either reduce the net cost of the fertilization treatment or provide funds for other treatments. This evolving carbon market has many uncertainties at the moment (e.g. who owns the offsets on crown land?) that have to be addressed before this becomes part of everyday business.

TFL 44 – MP#5 Timber Supply Analysis Page 25
4.7 Use SIBEC Site Index estimates The Base Case uses WFP’s biophysical site index model (BSIM) to estimate site productivity (see section 8.1 of the IP for details) where suitable cruise-based estimates are not available. This approach resulted in a mean site index (SI) for future leading species of 28.4 metres (27.0 m when all species are considered).
A frequently used approach for estimating site productivity is to use Terrestrial Ecosystem Mapping (TEM – site series mapping) and the associated SIBEC (Site Index by Biogeoclimatic Ecosystem Classification site series) site index estimates. Normally the use of TEM and SIBEC depends on an accuracy assessment having been done for the TEM. No such assessment has been done for the TFL 44 TEM, but this analysis is run to indicate the sensitivity of timber supply to site productivity estimates. Table 12 compares area-weighted average BSIM and SIBEC site index estimates by species and overall. The largest difference is for hemlock which has a significant affect on yields as hemlock is a component of future stands across all analysis units (see Table 36 of the IP).
Table 12 – Average site index estimates by species Site Index Estimate Approach
Ba SI (m)
Cw SI (m)
Cy SI (m)
Fd SI (m)
Hw SI (m)
Overall SI (m)
SIBEC 26.9 21.3 20.1 32.7 24.2 25.3 BSIM 27.1 20.4 20.0 33.9 29.0 27.0
The lower overall site index results in a 1.34 million m3 (4.4%) reduction in operable inventory at the beginning of the analysis and reduces managed stands yields by approximately 10-15% on average (at average harvest ages). These reduced yields create timber supply shortages in the mid and long term (when comparing against the Base Case). The short term is impacted to a lesser degree but reduced harvest levels are necessary to transition down to the lower mid-term harvest levels. In the short term (first 20 years) 600,000 m3 less is harvested; in the mid-term (21-40 years) 1.7 million m3 less is harvested; and in the long term (41-250 years) 18.1 million m3 less is harvested. Overall, there is 20.4 million m3 (10.1%) less harvested. The long term harvest level is approximately 10.7% less than the Base Case level. These results are very similar to the results in Section 4.6 where immature yields were decreased by 10%.
Table 13 – Harvest levels with yields based on SIBEC values
Annual Harvest Volume (m3)
Period Start Year
End Year Base Case
SIBEC Estimates
1 2008 2012 837,268 837,268 2 2013 2032 806,600 806,600 3 2033 2037 806,600 765,800 4 2038 2042 806,600 727,100
5 - 50 2043 2257 806,600 720,500

TFL 44 – MP#5 Timber Supply Analysis Page 26
600,000
650,000
700,000
750,000
800,000
850,000
900,000
950,000
1,000,000
1 (2008)
3 (2018)
5 (2028)
7 (2038)
9 (2048)
11 (2058)
13 (2068)
15 (2078)
17 (2088)
19 (2098)
21 (2108)
23 (2118)
25 (2128)
27 (2138)
29 (2148)
31 (2158)
33 (2168)
35 (2178)
37 (2188)
39 (2198)
41 (2208)
43 (2218)
45 (2228)
47 (2238)
49 (2248)
Period # (First year of period)
m3/
yr
SIBEC-based Immature Yields Base Case
Figure 18 – Harvest levels with yields based on SIBEC values
BSIM (a biophysical decision tree) was developed to improve site index estimates for strategic (forest level) analyses. WFP has a large database of second-growth permanent sample plots and cruise plots as well as research plots that were used in the development, calibration and validation of the decision tree. The basic idea is to relate measured second-growth site indices to biophysical site attributes, such as geographic location and elevation. Once the relationship is established, Site Index may be estimated for all stands in the forest based on specific biophysical site factors.

TFL 44 – MP#5 Timber Supply Analysis Page 27
4.8 Remove benefits of genetic gain The Base Case includes yield gains from tree improvement for recently established stands and future managed stands (applied through TIPSY yield model). This sensitivity tests the impact on timber supply if this silviculture activity to improve yields did not occur.
Table 14 and Figure 19 indicate that in the short term this tree improvement is not contributing to timber supply. This is logical as no stands with tree improvement are available for harvest until Period 9 (40 years into the future). Lower harvest levels are required starting in 2048 (period 9) to make the transition to a lower long-term harvest level due to reduced yields from managed stands (no genetic gain). In the long term, the lack of genetic gain generates harvest levels about 7.4% lower than the Base Case. Overall approximately 12.4 million m3 (~6.1%) less is harvested over the 250 years.
Table 14 – Harvest levels with no genetic gain
Annual Harvest Volume (m3)
Period Start Year
End Year Base Case
No Genetic Gain
1 2008 2012 837,268 837,268 2 - 8 2013 2047 806,600 806,600
9 2048 2052 806,600 786,400 10 – 50 2053 2257 806,600 746,700
600,000
650,000
700,000
750,000
800,000
850,000
900,000
950,000
1,000,000
1 (2008)
3 (2018)
5 (2028)
7 (2038)
9 (2048)
11 (2058)
13 (2068)
15 (2078)
17 (2088)
19 (2098)
21 (2108)
23 (2118)
25 (2128)
27 (2138)
29 (2148)
31 (2158)
33 (2168)
35 (2178)
37 (2188)
39 (2198)
41 (2208)
43 (2218)
45 (2228)
47 (2238)
49 (2248)
Period # (First year of period)
m3/
yr
No Genetic Gain Base Case
Figure 19 – Harvest levels with no genetic gain
Under the Chief Forester’s Standards for Seed Use (MoFR) a person establishing a stand must select a seed lot (to grow seedlings for planting) that has a genetic worth of 5% or more (if available). The genetic worth values used is creating the managed stand yield tables represent the averages for established stands and for future stands (see Table 35 and Table 36 in the IP).

TFL 44 – MP#5 Timber Supply Analysis Page 28
4.9 Remove impacts of Western Forest Strategy
Nearly all of the harvest within TFL 44 over the past 10 years was done using the retention silviculture system (mainly group retention). This is a result of the policies (forest management strategies) of WFP predecessor companies (MacMillan Bloedel, Weyerhaeuser and Cascadia Forest Products). The WFP forest strategy approach is to vary the use of retention systems and the amount of stand level retention by Resource Management Zones of the Vancouver Island Land Use Plan and by ecosection (see section 10.3.4 in the IP for details).
In the Base Case the impacts of the Western Forest Strategy were modeled by including, on average, a 3% THLB area netdown (see section 6.13.2 of the IP) and reducing yields of future stands and stands currently aged 1 – 10 years old by 3% (see section 8.4.2 of the IP). This sensitivity tests the timber supply implications that these forest strategy impacts have on the Base Case harvest levels.
The initial THLB area increases by 3% while the THLB inventory increases by 3.2%. The schedule shown in Table 15 and Figure 20 indicates the result when the initial harvest level is increased by 5%. This was selected as the LTHL was expected to be 6% higher than that of the Base Case (due to the removal of the area and yield impacts). The approach taken was to determine if the short term harvest could be greater by about the same percentage and this “gain” maintained throughout the planning horizon. The LTHL achieved is 5.6% higher than the Base Case.
Table 15 – Harvest levels with no forest strategy impacts
Annual Harvest Volume (m3)
Period Start Year
End Year Base Case
No forest strategy
1 2008 2012 837,268 879,140 2 2013 2017 806,600 870,830 3 2018 2022 806,600 826,875
4 - 6 2023 2037 806,600 806,600 7 2038 2042 806,600 831,600
8 -50 2043 2257 806,600 851,600

TFL 44 – MP#5 Timber Supply Analysis Page 29
600,000
650,000
700,000
750,000
800,000
850,000
900,000
950,000
1,000,000
1 (2008)
3 (2018)
5 (2028)
7 (2038)
9 (2048)
11 (2058)
13 (2068)
15 (2078)
17 (2088)
19 (2098)
21 (2108)
23 (2118)
25 (2128)
27 (2138)
29 (2148)
31 (2158)
33 (2168)
35 (2178)
37 (2188)
39 (2198)
41 (2208)
43 (2218)
45 (2228)
47 (2238)
49 (2248)
Period # (First year of period)
m3/
yr
Remove Forest Strategy Impacts Base Case
Figure 20 – Harvest levels with no forest strategy impacts
As there is only 3.2% more inventory available at the beginning of the analysis, the 5% increase in initial harvest level reduces the operable inventory such that the harvest must decline to the same level as the Base Case in the mid-term (periods 4 – 6). The larger THLB and greater yields obtained in the longer term allows the harvest level to increase until it is nearly the expected 6% greater.
Alternatively, the initial harvest level could have been increased by 3%. This would likely result in a higher mid-term harvest level and a LTHL closer to 6% higher than the Base Case.
TFL 44 – MP#5 Timber Supply Analysis Page 30
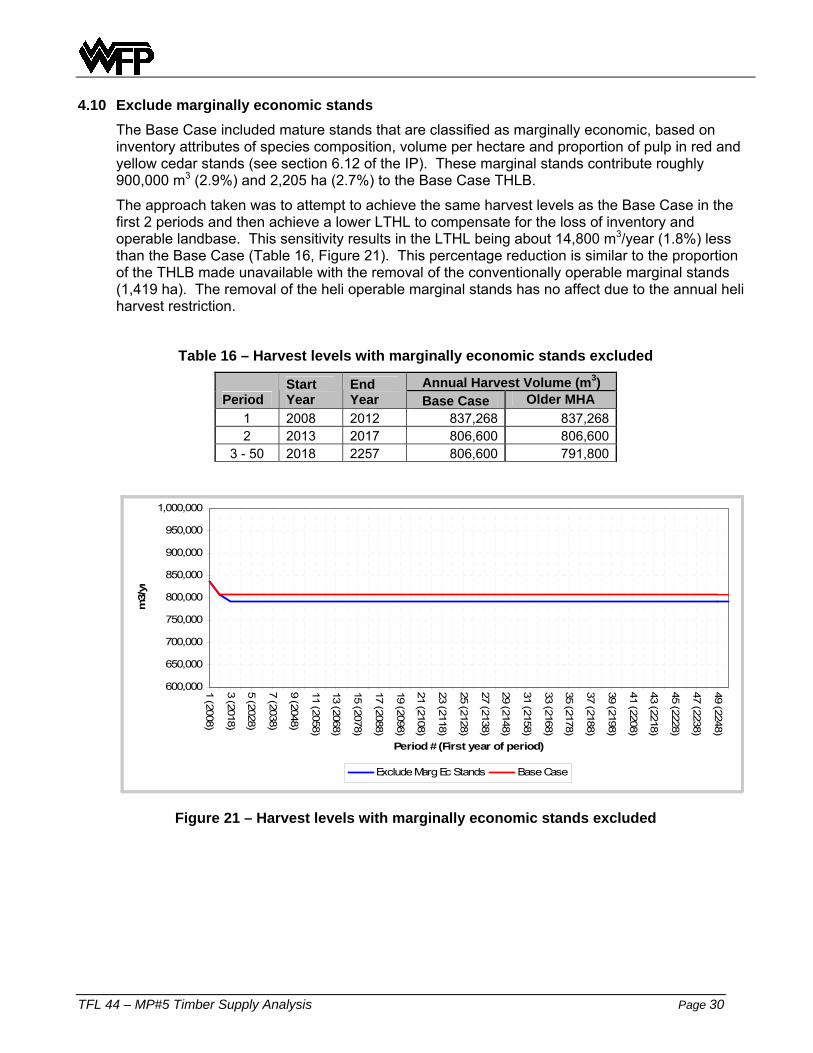
4.10 Exclude marginally economic stands The Base Case included mature stands that are classified as marginally economic, based on inventory attributes of species composition, volume per hectare and proportion of pulp in red and yellow cedar stands (see section 6.12 of the IP). These marginal stands contribute roughly 900,000 m3 (2.9%) and 2,205 ha (2.7%) to the Base Case THLB.
The approach taken was to attempt to achieve the same harvest levels as the Base Case in the first 2 periods and then achieve a lower LTHL to compensate for the loss of inventory and operable landbase. This sensitivity results in the LTHL being about 14,800 m3/year (1.8%) less than the Base Case (Table 16, Figure 21). This percentage reduction is similar to the proportion of the THLB made unavailable with the removal of the conventionally operable marginal stands (1,419 ha). The removal of the heli operable marginal stands has no affect due to the annual heli harvest restriction.
Table 16 – Harvest levels with marginally economic stands excluded
Annual Harvest Volume (m3) Period
Start Year
End Year Base Case Older MHA
1 2008 2012 837,268 837,268 2 2013 2017 806,600 806,600
3 - 50 2018 2257 806,600 791,800
600,000
650,000
700,000
750,000
800,000
850,000
900,000
950,000
1,000,000
1 (2008)
3 (2018)
5 (2028)
7 (2038)
9 (2048)
11 (2058)
13 (2068)
15 (2078)
17 (2088)
19 (2098)
21 (2108)
23 (2118)
25 (2128)
27 (2138)
29 (2148)
31 (2158)
33 (2168)
35 (2178)
37 (2188)
39 (2198)
41 (2208)
43 (2218)
45 (2228)
47 (2238)
49 (2248)
Period # (First year of period)
m3/
yr
Exclude Marg Ec Stands Base Case
Figure 21 – Harvest levels with marginally economic stands excluded

TFL 44 – MP#5 Timber Supply Analysis Page 31
4.11 Exclude approximately one-half of mature heli THLB In recent years, harvest in the high cost non-conventional (heli) mature inventory has been significantly less than its contribution to the current merchantable inventory. A substantial portion of this volume is hemlock and balsam of relatively low value in recent markets. This analysis tests the sensitivity of timber supply to the amount of heli operable mature inventory that is economically accessible.
The approach taken was to remove all marginally economic heli stands plus all heli stands in the higher elevation CWHmm2, CWHvm2 and MHmm1 BEC variants. This removed approximately 3,286 ha (57%) of mature heli THLB. The total volume removed was just over 2.5 million m3, or roughly 53% of the mature heli THLB inventory. As for species, the withdrawn lands comprise 55% of the mature heli hemlock, 62% of the mature heli balsam and 77% of the mature heli yellow cedar. These species are often the most uneconomic to harvest via helicopter due to the combination of high cost and low value.
Table 17 indicates the results of this sensitivity - harvest levels are the same as those of the Base Case. In other words, the 50,000 m3/year annual heli harvest constraint restricts timber supply in the Base Case such that the same timber supply can be achieved even with the removal of the THLB within this sensitivity. These results have an increased reliance on timely harvest of second growth from helicopter areas.
Table 17 – Harvest levels with approximately one-half of mature heli THLB excluded
Annual Harvest Volume (m3)
Period Start Year
End Year Base Case
Half mature heli excluded
1 2008 2012 837,268 837,268 2 - 50 2013 2257 806,600 806,600

TFL 44 – MP#5 Timber Supply Analysis Page 32
4.12 Remove annual heli harvest constraint The Base Case includes a constraint that limits the amount of heli volume harvested in a year to 50,000 m3. This constraint was included to reflect recent performance in the non-conventional portion of the THLB and to reflect the expectation that economics will continue to restrict the amount of volume accessed from these heli stands. This analysis tests the impact that constraint has on harvest levels achieved in the Base Case.
The approach taken was to set the initial harvest level such that it and the LTHL differed by approximately the same amount when compared to the corresponding harvest level in the Base Case. In this analysis the “stable” growing stock constraint is applied to the total THLB growing stock (rather than only the conventional THLB growing stock as done in the Base Case) because in this sensitivity the entire THLB is being utilized to provide a sustainable timber supply, whereas in the Base Case the conventional THLB is being utilized to provide a sustainable timber supply while the timber supply from the heli THLB is restricted.
Table 18 and Figure 22 indicate that with the heli harvest constraint removed the initial harvest level can be 40,000 m3/year higher and that level maintained for 20 years. The LTHL is also approximately 40,000 m3/year higher. Over the entire 250 years approximately 10.3 million m3 (5.1%) more is harvested.
Table 18 - Harvest levels with no heli constraint
Annual Harvest Volume (m3)
Period Start Year
End Year Base Case
No heli constraint
1 2008 2012 837,268 877,268 2 - 4 2013 2027 806,600 877,268
5 - 50 2028 2257 806,600 846,000
600,000
650,000
700,000
750,000
800,000
850,000
900,000
950,000
1,000,0001 (2008)
3 (2018)
5 (2028)
7 (2038)
9 (2048)
11 (2058)
13 (2068)
15 (2078)
17 (2088)
19 (2098)
21 (2108)
23 (2118)
25 (2128)
27 (2138)
29 (2148)
31 (2158)
33 (2168)
35 (2178)
37 (2188)
39 (2198)
41 (2208)
43 (2218)
45 (2228)
47 (2238)
49 (2248)
Period # (First year of period)
m3/
yr
Remove Heli Harvest Constraint Base Case
Figure 22 - Harvest levels with no heli constraint

TFL 44 – MP#5 Timber Supply Analysis Page 33
4.13 Reduce the percent disturbed within each VQO polygon To test the sensitivity of timber supply to the assumptions used for managing visual quality objectives (VQO), this sensitivity uses the mid-point of the disturbance range for each VQO class rather than the upper limit as in the Base Case (Table 19). The model was set such that no more than the applicable listed percentage of each VQO class within each landscape unit could be occupied by stands less than 15 years old (i.e. visually effective green-up (VEG) is reached in 15 years). When these limits were applied to individual VQO polygons, solving time for the model was several days. When the VQO polygons were grouped by class within each landscape unit solutions were generally generated in less than 2 hours. A solution was generated with the disturbance limits applied to individual VQO polygons rather than the aggregated polygons and there was no difference in harvest volumes achieved. This indicates that the aggregation of the VQO polygons had no significant impact on timber supply results.
Table 19 – Maximum disturbance by VQO class
Maximum disturbance % VQO Base Case Sensitivity
Modification (M) 25% 20% Partial Retention (PR) 15% 10%
Retention (R) 5% 2.5%
Table 20 and Figure 23 indicate the results of this sensitivity. Short term harvest levels are unaffected as there is sufficient inventory outside the visually sensitive areas to maintain the Base Case harvest levels. Commencing in 2023 (period 4) the more restrictive visual quality management assumptions (relative to the Base Case) begin having a timber supply impact: modelled harvest level is 3,000 m3/year (~0.4%) less than the Base Case.
Table 20 - Harvest levels with more restrictive visual quality management
Annual Harvest Volume (m3)
Period Start Year
End Year Base Case
VQOs more restrictive
1 2008 2012 837,268 837,268 2 - 3 2013 2022 806,600 806,600
4 - 50 2023 2257 806,600 803,600

TFL 44 – MP#5 Timber Supply Analysis Page 34
600,000
650,000
700,000
750,000
800,000
850,000
900,000
950,000
1,000,000
1 (2008)
3 (2018)
5 (2028)
7 (2038)
9 (2048)
11 (2058)
13 (2068)
15 (2078)
17 (2088)
19 (2098)
21 (2108)
23 (2118)
25 (2128)
27 (2138)
29 (2148)
31 (2158)
33 (2168)
35 (2178)
37 (2188)
39 (2198)
41 (2208)
43 (2218)
45 (2228)
47 (2238)
49 (2248)
Period # (First year of period)
m3/
yr
VQOs More Restrictive Base Case
Figure 23 - Harvest levels with more restrictive visual quality management
Visual impact assessments are used to guide cutblock design in order to mitigate the visual impact of cutblocks and roads. The screening effect of strategically located stand level retention can be used to effectively reduce the visual impact of cutblocks.

TFL 44 – MP#5 Timber Supply Analysis Page 35
4.14 Exclude stands containing “Red-listed” site series As part of the CSA certification process for TFL 44 a Sensitive Ecosystem Inventory (SEI) pilot project was undertaken in 2003/2004 to develop a GIS data model to help identify rare and/or sensitive ecosystems within TFL 44. This project made use of existing WFP GIS data components as the source data for the inventory: TEM data, forest cover data, hydrology data, and slope grid data. Other data sources used included B.C. Conservation Data Centre rare listed plant communities in tabular format.
For the SEI, the rare plant communities (red and blue-listed in an old-growth state) were deemed to be the highest priority for identification so a hierarchy was implemented for those TEM polygons that contained rare community ecosystems in one of the strata (TEM polygons have up to 3 strata). For example, if one of the strata of the TEM polygon satisfied the criteria for a red-listed plant community but was representative of only 10% of the polygon the entire polygon was still classified as red-listed. The hierarchy was determined to be red-list, blue-list, and then landscape rarity (site series or other ecosystems that collectively represented 2% of TFL 44 as it was at the time the SEI was completed).
For this sensitivity, all SEI polygons identified as red-listed were removed from the THLB. A total of 1,249 ha (1.6%) and 699,000 m3 (2.3%) of initial THLB was affected. Table 21 and Figure 24 indicate the results of maintaining Base Case harvest levels for the first 10 years and then allowing the LTHL to adjust to the reduced THLB area and inventory. The LTHL is 10,100 m3/year (1.3%) lower than the Base Case. This is less of a difference than the proportion of the THLB removed (1.6%) due to the exclusion of red-listed site series within the heli THLB not impacting the harvest levels (due to the annual heli harvest restriction).
Table 21 - Harvest levels with red-listed site series excluded
Annual Harvest Volume (m3)
Period Start Year
End Year Base Case
Exclude red-listed
1 2008 2012 837,268 837,268 2 2013 2017 806,600 806,600
3 - 50 2018 2257 806,600 796,500
600,000
650,000
700,000
750,000
800,000
850,000
900,000
950,000
1,000,000
1 (2008)
3 (2018)
5 (2028)
7 (2038)
9 (2048)
11 (2058)
13 (2068)
15 (2078)
17 (2088)
19 (2098)
21 (2108)
23 (2118)
25 (2128)
27 (2138)
29 (2148)
31 (2158)
33 (2168)
35 (2178)
37 (2188)
39 (2198)
41 (2208)
43 (2218)
45 (2228)
47 (2238)
49 (2248)
Period # (First year of period)
m3/
yr
Exclude Red-listed Site Series Base Case
Figure 24 – Harvest levels with red-listed site series excluded

TFL 44 – MP#5 Timber Supply Analysis Page 36
4.15 Remove “steep” terrain constraints To address terrain stability management considerations and Fisheries Sensitive Watershed designations the Base Case included rate-of-cut constraints on “steep” terrain within the high frequency landslide zone of Alberni East (see section 10.2.6 of the IP for details). This analysis tests the sensitivity of timber supply to removing these constraints.
The results indicate that the “steep” terrain constraints have a short-term timber supply impact in the Base Case: approximately 264,000 m3 more is harvested during periods 2 and 3 in this sensitivity. The LTHL is 1,000 m3/year (0.1%) lower due to lower inventory levels because of higher harvest levels in periods 2 and 3. Over the entire 250 year planning horizon only 30,000 m3 more are harvested in this sensitivity.
Table 22 - Harvest levels without “steep” terrain constraints
Annual Harvest Volume (m3)
Period Start Year
End Year Base Case
No “steep” terrain
constraints 1 2008 2012 837,268 837,268 2 2013 2017 806,600 837,268 3 2018 2022 806,600 828,750
4 - 50 2023 2257 806,600 805,600
600,000
650,000
700,000
750,000
800,000
850,000
900,000
950,000
1,000,000
1 (2008)
3 (2018)
5 (2028)
7 (2038)
9 (2048)
11 (2058)
13 (2068)
15 (2078)
17 (2088)
19 (2098)
21 (2108)
23 (2118)
25 (2128)
27 (2138)
29 (2148)
31 (2158)
33 (2168)
35 (2178)
37 (2188)
39 (2198)
41 (2208)
43 (2218)
45 (2228)
47 (2238)
49 (2248)
Period # (First year of period)
m3/
yr
Remove 'Steep' Terrain Constraint Base Case
Figure 25 – Harvest levels without “steep” terrain constraints The results of this sensitivity are impacted by the annual heli harvest constraint (50,000 m3/year) as roughly one-quarter of the “steep” terrain falls within the heli portion of the THLB, thereby limiting the potential timber supply gains possible in this sensitivity. Refer to section 4.12 for results of removing the annual heli harvest constraint.

TFL 44 – MP#5 Timber Supply Analysis Page 37
4.16 Increase minimum harvest ages by 10 years
To test the impact of minimum harvest age criteria on timber supply the minimum ages are increased by 10 years.
This change removes approximately 2.3 million m3 (~12.4%) of available inventory from the forest at the beginning of the analysis. When the harvest flow objective is to transition to the LTHL the lower available inventory and longer rotations requires a lower LTHL (see Table 23 and Figure 26) Over the 250 year planning horizon approximately 2.3 million m3 (1.2%) less is harvested in this sensitivity.
Table 23 - Harvest levels with older minimum harvest ages
Annual Harvest Volume (m3)
Period Start Year
End Year Base Case
Older minimum
harvest ages 1 2008 2012 837,268 837,268
2 - 50 2013 2257 806,600 797,100
600,000
650,000
700,000
750,000
800,000
850,000
900,000
950,000
1,000,000
1 (2008)
3 (2018)
5 (2028)
7 (2038)
9 (2048)
11 (2058)
13 (2068)
15 (2078)
17 (2088)
19 (2098)
21 (2108)
23 (2118)
25 (2128)
27 (2138)
29 (2148)
31 (2158)
33 (2168)
35 (2178)
37 (2188)
39 (2198)
41 (2208)
43 (2218)
45 (2228)
47 (2238)
49 (2248)
Period # (First year of period)
m3/
yr
Older MHA Base Case
Figure 26 – Harvest levels with older minimum harvest ages
Alternatively by reducing short and mid-term harvest levels to allow adequate inventory to accumulate it is possible to achieve a LTHL marginally greater (0.5%) than the Base Case LTHL.

TFL 44 – MP#5 Timber Supply Analysis Page 38
4.17 Include two years of current AAC
As mentioned in section 2.0 the initial harvest level in the Base Case was originally planned to include 2 years at the current AAC of 942,268 m3 and 3 years at the new harvest level (837,268 m3). For simplicity it was decided to not include the 2 years of the current AAC in the initial harvest level of the Base Case; instead this sensitivity is run to indicate the impact on harvest levels that change creates.
The initial harvest level for this run is set at 879,268 m3 and all other constraints are as per the Base Case. Table 24 and Figure 27 indicate that the higher short-term harvest levels reduce the LTHL by about 4,500 m3 (0.6%).
Table 24 - Harvest levels with inclusion of 2 years of current AAC
Annual Harvest Volume (m3)
Period Start Year
End Year Base Case
Include 2 years of current AAC
1 2008 2012 837,268 879,268 2 2013 2022 806,600 834,900
3 - 50 2023 2257 806,600 802,100
600,000
650,000
700,000
750,000
800,000
850,000
900,000
950,000
1,000,000
1 (2008)
3 (2018)
5 (2028)
7 (2038)
9 (2048)
11 (2058)
13 (2068)
15 (2078)
17 (2088)
19 (2098)
21 (2108)
23 (2118)
25 (2128)
27 (2138)
29 (2148)
31 (2158)
33 (2168)
35 (2178)
37 (2188)
39 (2198)
41 (2208)
43 (2218)
45 (2228)
47 (2238)
49 (2248)
Period # (First year of period)
m3/
yr
Include 2 Years of Current AAC in Period 1 Base Case
Figure 27 – Harvest levels with inclusion of 2 years of current AAC
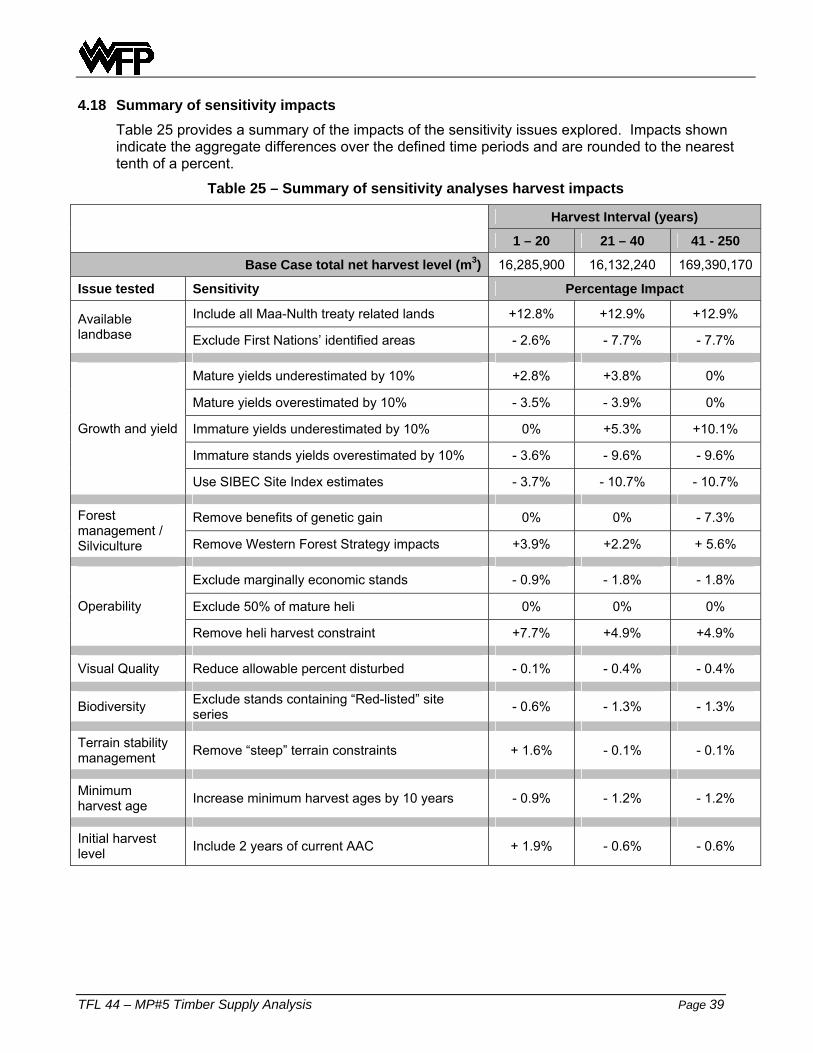
TFL 44 – MP#5 Timber Supply Analysis Page 39
4.18 Summary of sensitivity impacts Table 25 provides a summary of the impacts of the sensitivity issues explored. Impacts shown indicate the aggregate differences over the defined time periods and are rounded to the nearest tenth of a percent.
Table 25 – Summary of sensitivity analyses harvest impacts
Harvest Interval (years)
1 – 20 21 – 40 41 - 250
Base Case total net harvest level (m3) 16,285,900 16,132,240 169,390,170
Issue tested Sensitivity Percentage Impact
Include all Maa-Nulth treaty related lands +12.8% +12.9% +12.9% Available landbase Exclude First Nations’ identified areas - 2.6% - 7.7% - 7.7%
Mature yields underestimated by 10% +2.8% +3.8% 0%
Mature yields overestimated by 10% - 3.5% - 3.9% 0%
Immature yields underestimated by 10% 0% +5.3% +10.1%
Immature stands yields overestimated by 10% - 3.6% - 9.6% - 9.6%
Growth and yield
Use SIBEC Site Index estimates - 3.7% - 10.7% - 10.7%
Remove benefits of genetic gain 0% 0% - 7.3% Forest management / Silviculture Remove Western Forest Strategy impacts +3.9% +2.2% + 5.6%
Exclude marginally economic stands - 0.9% - 1.8% - 1.8%
Exclude 50% of mature heli 0% 0% 0% Operability
Remove heli harvest constraint +7.7% +4.9% +4.9%
Visual Quality Reduce allowable percent disturbed - 0.1% - 0.4% - 0.4%
Biodiversity Exclude stands containing “Red-listed” site series - 0.6% - 1.3% - 1.3%
Terrain stability management Remove “steep” terrain constraints + 1.6% - 0.1% - 0.1%
Minimum harvest age Increase minimum harvest ages by 10 years - 0.9% - 1.2% - 1.2%
Initial harvest level Include 2 years of current AAC + 1.9% - 0.6% - 0.6%

TFL 44 – MP#5 Timber Supply Analysis Page 40
5.0 Base Case Evolution
This section provides some details for other Base Case options that were reviewed and considered before deciding upon the option described in Section 2.0.
All options reviewed were created with these general assumptions:
1. Achieve a long-term even-flow harvest level that is approximately the same as the growth on the THLB (i.e. the volume of growing stock on the THLB is stable in the long-term).
2. Maximize volume harvested over the entire planning horizon.
5.1 Original Information Package Base Case
The accepted IP anticipated setting the initial harvest level at 869,700 m3/year. This was determined by estimating that the Maa-Nulth lands contribute 55,000 m3 to the current AAC of 942,268 m3, reducing the harvest level by 3.3% as projected in the last timber supply analysis and including 2 years of the current AAC in the initial harvest level (refer to section 10.3.2 of the IP for more information). A stable long-term THLB growing stock was required. Table 26 and Figure 28 show the results of this scenario (note that the scale of the vertical axis (annual harvest) is different than the earlier figures).
Table 26 – Base Case harvest levels with accepted IP assumptions
Annual Harvest Volume (m3) Period
Start Year
End Year Accepted IP
1 2008 2012 869,700 2 2013 2022 838,650 3 2023 2027 814,360
4 - 50 2028 2257 806,770
780,000790,000800,000
810,000820,000830,000840,000850,000
860,000870,000880,000
1 (2008)
3 (2018)
5 (2028)
7 (2038)
9 (2048)
11 (2058)
13 (2068)
15 (2078)
17 (2088)
19 (2098)
21 (2108)
23 (2118)
25 (2128)
27 (2138)
29 (2148)
31 (2158)
33 (2168)
35 (2178)
37 (2188)
39 (2198)
41 (2208)
43 (2218)
45 (2228)
47 (2238)
49 (2248)
Period # (First year of period)
m3/
yr
Accepted IP
Figure 28 - Accepted Information Package Base Case Schedule

TFL 44 – MP#5 Timber Supply Analysis Page 41
5.2 Remove 2 years of current AAC from initial harvest level
In order to clearly demonstrate the change in harvest levels from the current AAC it was decided to remove the 2 years of current AAC incorporated into the initial harvest level shown in Section 5.1. The initial harvest level in this scenario is based on assuming a 55,000 m3 contribution from the Maa-Nulth lands and a 3.3% reduction from the current AAC (Table 27 and Figure 29). A slightly higher (5,680 m3 or 0.7%) LTHL is achieved due to the reduced short-term harvest levels.
Table 27 – Base Case harvest levels without inclusion of 2 years of current AAC
Annual Harvest Volume (m3)
Period Start Year
End Year Accepted IP
Exclude 2 years of
current AAC 1 2008 2012 869,700 858,000 2 2013 2022 838,650 814,650 3 2023 2027 814,360 812,450
4 - 50 2028 2257 806,770 812,450
780,000790,000800,000
810,000820,000830,000840,000850,000
860,000870,000880,000
1 (2008)
3 (2018)
5 (2028)
7 (2038)
9 (2048)
11 (2058)
13 (2068)
15 (2078)
17 (2088)
19 (2098)
21 (2108)
23 (2118)
25 (2128)
27 (2138)
29 (2148)
31 (2158)
33 (2168)
35 (2178)
37 (2188)
39 (2198)
41 (2208)
43 (2218)
45 (2228)
47 (2238)
49 (2248)
Period # (First year of period)
m3/
yr
Accepted IP Remove 2 years of current AAC
Figure 29 – Base Case schedule with 2 years of current AAC excluded
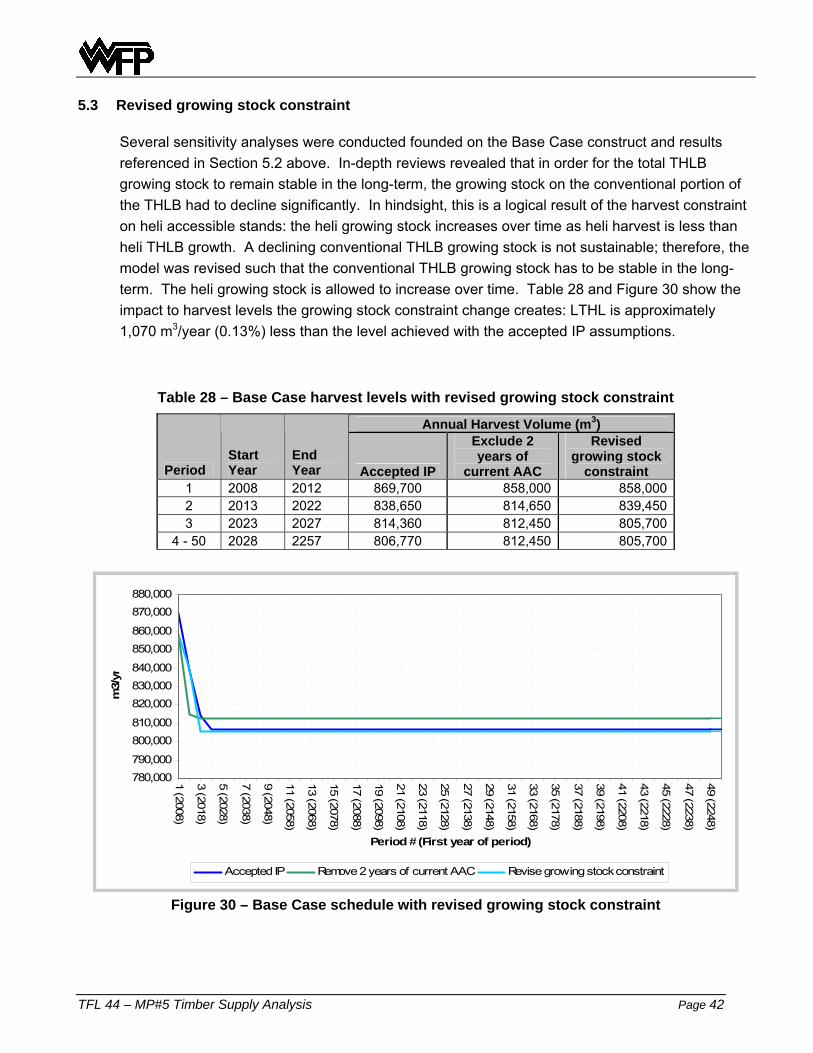
TFL 44 – MP#5 Timber Supply Analysis Page 42
5.3 Revised growing stock constraint
Several sensitivity analyses were conducted founded on the Base Case construct and results referenced in Section 5.2 above. In-depth reviews revealed that in order for the total THLB growing stock to remain stable in the long-term, the growing stock on the conventional portion of the THLB had to decline significantly. In hindsight, this is a logical result of the harvest constraint on heli accessible stands: the heli growing stock increases over time as heli harvest is less than heli THLB growth. A declining conventional THLB growing stock is not sustainable; therefore, the model was revised such that the conventional THLB growing stock has to be stable in the long-term. The heli growing stock is allowed to increase over time. Table 28 and Figure 30 show the impact to harvest levels the growing stock constraint change creates: LTHL is approximately 1,070 m3/year (0.13%) less than the level achieved with the accepted IP assumptions.
Table 28 – Base Case harvest levels with revised growing stock constraint
Annual Harvest Volume (m3)
Period Start Year
End Year Accepted IP
Exclude 2 years of
current AAC
Revised growing stock
constraint 1 2008 2012 869,700 858,000 858,0002 2013 2022 838,650 814,650 839,4503 2023 2027 814,360 812,450 805,700
4 - 50 2028 2257 806,770 812,450 805,700
780,000790,000
800,000810,000
820,000830,000840,000
850,000860,000
870,000880,000
1 (2008)
3 (2018)
5 (2028)
7 (2038)
9 (2048)
11 (2058)
13 (2068)
15 (2078)
17 (2088)
19 (2098)
21 (2108)
23 (2118)
25 (2128)
27 (2138)
29 (2148)
31 (2158)
33 (2168)
35 (2178)
37 (2188)
39 (2198)
41 (2208)
43 (2218)
45 (2228)
47 (2238)
49 (2248)
Period # (First year of period)
m3/
yr
Accepted IP Remove 2 years of current AAC Revise growing stock constraint
Figure 30 – Base Case schedule with revised growing stock constraint

TFL 44 – MP#5 Timber Supply Analysis Page 43
5.4 Final Base Case
Finally, with the model set-up as referenced in Section 5.3 above the sensitivity which adds the Maa-Nulth lands to the THLB was conducted. When the harvest flow objective of this sensitivity was to “parallel” the Base Case schedule (i.e. maintain a constant difference) it was determined that the harvest levels would be approximately 105,000 m3/year higher than the Base Case harvest levels (see section 4.1 for further discussion of this).
Due to those results the initial harvest level for the Base Case was revised to reflect the Maa-Nulth lands contributing 105,000 m3 to the current AAC of 942,268 m3; therefore the initial harvest level for the Base Case was set at 837,268 m3. Table 29 and Figure 31 show how the final Base Case compares to the earlier iterations. The LTHL of the final Base Case is 170 m3/year (0.02%) lower than the LTHL achieved with the accepted IP assumptions; therefore while the revisions made to the Base Case construct do alter the harvest levels for the first 15 years of the schedule, the long-term harvest level for the TFL is unaffected.
Table 29 –Base Case options reviewed
Annual Harvest Volume (m3)
Period Start Year
End Year Accepted IP
Exclude 2 years of
current AAC
Revised growing stock
constraint Final Base Case1 2008 2012 869,700 858,000 858,000 837,2682 2013 2022 838,650 814,650 839,450 806,6003 2023 2027 814,360 812,450 805,700 806,600
4 - 50 2028 2257 806,770 812,450 805,700 806,600
780,000790,000
800,000810,000
820,000830,000840,000
850,000860,000
870,000880,000
1 (2008)
3 (2018)
5 (2028)
7 (2038)
9 (2048)
11 (2058)
13 (2068)
15 (2078)
17 (2088)
19 (2098)
21 (2108)
23 (2118)
25 (2128)
27 (2138)
29 (2148)
31 (2158)
33 (2168)
35 (2178)
37 (2188)
39 (2198)
41 (2208)
43 (2218)
45 (2228)
47 (2238)
49 (2248)
Period # (First year of period)
m3/
yr
Accepted IP Remove 2 years of current AAC Revise growing stock constraint Final Base Case
Figure 31 - Base Case Options Reviewed

TFL 44 – MP#5 Timber Supply Analysis Page 44
6.0 Analysis Summary and Proposed AAC
The analysis shows that the initial harvest level for the Base Case is robust across the individual sensitivities.
For volume estimates:
Inventory audits conducted in the late 1990s provide support for the average volumes/ha in the mature forest.
Cruise data provides some support for current second-growth yields.
There is less certainty regarding projected future yields.
The main uncertainty is with economic access in the short and medium-terms (the next 60 years). The significance of economic operability has increased due to the following:
A substantial reduction in merchantable inventory has occurred during the last 10 to 20 years through the establishment of protected areas and reserves (net-downs) for non-timber values (for example, the establishment of OGMAs during MP #4), combined with on-going harvest. The result is a significant decrease in flexibility to maintain harvest levels in poor markets. Reduced harvest flexibility can also be accentuated by land use planning or First Nations interests that restrict access to areas of merchantable inventory.
Recent market conditions and the current outlook. Hembal prices have been relatively low for the last ten years. The current market downturn has been the most severe in recent decades and it is expected that recovery will be slow.
Reduced harvest flexibility and poor market conditions create uncertainties for economic access, in particular:
In mature forest there is uncertainty of harvest and rate of harvest from helicopter accessible areas (especially lower valued stands) and from conventional areas of low value and/or high access costs.
In second-growth forest there is uncertainty of harvest and harvest ages in more difficult (costly) terrain.
In addition the simplistic approach used in modelling (for practical reasons) introduces some uncertainty, although this may include offsetting factors. For example:
Operational scheduling of harvests will be different from the modelled approach. This may result in somewhat reduced harvest flexibility in the mid-term.
Harvest history and reserves have resulted in fragmentation of a portion of the THLB. For example, a Stanley spatial analysis using the first 25 years of the Woodstock Base Case schedule identified 2.5% as in areas of less than 2 ha in size and 5.1% in areas of less than 5 ha in size. It is possible that some of these small areas will not be harvested or harvest will be delayed until adjacent area is merchantable.
TFL 44 – MP#5 Timber Supply Analysis Page 45
Some small additional volumes will likely be available over time from practices such as single-stem harvesting in areas netted down in the analysis, for example in areas classified as uneconomic or unstable terrain.
The Base Case has made allowances for some of the concerns on economic access:
Areas of mature forest with low volumes and a high percentage of cedar / cypress pulp (broadly labelled as “uneconomic”) have been excluded.
The Base Case constrained harvest from helicopter accessible stands to a maximum of 50,000 m3/year based on recent performance. A sensitivity analysis shows that without this constraint an additional 40,000 m3/year might be harvested over the 250 year forecast (alternatively with different harvest flow constraints, even more could be harvested in the short-term).
Sensitivity analyses have explored timber supply impacts of several of the issues (uncertainties) individually. This includes:
Additional mature stands with relatively low volumes/ha have been broadly classified as marginally economic and were excluded in a sensitivity analysis. The results show a small (1.8%) reduction in harvest from Period 3 to Period 50.
A sensitivity excluded approximately one half of the mature helicopter accessible stands. The result was no impact on the harvest schedule volumes because of the constraint limiting harvest from helicopter accessible areas to a maximum of 50,000 m3/year. There is increased reliance on timely harvest of second-growth from helicopter areas.
A sensitivity analysis of minimum harvest ages extended by 10 years shows little impact; a harvest reduction of 1.2% in the medium-term and long-term.
To further explore possible timber supply impacts (particularly short-term and medium-term) of a combination of some of the uncertainties regarding economic access, a sensitivity analysis (not included in this document) was run that:
Excluded mature forest areas classified as marginally economic;
Excluded high elevation helicopter accessible areas of mature timber - the intent was to represent the lower valued portion of helicopter areas;
Excluded approximately 40% of high elevation mature conventional areas - again the intent was to represent the lower value / higher cost inventory;
Excluded any harvest of second-growth in helicopter accessible areas;
Reduced second-growth volumes by 10%; and,
Increased minimum harvest ages in second-growth by 10 years
Overall these adjustments reduced the initial mature inventory by 3.9 million m3 (23%), the initial total THLB growing stock by 6.2 million m3 (20%) and the long-term THLB area by 11,395 ha (14%). The resulting harvest schedule starts at the same initial harvest level as the Base Case (837,268 m 3/year) and then declines by 5% per 5-year period to 636,000 m3/year in Period 7
TFL 44 – MP#5 Timber Supply Analysis Page 46
(21% below the Base Case long-term harvest level of 806,600 m3/year). These results indicate the risk for downward pressure on timber supply during the next 40 years from reduced economically available merchantable inventory (relative to the Base Case).
Plans are to develop an improved basis for consideration of economic access at the strategic level. The current TFL 44 data set includes the approach used in previous analyses: that of making a broad allowance for economic operability based on inventory information, rather than on economic data (costs and values). WFP is planning a more detailed assessment of economic operability including consideration of harvest systems, costs and timber values; an approach similar to that applied recently for other forests (tenures) in BC.
In conclusion there is uncertainty on economic access. There are risks of downward pressure on harvest levels in the short-term and medium-term relative to harvests projected in the Base Case. During the next three years, WFP plans to develop a framework for more detailed assessment of strategic economic timber supply.
In recognition of the uncertainty regarding economic access to a portion of the inventory, an AAC of 800,000 m3/year is proposed for the WFP management portion of TFL 44. This excludes AAC for the BCTS, Maa-Nulth and Huu-ay-aht management areas in TFL 44 as of January 15, 2010. The 800,000 m3 includes 17,518 m3 allocated to First Nations.
The proposed AAC is 4.5% less than the initial harvest level of 837,268 m3/year in the Base Case.


