
TREASURY INSPECTOR GENERAL FOR TAX … Trends in Retirement Plans . August 9, ... forms of income...
36
TREASURY INSPECTOR GENERAL FOR TAX ADMINISTRATION Phone Number | 202-622-6500 Email Address | [email protected] Web Site | http://www.tigta.gov Statistical Trends in Retirement Plans August 9, 2010 Reference Number: 2010-10-097 This report has cleared the Treasury Inspector General for Tax Administration disclosure review process and information determined to be restricted from public release has been redacted from this document.
Transcript of TREASURY INSPECTOR GENERAL FOR TAX … Trends in Retirement Plans . August 9, ... forms of income...
TREASURY INSPECTOR GENERAL FOR TAX ADMINISTRATION
Phone Number | 202-622-6500 Email Address | [email protected] Web Site | http://www.tigta.gov
Statistical Trends in Retirement Plans
August 9, 2010
Reference Number: 2010-10-097
This report has cleared the Treasury Inspector General for Tax Administration disclosure review process and information determined to be restricted from public release has been redacted from this document.

HIGHLIGHTS
STATISTICAL TRENDS IN RETIREMENT PLANS
Highlights Final Report issued on August 9, 2010
Highlights of Reference Number: 2010-10-097 to the Internal Revenue Service Commissioner for the Tax Exempt and Government Entities Division.
IMPACT ON TAXPAYERS American workers face a number of risks in both accumulating and preserving retirement benefits. While the number of individuals participating in and the amount invested in employer-sponsored retirement plans has increased substantially over the last 30 years, retirees may not have enough income from retirement plans alone to cover their financial needs during retirement, and more individuals are withdrawing retirement savings before retirement. With longer life expectancy, both taxpayers’ investment decisions (including retirement plan investments) and changes in the economy will continue to play important roles in ensuring a financially secure retirement.
WHY TIGTA DID THE AUDIT The overall objective of this review was to identify retirement plan trends based on a wide range of statistical indicators. The data cover the vast majority of employer-sponsored retirement plans, but may not include some retirement plans for churches, government agencies, and some smaller employers. This audit was conducted as part of the TIGTA Fiscal Year 2010 Annual Audit Plan and addresses the major management challenge of Tax Compliance Initiatives.
WHAT TIGTA FOUND From Calendar Years 1977 to 2007, the number of options available for workers to save for retirement through employer-sponsored and individual retirement plans steadily increased. In addition, while there is no conclusive data to show the exact number of American workers who are saving for retirement, it is clear that a
higher percentage of American workers are participating in employer-sponsored retirement plans. Participation has doubled in the last 3 decades and has significantly outpaced population growth among working age Americans. For example, from July 1977 to July 2007, the working age population (i.e., people between the age of 18 and 64 years) grew 44.8 percent; however, employer-sponsored retirement plan participation increased 102.1 percent between Calendar Years 1977 and 2007. Also, the type of retirement plans being offered has changed drastically from those where the benefits are based on earnings and years of service to plans where benefits are based on employee contributions, any employer contributions, and investment earnings and declines.
Between Calendar Years 1977 and 2007, the value of retirement plan assets grew substantially. This is good news, as the increased value of plan assets generally equates to additional income upon retirement. However, it is also clear that many retirees will continue to rely on Social Security and other forms of income for retirement and may run the risk of outliving their retirement assets. In addition, more individuals are withdrawing retirement savings before retirement, which reduces the amount of income available for future retirement.
While this report provides some positive trends and some concerning trends, much of what is presented may change substantially as data become available for Calendar Years 2008, 2009, and 2010 when the country experienced a significant economic downturn and the beginnings of a recovery. In addition, legislative changes being considered could increase participation in retirement plans and provide incentives for younger workers to participate in the future.
WHAT TIGTA RECOMMENDED TIGTA made no recommendations in this report. Tax Exempt and Government Entities Division management reviewed the report before it was issued and offered clarifying comments.
DEPARTMENT OF THE TREASURY
WASHINGTON, D.C. 20220
TREASURY INSPECTOR GENERAL FOR TAX ADMINISTRATION
August 9, 2010 MEMORANDUM FOR COMMISSIONER, TAX EXEMPT AND GOVERNMENT ENTITIES
DIVISION
FROM: Michael R. Phillips Deputy Inspector General for Audit SUBJECT: Final Audit Report – Statistical Trends in Retirement Plans
(Audit # 201010009) This report presents the results of our review to identify retirement plan trends based on a wide range of statistical indicators. This audit was conducted as part of the Treasury Inspector General for Tax Administration Fiscal Year 2010 Annual Audit Plan and addresses the major management challenge of Tax Compliance Initiatives.
There are no recommendations in this report. Tax Exempt and Government Entities Division management reviewed the report before it was issued and offered clarifying comments and suggestions, which have been taken into account.
Copies of this report are also being sent to the Internal Revenue Service managers affected by the report results. Please contact me at (202) 622-6510 if you have questions or Nancy A. Nakamura, Assistant Inspector General for Audit (Management Services and Exempt Organizations), at (202) 622-8500.
Statistical Trends in Retirement Plans
Table of Contents
Background ..........................................................................................................Page 1
Results of Review ...............................................................................................Page 5
Retirement Plan Participation Has Increased, but Responsibility for Funding Retirement Plans Has Shifted to Individuals..................................Page 6
American Workers May Continue to Need Additional Sources of Income to Supplement Retirement Plan Income ..........................................Page 9
Underfunded or Terminated Retirement Plans and Early Spending of Retirement Savings Jeopardize Workers’ Ability to Have Sufficient Retirement Income .......................................................................Page 12
Many Trends Presented in This Report May Change Significantly in the Near Future .........................................................................................Page 15
Appendices Appendix I – Detailed Objective, Scope, and Methodology ........................Page 17
Appendix II – Major Contributors to This Report ........................................Page 18
Appendix III – Report Distribution List .......................................................Page 19
Appendix IV – Selected Information Regarding Federal Government Retirement Plans ...........................................................................................Page 20
Appendix V – Detailed Charts of Statistical Information.............................Page 24

Statistical Trends in Retirement Plans
Abbreviations
CY Calendar Year
FY Fiscal Year
IRA Individual Retirement Arrangement
IRS Internal Revenue Service
PBGC Pension Benefit Guaranty Corporation
PY Processing Year
SIMPLE Savings Incentive Match Plan for Employees
TY Tax Year
Statistical Trends in Retirement Plans
Page 1
Background
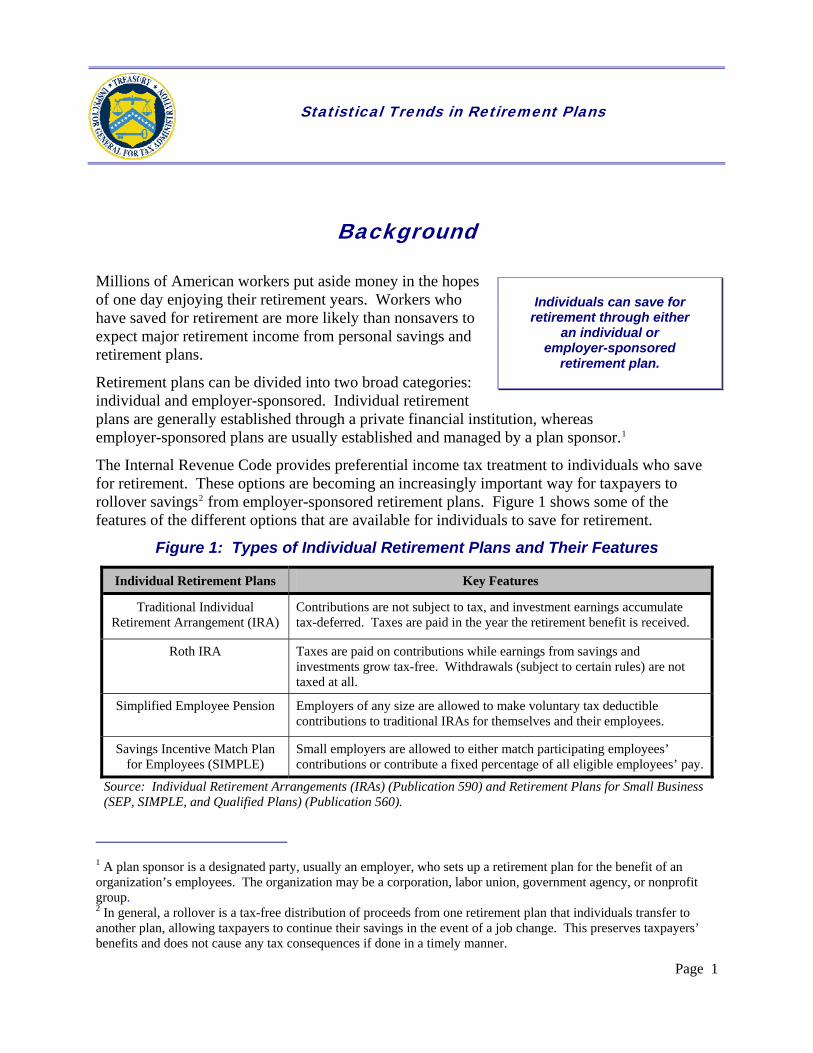
Millions of American workers put aside money in the hopes of one day enjoying their retirement years. Workers who have saved for retirement are more likely than nonsavers to expect major retirement income from personal savings and retirement plans.
Retirement plans can be divided into two broad categories: individual and employer-sponsored. Individual retirement plans are generally established through a private financial institution, whereas employer-sponsored plans are usually established and managed by a plan sponsor.1
Individuals can save for retirement through either
an individual or employer-sponsored
retirement plan.
The Internal Revenue Code provides preferential income tax treatment to individuals who save for retirement. These options are becoming an increasingly important way for taxpayers to rollover savings2 from employer-sponsored retirement plans. Figure 1 shows some of the features of the different options that are available for individuals to save for retirement.
Figure 1: Types of Individual Retirement Plans and Their Features
Individual Retirement Plans Key Features
Traditional Individual Retirement Arrangement (IRA)
Contributions are not subject to tax, and investment earnings accumulate tax-deferred. Taxes are paid in the year the retirement benefit is received.
Roth IRA Taxes are paid on contributions while earnings from savings and investments grow tax-free. Withdrawals (subject to certain rules) are not taxed at all.
Simplified Employee Pension Employers of any size are allowed to make voluntary tax deductible contributions to traditional IRAs for themselves and their employees.
Savings Incentive Match Plan for Employees (SIMPLE)
Small employers are allowed to either match participating employees’ contributions or contribute a fixed percentage of all eligible employees’ pay.
Source: Individual Retirement Arrangements (IRAs) (Publication 590) and Retirement Plans for Small Business (SEP, SIMPLE, and Qualified Plans) (Publication 560).
1 A plan sponsor is a designated party, usually an employer, who sets up a retirement plan for the benefit of an organization’s employees. The organization may be a corporation, labor union, government agency, or nonprofit group. 2 In general, a rollover is a tax-free distribution of proceeds from one retirement plan that individuals transfer to another plan, allowing taxpayers to continue their savings in the event of a job change. This preserves taxpayers’ benefits and does not cause any tax consequences if done in a timely manner.

Statistical Trends in Retirement Plans
Page 2
For employer-sponsored plans, the plan sponsor is responsible for determining membership parameters, investment choices, and in some cases, providing contribution payments in the form of cash and/or stock. These plans fall into two major categories:
• Defined benefit plans are traditionally set up so benefits are calculated by a set formula. Upon retirement, workers typically receive benefits based on years worked for an employer and earnings in years prior to retirement. Under this type of plan, the employer is generally responsible for making all or a portion of the contributions to fund the promised benefits.
• Defined contribution plans enable workers to contribute to individual accounts which are tax-advantaged in that contributions are typically excluded from current taxable income, and earnings on balances grow tax-deferred until they are withdrawn. An employer may also make contributions, either by matching employee’s contributions up to plan or legal limits, or on a noncontingent basis.
Figure 2 shows several types of defined contribution plans based on various sections of the Internal Revenue Code.
Figure 2: Examples of Defined Contribution Retirement Plans
Internal Revenue Code
Section Description
401(k) Plan where employees have individual accounts to which the employee, employer, or both make contributions. Benefits are based on contributions and investment returns (gains and losses) on the accounts.
403(b) Plan designed for public education and tax-exempt entities. Both the plan sponsor and employees can make pre-tax contributions.
457(b) Plan normally open to all employees working for a State or local government. Both the plan sponsor and participants are permitted to make pre-tax contributions.
Source: Retirement Savings: Better Information and Sponsor Guidance Could Improve Oversight and Reduce Fees for Participants (GAO-09-641, dated September 2009).
Most employer-sponsored plans in the private sector are covered by the Employee Retirement Income Security Act of 1974.3 Among other things, the Act provides protections for participants and beneficiaries in employee benefit plans. Federal Government organizations responsible for overseeing Employee Retirement Income Security Act provisions include:
3 Pub. L. No. 93-406, 88 Stat. 829 (codified as amended in scattered sections of 5 U.S.C., 18 U.S.C., 26 U.S.C., 29 U.S.C., and 42 U.S.C.).
Statistical Trends in Retirement Plans
Page 3
• The Department of Labor Employee Benefits Security Administration – This organization administers and enforces provisions of the Employee Retirement Income Security Act. This includes providing assistance to employers, plan service providers, and others to help them comply with the Act, as well as developing and regulating plan responsibilities and standards for employers and/or plan sponsors.
• The Internal Revenue Service (IRS) Employee Plans function – This function ensures employer-sponsored retirement plans comply with all Internal Revenue Code provisions by examining Annual Returns/Reports of Employee Benefit Plan (Form 5500 series) and related returns. The Employee Plans function is also responsible for approving the written form of plans.
• The Pension Benefit Guaranty Corporation (PBGC) – This organization was established by the Employee Retirement Income Security Act to ensure participants in defined benefit plans receive a minimum level of benefits should their retirement plan be terminated and unable to pay promised benefits.
In addition to the private sector, retirement plans for Federal, State, and local government employees encompass a significant number of plans and participants. At the end of Fiscal Year (FY) 2007, retirement plans for Federal employees included more than 8.8 million individuals and held nearly $928 billion in assets.4 In addition to Federal retirement plans, at the end of FY 20075 there were 2,547 retirement plans for State and local governments. These plans held nearly $3.4 trillion in assets and included nearly 18.6 million employees.
The information used in this review originated from several sources which are subsequently described. Each of the sources gathered, processed, and retained data in different ways to meet their organizational objectives.6 Because of this, 2007 (plan year,7 fiscal year,8 processing year,9 and tax year10) is the latest data that we were able to obtain complete information from all sources. Therefore, the results presented in the report do not reflect the significant economic downturn experienced in Calendar Year (CY) 2008 and portions of CY 2009, in which many
4 See Appendix IV for more information about Federal Government retirement plans. 5 FY 2007 for these plans encompasses the period July 1, 2006, through June 30, 2007. 6 The various sources reported data in different year formats (fiscal years, plan years, processing years, and tax years). 7 The Department of Labor defines a plan year as the calendar year, or an alternative 12-month period, that a retirement plan uses for plan administration. However, the plan year can be shorter in certain circumstances (e.g., the first year a retirement plan is in operation). 8 A 12-month consecutive period ending on the last day of any month, except December. The Federal Government’s fiscal year begins on October 1 and ends on September 30. The Census Bureau collects information on a fiscal year that begins on July 1 and ends on June 30. 9 The calendar year in which the return or document is processed by the IRS. 10 The 12-month period for which tax is calculated. For most individual taxpayers, the tax year is synonymous with the calendar year.

Statistical Trends in Retirement Plans
Page 4
investment portfolios experienced significant losses, or reflect any recovery that portfolios may have experienced in the latter portion of CYs 2009 and 2010.
The data for this project included the following sources:
• Information Returns Received by the IRS: These include data submitted by third parties, such as IRA Contribution Information (Form 5498) and Wage and Tax Statements (Form W-2).
• PBGC Data Books: Annually, the PBGC publishes the Pension Insurance Data Book with detailed statistics about its programs.
• Census Bureau Statistics: The Census Bureau annually estimates residential population within selected demographics including selected age groups and gender.
• Department of Labor: The Department of Labor annually prepares a Pension Plan Bulletin which includes historical information dating back to Plan Year (hereafter referred to as CY)11 1975. When using the Bulletin, our analyses typically started with data from CY 1977 and were analyzed in 5-year increments until CY 2007.
This review includes data from the vast majority of employer-sponsored retirement plans;12 however, data originating from the Department of Labor and the PBGC may not include some retirement plans that are not required to file a Form 5500 such as churches, government agencies, and some smaller employers that are required to file only an Annual Return of One-Participant (Owners and Their Spouses) Retirement Plan (Form 5500-EZ) with the IRS.
This review was performed at the Tax Exempt and Government Entities Division Employee Plans Examination function in Baltimore, Maryland, during the period December 2009 through June 2010. Because we did not have access to source data or systems producing the data, we did not independently verify data we obtained from non-IRS sources. With this exception, we conducted this performance audit in accordance with generally accepted government auditing standards. Those standards require that we plan and perform the audit to obtain sufficient, appropriate evidence to provide a reasonable basis for our findings and conclusions based on our audit objective. We believe that the evidence obtained provides a reasonable basis for our findings and conclusions based on our audit objective. Detailed information on our audit objective, scope, and methodology is presented in Appendix I. Major contributors to the report are listed in Appendix II.
11 According to the Department of Labor, 80 percent of retirement plans file annual returns on a calendar-year basis. However, 20 percent of retirement plans use a fiscal year basis for filing. To simplify our presentation for the purposes of this report, we refer to Department of Labor data as being on a calendar-year basis. 12 In this report, the number of employees in retirement plans is based on active participants who are employed currently, covered by a plan, and not yet retired.

Statistical Trends in Retirement Plans
Page 5
Results of Review
From CYs 1977 through 2007, the number of options available for workers to save for retirement through employer-sponsored and individual retirement plans steadily increased. In addition, while there is no conclusive data to show the exact number of American workers who are or are not saving for retirement, it is clear that a higher percentage of American workers are participating in employer-sponsored retirement plans. Participation has doubled in the last 3 decades and has significantly outpaced population growth among working age Americans. However, the type of retirement plans offered by employers have changed drastically from those where the benefits are based on earnings and years of service to plans where benefits are based on employee contributions, any employer contributions, and investment earnings and declines. In addition to employer-sponsored retirement plans, participation in individual retirement plans has remained steady in recent years, but the amount being contributed has increased steadily.
Due to the increased participation in retirement plans and significant increases in the stock market between CYs 1977 and 2007, the value of retirement plan assets grew substantially during that period. This is good news for those saving for retirement, as the increased value of plan assets generally equates to additional income upon retirement. However, for employer-sponsored defined benefit plans, the average value of plan assets per individual was $62,600, a very modest amount that may not provide sufficient income for taxpayers throughout their retirement years. With longer life expectancy, both taxpayers’ investment decisions and changes in the economy will continue to play important roles in ensuring a financially secure retirement.
In addition to concerns over the amount being saved through retirement plans, the dollar value of retirement plans that were terminated and taken over by the PBGC since FY 2007 has risen drastically, and more individuals are withdrawing retirement savings before retirement. However, the number of plans struggling with funding future retirement benefits decreased between FYs 2004 and 2007, which is a positive indicator.
While this report provides some positive trends and some concerning trends, it is important to note that much of what we are presenting may change substantially as data become available for CYs 2008, 2009, and 2010 when the country experienced a significant economic downturn and the beginnings of a recovery. In addition, legislative changes being considered at the end of our fieldwork could increase participation in retirement plans and provide incentives for younger workers to participate in the future.

Statistical Trends in Retirement Plans
Page 6
Retirement Plan Participation Has Increased, but Responsibility for Funding Retirement Plans Has Shifted to Individuals
Retirement planning becomes more urgent as workers get older. In an April 2010 response to an inquiry from the Departments of the Treasury and Labor, the Government Accountability Office noted Americans are living longer. For example, couples both aged 62 years have a 47 percent chance that at least 1 of them will live to be 90 years old.13 Retirement plans can provide a significant source of income for retirees. According to the Social Security Administration, 28.3 percent of income for those aged 65 years and older in CY 2008 was from retirement plans.14 However, according to the Survey of Consumer Finances, about 39 percent of households at or nearing retirement did not have a formal retirement plan in CY 2007.
Based on available data, it is difficult to tell exactly how many Americans are saving for retirement through formal retirement plans. For example, some retirement plans such as church plans and Government plans are not required to file information reports. Therefore, consistent data are not available regarding participation on certain types of plans. In addition, some individuals may be participating in more than one type of retirement plan.15 As such, figures regarding different retirement plans cannot be combined without double-counting.
Even with these limitations, it is clear that more Americans are participating in employer-sponsored retirement plans. However, in the last 30 years, the responsibility for managing and funding retirement plans has shifted from employers to individuals. In addition, a smaller, but stable, percentage of working age Americans are saving for retirement through individual retirement plans. The following sections of this report contain data on a number of noteworthy trends regarding retirement plan participation and investments of American workers and how they have changed over the past 30 years.
The number of active participants in employer-sponsored retirement plans grew significantly from CY 1977 to CY 2007
Employer-sponsored retirement plan participation has significantly outpaced the growth in the working age population over the past 30 years. Between July 1977 and July 2007, the working age population (i.e., people between the age of 18 and 64 years) grew 44.8 percent (from 130.9 million to 189.5 million). However, employer-sponsored retirement plan participation grew 102.1 percent (from 42.7 million to 86.3 million) between CYs 1977 and 2007. This rate of growth indicates that working Americans are increasingly participating in retirement plans sponsored by their employers.
13 Retirement Income: Challenges for Ensuring Income throughout Retirement (GAO-10-632R, dated April 2010). 14 Income of the Population 55 and Older, 2008 (SSA Publication No.13-11871, dated April 2010). 15 For example, taxpayers participating in an employer-sponsored plan may also contribute to a traditional IRA through a financial institution.

Statistical Trends in Retirement Plans
Page 7
The growth of participation in employer-sponsored retirement plans is directly correlated with the explosion of workers who participated in defined contribution plans (e.g. 401(k) plans) over the last 30 years. Between CYs 1977 and 2007, the number of participants in defined contribution plans increased 358 percent (from 14.6 million to 66.9 million workers) compared to a 31 percent decrease in defined benefit plan (commonly known as pension plans) participants (from 28.1 million workers to 19.4 million workers). Therefore, the increase in overall employer-sponsored retirement plan participation occurred despite a reduction in defined benefit plan participation. Figure 3 shows the overall growth in employer-sponsored retirement plan participation between CYs 1977 and 2007, as well as the overall increase in defined contribution plans and overall decrease in defined benefit plans.
Figure 3: Number of Active Participants in Employer-Sponsored Retirement Plans (in Thousands) by Type of Plan (CYs 1977–2007)
19,40721,63322,61925,22228,427
29,678
28,058
66,873
52,86847,651
38,676
34,853
23,421
14,600
86,280
74,50170,270
63,89863,280
53,09942,658
0
20,000
40,000
60,000
80,000
100,000
1977 1982 1987 1992 1997 2002 2007
Calendar Year
Activ
e Pa
rtic
ipan
ts (t
hous
ands
)
Defined Benefit Plan Defined Contribution Plan Total
Source: Department of Labor, Employee Benefits Security Administration, January 2010 “Private Pension Plan Bulletin” and February 2009 “Private Pension Plan Bulletin Historical Tables and Graphs.”
See Appendix V, Figures 1 and 2, for trend information on the number of employer-sponsored retirement plans over the last 30 years.
Employer-sponsored retirement plans have drastically shifted from pension plans where benefit amounts are pre-determined to defined contribution plans where benefit amounts are dependent on assets in employees’ accounts
Since the late 1970s, there has been a major shift in the way that employers are sponsoring retirement plans. As shown in Figure 4, in CY 1977, nearly two-thirds (65.8 percent) of all

Statistical Trends in Retirement Plans
Page 8
workers participating in an employer-sponsored retirement plan were in a defined benefit plan (management of plan assets and payment of benefits is the responsibility of the employer), while the other one-third (34.2 percent) were in a defined contribution plan (management of assets and payment of benefits is partially or fully the responsibility of the employee). By CY 1997, the percentages had completely reversed as more than two-thirds (67.8 percent) of all workers were in a defined contribution plan and only about one-third (32.2 percent) were in a defined benefit plan. Figure 4 shows that the shift to defined contribution plans continued through CY 2007, when more than three quarters (77.5 percent) of all participants were involved in defined contribution plans.
Figure 4: Percentage of Active Participants in Employer-Sponsored Retirement Plans by Type of Plan (CYs 1977–2007)
65.8%55.9%
44.9%39.5%
32.2%29.0%
22.5%
34.2%
44.1%
55.1%60.5%
67.8%71.0%
77.5%
0%
25%
50%
75%
100%
1977 1982 1987 1992 1997 2002 2007
Calendar Year
Perc
enta
ge o
f Act
ive
Parti
cipa
nts
Defined Benefit Plan Defined Contribution Plan
Source: Department of Labor, Employee Benefits Security Administration, January 2010 “Private Pension Plan Bulletin” and February 2009 “Private Pension Plan Bulletin Historical Tables and Graphs.”
See Appendix V, Figures 1 and 2, for trend information on the number of employer-sponsored retirement plans over the last 30 years.
The percentage of working age Americans saving for retirement through individual retirement plans remained stable between Tax Years (TY) 2004 and 2007
All workers have at least one method available to save for retirement, and many workers have a wide array of options for funding their retirement. These options may include using an employer-sponsored retirement plan and/or saving on their own through an IRA. We do not

Statistical Trends in Retirement Plans
Page 9
have access to individual retirement plan information prior to TY 2004;16 however, it is clear that a significant number of Americans are using individual retirement plans to save for retirement. For TYs 2004 through 2007, an average of about 15 million working-age Americans save for retirement through individual retirement plans. This equates to about 8 percent of the working age population. As shown in Figure 5, the number and percentage of working age Americans participating in individual retirement plans remained fairly stable between TYs 2004 and 2007.
Figure 5: Number and Percentage of Working Age Americans Participating in Individual Retirement Plans (TYs 2004–2007)
TY
Number of Individuals Participating in Individual
Retirement Plans
Percentage of Working Age Americans Participating in
Individual Retirement Plans
2004 14.88 million 8.1%
2005 15.08 million 8.1%
2006 15.11 million 8.1%
2007 15.15 million 8.0%
Source: Form 5498 submitted by third-party financial institutions to the IRS.
See Appendix V, Figure 3, for trend information on the number of participants in individual retirement plans for TYs 2004 through 2007.
American Workers May Continue to Need Additional Sources of Income to Supplement Retirement Plan Income
In April 2010 testimony17 before the United States Senate Special Committee on Aging, the Government Accountability Office noted longer life expectancies and a declining economy created a risk that aging taxpayers could outlive their assets. For example, in CY 2007, before the recent recession, one-half of the households with someone aged 55 to 64 years had financial assets of $72,400 or less, not much more than the median annual working income of $54,600 in the same year.
Our analysis of retirement plan trends revealed similar concerns but also found that the value of employer-sponsored retirement plans has increased greatly over the last 30 years, and the average amount being contributed to individual retirement accounts has increased steadily over the last several years for which we have data. However, just like concerns expressed in the Government Accountability Office’s recent testimony, we noted that the average value of plan
16 To complete this analysis, we used data from TY 2004 Forms 5498, which was the earliest year that information was available. 17 Retirement Income: Challenges for Ensuring Income throughout Retirement (GAO-10-632R, dated April 2010).

Statistical Trends in Retirement Plans
Page 10
assets for each employee in employer-sponsored retirement plans is not significantly different than the median annual working income in CY 2007. With individuals living longer, it is clear that many retirees will continue to rely on Social Security and other forms of income for retirement and may run the risk of outliving their retirement assets. In addition, future retirement income can vary widely based on investment decisions (including retirement plan investments) and gains and/or declines in the stock market.
The value of investments in employer-sponsored retirement plans increased substantially between CYs 1977 and 2007; however, retirement income is subject to stock market fluctuations
The value of employer-sponsored retirement plans is comprised of contributions to the plan plus earnings received from investments less any disbursements for costs to administer the plan and any disbursements made to plan participants. Between CYs 1977 and 2007, the total value of employer-sponsored retirement plans grew substantially from approximately $325 billion in CY 1977 to more than $6 trillion in CY 2007. Much of the growth in the value of employer-sponsored retirement plans can be attributed to increased participation of workers between the ages of 18 and 64 years mentioned earlier in this report, as well as significant returns from investments during the 30-year period. This is good news for those saving for retirement, as the increased value of plan assets generally equates to additional income upon retirement.
The value of retirement plan assets per plan participant generally increased steadily between CYs 1977 and 2007, with the exception of one period between CYs 1997 and 2002 where the value per participant declined. While we cannot draw a definite conclusion, the decline between CYs 1997 and 2002 was more than likely caused by a significant downturn in the information technology sector of the economy during this period.
Figure 6 shows the average value of assets per participant from CYs 1977 through 2007 for both defined benefit and defined contribution plans. At the end of CY 2007, defined benefit plans had an average of almost $63,000 in assets per participant while defined contribution plan participants had an average value of about $42,000. While the increasing value in retirement plan assets between CYs 1977 and 2007 is promising, individuals will most likely need other sources of income, such as Social Security, over the course of their retirement years. The widening gap between defined benefit plan assets and defined contribution plan assets is most likely caused by the shift in retirement plan participants from fewer defined benefit plans to significantly more defined contribution plans. Another factor is that defined benefit plan participants tend to be older on average than participants in defined contribution plans, which has allowed defined benefit plan investments to grow for a longer period of time.

Statistical Trends in Retirement Plans
Page 11
Figure 6: Employer-Sponsored Retirement Plan Assets per Participant by Type of Plan (CYs 1977–2007)
$0
$20,000
$40,000
$60,000
$80,000
Ass
ets
per
Part
icip
ant (
dolla
rs)
Defined Benefit Plan $6,675 $14,325 $21,955 $29,010 $42,969 $39,585 $62,597
Defined Contribution Plan $6,002 $9,572 $13,726 $22,351 $33,304 $29,898 $42,218
Calendar Year 1977
Calendar Year 1982
Calendar Year 1987
Calendar Year 1992
Calendar Year 1997
Calendar Year 2002
Calendar Year 2007
Source: Department of Labor, Employee Benefits Security Administration, January 2010 “Private Pension Plan Bulletin” and February 2009 “Private Pension Plan Bulletin Historical Tables and Graphs.”
See Appendix V, Figures 4, 5, and 6, for trend information on the total amount of employer-sponsored retirement plan assets as well as the total amount of contributions and distributions for employer-sponsored assets.
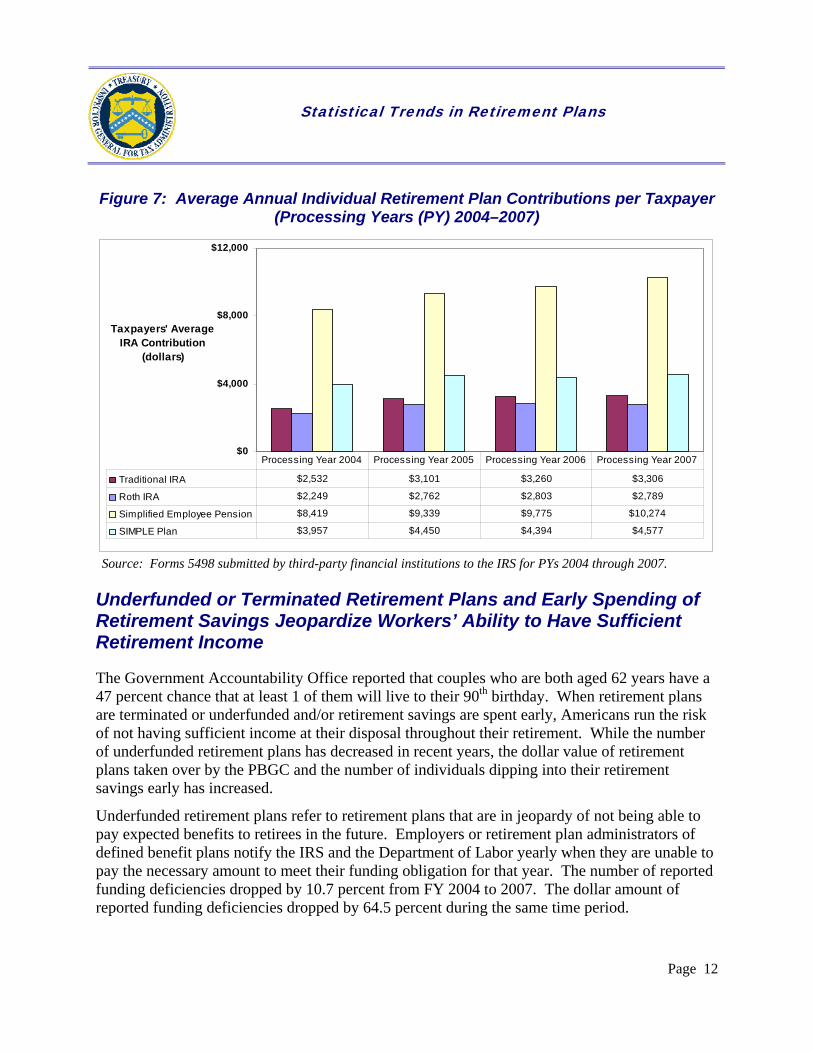
Taxpayers steadily increased contributions to individual retirement plans As shown in Figure 7, using available data from TYs 2004 through 2007, we determined that the amount of annual contributions to different individual retirement plans generally increased during this 4-year period. Individuals who participated in Simplified Employee Pension IRAs consistently saved more than individuals using other types of individual retirement savings plans. There could be several reasons for the gap but it is probably attributed to the fact that the tax code permits taxpayers eligible for Simplified Employee Pension IRAs to make larger contributions than other individual retirement plan options.18 In addition, many of the people choosing the other individual retirement savings options may also be eligible to participate in other employer-sponsored plans.
18 For TY 2009, the maximum contribution an individual could make to a traditional or Roth IRA was $5,000. The maximum contribution an individual could make to a SIMPLE was $11,500. The maximum contribution for a Simplified Employee Pension IRA was the lesser of 25 percent of the employee’s compensation or $49,000.
Statistical Trends in Retirement Plans
Page 12
Figure 7: Average Annual Individual Retirement Plan Contributions per Taxpayer (Processing Years (PY) 2004–2007)
$0
$4,000
$8,000
$12,000
Taxpayers' Average IRA Contribution
(dollars)
Traditional IRA $2,532 $3,101 $3,260 $3,306
Roth IRA $2,249 $2,762 $2,803 $2,789
Simplified Employee Pension $8,419 $9,339 $9,775 $10,274
SIMPLE Plan $3,957 $4,450 $4,394 $4,577
Processing Year 2004 Processing Year 2005 Processing Year 2006 Processing Year 2007
Source: Forms 5498 submitted by third-party financial institutions to the IRS for PYs 2004 through 2007.
Underfunded or Terminated Retirement Plans and Early Spending of Retirement Savings Jeopardize Workers’ Ability to Have Sufficient Retirement Income
The Government Accountability Office reported that couples who are both aged 62 years have a 47 percent chance that at least 1 of them will live to their 90th birthday. When retirement plans are terminated or underfunded and/or retirement savings are spent early, Americans run the risk of not having sufficient income at their disposal throughout their retirement. While the number of underfunded retirement plans has decreased in recent years, the dollar value of retirement plans taken over by the PBGC and the number of individuals dipping into their retirement savings early has increased.
Underfunded retirement plans refer to retirement plans that are in jeopardy of not being able to pay expected benefits to retirees in the future. Employers or retirement plan administrators of defined benefit plans notify the IRS and the Department of Labor yearly when they are unable to pay the necessary amount to meet their funding obligation for that year. The number of reported funding deficiencies dropped by 10.7 percent from FY 2004 to 2007. The dollar amount of reported funding deficiencies dropped by 64.5 percent during the same time period.

Statistical Trends in Retirement Plans
Page 13
While the number of underfunded plans decreased between FYs 2004 and 2007, the dollar amount of retirement plans taken over by the PBGC has been increasing rapidly. In October 2009 Senate testimony,19 the Government Accountability Office noted the rapid increase in assets and liabilities the PBGC took over for defined benefit plans.20 Through the second quarter of FY 2009, the PBGC’s deficit21 was $33 billion, which was triple the $11 billion deficit at the end of FY 2008. However, just 10 years earlier the PBGC’s deficit was $39 million, .1 percent of the current deficit.
The large increase in this deficit is the result of the PBGC assuming responsibility for several very large defined benefit plans. For example, in August 2009, the PBGC assumed responsibility for six plans of one employer. Collectively, these plans covered more than 70,000 employees and were underfunded by $7 billion, of which the PBGC was responsible for $6.7 billion, putting further financial strain on the PBGC’s rapidly increasing deficit.
Another way that retirement plan savings can be put in jeopardy is if funds invested for retirement are withdrawn early. This is known as leakage (hereafter referred to as early withdrawal). According to the Census Bureau’s Survey of Income and Program Participation studies in CYs 1998, 2003, and 2006, approximately 15 percent of participants in employer-sponsored defined contribution plans made early withdrawals22 from their retirement plans in each of these 3 years.
Individual retirement plans can also experience early withdrawals that will reduce the amount of income available for future retirement and result in additional tax. In general, taxpayers making early withdrawals must file Additional Taxes on Qualified Plans (Including IRAs) and Other Tax-Favored Accounts (Form 5329) to report taxes due. For tax returns that were processed during PYs 2006 through 2009, we obtained data for the total number of taxpayers who reported additional tax as well as the aggregate amount of additional tax due.23 Figure 8 shows that the number of taxpayers withdrawing funds early from retirement plans is steadily increasing. The IRS processed 900,000 more Forms 5329 in PY 2009 than in PY 2006 (an increase of 18 percent). This equates to an associated $1.25 billion (32 percent) increase in total additional tax and loss of income on these funds had they not been withdrawn.
19 Pension Benefit Guaranty Corporation: Workers and Retirees Experience Delays and Uncertainty When Underfunded Plans are Terminated (GAO-10-181T, dated October 2009). 20 Most participants of terminated plans are entitled to receive the full amount of benefits they earned under their plans, except that they receive retirement benefits from the PBGC instead of their former employer. In such cases, the calculation of an estimated benefit is straightforward. However, some participants may have their benefits reduced to comply with certain limits specified under the Employee Retirement Income Security Act and related regulations. 21 The PBGC’s deficit is the resulting difference between its assets and liabilities. 22 A withdrawal is considered to be early if made prior to age 59½. 23 We were unable to quantify the total dollar amount of early withdrawals as that data are not captured when processing Forms 5329. However, the total additional tax is based on the amount of the early withdrawal and the individuals’ personal income tax brackets.

Statistical Trends in Retirement Plans
Page 14
Figure 8: Early Withdrawals From Individual Retirement Plans (PYs 2006–2009)
PY Taxpayers Total Additional Tax
Average Tax per Taxpayer
2006 4.86 million $3.97 billion $816 2007 5.10 million $4.40 billion $863 2008 5.53 million $5.10 billion $922 2009 5.75 million $5.22 billion $907
Source: Forms 5329 submitted to the IRS for PYs 2006 through 2009.
As workers approach retirement age, the need for retirement savings becomes more critical because any early withdrawals made in the years immediately preceding retirement provides less time for workers to makeup for the loss in retirement savings. While Social Security is the largest source of retirement income for households with someone aged 65 years or older, other financial assets such as employer-sponsored retirement plan benefits, individual retirement plan savings, and nonfinancial assets such as home equity are important sources of retirement income.
Our analysis revealed that the average age for taxpayers making early withdrawals was 42 years, and the age group “41 to 50 years old” accounted for the largest amount of total additional tax each year due to early withdrawals. The second age group most likely to withdraw funds early was “51 to 60 years old.” This is concerning because these groups have the least amount of time to repay savings prior to retirement. Figure 9 includes a breakdown of the total additional taxes due by taxpayers’ age. As shown in Figure 9, the “41 to 50 years old” group paid nearly $2 billion in additional taxes in PY 2009.

Statistical Trends in Retirement Plans
Page 15
Figure 9: Total Additional Taxes Due Based on Early Withdrawal of Individual Retirement Plan Funds by Age Group (PYs 2006–2009)
$0
$500
$1,000
$1,500
$2,000
2006 2007 2008 2009
Processing Year
Tota
l Add
ition
al T
ax -
Early
With
draw
als
(mill
ions
)
Ages 21-30 Ages 31-40 Ages 41-50 Ages 51-60
Source: Comparison of data from Forms 5329 processed during PYs 2006 through 2009 to taxpayer information on the IRS database of individual taxpayers’ accounts.
See Appendix V, Figure 7, for a more detailed breakdown of data from taxpayers reporting an early withdrawal from retirement savings.
Many Trends Presented in This Report May Change Significantly in the Near Future
During the 2 years following the period of this review, there was a significant downturn in the economy. The recession, which officially began in December 2007, has taken a heavy toll on many taxpayers’ retirement savings. For example, a survey conducted in February and March 2009241showed that 37 percent of full-time employed adults of all ages stated they have thought in the past year about postponing their eventual retirement. This proportion swells to 52 percent among full-time workers aged 50 to 64 years, as well as 16 percent that responded that they never expect to stop working.
In addition, a September 2009 economic survey25 by the Census Bureau showed the recession had plunged 2.6 million more Americans into poverty and eliminated household income gains
241Social and Demographic Trends: Most Middle-Aged Adults Are Rethinking Retirement Plans (Pew Research Center, dated May 2009). 25 Income, Poverty, and Health Insurance Coverage in the United States (P60-236(RV), dated September 2009).

Statistical Trends in Retirement Plans
Page 16
from an entire decade. However, there is evidence of a reversal in the recent downward economic trends. In April 2010 testimony263before Congress, the Chairman of the Federal Reserve Bank forecasted a moderate economic recovery. The Chairman added, however, that if the pace of recovery is moderate (as expected), it will require a significant amount of time to restore the 8.5 million jobs lost over the past 2 years.
There were several other legislative changes being considered at the end of our fieldwork, which if enacted, will significantly affect some of the trends presented in this report. For example, Congress has introduced legislation that would create a mandatory retirement system of automatic payroll deduction for individual retirement plans. Under this legislation, employers with 10 or more employees who have been in business for 2 years and offer no retirement plan would be required to offer payroll deduction IRAs. Other legislation being discussed includes a tax credit being offered to young workers who contribute to retirement plans.
Given the instability in investments in recent years, the resulting impact on retirement plans, and the legislative changes being considered by Congress, a followup review of trends noted in this report will be needed to show the full impact of the recent economic downturn, resulting recovery, and changes due to legislation.
263Statement by Chairman, Board of Governors of the Federal Reserve System, before the Joint Economic Committee, U.S. Congress (dated April 2010).
Statistical Trends in Retirement Plans
Page 17
Appendix I
Detailed Objective, Scope, and Methodology
The overall objective of this review was to identify retirement plan trends based on a wide range of statistical indicators. To accomplish this objective, we:
I. Analyzed data available from IRS files, including information regarding individual retirement plan contributions, distributions, early withdrawals, and taxes on early withdrawals.
II. Obtained and analyzed data available from non-IRS sources within the Federal Government, including the Department of Labor, the PBGC, the Census Bureau, and the Government Accountability Office.
III. Identified key high-level trends based on data gathered in Steps I and II.
A. Analyzed data from IRS and non-IRS sources to determine trends in employer-sponsored retirement plans (participation, contributions, disbursements, and total assets).
B. Analyzed tax return data from IRS sources to determine trends in individual retirement plans.
C. Evaluated trends associated with the economic risk that retirement plans have experienced by analyzing PBGC information to determine the number of retirement plans and associated plan participants insured by the PBGC, number of plans that the PBGC took over, and amount of claims paid from terminated plans.
Internal controls methodology
Internal controls relate to management’s plans, methods, and procedures used to meet their mission, goals, and objectives. Internal controls include the processes and procedures for planning, organizing, directing, and controlling program operations. They include the systems for measuring, reporting, and monitoring program performance. Because the scope of this audit focused on the development of statistical trends from IRS and non-IRS data, we did not perform a full assessment of internal controls. Within the context of our audit objective, we determined that internal controls related to the reliability of information were relevant. We evaluated these controls by performing general validation tests to provide reasonable assurance that IRS data were accurate, complete, and reliable. Because we did not have access to source data or systems producing the data, we did not independently verify data we obtained from non-IRS sources.

Statistical Trends in Retirement Plans
Page 18
Appendix II
Major Contributors to This Report
Nancy A. Nakamura, Assistant Inspector General for Audit (Management Services and Exempt Organizations) Troy D. Paterson, Director James V. Westcott, Audit Manager Steve T. Myers, Lead Auditor Andrew J. Burns, Senior Auditor Stephen A. Elix, Auditor
Statistical Trends in Retirement Plans
Page 19
Appendix III
Report Distribution List
Commissioner C Office of the Commissioner – Attn: Chief of Staff C Deputy Commissioner for Services and Enforcement SE Deputy Commissioner, Tax Exempt and Government Entities Division SE:T Director, Employee Plans, Tax Exempt and Government Entities Division SE:T:EP Chief Counsel CC National Taxpayer Advocate TA Director, Office of Legislative Affairs CL:LA Director, Office of Program Evaluation and Risk Analysis RAS:O Office of Internal Control OS:CFO:CPIC:IC Audit Liaison: Director, Communications and Liaison, Tax Exempt and Government Entities Division SE:T:CL

Statistical Trends in Retirement Plans
Page 20
Appendix IV
Selected Information Regarding Federal Government Retirement Plans
Civil Service Retirement System
The Civil Service Retirement Act1 established the Civil Service Retirement System for certain Federal employees. The Civil Service Retirement System is a defined benefit, contributory retirement system whereby employees contribute a percentage of their pay and their employing agency matches the employees’ contribution. Future benefits are based on employees’ years of service and earnings over the course of their careers. In general, employees must wait until they reach age 55 to receive full benefits and could be subject to a reduced annuity if they retire at an earlier age.2
Federal Employees Retirement System
The Civil Service Retirement System was replaced by the Federal Employees Retirement System for Federal employees who began their Federal careers after January 1, 1984.3 The Federal Employees Retirement System is a defined contribution plan that provides benefits from three different sources.
• A basic benefit which is based on employee contributions and matching contributions by the agency. This is similar to the defined benefit aspect of the Civil Service Retirement System but at a much lower amount.
• Social Security.
• The Thrift Savings Plan, a tax deferred retirement savings and investment plan for which retirement income depends on contributions made by employees or their agencies during their working years.
Two of the three parts of the Federal Employees Retirement System (Social Security and the Thrift Savings Plan) are “portable” as employees can take those funds to their next job if they leave the Federal Government before retirement.
1 5 United States Code Section (§) 8331-8351, P.L. 77-411, § 7, 56 Stat. 13, 16. 2 In some cases, employees can retire prior to age 55 without being subject to an annuity reduction. These include employees who retire because of a disability or under special provisions for law enforcement officers. 3 The Federal Employees Retirement System program did not become effective until January 1, 1987. An interim plan was in effect from January 1, 1984, through December 1, 1986, and any employee hired during that period received credit for all service toward the Federal Employees Retirement System.

Statistical Trends in Retirement Plans
Page 21
As with private-sector employer-sponsored retirement plans, there has been a marked shift in the number of employees covered under defined benefit and defined contribution plans. Figure 1 shows the shift from the Civil Service Retirement System to the Federal Employees Retirement System. Between FYs 1987 and 2007, the total number of employees under the Civil Service Retirement System dropped 1.5 million (35 percent) while employees covered by the Federal Employees Retirement System increased 1.6 million (200 percent).
Figure 1: Federal Employees Retirement Plans Participation (FYs 1987–2007)
3.22.8
3.5
4.04.3
2.4
2.01.71.4
0.8
3.5 3.6
3.43.63.8
0
1
2
3
4
5
1987 1992 1997 2002 2007
Fiscal Year
Fede
ral E
mpl
oyee
s R
etire
men
t Pla
nsPa
rtic
ipan
ts (m
illio
ns)
Civil Service Retirement System Federal Employees Retirement System Military
Source: EBRI Databook on Employee Benefits, Federal Government Retirement Plans (Employee Benefit Research Institute, dated January 2009).
Figure 2 shows the correspondingly large increase in Federal Employees Retirement System assets over the last 20 years as new employees covered by the Federal Employees Retirement System have entered Federal employment. For example, while Civil Service Retirement System assets increased $253 billion (145 percent) during this period, assets for the Federal Employees Retirement System increased at a far more accelerated rate from $4 billion to $282 billion (6,950 percent).

Statistical Trends in Retirement Plans
Page 22
Figure 2: Federal Employees Retirement Plans Assets (FYs 1987–2007)
$344
$428$417
$256
$175
$282
$162
$83$32
$4
$218
$177
$143$106
$39
$-
$100
$200
$300
$400
$500
1987 1992 1997 2002 2007
Fiscal Year
Fede
ral E
mpl
oyee
s R
etire
men
t Pla
ns A
sset
s (b
illio
ns)
Civil Service Retirement System Federal Employees Retirement System Military
Source: EBRI Databook on Employee Benefits, Federal Government Retirement Plans (Employee Benefit Research Institute, dated January 2009).
Both Civil Service Retirement System and Federal Employees Retirement System employees may contribute to the Thrift Savings Plan; however, Federal Employees Retirement System employees can receive matching funds from the Federal Government for up to 5 percent of their salary. For Federal employees under the Federal Employees Retirement System, the Thrift Savings Plan is an integral part of their overall retirement savings. Figure 3 shows there was significant growth in participation, contributions, and total assets between FYs 1987 and 2007. In large part, the increases in contributions occurred over the past 10 years as the number of participants increased substantially.

Statistical Trends in Retirement Plans
Page 23
Figure 3: Participation, Contributions, Total Benefits Paid, and Net Assets for the Thrift Savings Plan (FYs 1987–2007)
Statistic FY 1987 FY 1992 FY 1997 FY 2002 FY 2007
Percentage Increase
(FYs 1987–2007)
Total Participation (in millions)
0.99 1.92 2.30 2.96 3.80 283.8%
Employee Contributions (in millions)
$29.5 $109.4 $191.1 $381.2 $702.9 2,282.7%
Employer Contributions (in millions)
$10.6 $51.0 $87.7 $141.9 $220.6 1,981.1%
Total Benefits Paid (in
billions)41 $1.0 $2.4 $7.9
Net Assets (in billions) $1.1 $16.2 $60.7 $102.3 $231.6 20,954.5%
Source: Thrift Savings Plan Financial Statements, Federal Retirement Thrift Investment Board.
41From the inception of the Thrift Savings Plan on April 1, 1987, through the end of FY 1992, benefits paid were less than $0.5 billion.

Statistical Trends in Retirement Plans
Page 24
Appendix V
Detailed Charts of Statistical Information
The following charts are included to provide additional trends regarding employer-sponsored and individual retirement plans.
Total Number of Employer-Sponsored Retirement Plans and Types of Plans
During the 30-year period of CYs 1977 through 2007, there was a major shift from defined benefit plans to defined contribution plans. As shown in Figures 1 and 2, the increase in the number of plans is almost exclusively associated with defined contribution plans. For example, the number of defined benefit plans decreased by nearly 73,000 (59.7 percent) during this period while the number of defined contribution plans increased by nearly 378,000 (134.5 percent). Since CY 1997, defined contribution plans have accounted for more than 90 percent of all employer-sponsored retirement plans in existence.
Figure 1: Total Number of Employer-Sponsored Retirement Plans by Type (CYs 1977–2007)
121,655174,998
163,065
88,62159,499 47,369 48,982
280,972
419,458
569,964
619,714660,542 685,943
658,805
402,627
594,456
733,029 708,335 720,041 733,312 707,787
0
200,000
400,000
600,000
800,000
1977 1982 1987 1992 1997 2002 2007
Calendar Year
Tota
l Em
ploy
er-S
pons
ored
Pla
ns
Defined Benefit Plan Defined Contribution Plan Total
Source: Department of Labor, Employee Benefits Security Administration, January 2010 “Private Pension Plan Bulletin” and February 2009 “Private Pension Plan Bulletin Historical Tables and Graphs.”

Statistical Trends in Retirement Plans
Page 25
Figure 2: Percentage of Defined Benefit Plans and Defined Contribution Plans to Total Employer-Sponsored Retirement Plans (CYs 1977–2007)
30.2% 29.4%22.2%
12.5%8.3% 6.5% 6.9%
69.8% 70.6%77.8%
87.5%91.7% 93.5% 93.1%
0%
20%
40%
60%
80%
100%
1977 1982 1987 1992 1997 2002 2007
Calendar Year
Employer-Sponsored Plans: Percentage Defined Benefit and Defined Contribution
Defined Benefit Plan Defined Contribution Plan
Source: Department of Labor, Employee Benefits Security Administration, January 2010 “Private Pension Plan Bulletin” and February 2009 “Private Pension Plan Bulletin Historical Tables and Graphs.”
Individual Retirement Plans: Participation and Additional Taxes on Withdrawals (TYs 2004–2007)
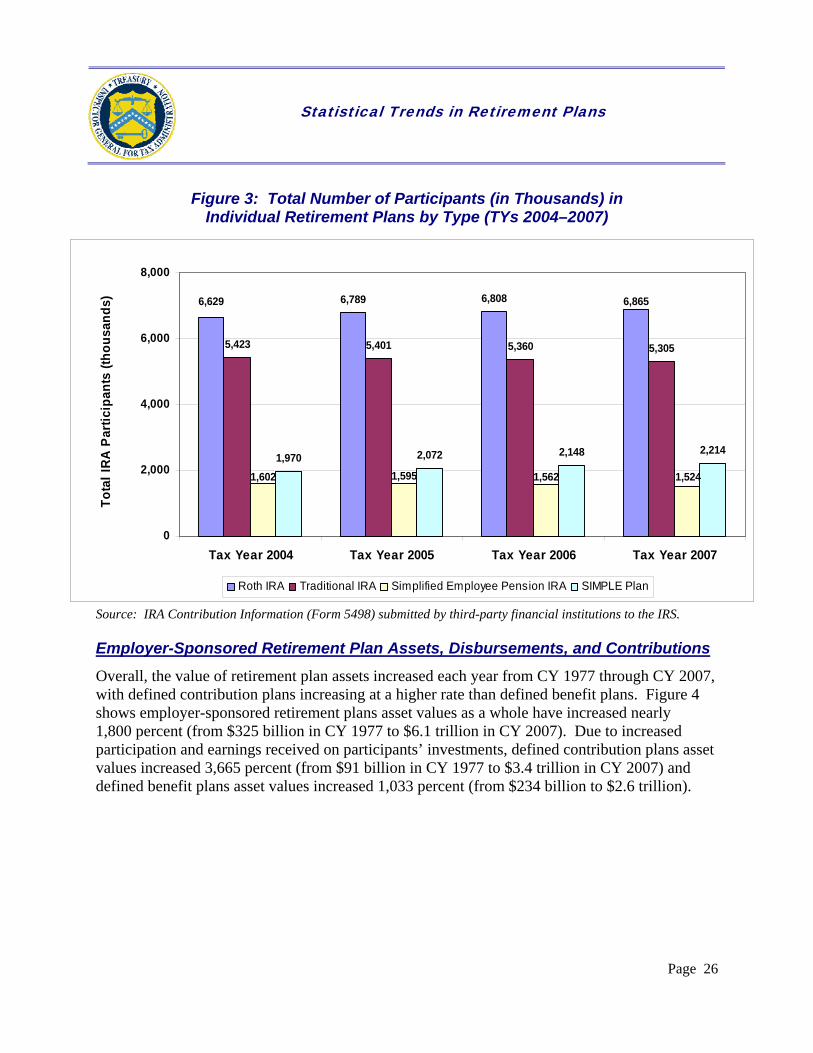
The number of participants in individual retirement plans increased 1.8 percent between TYs 2004 and 2007, from 14.88 million to 15.14 million.1 As shown in Figure 3, participation increased for two types of individual retirement plans and decreased for two others.
• Roth IRA participation increased by 3.6 percent, from approximately 6.6 million in TY 2004 to approximately 6.9 million in TY 2007.
• Traditional IRA participation decreased by 2.2 percent, from approximately 5.4 million in TY 2004 to approximately 5.3 million in TY 2007.
• Simplified Employee Pension IRA participation decreased by 4.9 percent, from approximately 1.6 million in TY 2004 to approximately 1.5 million in TY 2007.
• SIMPLE participation increased by 12.4 percent, from approximately 2.0 million in TY 2004 to approximately 2.2 million in TY 2007.
1 Total participants for the specific types of individual retirement arrangements will exceed the total number of participants for individual retirement plans because some taxpayers participated in more than one type of plan.
Statistical Trends in Retirement Plans
Page 26
Figure 3: Total Number of Participants (in Thousands) in Individual Retirement Plans by Type (TYs 2004–2007)
6,789 6,808
5,423 5,401 5,360 5,305
1,970 2,072 2,148 2,214
6,8656,629
1,602 1,595 1,562 1,524
0
2,000
4,000
6,000
8,000
Tax Year 2004 Tax Year 2005 Tax Year 2006 Tax Year 2007
Tota
l IRA
Par
ticip
ants
(tho
usan
ds)
Roth IRA Traditional IRA Simplified Employee Pension IRA SIMPLE Plan
Source: IRA Contribution Information (Form 5498) submitted by third-party financial institutions to the IRS.
Employer-Sponsored Retirement Plan Assets, Disbursements, and Contributions
Overall, the value of retirement plan assets increased each year from CY 1977 through CY 2007, with defined contribution plans increasing at a higher rate than defined benefit plans. Figure 4 shows employer-sponsored retirement plans asset values as a whole have increased nearly 1,800 percent (from $325 billion in CY 1977 to $6.1 trillion in CY 2007). Due to increased participation and earnings received on participants’ investments, defined contribution plans asset values increased 3,665 percent (from $91 billion in CY 1977 to $3.4 trillion in CY 2007) and defined benefit plans asset values increased 1,033 percent (from $234 billion to $2.6 trillion).

Statistical Trends in Retirement Plans
Page 27
Figure 4: Employer-Sponsored Retirement Plans Asset Values (in Millions) by Type (CYs 1977–2007)
$0
$1,000,000
$2,000,000
$3,000,000
$4,000,000
$5,000,000
$6,000,000
$7,000,000
Tota
l Ass
ets
(mill
ions
)
Defined Benefit Plan $233,609 $553,419 $877,269 $1,146,798 $1,735,604 $1,665,657 $2,646,603Defined Contribution Plan $91,465 $235,567 $525,219 $947,289 $1,818,152 $1,951,596 $3,443,870Total $325,074 $788,986 $1,402,488 $2,094,087 $3,553,756 $3,617,253 $6,090,473
Calendar Year 1977
Calendar Year 1982
Calendar Year 1987
Calendar Year 1992
Calendar Year 1997
Calendar Year 2002
Calendar Year 2007
Source: Department of Labor, Employee Benefits Security Administration, January 2010 “Private Pension Plan Bulletin” and February 2009 “Private Pension Plan Bulletin Historical Tables and Graphs.”
As shown in Figure 5, the pattern of disbursements from CY 1977 through CY 2007 illustrates the shift from defined benefit plans to defined contribution plans. For example, in CY 1977, defined benefit plans disbursed more funds than defined contribution plans. Although defined benefit plan disbursements increased 941 percent between CYs 1977 and 2007 (from $15 billion to $159 billion), defined contribution plan disbursements increased more than 3,700 percent (from $8 billion to $294 billion) during this same period.

Statistical Trends in Retirement Plans
Page 28
Figure 5: Employer-Sponsored Retirement Plan Disbursements (in Millions) by Type (CYs 1977–2007)
$0
$100,000
$200,000
$300,000
$400,000
$500,000
Empl
oyer
-Spo
nsor
ed R
etire
men
t Pla
ns D
isbu
rsem
ents
(mill
ions
)
Defined Benefit Plan $15,249 $33,875 $66,241 $77,853 $97,213 $135,824 $158,741
Defined Contribution Plan $7,702 $21,432 $56,013 $74,588 $135,266 $178,740 $294,105
Total $22,951 $55,307 $122,254 $152,441 $232,479 $314,564 $452,846
Calendar Year 1977
Calendar Year 1982
Calendar Year 1987
Calendar Year 1992
Calendar Year 1997
Calendar Year 2002
Calendar Year 2007
Source: Department of Labor, Employee Benefits Security Administration, January 2010 “Private Pension Plan Bulletin” and February 2009 “Private Pension Plan Bulletin Historical Tables and Graphs.”
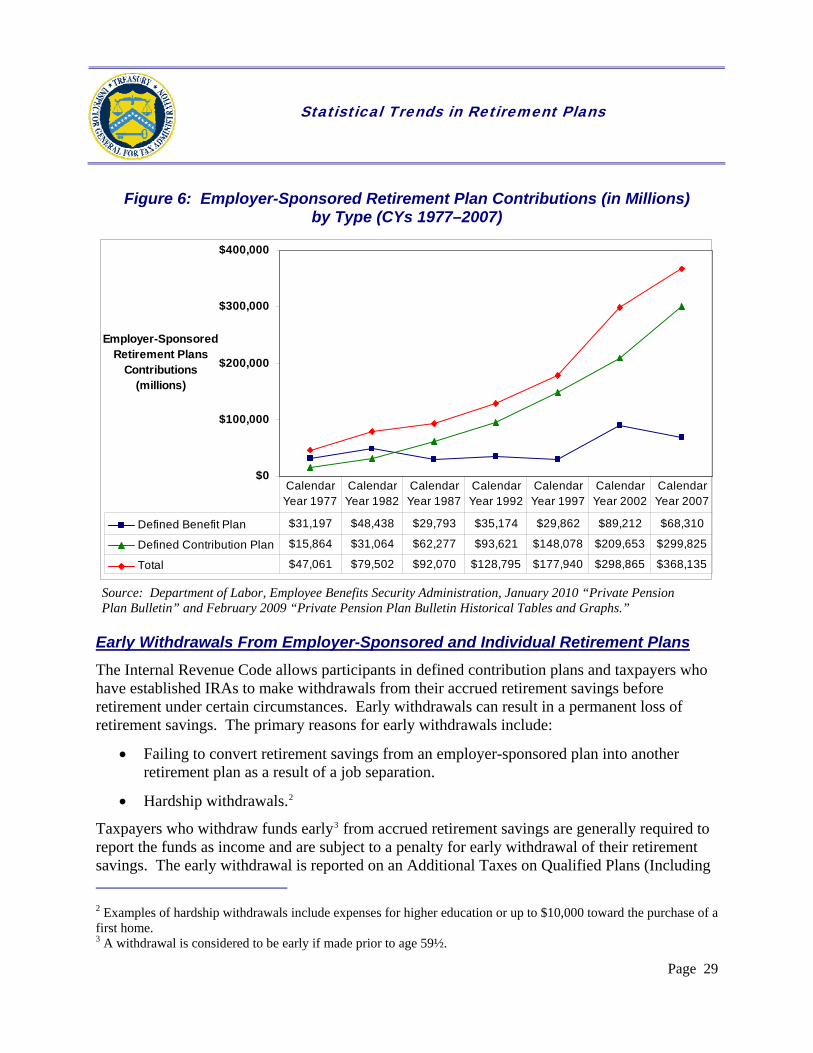
Figure 6 shows that, from CY 1977 through CY 2007, total contributions to employer-sponsored retirement plans increased $321 billion (683 percent), from $47 billion to $368 billion. This is mostly attributable to defined contribution plans, for which contributions increased $284 billion (nearly 1,800 percent). In contrast, contributions for defined benefit plans increased only $37 billion (119 percent) during this same period.
Statistical Trends in Retirement Plans
Page 29
Figure 6: Employer-Sponsored Retirement Plan Contributions (in Millions) by Type (CYs 1977–2007)
$0
$100,000
$200,000
$300,000
$400,000
Employer-Sponsored Retirement Plans
Contributions (millions)
Defined Benefit Plan $31,197 $48,438 $29,793 $35,174 $29,862 $89,212 $68,310
Defined Contribution Plan $15,864 $31,064 $62,277 $93,621 $148,078 $209,653 $299,825
Total $47,061 $79,502 $92,070 $128,795 $177,940 $298,865 $368,135
Calendar Year 1977
Calendar Year 1982
Calendar Year 1987
Calendar Year 1992
Calendar Year 1997
Calendar Year 2002
Calendar Year 2007
Source: Department of Labor, Employee Benefits Security Administration, January 2010 “Private Pension Plan Bulletin” and February 2009 “Private Pension Plan Bulletin Historical Tables and Graphs.”
Early Withdrawals From Employer-Sponsored and Individual Retirement Plans The Internal Revenue Code allows participants in defined contribution plans and taxpayers who have established IRAs to make withdrawals from their accrued retirement savings before retirement under certain circumstances. Early withdrawals can result in a permanent loss of retirement savings. The primary reasons for early withdrawals include:
• Failing to convert retirement savings from an employer-sponsored plan into another retirement plan as a result of a job separation.
• Hardship withdrawals.2
Taxpayers who withdraw funds early3 from accrued retirement savings are generally required to report the funds as income and are subject to a penalty for early withdrawal of their retirement savings. The early withdrawal is reported on an Additional Taxes on Qualified Plans (Including 2 Examples of hardship withdrawals include expenses for higher education or up to $10,000 toward the purchase of a first home. 3 A withdrawal is considered to be early if made prior to age 59½.

Statistical Trends in Retirement Plans
Page 30
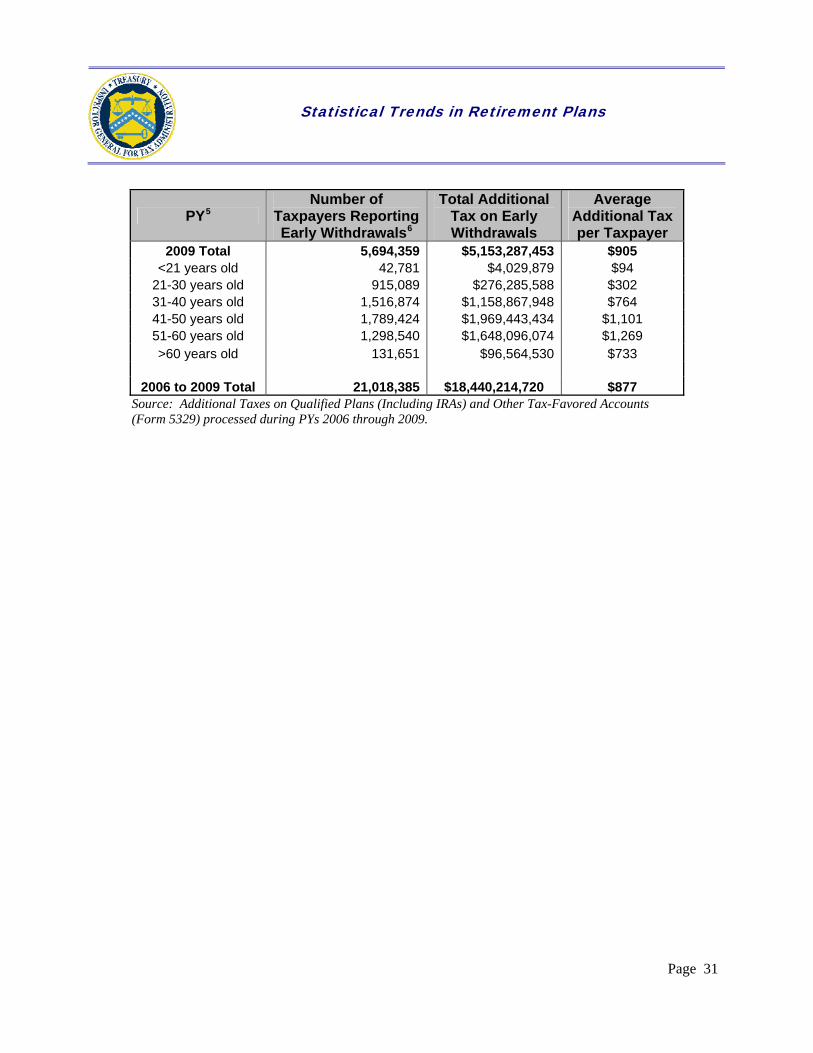
IRAs) and Other Tax-Favored Accounts (Form 5329). Figure 7 provides a breakdown of data from Forms 5329 that were processed from PYs 2006 through 2009. Specifically, it shows the number of taxpayers who withdrew funds prior to retirement and the amount of additional tax that was paid as a result of the early withdrawal. We also provide a more detailed breakdown based on the age of the primary taxpayer listed on the U.S. Individual Income Tax Return (Form 1040).4
Figure 7: Early Withdrawal of Individual Retirement Plan Savings by Age of Primary Taxpayer (PYs 2006 - 2009)
PY5 Number of
Taxpayers Reporting Early Withdrawals6
Total Additional Tax on Early Withdrawals
Average Additional Tax per Taxpayer
2006 Total 4,800,689 $3,905,322,141 $813 <21 years old 29,880 $3,247,266 $109
21-30 years old 749,792 $248,660,506 $332 31-40 years old 1,361,859 $958,850,978 $704 41-50 years old 1,531,790 $1,483,375,573 $968 51-60 years old 1,020,695 $1,132,353,040 $1,109 >60 years old 106,673 $78,834,778 $739
2007 Total 5,050,786 $4,345,780,992 $860
<21 years old 36,569 $3,754,582 $103 21-30 years old 822,937 $269,512,524 $328 31-40 years old 1,404,215 $1,058,693,330 $754 41-50 years old 1,588,131 $1,649,768,010 $1,039 51-60 years old 1,082,941 $1,276,399,475 $1,179 >60 years old 115,993 $87,653,071 $756
2008 Total 5,472,551 $5,035,824,134 $920
<21 years old 42,550 $4,378,007 $103 21-30 years old 892,400 $303,366,224 $340 31-40 years old 1,501,050 $1,216,088,741 $810 41-50 years old 1,727,108 $1,926,922,326 $1,116 51-60 years old 1,190,889 $1,495,416,858 $1,256 >60 years old 118,554 $89,651,978 $756
4 Data used to determine a taxpayer’s age were taken from the IRS Individual Master File, the IRS database that maintains transactions or records of individual tax accounts. 5 The year in which tax returns and other tax data are processed. 6 The total number of taxpayers and additional tax do not match the data in Figure 8 on page 14 of this report because some accounts analyzed did not have date of birth information available and, therefore, were not included in Figure 7.
Statistical Trends in Retirement Plans
Page 31
PY5 Number of
Taxpayers Reporting Early Withdrawals6
Total Additional Tax on Early Withdrawals
Average Additional Tax per Taxpayer
2009 Total 5,694,359 $5,153,287,453 $905 <21 years old 42,781 $4,029,879 $94
21-30 years old 915,089 $276,285,588 $302 31-40 years old 1,516,874 $1,158,867,948 $764 41-50 years old 1,789,424 $1,969,443,434 $1,101 51-60 years old 1,298,540 $1,648,096,074 $1,269 >60 years old 131,651 $96,564,530 $733
2006 to 2009 Total 21,018,385 $18,440,214,720 $877
Source: Additional Taxes on Qualified Plans (Including IRAs) and Other Tax-Favored Accounts (Form 5329) processed during PYs 2006 through 2009.
![OFFICE OF INSPECTOR GENERAL - RRB.Gov1].pdf · The Railroad Retirement Board, Office of Inspector General conducted an audit to assess the adequacy of the selected business process](https://static.fdocuments.net/doc/165x107/5e9631b32de1e9515f018ab3/office-of-inspector-general-rrbgov-1pdf-the-railroad-retirement-board-office.jpg)


![OFFICE OF INSPECTOR GENERAL - RRB1].pdf · The RRB administers the retirement/survivor and unemployment/sickness insurance benefit programs for railroad workers and their families](https://static.fdocuments.net/doc/165x107/603d8bd5eb351313566add57/office-of-inspector-general-rrb-1pdf-the-rrb-administers-the-retirementsurvivor.jpg)


![OFFICE OF INSPECTOR GENERAL - RRB1].pdf · Report No. 17-04 . April 11, 2017 . RAILROAD RETIREMENT BOARD . i . EXECUTIVE SUMMARY. Background . The Office of Inspector General (OIG)](https://static.fdocuments.net/doc/165x107/5f07326d7e708231d41bca0c/office-of-inspector-general-rrb-1pdf-report-no-17-04-april-11-2017-railroad.jpg)