Transverse Thermoelectric Effects for Cooling and Heat Flux Sensing
120
Transverse Thermoelectric Effects for Cooling and Heat Flux Sensing By Brooks Samuel Mann Thesis submitted to the Faculty of the Virginia Polytechnic Institute and State University in partial fulfillment of the requirements for the degree of Master of Science in Mechanical Engineering Approved: ___________________________________ Scott T. Huxtable, Advisor ___________________________________ Elaine P. Scott, Committee Member ___________________________________ Thomas E. Diller, Committee Member June 16, 2006 Blacksburg, Virginia Keywords: transverse thermoelectrics, cooling, heat flux sensing, semiconductor, bismuth telluride, Seebeck, Peltier, anisotropy
Transcript of Transverse Thermoelectric Effects for Cooling and Heat Flux Sensing

Transverse Thermoelectric Effects for Cooling and
Heat Flux Sensing
By
Brooks Samuel Mann
Thesis submitted to the Faculty of the
Virginia Polytechnic Institute and State University
in partial fulfillment of the requirements for the degree of
Master of Science
in
Mechanical Engineering
Approved:
___________________________________
Scott T. Huxtable, Advisor
___________________________________
Elaine P. Scott, Committee Member
___________________________________
Thomas E. Diller, Committee Member
June 16, 2006
Blacksburg, Virginia
Keywords: transverse thermoelectrics, cooling, heat flux sensing, semiconductor,
bismuth telluride, Seebeck, Peltier, anisotropy

ii
Transverse Thermoelectric Effects for Cooling and
Heat Flux Sensing
Brooks Samuel Mann
(Abstract)
While thermoelectric technology has developed steadily over the last 50 years,
transverse thermoelectrics have generally been ignored in the industrial and commercial
uses of thermoelectric devices to date. This project focuses on investigating transverse
thermoelectric effects for localized cooling and heat flux sensing. Thermoelectric
cooling devices are useful when their advantages (small size, solid state, active
temperature control) outweigh their relatively poor efficiency. Transverse heat flux
sensors, which generate an electric field in a direction orthogonal to the heat flow, have
the advantage that the signal depends on the length of the device rather than the
thickness. Thus, they can be made very thin for fast response times while maintaining a
large signal.
A prototype transverse device was built out of bulk samples of bismuth and
bismuth telluride, which are common thermoelectric materials. The device was
constructed of alternating layers of the constituent materials to simulate the effects of an
intrinsically anisotropic material. The device was tested for its cooling and heat flux
sensing capabilities, and the results of this testing were compared to predicted values.
Although the device failed to demonstrate cooling, its heat flux sensing capabilities were
promising. The device was tilted to several angles of inclination between 44° and 84°
from horizontal, and the output voltage was recorded for several values of heat flux. The
signal strength varied between 190.2 and 2321.6 µV/(W/cm2), at inclination angles of 84°
and 44°, respectively. The results followed the trend of the predicted values well, but the
magnitude of the output voltage was significantly lower than expected. An uncertainty
analysis was performed, and it was determined that the most likely source of error was
the uncertainty in the amount of heat flux that went through the device during testing.
This thesis outlines the process of building and testing the device, and the analysis
of the results. Recommendations for future work are also given.

iii
Acknowledgements
I would like to thank Dr. Scott Huxtable, my advisor, for the opportunity to
perform this research. His constant support and advice helped me to solve the problems
and overcome the obstacles I encountered throughout the process. I also greatly
appreciate the help and support of Dr. Elaine Scott and Dr. Thomas Diller, the other
members of my committee. Many friends and fellow students provided technical and
organizational advice, including Nitin Shukla, Manu Mital, Jerrod Ewing, Christian
James, and Andrew Gifford. The faculty, staff, and students of the Center for Power
Electronics (CPES) also deserve thanks for technical advice and for the annual
conferences that added greatly to my engineering knowledge and professional skills.
This project was funded primarily through CPES by the ERC Program of the National
Science Foundation (NSF) under Award Number EEC-9731677.
Many friends have provided companionship and encouragement during my six
years at Virginia Tech, which is greatly appreciated. Finally, I would like to thank my
family for their unwavering support and interest in my studies throughout my coursework
and research. Without the support of my family I doubt I could have made it this far.

iv
Table of Contents
Abstract ............................................................................................................................... ii
Acknowledgements ............................................................................................................ iii
Table of Contents ............................................................................................................... iv
List of Figures ...................................................................................................................vii
List of Tables...................................................................................................................... xi
Chapter 1 – Introduction .................................................................................................. 1
1.1 Motivation ........................................................................................................... 1
1.2 Thermoelectric Cooling Devices......................................................................... 1
1.3 Heat Flux Sensors and Power Generators ........................................................... 3
1.4 Summary and Achievements of the Project ........................................................ 4
1.5 Thesis Outline ..................................................................................................... 5
Chapter 2 – Background .................................................................................................. 6
2.1 A Brief History of Thermoelectrics .................................................................... 6
2.2 Review of the Applications of Thermoelectrics.................................................. 8
2.3 The Transverse Seebeck and Peltier Effects ..................................................... 11
2.4 Anisotropy: Intrinsic vs. Artificial .................................................................... 13
2.5 The History of Transverse Thermoelectric Studies........................................... 14
2.6 Summary ........................................................................................................... 19
Chapter 3 – Construction of the Device and Test Procedures .................................... 20
3.1 Material Selection ............................................................................................. 20
3.2 Early Measurements.......................................................................................... 21
3.2.1 Experimental Setup and Components .................................................. 21

v
3.2.2 Thermoelectric Cooling Capabilities of Bi2Te3 Samples..................... 22
3.2.3 Heat Flux Sensing Capabilities of Bi2Te3 Samples.............................. 24
3.3 Construction of the device................................................................................. 26
3.3.1 Construction of Material Layers .......................................................... 26
3.3.2 Interface Materials................................................................................ 27
3.4 Test Setup and Procedures ................................................................................ 33
3.4.1 Initial Test Setup .................................................................................. 33
3.4.2 Adjustments to Test Setup ................................................................... 34
3.5 Data Collection and Analysis............................................................................ 38
3.6 Summary ........................................................................................................... 39
Chapter 4 – Results and Analysis .................................................................................. 40
4.1 Expected Results ............................................................................................... 40
4.2 Results for α = 77° ............................................................................................ 42
4.3 Results for All Angles ....................................................................................... 44
4.4 Comparing Measured Data with Calculated Values ......................................... 49
4.4.1 Outline of Governing Equations .......................................................... 49
4.4.2 Characterization of Device Geometry.................................................. 53
4.4.3 Comparing the Actual Data to the Calculated Curve........................... 54
4.4.4 Possible Sources of Error ..................................................................... 55
4.5 Uncertainty Analysis ......................................................................................... 56
4.5.1 Uncertainty in Material Properties and Geometry ............................... 57
4.5.2 Uncertainty in Measurements............................................................... 59
4.5.3 Uncertainty in the Measured Heat Flux ............................................... 64
4.5.3.1 Method 1 – Using Temperature Data...................................... 64
4.5.3.2 Method 2 – Simple Analysis of Convective Losses................ 66
4.5.3.3 The Effects of Uncertainty in the Heat Flux ........................... 69
4.6 Alternate Plotting Methods ............................................................................... 71
4.7 Summary ........................................................................................................... 73

vi
Chapter 5 – Conclusions and Recommendations ......................................................... 75
5.1 Summary of Results and Analysis .................................................................... 75
5.2 Achievements of the Project ............................................................................. 76
5.3 Recommendations ............................................................................................. 77
5.4 Conclusions ....................................................................................................... 78
References ......................................................................................................................... 79
Appendix A – Heat Flux Sensing Data ............................................................................. 83
Appendix B – Other Measurements ................................................................................ 103
Appendix C – Pictures of the Device .............................................................................. 106
Vita .................................................................................................................................. 109

vii
List of Figures
Figure 1.1. Three examples of commercially available TECs ........................................... 2
Figure 2.1. A rough sketch of the dependence of
and on the
concentration of free carriers..................................................................................... 8
Figure 2.2. One pair of n- and p-type legs in a traditional thermoelectric cooler ............ 10
Figure 2.3. The material orientations for (a)traditional and
(b)transverse thermoelectric effects ....................................................................... 12
Figure 2.4. The two ways to construct a transverse thermoelectric device...................... 14
Figure 2.5. The device proposed by Babin . in Ref. 9............................................... 16 Figure 3.1. Experimental setup used to measure cooling effects from
bismuth telluride sample ......................................................................................... 22
Figure 3.2. The cooling characteristics of Marlow® model #DT12-4
thermoelectric cooler............................................................................................... 23
Figure 3.3. The results of steady state cooling tests on the sample of
bismuth telluride...................................................................................................... 24
Figure 3.4. The setup for measuring the Seebeck coefficient of the
bismuth telluride sample ......................................................................................... 25
Figure 3.5. Sample data from Seebeck measurements on the Bi2Te3 sample................. 25
Figure 3.6. An overview of the geometry and cutting process used to make
the device layers ...................................................................................................... 27
Figure 3.7. The experimental setup for testing the device for a) cooling
and b) heat flux sensing........................................................................................... 28
Figure 3.8. Photo of test setup used for measuring the heat flux sensing
capabilities of the device ......................................................................................... 29
Figure 3.9. Steady state cooling tests with the device made with carbon paint ............... 29
Figure 3.10. Transient heat flux sensing test of the device made with
carbon paint ............................................................................................................. 30
Figure 3.11. Steady state heat flux sensing tests with the device made with
carbon paint ............................................................................................................. 30
Figure 3.12. Sample data from Seebeck measurements on the device

viii
constructed with silver paint ................................................................................... 31
Figure 3.13. The processes for (a) constructing the initial device and
(b) changing the angle of the device ...................................................................... 32
Figure 3.14. Schematic of the initial setup for measuring heat flux sensing
capabilities............................................................................................................... 34
Figure 3.15. Initial test results with the device constructed with indium film................. 35
Figure 3.16. Modified setup to decrease errors due to convection in ambient air ........... 36
Figure 3.17. Steady state results from the device with = 77°........................................ 37 Figure 3.18. The front panel of the LabVIEW® VI used to record voltage
and temperature data ............................................................................................... 39
Figure 4.1. Transverse device built and tested by Zahner . [R] ................................ 41 Figure 4.2. Heat flux sensing results at different angles from Zahner . [R].............. 41 Figure 4.3. The device constructed with indium film with = 77° ................................. 42
Figure 4.4. All heat flux sensing data from the device with = 77° ............................... 43
Figure 4.5. Least squares fit for the selected data from the device with = 77°............. 44
Figure 4.6. All heat flux sensing data from the device with = 66° ............................... 45
Figure 4.7. Steady state results from all nine angles........................................................ 46
Figure 4.8. Insulation added to the heater ........................................................................ 47
Figure 4.9. The signal from each angled device subjected to a heat flux of 2 W/cm2 ..... 48
Figure 4.10. The length of the device as a function of the angle α .................................. 53
Figure 4.11. The predicted values of signal strength are plotted with the actual data ..... 55
Figure 4.12. The effect of uncertainty on the predicted output voltage of the device ..... 58
Figure 4.13. The result of uncertainty analysis for α = 77° ............................................. 59
Figure 4.14. The result of uncertainty analyses on the measured data............................. 60
Figure 4.15. Comparison of the two methods for finding the uncertainty
in the measured data................................................................................................ 62
Figure 4.16. A hypothetical comparison of the bias in each method ............................... 63
Figure 4.17. Comparison of the data when the heat flux is calculated by
the two methods ...................................................................................................... 65
Figure 4.18. A schematic of the thermocouple placement in the test setup..................... 66
Figure 4.19. Outline of the resistive network when insulation was used......................... 67

ix
Figure 4.20. Outline of the resistive network when insulation was not used................... 68
Figure 4.21. The possible uncertainty in the heat flux that flows through the device ..... 70
Figure 4.22. The comparison of predicted and actual values when calculated as
sensitivities rather than voltages at a certain heater power ..................................... 71
Figure 5.1. The final form of the comparison of actual data and predicted values.......... 76
Figure A.1. All useable heat flux sensing data from each of the nine tested angles........ 83
Figure A.2. All data from steady state heat flux sensing tests with the
angle α = 77° (A)..................................................................................................... 84
Figure A.3. Truncated data from the angle α = 77° (A)................................................... 84
Figure A.4. All data from steady state heat flux sensing tests with the
angle α = 58° (B)..................................................................................................... 87
Figure A.5. Truncated data from the angle α = 58° (B) ................................................... 87
Figure A.6. All data from steady state heat flux sensing tests with the
angle α = 47° (C).................................................................................................... 89
Figure A.7. Truncated data from the angle α = 47° (C) ................................................... 89
Figure A.8. All data from steady state heat flux sensing tests with the
angle α = 59° (D)..................................................................................................... 91
Figure A.9. Truncated data from the angle α = 59° (D)................................................... 91
Figure A.10. All data from steady state heat flux sensing tests with the
angle α = 66° (E) ..................................................................................................... 93
Figure A.11. Truncated data from the angle α = 66° (E) ................................................. 93
Figure A.12. All data from steady state heat flux sensing tests with the
angle α = 44° (F) ..................................................................................................... 95
Figure A.13. Truncated data from the angle α = 44° (F) ................................................. 95
Figure A.14. All data from steady state heat flux sensing tests with the
angle α = 84° (G)..................................................................................................... 97
Figure A.15. Truncated data from the angle α = 84° (G)................................................. 97
Figure A.16. All data from steady state heat flux sensing tests with the
angle α = 65° (H)..................................................................................................... 99
Figure A.17. Truncated data from the angle α = 65° (H)................................................. 99
Figure A.18. All data from steady state heat flux sensing tests with the

x
angle α = 47° (I) .................................................................................................... 101
Figure A.19. Truncated data from the angle α = 47° (I) ................................................ 101
Figure B.1. The temperatures of the top and bottom surfaces of the
device under a changing value of heat flux........................................................... 103
Figure B.2. The voltage and temperature difference associated with the
transient test........................................................................................................... 104
Figure B.3. Steady state data points and the least-squares fit for the
measurement of the Seebeck coefficient of a sample of bismuth ......................... 105
Figure B.4. Steady state data points and the least-squares fit for the
measurement of the Seebeck coefficient of a sample of bismuth telluride........... 105
Figure C.1. A picture of the device with α = 77° (A) .................................................... 106
Figure C.2. A picture of the device with α = 58° (B)..................................................... 106
Figure C.3. A picture of the device with α = 47° (C)..................................................... 106
Figure C.4. A picture of the device with α = 59° (D) .................................................... 107
Figure C.5. A picture of the device with α = 66° (E)..................................................... 107
Figure C.6. A picture of the device with α = 44° (F) ..................................................... 107
Figure C.7. A picture of the device with α = 84° (G) .................................................... 108
Figure C.8. A picture of the device with α = 65° (H) .................................................... 108
Figure C.9. A picture of the device with α = 47° (I) ...................................................... 108

xi
List of Tables
Table 3.1. Thermoelectric properties of bismuth (Bi) and bismuth
telluride (Bi2Te3) [37].............................................................................................. 21
Table 4.1. Steady state results from all nine angles ......................................................... 47
Table 4.2. Summary of the “effective” material properties of the multilayered device
calculated from the properties of the constituent materials..................................... 52
Table 4.3. The effects of uncertainty in material properties on the output
voltage of the device ............................................................................................... 57
Table 4.4. Summary of the uncertainties found using the two methods .......................... 62
Table 4.5. Summary of the results from the analysis of the effects of
convection ............................................................................................................... 69
Table A.1. Comprehensive tabular data from heat flux sensing tests
with α = 77° (A) ...................................................................................................... 85
Table A.2. Comprehensive tabular data from heat flux sensing tests
with α = 58° (B) ...................................................................................................... 88
Table A.3. Comprehensive tabular data from heat flux sensing tests
with α = 47° (C) ...................................................................................................... 90
Table A.4. Comprehensive tabular data from heat flux sensing tests
with α = 59° (D) ...................................................................................................... 92
Table A.5. Comprehensive tabular data from heat flux sensing tests
with α = 66° (E)....................................................................................................... 94
Table A.6. Comprehensive tabular data from heat flux sensing tests
with α = 44° (F) ....................................................................................................... 96
Table A.7. Comprehensive tabular data from heat flux sensing tests
with α = 84° (G) ...................................................................................................... 98
Table A.8. Comprehensive tabular data from heat flux sensing tests
with α = 65° (H) .................................................................................................... 100
Table A.9. Comprehensive tabular data from heat flux sensing tests
with α = 47° (I)...................................................................................................... 102

1
Chapter 1 – Introduction
1.1 Motivation
The initial goal of this project was to develop a transverse thermoelectric device
that could demonstrate cooling and heat flux sensing capabilities. Thermoelectric
applications have been limited due to low efficiency, and the transverse effects exhibit
certain advantages that may lead to better and more useful thermoelectric devices. The
specific application that this project was initially geared towards was a thin-film
transverse thermoelectric device for localized cooling on electronic chips. A device was
built from bulk thermoelectric materials to simulate the characteristics of a thin-film
device, and was tested for its cooling capabilities. However, the device performance
when used as a heat flux sensor was much more promising. A future project may
continue the pursuit of a thin-film device that takes advantage of the transverse effects.
1.2 Thermoelectric Cooling Devices
A thermoelectric cooler is a solid state heat pump that uses the Peltier effect, and
works in conjunction with a heat sink to remove heat from a system. Most applications
that require cooling do not employ thermoelectrics because of the low values of
efficiency that are inherent in thermoelectric coolers (TECs). A TEC requires relatively
large amounts of electrical power in order to produce a cooling effect. In fact, more
conventional systems such as vapor compression refrigeration cycles have as much as a 3
to 1 advantage in efficiency over thermoelectrics [1]. However, TECs can be useful in
cetain applications where the advantages outweigh the disadvantages.
TECs are solid state, and so they produce no noise and require little to no
maintenance. They also are quite small when compared to other systems, and so can be
useful when there is a limited amount of space in a system. Figure 1.1 shows three
examples of commercial TECs made by Marlow®. Despite their small size, these devices

2
can all create temperature differences of around 65 °C [2]. They can also be stacked on
top of each other to create even larger temperature differences. Because of their small
size, TECs can be used for localized cooling, where only a small part of the system needs
to be cooled.
Figure 1.1. Three examples of commercially available TECs. To achieve the maximum temperature difference of 65 °C, the DT12-4 uses 36 W of electrical power, the DT3-6 uses 13 W, and the MI1021T-03AC-09 (right) uses 2.2 W (assuming an ambient temperature of 27°C).
TECs are also useful as “active temperature control” devices. A simple feedback
loop can be used to implement a TEC in a system where a specific temperature is
required, because the temperature of one side of the TEC is directly proportional to the
input power. The “cold” side of the device can be either cooled or heated to the proper
temperature, depending on the direction of the electrical current. As long as the
temperature is within the range of the device, and a proper heat sink / heat source is used
on the other side, the temperature can be controlled quite accurately.
The current applications of TECs are minimal because of the low efficiency
values associated with them. Marlow lists some possible uses of TECs as “temperature
stabilization of bolometers and ferroelectric detectors, laser diode arrays in fiber optic
systems, and maintaining constant viscosity in ink jet printers.” In a more general sense,
TECs can be used where there is limited space, low maintenance is desirable, active
temperature control is needed, or another of the advantages of thermoelectrics can be
applied. Possibly the most widespread current use of TECs is in small refrigerators and

3
beverage coolers. They are much less efficient than other refrigerators and coolers, but
are also much lighter and quieter.
1.3 Heat Flux Sensors and Power Generators
Heat flux sensors are useful in any application where it is important to know
about how and where thermal energy goes. Most industrial processes have some method
of temperature measurement, but in some instances the amount of heat flux is just as
important [3]. Heat flux sensors can help determine if a certain process is running
properly and efficiently, or if energy is reaching its proper destination in a system.
Thermoelectric heat flux sensors can have the same structure as TECs, but work
somewhat in reverse. A temperature difference across the device (which is proportional
to the heat flux flowing through the device) creates an electrical signal which can be
measured. Properly calibrated, the device can determine the energy flow from any
surface, or the radiative energy from a remote source such as a laser.
The advantage of a transverse thermoelectric heat flux sensor is that the size of
the signal depends on the length of the device rather than the thickness, as with normal
heat flux sensors. This is because the electric field develops in a direction orthogonal to
that of the heat flux. The device can be built with a very small thickness to improve the
response time of the signal while maintaining a large signal by increasing the device’s
length.
Thermoelectric devices can also be used for power generation. The principles are
essentially the same as with thermoelectric heat flux sensors, i.e. a temperature difference
across the device creates a voltage. There is not much everyday use for thermoelectric
power generators because the power gained is far outweighed by the cost of the device.
However, in applications where another power source is not readily available but a
temperature difference is, thermoelectric power generators can be useful. Such
applications could include remote sensors, sensors in enclosed spaces, and even deep
space probes. NASA has implemented thermoelectric power generators is several deep
space missions, such as Voyager and Cassini [4,5]. These generators are known as

4
Radioisotope Thermoelectric Generators (RTG) because they use Plutonium-278 as a
heat source. As the radioactive substance releases heat energy, the thermoelectric devices
convert that energy to electricity for use in the probe. NASA is also working on a device
that could be implanted inside the human body and use temperature differences to power
health monitoring systems on long manned missions [6]. These types of devices could
also be used to power pacemakers.
One can imagine a myriad of other uses for thermoelectric power generators.
There are countless instances in industry and transportation where heat is lost to the
environment because of the inefficiency of conventional power systems (smokestacks,
internal combustion engines, cooling towers, etc.). Thermoelectric devices could be
installed to convert some of this waste heat to useable electricity, but at this time the
inefficiency of thermoelectric materials prevents this type of application from being
economically viable. It is possible that in the future transverse thermoelectric technology
may contribute to the improvement of the efficiency of thermoelectric devices, but that is
outside the scope of this work.
1.4 Summary and Achievements of the Project
Many achievements were made over the course of this project. The material
properties of thermoelectric properties were investigated, techniques for measurements of
cooling and heat flux sensing were developed, and a transverse thermoelectric device was
designed and constructed. Several obstacles were overcome during the design and testing
phases of the project, and several remain to be solved.
The project began with the selection of bulk thermoelectric materials to be used to
build a multilayered device. Past studies [7,8,9] suggested that bismuth (Bi) and bismuth
telluride (Bi2Te3) would be good thermoelectric materials, i.e. they would work well in
conjunction to produce a testable transverse device. These materials were obtained and
tested for their Seebeck coefficient, the main material property used to characterize
thermoelectric materials. Once the materials had been investigated, a device was
constructed. Techniques for cutting and connecting the pieces were developed and

5
improved over the course of several months. The materials were cut with a low speed
dicing saw and were ultimately connected using indium film.
Measurement techniques for determining the cooling and heat flux sensing
capabilities of the device were developed in a simple yet effective way. For cooling, the
device was powered with a DC source and the resulting temperature difference was
measured with thermocouples. For heat flux sensing, the device was heated on one side
to create a temperature difference (heat flux), and the resulting voltage was measured.
All measurements were taken using a DAQ system made of parts from National
Instruments® and recorded with a simple LabVIEW® program.
The results of the heat flux sensing tests were compared to predicted values,
which were determined from basic theory [10]. The results followed the trend of the
predicted values, but the magnitude of the output signal was significantly lower than
expected. An analysis of uncertainty and errors followed, and several possibilities were
uncovered. It was ultimately determined that the device was indeed displaying transverse
thermoelectric effects consistent with expected results, but that certain flaws in the
construction and testing process limited the accuracy of the data.
1.5 Thesis Outline
This thesis details the decisions and processes that lead to the creation, testing,
and analysis of a transverse thermoelectric device. Chapter 2 outlines the history of
thermoelectric research, from the discovery of thermoelectrics in 1822 to current research
regarding the search for better thermoelectric materials and the transverse Seebeck effect.
Chapter 3 describes the process of constructing and testing the device. Included are
discussions of material selection, some early measurements, and a complete description
of the test setup. Chapter 4 begins with a discussion of the expected results for heat flux
sensing, and then details the actual results from several different tests. The results are
then compared to the predicted values, and a discussion of uncertainty and error analysis
follows. Finally, Chapter 5 summarizes the results and analysis of testing, and gives
several recommendations for future work.

6
Chapter 2 - Background
2.1 A Brief History of Thermoelectrics
The study of thermoelectrics began in 1822 when Thomas Johann Seebeck [11], a
German physicist, noticed that two dissimilar metals in a closed loop caused a compass
needle to deflect when the two metals were held at different temperatures. This meant
that an electric field was created between the two metals, thus inducing a magnetic field
to deflect the needle. Seebeck later discovered that some metals were able to create
stronger fields with the same temperature difference, and that the amount of deflection in
the needle was proportional to the temperature difference between the two conducting
metals. These principles make up the foundations of thermoelectrics, and for his
discoveries the Seebeck coefficient (the voltage produced between two points of a
conductor where a uniform temperature difference of 1K exists between those two points)
was named after the founding father of thermoelectrics.
In 1834 a French watchmaker named Jean Charles Athanase Peltier [12]
discovered that thermoelectric materials could also work in reverse. That is, an applied
voltage could create a temperature difference between the two dissimilar metals.
Although Peltier is generally credited with the discovery of thermoelectric cooling, he did
not fully understand the physics of the phenomenon. The full explanation was given four
years later by Emil Lenz, who showed that a drop of water on a bismuth-antimony
junction would freeze when electrical current was applied one way, and melt again when
the current was reversed.
As knowledge of thermoelectrics increased, the most important discoveries were
related to material properties. In 1911, Altenkirch [13] derived the thermoelectric
efficiency, now known simply as , or the thermoelectric figure of merit. This value is
given as
σ2=
(2.1)

7
where is the Seebeck coefficient,
is the electrical conductivity, and is the thermal
conductivity. Altenkirch and others realized that ideal thermoelectric materials would
have a high electrical conductivity to minimize Joule heating and a low thermal
conductivity to prevent the backflow of heat from the hot side to the cool side. The
thermoelectric efficiency can be non-dimensionalized by multiplying by the absolute
temperature , which yields the most common form of thermoelectric efficiency, , also known as the dimensionless . Early work in thermoelectrics resulted in very small values of
because the
materials being used (mostly metals) did not possess ideal thermoelectric properties.
Most traditional materials have a correlation between electrical and thermal conductivity.
That is, a material that conducts electricity well, such as a metal, will also conduct heat
well, and a material that insulates heat, such as glass or ceramic, also insulates electricity.
Beginning in the late 1930’s and continuing into the 1970’s, there was a surge of
discoveries that showed semiconductors exhibited the best thermoelectric properties.
Until then metals such as bismuth and antimony alloys were the state of the art with a
value of around 0.1 at room temperature. The implementation of semiconductors such as
bismuth telluride (Bi2Te3) helped to increase that number by ten fold because
semiconductors are moderate conductors of heat and electricity. Figure 2.1 shows a
rough approximation of the dependence of thermoelectric properties on carrier
concentration. It can be seen in the figure that semiconductors display the largest value
of σ2
, and they also have moderate values of . This means that they are the best known thermoelectric materials. The efficiency of modern thermoelectric materials still
cannot compete with more conventional methods because the electrical conductivity is
too low and the thermal conductivity is too high. A value of roughly 3 is needed in order for thermoelectric cooling systems to compete with vapor compression refrigerators
[1].
Recent advancements in nanoscale physics have allowed researchers to begin
manipulating materials at the molecular level. This means that new materials may be
created that can conduct electricity very well while insulating against heat transfer. This
area of research will be discussed in more detail in the next section.

8
Figure 2.1. A rough sketch of the dependence of and on the concentration of free carriers. The relatively moderate values of electrical and thermal conductivity make semiconductors the best known thermoelectric materials [14].
2.2 Review of the Applications of Thermoelectrics
Thermoelectric effects can be used in two ways. The first is called the Seebeck
effect, and it occurs when a temperature gradient in a material creates a voltage potential
by pushing electrons from one side to the other. The Seebeck effect is useful for heat
flux sensing, where the signal is proportional to the temperature gradient and thus the
log carrier concentration (n)
log n
Insulators Semiconductors Metals
Electronic Thermal Conductivity
Lattice Thermal Conductivity
k
Thermal Conductivity
σ S
S2σ
1019
cm-3
S
Seebeck Coefficient
σ
Electrical Conductivity

9
heat flux, and power generation, where a small voltage (enough to run a small motor,
sensor, transmitter, etc.) can be generated essentially for free if there is a large enough
temperature difference. Thermocouples also operate on the Seebeck effect, by having
one junction at a reference temperature and outputting a voltage proportional to the
temperature difference between the junctions.
The second method for utilizing thermoelectrics is called the Peltier effect. This
effect occurs when a current applied to a material creates a temperature difference. The
side that gets cool can be used to actively lower the temperature of electronics or other
surfaces. To date, thermoelectric coolers are not in wide-spread use because of their low
efficiency. They are solid-state and quiet, require almost no maintenance, and will last
indefinitely, but these advantages do not justify the amount of power they consume in
most cases (a value of 1 corresponds to roughly one third the efficiency of a normal refrigeration cycle [1]). The cost of materials and fabrication for thermoelectric coolers
can also be high.
Most commercial coolers use bismuth telluride (Bi2Te3), the best known
thermoelectric material around room temperature. Alternating legs of p-doped and n-
doped Bi2Te3 are connected electrically in series and thermally in parallel (Fig. 2.2). In
the p-doped legs, positively charged holes carry heat in the same direction as the current
flow, and in the n-doped legs, negatively charged electrons carry heat in the opposite
direction. The net effect is that heat is carried from the cold side to the hot side in both
legs. A commercial cooler is generally constructed of dozens of pairs of legs in a fashion
that maximizes cooling per unit area. The amount of doping in the material is optimized
and usually results in a maximum value of about 1 for Bi2Te3. The applications of thermoelectric technology are somewhat limited due to the
efficiency of current materials. Thermoelectric coolers are mostly used in electronic
devices where a traditional fan and heat sink may be too loud or take up too much space.
The advantage of a thermoelectric device in this case is that it has no moving parts, and
so is quiet and requires less maintenance. The device pumps heat from the chip to a heat
sink just as a fan does, but uses much more power to remove the same amount of heat. A
thermoelectric device may also be used for active temperature control because it can
either cool or heat the controlled side, depending on which way the current is flowing.

10
Thermoelectric devices are also used for power generation in remote locations
where a significant temperature gradient is available. For instance, some deep space
probes use thermoelectric generators for power when they are too far out for solar energy
to be sufficiently available (the generator uses an onboard source of heat provided by
radioactive plutonium). These types of generators could also be used to provide power to
sensors in remote locations, enclosed spaces, wristwatches, laptop computers, or any
other number of devices where a more conventional source of power is not available.
Figure 2.2. One pair of n- and p-type legs in a traditional thermoelectric cooler. The carriers move heat from the cold side to the hot side in both legs.
Recent investigations have resulted in discoveries of different materials that
exhibit high values using materials other than Bi2Te3. The main challenge in improving thermoelectric materials is that the three relevant properties (electrical
conductivity, thermal conductivity, and Seebeck coefficient) are interrelated. The
equation for dictates that one must maximize and while minimizing , yet most
materials with a high value of also have a high value of . The basic way to create a material that is a good candidate for thermoelectrics is
to confine electrons in one or more dimensions so that the electrical properties can be
more easily controlled [15]. If one dimension is smaller than the mean free path of
phonons while remaining larger than the mean free path of electrons, then electricity will
I
Cold (T-∆∆∆∆T)
Hot (T)
e+ e–
n-type p-type

11
pass easily through the material while heat will not (high , low ). Such a material would be very thin, in the nanoscale range, and so is not yet perfected. In 2001 Rama
Venkatasubramanian . [1] reported a value of 2.4 using a device made of ultra-thin layers of bismuth telluride and antimony telluride. Such results have not been
repeated to date, but the group says they may be able to achieve values of up to 3.5 in the near future. A 2002 study by Yamashita and Tomiyoshi [16] reported more modest
improvements with values of around 1.2 using refined doping and annealing methods. Another group [17] uses (Bi0.25Sb0.75)2Te3 and Bi2(Se0.1Te0.9)3 alloys grown on very thin
substrates as a miniaturized thermogenerator for radiation sensing and power generation
for tiny devices. Here the advantage of using thin materials is the ability to have
thousands of junctions instead of only a few dozen. Other studies have shown values of 1.3-1.6 in PbSeTe/PbTe quantum dot superlattice structures [18,19], and values above 5 were predicted for metal-based superlattices with tall barriers at room
temperature [20].
The search for more efficient thermoelectric materials continues, and will be
spurred by advances in nanotechnology in the future. Another direction for possible
improvements to thermoelectric devices is the use of transverse thermoelectric effects.
2.3 The Transverse Seebeck and Peltier Effects
Transverse thermoelectric effects have been studied less extensively than
traditional thermoelectric effects, mostly because of limitations in efficiency. Recent
work has revealed that newly discovered materials and techniques may increase the
viability of transverse thermoelectrics.
The thermoelectric field of any material due to a temperature gradient ∇ can be
determined by [10]
E = S ∇⋅ (2.2)
where S is the Seebeck tensor, which is of the form [10]

12
S =
( ) ( )
( ) ( )
+−
−+
⊥⊥
⊥⊥
ααα
ααα
22||||2
1
||
||2122
||
cossin02sin
00
2sin0sincos
(2.3)
where ||
and ⊥
are the in-plane and out-of-plane Seebeck coefficients, and α is the
angle between the c-axis and the surface normal of the material (Fig. 2.3). If the angle α
is either 0º or 90º, then the off-diagonal terms are zero, and the thermoelectric effects are
purely traditional. Current thermoelectric cooling technology utilizes this traditional
effect, where the electric current and heat are flowing in parallel directions.
Figure 2.3. The material orientations for (a)traditional and (b)transverse thermoelectric effects. Both orientations follow the same general Seebeck tensor, but the off-diagonal terms are only non-zero when the angle is between 0º and 90º and the Seebeck coefficient is anisotropic.
If the material is cut so that the angle between the c-axis and the surface normal is
between 0º and 90º, the off-diagonal terms will be non-zero and thus contribute to
thermoelectric effects. However, the reason that most materials will not exhibit strong
transverse thermoelectric behavior is that there must be a significant difference between
the in-plane and out-of-plane Seebeck coefficients. In other words, the material must be
strongly anisotropic. If such anisotropy exists, then the current and heat will flow in
Current Heat Heat
Surface Normal c-axis
z
x
(a) (b)
S =
⊥
00
00
00
||
||
S =
( ) ( )
( ) ( )
+−
−+
⊥⊥
⊥⊥
ααα
ααα
22||||2
1
||
||2122
||
cossin02sin
00
2sin0sincos
Current

13
perpendicular directions. This is particularly advantageous when the device is used as a
heat flux sensor. Most heat flux sensors have signal strengths proportional to their
thickness, and so response time must be sacrificed for signal strength (because a large
thickness results in a slow response time). A transverse thermoelectric heat flux sensor
has a signal strength proportional to its length, since that is the direction of electrical
current flow. This means that the device can be made as thin as possible to achieve fast
response times, and will still have a sufficient signal strength.
2.4 Anisotropy: Intrinsic vs. Artificial
The underlying principle of transverse thermoelectrics is the anisotropy of the
material. This results in non-zero off-diagonal terms in the Seebeck tensor, which allows
for a transverse voltage. As shown in Figure 2.4, there are two ways to achieve
anisotropy in thermoelectric materials. The device may be made of a single material
which is intrinsically anisotropic, such as growing single-crystal bismuth, YBa2Cu3O7-δ
(YBCO), or some other anisotropic material on a miscut substrate so that the c-axis is at
an angle with the surface normal. This results in a thin film device made from one
material that exhibits transverse thermoelectric effects. The alternate method is to build a
layered device with alternating layers of two materials that have sufficiently differing
thermoelectric properties and then cutting the device at the desired angle. The result here
is a device which can be considered a single anisotropic material (so long as the
dimensions of each layer are small compared with the overall dimensions of the device),
and also exhibits transverse effects.
The first type of device (Fig. 2.4a) offers several advantages for practical
applications. They can be much thinner for fast-response sensors, and should be easier to
mass-produce once their design is perfected. A layered device must be fabricated from
alternating layers, and a connection must be made between each layer. This would
certainly prove to be more costly than constructing an intrinsically anisotropic device.
For experimental purposes a layered device (Fig. 2.4b) is simpler to construct, but
requires a method for joining the layers so that they are sufficiently connected

14
electrically. The interface material or process used here should not contribute
significantly to the performance of the device. This type of device may be cheaper to
make, and easier to deal with in proof-of-principle studies, but thin films made of
intrinsically anisotropic materials are more promising for actual future devices.
Figure 2.4. The two ways to construct a transverse thermoelectric device are (a) from a single intrinsically anisotropic material grown at an angle on a miscut substrate, and (b) from two dissimilar materials layered at an angle to simulate an intrinsically anisotropic material.
2.5 The History of Transverse Thermoelectric Studies
The transverse Seebeck effect was first discovered by Lord Kelvin in the 19th
century [21] when he noticed that anisotropic materials exhibit thermoelectric fields in a
perpendicular direction to applied temperature gradients. Research in the area of
transverse thermoelectrics began growing steadily in the early 1970’s with many studies
coming from the former Soviet Union. These studies were mostly geared towards using
transverse thermoelectric devices for power generation using waste heat, but a few were
also focused on using these devices for cooling.
Early studies focused on the anisotropy of semiconductors such as Bi2Te3 and
CrSi2 [22] found that certain materials had strongly anisotropic thermoelectric properties.
A study by Korolyuk . [23] used homogeneous thermoelectrically anisotropic thermoelements for power generation as well as measurement of current, voltage, or
power. A current was applied to the device and converted to a temperature difference,
which was then converted back to a voltage which can be measured. This method was
(b) (a)
Thermoelectric Film
Substrate
Surface Normal
c-axis
(1) (2) (1) (2) (1) (2) (1) (2)
15
proposed because of its high accuracy and independence of the form of the input signal.
The same study also showed that for a thermoelement with an anisotropic Seebeck tensor
independent of temperature and a linear temperature distribution though the element, the
resulting emf is proportional to / where is the length of the thermoelement and
is
the width (the direction of the temperature gradient). This is important when considering
a transverse device for the measurement of heat flux, because the device has a larger
output when the dimension perpendicular to the heat flux is large, rather than the
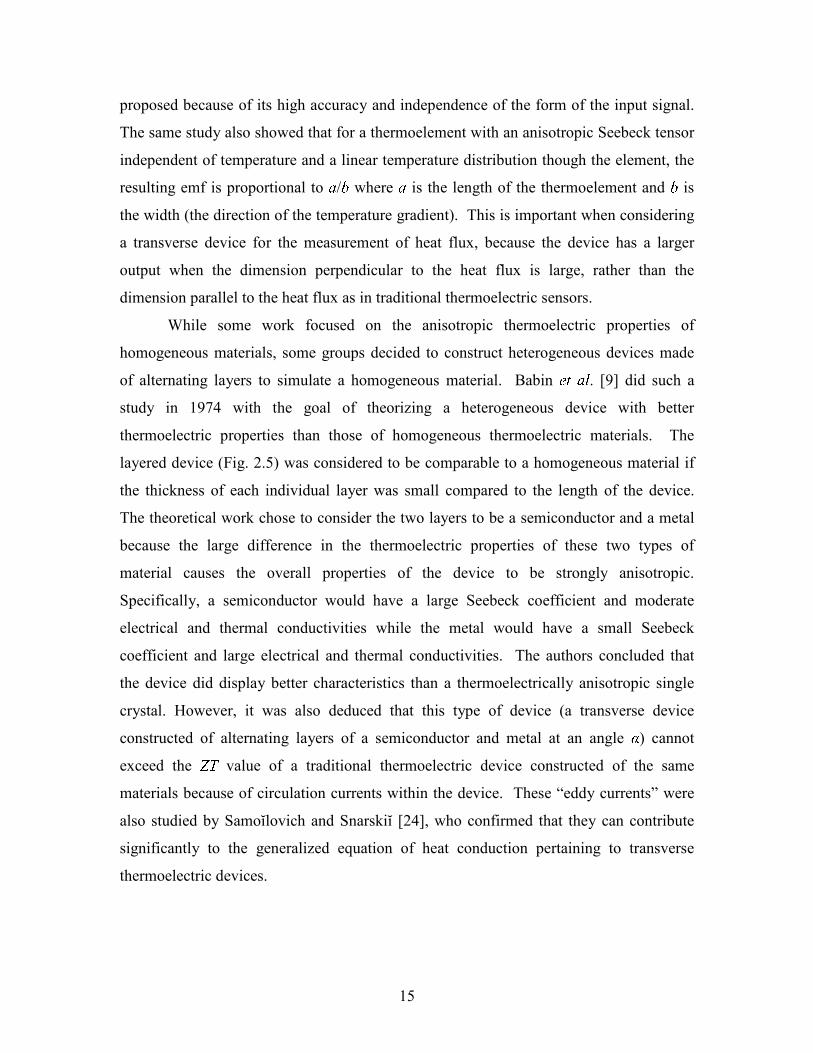
dimension parallel to the heat flux as in traditional thermoelectric sensors.
While some work focused on the anisotropic thermoelectric properties of
homogeneous materials, some groups decided to construct heterogeneous devices made
of alternating layers to simulate a homogeneous material. Babin . [9] did such a study in 1974 with the goal of theorizing a heterogeneous device with better
thermoelectric properties than those of homogeneous thermoelectric materials. The
layered device (Fig. 2.5) was considered to be comparable to a homogeneous material if
the thickness of each individual layer was small compared to the length of the device.
The theoretical work chose to consider the two layers to be a semiconductor and a metal
because the large difference in the thermoelectric properties of these two types of
material causes the overall properties of the device to be strongly anisotropic.
Specifically, a semiconductor would have a large Seebeck coefficient and moderate
electrical and thermal conductivities while the metal would have a small Seebeck
coefficient and large electrical and thermal conductivities. The authors concluded that
the device did display better characteristics than a thermoelectrically anisotropic single
crystal. However, it was also deduced that this type of device (a transverse device
constructed of alternating layers of a semiconductor and metal at an angle ) cannot exceed the value of a traditional thermoelectric device constructed of the same materials because of circulation currents within the device. These “eddy currents” were
also studied by Samoĭlovich and Snarskiĭ [24], who confirmed that they can contribute
significantly to the generalized equation of heat conduction pertaining to transverse
thermoelectric devices.

16
Figure 2.5. The device proposed by Babin . in Ref. 9. The individual layers are assumed to be isotropic, and the device can be regarded as a homogeneous anisotropic material if the thickness of each layer is small compared with the total length of the device.
In 1977 Gudkin . [8] carried out an experimental study to confirm the findings of Babin . [9]. A device was constructed with alternating layers of Bi and Bi0.5Sb1.5Te3, and tested to show its cooling capabilities. The components were chosen to
maximize the quantity
σ2=
(2.4)
where σ is the electrical conductivity in the direction of current flow, is the thermal
conductivity in the direction of heat flow, and is the off-diagonal term from the
Seebeck tensor (see Eqn. 2.3). This can then be compared to the value of a traditional cooler whose legs are made with the same two materials,
( )( )22211
221
21
σσ +
−=−
(2.5)
where the subscripts 1 and 2 indicate the properties of the two constituents of the device.
The materials making up the transverse device must maximize 1-2 and the ratio 2
2 /
11 in order to be effective, and the two materials chosen in this study resulted in
acceptable values of 1-2 = 0.85 × 10⁻³ K-1 and
2
2 /
1
1 = 60. This study also claims
1
ϕ
1
0
0
1/ ∂∂

17
that the optimum angle between the layers and the surface normal is 60°, although no
mathematical reason is given (a discussion of the effect of angle on device properties will
follow later in this chapter). At the optimum current density, the temperature drop across
the device was reported to be more than 23º C. An earlier study by Gudkin . [25] shows the possibility of using “cascaded” devices of arbitrary shape to aid cooling by
changing the relative areas of the cold and hot sides of the device.
Additional work in the late 1970’s addressed other issues, such as utilizing
transverse coolers in a magnetic field [26] and the more subtle effects of the anisotropy of
thermoelectric properties [27-30]. In 1978 Gorya and Lupashko [31] confirmed the
earlier theoretical work by Babin . that suggested an artificially anisotropic device could exhibit better thermoelectric performance than an anisotropic thermoelement made
from a single-crystal material.
Once the basic principles of transverse thermoelectric effects had been thoroughly
investigated, research in the area began to die down. But in the early 1990’s, some
researchers began to realize that new methods and technologies could be beneficial to the
field of transverse thermoelectrics, and the amount of research began to increase. As was
discussed earlier, the ideal thermoelectric material has high values of the Seebeck
coefficient and electrical conductivity, and a low thermal conductivity. With the
introduction of nanoscale processes and material manipulation, researchers saw that
certain materials, mainly superconductors, could be arranged in a way that was
advantageous to thermoelectrics. A paper from 1991 by Lengfeller . [32] showed that a thin film of superconducting YBa2Cu3O7-δ (YBCO) produced large voltages in the
transverse direction when subjected to heat flux from a laser pulse. These types of large
voltages were reproduced by Testardi in 1993 [33]. Lengfeller . [32] concluded that the large voltages were due to non-zero off-diagonal terms in the Seebeck tensor, i.e. the
transverse Seebeck effect. Lengfeller’s group had originally thought that the abnormally
large voltage was due to a combination of effects including tensorial photoelectric effects
and piezo- and pyroelectricity. The superconductor was oriented with the c-axis at an
angle of up to 20º from the surface normal to produce varying magnitudes in the output
signal, and in fact it was concluded that the signal was directly proportional to the angle
at which the film was grown. Lengfeller . [32] suggested that this new type of device

18
would be useful as a radiative heat flux sensor which would be almost wavelength-
independent around room temperature.
Several other studies of superconductors were conducted during that time period,
including studies related to the fast time response of YBCO films [34] and the equally
promising transverse thermoelectric properties of Bi2Sr2CaCu2O8 films [35,36] and many
other types of superconductors [37].
Another interesting direction that this area took in the late 1990’s was in the field
of conducting polymers. Mateeva . [38] described a way to make flexible material from conducting polymers such as polyaniline and polypyrrole that exhibit transverse
thermoelectric effects. These types of materials are easily made anisotropic by stretching
or spin-coating, but at the time of the study only exhibited values of around 10-3. The paper suggested, however, that future materials could conceivably have much higher
values of electrical conductivity and therefore much better thermoelectric efficiency. The
problem with the material used in the study was that there was an “internal short-
circuiting” of the transverse Seebeck effect because the two types of carriers seem to
cancel each other out. If conducting polymers ever become viable candidates for
transverse thermoelectric devices, they would be useful in many applications, especially
in the medical field, where a flexible bandage-like material could be constructed and
serve as a splint device while also heating or cooling.
Transverse thermoelectric effects can also be observed in artificially anisotropic
devices. A study by Zahner . in 1998 [10] used a metallic multilayer structure composed of alternating layers of thin films of copper and constantan. The stack was cut
at an angle to produce a transverse device, and a correlation was found between the angle
and the signal produced by the device when irradiated with a laser. The group concluded
that the artificial structure exhibited the same type of response as YBCO and other
superconducting films. A follow-up study in 2004 [39] presented more results from the
copper-constantan type of device and determined that the device would be useful for laser
sensing. Studies have also been done on intrinsically anisotropic materials other than
superconductors. Cho . [40] constructed thin films of Bi and BiSb alloy on CdTe substrates cut at an angle of about 19°.

19
2.6 Summary
Thermoelectrics have been around for almost 200 years, but still are not in
widespread use because of their poor thermodynamic efficiency. Research in the middle
of the 20th century revealed that semiconductors had favorable properties for
thermoelectrics, and interest was renewed in the field. Current work shows that some
promising materials may soon be able to be competitive with conventional cooling
methods.
The field of transverse thermoelectrics has evolved into a search for materials
which have properties that maximize the value of . Research began with materials such as bismuth and antimony alloys and moved later into superconductors and
multilayered structures. The goal is to develop a device that produces a high signal in
heat flux sensing and power generation applications, and a high temperature gradient in
cooling applications. Many researchers are optimistic that in the future there will be
materials that can eventually compete in efficiency with more conventional refrigeration
methods. A device which utilizes transverse thermoelectric effects and has high
efficiency would almost certainly become a popular method for cooling electronics,
because the small size, localized cooling, and solid state operation of thin film devices
would be advantageous in that area.

20
Chapter 3 – Construction of the Device and Test
Procedures
This chapter outlines the decisions and procedures that led up to the construction
of the transverse device. As stated in the previous chapter, a transverse device can be
constructed either with an intrinsically anisotropic material grown at an angle or it can be
made from alternating layers of differing materials to simulate anisotropy. The latter
method was chosen because it was determined to be a simpler method for obtaining a
device to be used for proof-of-principle purposes. The goal was to make a device that
could exhibit transverse effects, and use the knowledge gained from that experience to
later go on to more practical devices.
3.1 Material Selection
Previous researchers that have constructed artificially anisotropic transverse
thermoelectric devices have chosen to use already proven thermoelectric materials like Bi
and Bi0.5Sb1.5Te3 [7,8], or metals with weaker thermoelectric properties like copper and
constantan [10]. It was decided that for this study, proven thermoelectric materials would
be better because they result in more measurable thermoelectric effects. A sample of
bismuth telluride was obtained and it was determined that this material would be suitable
for the semiconductor material. The second material needed to have significantly
different thermoelectric properties than the first in order to create a large anisotropic
effect. It was decided that bismuth would be the best choice because it is a metal, and
because it was used in previous studies along with a semiconductor to create transverse
devices [7,8]. The thermoelectric properties of bismuth and bismuth telluride are shown
in Table 3.1.

21
Table 3.1. Thermoelectric properties of bismuth (Bi) and bismuth telluride (Bi2Te3) [37]. (* Measured)
Material Electrical Conductivity,
σ ( )Ω1
Thermal Conductivity,
k ( )
Seebeck Coefficient,
S ( )µ
Bi 9×10⁵ 8.0 34.5*
Bi2Te3 (N) 2.11×10⁴ 1.8 190*
3.2 Early Measurements
Before construction of the device began, early measurements were taken to
determine the thermoelectric properties of the bismuth telluride samples. These early
tests helped to develop techniques for measuring thermoelectric capabilities of the device
itself, but eventually proved to be not useful in the characterization of the bismuth
telluride.
3.2.1 Experimental Setup and Components
Figure 3.1 shows the experimental setup used to measure the thermoelectric
characteristics of the bismuth telluride. A current was simply passed through the
material, and the resulting temperature difference across the material was measured with
thermocouples. The electrical leads were connected using high purity silver paint from
SPI® because it was easy to implement and formed a good electrical connection. It was
determined that normal solder would not work as well because it would not form a good
connection with the surface of the bismuth telluride. Type K thermocouples were used to
measure temperature, and were read using a National Instruments® SC-2345 Signal
Conditioning Connector Block and SCC-TC01 Thermocouple input modules, and a PCI-
6221 M Series Multifunction DAQ card, also from National Instruments®. The bismuth
telluride was attached to the heat sink using AOS® Heat Sink Compound, a thermal paste,
to aid in heat transfer and isolate the sample electrically from the aluminum heat sink.
The device was powered with an Agilent® E3644A power supply.

22
A heat sink must be used when performing this kind of test because the Joule
heating inside the sample due to the electric current can make the sample temperature rise
rapidly without a means of heat removal. One side of the sample was placed on the heat
sink and the other side was placed on a foam block for support. It was anticipated that
one side of the sample would get hot while the other got cool, just as with a commercial
thermoelectric cooler. There was indeed a temperature difference between the two sides,
but neither side reached a temperature below room temperature, and if the direction of
electrical current was reversed, the direction of the temperature difference remained the
same. It was therefore determined that the temperature difference was only due to one
side being on the heat sink and the other not. The Joule heating created an internal heat
source in the sample, and the side on the heat sink rose in temperature less rapidly than
the other side.
Figure 3.1. Experimental setup used to measure cooling effects from bismuth telluride sample.
3.2.2 Thermoelectric Cooling Capabilities of Bi2Te3 Samples
The testing procedures for determining the cooling effects of the bismuth telluride
were fairly simple. The sample was powered at a constant current until a steady state was
reached. The DAQ system then recorded temperature data for about 30 seconds. These
TLOW THIGH
+ -
Heat Sink Foam Block
Bi2Te3 Sample
Thermal Paste Silver Paint

23
data were then averaged over the 30 second time period and the final result was two
temperatures corresponding to one input current. The expected result for this type of test
would be something like Figure 3.2, which shows the cooling characteristic chart for a
commercial cooler built by Marlow®. In this chart one can see that a larger amount of
current supplied to the device results in a larger temperature difference. In this case the
temperature difference indicates cooling, i.e. the hot side was held at room temperature.
At about 3.6 A the cooling starts to decrease because Joule heating produces too much
excess heat, which begins to flow more rapidly back toward the cool side of the device.
Figure 3.2. The cooling characteristics of Marlow® model #DT12-4 thermoelectric cooler (adapted from www.marlow.com)
In contrast to the expected result, Figure 3.3 shows some steady state results for
the bismuth telluride sample. The sample did not show cooling, although there was a
temperature difference because of the aforementioned reasons. The graph does not seem
to have the same shape as the Marlow® chart either, but this may be because the
maximum current is much larger than 1.25 A, which was the largest current tested.

24
Figure 3.3. The results of steady state cooling tests on the sample of bismuth telluride. Cooling is not present although there is a temperature difference due to the heat sink.
3.2.3 Heat Flux Sensing Capabilities of Bi2Te3 Samples
The bismuth telluride sample was then tested for its heat flux sensing capabilities.
The setup for this test is shown in Figure 3.4. One side of the sample was placed on a
heater (a ¼” cartridge heater encased in a rectangular steel sleeve) and the other side was
exposed to room temperature air. The voltage across the sample in the same direction of
the heat flux was measured along with the temperature of each side, and the resulting
Seebeck coefficient was recorded (S = V/∆T). This preliminary testing resulted in a
Seebeck coefficient of around 200 µV/K, which is in good agreement with published
values [14]. An example of results of the preliminary testing can be seen in Figure 3.5.
Another test was performed later, when the techniques had been somewhat refined. The
Seebeck coefficients of the bismuth and bismuth telluride samples were found to be 34.5
µV / K and 190 µV / K, respectively.
0.2 0.4 0.6 0.8 1 1.20
10
20
30
40
50
60
70
80
90
100
Current (A)
Tem
pera
ture
( o
C)
THIGH
TLOW
∆T

25
Figure 3.4. The setup for measuring the Seebeck coefficient of the bismuth telluride sample.
0 10 20 30 40 50 60 70 800
10
20
30
∆T
, oC
0 10 20 30 40 50 60 70 800
2000
4000
6000
Voltage, µ
V
0 10 20 30 40 50 60 70 800
100
200
300
Time, seconds
Seebeck, µ
V/K
Figure 3.5. Sample data from Seebeck measurements on the Bi2Te3 sample.
Thermocouples
Voltage
Heaters
Heat Sink
Bi2Te3 Sample

26
3.3 Construction of the Device
Once the techniques for testing and characterizing a thermoelectric device had
been developed, the design and construction of the artificially anisotropic device began.
The device was meant to show the basic principles of transverse thermoelectrics, and was
designed to be easy to construct and manipulate. This section details the process of
constructing the transverse device.
3.3.1 Construction of Material Layers
Many things had to be considered when designing the transverse device. The
materials must be significantly different to create artificial anisotropy, the contacts must
be made to minimize electrical resistance between the layers, and it must be possible to
test the device at many different angles. As discussed earlier the materials chosen for this
project were bismuth and bismuth telluride, partly because of the precedent set by earlier
studies and partly because the thermoelectric properties were determined to be
sufficiently different. It was decided that the best way to cut the material into
appropriately sized pieces would be with a dicing saw. The process was time consuming
but effective, as the pieces had smooth interfaces and a consistent size. The original
materials used were bars of bismuth (0.5” diameter × 4” length) from Alfa Aesar® and
disks of bismuth telluride (1.35” diameter × 0.198” thickness) from Marlow®. The
geometry and cutting process of the pieces is outlined in Figure 3.6.
An important thing to consider when concerned about the anisotropy of the device
is the anisotropy of the individual materials. Bismuth is an intrinsically anisotropic
material, but the particular sample used in this project was not single crystal. It was
simply pure bismuth melted into a bar shape, and so the crystal planes were randomly
arranged (amorphous). The bismuth telluride samples were obtained from a commercial
thermoelectric cooler manufacturing company and were single crystal. One early
concern was that it could be difficult to align the layers of the device so that the
properties in each layer would be consistent. If some layers were aligned so that the
crystal planes were not in the same direction as in other layers, the properties of the

27
device would not be consistent from layer to layer. It was determined that the cutting
process assured that the layers would be consistent with each other because the cuts were
made in a direction parallel to the crystal planes.
Figure 3.6. An overview of the geometry and cutting process used to make the device layers. The bismuth and bismuth telluride samples were cut into equally sized slabs using a Buehler Isomet® low speed saw.
3.3.2 Interface Materials
Once the layers of material were cut, they had to be joined by choosing an
interface material that would hold the pieces together while providing a good electrical
connection. The first interface material to be tested was conductive carbon paint from
SPI® because it was fairly easy to use and could be removed with acetone in order to take
the device apart and put it back together at a new angle. To construct the device, the
layers were simply coated with the carbon paint, pressed together at a chosen angle, and
then allowed to dry. The excess carbon paint was then scraped off the sides of the device
to avoid electrical shorts. Carbon paint was also used to connect wires to the ends of the
device for supplying power or reading voltage. The device was tested for cooling and
heat flux sensing in a similar manner as the bismuth telluride samples (Fig. 3.7, 3.8). It
also did not show any cooling, but did show the ability to sense a heat flux, although the
results were not particularly satisfactory.
Bismuth
Bi2Te3
5.35 mm
7.81 mm
1.13 mm

28
Figure 3.7. The experimental setup for testing the device for a) cooling and b) heat flux sensing.
The results of the cooling and heat flux sensing tests are shown in Figures 3.9,
3.10, and 3.11. Figure 3.9 shows steady state tests in which the device was powered with
a DC source and the temperature of the top and bottom sides of the device were recorded.
Each point on the graph shows one steady state test and the two lines correspond to two
days of testing. One side of the device was on a heat sink, and it was determined that this
was the cause for the temperature difference rather than thermoelectric effects, because
when the direction of electrical current was switched, the temperatures of the two sides
were not affected. Figure 3.10 shows a transient heat flux sensing test in which the
device was heated on one side while the other side was on a heat sink to create a
temperature difference across the device. The temperature at each side was recorded, as
was the resulting voltage induced along the length of the device (in the direction
perpendicular to the temperature difference). The voltage follows the temperature
difference well, although it is not smooth.
Figure 3.11 shows steady state heat flux sensing tests. Again, each point
represents a steady state test, and the five lines correspond to five days of testing. This
test indicated that there was some sort of problem with either the testing methods or the
device itself, because the tests are significantly inconsistent from day to day. It was
thought that the fan attached to the heat sink was providing too much interference by
increasing convection along the sides of the device, but tests with and without the fan all
show the same inconsistencies. The resistance of the device from end to end was around
12 ohms (the theoretical resistance was less than 1 ohm), and it was thought that this high
Heat Sink
THigh
TLow
_ +
THigh
Heat Sink
Heater
TLow
_ +
b) a)

29
value of resistance might be affecting the cooling and heat flux sensing capabilities of the
device.
Figure 3.8. Photo of test setup used for measuring the heat flux sensing capabilities of the device.
0 1 2 3 4 5 6 7 8 90
5
10
15
20
25
Power, Watts
Tem
p.
Diffe
rence,
C
Trial 1
Trial 2
Figure 3.9. Steady state cooling tests with the device made with carbon paint. The two lines correspond to two days of testing.
Heat Sink
Thermocouples
Heater
V+ V–

30
Figure 3.10. Transient heat flux sensing test of the device made with carbon paint.
0 1 2 3 4 5 6 7 8 9 100
5
10
15
20
25
30
35
40
Power, Watts
Tem
p.
Diffe
rence,
C
1st Run (No Fan)
2nd Run (No Fan)
3rd Run (Fan)
4th Run (No Fan)
5th Run (Fan)
Figure 3.11. Steady state heat flux sensing tests with the device made with carbon paint. The lines correspond to tests on different days.

31
A new interface material, high purity silver paint from SPI®, was chosen because
it also was easy to use and remove. The device was constructed in the same manner as
before, and tested in the same way. The internal resistance was about the same (about 12
ohms), and the results of testing were also similar. The device still did not exhibit
cooling, but showed capabilities as a heat flux sensor, just as before. Some example
results of heat flux sensing measurements using the device made with silver paint are
shown in Figure 3.12.
The testing still indicated that there were large differences in the data between one
day and the next, as seen in Figure 3.11. It was decided that a new interface material may
result in better data. The next material, and the one ultimately chosen to continue testing
with, was indium film from Indium Corporation of America®. This material was more
difficult to apply to the bismuth and bismuth telluride layers, but resulted in a much lower
internal resistance and also held the layers together more strongly.
0 50 100 150 200 250 300 350 4000
10
20
30
∆T
, oC
0 50 100 150 200 250 300 350 4000
2000
4000
6000
Voltage,
V
0 50 100 150 200 250 300 350 4000
100
200
300
Time, seconds
Seebeck, µ
V/K
Figure 3.12. Sample data from Seebeck measurements on the device constructed with silver paint.

32
The method for implementing the indium film is outlined in Figure 3.13. The
film has a melting point of 157 ºC, so once it was layered in between the bismuth and
bismuth telluride pieces along with flux to aid in bonding, the device was heated to
around 160-170 ºC using a cartridge heater. The excess indium seeped out of the sides of
the device and was removed to prevent electrical shorts across the layers, and the device
was allowed to cool. The end product was a layered device with better contacts than
before (internal resistance less than 1 Ω) that was also structurally stronger. Figure 3.13
also shows the process of changing the angle, which simply consisted of heating the
device above 157 ºC and moving the pieces to a new angle using a foam block cut to the
desired angle. This process worked well, although an unforeseen side effect was that the
bismuth slices experienced some localized melting. The melting temperature of bismuth
is 271.3 ºC, but some bismuth did appear to melt. The implications of this along with
other possible errors will be discussed in later chapters. The results of measurements
taken from the device made with indium film can be found in the next chapter.
Figure 3.13. The processes for (a) constructing the initial device and (b) changing the angle of the device. In (a), the pieces were kept flat so that the indium melted uniformly between the pieces.
Even with the drastically lowered value of resistance, the device with indium
interface connections still did not exhibit cooling as expected. It is assumed that there is
some problem with the materials themselves that prevents the device from cooling, and
the remainder of this report will focus on characterizing the device as a heat flux sensor.
Aluminum Plate
Cartridge Heater
Foam Block
Bi and Bi2Te3 with In film between each layer
a) b)
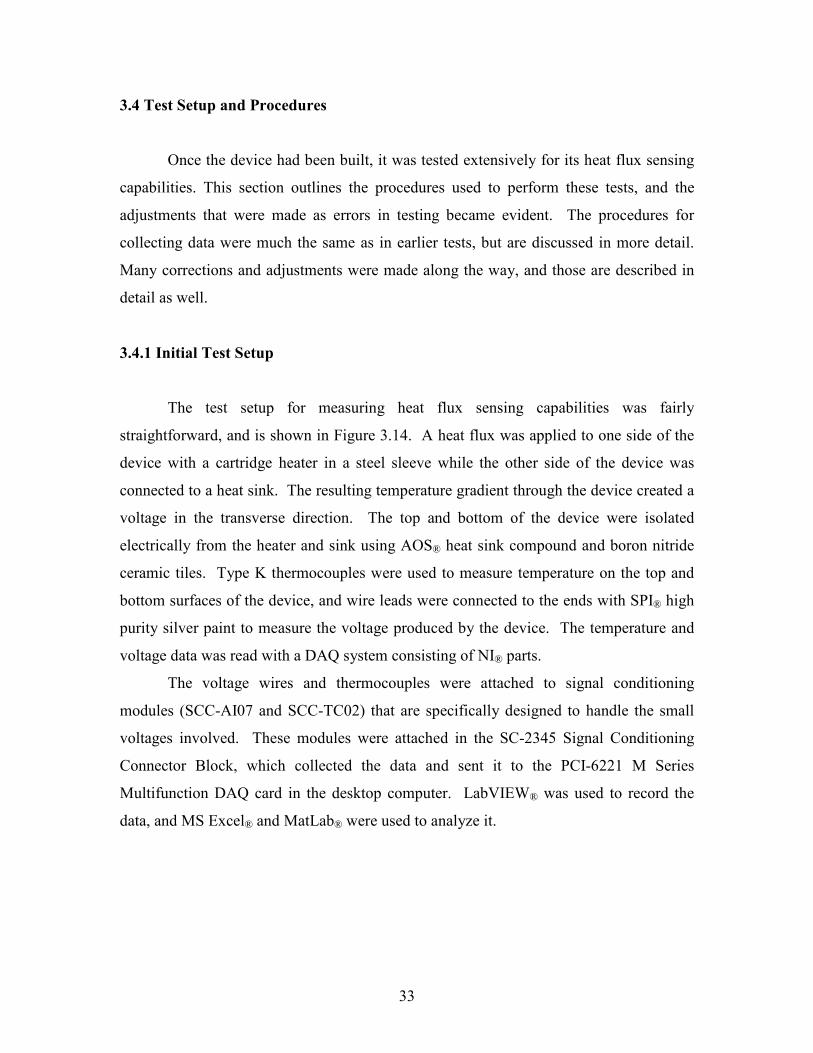
33
3.4 Test Setup and Procedures
Once the device had been built, it was tested extensively for its heat flux sensing
capabilities. This section outlines the procedures used to perform these tests, and the
adjustments that were made as errors in testing became evident. The procedures for
collecting data were much the same as in earlier tests, but are discussed in more detail.
Many corrections and adjustments were made along the way, and those are described in
detail as well.
3.4.1 Initial Test Setup
The test setup for measuring heat flux sensing capabilities was fairly
straightforward, and is shown in Figure 3.14. A heat flux was applied to one side of the
device with a cartridge heater in a steel sleeve while the other side of the device was
connected to a heat sink. The resulting temperature gradient through the device created a
voltage in the transverse direction. The top and bottom of the device were isolated
electrically from the heater and sink using AOS® heat sink compound and boron nitride
ceramic tiles. Type K thermocouples were used to measure temperature on the top and
bottom surfaces of the device, and wire leads were connected to the ends with SPI® high
purity silver paint to measure the voltage produced by the device. The temperature and
voltage data was read with a DAQ system consisting of NI® parts.
The voltage wires and thermocouples were attached to signal conditioning
modules (SCC-AI07 and SCC-TC02) that are specifically designed to handle the small
voltages involved. These modules were attached in the SC-2345 Signal Conditioning
Connector Block, which collected the data and sent it to the PCI-6221 M Series
Multifunction DAQ card in the desktop computer. LabVIEW® was used to record the
data, and MS Excel® and MatLab® were used to analyze it.

34
Figure 3.14. Schematic of the initial setup for measuring heat flux sensing capabilities.
The characterization of the device consisted of steady state measurements. The
heater was turned on to a chosen power level and the setup was left to reach steady state.
The initial requirements used to determine when steady state was reached were not
stringent enough, and this is discussed in the next section. Once steady state had been
reached, the DAQ system was collected data for a 30 second interval. The temperatures
and voltage were then averaged over the interval and these data were recorded. The
purpose of averaging the values over a 30 second interval was to eliminate some minor
fluctuations that occurred in the signals. The results from the recorded data were several
steady state points at different levels of heat flux. The values of temperature and voltage
were later compared to calculated values to evaluate the accuracy of the testing. This
process was repeated over many values of , the angle of inclination of the device.
3.4.2 Adjustments to Test Setup
Several early problems were encountered, and adjustments were made to improve
the test procedures. Figure 3.15 shows the first few days of testing with the device
constructed with indium film. The points represent steady state values, and the lines
represent different days of testing. The data varies wildly from day to day, and even on
single lines, the points are not consistent with each other. Initially this was thought to be
some sort of hysteresis within the device, as the points are fairly consistent when the
V
THigh
TLow
SCC-AI07
SCC-TC02
SCC-TC02
SC-2345
PCI-6221 M Series
Multifunction DAQ card
Heat Sink
_
Fan
Heater

35
device is being heated or cooled, but points during heating are not consistent with points
during cooling (the lines connect the steady state tests in chronological order). It was not
understood why hysteresis should happen because the heater was not always changing
temperature, i.e. the device should not “remember” if it was being heated or cooled
because these were steady state tests. The criteria for steady state at that time was to let
the device heat or cool until its top and bottom temperatures were not changing by more
than 1 °C within a 30 second interval. It was determined with the help of Dr. Thomas
Diller that this definition of steady state was not stringent enough. After the tests shown
in Figure 3.15, it was decided to let the device sit for 45-60 minutes between tests to
reach steady state. The temperatures were checked after 30-45 minutes, and if they
hadn’t changed after another 15 minutes then the setup was assumed to be at steady state.
This definition resulted in much better data, which are shown in Chapter 4.
0 10 20 30 40 50 600
500
1000
1500
2000
2500
3000
3500
Temperature Difference, C
Voltage, µV
12-20-05
12-22-05
12-23-05
12-24-05
01-03-06
Figure 3.15. Initial test results with the device constructed with indium film.

36
Another possible source of error that was dealt with early in the process was
convection from the ambient air. When the time for steady state was lengthened, it was
noticed that there were still long term fluctuations in the temperatures, with periods of
around 3-5 minutes. This time period was similar to the fluctuations in room temperature
due to the air conditioning unit turning on and off, so it was assumed that the fluctuations
would be lessened if the setup was isolated somehow. A glass bell jar was placed over
the setup to enclose it from the ambient conditions, as seen in Figure 3.16. Foam was
placed between the bottom of the glass bell and the table so that the wires could run
under the glass while maintaining a seal.
Figure 3.16. Modified setup to decrease errors due to convection in ambient air.
After implementing the glass bell jar, there were still some seemingly random
long-term fluctuations in the signal even after the setup reached steady state. The heater
was being powered by AC power through a transformer, and after close scrutiny it was
discovered that this power had some long-term fluctuations, possibly due to other devices
Glass bell jar to isolate the setup from ambient air currents
Foam

37
on the same circuit being turned off and on. The output of the transformer was hooked
into an Agilent® 34401A Digital Multimeter, and it was determined that this output was
not constant. To solve this problem, the heater was instead powered by the Agilent®
E3644A DC power supply so a constant amount of heat flux would be applied to the
device. This resulted in much better data with much more consistent steady state values
from day-to-day. Figure 3.17 shows the results of testing on the device with = 77°. The results are fairly consistent after the first five days of testing. However, on the first
five days, the results are linear but vary day-to-day. The reason for this variation has not
been positively identified, but it may be due to long-term curing of the silver paint
contacts on the ends of the device, or transient effects in the indium film or flux used to
attach the indium film. The problem was solved by leaving the setup with the heater
turned on overnight at a moderate value (hot side temperature ~ 50°C). This method
caused the device to give consistent results starting on the first day of testing, and was
used each time the angle was changed.
0 10 20 30 40 50 600
200
400
600
800
1000
1200
1400
Temperature Difference, oC
Voltage O
utp
ut,
µV
1/23/06
1/24/06
1/25/06
1/26/06
1/27/06
1/30/06
1/31/06
2/1/06
2/2/06
2/3/06
Figure 3.17. Steady state results from the device with = 77°.

38
It should be noted that there is an offset of about 100 V on the linear relationship depicted in Figure 3.17. This offset was evident in every test, and did not change sign if
the leads from the device were switched (positive for negative). This means that the
small offset was somewhere in the DAQ system, and was easy to deal with. The linear
relationship between voltage and temperature difference was found using a least squares
method in MatLab®, and the offset was easily determined and subtracted out. The slope
of the line then became the “effective Seebeck coefficient” of the device. In later tests
the heat flux sensing capabilities of the device were recorded using the power input to the
heater (i.e. heat flux) rather than the temperature difference across the device. The two
methods are not exactly the same because the value of the thermal conductivity of the
device in the direction of the heat flux is not constant with (see Chap. 4). The three main adjustments made to the initial test procedures greatly increased
the accuracy and repeatability of the measurements. The setup was enclosed in a glass
bell jar to eliminate interference from ambient convection, the heater was powered with a
DC rather than an AC supply, and the setup was heated overnight to eliminate day-to-day
inconsistencies.
3.5 Data Collection and Analysis
A simple LabVIEW® program was written to record data from the thermocouples
and voltage leads. A pre-built function named DAQ Assistant was used to transfer data
at 10 Hz from the DAQ card to a text file, and a graphical interface (Fig. 3.18) was
implemented so the temperatures and voltage could be monitored in real time. For steady
state tests, this graphical interface was sufficient to determine the length of time needed.
As stated before, the temperatures and voltage were observed about 30-45 minutes after
the heater had been adjusted, and again about 15 minutes later. If the graph showed no
change in temperature or voltage, the data was recorded.
Once the data had been recorded to a text file using LabVIEW®, that text file was
imported to MatLab® using a simple m-file. The data was broken up into vectors and
manipulated accordingly. MatLab® was chosen for its ease of use and exceptional

39
graphical outputs. A summary of values for each test was also stored in an MS Excel®
spreadsheet.
Figure 3.18. The front panel of the LabVIEW® VI used to record voltage and temperature data.
3.6 Summary
Since the ultimate goal is to create a device that will be thermoelectrically
efficient, it was decided that bismuth and bismuth telluride would be used for the layers
of the device in order to get a large signal. The layers were cut using a dicing saw and
attached using indium film. The device was tested by first placing a heater on one side
while the other side was attached to a heat sink, and then measuring the induced voltage
in the transverse direction. Many adjustments were made to the device and setup as
problems arose. The temperature and voltage data from the tests were collected using
LabVIEW® and analyzed using MatLab® and Excel®.

40
Chapter 4 – Results & Analysis
The device was subjected to heat flux sensing tests for almost four months after
the test setup was finalized. The length of time between steady state points made the
process fairly slow, but nonetheless a large amount of data was recorded. This chapter
outlines the major results and an analysis of the data, including comparisons with
calculated values, follows. Note that a comprehensive collection of data can be found in
Appendix A.
4.1 Expected Results
A study by Zahner . [10] in 1998 involved similar principles to this project. It consisted of a device constructed from a multilayered structure of sintered copper and
constantan foils cut at an angle as shown in Figure 4.1. Their device was tested for heat
flux sensing capabilities by irradiating it with a laser so that the surface of the device was
subject to a known heat flux. The voltage output was recorded for each test, and these
tests were repeated for several angles. The result was Figure 4.2, which shows the actual
data points and a curve of calculated values. The equations leading up to this calculated
curve will be discussed later in this chapter.
The project that is the subject of this thesis is similar to the study by Zahner ., the major differences being the material selection, geometry of the device, and method of
applying heat flux to the device. Therefore the expected results may be calculated using
the equations from Ref. 10 with slight adjustments for geometry and materials. These
calculations and comparisons are presented later in this chapter.
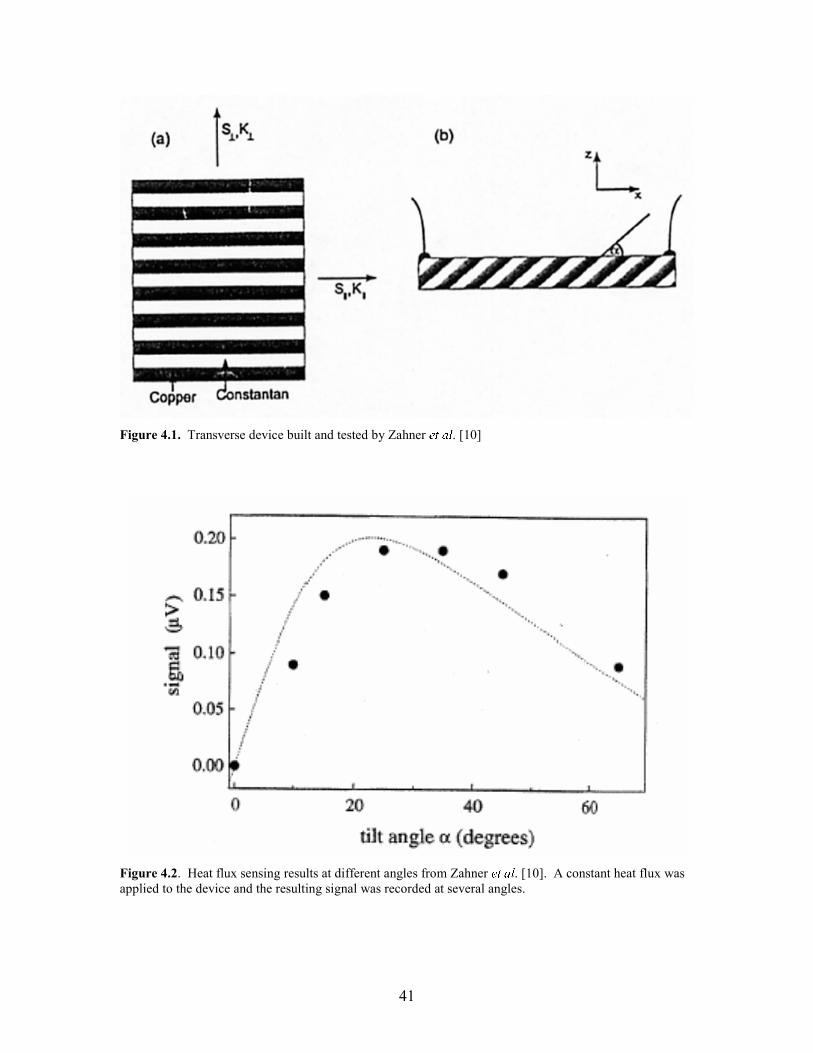
41
Figure 4.1. Transverse device built and tested by Zahner . [10]
Figure 4.2. Heat flux sensing results at different angles from Zahner . [10]. A constant heat flux was applied to the device and the resulting signal was recorded at several angles.

42
4.2 Results for α = 77°
The first angle tested was = 77°, an angle close to vertical (Fig. 4.3). The
steady state measurements were taken for 10 days, with much variation on the first 5
days. This was due to the aforementioned problem with inconsistent day-to-day
measurements that was solved by heating the device overnight. This problem had not
been diagnosed yet when the first tests were carried out, so the data is not consistent over
the first few days. Figure 4.4 shows all the data from the device with = 77°. It should
be noted that this plot is different than the one shown in Fig. 3.17, which shows the same
data with the temperature difference on the x-axis. It is sometimes more informative,
when studying a heat flux sensor, to plot signal vs. heat flux. The heat flux was
calculated by dividing the heater input power by the cross-sectional area of the device.
This calculation assumes that all the electrical power consumed by the heater is converted
to heat, and that all that heat is transferred to the device. The distinction between
temperature difference and heat flux may seem subtle at first, but it is important when
comparing angles because the thermal conductivity [10] and cross-sectional area of this
device are not constant with angle.
Figure 4.3. The device constructed with indium film with = 77°. A photograph of the device was measured to determine the value of the angle α, which was taken as the average of α1 and α2. Photographs of the device at all tested angles can be found in Appendix C.
α1 = tan-1 b1/a1
a1
b1
a2
b2
α2 = tan-1 b2/a2

43
0 0.5 1 1.5 2 2.5 3 3.5 4 4.5 50
200
400
600
800
1000
1200
1400
Heat Flux, W/cm2
Voltage O
utp
ut,
µV
1/23/06
1/24/06
1/25/06
1/26/06
1/27/06
1/30/06
1/31/06
2/1/06
2/2/06
2/3/06
Figure 4.4. All heat flux sensing data from the device with = 77°.
If the early tests are ignored, there are 4 days of testing that are consistent with
each other (Fig. 4.5). These points can be used to calculate a linear relationship between
heat flux and output voltage. A simple least squares fit was implemented in Matlab®, and
the resulting slope of the line was recorded as the signal strength in units of V/(W/cm2).
The process of determining which tests represented the true performance of the device
and using these data to characterize the device was implemented for each of the tested
angles.

44
0 0.5 1 1.5 2 2.5 3 3.5 4 4.50
200
400
600
800
1000
1200
1400
Heat Flux, W/cm2
Voltage O
utp
ut,
µV
Measured Data
Least Squares Fit
Figure 4.5. Least squares fit for the selected data from the device with = 77°.
The slope of the line in Figure 4.5, and therefore the signal strength of the device
with = 77°, is 289.9 V/(W/cm2). This is of course much smaller than commercial heat
flux sensors (sensors of comparable size made by Vatell Corp. in Christiansburg, VA
have sensitivities of up to 150 mV/(W/cm2) [41]), but keep in mind that the signal
strength of a device of this nature is dependent on many factors including geometry and
material properties. The devices in this study are meant for proof-of-principle purposes
and are not competitive with commercial devices at this time.
4.3 Results for all angles
The problem of day-to-day inconsistencies was solved by heating the device
overnight before testing. Therefore, the data from the later tests was much more
consistent, and less data was taken before a good relationship was established. For

45
instance, Figure 4.6 shows all data taken from the device with = 66°. No data was taken out from this set. The individual data sets for every angle in tabular and graphical
form can be found in Appendix A of this report.
0 0.5 1 1.5 2 2.5 3 3.5 4 4.50
500
1000
1500
2000
2500
3000Steady State Data for α = 66o
Heat Flux, W/cm2
Voltage O
utp
ut,
µV
3/24/06
3/28/06
3/29/06
3/30/06
Figure 4.6. All heat flux sensing data from the device with = 66°.
Figure 4.7 and Table 4.1 show the data from all of the tested angles. These data
are compared to calculated values in Chapter 5, but it is already evident in the figure that
there are certain repeatability issues. Specifically, there are angles close together that
have wildly different voltage outputs. These tests were conducted separately, i.e. the
device was set to one angle, then a second angle, then a third angle close to the first
angle. One would expect that the results from the first angle and the third angle would be
close since the angles are almost the same, but in some cases that did not occur. It is not
known exactly what caused these problems, but the problem was solved by re-melting the
indium film and allowing it to cool again. This process was repeated until the device
gave an output near the expected value. The output seemed to be either very low or near
the expected value, with no in-between values. Because of this fairly “digital” behavior,

46
it was assumed that the process of re-melting the indium film had some direct effect on
the output of the device, and that sometimes the output was normal while other times it
was very low. For the remainder of the tests, the device was re-melted until it gave a
good output.
It is important to note that foam insulation was used on the heater for the last three
angles. It was earlier assumed that all the heat from the heater was going through the
device to the heat sink, but it was known that some heat was escaping to the surroundings
from the top and side surfaces of the heater. In order to improve the accuracy of the
assumption, foam insulation was attached to the top and side surfaces of the heater, in
order to direct more heat down into the device (Fig. 4.8). The tests with insulation seem
to result in a larger signal strength (closer to predicted values) than those without
insulation.
0 0.5 1 1.5 2 2.5 3 3.5 4 4.50
1000
2000
3000
4000
5000
6000
Heat Flux, W/cm2
Voltage O
utp
ut,
µV
α = 77o (A)
α = 58o (B)
α = 47o (C)
α = 59o (D)
α = 66o (E)
α = 44o (F)
α = 84o (G)
α = 65o (H)
α = 47o (I)
Figure 4.7. Steady state results from all nine angles. Each point represents a steady state test, and each data set represents the test from a single angle taken over several days. The sets are in chronological order from A to I.
It can be seen in both Figure 4.7 and Table 4.1 that there is a small offset
associated with each data set. The offset is approximately the same for each angle, or at
least does not correlate with the magnitude of the angle. It was assumed that the offset

47
was due to a flaw in the data acquisition system, and did not affect the results. The signal
strength (SS) reported in Table 4.1 is simply the slope of a least-squares line for each data
set, and the offset is the y-intercept of that line.
Table 4.1. Steady state results from all nine angles.
Angle, α Sensitivity
µV / (W / cm2)
Offset (µV)
A 77° 289.9 98.3
B 58° 1172.0 132.4
C 47° 173.2 81.8
D 59° 175.9 120.7
E 66° 682.5 157.2
F 44° 1980.1 162.5
G 84° 190.2 114.8
H 65° 1197.8 84.7
I 47° 2321.6 130.4
Figure 4.8. Insulation was added to the heater in order to improve the assumption that all the heat was going through the device.

48
In order to compare angles, the slope and offset of the least squares line was used.
A specific value of heat flux was chosen, and the output voltage was calculated for each
angle. Because each set of steady state data was close to linear, this method was
determined to be the best way to compare the angles. Figure 4.9 shows the output
voltage of each of the nine angles with a heat flux of 2 W/cm2.
35 40 45 50 55 60 65 70 75 80 85 900
500
1000
1500
2000
2500
3000
3500
4000
Angle from Horizontal, Degrees
Sig
nal, µ
V
Figure 4.9. The signal from each angled device subjected to a heat flux of 2 W/cm2 was derived from the raw data for easy comparison between angles. The tests are again labeled chronologically from A to I.
At first glance it may seem that there is no correlation between the angle and the
output signal in Figure 4.9. However, it has been determined that there was something
wrong with the device in sets C and D. There may have been bad connections between
layers, or some substance interfering with thermoelectric effects. The small output seen
in C and D was also apparent a few more times throughout testing, but after it was
realized that the output should not be so low, the device was re-melted until the output
was closer to the expected value. As explained before, this phenomenon seemed to be
“digital,” i.e. the output was either very low or near the expected value. The important
A
B
C D
E
F
G
H
I A – F without insulation G – I with insulation

49
point here is that the problem seems to be related to the process of constructing the device
rather than some unknown problem with the thermoelectric effects.
4.4 Comparing Measured Data with Calculated Values
Once the data for several angles had been collected, it could be compared to
calculated values. Equations from Ref. 10 and 23 were modified to calculate the
expected signal strength at each angle based on material properties and geometric
orientation.
4.4.1 Outline of Governing Equations
The paper by Zahner . [10], first introduced in Chapter 2, outlines the equations needed to predict the voltage output of a transverse heat flux sensor made of
alternating layers. The device used in Zahner’s paper was a multilayered structure of
copper and constantan films. The layers were sintered and cut at an angle to produce a
transverse thermoelectric device. Although the materials and geometry are different in
this work, the equations can still be applied.
The underlying equation for all thermoelectric heat flux sensors states that the
electric field, E, produced by such a device when subjected to a temperature gradient can
be expressed as [10]
∇⋅= (4.1)
where is the Seebeck tensor and ∇ is the temperature gradient. The Seebeck tensor
is a 3×3 matrix, but in most cases it can be simplified. In the case of a transverse heat
flux sensor, heat is moving only in the z direction and electricity is moving only in the x
direction (there are local eddies in the individual layers, but when evaluating the total

50
voltage output of the device, these can be ignored). The general form of the Seebeck
tensor is [10]
( )
( )
+−
−+
=
⊥⊥
⊥⊥
ααα
ααα
22||||2
1
||
||2122
||
cossin02sin
00
2sin0sincos
(4.2)
where ||
is the Seebeck coefficient in the x direction (the direction of electrical flow),
⊥
is the Seebeck coefficient in the z direction (the direction of heat flow), and α is the
angle of inclination of the layers from the x axis (Fig. 4.1).
If the device were simply a single layer of intrinsically anisotropic material, then
||
and ⊥
would simply be the in-plane and out-of-plane Seebeck coefficients of the
material, respectively. The Seebeck coefficients of a multilayered structure depend on
the thermoelectric properties of the constituents [10]. The in-plane and out-of-plane
Seebeck coefficients of a multilayered device made of bismuth and bismuth telluride
layers are given by [10]
32
3232
|| σσ
σσ
+
+= ,
32
3232 +
+=⊥
(4.3)
where σ is the electrical conductivity and is the thermal resistance. The thermal
resistance is given by /= , where is a characteristic dimension and is the
thermal conductivity. Since the dimensions of all layers are equal in this case, can be
replaced by 1− in Equation 4.3.
The electric field in a transverse device subject to a temperature gradient can be
determined using Equations 4.1, 4.2 and 4.3. Since the heat and electric current are in
orthogonal directions in a transverse device, the off-diagonal terms in the Seebeck
coefficient are used. With a temperature gradient in the z direction, the electric field is
given by

51
( ) ∇−= ⊥||2
1 2sin α (4.4)
The importance of anisotropy is apparent in Equation 4.4. The magnitude of the
electric field is directly proportional to the difference between ||
and ⊥
, and therefore
the material properties must be sufficiently different for a large electric field to be
induced. Recall also that an important advantage of a transverse heat flux sensor is that
the output voltage is proportional to the length of the device rather than the thickness.
The actual voltage output of the device is equal to the magnitude of the electric field
multiplied by the length of the device (assuming is constant along the length of the
device):
( ) ∇−= ⊥||2
1 2sin α (4.5)
In order to predict the output voltage of a transverse device, the temperature
gradient across the device must be determined. The temperature difference across the
device was measured in the experimental process outlined in Chapter 3, but recall that the
heat flux was also monitored. The electrical power used by the heater was divided by the
surface area of the device in order to calculate the heat flux for each angle. Fourier’s
Law ( ) ∇='' can be used along with Equation 4.5 to predict the output voltage of the
device based on a heat flux input. The magnitude of the output voltage is then given by
( ) ''2sin ||21
⊥−= α (4.6)
where is the “effective” thermal conductivity of the device in the direction of heat
flow, which can be determined from the material properties of the constituents. The
effective thermal conductivity of the device is given by [10]
αα 22|| cossin ⊥+= (4.7)

52
where ||
and ⊥
are the in-plane and out-of-plane thermal conductivities, respectively,
and are given by [10]
( )322
1||
+= , 32
322
+=⊥
(4.8)
where and
32 are the thermal conductivities of bismuth and bismuth telluride,
respectively. Equations 4.3 and 4.8 can be combined with the material properties
outlined in Table 3.1 to calculate the values of ||
, ⊥
, ||
, and ⊥
. These values are
shown in Table 4.2.
Table 4.2. Summary of the “effective” material properties of the multilayered device calculated from the properties of the constituent materials.
Material Properties Equation Result
5109×= σ Ω1 ,
41011.232
×= σ Ω1 ,
5.34= µ ,
19032=
µ
32
3232
|| σσ
σσ
+
+=
06.38|| =
µ
0.8= ,
8.132=
,
5.34= µ ,
19032=
µ
11
11
32
3232
−−
−−
⊥ +
+=
85.21=⊥
µ
0.8= ,
8.132=
( )322
1||
+=
9.4|| =
0.8= ,
8.132=
32
322
+=⊥
94.2=⊥

53
4.4.2 Characterization of Device Geometry
One significant difference between the device used in Zahner’s paper [10] and the
device used in this work is the selection of materials. Zahner’s device was constructed of
layers of copper and constantan, while the device used in this work was constructed of
layers of bismuth and bismuth telluride. However, a more subtle difference is the
geometry of the device, and how devices with different angles were made. As shown in
Figure 4.1, the device in Ref. 10 was cut from a larger sample of the multilayered
structure into a rectangular device, and many devices were cut at different angles but with
the same dimensions. The device used in this work was made of rectangular pieces that
were connected with indium film as shown in Figure 4.10. This method was used so that
the same pieces could be used multiple times. The irregular shape of the device causes
the length and thickness to change with the angle. Figure 4.10 shows the orientation of
the device and the dimensions in question.
Figure 4.10. The length of the device as a function of the angle α. There were 13 layers used in each tested device, each with a thickness of 1.13 mm.
α L
L α = number of pieces
= layer thickness ααα sin
m01469.0
sin
m00113.013
sin=
⋅=
⋅=
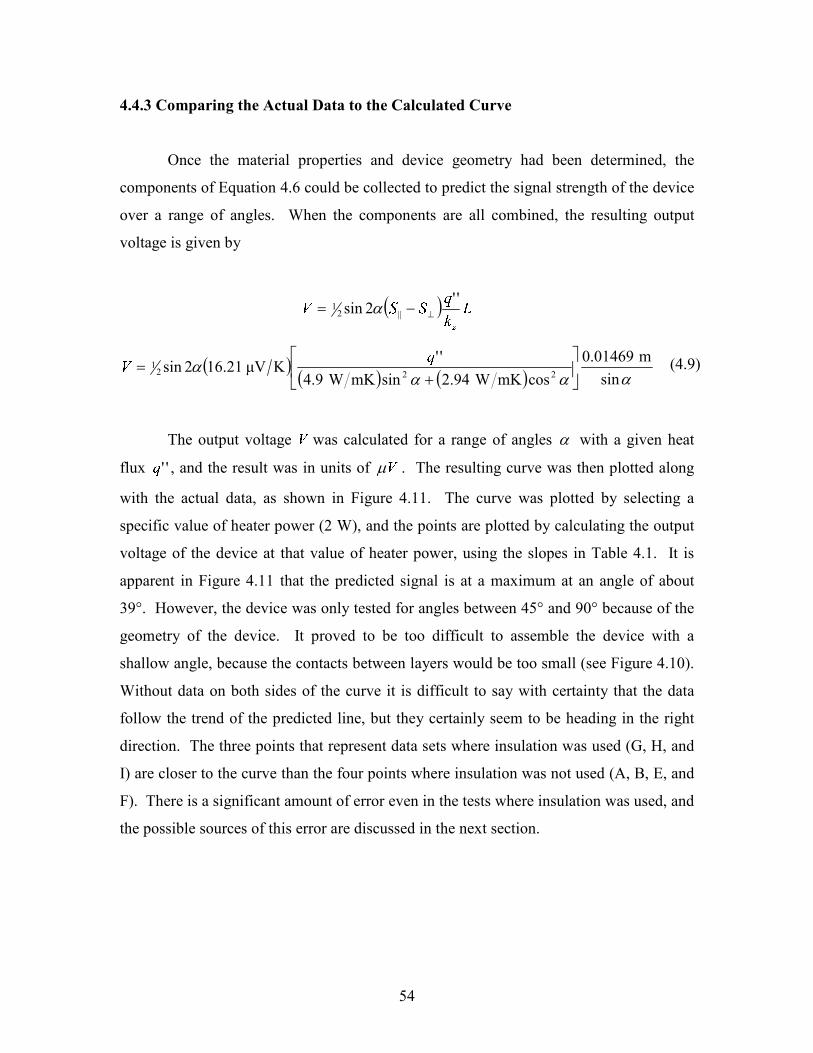
54
4.4.3 Comparing the Actual Data to the Calculated Curve
Once the material properties and device geometry had been determined, the
components of Equation 4.6 could be collected to predict the signal strength of the device
over a range of angles. When the components are all combined, the resulting output
voltage is given by
( ) ''2sin ||21
⊥−= α
( )( ) ( ) ααα
αsin
m01469.0
cosmKW94.2sinmKW9.4
''KµV21.162sin
2221
+=
(4.9)
The output voltage was calculated for a range of angles α with a given heat
flux '' , and the result was in units of
µ . The resulting curve was then plotted along
with the actual data, as shown in Figure 4.11. The curve was plotted by selecting a
specific value of heater power (2 W), and the points are plotted by calculating the output
voltage of the device at that value of heater power, using the slopes in Table 4.1. It is
apparent in Figure 4.11 that the predicted signal is at a maximum at an angle of about
39°. However, the device was only tested for angles between 45° and 90° because of the
geometry of the device. It proved to be too difficult to assemble the device with a
shallow angle, because the contacts between layers would be too small (see Figure 4.10).
Without data on both sides of the curve it is difficult to say with certainty that the data
follow the trend of the predicted line, but they certainly seem to be heading in the right
direction. The three points that represent data sets where insulation was used (G, H, and
I) are closer to the curve than the four points where insulation was not used (A, B, E, and
F). There is a significant amount of error even in the tests where insulation was used, and
the possible sources of this error are discussed in the next section.

55
0 10 20 30 40 50 60 70 80 900
500
1000
1500
2000
2500
3000
3500
4000
4500
Angle from Horizontal, Degrees
Sig
nal, µ
V
Predicted Signal
Erroneous Tests
Tests Without Heater Insulation
Tests With Heater Insulation
Figure 4.11. The predicted values of signal strength are plotted with the actual data. The points are again labeled chronologically from A to I. All points correspond to a constant heater power of 2 W.
4.4.4 Possible Sources of Error
The points in Figure 4.11 (other than C and D) seem to follow the trend of the
predicted curve well, although there is a sizeable gap between the points and the curve.
The most obvious possible source of error is that the heat flux was calculated using the
electrical input to the heater. The heater probably turned almost all of that electrical
power into heat, but not all the heat went though the transverse device. Some escaped
through the other sides of the heater, and some was lost along the sides of the device,
before reaching the heat sink. It is apparent that this was a large source of error because
the points in Figure 4.11 got much closer to the predicted curve when insulation was
added.
A
B
C D
F
E
G
H
I

56
Another possible source of error is the electrical connections between the layers.
The indium film could have had some small effect on the thermoelectric properties of the
device, and the quality of the connections almost certainly had some effect on local
thermoelectric effects (eddies) that could have contributed to the total output of the
device. An ideal connection would have been seamless, as if the device were made of
one solid material. The connections on either end of the device (silver paint) also could
have affected the signal. The irregular shape of the device may have contributed to the
error as well. The calculations assumed that the device was of a rectangular shape, but
the actual device had a jagged edge due to the shape of the layers (Figure 4.10). The
protrusions on the top and bottom sides of the device may have contributed local current
eddies that affected the signal. Finally, the uncertainties in the material properties and
geometric dimensions could have affected the predicted values and the measured data
points. These uncertainties are discussed more thoroughly in the next section.
4.5 Uncertainty Analysis
The predicted values of the output voltage of the device were determined using
published and measured material properties. It is difficult to assign uncertainties to these
values, because the particular materials used may or may not be of the same exact form
as those tested in other publications. The bismuth used in the device was amorphous,
while the bismuth in other studies may be single crystal. The bismuth telluride samples
may be doped differently. Table 4.3 shows the uncertainties used in calculating
maximum and minimum values for the predicted curve. These uncertainty values do not
have any real scientific basis, but are useful for determining the general effects of
uncertainty and examining the properties for which the output of the device is most
sensitive. The dimensions of the device were measured directly with a caliper, so the
accuracy of the dimensions is high. The uncertainty in the actual measurements was also
analyzed. Each data set was close to linear, but outer bounds were drawn to include all
the points and the minimum and maximum values of signal strength were added as error
bars to the final plot.
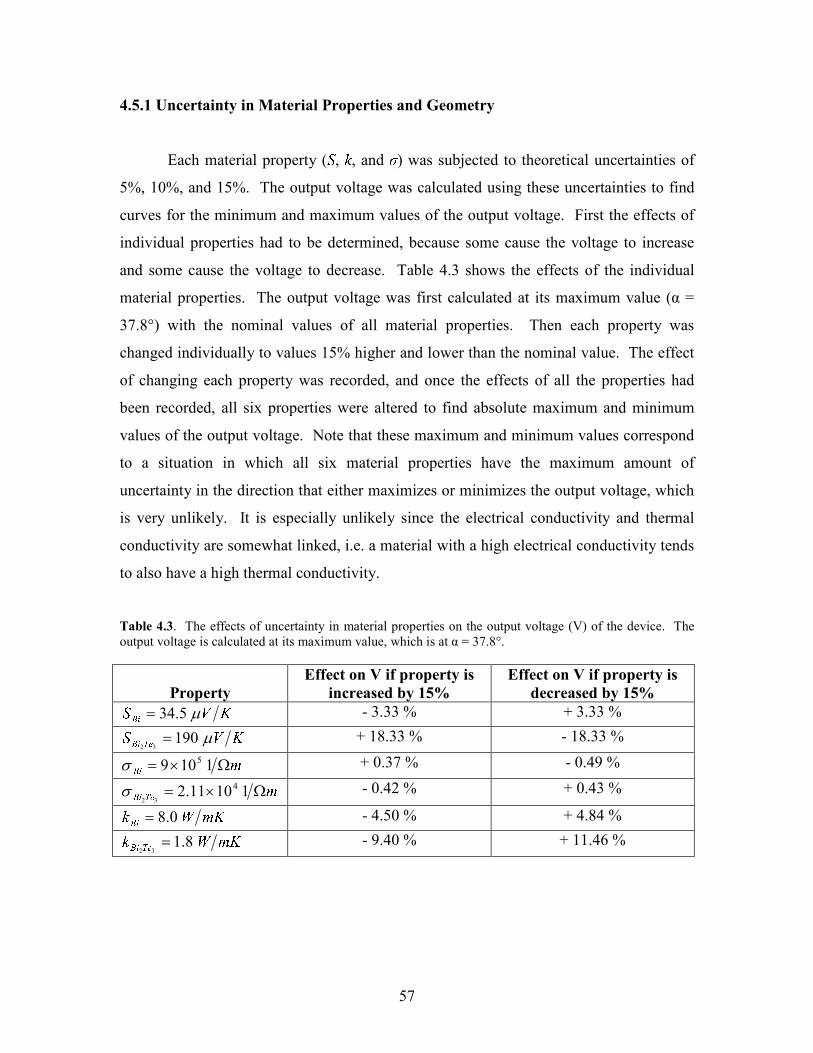
57
4.5.1 Uncertainty in Material Properties and Geometry
Each material property (,
, and ) was subjected to theoretical uncertainties of
5%, 10%, and 15%. The output voltage was calculated using these uncertainties to find
curves for the minimum and maximum values of the output voltage. First the effects of
individual properties had to be determined, because some cause the voltage to increase
and some cause the voltage to decrease. Table 4.3 shows the effects of the individual
material properties. The output voltage was first calculated at its maximum value (α =
37.8°) with the nominal values of all material properties. Then each property was
changed individually to values 15% higher and lower than the nominal value. The effect
of changing each property was recorded, and once the effects of all the properties had
been recorded, all six properties were altered to find absolute maximum and minimum
values of the output voltage. Note that these maximum and minimum values correspond
to a situation in which all six material properties have the maximum amount of
uncertainty in the direction that either maximizes or minimizes the output voltage, which
is very unlikely. It is especially unlikely since the electrical conductivity and thermal
conductivity are somewhat linked, i.e. a material with a high electrical conductivity tends
to also have a high thermal conductivity.
Table 4.3. The effects of uncertainty in material properties on the output voltage (V) of the device. The output voltage is calculated at its maximum value, which is at α = 37.8°.
Property
Effect on V if property is
increased by 15%
Effect on V if property is
decreased by 15%
5.34= µ - 3.33 % + 3.33 %
19032=
µ + 18.33 % - 18.33 %
5109×= σ Ω1 + 0.37 % - 0.49 % 41011.2
32×=
σ Ω1 - 0.42 % + 0.43 %
0.8= - 4.50 % + 4.84 %
8.132=
- 9.40 % + 11.46 %

58
Once the contributions of individual material properties had been determined, the
uncertainties were combined in a way that would maximize the uncertainty of the output
voltage. That is, a curve was constructed using the uncertainty in each property that
would maximize the output voltage, and another curve was constructed using the
uncertainty in each property that would minimize the output voltage. The results of these
combinations are shown in Figure 4.12 along with the actual data.
0 10 20 30 40 50 60 70 80 900
1000
2000
3000
4000
5000
6000
Angle from Horizontal, Degrees
Sig
nal, µ
V
Figure 4.12. The effect of uncertainty on the predicted output voltage of the device. The red dashed lines represent the maximum and minimum values of the predicted output voltage using 15% uncertainty in the material properties of the device.
The actual data points in Figure 4.12 are close to the curve representing the
minimum value of output voltage with material property uncertainties of 15%. To
compare these results with the individual contributions found in Table 4.3, the values of
the maximum and minimum curves at the peak angle of 37.8° are 21.7% higher and
21.7% lower than the nominal curve, respectively. If the uncertainties in the individual
Predicted Signal
Maximum Signal (+21.7%)
Minimum Signal (-21.7%)
Actual Data

59
properties are simply added, the total uncertainty would seem to be much more than
21.7%, but some of the effects tend to cancel each other out in the equations.
4.5.2 Uncertainty in Measurements
Another possible source of error is the linearity of the data sets. The output of the
device at each angle was measured at several different values of heat flux, and the
resulting data sets were fairly linear (see Figure 4.7). Each data set was fitted with a
least-squares line, the assumption being that the relationship between heat flux and output
voltage was linear. However, there was some amount of error involved in each data set,
as the line did not go through every point. In order to determine the amount of
uncertainty involved in linearizing the data sets, two methods were used. The first
method was to draw alternate slopes into the plots in order to include all of the data
points, as shown in Figure 4.13.
0 0.5 1 1.5 2 2.5 3 3.5 4 4.50
500
1000
1500
Heat Flux, W/cm2
Voltage O
utp
ut,
µV
Measured Data
Least Squares Fit
Figure 4.13. The result of uncertainty analysis for α = 77°. The dashed lines were drawn to include all points, and represent a 10% uncertainty in the slope of the least-squares line.

60
The dashed lines in Figure 4.13 represent a 10% uncertainty in the measured data.
That is, the slopes of the dashed lines are 10% larger and smaller than the slope of the
least-squares line. These dashed lines were added to the plots for all nine angles that
were tested, and the plots can be found in Appendix A. The uncertainty in the plot for α
= 77° was one of the largest; most of the others had uncertainties of less than 5%.
Once the uncertainty in the measured data had been estimated, it could be added
to the plot shown in Figure 4.12. Error bars were added to each data point, indicating the
uncertainty in the linearity of the data. Figure 4.14 shows the results of uncertainty
analysis on the predicted values and the measured values. The error bars are quite small
when seen on the scale of the plot, and they do not extend into the region of 15%
uncertainty of the predicted values.
0 10 20 30 40 50 60 70 80 900
1000
2000
3000
4000
5000
6000
Angle from Horizontal, Degrees
Sig
nal, µ
V
Figure 4.14. The result of uncertainty analyses on the measured data. The points represent the slopes from the nine data sets, and the error bars represent the uncertainty in those slopes.
Predicted Signal
Maximum Signal (+21.7%)
Minimum Signal (-21.7%)
Actual Data (With Uncertainty Method 1)

61
The second method of estimating the uncertainty in the data was to statistically
analyze the variance of the data from the least-squares line. The slope of the line
describes the approximate value of the output voltage at any given heat flux. Therefore,
the uncertainty can be analyzed by finding the variance between the predicted value and
the actual value of the output voltage at every measured heat flux. The standard error of
the least squares line is given as [42]
( ) ∑
=
−= 1
2
(4.10)
where is the number of data points, is the actual voltage measurement at the th data point, is the predicted value at the th data point, and is the degrees of freedom of the fit, = – ( + 1), where is the order of the least-squares fit. In this case = 1, so = – 2. The standard error is multiplied by the estimator (since the data set is finite) to arrive at the uncertainty in the fit [42]:
,± (4.11)
where is the equation for the least-squares fit, is the estimator at the proper values of and , and is the percentage of confidence. A 90% confidence level was
considered to be adequate in this case. The value in Equation 4.11 was added and
subtracted from the slope of the least squares fit to determine the maximum and
minimum values for the slope.
For each of the nine angles, the uncertainty was calculated with this method, and
new error bars were added to the plot, as seen in Figure 4.15. The blue error bars indicate
the uncertainty found in the “guessing” method, and the red error bars indicate the
uncertainty found using the above equations. Table 4.4 summarizes the results of
uncertainty analysis on the measured data.

62
0 10 20 30 40 50 60 70 80 900
1000
2000
3000
4000
5000
6000
Angle from Horizontal, Degrees
Sig
nal, µ
V
Figure 4.15. Comparison of the two methods for finding the uncertainty in the measured data. The smaller blue error bars indicate the uncertainty found in the “guessing” method, and the larger red error bars indicate the uncertainty found using the statistical method.
Table 4.4. Summary of the uncertainties found using the two methods.
Data
Set
Angle Intercept
(µV)
Slope (µV/(W/cm2)) Uncertainty
from “guessing”
method
Uncertainty
from statistical
method
A 77 98.3 289.9 ± 10 % ± 17.6 %
B 58 132.4 1172.0 ± 2 % ± 6.8 %
C 47 81.8 173.2 ± 15 % ± 28.8 %
D 59 120.7 175.9 ± 4 % ± 14.6 %
E 66 157.2 682.5 ± 7 % ± 19.5 %
F 44 162.5 1980.1 ± 3 % ± 8.5 %
G 84 114.8 190.2 ± 5 % ± 14.2 %
H 65 84.7 1197.8 ± 4 % ± 11.0 %
I 47 130.4 2321.6 ± 3 % ± 6.7 %
Predicted Signal
Maximum Signal (+21.7%)
Minimum Signal (-21.7%)
Actual Data (With Uncertainty Method 1)
Actual Data (With Uncertainty Method 2)

63
Figure 4.15 and Table 4.4 show that the two methods produced significantly
different values of uncertainty at each point. This is most likely due to bias in the
methods. In the first method, where the alternate slopes were “guessed,” more attention
was paid to the data points at higher values of heat flux because these points tended to
have larger magnitudes of error. However, the statistical method paid equal attention to
all points, and the points at lower values of heat flux, while closer to the line, sometimes
had larger relative values of error. Figure 4.16 outlines a description of the bias in the
two methods. In the hypothetical plot, the “guessing” method includes the larger value
and is closer to the least-squares line, but the statistical method is influenced more by the
smaller value because it must “pivot” around the intercept while including all points.
Figure 4.16. A hypothetical comparison of the bias in each method.
The statistical method may not be perfect, but it ultimately was chosen to
represent the uncertainty in the measured data. However, as shown in Figure 4.15, the
data is still not overlapping the predicted curve. The uncertainty in the heat flux was
estimated next. The actual data sets from each angle with the uncertainty from each
method can be found in Appendix A.
“guessing” method
statistical method
Heat Flux
Signal
least-squares fit (1st order)

64
4.5.3 Uncertainty in the Measured Heat Flux
Perhaps the largest source of uncertainty is in the estimate of the amount of heat
flux that goes through the device. Recall that the last three data sets were obtained after
insulation was applied to the heater, and there was a significant rise in the output voltage.
This was because more of the heat produced by the heater was going through the device
(less was escaping to the surroundings). Unfortunately there is no way to determine
exactly how much error was involved, because the heat released to the environment was
not measured. Two methods were used to attempt to analyze the uncertainty in the
amount of heat flux that went through the device.
4.5.3.1 Method 1 – Using Temperature Data
Since the temperature across the device was measured for each test, the heat flux
through the device should be easy to calculate using Fourier’s Law:
∇−='' (4.12)
where is the effective thermal conductivity of the device in the direction of heat flow
(see Equation 4.7) and ∇ is the temperature gradient in the direction of heat flow, and
is simply equal to the temperature difference divided by the distance in that direction.
Using this equation, the heat flux across the device can be determined by using
experimental temperature data, as shown in Figure 4.17. It is clear in the plot that the
output voltage is different when the heat flux is calculated using the temperature
difference (a different value of heat flux results in a different value being calculated from
the least-squares fit for each angle). In fact, the data show that in most cases the heat flux
is lower when calculated using the temperature difference. If this is assumed to be the
“true” value of the heat flux, then it follows that the heater is actually producing a larger
heat flux than it should be (when calculated using the power input to the heater). Clearly
there is some problem when calculating the heat flux using Fourier’s Law, because the

65
heat flux that actually goes through the device must always be smaller than the heat flux
calculated using the electrical power input to the heater, due to convective losses.
0 10 20 30 40 50 60 70 80 900
500
1000
1500
2000
2500
3000
3500
4000
4500
Angle from Horizontal, Degrees
Sig
nal, µ
V
Predicted Values
Heat Flux ~ Heater Power
Heat Flux ~ Temperature
Difference
Figure 4.17. Comparison of the data when the heat flux is calculated by the two methods. The blue points indicate when the heat flux is calculated from the electrical power input to the heater, and the red points indicate when the heat flux is calculated from the thermocouple data.
There are two possible explanations to this problem. The first is that the material
properties used to calculate are inaccurate, i.e. either
or 32 or both are too low.
This is possible, but the more probable explanation is that the temperature data from the
thermocouples are inaccurate. Figure 4.18 shows how the thermocouples were placed
during testing. The thermocouples were not placed directly on the surface of the device,
but were buried in the thermal paste between the device and the ceramic plates. The
paste has a small value of thermal conductivity, and it was thought that this placement
would ensure accurate temperature readings. Also, there may have been local changes in
temperature depending on which layer the thermocouple was placed. The “average”
thermal conductivity of the device is calculated as , but the individual layers still retain
there own values of .
Heat Flux ~ Heater Power Heat Flux ~ Temperature Difference

66
Figure 4.18. A schematic of the thermocouple placement in the test setup.
Figure 4.18 shows that the placement of the thermocouples probably resulted in
the recorded temperature difference being larger than the actual temperature difference,
resulting in the actual heat flux through the device being smaller than the heat flux
calculated using Fourier’s Law. Thus, it was decided that the method of calculating the
heat flux using the electrical power to the input was more accurate, despite the fact that
this method does not include the effects of convection.
4.5.3.2 Method 2 – Simple Analysis of Convective Losses
In order to estimate the heat lost from the heater before going through the device,
a first-order approximate model was developed to estimate convective losses (radiative
losses were neglected because of the relatively low temperatures involved). Figures 4.19
and 4.20 outline the resistance networks and equations used to solve for the heat flux
through the device.
''
Thermal Paste

67
With Insulation
Figure 4.19. Outline of the resistive network and equations used to solve for the amount of heat that goes through the device when insulation was used.
1+=
_
1=
! " #$ 2= % & % & % & '
=
( (
! '(
)*))+)),)))*+,- . - / 0 1 2 / 3 . ))**++,,3 4 5 2 - 6 07 - 3 0 - 1 899899899888888 98989898::+++=+++=
====−
- . - / 0 1 2 / 3 .)*+,) - . - / 0 1 2 / 3 .) $$$$$ 9.0
1111≈
+++
=
Device (C, D)
Heater
(not to scale)
Insulation (A)
Underside of heater (B)
4 Paths for Heat: A – Conducted through insulation, convected to air B – Convected through bare spots on the heater C – Convected from sides of device D – Conducted through device to heat sink
; < = > = 0.05 W/mK

68
Without Insulation
Figure 4.20. Outline of the resistive network and equations used to solve for the amount of heat that goes through the device when insulation was not used.
- . - / 0 1 2 / 3 . 0 5 3 1 -+ 9
_
1=
2 - * " #$ 2=
- 2 / - - 2 / - - 2 / -) 9=
+( * )(
)*))+)))*+- . - / 0 1 2 / 3 . ))**++3 4 5 2 - 6 07 - 3 0 - 1 89989988888 989898::++=++=
===−
- . - / 0 1 2 / 3 .)*+) - . - / 0 1 2 / 3 .) $$$$ 8.0
111≈
++
=
Device (C, D)
Heater
(not to scale)
All surface area of the heater except where the device is (B)
3 Paths for Heat: B – Convected through bare spots on the heater C – Convected from sides of device D – Conducted through device to heat sink

69
An angle of α = 65° was used for Figures 4.19 and 4.20, and the electrical input to
the heater was 2 W. The rough estimate was that about 90% of the heat goes through the
device when insulation is used on the heater, and about 80% of the heat goes through the
device when insulation is not used (a convective heat transfer coefficient of 15 W/m2K
was used). Note that the “2” in the thermal resistance of the sides of the device comes
from the fact that the average temperature of the sides is halfway between the heater
temperature and the ambient temperature. Table 4.5 shows a summary of the convective
heat losses at each surface for both cases (with and without insulation).
Table 4.5. Summary of the results from the analysis of the effects of convection. The heater power for each case is 2 W, the convective heat transfer coefficient is 15 W/m2K, and the device has an angle of 65°.
A (Insulation) B (Heater) C (Sides) D (Device) $ (K/W) with insulation
174.8 207.4 386.1 9.25 with insulation (W)
0.0943 0.0795 0.0427 1.783
% of = = with
insulation 4.72 % 3.98 % 2.14 % 89.2 % $ (K/W) with no
insulation- 40.02 386.1 9.25 with no
insulation (W) - 0.368 0.0382 1.594
% of = = with
no insulation - 18.4 % 1.91 % 79.7 %
4.5.3.3 The Effects of Uncertainty in the Heat Flux
If the nominal material properties of the device are assumed to be correct, curves
can be drawn with several different estimates of heat loss to the surrounding air. Figure
4.21 shows the results of such speculation. Dashed lines are added to show what the
predicted values of the output voltage would be if only a fraction of the heat produced by
the heater actually flows into the device.

70
0 10 20 30 40 50 60 70 80 900
500
1000
1500
2000
2500
3000
3500
4000
4500
Angle from Horizontal, Degrees
Sig
nal, µ
V
Figure 4.21. The possible uncertainty in the heat flux that flows through the device shows that the data may be close to the predicted values.
Figure 4.21 shows that with a certain amount of uncertainty in the heat flux, the
data may be within the range of the predicted values. For instance, two of the points for
which insulation were used are above the 70% curve, meaning that these values would be
close to correct if the heat flux going through the device was between 70% and 80% of
the amount of heat produced by the heater. It is difficult to tell if this is a reasonable
amount of uncertainty in the amount of heat flux. The previous section estimated the
percentage of heat flux that went through the device, and the rough estimations of the
convective heat transfer coefficient and the thermal conductivity of the insulation resulted
in the heat flux going through the device to be 90% of the total heat flux when insulation
was used and 80% when the insulation was not used. Figure 4.21 shows that these
amounts are still too large, but the assumptions are rough and may be too conservative.
q’’ = 100%
q’’ = 90%
q’’ = 80%
q’’ = 70%
Actual Data (1)
Actual Data (2)

71
4.6 Alternate Plotting Methods
The data in this report have been presented in plots where a specific value of
heater power was chosen. That amount of heater power was used to calculate the heat
flux at each angle for the predicted curve, and to select the appropriate data point from
each least-squares line. The amount of heat flux at each angle is slightly different
because the area of the device changes with angle. An alternate method of plotting the
data is to simply plot the sensitivity (voltage / heat flux) of the device at each angle. This
method is more helpful in an engineering sense, since it more precisely compares the
performance of the device at several angles to the expected performance. However, there
are certain subtleties that cause this method to have disadvantages. Figure 4.22 shows the
plot of device sensitivity vs. angle.
0 10 20 30 40 50 60 70 80 900
1000
2000
3000
4000
5000
6000
7000
Angle from Horizontal, Degrees
Sensitiv
ity, µ
V/(
W/c
m2)
Predicted Sensitivity
Actual Sensitivity
Figure 4.22. The comparison of predicted and actual values when calculated as sensitivities rather than voltages at a certain heater power.
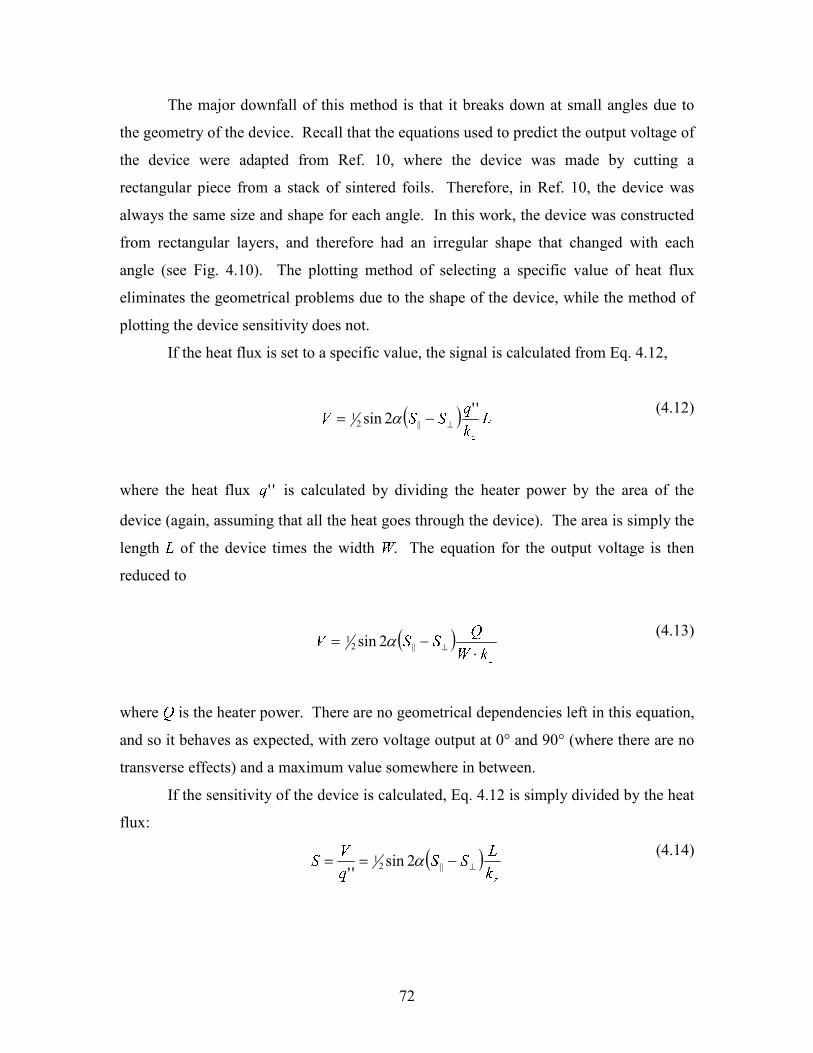
72
The major downfall of this method is that it breaks down at small angles due to
the geometry of the device. Recall that the equations used to predict the output voltage of
the device were adapted from Ref. 10, where the device was made by cutting a
rectangular piece from a stack of sintered foils. Therefore, in Ref. 10, the device was
always the same size and shape for each angle. In this work, the device was constructed
from rectangular layers, and therefore had an irregular shape that changed with each
angle (see Fig. 4.10). The plotting method of selecting a specific value of heat flux
eliminates the geometrical problems due to the shape of the device, while the method of
plotting the device sensitivity does not.
If the heat flux is set to a specific value, the signal is calculated from Eq. 4.12,
( ) ''2sin ||21
⊥−= α (4.12)
where the heat flux '' is calculated by dividing the heater power by the area of the
device (again, assuming that all the heat goes through the device). The area is simply the
length of the device times the width . The equation for the output voltage is then
reduced to
( ) ⋅
−= ⊥||21 2sin α
(4.13)
where is the heater power. There are no geometrical dependencies left in this equation,
and so it behaves as expected, with zero voltage output at 0° and 90° (where there are no
transverse effects) and a maximum value somewhere in between.
If the sensitivity of the device is calculated, Eq. 4.12 is simply divided by the heat
flux:
( ) ⊥−== ||2
1 2sin''
α (4.14)

73
This is still a valid way to calculate the output voltage of the device, but the that remains in the equation presents a problem. Recall that the length of the device was
calculated as
αsin
⋅=
(4.15)
where is the number of layers, is the thickness of each layer, and α is the angle of the
device. The equation is thus not valid for small angles, where tends to get very large.
For moderate angles this is somewhat valid because the length of the device does increase
with decreasing α, but it is unknown how accurate this method is since the smallest angle
tested was 44°.
As shown in Figure 4.22, this alternate method results in about the same amount
of error between the predicted and actual values, but it is nonsensical at small angles.
This method makes more sense for engineering uses, but the geometry of the device
prevents it from being as effective as the original method of choosing a specific value of
heater power.
4.7 Summary
The device was tested for its heat flux sensing capabilities by setting it to nine
different angles and taking steady state measurements of its output voltage when
subjected to known heat fluxes. The results were fairly linear, and repeatable from day
to day. However, there were inconsistencies between angles due to unknown errors in
the preparation of the device. Insulation was added to the heater for the last few tests to
improve the assumption that all the heat was flowing through the device.
The experimental results from testing were compared to values of the output
voltage predicted from theory. The data followed the same trend of the predicted values,
but there was a significant gap between the two. An uncertainty analysis was performed

74
to see if the data would match the predicted values under certain conditions, and it was
concluded that the most likely source of error was the measured heat flux.
The results matched the general shape of the predicted values, but a more refined
process of constructing and testing the device would almost certainly result in more
accurate data. A thorough discussion of possible improvements is presented in the next
chapter.

75
Chapter 5 – Conclusions and Recommendations
5.1 Summary of Results and Analysis
Although the transverse multilayered device did not display thermoelectric
cooling effects, its capabilities as a heat flux sensor were tested extensively. A simple
method for testing the device was devised, and the data was collected and compared to
calculated predictions. The results tended to follow the same trends as the calculated
values, but there were significant gaps between the magnitudes of the actual signals and
the predicted values. This was partly explained through uncertainty analysis of the
material properties and the linearity of the actual data, but was most likely due to the
uncertainty in the amount of heat flux that was flowing through the device. Future
projects may get more accurate results if closer attention is paid to these uncertainties.
For example, the properties used in the calculations should be measured rather than taken
from literature. To eliminate uncertainties related to convective losses, the tests should
be performed in a vacuum.
All of the experimental results from heat flux testing on the multilayered device
can be found in Appendix A, but a summary plot is shown in Figure 5.1. The solid black
curve indicates the predicted values of the output voltage (as calculated using equations
modified from Ref. 10), the red dotted lines indicate the maximum and minimum values
of the output voltage based on 15% uncertainties in all the material properties, and the
blue points with error bars indicate the actual data points with maximum and minimum
values based on a 90% confidence interval. The horizontal axis indicates the angle of
inclination of the device. The output voltage of the device depends on the angle because
the angle is included in the Seebeck tensor, which determines the Seebeck coefficient of
the device in the transverse direction based on the material properties of the constituent
materials and the geometry of the device. The maximum output is not at exactly 45°
because the thermal conductivity of the device depends on the angle, and because the
geometry of the device changes with the angle.

76
In Figure 5.1, the three data points closest to the line were tested using insulation
on the heater to decrease heat loss through the top and sides of the heater. The four
“middle” points were gathered before the insulation was added, and it has been
determined that the two “bottom” points are erroneous in some way and their
inconsistencies are not due to thermoelectric effects. It can be seen that the largest source
of error was most likely the calculation of the heat flux going through the device. When
insulation was added, the signal got much closer to the predicted value, and it seems that
with a perfectly insulated heat source (or a better way of determining the amount of heat
flux going through the device), the data points would lie very close to the predicted
curve.
0 10 20 30 40 50 60 70 80 900
1000
2000
3000
4000
5000
6000
Angle from Horizontal, Degrees
Sig
nal, µ
V
Figure 5.1. The final form of the comparison of actual data and predicted values at a heater power of 2 W. Uncertainties in material properties and actual measurements were taken into account, but there is unknown uncertainty in the amount of heat flux that actually reaches the device.
5.2 Achievements of the Project
Other than the data collected, there were many valuable achievements during the
course of this project. Simple techniques were developed for measuring the cooling and
Predicted Signal
Signal Uncertainty (± 21.7%)
Actual Data (Insulation)
Actual Data (No Insulation)
Actual Data (Erroneous)

77
heat flux sensing capabilities of thermoelectric devices and materials. Information
regarding the thermoelectric properties of bismuth and bismuth telluride was gathered.
Equations were modified from Ref. 10 to analyze the results, and a simple uncertainty
analysis revealed many possible improvements to the process. The data and knowledge
collected in this project could lead to the construction of a more reliable and accurate
multilayered device, or eventually to a prototype thin-film device that could display
characteristics that rival those of current thermoelectric technology.
5.3 Recommendations
There are several parts of the project that could be improved. Of course, many
improvements were made along the way, but several other improvements could still be
made. Below is a list of improvements that would be implemented if the project were to
be started anew with the knowledge already gained.
• The most important improvement would be a better way of determining the
amount of heat flux that actually flows through the device. Perhaps a thin-film
heat flux sensor could be placed between the heater and the device. The output
from this sensor would directly relay the amount of heat flux flowing into the
device, although a small amount would still leak from the sides of the device.
Alternatively, the tests could be performed in a vacuum to eliminate convection.
• An improved way to measure the temperature of the top and bottom sides of the
device while testing is needed. This is not as important as measuring the heat
flux, but may be helpful in determining certain characteristics of the device.
• The individual properties of the constituent materials should be measured rather
than taken from references. This would decrease the amount of uncertainty in the
calculated values. Another improvement would be a process by which the
properties of the device can be measured after it has been constructed. These
values could then be directly added to the equations rather than estimated from
the properties of the constituents.

78
• The bismuth layers need to be replaced with another metal that has a higher
melting temperature if the indium film is to be used to connect the layers. The
localized melting in the bismuth layers was detrimental to the structure and
possibly the performance of the device. Any metal will do, so long as the
thermoelectric properties are sufficiently different from those of bismuth telluride.
In fact, this may actually lead to a larger signal, because normal metals have
Seebeck coefficients near zero. The difference between the Seebeck coefficients
of the two constituents would then be larger.
• The layers should be coated with a thin film of nickel to prevent diffusion of the
indium film into the thermoelectric materials. This may or may not have been a
problem with the device in this project.
• More care should be taken when collecting steady state data. Even though the
points for most of the angles are close to the least-squares fits, the small
discrepancies at low heat flux levels cause large uncertainties to arise.
• If possible, the device should be regularly shaped, i.e. parallelograms rather than
rectangles, as in Ref. 10 (see Figure 4.1). This would eliminate the ambiguities
involved in the geometry in the device, but would prevent the process of re-
melting the device and changing the angle at will. Several devices would have to
be built, which may be inconvenient and/or impractical.
5.4 Conclusions
The results of this work indicate that the device displays transverse thermoelectric
properties. The data follow the trend of calculated values, although significant sources of
uncertainty prevented an accurate match between experimental results and calculated
values. Further research is needed to determine whether transverse devices, whether they
are made of layers of thermoelectric materials or thin films, can compete with more
traditional devices for cooling and heat flux sensing.

79
References
[1] R. Venkatasubramanian, E. Siivola, T. Colpitts, and B. O’Quinn, “Thin-film
thermoelectric devices with high room-temperature figures of merit,” Nature, Vol.
413, 2001, pp. 597–602.
[2] Marlow Industries, “Product Description – Single Stage Coolers,”
http://www.marlow.com/Products/productlist.asp?ProductType=10&SubType=0,
(Dallas, TX).
[3] T. E. Diller, “Heat Flux,” The Measurement, Instrumentation, and Sensors
Handbook, CRC Press, Boca Raton, 1999, pp. 34-1–34-15.
[4] Jet Propulsion Laboratory, “Radioisotope Thermoelectric Generators,”
http://voyager.jpl.nasa.gov/spacecraft/instruments_rtg.html, (Pasadena, CA).
[5] Jet Propulsion Laboratory, “Cassini-Huygens: Mission to Saturn & Titan,”
http://saturn.jpl.nasa.gov/spacecraft/safety.cfm, (Pasadena, CA).
[6] National Aeronautics and Space Administration, “Human-Implantable
Thermoelectric Devices,” http://www.nasa.gov/centers/ames/research/technology-
onepagers/human_devices.html, (Ames Research Center, Moffett Field, CA).
[7] T. S. Gudkin and E. É. Fiskind, “Response time of a thermal converter with a
synthetic anisotropy,” Sov. Tech. Phys. Lett., Vol. 4, No. 7, 1978, pp. 844–847.
[8] T. S. Gudkin, E. K. Iordanishvili, and E. É. Fiskind, “Transverse cooling effect in
a statefied medium with artificial anisotropy,” Sov. Tech. Phys. Lett., Vol. 4, No.
5, 1978, pp. 607–610.
[9] V. P. Babin, T. S. Gudkin, Z. M. Dashevskii, L. D. Dudkin, E. K. Iordanishvili,
V. I. Kaidanov, N. V. Kolomoets, O. M. Narva, and L. S. Stil’bans, “Anisotropic
synthetic thermoelements and their maximum capabilities,” Sov. Phys.
Semicond., Vol. 8, No. 4, 1974, pp. 748–753.
[10] Th. Zahner, R. Förg, and H. Lengfellner, “Transverse thermoelectric response of a
tilted metallic multilayer structure,” Appl. Phys. Lett., Vol. 73, No. 10, 1998, pp.
1364–1366.

80
[11] T. J. Seebeck, Magnetische Polarisation der Metalle und Erzedurch Temperatur-
Differenz. Abhand Deut. Akad. Wiss. Berlin, 1822, pp. 265–373.
[12] J. C. Peltier, Nouvelles experiences sur la caloriecete des courans electriques.
Ann. Chem., LVI, 1834, pp.371–387.
[13] E. Altenkirch, Physikalische Zeitschrift, Vol. 12, 1911, pp. 920–924.
[14] D. M. Rowe, CRC Handbook of Thermoelectrics, CRC Press, Boca Raton, 1994.
[15] R. F. Service, “Temperature rises for devices that turn heat into electricity,”
Science, Vol. 306, 2004, pp. 806–807.
[16] O. Yamashita and S. Tomiyoshi, “Bismuth telluride compounds with high
thermoelectric figures of merit,” J. Appl. Phys., Vol. 93, No. 1, 2003, pp. 368–
374.
[17] I. Stark and M. Stordeur, “New micro thermoelectric devices based on bismuth
telluride – type thin solid films,” 18th Intl. Conf. on Thermoelectrics, 1999, pp.
465–472.
[18] T. C. Harman, P. J. Taylor, M. P. Walsh, and B. E. LaForge, “Quantum dot
superlattice thermoelectric materials and devices,” Science, Vol. 297, 2002, pp.
2229–2232.
[19] A. Majumdar, “Thermoelectricity in semiconductor nanostructures,” Science,
Vol. 303, 2004, pp. 777–778.
[20] D. Vashaee and A. Shakouri, “Improved thermoelectric power factor in metal-
based superlattices,” Phys. Rev. Lett., Vol. 92, No. 10, 2004, pp. 106103-1–
106103-4.
[21] W. Thomson (Lord Kelvin), Mathematical and Physical Papers, Vol. 1,
Cambridge Univ. Press, 1882, pp. 266.
[22] V. I. Kaidanov, V. A. Tselishchev, A. P. Usov, L. D. Dudkin, B. K. Voronov, and
N. N. Trusova, “Anisotropy of the transport properties of chromium disilicide,”
Sov. Phys. Semicond., Vol. 4, No. 7, 1970, pp. 1338–1345.
[23] S. L. Korolyuk, I. M. Pilat, A. G. Samoĭlovich, V. N. Slipchenko, A. A. Snarskiĭ,
and E. F. Tsar’kov, “Anisotropic thermoelements,” Sov. Phys. Semicond., Vol. 7,
No. 4, 1973, pp. 725–733.

81
[24] A. G. Samoĭlovich and A. A. Snarskiĭ, “Investigation of thermoelectric eddy
currents,” Sov. Phys. Semicond., Vol. 13, No. 8, 1979, pp. 1539–1547.
[25] T. S. Gudkin, E. K. Iordanishvili, and E. É. Fiskind, “Theory of an anisotropic
thermoelectric cooling unit,” Sov. Phys. Semicond., Vol. 11, No. 9, 1977, pp.
1790–1794.
[26] L. I. Bytenskiĭ, T. S. Gudkin, E. K. Iordanishvili, and E. É. Fiskind, “Anisotropic
thermoelectric cooling unit in a magnetic field,” Sov. Phys. Semicond., Vol. 12,
No. 3, 1978, pp. 538–542.
[27] V. N. Slipchenko and A. A. Snarskiĭ, “Influence of the anisotropy of the thermal
conductivity on the transverse thermoelectric power,” Sov. Phys. Semicond., Vol.
8, No. 10, 1974, pp. 2010–2013.
[28] O. Ya. Luste and A. G. Samoĭlovich, “Influence of the thermal conductivity
anisotropy on the transverse thermoelectric power,” Sov. Phys. Semicond., Vol.
11, No. 1, 1977, pp. 209–211.
[29] A. A. Snarskiĭ, “Thermo-emf of anisotropic thermoelements. I. Rectangular
elements,” Sov. Phys. Semicond., Vol. 11, No. 10, 1977, pp. 2053–2055.
[30] A. G. Samoĭlovich and V. N. Slipchenko, “The emf of an anisotropic
thermoelement,” Sov. Phys. Semicond., Vol. 9, No. 3, 1975, pp. 594–596.
[31] O. S. Gorya and E. F. Lupashko, “Optimization of the figure of merit of a
thermoelement with a deliberately induced anisotropy,” Sov. Phys. Semicond.,
Vol. 13, No. 2, 1979, pp. 340–343.
[32] H. Lengfellner, G. Kremb, A. Schnellbögl, J. Betz, K. F. Renk, and W. Prettl,
“Giant voltages upon surface heating in normal YBa2Cu3O7-δ films suggesting an
atomic layer thermopile,” Appl. Phys. Lett., Vol. 60, No. 4, 1992, pp. 501–503.
[33] L. R. Testardi, “Anomalous laser-induced voltages in YBa2Cu3Ox and ‘off-
diagonal’ thermoelectricity,” Appl. Phys. Lett., Vol. 64, No. 18, 1994, pp. 2347–
2349.
[34] S. Zeuner, W. Prettl, and H. Lengfellner, “Fast thermoelectric response of normal
state YBa2Cu3O7-δ films,” Appl. Phys. Lett., Vol. 66, No. 14, 1995, pp. 1833–
1835.
82
[35] W. M. Huber, S. T. Li, A. Ritzer, D. Bäuerle, H. Lengfellner, and W. Prettl,
“Transverse Seebeck effect in Bi2Sr2CaCu2O8,” Appl. Phys. A, Vol. 64, 1997, pp.
487–489.
[36] Th. Zahner, R. Schreiner, R. Stierstorfer, O. Kus, S. T. Li, R. Roessler, J. D.
Pedarnig, D. Bäuerle, and H. Lengfellner, “Off-diagonal Seebeck effect and
anisotropic thermopower in Bi2Sr2CaCu2O8 thin films,” Europhys. Lett., Vol. 40,
No. 6, 1997, pp. 673–678.
[37] A. A. Snarskiĭ, A. M. Pal’ti, and A. A. Ashcheulov, “Anisotropic thermocouples
article,” Semiconductors, Vol. 31, No.11, 1997, pp. 1281–1298.
[38] N. Mateeva, H. Niculescu, J. Schlenoff, and L. Testardi, “Thermoelectric
begavior of conducting polymers: On the possibility of ‘off-diagonal’
thermoelectricity,” Mat. Res. Soc. Symp. Proc., Vol. 478, 1997, pp. 243–248.
[39] K. Fischer, C. Stoiber, A. Kyarad, H. Lengfellner, “Anisotropic thermopower in
tilted metallic multilayer structures,” Appl. Phys. A, Vol. 78, 2004, pp. 323–326.
[40] S. Cho, Y. Kim, A. DiVenere, G. K. L. Wong, and J. B. Ketterson, “Anisotropic
Seebeck and magneto-Seebeck coefficients of Bi and Bi0.92Sb0.08 alloy thin films,”
J. Appl. Phys., Vol. 88, No. 2, 2000, pp. 808–812.
[41] Vatell Corporation, “Heat Flux Transducers,”
http://www.vatell.com/HF%20Sensors.htm, (Christiansburg, VA).
[42] R. S. Figiola and D. E. Beasley, Theory and Design for Mechanical
Measurements, 2nd Edition, John Wiley and Sons, Inc., New York, 1995.

83
Appendix A – Heat Flux Sensing Data
This appendix shows the data from all nine angles tested with the multilayered
device built with indium film connections. The first plot shows the data used to calculate
the signal strength for every angle. Following are plots and tables for each individual
angle. In each case, the first plot shows all data taken for that angle, and the second plot
shows the truncated data. Recall that the data from the first few days for several angles
was discarded because the steady state results were not consistent in that time period.
The plots of the truncated results also show the results of uncertainty analysis.
The red dashed lines indicate the maximum and minimum values of the slope from the
“guessing” method (method 1), while the blue dashed lines indicate the maximum and
minimum values of the slope from the statistical method (method 2), using a 90%
confidence level. Individual points on any plot correspond to one steady state test.
0 0.5 1 1.5 2 2.5 3 3.5 4 4.50
1000
2000
3000
4000
5000
6000
Heat Flux, W/cm2
Voltage O
utp
ut,
µV
α = 77o (A)
α = 58o (B)
α = 47o (C)
α = 59o (D)
α = 66o (E)
α = 44o (F)
α = 84o (G)
α = 65o (H)
α = 47o (I)
Figure A.1. All useable heat flux sensing data from each of the nine tested angles.

84
0 0.5 1 1.5 2 2.5 3 3.5 4 4.5 50
200
400
600
800
1000
1200
1400
Heat Flux, W/cm2
Voltage O
utp
ut,
µV
1/23/06
1/24/06
1/25/06
1/26/06
1/27/06
1/30/06
1/31/06
2/1/06
2/2/06
2/3/06
Figure A.2. All data from steady state heat flux sensing tests with the angle α = 77° (A).
0 0.5 1 1.5 2 2.5 3 3.5 4 4.50
200
400
600
800
1000
1200
1400
1600
Heat Flux, W/cm2
Voltage O
utp
ut,
µV
Figure A.3. Truncated data from the angle α = 77° (A). The slope of the least-squares fit is 289.9 µV/(W/cm2) and the uncertainties from method 1 and method 2 are ±10% and ±17.6% respectively.
Experimental Data
Least Squares Fit
Method 1 Uncertainty
Method 2 Uncertainty
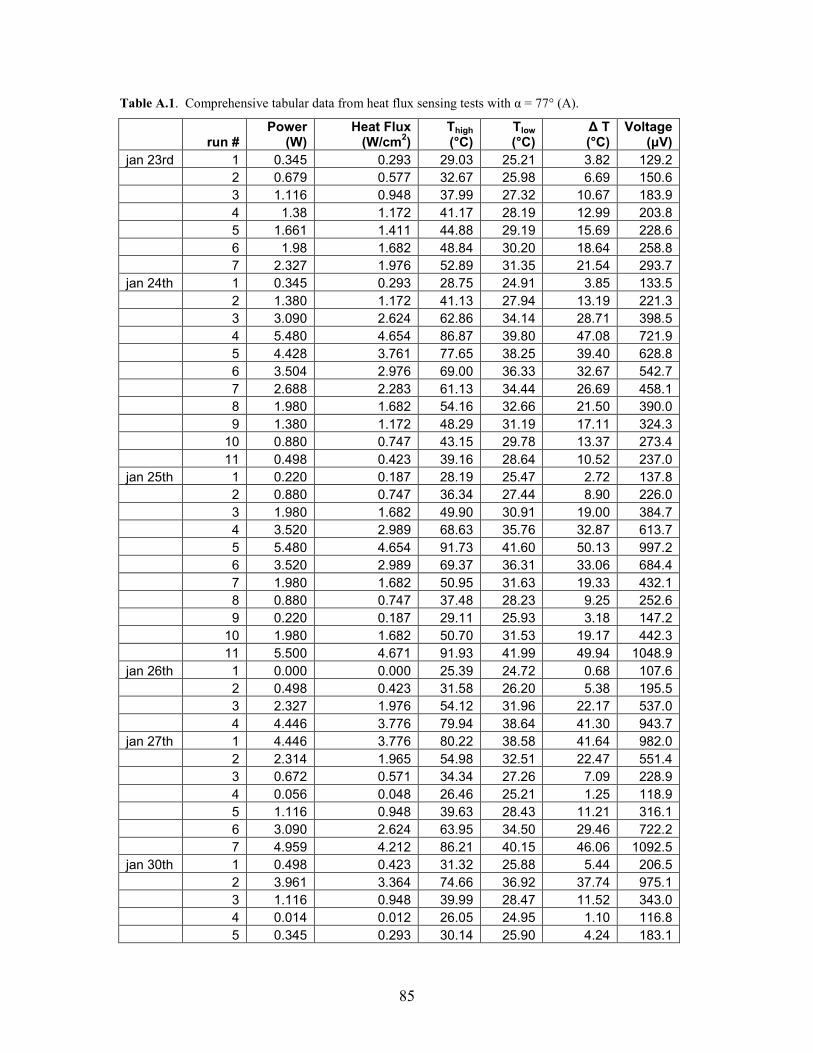
85
Table A.1. Comprehensive tabular data from heat flux sensing tests with α = 77° (A).
run # Power
(W) Heat Flux (W/cm
2)
Thigh (°C)
Tlow (°C)
∆ T (°C)
Voltage (µV)
jan 23rd 1 0.345 0.293 29.03 25.21 3.82 129.2
2 0.679 0.577 32.67 25.98 6.69 150.6
3 1.116 0.948 37.99 27.32 10.67 183.9
4 1.38 1.172 41.17 28.19 12.99 203.8
5 1.661 1.411 44.88 29.19 15.69 228.6
6 1.98 1.682 48.84 30.20 18.64 258.8
7 2.327 1.976 52.89 31.35 21.54 293.7
jan 24th 1 0.345 0.293 28.75 24.91 3.85 133.5
2 1.380 1.172 41.13 27.94 13.19 221.3
3 3.090 2.624 62.86 34.14 28.71 398.5
4 5.480 4.654 86.87 39.80 47.08 721.9
5 4.428 3.761 77.65 38.25 39.40 628.8
6 3.504 2.976 69.00 36.33 32.67 542.7
7 2.688 2.283 61.13 34.44 26.69 458.1
8 1.980 1.682 54.16 32.66 21.50 390.0
9 1.380 1.172 48.29 31.19 17.11 324.3
10 0.880 0.747 43.15 29.78 13.37 273.4
11 0.498 0.423 39.16 28.64 10.52 237.0
jan 25th 1 0.220 0.187 28.19 25.47 2.72 137.8
2 0.880 0.747 36.34 27.44 8.90 226.0
3 1.980 1.682 49.90 30.91 19.00 384.7
4 3.520 2.989 68.63 35.76 32.87 613.7
5 5.480 4.654 91.73 41.60 50.13 997.2
6 3.520 2.989 69.37 36.31 33.06 684.4
7 1.980 1.682 50.95 31.63 19.33 432.1
8 0.880 0.747 37.48 28.23 9.25 252.6
9 0.220 0.187 29.11 25.93 3.18 147.2
10 1.980 1.682 50.70 31.53 19.17 442.3
11 5.500 4.671 91.93 41.99 49.94 1048.9
jan 26th 1 0.000 0.000 25.39 24.72 0.68 107.6
2 0.498 0.423 31.58 26.20 5.38 195.5
3 2.327 1.976 54.12 31.96 22.17 537.0
4 4.446 3.776 79.94 38.64 41.30 943.7
jan 27th 1 4.446 3.776 80.22 38.58 41.64 982.0
2 2.314 1.965 54.98 32.51 22.47 551.4
3 0.672 0.571 34.34 27.26 7.09 228.9
4 0.056 0.048 26.46 25.21 1.25 118.9
5 1.116 0.948 39.63 28.43 11.21 316.1
6 3.090 2.624 63.95 34.50 29.46 722.2
7 4.959 4.212 86.21 40.15 46.06 1092.5
jan 30th 1 0.498 0.423 31.32 25.88 5.44 206.5
2 3.961 3.364 74.66 36.92 37.74 975.1
3 1.116 0.948 39.99 28.47 11.52 343.0
4 0.014 0.012 26.05 24.95 1.10 116.8
5 0.345 0.293 30.14 25.90 4.24 183.1

86
6 5.480 4.654 92.79 41.76 51.02 1334.6
7 1.370 1.164 43.75 29.88 13.87 406.5
8 1.661 1.411 47.03 30.45 16.58 470.8
9 3.090 2.624 64.51 34.76 29.76 812.4
10 0.880 0.747 37.39 28.12 9.27 299.6
jan 31st 1 0.498 0.423 32.31 26.85 5.46 217.1
2 2.688 2.283 59.57 33.71 25.86 723.4
3 4.959 4.212 86.26 40.25 46.01 1268.9
4 1.661 1.411 47.74 31.21 16.53 486.0
5 0.679 0.577 34.94 27.72 7.22 257.5
6 0.000 0.000 26.08 25.35 0.73 109.2
7 0.126 0.107 27.60 25.70 1.90 136.1
8 0.992 0.842 40.14 28.83 11.31 361.8
9 3.978 3.378 74.98 37.44 37.54 1052.1
feb 1st 1 2.327 1.976 55.09 32.25 22.84 669
2 2.511 2.133 57.43 32.92 24.51 718.3
3 2.688 2.283 59.71 33.46 26.25 760.5
4 2.886 2.451 62.21 34.14 28.07 811.5
5 3.090 2.624 64.73 34.79 29.94 863.3
6 3.302 2.804 67.21 35.39 31.82 910.4
7 3.520 2.989 69.82 36.06 33.76 967.6
8 3.729 3.167 72.56 36.72 35.84 1028.2
9 3.961 3.364 75.25 37.41 37.84 1078.1
feb 2nd 1 0.000 0.000 25.12 24.38 0.74 108.7
2 0.220 0.187 27.94 25.15 2.79 158.9
3 0.880 0.747 36.73 27.51 9.22 316.8
4 1.980 1.682 48.04 30.55 17.49 534.3
5 2.688 2.283 55.06 32.31 22.76 676.4
feb 3rd 1 0.498 0.423 32.08 26.57 5.51 229.4
2 1.380 1.172 43.64 29.64 14.00 451.5
3 3.090 2.624 65.37 35.44 29.93 893.0
4 3.520 2.989 70.72 36.79 33.93 1007.3
5 3.961 3.364 76.20 38.16 38.03 1123.0
6 4.446 3.776 82.30 39.72 42.57 1246.1

87
0 0.5 1 1.5 2 2.5 3 3.5 4 4.50
500
1000
1500
2000
2500
3000
3500
4000
4500
5000
Heat Flux, W/cm2
Voltage O
utp
ut,
µV
2/21/06
2/22/06
2/24/06
2/27/06
2/28/06
Figure A.4. All data from steady state heat flux sensing tests with the angle α = 58° (B).
0 0.5 1 1.5 2 2.5 3 3.5 4 4.50
1000
2000
3000
4000
5000
6000
Heat Flux, W/cm2
Voltage O
utp
ut,
µV
Figure A.5. Truncated data from the angle α = 58° (B). The slope of the least-squares fit is 1172.0 µV/(W/cm2) and the uncertainties from method 1 and method 2 are ±2% and ±6.8% respectively.
Experimental Data
Least Squares Fit
Method 1 Uncertainty
Method 2 Uncertainty
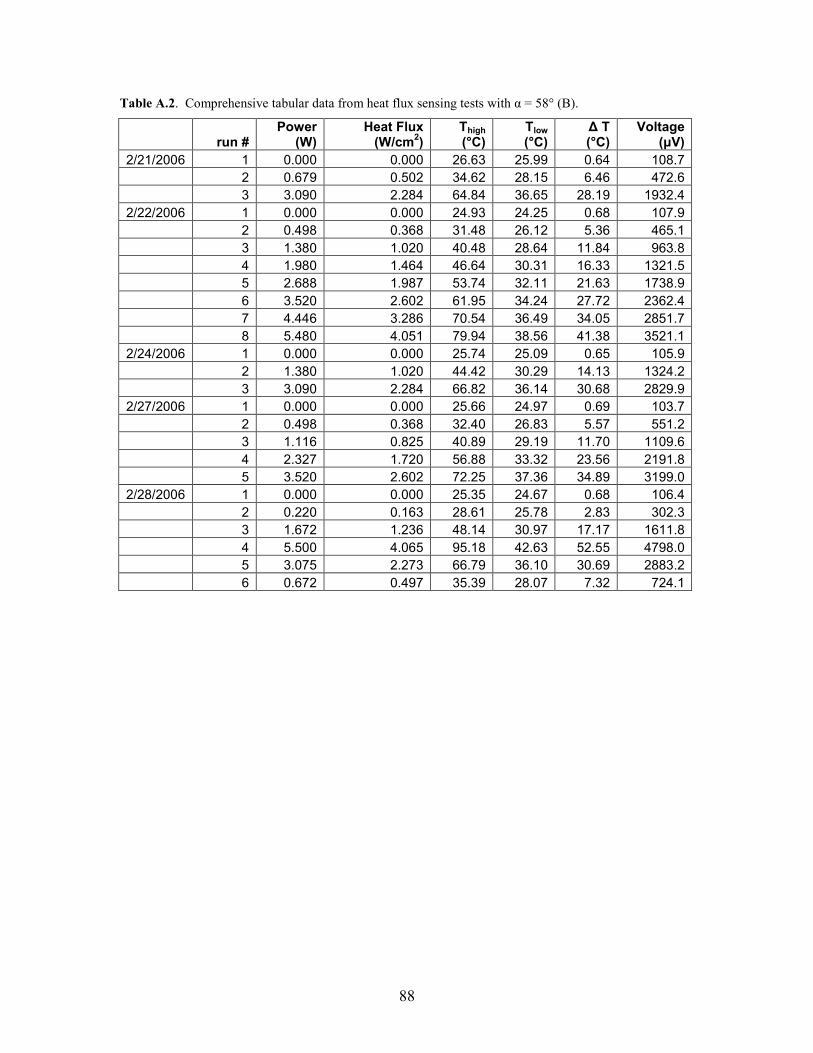
88
Table A.2. Comprehensive tabular data from heat flux sensing tests with α = 58° (B).
run # Power
(W) Heat Flux (W/cm
2)
Thigh (°C)
Tlow (°C)
∆ T (°C)
Voltage (µV)
2/21/2006 1 0.000 0.000 26.63 25.99 0.64 108.7
2 0.679 0.502 34.62 28.15 6.46 472.6
3 3.090 2.284 64.84 36.65 28.19 1932.4
2/22/2006 1 0.000 0.000 24.93 24.25 0.68 107.9
2 0.498 0.368 31.48 26.12 5.36 465.1
3 1.380 1.020 40.48 28.64 11.84 963.8
4 1.980 1.464 46.64 30.31 16.33 1321.5
5 2.688 1.987 53.74 32.11 21.63 1738.9
6 3.520 2.602 61.95 34.24 27.72 2362.4
7 4.446 3.286 70.54 36.49 34.05 2851.7
8 5.480 4.051 79.94 38.56 41.38 3521.1
2/24/2006 1 0.000 0.000 25.74 25.09 0.65 105.9
2 1.380 1.020 44.42 30.29 14.13 1324.2
3 3.090 2.284 66.82 36.14 30.68 2829.9
2/27/2006 1 0.000 0.000 25.66 24.97 0.69 103.7
2 0.498 0.368 32.40 26.83 5.57 551.2
3 1.116 0.825 40.89 29.19 11.70 1109.6
4 2.327 1.720 56.88 33.32 23.56 2191.8
5 3.520 2.602 72.25 37.36 34.89 3199.0
2/28/2006 1 0.000 0.000 25.35 24.67 0.68 106.4
2 0.220 0.163 28.61 25.78 2.83 302.3
3 1.672 1.236 48.14 30.97 17.17 1611.8
4 5.500 4.065 95.18 42.63 52.55 4798.0
5 3.075 2.273 66.79 36.10 30.69 2883.2
6 0.672 0.497 35.39 28.07 7.32 724.1

89
0 0.5 1 1.5 2 2.5 3 3.5 40
200
400
600
800
1000
1200
Heat Flux, W/cm2
Voltage O
utp
ut,
µV
3/1/06
3/2/06
3/3/06
3/6/06
3/7/06
3/8/06
Figure A.6. All data from steady state heat flux sensing tests with the angle α = 47° (C).
0 0.5 1 1.5 2 2.5 3 3.5 40
100
200
300
400
500
600
700
800
900
1000
Heat Flux, W/cm2
Voltage O
utp
ut,
µV
Figure A.7. Truncated data from the angle α = 47° (C). The slope of the least-squares fit is 173.2 µV/(W/cm2) and the uncertainties from method 1 and method 2 are ±15% and ±28.8% respectively.
Experimental Data
Least Squares Fit
Method 1 Uncertainty
Method 2 Uncertainty
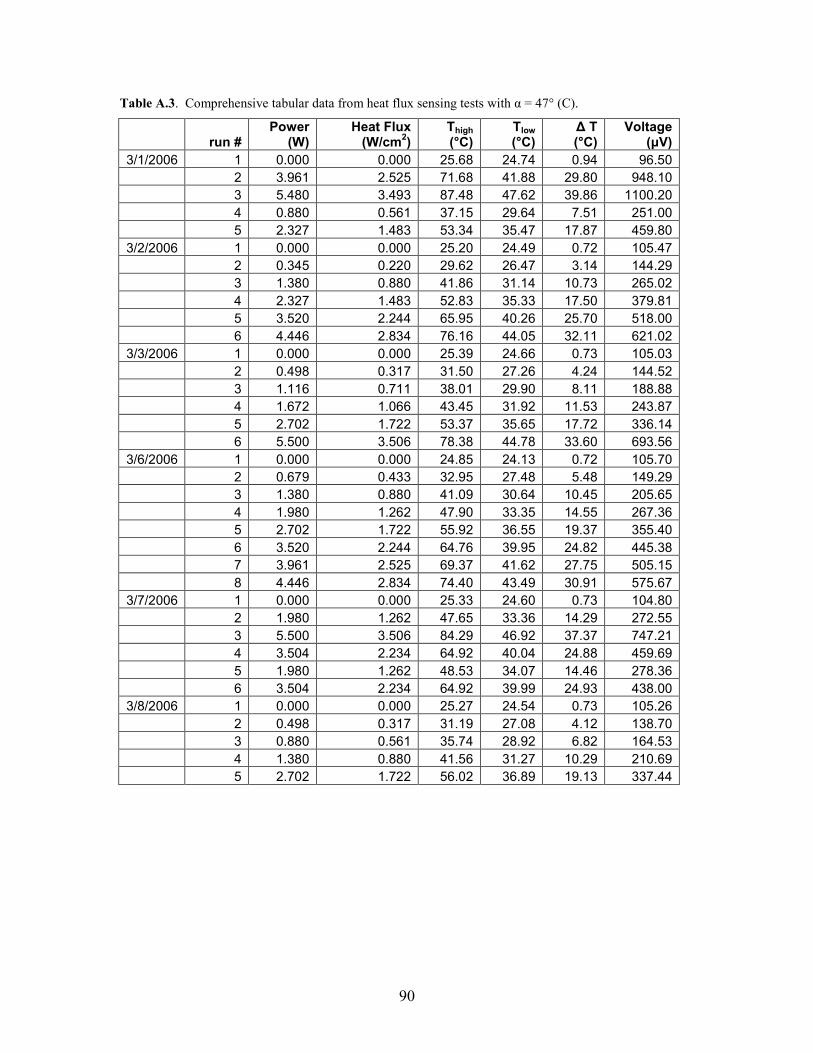
90
Table A.3. Comprehensive tabular data from heat flux sensing tests with α = 47° (C).
run # Power
(W) Heat Flux (W/cm
2)
Thigh (°C)
Tlow (°C)
∆ T (°C)
Voltage (µV)
3/1/2006 1 0.000 0.000 25.68 24.74 0.94 96.50
2 3.961 2.525 71.68 41.88 29.80 948.10
3 5.480 3.493 87.48 47.62 39.86 1100.20
4 0.880 0.561 37.15 29.64 7.51 251.00
5 2.327 1.483 53.34 35.47 17.87 459.80
3/2/2006 1 0.000 0.000 25.20 24.49 0.72 105.47
2 0.345 0.220 29.62 26.47 3.14 144.29
3 1.380 0.880 41.86 31.14 10.73 265.02
4 2.327 1.483 52.83 35.33 17.50 379.81
5 3.520 2.244 65.95 40.26 25.70 518.00
6 4.446 2.834 76.16 44.05 32.11 621.02
3/3/2006 1 0.000 0.000 25.39 24.66 0.73 105.03
2 0.498 0.317 31.50 27.26 4.24 144.52
3 1.116 0.711 38.01 29.90 8.11 188.88
4 1.672 1.066 43.45 31.92 11.53 243.87
5 2.702 1.722 53.37 35.65 17.72 336.14
6 5.500 3.506 78.38 44.78 33.60 693.56
3/6/2006 1 0.000 0.000 24.85 24.13 0.72 105.70
2 0.679 0.433 32.95 27.48 5.48 149.29
3 1.380 0.880 41.09 30.64 10.45 205.65
4 1.980 1.262 47.90 33.35 14.55 267.36
5 2.702 1.722 55.92 36.55 19.37 355.40
6 3.520 2.244 64.76 39.95 24.82 445.38
7 3.961 2.525 69.37 41.62 27.75 505.15
8 4.446 2.834 74.40 43.49 30.91 575.67
3/7/2006 1 0.000 0.000 25.33 24.60 0.73 104.80
2 1.980 1.262 47.65 33.36 14.29 272.55
3 5.500 3.506 84.29 46.92 37.37 747.21
4 3.504 2.234 64.92 40.04 24.88 459.69
5 1.980 1.262 48.53 34.07 14.46 278.36
6 3.504 2.234 64.92 39.99 24.93 438.00
3/8/2006 1 0.000 0.000 25.27 24.54 0.73 105.26
2 0.498 0.317 31.19 27.08 4.12 138.70
3 0.880 0.561 35.74 28.92 6.82 164.53
4 1.380 0.880 41.56 31.27 10.29 210.69
5 2.702 1.722 56.02 36.89 19.13 337.44

91
0 0.5 1 1.5 2 2.5 3 3.5 4 4.5100
200
300
400
500
600
700
800
900
Heat Flux, W/cm2
Voltage O
utp
ut,
µV
3/21/06
3/22/06
Figure A.8. All data from steady state heat flux sensing tests with the angle α = 59° (D).
0 0.5 1 1.5 2 2.5 3 3.5 4 4.5100
200
300
400
500
600
700
800
900
1000
Heat Flux, W/cm2
Voltage O
utp
ut,
µV
Figure A.9. Truncated data from the angle α = 59° (D). The slope of the least-squares fit is 175.9 µV/(W/cm2) and the uncertainties from method 1 and method 2 are ±4% and ±14.6% respectively.
Experimental Data
Least Squares Fit
Method 1 Uncertainty
Method 2 Uncertainty

92
Table A.4. Comprehensive tabular data from heat flux sensing tests with α = 59° (D).
run # Power
(W) Heat Flux (W/cm
2)
Thigh (°C)
Tlow (°C)
∆ T (°C)
Voltage (µV)
3/21/2006 1 1.980 1.479 51.04 34.80 16.24 395.54
2 2.702 2.019 59.76 38.12 21.64 486.18
3 3.520 2.630 69.62 41.77 27.85 575.54
4 4.446 3.322 80.45 45.68 34.76 693.23
5 5.480 4.094 91.93 49.76 42.18 817.88
6 0.220 0.164 29.51 27.03 2.48 141.85
7 0.000 0.000 26.82 26.08 0.74 106.55
3/22/2006 1 0.000 0.000 26.58 25.89 0.69 101.58
2 0.679 0.507 34.61 28.67 5.94 214.95
3 1.116 0.834 39.83 30.41 9.42 282.19
4 2.327 1.739 54.74 35.95 18.79 445.38
5 3.090 2.309 63.99 39.28 24.71 532.16
6 3.978 2.972 74.30 42.99 31.32 643.43
7 4.959 3.705 85.82 47.21 38.61 786.19
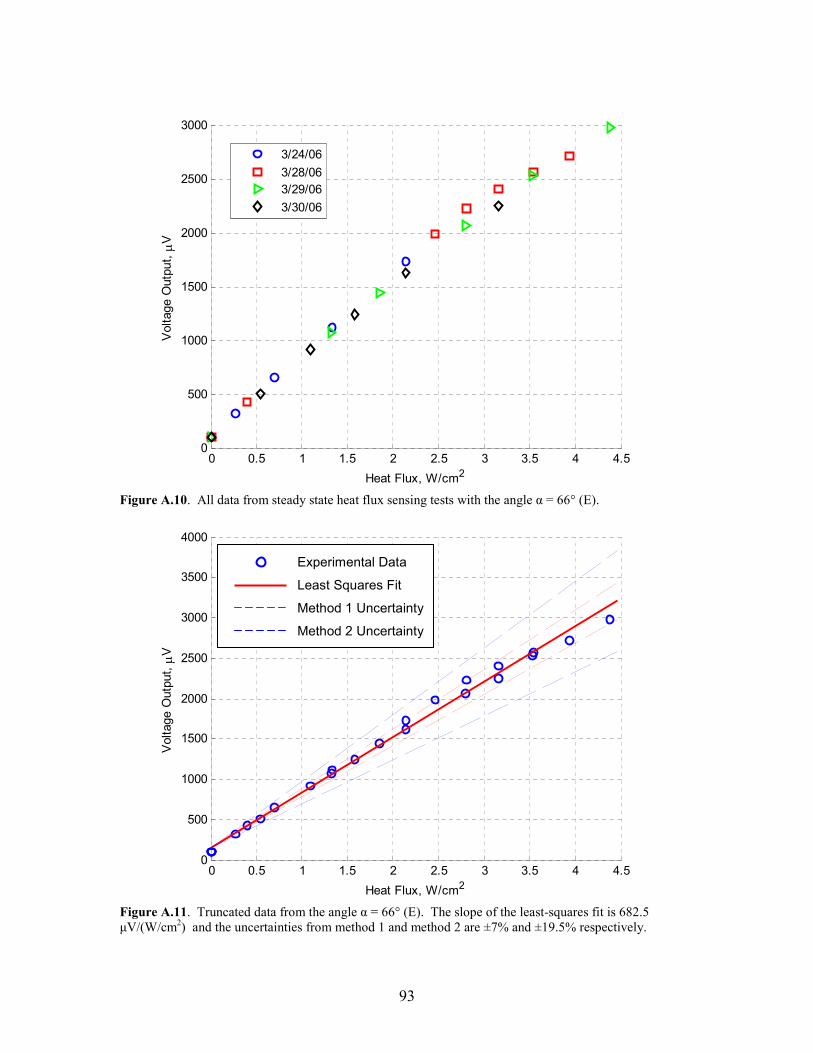
93
0 0.5 1 1.5 2 2.5 3 3.5 4 4.50
500
1000
1500
2000
2500
3000
Heat Flux, W/cm2
Voltage O
utp
ut,
µV
3/24/06
3/28/06
3/29/06
3/30/06
Figure A.10. All data from steady state heat flux sensing tests with the angle α = 66° (E).
0 0.5 1 1.5 2 2.5 3 3.5 4 4.50
500
1000
1500
2000
2500
3000
3500
4000
Heat Flux, W/cm2
Voltage O
utp
ut,
µV
Figure A.11. Truncated data from the angle α = 66° (E). The slope of the least-squares fit is 682.5 µV/(W/cm2) and the uncertainties from method 1 and method 2 are ±7% and ±19.5% respectively.
Experimental Data
Least Squares Fit
Method 1 Uncertainty
Method 2 Uncertainty

94
Table A.5. Comprehensive tabular data from heat flux sensing tests with α = 66° (E).
run # Power
(W) Heat Flux (W/cm
2)
Thigh (°C)
Tlow (°C)
∆ T (°C)
Voltage (µV)
3/24/2006 1 0.000 0.000 26.09 25.47 0.62 102.7
2 0.345 0.275 30.73 27.29 3.44 321.3
3 0.880 0.701 38.27 30.43 7.84 653.7
4 1.672 1.331 48.81 34.56 14.25 1122.7
5 2.688 2.140 62.24 39.88 22.36 1728.8
3/28/2006 1 0.000 0.000 25.50 24.79 0.71 101.5
2 0.498 0.397 32.66 27.94 4.72 425.0
3 3.090 2.460 66.37 41.12 25.25 1985.8
4 3.520 2.803 71.94 43.42 28.52 2224.1
5 3.961 3.154 77.42 45.56 31.86 2407.2
6 4.446 3.540 83.04 47.26 35.77 2561.6
7 4.940 3.934 88.68 49.01 39.66 2718.1
3/29/2006 1 0.000 0.000 25.16 24.46 0.70 104.1
2 5.500 4.379 94.57 50.55 44.02 2980.3
3 4.428 3.526 82.53 46.36 36.17 2535.0
4 3.504 2.790 71.69 42.65 29.04 2067.5
5 2.327 1.853 56.91 37.20 19.71 1446.9
6 1.661 1.323 48.12 33.85 14.27 1075.2
3/30/2006 1 0.000 0.000 25.45 24.78 0.67 101.0
2 0.679 0.541 34.85 28.66 6.19 503.2
3 1.380 1.099 44.28 32.28 12.00 914.0
4 1.980 1.577 52.29 35.33 16.95 1242.2
5 2.688 2.140 61.53 38.87 22.66 1624.9
6 3.961 3.154 77.28 44.61 32.66 2253.7

95
0 0.5 1 1.5 2 2.50
500
1000
1500
2000
2500
3000
3500
4000
4500
Heat Flux, W/cm2
Voltage O
utp
ut,
µV
4/10/06
Figure A.12. All data from steady state heat flux sensing tests with the angle α = 44° (F).
0 0.5 1 1.5 2 2.50
500
1000
1500
2000
2500
3000
3500
4000
4500
5000
Heat Flux, W/cm2
Voltage O
utp
ut,
µV
Figure A.13. Truncated data from the angle α = 44° (F). The slope of the least-squares fit is 1980.1 µV/(W/cm2) and the uncertainties from method 1 and method 2 are ±3% and ±8.5% respectively.
Experimental Data
Least Squares Fit
Method 1 Uncertainty
Method 2 Uncertainty

96
Table A.6. Comprehensive tabular data from heat flux sensing tests with α = 44° (F).
run # Power
(W) Heat Flux (W/cm
2)
Thigh (°C)
Tlow (°C)
∆ T (°C)
Voltage (µV)
4/10/2006 1 0.000 0.000 24.83 24.12 0.71 100.7
2 0.679 0.411 34.70 28.68 6.02 970.2
3 1.380 0.836 45.14 33.63 11.51 1854.4
4 1.980 1.199 53.84 37.64 16.20 2601.7
5 2.688 1.628 63.75 42.17 21.59 3454.2
6 3.520 2.131 74.78 47.02 27.76 4280.3

97
0 0.5 1 1.5 2 2.5 3 3.5100
200
300
400
500
600
700
800
Heat Flux, W/cm2
Voltage O
utp
ut,
µV
4/21/06
4/24/06
4/26/06
Figure A.14. All data from steady state heat flux sensing tests with the angle α = 84° (G).
0 0.5 1 1.5 2 2.5 3 3.5100
200
300
400
500
600
700
800
900
Heat Flux, W/cm2
Voltage O
utp
ut,
µV
Figure A.15. Truncated data from the angle α = 84° (G). The slope of the least-squares fit is 190.2 µV/(W/cm2) and the uncertainties from method 1 and method 2 are ±5% and ±14.2% respectively.
Experimental Data
Least Squares Fit
Method 1 Uncertainty
Method 2 Uncertainty

98
Table A.7. Comprehensive tabular data from heat flux sensing tests with α = 84° (G).
run # Power
(W) Heat Flux (W/cm
2)
Thigh (°C)
Tlow (°C)
∆ T (°C)
Voltage (µV)
4/21/2006 1 0.000 0.000 26.06 25.43 0.63 102.8
2 0.880 0.763 41.11 29.76 11.35 214.2
3 1.661 1.440 54.01 33.45 20.56 276.0
4 2.327 2.017 64.60 36.42 28.18 345.6
5 3.075 2.666 76.32 39.51 36.81 462.2
6 3.504 3.037 82.72 41.20 41.52 551.1
4/24/2006 1 0.000 0.000 25.51 24.91 0.60 101.9
2 0.880 0.763 40.64 29.13 11.51 270.6
3 1.370 1.188 48.61 31.20 17.42 359.4
4 2.314 2.006 63.59 35.21 28.39 508.2
5 3.090 2.679 75.52 38.49 37.03 599.7
4/26/2006 1 0.000 0.000 25.19 24.59 0.60 100.6
2 0.672 0.583 37.08 28.12 8.97 230.0
3 2.327 2.017 63.98 35.40 28.58 507.9
4 3.504 3.037 82.20 40.15 42.05 689.8
5 3.944 3.419 88.92 41.91 47.01 764.6

99
0 0.5 1 1.5 2 2.5 3 3.50
500
1000
1500
2000
2500
3000
3500
4000
4500
Heat Flux, W/cm2
Voltage O
utp
ut,
µV
5/4/06
5/5/06
5/8/06
Figure A.16. All data from steady state heat flux sensing tests with the angle α = 65° (H).
0 0.5 1 1.5 2 2.5 3 3.5 40
500
1000
1500
2000
2500
3000
3500
4000
4500
5000
Heat Flux, W/cm2
Voltage O
utp
ut,
µV
Figure A.17. Truncated data from the angle α = 65° (H). The slope of the least-squares fit is 1197.8 µV/(W/cm2) and the uncertainties from method 1 and method 2 are ±4% and ±11.0% respectively.
Experimental Data
Least Squares Fit
Method 1 Uncertainty
Method 2 Uncertainty
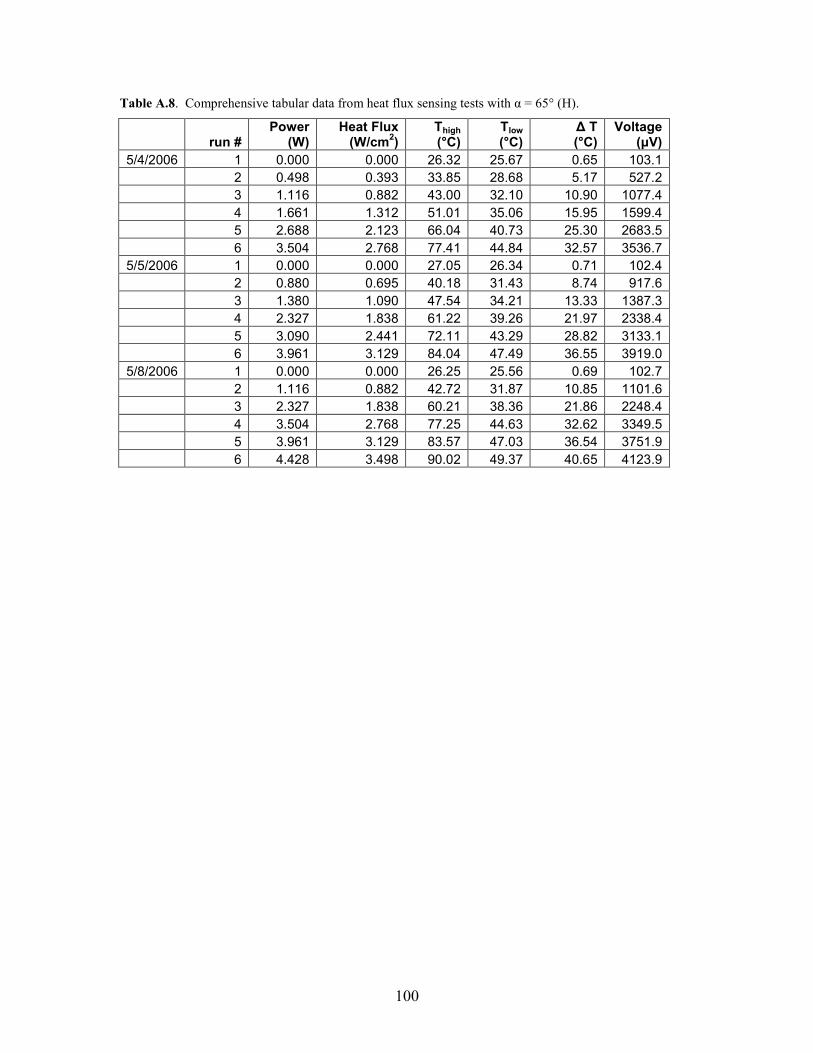
100
Table A.8. Comprehensive tabular data from heat flux sensing tests with α = 65° (H).
run # Power
(W) Heat Flux (W/cm
2)
Thigh (°C)
Tlow (°C)
∆ T (°C)
Voltage (µV)
5/4/2006 1 0.000 0.000 26.32 25.67 0.65 103.1
2 0.498 0.393 33.85 28.68 5.17 527.2
3 1.116 0.882 43.00 32.10 10.90 1077.4
4 1.661 1.312 51.01 35.06 15.95 1599.4
5 2.688 2.123 66.04 40.73 25.30 2683.5
6 3.504 2.768 77.41 44.84 32.57 3536.7
5/5/2006 1 0.000 0.000 27.05 26.34 0.71 102.4
2 0.880 0.695 40.18 31.43 8.74 917.6
3 1.380 1.090 47.54 34.21 13.33 1387.3
4 2.327 1.838 61.22 39.26 21.97 2338.4
5 3.090 2.441 72.11 43.29 28.82 3133.1
6 3.961 3.129 84.04 47.49 36.55 3919.0
5/8/2006 1 0.000 0.000 26.25 25.56 0.69 102.7
2 1.116 0.882 42.72 31.87 10.85 1101.6
3 2.327 1.838 60.21 38.36 21.86 2248.4
4 3.504 2.768 77.25 44.63 32.62 3349.5
5 3.961 3.129 83.57 47.03 36.54 3751.9
6 4.428 3.498 90.02 49.37 40.65 4123.9

101
0 0.5 1 1.5 2 2.50
1000
2000
3000
4000
5000
6000
Heat Flux, W/cm2
Voltage O
utp
ut,
µV
5/11/06
5/12/06
5/15/06
Figure A.18. All data from steady state heat flux sensing tests with the angle α = 47° (I).
0 0.5 1 1.5 2 2.50
1000
2000
3000
4000
5000
6000
Heat Flux, W/cm2
Voltage O
utp
ut,
µV
Figure A.19. Truncated data from the angle α = 47° (I). The slope of the least-squares fit is 2321.6 µV/(W/cm2) and the uncertainties from method 1 and method 2 are ±3% and ±6.7% respectively.
Experimental Data
Least Squares Fit
Method 1 Uncertainty
Method 2 Uncertainty

102
Table A.9. Comprehensive tabular data from heat flux sensing tests with α = 47° (I).
run # Power
(W) Heat Flux (W/cm
2)
Thigh (°C)
Tlow (°C)
∆ T (°C)
Voltage (µV)
5/11/2006 1 0.000 0.000 26.70 26.05 0.65 104.8
2 0.672 0.428 39.38 32.86 6.53 1058.5
3 1.116 0.711 47.80 37.47 10.33 1711.4
4 1.661 1.059 58.03 43.06 14.98 2573.0
5 2.314 1.475 69.92 49.63 20.29 3606.6
6 3.090 1.970 83.28 57.01 26.27 4513.7
5/12/2006 1 0.000 0.000 25.82 25.13 0.69 101.8
2 0.880 0.561 42.88 34.80 8.07 1469.0
3 1.980 1.262 63.63 46.44 17.20 3198.6
4 2.688 1.713 76.69 53.71 22.98 4211.2
5 3.504 2.234 91.14 61.57 29.57 5209.7
5/15/2006 1 0.000 0.000 24.96 24.27 0.69 97.7
2 0.345 0.220 32.09 28.56 3.53 634.4
3 0.880 0.561 42.69 34.67 8.01 1481.7
4 1.661 1.059 57.67 43.23 14.43 2659.1
5 2.688 1.713 76.89 53.97 22.92 4199.7

103
Appendix B – Other Measurements
This appendix shows the pertinent experimental data that was not included in the
main text of this report.
The following two plots show results of a transient heat flux sensing test with a
device with an angle of α = 60° that was constructed using silver paint to connect the
layers. The resulting output voltage follows closely the temperature difference across the
device, indicating a good response time. Since the temperature difference was measured
across the height of the device and the voltage was measured along the length, the results
indicate that the device is indeed displaying transverse thermoelectric effects.
0 50 100 150 200 250 300 350 400 45020
25
30
35
40
45
50
55
time (sec)
Tem
pera
ture
(C
)
T1
T2
Figure B.1. The temperatures of the top and bottom surfaces of the device under a changing value of heat flux.

104
0 50 100 150 200 250 300 350 400 4500
10
20
30
Time (s)
Tem
p.
Diff.
(C)
0 50 100 150 200 250 300 350 400 4500
2000
4000
6000
Time (s)
Voltage (
mic
roV
)
Figure B.2. The voltage and temperature difference associated with the transient test.
The next two plots show the results of Seebeck coefficient measurements on
samples of bismuth and bismuth telluride. The methods of obtaining these results are
described in Chapter 3.

105
0 5 10 15 20 25 30 35 40 45 500
200
400
600
800
1000
1200
1400
1600
1800
Temperature Difference, oC
Voltage, µV
Actual Data Points
Least-Squares Fit
Figure B.3. Steady state data points and the least-squares fit for the measurement of the Seebeck coefficient of a sample of bismuth. The Seebeck coefficient was determined to be S = 34.5 µV/K.
0 10 20 30 40 50 600
2000
4000
6000
8000
10000
12000
Temperature Difference, oC
Voltage, µV
Actual Data Points
Least-Squares Fit
Figure B.4. Steady state data points and the least-squares fit for the measurement of the Seebeck coefficient of a sample of bismuth telluride. The Seebeck coefficient was determined to be S = 190 µV/K.

106
Appendix C – Pictures of the Device
Figure C.1. A picture of the device with α = 77° (A).
Figure C.2. A picture of the device with α = 58° (B).
Figure C.3. A picture of the device with α = 47° (C).

107
Figure C.4. A picture of the device with α = 59° (D).
Figure C.5. A picture of the device with α = 66° (E).
Figure C.6. A picture of the device with α = 44° (F).

108
Figure C.7. A picture of the device with α = 84° (G).
Figure C.8. A picture of the device with α = 65° (H).
Figure C.9. A picture of the device with α = 47° (I).

109
Vita Brooks Samuel Mann was born on March 10th, 1982 in Charleston, South
Carolina to Gail and Stephan Mann. After several years in South Carolina and the
Washington, D.C. area, Brooks and his family moved to Frederick, Maryland. Brooks
played baseball and soccer as a child, and played soccer into his high school years.
Brooks graduated from Governor Thomas Johnson High School in 2000, and continued
on to the engineering school at Virginia Tech. He worked as an Undergraduate Research
Assistant under Dr. Ricardo Burdisso as a junior and senior, graduated with a B.S. in
Mechanical Engineering in 2004, and stayed at Virginia Tech to pursue a graduate
degree. Brooks worked as a Graduate Teaching Assistant for M.E. Lab II in the fall of
2004, and then became a Graduate Research Assistant working toward his thesis under
Dr. Scott Huxtable. Brooks graduated with an M.S. in Mechanical Engineering in 2006.