Transporters in Liver - UTokyo...
42
Transporters in Liver OCT1 NTCP OATP1B1 (OATP2) OATP1B3 (OATP8) OATP2B1 (OATP-B) OAT2 MRP3 MRP4 MRP2 BCRP MDR1 BSEP MRP6 Uptake of Drugs Blood Vessel Metabolic Enzyme Metabolism Secretion into Bile (Metabolites) Hepatocyte Bile Duct (Drugs)
Transcript of Transporters in Liver - UTokyo...

Transporters in Liver
OCT1 NTCP OATP1B1 (OATP2)
OATP1B3 (OATP8)
OATP2B1 (OATP-B) OAT2 MRP3 MRP4
MRP2 BCRP MDR1
BSEP
MRP6
Uptake of Drugs Blood Vessel
Metabolic Enzyme
Metabolism
Secretion into Bile
(Metabolites)
Hepatocyte
Bile Duct
(Drugs)

Drug Metabolism in Liver e.g. Pravastatin(Anti-hyperlipidemia)
OATP1B1 (OATP2)
OATP1B3 (OATP8)
MRP2
Blood Vessel
Hepatocyte
Bile Duct
Uptake of Drugs
(Drugs)

Main Transporters Expressed in Liver, Kidneys, Small Intestine and Brain
Blood
Blood brain barrier Brain capillary endothelial cells
absorption
PEPT1 ASBT
Small intestine
Urinary excretion
Kidneys
Biliary excretion
Liver
Cerebrospinal fluid Blood cerebrospinal fluid barrier Choroid plexus epithelial cells
Red colored transporters are those focused on in my laboratory
MRP2 P-gp BCRP OATPs
OCT1 MCT1 MRP3 OSTα/β
OAT1 OAT3 OCT2 OATP
4C1 MRP3 MRP6
PEPT1 PEPT2
OCTN1 OCTN2
MRP2 MRP4 P-gp OAT4
URAT1 MATE1 MATE2
BSEP
MATE1 MRP2 BCRP
P-gp
MRP3 MRP4 MRP6
OATP1B1 OATP1B3 OCT1 NTCP OAT2 OCTN2
P-gp BCRP MRP1 MRP4 MRP5
OAT3
OATP1A2 OATP1C1
OCTN2
OATP1A2
OATP 1A2 MRP1 OATP1C1 MRP4
PEPT2 OAT3 OATP1A2

Giacomini KM and Sugiyama Y, Membrane transporters and drug response, Chapter 2 in "Goodman & Gilman's The Pharmacological Basis of Therapeutics 11th edition", 2005
Role of Transporters in Xenobiotic Detoxification
ATP Binding Cassette (ABC)
ABC(ATP binding cassette )transporter
intracellular
extra cellular membrane
COOH
NH2
e.g. MRP2 MDR1 BCRP BSEP MRP3 MRP6 SLC (solute carrier )transporter
extra cellular membrane
intracellular
NH2 COOH
e.g. OATP NTCP OAT OCT
Blood Concentration gradient of xenobiotic
Bile, Urine
ATP
ATP
ABC
SLC
Liver, Kidney
ABC
ABC SLC SLC
Concentration gradient of xenobiotic
Blood brain barrier (Brain capillary endothelial cells)
Brain intercellular fluid

Figure removed due to copyright restrictions
A clinical study in healthy volunteers [11C]verapamil - Non-invasive measurement of intracerebral drug concentration with PET scans. (in collaboration with Dr. T. Suhara, National Institute of Radiological Science)
Takano A, et al J Nucl Med. 47:1427-33, 2006.
In duodenum, P-gp expression levels altered depending on SNPs. Similar correlation between P-gp expression and SNPs in brain could be expected to lead to altering intracerebral drug concentration.
Results with a PET study in monkeys
Inhibition of P-gp significantly increased the brain concentration of drug.
Control state P-gp inhibition condition
‡ Lee YJ, et al J Pharmacology Exp Ther 316:647-53 (2006)
Individual Difference in P-gp Gene Polymorphism, Xenobiotic Excretion in Brain Capillary, and Drug Penetration into Brain
Figure removed due to
copyright restrictions

Oseltamivir (TAMIFLU):An7‐influenza drug
Ro 64‐0802 (pharmacologically‐ac7ve form) Parent form
hydrolysis
Oseltamivir is the prodrug form of Ro64‐0802, a selec7ve inhibiter of influenza virus neuraminidase. In Japan, prescrip7ons for oseltamivir in 2006 exceeded 10 million. Abnormal behavior in young pa7ents with influenza being treated by oseltamivir have been reported.
M.W. : 312.40 Log D (at pH7) : ‐0.30 pKa : 14.68 (Acidic) 8.81 (Basic)
M.W. : 284.35 Log D (at pH7) : ‐2.05 pKa : 4.13 (Acidic) 9.26 (Basic)

Since being launched in 2001, abnormal behaviors including jumping and falling from balconies have occurred in 211 cases of oseltamivir treatment in Japan (as of June 2007).
Incidence of the abnormal behavior by age was 33.6% in less than 10 years, 44.5% in 10-19, reaching 78.1% in total. The adverse effects of abnormal behavior was reported mostly by the patients aged 19 and younger (from YAKUJI NIPPO).
Although causal relationship between oseltamivir exposure and abnormal behavior remains unclear, in March 2007 Japan’s Ministry of Health and Welfare directed that the drug be not prescribed to teenagers.
1. Pharmacokinetic regulatory mechanism of oseltamivir and its acid form in peripheral tissues
2. Brain penetration of both compounds and relevant molecular mechanism
Precise scientific epidemiologic analysis of clinical data should be required before drawing conclusion on the causal relationship.
Given that a cause of abnormal behavior is the oseltamivir exposure’, ‘what mechanism could be plausible’ is discussed in this study by examining the following pharmacokinetic mechanism prior to the results of epidemiological analysis.

Brain Distribution Mechanism in Anti-influenza Oseltamivir (Tamiflu)
Oseltamivira (Tamiflu)
Brain endothelial cells (BBB)
Central nervous System (CNS)
esterase ester form acid form
CNS Adverse Effects ?
ester form acid form Blood
P-gp KO largely increases the brain concentration of tamiflul.
esterase
P-gp
Decreased brain P-gp concentration in young rats results in increase of brain Tamiflu concentration.
×5.0
×6.7
Days after birth
MRP4
OAT3
Liver

Probability of Adverse Effects (1 in 10,000)
F(Tox) = Fmdr1 x Fother trans x Fces
0.001 0.1 0.1 0.1
0.00001 0.05 0.01 0.02
0.000001 0.01 0.01 0.01

Virtual Clinical Trials Collection of individual variability data on physiological and biochemical parameters
Real person Virtual person
A variety of virtual persons on computer

10 fold
Time Course of Plasma Concentration of Midazolam after 2 mg Oral Administration
Clin Pharmacol Ther. 69, 333, 2001
Approx. 10-fold individual differences are shown in the CYP3A4 substrate without definite gene polymorphisms.
‡ Provided by Dr M. Kato (Chugai Pharmaceutical)

Factors responsible for individual variation (Dominant factors of pharmacokinetics)
Body weight
Liver weight
Enzyme level
Transporter level
Serum protein concentration
Hepatic blood flow rate
Glomerular filtration rate

Virtual Person with various conditions
Body weight
Liver weight
Enzyme level
Transporter level
Serum protein concentration
Hepatic blood flow rate
Glomerular filtration rate
Parameters generated from random numbers
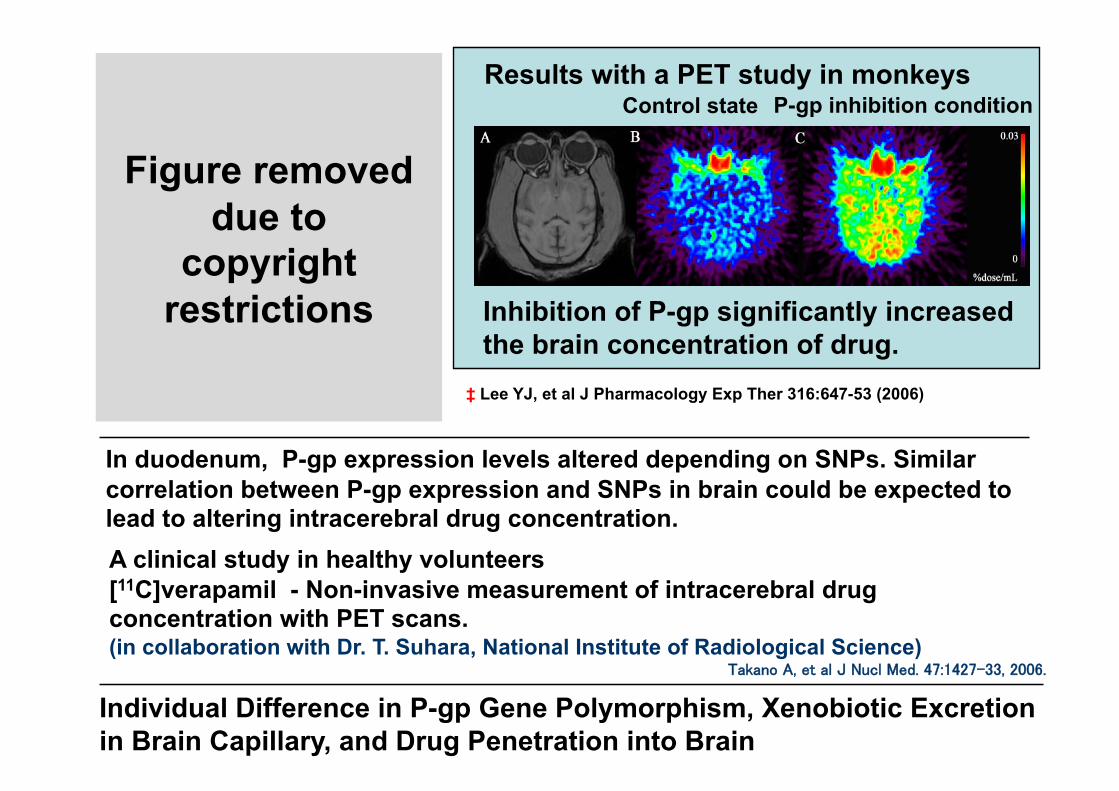
Japanese 63.6 ±7.4 kg
Europeans & North Americans 83.2 ±10.6 kg
Common parameters CLint,h: 16.3mL/min/mL liver (individual difference: 33%) Liver volume: 19.5±2.2 mL/kg Liver perfusion: 1.22±0.16 mL/min/mL liver
Pharmacokinetics of Midazolam

Studies on Magnitude of Inter-Individual Variations in Blood Levels of Oseltamivira and Its Active Metabolite Analysis by Monte Carlo simulation
Clinical PK data
Mathematical model indicative of blood concentrations
Pseudo-random numbers
Individual variation of drug exposure (Virtualizable of large-scale clinical study)
Gene mutation frequency & functional change of metabolic enzyme & transporter
1. Wynne et al. Hepatology (1989) 9: 297-301 2. Muhammad et al. Journal of nuclear medicine (1969) 672- 5) 3. From the simulation results (assumed to be FaFg=1) 4. Application Materials. CV value: Kato et al. submitted 5. Application Materials. Use hematocrit level of 0.45. 6. Brian Davis et al. Pharmaceutical research (1993) 10; 7 1093-5 7. Hill et al. DMD (2002) 30: 13-9 8.Calculated by neglecting reuptake.
PK parameters used for the simulation
Inter-individual deviation of blood flow rate, protein binding and GFR
Capable of treating the drug exposure deviation generated by the combination of multiple variational parameters as a distribution map in tens of thousands scale of people. Drug exposures in patients, which were missed in clinical studies due to the low frequencies despite of the large functional changes, are valuable.
Output

Studies on Magnitude of Inter-Individual Variation of AUC in Active Metabolite Concentration in Brain Number of patients
Difference from the mean (fold)
Assumption 2. ①<<② (Assuming that AUC of the active form concentration in brain is defined mainly by its uptake from blood side.)
× 9.59
z
brain
PSeff_osel
CLmet_brain_osel
Oseltamivir Active form
PSeff_Active form
PSinf_Active form
Functional change of OAT3, MRP4, MDR1, and CES1A in the subject with the highest brain exposure of active form in each assumption.
(Activity level in wild type = 1) #39954
AUC of oseltamivir concentration in brain increased maximum almost 10 times mean value. The number of subjects whose AUC increased more than 7 times were 30 out of 50000.
① ; Metabolism in brain ② ; Uptake from blood

Hepatobiliary drug transporters Bile
MRP3
Na+ Bile acid
MDR1/ P-gp
MRP2
BSEP
BCRP Bile acid
OCT1 OAT2 OATP 1B3 NTCP OATP
1B1
pravastatin, robastatin, pitavastatin, cerivastatin, valsartan, telmisartan, temocapril, nateglinide, repaglinide bozentan
telmisartan fexofenadine
pravastatin, robastatin, pitavastatin, olmesartan valsartan, telmisartan, methotrexate, SN-38, cefodizime, glucuronic acid conjugate, glutathion conjugate
fluoroquinolone, pitavastatin, robastatin, sulfasalazine, methotrexate, sulfoconjugate
Glucronic acid conjugate
ATP
ADP
ATP ATP
ATP
ATP
ADP ADP
ADP
ADP
many drugs including digoxin vinblastine
salicylic acid indomethacin, etc
metformin cimetidine
*Many important drugs for medication *Vectorial transport (similar in substrate recognition of transporters for uptake and excretion)

Metabolism
Pravastatin
ADP ATP
Small intestine
absorption
Uptake to Liver Excretion to Bile MRP2 OATP1B1
Liver
Binding to
intracellurar HMG-CoA reductase
OATP2B1 (OATP-B)?
Enterohepatic Circulation
Transporter Group Involved in Enterohepatic Circulation of Pravastatin ~Efficient Transport to Liver~
OH
HO
H O O HO
H
HOOC
pravastatin
Yamazaki et al. AJP 264:G36,1993 Nakai et al. JPET 297:861,2001
Yamazaki et al. DMD 25:1123,1997
Sasaki et al. JBC 277:6497,2002
Kobayashi et al. JPET 306:703,2003

Trans-cell Transport in Pravastatin Double-Transfectant
0 100 200 300 400 500
0 60 120 180 0
100 200 300 400 500
0 60 120 180
B-A
Tran
scel
lula
r Tra
nspo
rt
(µl/m
g pr
otei
n)
Time (min)
OATP1B1/MRP2 OATP1B1/MDR1
B-A A-B A-B
MDCKII
OATP 1B1
MDR1
[3H]PRA
Apical
MDCKII
Basal
MRP2
OATP 1B1
PS2 + PS3 PSnet = PS1 x
PS3
TRANSWELL
PSnet
PS2 PS1
PS3
Basal
Apical
Establishment of Double-Expression Cells
Apical (Bile duct side)
Basal (Blood side)
MDCKII
OATP 1B1
MRP2
Immunostain image
Apical
Basal
MRP2: red OATP1B1: green Nuclei: blue
Utilization of Co-expression System of Uptake-Excretion-Transporters
[Sasaki M et al., J Biol Chem, 277, 6497-503 (2002)]
‡ Matsushima S et al., J Pharmacol Exp Ther, 314, 1059-67 (2005))

There have been 52 deaths (31 in the US) from the adverse effect rhabdomyolysis in patients taking serivastatin. Twelve of the 31 patients in the US were confirmed to take concomitant fibrate group anti-hyperlipidemic agents. [from British Medical Journal 323, 359 (2001) & British Medical Journal 323, 415 (2001)]
Yakuji Nippo, Aug, 15, 2001 Yakuji Nippo, Aug. 27, 2001
OATP1B1 他の トランス
ポーター
CYP2C8 CYP3A4
2C8, 3A4
2C8
N
F
C H 3 O
O H O H C O O Na
Serivastatin
N
F
O H
O H O H C O O H
M-1
N
F
C H 3 O
O H O H C O O H
O H M-23
Uptake to liver
Low risk of interaction has been considered in serivastatin due to its multiple metabolic pathways .
Cyclosporine A
Gemfibrozil glucronide
Adverse Effects of Cerivastatin - Drug-Drug Interaction with Gemfibrozil -
Elucidation of Primary Action Point in the Interacting Drug and Detoxification of Cerivastatin in Liver
Shitara, Y. et al. J Pharmacol Exp Ther, 311(1): 228-36 (2004)
Shitara, Y. et al. J Pharmacol Exp Ther, 304(2): 610-6 (2003)
Shitara, Y. and Sugiyama, Y. Pharmacol Ther, 112(1): 71-105 (2006)

Mobilization of Pravastatin (Anti-hyperlipidemia)
‡(Modified figure from J. Azuma: 「「クスリに弱いヒト」と「困ったクスリ」たち」 (Individual Difference of Reactivity to Drug ),Jiho, Inc., Tokyo, 2001
Gl tract Plasma Kidney
Liver Bile
Portal
Muscle
absorption
Oral administration
Metabolism
Distribution Excretion Excretion
Feces Urine
Drug actions
Adverse effects

Relation between simvastatin-induced myopathy and genetic polymorphism of OATP1B1
significant correlation with the event
Case=85 vs control 90: ca 300,000marker SNPs
-Log
10P
valu
e Significant link r2>0.95) between Marker SNPs and SLCO1B1 T521C (V174A) !
521CC
521CT 521TT
Years since Starting 80mg of Simvastatin 0 1 2 3 4 5 0
10
5
15
20
Cum
ulat
ive
Perc
enta
ge o
f pat
ient
s w
ho
have
had
a m
yopa
thy
Odds ratio of this SNPs for simvastatin-induced myopathy
521CT vs TT → 4.5 fold
521CC vs TT →16.9 fold
‡(SEARCH Collaborative Group et al., New Engl J Med, 359, 789-99 (2008))
OATP1B1 polymorphism seriously affects the adverse reactions.

Physiological Model
Physiological Model and Prediction of Time Course in Plasma Level
:i.v. 0.134mg/kg (Actual value*) :p.o. 0.26mg/kg (Actual value*)
Time Course of Plasma Concentration in Human
Lung
Brain
Muscle
GI
QBrain
QMuscle
QLiver
PSinf
PSbile
PSeff
CLmet
Blood Urine Qtotal
ka
i.v.
p.o.
Liver
inlet
Liver
Liver
Liver
Liver
inlet inlet inlet inlet
Kidney QKidney
:Predictive value
Blood Intra-capilary
Hepatic parenchymal cells Extrapolated parameters in vivo from in vitro data

Mathematical Model for Prediction of Drug Concentration
Blood
Liver→Efficacy Target
Lung
Extra cellular space of liver ①
Extracellular space of liver ②
Intra-gastrointestinal duct
Brain, Muscle, Kidney

Mathematical Model for Prediction of Drug Concentration
Blood
Liver→Efficacy Target
Muscle→ Adverse Effect Target

Small Intestine Liver Tumor
capecitabine
5’-DFCR
5’-DFUR
5’-DFUR
5’-DFCR 5-FU
N N
O
NH2 F
O
HO OH
N N
O
HN F
O
HO OH
CO-O
capecitabine
HN N
O
O F
O
HO OH
HN N
O F
O H
Carboxyl- esterase
Cytidine deaminase
dThd- Pase
DPD
5’-DFCR 5’-DFUR 5-FU
Liver Liver
Tumor Tumor
capecitabine
‡ H. Ishitsuka, 2000, Investigational New Drugs 18, 343-354

Hours after drug administration 0 2 4 6 8
5-FU
leve
l (µg
/ml o
r g) 16
14
12
10
8
6
4
2
0
Tumor
Muscle Plasma
0 2 4 6 8
5-FU ( i.p.)
0 1 2
3
2
1
0
16
14
12
10
8
6
4
2
0
Muscle
Plasma
Tumor
Ishikawa T. et al. Biochem J., 55, 1091-1097 (1998)

6 5 4 3 2 1 0
Brain
Lung Liver Spleen Kidney Stomach S.Intestine L.Intestine Thymus Plasma Lymph Node Bone Marrow
Heart
Brain Heart Lung Liver Spleen Kidney
Thymus Plasma
Stomach Deodenum Jejunum Ileum Colon Rectum Bone Marrow
3 3 3 3 3 3 2 3 3 1 2 3 3 3 3
6 5 4 3 2 1 0
(n= )
Human Rat
Brain
Lung Liver Spleen Kidney Stomach S.Intestine L.Intestine Thymus Plasma Lymph Node Bone Marrow
Heart
Mouse Monkey
Blood Bladder Cervix Ovary Thyroid Breast L. Intestine S. Intestine Stomach Kidney Spleen Liver Lung Heart
4
15
7
3
19 16
36
4
32
24
9 14
3
3
6 5 4 3 2 1 0
6 5 4 3 2 1 0
Onodera H. et al., 2000

Km4S1+C
Km3S3+C Vmax3S4 Km3S4+C
Vmax3S3 Vmax3S2 Km3S2+C
Vmax3S1 Km3S1+C
Vmax2S4 Km2S4+C
Vmax2S3 Km2S3+C
Vmax2S2 Km2S2+C Km2S1+C
Vmax4S4 Km4S4+C Km4S3+C Km4S2+C
Vmax4S2
>
Vmax4S3 Vmax4S1
liver
GI tract
tumor
NET
bloo
d
liver
GI tract
tumor
NET
bloo
d
liver
GI tract
tumor
NET
bloo
d
bloo
d
liver
GI tract
tumor
NET
bloo
d
bloo
d
> >
> >
> > > > > > >
>
> > > > >
> > >
Q3
Q2
Q2’ Q2
Q4
Q5
Q3
Q2
Q2’ Q2
Q4
Q5
Q3
Q2
Q2’ Q2
Q4
Q5
Q3
Q2
Q2’ Q2
Q4
Q5
CLr,u CLr,u CLr,u CLr,u
ka·F Vmax2S1
capecitabine 5’-DFCR 5’-DFUR 5-FU carboxylesterase
bloo
d bl
ood
cyd deaminase dThdPase DPD
‡ Tsukamoto et al., Pharmaceutical Research. 2001. Vol. 18, Iss. 8; pg. 1190

Controlled Release Improved absorption
Targeting
DDS is a transport system for delivering drugs to the in vivo targeting site properly, at the right time, and in appropriate amount for requirements.
‘Courier for Drugs’
Functional Components of DDS
‡ Cited from Dr. M. Morishita, Department of Pharmaceutics, Hoshi University
Drug Delivery System

‡ Cited from Dr. M. Morishita, Department of Pharmaceutics, Hoshi University
Controlled release-type formulation
Minimal toxic concentration
Minimum effective concentration Ther
apeu
tic ra
nge
conc
entr
atio
n
Standard formulation
Plas
ma
Con
cent
ratio
n
Time after Treatment
Time Course of Plasma Concentration after Treatment of Controlled Release-Type Formulation

Time Controlled Release Formulation
Drug is released at a certain period of time after treatment.
・ New time controlled medication , in accordance with the concept of “chrono-pharacotherapy “ has been established. ・ Midnight medication is avoidable.
Time
Released Amount
Lag time
Formulation with timer function
‡ Cited from Dr. M. Morishita, Department of Pharmaceutics, Hoshi University
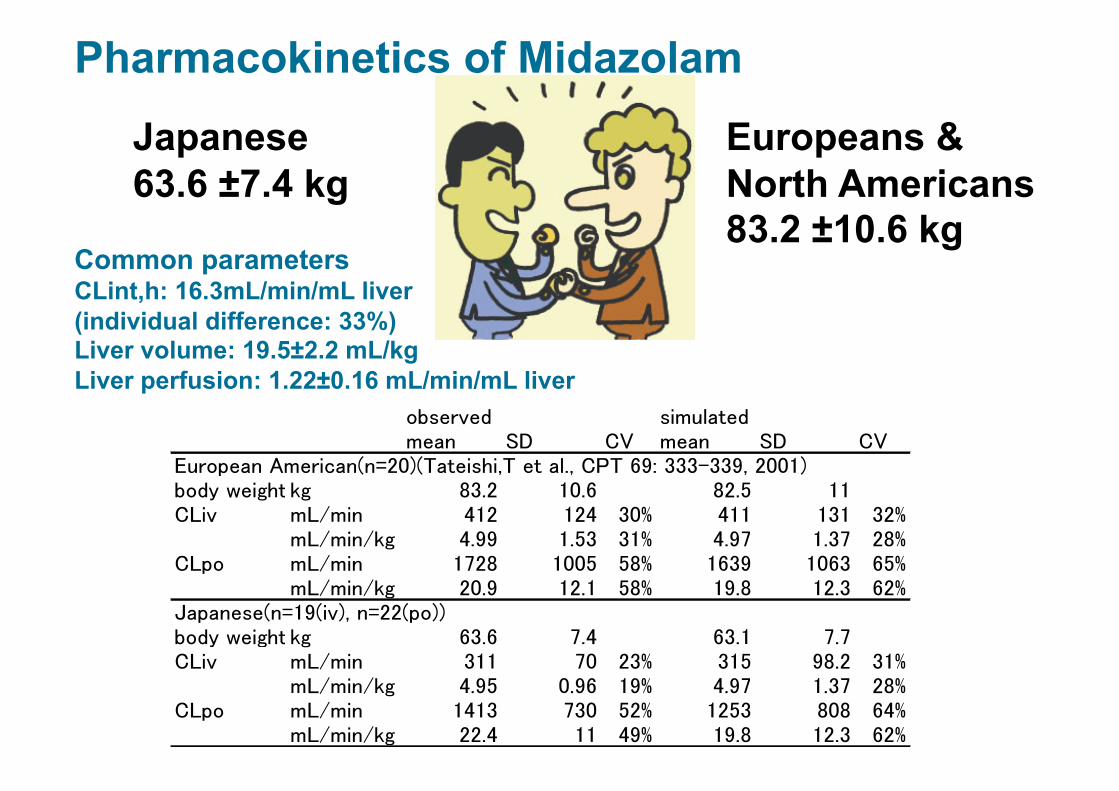
・Symptoms at night or dawn are suppressible. ・With no disturbance of sleep ・No need to go up to take medicine in the middle of night.
Do patients occasionally need medication during a certain period of time?
18 Night time
Day time
0
6
12
Insomnia Short acting hypnotics
Asthma Bronchodilators
Urinary incontinence Anticholinergic agents
Parkinson’s disease Anti-Parkinson agents
Pain Analgesics
Gout Anti-inflammatory
agents Ischemic heart disease
Anti-anginal agents, Anti-hypertensive agents Benefit for patients
‡ Cited from Dr. M. Morishita, Department of Pharmaceutics, Hoshi University
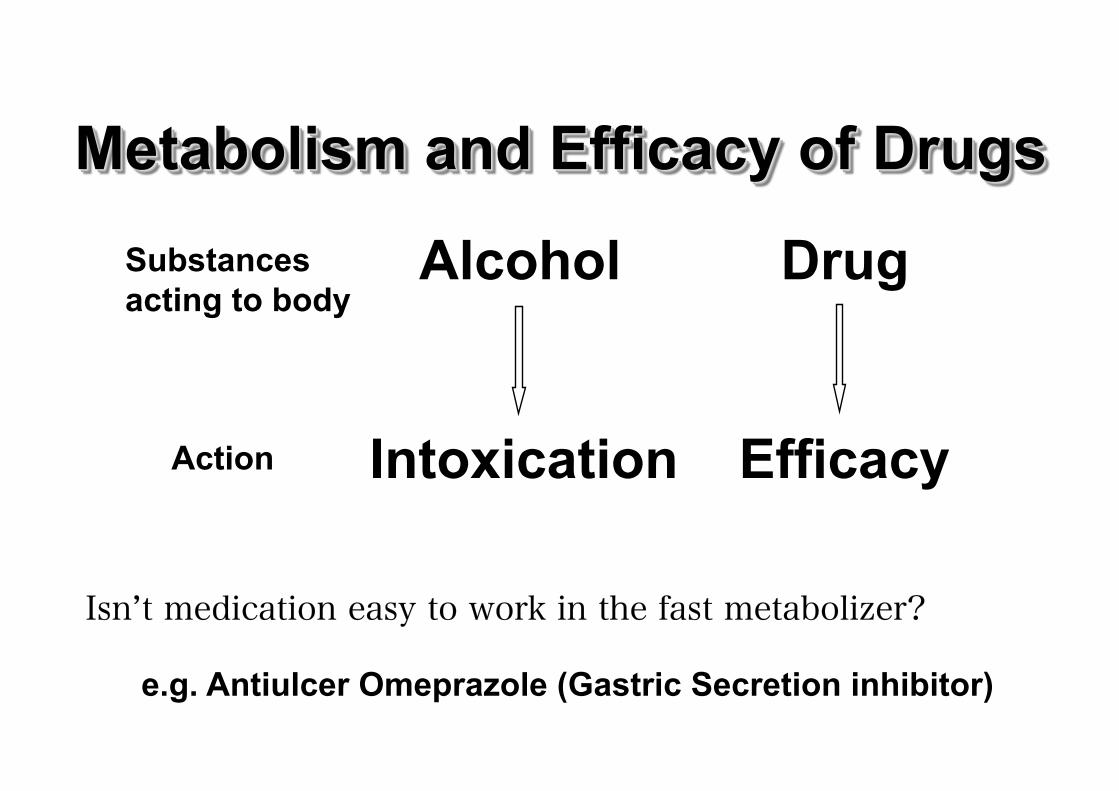
Alcohol Drug
Intoxication Efficacy
Substances acting to body
Action
Isn’t medication easy to work in the fast metabolizer?
e.g. Antiulcer Omeprazole (Gastric Secretion inhibitor)

(Vesell, 1975)
Difference between Mono- and Di-Zygotic Twin in Plasma Half Life of Antipyrin and Bisdihydroxycoumarine
Plas
ma
half
life
(hou
r) 100
50
10
1
5
Monozygotic twin Dizyogotic twin
Antipyrin Bisdihyroxycoumarine
‡ Cited from Professor T. Kamataki (Hokkaido University)

Metabolism of Antiulser Omeprazole
CYP2C19 CYP3A4 Omeprazole
5-hydroxyomeprazole Omeprazole sulfone
Main metabolic pathway
(inactive) (inactive)
Drug metabolizing enzyme Drug metabolizing enzyme

CYP2C19 Genotype
Rapid metabolizer: RM Individuals with no mutation in both CYP2C19 alleles
CYP2C19 gene
Intermediate metabolizer: IM Individuals with mutation in one CYP2C19 allele
Poor metabolizer: PM) Individuals with mutation in both CYP2C19 alleles

Ethnic Difference of CYP2C19 Genotype
Ethnic difference in ‘Poor Metabolizer (PM)’ percentage
White (US) 2.5% White (EU) 3.0% Black (US) 2.0% Zimbabwean 4.8% Chinese (Han people) 19.5% Korean 12.6% Japanese 18.0-22.5%
‡ Furuta,T. et al., Drug Metab. Pharmacokinet. 20: 153-167 (2005).

8 6
1600
1200
800
400
0 0 2 4 10 24
P<0.001
P<0.001
P<0.05
CYP2C19 Genotype and Plasma Omeprazole Concentration
Time after treatment (hr)
Plas
ma
conc
entr
atio
n of
om
epra
zole
(ng/ml)
Poor metabolizer (PM) Intermediate metabolizer(IM)
Rapid metabolizer (RM)
0
6000
4000
2000
AU
C
Comparison of AUC
‡ Furuta,T. et al., Drug Metab. Pharmacokinet. 20: 153-167 (2005).
Omeprazole, 20mg treatment

8.0
24
CYP2C19 Genotype and Pharmacological Effects of Omeprazole
Time after treatment (hr)
Gas
tric
pH
(pH)
Poor metabolizer (PM) Intermediate metabolizer (IM) Rapid metabolizer (RM)
6.0
4.0
2.0 1.0
0 3 6 9 12 15 18
Lunc
h
Din
ner
Bre
akfa
st
Furuta,T. et al., Drug Metab. Pharmacokinet. 20: 153-167 (2005).

CYP2C19 Genotype and Decolonization of H. pylori by Omeprazole.
P<0.05
P<0.05
P<0.05 Er
adic
atio
n ra
te o
f H.P
ylor
i 100
80
60
40
20
(%) Omeprazole, 20mg & Amoxicilin, 2000mg
Treatment for 2 weeks
‡ Furuta,T. et al., Drug Metab. Pharmacokinet. 20: 153-167 (2005).