Finite Element Analysis, Axial Force Element, Beam Element, 1D Tapered

City of Fort Lauderdale Comprehensive Plan (Ordinance C-08-18) Volume II – Transportation Element Page 8-1
TRANSPORTATION ELEMENT – DATA AND ANALYSIS I. Introduction The City of Fort Lauderdale is essentially a mature City with many well-established neighborhoods. The City is approximately 36.29 square miles in area, generally bordered on the east by the Atlantic Ocean, State Road 7 on the west, McNab Road on the north and the Fort Lauderdale/Hollywood International Airport on the south. This element provides the framework for identifying the process for decision making and prioritization of all local transportation related improvements including roadway, transit, bike/pedestrian and waterway. This element ensures consistency with other local, regional, state and federal plans, standards, rules and laws. Strong emphasis is placed on coordination with other transportation providers and users of the system. This document is divided into four sections. Section 1 is a brief introduction. Section 2 addresses the data requirements and includes inventories of the general location of transportation system features; special transportation or land use features; transportation level of service (LOS) standards; capacity of significant parking facilities and duration limitations; safety considerations; air quality monitoring; and transportation and population characteristics. Section 3 analyzes all modes of transportation. Section 4 addresses implementation and future initiatives. II. Data Requirements Rule 9J-5.019(2), Florida Administrative Code (FAC), requires the Transportation Element to be based upon the following data: general location of the transportation system features; existing functional classification and maintenance responsibilities; transit trip generators and attractors; designated transportation facilities for hurricane evacuation; the existing peak hour; peak direction of level of service for roads, public transit facilities, and corridors or routes; and capacity of significant parking facilities and duration of limitations. This chapter addresses the above described rule requirements. A. The Transportation System The transportation system encompasses the following networks: roadways, public transit, bikeways, pedestrianways, waterways, seaport, airports, railways, greenways, and intermodal facilities.
1. Roadway Network The roadway network includes: roadway segments or links, intersections, bridges, rights-of-way, signalization, signage, roadway amenities, and significant parking facilities.
a. Segments. A roadway segment or link is a portion of a roadway defined for the purpose of traffic analysis. The segment origination and termination points are typically signalized intersections or the point where

City of Fort Lauderdale Comprehensive Plan (Ordinance C-08-18) Volume II – Transportation Element Page 8-2
the number of lanes on a roadway changes. Segments can be classified by number of lanes or function.
1. Number of lanes. Rule 9J-5.019(2)9., FAC, requires that the number of through lanes for each roadway be identified on an existing transportation map or map series. The Existing Surface Road System Map 1 depicts the lane characteristics of the existing roadway network consistent with the rule requirement. 2. Federal Functional Classification System. Refers to the Federal Highway Administration approved designation that divides roadways into a hierarchy of types ranging from arterials to locals. This hierarchy based on traffic mobility and land access. The Federal Functional Classification System consists of four categories for an urban setting like Fort Lauderdale. They are: Principal Arterial, Minor Arterial, Collector and Local.
Arterial roadways are classified as either principal or minor. A roadway serving only one of the arterial road purposes is classified as a minor arterial, while one serving more than a single purpose is classified as a principal arterial road. All limited access highways and roads that connect urbanized areas are considered to serve several trip purposes, and thus are classified as principal arterial roads. A minor collector roads significant purpose is providing access to diffuse land use areas. When evaluating the function of a road, the U.S. Department of Transportation (USDOT) considers a road’s trip purposes in relation to the total public roadway network. A road is classified based upon its most significant trip purpose; however, a road may serve more than one significant trip purpose. The Federal Functional Classification System recognizes twelve significant trip purposes. The Federal Functional classifications for Fort Lauderdale’s significant roadways are listed in Table 1 and shown on Map 2.

City of Fort Lauderdale Comprehensive Plan (Ordinance C-08-18) Volume II – Transportation Element Page 8-3
W SUNRISE BLVD
W BROWARD BLVD
DAVIE BLVD
SR 84
N S
R 7
OAKLAND PARK BLVD
COMMERCIAL BLVD
NW 62ND ST
S F
ED
ER
AL
HW
Y
N F
EDE
RAL
HW
Y
E LAS OLAS BLVD
N A
TLAN
TIC
BLV
D
NW
31S
T A
VE
INTE
RST
ATE
95NW 19 ST
ATLA
NTI
C O
CE
AN
FLORID
A TU
RNPIKE
AN
DR
EW
S A
VE
N D
IXIE
HW
Y
NE 13 ST
I-595
SE 17 ST
NW
27
AV
E
SISTRUNK BLVD
MCNAB RD
¯DATA SOURCE: FLORIDA DEAPRTMENT OF TRANSPORTATION - April, 2006MAP SOURCE: CITY OF FORT LAUDERDALE PLANNING & ZONING DEPARTMENT- JULY, 2006
EXISTING SURFACE ROADWAY SYSTEM
0 1 20.5Miles
MAP 1
LegendCITY LIMITS
4 Lanes6 Lanes8 Lanes
EXPRESSWAY
2 Lanes
10 Lanes (I-95)

City of Fort Lauderdale Comprehensive Plan (Ordinance C-08-18) Volume II – Transportation Element Page 8-4
Table 1
Functional Classification by Trip Purpose
Trip Purpose
Functional
Classification Travel to and through urbanized areas
Arterial
Travel to and through small urban areas
Arterial
National defense
Arterial
Interstate and regional commerce
Arterial
Access to airports, seaports, and major rail terminals or intermodal facilities
Arterial
Access to major public facilities
Arterial
Access to minor public facilities
Arterial
Interconnection of major thoroughfares
Collector
Interconnection of minor thoroughfares
Collector
Access to concentrated land use areas
Collector
Access to diffused land use areas
Collector
Travel between home, work, entertainment, and shopping destinations and nearest road on the primary network composed of arterial and collector roads
Local
Source: Highway Functional Classification Concepts, Criteria and Procedures, Federal Highway Administration.

City of Fort Lauderdale Comprehensive Plan (Ordinance C-08-18) Volume II – Transportation Element Page 8-5
W SUNRISE BLVD
W BROWARD BLVD
DAVIE BLVD
SR 84
N S
R 7
OAKLAND PARK BLVD
COMMERCIAL BLVD
NW 62ND ST
S F
EDER
AL
HW
Y
N F
EDE
RAL
HW
Y
E LAS OLAS BLVD
N A
TLAN
TIC
BLV
D
NW
31S
T AV
E
INTE
RST
ATE
95
NW 19 ST
ATLA
NTI
C O
CE
AN
FLORID
A TU
RNPIKE
AN
DR
EW
S A
VE
N D
IXIE
HW
YNE 13 ST
I-595
SE 17 ST
NW
27
AVE
SISTRUNK BLVD
MCNAB RD
¯DATA SOURCE: FLORIDA DEAPRTMENT OF TRANSPORTATION - OCT, 2006MAP SOURCE: CITY OF FORT LAUDERDALE PLANNING & ZONING DEPARTMENT- NOV, 2006
FUNCTIONAL CLASSIFICATION OF ROADWAYS
0 1 20.5Miles
Legend
Local Streets
CITY LIMITS
Functional CassificationsPrincipal Arterial-Interstate URBANPrincipal Arterial-Freeways and Expressways URBANOther Principal Arterial URBANMinor Arterial URBANCollector URBANLocal URBAN
MAP 2

City of Fort Lauderdale Comprehensive Plan (Ordinance C-08-18) Volume II – Transportation Element Page 8-6
3. Florida Intrastate Highway System. Section 334.03, FS, defines the
Florida Intrastate Highway System (FIHS) as a system of limited access and controlled access facilities on the State Highway System, which have the capacity to provide high-speed and high-volume traffic movements in an efficient and safe manner. State legislation enacted in 2004 created a Strategic Intermodal System (SIS) that is a regional network of transportation facilities. SIS/FIHS roadways must be identified for two reasons. First, Rule 9J-5.019, FAC, requires the FDOT level of service standard to be applied to SIS/FIHS roads. Second, Rule 9J-5.019, FAC, requires the establishment of strategies to facilitate local traffic use of alternatives to the SIS/FIHS. Table 2 lists those Fort Lauderdale roadways on the Strategic Intermodal System. Map 3 shows all City of Fort Lauderdale SIS facilities, as well as SIS Connectors.
Table 2
Connectors of the Strategic Intermodal System (SIS)
SIS Roadways
Roadway Segments Interstate 95
NW 19 Street to I-595
Interstate 595
I -95 to US 1
SIS
Connectors
Roadway Segments
Broward Boulevard I-95 to NE 3rd Ave to Greyhound Bus Terminal
SR 84 I-95 to Port Everglades entrance
SW 4th Avenue SR 84 to Perimeter Road Andrews Avenue SR 84 to Airport entrance
Source: FDOT, District 4, 2005.
b. Intersections and interchanges. An intersection is defined as the general area where two or more roadways join or cross at grade, including the roadway and roadside facilities for traffic movements within the intersection. An intersection is an important part of the roadway network because its design influences the efficiency, safety, speed, cost of operation, and capacity of roadways.

W SUNRISE BLVD
W BROWARD BLVD
DAVIE BLVD
SR 84
N S
R 7
OAKLAND PARK BLVD
COMMERCIAL BLVD
NW 62ND ST
S F
ED
ER
AL
HW
Y
N F
ED
ER
AL
HW
Y
E LAS OLAS BLVD
N A
TLA
NT
IC B
LVD
NW
31S
T A
VE
INT
ER
STA
TE 9
5
NW 19 ST
AT
LAN
TIC
OC
EA
N
FLO
RIDA T
URNPIKE
AN
DR
EW
S A
VE
N D
IXIE
HW
Y
NE 13 ST
I-595
SE 17 ST
NW
27
AV
E
SISTRUNK BLVD
MCNAB RD
Fort Lauderdale /Hollywood
International Airport
PortEverglades
Fort LauderdaleFEC Intermodal
Terminal
Fort LauderdaleAirport Tri-Rail
Station
Fort LauderdaleAmtrak / Tri-Rail
Station
Fort LauderdaleGreyhound
Bus Terminal
Cypress CreekTri-Rail Station
I-595 EAST STRAIGHT INTOPORT ENTRANCE (ELLER DR)
SIS CORRIDOR(I-595/US-1 INTERCHANGE)DIRECTLY TO ENTRANCE
I-95 TO GRIFFIN RD,TO RAVENSWOOD RD, TO GULFSTREAM WAY
TO ENTRANCE
SIS CORRIDOR(I-95 RAMPS)
DIRECTLY TO ENTRANCE
I-95 TO BROWARD BLVD, TO NE 3 AVE TO NE 3 ST TO
ENTRANCE
I-95 TO SR 84 TO SPANGLERBLVD INTO PORT ENTRANCE
I-95 TO SR 84 TO ANDREWS AVETO ENTRANCE
I-95 TO SR 84/SW 24 ST TOSW 4 AVE TO PERIMETER RD
TO ENTRANCE
I-95 TO CYPRESS CREEK RD TOANDREWS AVE TO ENTRANCE
FEC SPURS FROM SEAPORTPROPERTY TO FEC & CSX LINES
CS
X/T
RI-
RA
IL R
AIL
WA
Y
FE
C R
AIL
WA
Y
DATA SOURCE: FLORIDA DEPARTMENT OF TRANSPORTATION (FDOT) - JULY, 2006MAP SOURCE: CITY OF FORT LAUDERDALE PLANNING & ZONING DEPARTMENT- JULY, 2006
STRATEGIC INTERMODAL SYSTEM MAP 3
0 1 20.5Miles
Volume II - Transportation Element Page 8-7
Legend
CORRIDORS
HUBS
Airport
Seaport
Passenger TerminalIntermodal Freight -
Rail Terminal
CITY LIMITS
Rail Connector
Road Connector
Highway
MAP 3

City of Fort Lauderdale Comprehensive Plan (Ordinance C-08-18)Volume II – Transportation Element Page 8-8
1. Interchanges are designed to permit traffic to move freely from one road to another without crossing another line of traffic. Generally, four types of interchanges are used in Broward County’s intrastate system: Partial Cloverleaf, Diamond, Mixed Directional and All Directional.
2. Fort Lauderdale’s main interchanges include: I-95 and Davie Blvd., I-95 and Broward Blvd, I-95 and Sunrise Blvd., I-95 and I-595, I-95 and SR-84, I-595 and Fort Lauderdale/Hollywood International Airport, I-595 and US-1.
c. Bridges, overpasses and tunnels. A bridge is a structure, including supports, erected over a depression or an obstruction, such as water, a highway, or railway, which has a track or passageway for carrying traffic or other moving loads.
1. Fort Lauderdale has numerous bridges and overpasses throughout the City. There is only one tunnel in the City. It is located on US-1 south of Broward Blvd. (Henry Kinney Tunnel)
d. Right-of-way. Right-of-way often is the major cost for many transportation improvement projects. Therefore, the acquisition of the needed land should be planned far in advance of the scheduled construction time. The Broward County Trafficways Plan, administered by the Broward County Planning Council, is a roadway right-of-way preservation plan. To accommodate the impacts of new development, right-of-way is dedicated by developing parcels to provide for an adequate regional roadway network. A dedication for at least half of the roadway width that the Trafficways Plan calls for is normally required at the platting stage.
Currently there are four main classifications designated in the Trafficways Plan: limited access/controlled; arterial; collector; and one-way pair. The right-of-way width for the limited access and controlled freeways is 325 feet; for arterial roadways, it varies from 100 to 200 feet; for collector roads, it ranges from 70 to 94 feet; and for one-way pairs, the range is from 42 to 54 feet. Where right-of-way cannot be dedicated as a condition of development order approval, right-of-way is acquired through condemnation. Fort Lauderdale’s Capital Improvements Element does not include right-of-way acquisition as a separate line item; instead, the cost is included as part of the total construction project. The Broward County Transportation Improvement Program (TIP), however, does include a separate line item for right-of-way acquisition.

City of Fort Lauderdale Comprehensive Plan (Ordinance C-08-18) Volume II – Transportation Element Page 8-9
The widening of SR 7 and the 7th/9th Connector are projects requiring right-of-way acquisition. The Downtown Transit Circulator and the East-West Transit Line projects may also need additional right-of-way.
e. Signalization. Signalization is an important part of the roadway system. It controls the flow of traffic, therefore, it affects the traffic volume passing through a particular intersection. For isolated (that is, non-system or uncoordinated) operation, the signal type indicates the degree to which a traffic signal’s cycle length, phase plan, and phase times are preset or actuated. There are currently two types of signals in use: Actuated signals and Semi-actuated signals. Intersections that have actuated signals will have vehicle detectors for all approaches. Each phase is subject to a minimum and maximum green time and some phases may be skipped if no vehicle demand is detected. Intersections installed with semi-actuated signals only have detectors located on the minor street. The signal is set such that the green is always on the major street unless a vehicle is detected on the minor street. The pre-timed signal has preset sequence of phases in repetitive order. Each phase has a fixed green time and change interval that is repeated in each cycle. The Broward County Traffic Engineering Division is responsible for installing and maintaining all signal systems in the County. The purpose of traffic signal computerization is to optimize signal operation, thereby, providing a more efficient transportation system. Coordination of traffic signals through computerization has been recognized as one of most effective ways to improve the traffic flows. A signal pre-emption for transit is being planned to help BCT provide faster and more reliable service. The City will support Broward County’s continued systematic installation and maintenance of a fully computerized signal system and the signal pre-emption program Countywide.
f. Signage. Signing and markings are features of traffic control and operation that must be considered in the geometric layout of each facility. The FDOT, Broward County, and the City create and maintain signage on their functionally assigned roadways. g. Amenities. Landscaping is the primary highway amenity. Landscape design of completed highways serves functional, as well as aesthetic purposes. Plants can serve functions of glare reduction, acoustical control, erosion control, and traffic control, if they are well chosen and judiciously placed. Plants also can provide a canopy to reduce heat gain on impervious pavement. They create and define spaces by complementing and improving the attractiveness of certain land forms, while masking undesirable views and aid in stormwater

City of Fort Lauderdale Comprehensive Plan (Ordinance C-08-18) Volume II – Transportation Element Page 8-10
storage and control. Landscape design can influence speed through control of roadway focal points. h. Significant parking facilities and durational limits Significant public parking facilities in Fort Lauderdale are defined as greater than 350 parking spaces and available to the general public are listed in Table 3 and shown on Map 4. Long-term parking facilities are defined as more than a day parking duration.
Table 3
Capacity and Duration of Significant Public Parking Facilities
Map ID
Facility
Location Spaces
Duration
1
Ft Lauderdale Central Parking Garage
SE 1st Ave./SE 1st St.
2,156
Long- & short-term
2 Ft. Lauderdale Municipal
NE 1st St./Andrews
536
Long- & short-term
3
Ft. Lauderdale Station
Broward Blvd./I-95
556
Long- & short-term
4 Cypress Creek Station
Cypress Creek/CSX
394
Long- & short-term
5 Broward County Governmental Center
Broward Blvd./SW 1st Ave
1,550
Short-term
6 Center for Performing Arts
SW 2nd St./SW 5th Ave.
953
Short-term
7 Ft. Lauderdale/Hollywood International Airport
Airport
15,240
Long- & short-term
8
Port Everglades/Convention Center Parking Garage
SE 20th St./Eisenhower Blvd.
2,500
Long- and short-term
9
South Beach Lot
SR A1A
502
Short-term
10
Las Olas Intracoastal Lot Las Olas Boulevard at the Intracoastal Waterway
474
Short-term
Source: Broward County Transportation Planning Division, 2005.
The City has two other privately owned major parking facility located at the Galleria Mall and Beach Place.

W SUNRISE BLVD
W BROWARD BLVD
DAVIE BLVD
SR 84
N S
R 7
OAKLAND PARK BLVD
COMMERCIAL BLVD
NW 62ND ST
S F
ED
ER
AL
HW
Y
N F
ED
ER
AL
HW
YE LAS OLAS BLVD
N A
TLA
NT
IC B
LVD
NW
31S
T A
VE
INT
ER
STA
TE 9
5NW 19 ST
AT
LAN
TIC
OC
EA
N
FLO
RIDA T
URNPIKE
AN
DR
EW
S A
VE
N D
IXIE
HW
Y
NE 13 ST
I-595
SE 17 ST
NW
7 A
VE
SISTRUNK BLVD
MCNAB RD
Fort Lauderdale /Hollywood
International Airport
PortEverglades
Fort Lauderdale /Executive
Airport
101011
22
33
44
55
66
77
99
88
DATA SOURCE: BROWARD COUNTY TRANSPORTATION PLANNING DIVISION - MAY, 2006MAP SOURCE: CITY OF FORT LAUDERDALE PLANNING & ZONING DEPARTMENT- JAN, 2007
Volume II - Transportation Element Page 8-11
PUBLIC PARKING MAP 4 0 1 20.5
Miles
Legend
WATER
CITY LIMITS
SIGNIFICANT FACILITIES

City of Fort Lauderdale Comprehensive Plan (Ordinance C-08-18) Volume II – Transportation Element Page 8-12
i. Safety. A safe roadway network enhances the protection of life and property. Safety aspects include crash indicators, access management standards, hurricane evacuation, debris control, intersection and interchange improvements, bike lanes, sidewalks and signalization.
1) Crash indicators. Table 4 illustrates the number of vehicular crashes and the percent change in crashes from the previous year for the years 2000 to 2005 in Fort Lauderdale as compared to Broward County and the State of Florida. Other than 2005, the City has lowered the number of traffic crashes since 2002.
Table 4
Number of Vehicular Crashes and Percent Change in Fort Lauderdale, Broward County and Florida: (2000-2005)
Fort Lauderdale Broward County Florida Calendar
Year
Crashes Percent Change
Crashes
Percent Change
Crashes
Percent Change
2000 11,043 ---
27,814
---
246,541
---
2001 11,580 +4.86
28,262
+1.61
256,169
+3.91
2002 10,880 -6.43
27,096
-4.13
250,470
-2.22
2003 10,622 -2.43
26,444
-2.41
243,294
-2.87
2004 10,514 -1.03
26,627
+0.69
252,902
+3.95
2005 10,724 +2.00 27,399 +2.90 268,605 +6.21 Source: 2005 Traffic Crash Facts, Florida Department of Highway Safety and Motor Vehicles, 2005, City of Fort Lauderdale District and Citywide Statistics, 2006.
2) Access management. Fort Lauderdale will continue maintaining land development regulations that control the connection of access points of driveways and roads. 3) Hurricane evacuation. Another roadway safety concern is the evacuation of the Coastal High Hazard Area, generally defined as the areas east of Intracoastal Waterway, prior to an on-coming hurricane. The designated evacuation zones critical to the evacuation of the coastal population prior to an impending natural disaster are shown on Map 5. Table 5 shows the five east-west evacuation routes leading from and into the Coastal High Hazard Area. All bridges crossing the Intracoastal Waterway are critical in the event of evacuation, and are listed in Table 6.

W SUNRISE BLVD
W BROWARD BLVD
DAVIE BLVD
SR 84
N S
R 7
OAKLAND PARK BLVD
COMMERCIAL BLVD
NW 62ND ST
S F
ED
ER
AL
HW
Y
N F
ED
ER
AL
HW
YE LAS OLAS BLVD
N A
TLA
NT
IC B
LVD
NW
31S
T A
VE
INT
ER
STA
TE 9
5NW 19 ST
AT
LAN
TIC
OC
EA
N
FLO
RIDA T
URNPIKE
AN
DR
EW
S A
VE
N D
IXIE
HW
Y
NE 13 ST
I-595
SE 17 ST
NW
7 A
VE
SISTRUNK BLVD
MCNAB RD
Fort Lauderdale /Hollywood
International Airport
PortEverglades
95
595
PLANTATION ELEMENTARYPLANTATION ELEMENTARY
PARK LAKES ELEMENTARYPARK LAKES ELEMENTARY
ROCK ISLAND ELEMENTARYROCK ISLAND ELEMENTARY
ASHE, ARTHUR ROBERT JR MIDDLEASHE, ARTHUR ROBERT JR MIDDLE
DATA SOURCE: SOUTH FLORIDA REGIONAL PLANNING COUNCIL (SFRPC) - SEPT, 2006MAP SOURCE: CITY OF FORT LAUDERDALE PLANNING & ZONING DEPARTMENT- JULY, 2006
HURRICANE EVACUATION ZONES MAP 50 1 20.5
Miles
MAP 5
LegendCORPORATE LIMIT
COUNTY EVACUATION ZONESPLAN A (CAT. 1-2 HURRICANE)
PLAN B (CAT. 3 OR HIGHER HURRICANE)
EVACUATION ROUTES
HURRICANE SHELTERS

City of Fort Lauderdale Comprehensive Plan (Ordinance C-08-18)Volume II – Transportation Element Page 8-14
Table 5 Hurricane Evacuation Routes and Other Pertinent Information
Route
General Area Served for
Evacuation
Lanes: SR A1A
to US 1 Commercial Blvd.
Terra Mar Dr. to north boundary of Ft. Lauderdale
4 & 6 lanes
Oakland Park Blvd.
North boundary of Ft. Lauderdale to Sunrise Blvd.
4 & 6 lanes
Sunrise Blvd.
Sunrise Blvd. to Las Olas Blvd.
6 lanes
Las Olas Blvd.
Sunrise Blvd. to SE 17th Street
4 lanes
17th Street
Las Olas Blvd. to Port Everglades
4 & 6 lanes
Source: Broward County Transportation Planning Department, 2006
Table 6 Bridges Critical to Hurricane Evacuation
Bridge Name
Length and Deck Width
in Feet
Closed
Clearance in Feet
Commercial Blvd. Bridge
350/58
15
Oakland Park Blvd. Bridge
456/57
22
Sunrise Blvd. Bridge
362/54
16
Las Olas Bridge
1,095/62
31
17th Street Bridge
999/57
25
Source: Broward County Transportation Planning Department, 2006
2. Public Transit Network Fort Lauderdale’s public transit network includes: transit facilities, right-of-ways, exclusive transit corridors, and transit vehicles.
a. Public transit facilities. Public transit facilities include: bus and passenger rail terminals (Major Transit Hub), rail corridors, transfer stations, transit bus stops and park and ride facilities.
1. The Broward Central main bus transit passenger terminal is located in downtown Fort Lauderdale, on the northwest corner of the Broward Boulevard and Brickell Avenue. The bus terminal sits on an approximately three acre site and can accommodate up to

City of Fort Lauderdale Comprehensive Plan (Ordinance C-08-18) Volume II – Transportation Element Page 8-15
24 buses simultaneously and is accessible as defined by the Americans with Disabilities Act (ADA). Greyhound Lines, a private bus passenger company, has a bus terminal in the City of Fort Lauderdale. Railway, waterway, airport, and intermodal terminals are discussed in other subsections of this section, under their respective headings. The Greyhound bus terminal is a component of the SIS. 2. Fort Lauderdale has two passenger rail terminals. They are:
a. Cypress Creek Station – Located at I-95 and Cypress Creek Road. b. Fort Lauderdale Station – Located at I-95 and Broward Boulevard.
3. Rail Corridors – Fort Lauderdale has two rail corridors. They
are: a. South Florida Rail Corridor – Located just west of I-95 running north/south. b. Florida East Coast Railway – Located near US-1 running north/south.
Both rail terminals and rail corridors are components of the Strategic Intermodal System. See Map 3 for details.
4. A transfer station is a fixed location where passengers interchange from one route or vehicle to another. Fort Lauderdale’s transfer stations are located at the two rail stations and the Central Bus Terminal. The Broward Boulevard Tri-Rail station is currently a well-used transfer hub connection to Downtown Fort Lauderdale. The City also has a specialized bus stop that operates as transfer station at Galt Ocean Mile. These locations are bus stops that provide a convergence of several routes. Because more than one route frequents the bus stop, passengers can transfer between routes and vehicles.

City of Fort Lauderdale Comprehensive Plan (Ordinance C-08-18) Volume II – Transportation Element Page 8-16
5. Public transit bus stops. The BCT maintains, monitors, and updates its Bus Stop Inventory. The 2006 inventory shows Fort Lauderdale has approximately 848 bus stops. Private advertisers maintain approximately 319 benches. Approximately 43 shelters have been installed and are maintained by FDOT. The City has a non-advertising ordinance for shelters located within the City. 6. Fort Lauderdale has two park and ride lots. They are located adjacent to the Cypress Creek and Fort Lauderdale rail stations.
b. Rights-of-way. Additional right-of-way along major arterial roadways is acquired during the roadway widening process for bus pullout bays, also called bus bays. Bus pullout bays are specialized bus stop auxiliary lanes, independent of the through traffic travel lane. Fort Lauderdale has approximately 60 bus bays/right-turn-lanes associated with bus stops. The bus bays are designed to minimize traffic obstruction and maximize passenger safety. c. Exclusive public transit corridors. Roadway or railway corridors exclusively designated by the FDOT, City or County for public transit, which is physically separated from general use corridors and to which access is highly restricted. The City does not have any exclusive public transit corridors. d. Public transit vehicles. The Broward County Transit (BCT) 2005 vehicle inventory consists of approximately 284 full-size transit coaches, each with seating capacities of approximately 40-42 persons. Additionally, BCT owns 75 community buses. All vehicles are air-conditioned and have kneeling mechanisms, which lower the steps of a bus to accommodate persons who have mobility impairments. All buses are equipped with wheelchair lifts or ramps for facilitating boarding and disembarking. SFRTA’s service fleet consists of 12 diesel-electric locomotives, 11 bi-level cab cars and 15 bi-level coaches.
e. Public Transit Services. Public transit services are passenger services provided by public, private or non-profit entities. They include the following surface transit modes: fixed route bus service, limited route bus service, high capacity transit corridors, feeder bus service, demand responsive/paratransit service, community bus service, intercounty service, and other services. Maps 6 and 7 show the existing fixed public transit routes and the community bus service routes.

W SUNRISE BLVD
W BROWARD BLVD
DAVIE BLVD
SR 84
N S
R 7
OAKLAND PARK BLVD
COMMERCIAL BLVD
NW 62ND ST
S F
ED
ER
AL
HW
Y
N F
ED
ER
AL
HW
YE LAS OLAS BLVD
N A
TLA
NT
IC B
LVD
NW
31S
T A
VE
INT
ER
STA
TE 9
5NW 19 ST
AT
LAN
TIC
OC
EA
N
FLO
RIDA T
URNPIKE
AN
DR
EW
S A
VE
N D
IXIE
HW
Y
NE 13 ST
I-595
SE 17 ST
NW
27
AV
E
SISTRUNK BLVD
MCNAB RD
Fort Lauderdale /Hollywood
International Airport
PortEverglades
11
40
BCT CentralTerminal
981
81
36
11
40
81
55
62
18
36
31
6
20
9
72
60
50
14
1
22
30
57
15
441
10
DATA SOURCE: BROWARD COUNTY TRANSIT DIVISION - JAN, 2006MAP SOURCE: CITY OF FORT LAUDERDALE PLANNING & ZONING DEPARTMENT- JULY, 2006
EXISTING BCT TRANSIT ROUTES
0 1 20.5Miles
Legend
BCT Busroutes
1
CITY LIMITS
BUS ROUTES
MAP 6

W SUNRISE BLVD
W BROWARD BLVD
DAVIE BLVD
SR 84
OAKLAND PARK BLVD
COMMERCIAL BLVD
NW 62ND ST
S F
ED
ER
AL
HW
Y
N F
ED
ER
AL
HW
Y
E LAS OLAS BLVD
N A
TLA
NT
IC B
LVD
NW
31S
T A
VE
INT
ER
STA
TE 9
5
NW 19 ST
AT
LAN
TIC
OC
EA
N
FLO
RIDA T
URNPIKE
AN
DR
EW
S A
VE
N D
IXIE
HW
YNE 13 ST
SE 17 ST
NW
27
AV
E
SISTRUNK BLVD
MCNAB RD
CYPRESS CREEK STATIONCYPRESS CREEK STATION
FT. LAUDERDALE STATIONFT. LAUDERDALE STATION
DATA SOURCE: BROWARD COUNTY METROPOLITAN PLANNING ORRGANIZATION (MPO) OCT, 2006MAP SOURCE: CITY OF FORT LAUDERDALE PLANNING & ZONING DEPARTMENT- JULY, 2006
COMMUNITY BUS / TRI-RAIL SHUTTLES
0 0.8 1.60.4Miles
Legend
Convention Connection
Tri-Rail Shuttle RoutesCC1
CC2
CC3
FL1
Community Bus RoutesDowntown Loop
Las Olas/Beaches (fri & sat eve)
TMAX Park & Ride
TMAX Tri-Rail (weekend)
Northwest Circulator
Lauderdale Manors/Villas Hillmont Heights
North Beach
CITY LIMITS
Tri-Rail Station
MAP 7

City of Fort Lauderdale Comprehensive Plan (Ordinance C-08-18) Volume II – Transportation Element Page 8-19
1. Fixed-route bus service. Broward County Transit (BCT) operates a fixed-route bus system servicing nearly all of Fort Lauderdale. It provides service on a repetitive, fixed-schedule basis. Each fixed-route trip serves the same origins and designations. Currently, BCT operates 40 transit routes. Connections also are made to Miami-Dade County and Palm Beach County and Tri-Rail Commuter Rail service (seven stations). Fixed-route transit service is provided seven days a week. Routes operate from as early as 4:45 a.m. until 12:25 a.m. 2. Limited bus services. Limited bus services, which has faster operating speeds and serves a limited number of origins and destinations, provides a level of service comparable to the automobile. BCT recently instituted a limited stop service on SR 7 (US 441) called the Breeze in 2007. It has over 1,800 passengers boarding’s per weekday. 3. High capacity transit corridors. Providing high-capacity transportation will ensure economic vitality as well as minimize the impact on the environment. Articulated buses and express transit service alternatives are critical to improving transit options and to continue to explore the feasibility of fixed guideway and high-performance systems such as Bus Rapid Transit. The high-capacity premium transit enhancements are located along the corridors listed in Table 7.
Table 7
Premium Transit Corridors
Premium Transit
Enhancement
Transit Corridor
Limits
Light Rail Transit FEC RR Transit Corridor From Miami-Dade County to Palm Beach CountyLight Rail Transit Central Broward East-West
Transit Corridor From Sawgrass Mills to Int’l Airport via Downtown
BRT/Bus Rapid Transit
SR 7 Transit Bridge Phase 1: Miami-Dade County to I-595; Phase 2: I-595 to Palm Bach County
Rapid Bus Oakland Park Blvd From Sawgrass Mills to Downtown via US 1 Express Bus Cypress Creek / McNab
Road Sawgrass Mills – Cypress Creek Tri-Rail Station
Express Bus Powerline Road From Downtown Fort Lauderdale to Palm Beach Co.
Express Bus Sunrise Blvd Sawgrass Mills to Downtown Fort Lauderdale Tri-Rail Tri-Rail/SFRCTransit
Corridor From Miami-Dade County to Palm Beach County

City of Fort Lauderdale Comprehensive Plan (Ordinance C-08-18) Volume II – Transportation Element Page 8-20
4. SFRTA/Tri-Rail Feeder bus services. Feeder bus service routes are defined as local transit service that picks up and delivers passengers to a rail transit terminal, express bus stop, transfer point, or terminal. Feeder bus service is currently provided to SFRTA/Tri-Rail stations under a private contract and are identified in Table 8.
Table 8
SFRTA/Tri-Rail Feeder Bus Service
Station Name
Routes/Main Roadways
Vehicles
Cypress Creek
Cypress Creek Rd., Commercial Blvd. and Federal Highway
2
Cypress Creek
Cypress Creek Rd., Commercial Blvd. and NW 33rd Avenue
2
Cypress Creek
Cypress Creek Rd., Andrews, Racetrack and Powerline Rd
2
Ft. Lauderdale
Broward Blvd, Andrews Ave. and SE 3rd Ave.
4
Source: Train Schedule and System Information, South Florida Regional Transportation Authority (SFRTA) 2007
5. Demand responsive service. Broward County funds and administers the Transportation Options Program (TOPS), which provides door-to-door service, upon request, to residents who are disabled, transportation or economically disadvantaged, for several specific trip purposes. The program, introduced by Broward County Transit’s Paratransit Service in December 1996, gives consumers a choice of transportation service providers. Presently, five transportation entities provide demand responsive service: AAA; Area Agency on Aging in Pembroke Pines and Deerfield Beach; Handi-Van; Village Car Service; and Broward Urban Shuttle. 6. Community bus services. Table 9 presents the operating characteristics of Fort Lauderdale’s transit services. Map 7 shows community bus routes. These mini buses are wheelchair accessible and allow better access to city neighborhoods. The increased City participation in the community bus service means shorter neighborhood trips, better connections to neighboring cities and increased connections to fixed bus routes.

City of Fort Lauderdale Comprehensive Plan (Ordinance C-08-18) Volume II – Transportation Element Page 8-21
Suntrolley service operated by the Downtown Fort Lauderdale Transportation Management Association (DFLTMA) is a rubber tire free trolley service with several routes serving the downtown and beach areas. The Broward Boulevard East/West Express (BEWE) Transit Service operated by BCT provides a convenient, reliable, and free express transit service for County employees, residents, consultants, developers and other customers conducting business with Broward County on a regular basis or seeking County services at either location.
The BEWE service operates on a 30-minute frequency beginning at 7:00 a.m. and stops at the Government Center West located at One University Drive in Plantation, the Broward Sheriff's Office at Broward Blvd. and Northeast 27th Avenue, and the Governmental Center at the Brickell Ave. entrance. Two 20-passenger shuttle buses are utilized to provide the BEWE service.
The Broward Boulevard East/West Express Transit Service will operate on bio-diesel fuel in Transportation Management Association's commitment to promote domestically produced renewable energy sources. The project is funded by a grant from the Metropolitan Planning Organization. 7. Safety. Public transit safety addresses such issues as the safety certification process, transit fatalities and injuries, security surveillance at terminals and on buses, and hurricane evacuation.
a. Safety certification. BCT is in full compliance with the safety requirements mandated by the System Safety Program Plan (SSPP), Chapter 14-90, Equipment and Operational Safety Standards Governing Public Sector Bus Transit Systems. This is reflected in the Quality Assurance Performance Evaluation performed in May 2006 by the Florida Commission for the Transportation Disadvantaged (FCTD). The safety requirements are incorporated in every aspect of the operation including design and construction, procurement activities, and training and operation of the system.
b. Transit fatalities and injuries. Table 9 provides data regarding incidents and injuries, which have occurred from BCT vehicle collisions or in association with the use of BCT. In this table only incidents, where at least one person is transported to the hospital and/or there is at least $7,500 in total property damaged, are reported. Previously,

City of Fort Lauderdale Comprehensive Plan (Ordinance C-08-18) Volume II – Transportation Element Page 8-22
all incidents were reported, regardless of any injury or property damage. Also, only injuries where a person is actually transported to the hospital are reported to the Federal Transit Administration (FTA). Previously, anybody who complained of injury was counted as injured, whether they were transported or not. This explains why injuries are lower then the previous reporting period. The most incidents occurred in 2004, including 70 collisions with other vehicles, three collisions with objects and seven collisions with people. No fatalities took place in 2005.
Table 9
BCT Transit Safety and Collision Report
Incidents Injuries Fatalities Safety Items 2003 2004 2005 2003 2004 2005 2003 2004 2005
Collisions Collision with other vehicles
59 70 53 125 145 109 1 0 0
Collisions with objects 3 3 0 2 3 0 0 0 0 Collisions with people 1 7 0 1 5 0 0 2 0 Non-collisions Personal Casualties inside vehicle
47 37 48 54 38 51 0 0 0
Boarding & alighting vehicle
8 2 19 8 2 19 0 0 0
Source: Transit Safety and Security Form (405)-Report Year 2003-2005, BCT 2005.
c. Security detail and surveillance. BCT has a security detail composed of a Broward County Sheriff Sergeant and deputies. Additionally, all new buses purchased are equipped with security cameras and retrofitting older buses with security cameras is being considered. Security cameras are being installed on Tri-Rail trains. Table 10 shows BCT’s Transit System Security report.
d. Hurricane evacuation. BCT continues to provide bus service to evacuees in the Coastal High Hazard Area.

City of Fort Lauderdale Comprehensive Plan (Ordinance C-08-18) Volume II – Transportation Element Page 8-23
Table 10
BCT Transit System Security Report
Security Items
2004
2005
Robbery
0
1
Aggravated assault
10
38
Larceny/theft
4
10
Other assault
7
9
Vandalism
11
6
Drug abuse violations
36
24
Driving under the influence
0
0
Drunkenness
130
575
Disorderly conduct
298
92
Trespassing
36
38
Fare evasion
22
7
Curfew and loitering laws
10
1
TOTAL
562
801
Source: Transit Safety and Security Form (405)-Report Year 2004-2005, BCT 2004-2005.
e. Major public transit trip generators and attractors. Major public transit generators and attractors are concentrated areas of intense land use or activity that produce or attract a significant number of local trip ends. Public transit generators are typified by residential land uses. Public transit attractors include commercial, industrial, office, commercial recreation, educational, institutional, and transportation land uses. Ideally, public transit should connect major transit generators to major transit attractors. The Major Public Transit Generators and Attractors are displayed in Map 8. A major public transit attractor is defined as: a major office/industrial building exceeding 100,000 square feet, a community facility such as a school or a recreational area and other high density employment centers. Table 11 lists major transit trip attractors. A major transit generator is defined as having a high population density.

W SUNRISE BLVD
W BROWARD BLVD
DAVIE BLVD
SR 84
N S
R 7
OAKLAND PARK BLVD
COMMERCIAL BLVD
NW 62ND ST
S F
ED
ER
AL
HW
Y
N F
ED
ER
AL
HW
YE LAS OLAS BLVD
N A
TLA
NT
IC B
LVD
NW
31S
T A
VE
INT
ER
STA
TE 9
5
NW 19 ST
AT
LAN
TIC
OC
EA
N
FLO
RIDA T
URNPIKE
AN
DR
EW
S A
VE
N D
IXIE
HW
Y
NE 13 ST
I-595
SE 17 ST
NW
27
AV
E
SISTRUNK BLVD
MCNAB RD
Fort Lauderdale /Hollywood
International Airport
PortEverglades
44
55
22
3311
22
66
22
11
7744
22
88
22
11
5599
33 88
66
2211
66
55
66
55
11
33
11
22
99
22
77
33
66
5511 33
11
22
33
5511
44 33
22
554411
88
22
44
66
77
88
77
1212
1010
1010
1313
1111
DATA SOURCE: CITY OF FORT LAUDERDALE PLANNING & ZONING DEPARTMENT - JULY, 2006MAP SOURCE: CITY OF FORT LAUDERDALE PLANNING & ZONING DEPARTMENT- JULY, 2006
TRANSIT GENERATORS & ATTRACTORS
0 1 20.5Miles
11
77
44
66
44
2233
33
4488
77
55
99
44
11
1515
1111
1212
10101414
1616
S F
ED
HW
Y
NE 2ND ST
SE 2ND ST
SE 6TH ST
SW 2ND ST
NW 2ND ST
SW 6TH ST
S A
ND
RE
WS
AV
E
N U
S1
W BROWARD BLVD
NW
7TH
AV
E
SW 4TH AVE
SE
3RD
AV
E
SW
7TH
AV
E
MAP 8
Legend
MAJOR HOTELS
MAJOR MEDICAL FACILITIES
MAJOR PARKS
OFFICE / INDUSTRIAL BLDGS
OFFICE / INDUSTRIAL PARK
PORT EVERGLADES CRUISE TERMINALS
SHOPPING CENTERS / MALLS
STADIUMS / AUDITORIUMS / ARENAS
TRI-RAIL STATIONS
City Limits
Water
TAZ Boundaries
Top 5% TAZ Population
Transit Attractors
AIRPORT TERMINALS
COLLEGES / UNIVERSITIES
GOVERNMENT

City of Fort Lauderdale Comprehensive Plan (Ordinance C-08-18) Volume II – Transportation Element Page 8-25
Table 11
Transit Attractors Map # Office/Industrial Parks Corporate Park at Cypress Creek 1 Cypress Creek Business Park 2 Cypress Creek Executive Center 3 New River Center 4 Parkway Commerce Center 5 Stevenson Center Office Park 6 Uptown Office Park 7 Corporate Square 8 Trafalgar Plaza Office Park Center 9 Spectrum Office Park 10 Office/Industrial Buildings Airport Center 1 Atrium Building 2 Bank Atlantic Building 3 Barnett Bank Plaza 4 Broward Financial Center 5 Coastal Tower 6 First Fort Lauderdale Place 7 First Union Center 8 International Building 9 Las Olas Center 10 One Blockbuster Plaza 11 One Corporate Plaza 12 Radice Corporate Center 13 SunTrust Center 14 The Tower 15 Government Building 16 Shopping Centers/Major Tourism Destinations Coral Ridge Mall 1 The Galleria at Fort Lauderdale 2 Sears Town 3 Southport Shopping Center 4
Beach Place 5

City of Fort Lauderdale Comprehensive Plan (Ordinance C-08-18) Volume II – Transportation Element Page 8-26
Table 11
Transit Attractors Map # Major Medical Facilities Broward General Medical Center 1 Cleveland Clinic Florida 2 Cleveland Clinic Hospital 3 Fort Lauderdale Hospital 4 Holy Cross Hospital 5 Imperial Point Medical Center 6 Vencor Hospital of Fort Lauderdale 7 North Ridge Medical Center 8 Government Broward County Courthouse 1 Broward County Government Center 2 Broward County Main Library 3 Federal Courthouse 4 Florida Department of Transportation 5 Fort Lauderdale City Hall 6 School Board Administration 7 Colleges/Universities The Art Institute of Fort Lauderdale 1 Florida Atlantic Univ (Commercial) 2 Florida Atlantic Univ (Downtown) 3 Florida International Univ (Downtown) 4 Major Parks George English Park 1 Holiday Park 2 Hugh Taylor Birch State Park 3 Joseph C Carter Park 4 Snyder Park 5 Mills Pond Park 6 Major Hotels Embassy Suites Hotel 1 Fort Lauderdale Marriott North 2 Fort Lauderdale Grande Hotel 3 Marriott Harbor Beach Resort 4 Pier 66 Resort/Hyatt Regency 5

City of Fort Lauderdale Comprehensive Plan (Ordinance C-08-18) Volume II – Transportation Element Page 8-27
Table 11
Transit Attractors Map # Radisson/ Bahia Mar Beach Resort 6 Sheraton Yankee Clipper Beach Resort 7 Sheraton Yankee Trader Beach Resort 8 Stadiums/Auditoriums/Arenas The Art Museum 1 Bonnet House 2 Bonnet House Beach 3 Broward Center for the Performing Arts 4 Broward County Convention Center 5 Fort Lauderdale Beach 6 Fort Lauderdale Aquatic Complex 7 Jungle Queen Cruises 8 Museum of Discovery 9 Parker Playhouse 10 War Memorial Auditorium 11 Fort Lauderdale/Lockhart Stadium Complex 12 Airports Fort Lauderdale Executive Airport 1 Fort Lauderdale-Hollywood International Airport 2 Tri-Rail Stations Cypress Creek Station 1 Fort Lauderdale Station 2 Port Everglades Cruise Terminals Northport Terminal 1 Midport Terminal 2 Southport Terminal 3 Source: Walter H. Keller, Inc.
3. Bicycle network. The bicycle network includes bicycle facilities and services designed to enable and encourage the use of bicycles for recreational and utilitarian purposes. Recreational trips include travel for leisure, enjoyment, or pleasure and utilitarian trips include travel for work or errands.

City of Fort Lauderdale Comprehensive Plan (Ordinance C-08-18) Volume II – Transportation Element Page 8-28
a. Bicycle facilities. Bicycle facilities include bikeways, bicycle parking, employee showers and clothing lockers and bicycle racks on buses and trains.
1. Bikeways. A bikeway is any road, path or way which is open to bicycle travel. Fort Lauderdale bikeways include multi-purpose paths/greenways, designated bicycle lanes, paved shoulders, and wide curb lanes. In recent years the consideration of bikeways as part of the roadway design, like landscaping, has gradually become part of the roadway design process. However, because bicycle lanes were rare in Broward County and immediate connectivity between the few existing facilities was not financially feasible; a construction by opportunity approach was utilized to begin development of the on-road bicycle facility network. As new roads are being constructed, on-road bicycle facilities are included. Broward County is now reaching the point at which connectivity between facilities is becoming financially feasible. To further develop this network the Broward County Bicycling Advisory Committee is helping to develop a prioritized list of bicycle facility construction projects. The location of Existing and Designed Bikeway Facilities are displayed on Map 9. Bikeways predominantly follow state roads, although scattered segments follow local roads.
2. A bicycle lane is a portion of a roadway that has been designated by striping, signage, and pavement markings for the preferential or exclusive use of bicycles. Unlike multi-purpose paths, bike lanes are not physically separated from traffic. Fort Lauderdale will continue to include bikeways in road construction projects.
3. Shared facilities are on road facilities that provide for bicycling but are not striped or marked to bicycle lane standards. Paved shoulders and wide curb lane fit into this category. A wide curb lane is the outermost through lane of a roadway at least two feet wider than the interior lanes. Typically this is at least thirteen feet wide and is not defined by a lane stripe. Outside lane widths of fourteen feet or wider are marked striped with an eleven foot travel lane adjacent to three foot undesignated lane. Paved shoulders provide a defined space adjacent to the travel lane but do not correctly direct a bicyclist through an intersection when a right turn lane is present.
4. Undesignated Lanes. If fourteen feet is available for the outside lane, it is typically divided to create a three foot undesignated lane next to an eleven-foot travel lane. The striping

City of Fort Lauderdale Comprehensive Plan (Ordinance C-08-18) Volume II – Transportation Element Page 8-29
pattern of the undesignated lane is similar to that of marked bicycle lane.
5. Bicycle parking. Bicycle parking includes racks and lockers of various designs. Recognizing that not all bike parking facilities provide equal protection or security Broward County and the Broward County MPO produced the Broward County End-of-Trip Bicycle Facilities Guide that provides the reader with information needed to make the right decisions abut bicycle parking. Bicycle parking racks are available at Broward County government facilities, including the downtown Governmental Center, County Courthouse, County libraries, and at BCT and Tri-Rail public transit terminals. Traditional bicycle parking racks provide minimal security when bikes are left alone for long periods of time. Bicycle storage lockers provide additional security from theft and protection from inclement weather by enclosing the entire bike. Additional bicycle parking facilities are needed throughout the City, particularly at transit facilities.
6. Bus Mounted Bicycle racks. Bus mounted bicycle racks provided on public transit vehicles allow a passenger to carry a bike from a point of origin to a destination. Public transport racks enable the user to reach destinations not served by the bicycle network, thereby increasing the service area. BCT’s records show an average monthly rack usage of 33,000 per month. Tri-Rail serves hundreds of bicyclists daily by providing bicycle racks at stations and transport space on each rail car. 7. Lockers and showers. The availability of showers and lockers encourages bicycle commuting by removing obstacles to employees who must maintain a professional appearance.
b. Bicycle safety. Table 12 presents bicycle/ motor vehicle crash injury and fatality data for Broward County from 2000 -2004.

City of Fort Lauderdale Comprehensive Plan (Ordinance C-08-18) Volume II – Transportation Element Page 8-30
W SUNRISE BLVD
W BROWARD BLVD
DAVIE BLVD
SR 84
N S
R 7
OAKLAND PARK BLVD
COMMERCIAL BLVD
NW 62ND ST
S FE
DE
RAL
HW
Y
N F
EDER
AL H
WY
E LAS OLAS BLVD
N A
TLA
NTI
C B
LVD
NW
31S
T AV
E
INTE
RSTA
TE 9
5
NW 19 ST
ATLA
NTI
C O
CE
AN
FLORID
A TURNPI
KE
AND
RE
WS
AVE
N D
IXIE
HW
Y
NE 13 ST
I-595
SE 17 ST
NW
7 A
VE
SISTRUNK BLVD
MCNAB RD
Fort Lauderdale /Hollywood
International Airport
PortEverglades
¯DATA SOURCE: BROWARD COUNTY TRANSPORTATION PLANNING DEPARTMENT- 2002MAP SOURCE: CITY OF FORT LAUDERDALE PLANNING & ZONING DEPARTMENT- JULY, 2006
EXISTING & DESIGNED BICYCLE FACILITIES
0 1 20.5Miles
Legend
Bicycle FacilitiesBike LaneWide Curb LanePaved ShoulderUnmarked Lane
Existing FacilityDesigned Facility
CITY LIMITS
MAP 9

City of Fort Lauderdale Comprehensive Plan (Ordinance C-08-18) Volume II – Transportation Element Page 8-31
Table 12 Bicycle/Motor Vehicle Crashes Injuries, Injury Rate & Fatalities
2000-2004
Year
Broward County
Population
Injuries
Injury Rate per 100,000 population
Fatalities
2000 1,623,018 649 39.99 6 2001 1,649,925 597 36.18 6 2002 1,676,153 667 39.7 4 2003 1,698,425 669 39.4 5 2004 1,723,131 672 39 6
Source: Florida Dept of Highway Safety and Motor Vehicles
4. Pedestrianways network. The pedestrianways network includes sidewalks and walkways that are pedestrian lanes that provide people with space to travel within the public right-of-way that is separated from roadway vehicles.
a. Pedestrian facilities. Pedestrian facilities include sidewalks, crosswalks, walkways, access facilities, and pedestrian facility design treatments. Pedestrian facilities improve mobility for pedestrians and provide access for all types of pedestrian travel: to and from home, work, parks, schools, shopping areas, transit stops, etc. They also provide places for children to walk, run, skate, ride bikes, and play. Sidewalks should be continuous along both or one side of a street and sidewalks should be fully accessible to all pedestrians. Sidewalks must be eight feet wide at all transit stops in order to meet ADA guidelines. They should also be part of a system that provides access to goods, services, transit, and homes. Well-designed walking environments are enhanced by urban design elements and street furniture, such as benches, bus shelters, trash and recycling receptacles, and water fountains.
Fort Lauderdale’s pedestrian facilities are comprised primarily of sidewalks. These were historically not very well provided in many of the developments constructed before the late 1980's, and a great deal of infill sidewalks are required on the City’s arterial and collector streets to provide safe, comfortable drained walkways for pedestrians. This point is particularly important when access to transit is considered.
1. Sidewalks. A sidewalk inventory was completed for over 400 miles of sidewalks in ten pedestrian study areas in Broward County identified by Broward County MPO’s Pedestrian Focus Group. This group identifies areas of existing or future pedestrian

City of Fort Lauderdale Comprehensive Plan (Ordinance C-08-18) Volume II – Transportation Element Page 8-32
and transit activity. Approximately 370 miles of this inventory was completed along arterial and collector streets, while the remainder included local streets that either carry transit buses, or serve as primary pedestrian routes accessing transit stops. Of the roads that were inventoried, 70 percent are in good or fair condition, but almost 20 percent – or almost 80 miles – are missing sidewalks altogether. In addition to these pedestrian focus areas, sidewalk conditions for state highways were obtained from FDOT’s Roadway Characteristics Inventory (RCI) database and video log records, and an additional 140 miles of County and local roadways were inventoried in July 2004 as part of this study. The combined results of these data inventories for missing sidewalks are shown in Map 10.
2. Crosswalks. Crosswalks provide pedestrians with connections between sidewalks and walkways. Crosswalks are located at road intersections and mid-block locations that attract heavy pedestrian traffic, such as schools and parks. Well-marked crosswalks provide safe paths for pedestrians by alerting drivers of the potential for pedestrians crossing the street. Crosswalks may be grade-separated where safety is a concern. Improving pedestrian access along transit routes, to public transit stops, and safe routes to school is a priority.
Signals indicate to the pedestrian when it is safe to cross the street and are typically used at busy intersections in conjunction with crosswalks. At wide intersections, pedestrians often have difficulty crossing the street during the window of safety. In these circumstances, a median strip may be provided for the pedestrian to wait until the next signal change.
3. Pedestrian Treatments. Pedestrian treatments are primarily designed to promote a pleasurable walking experience. Treatments include benches, fountains, landscaping, lighting, and other urban design features. Appropriate lighting and maintenance of pedestrian sight lines are important for safety enhancement. Lighting and sight lines enable the pedestrian to spot and avoid threatening situations.
b. Safety. The Surface Transportation Policy Project calculates pedestrian safety rates using a numerical scale called the pedestrian danger index (PDI). The PDI is calculated on a scale of 1 to 100, with 1 being the safest city for walking and 100 the most dangerous. It is based upon the total number of pedestrian injuries and fatalities, the percent of all traffic related fatalities and injuries that are pedestrian, and the percent of commuters who walk to work.

City of Fort Lauderdale Comprehensive Plan (Ordinance C-08-18) Volume II – Transportation Element Page 8-33
W SUNRISE BLVD
W BROWARD BLVD
DAVIE BLVD
SR 84
N S
R 7
OAKLAND PARK BLVD
COMMERCIAL BLVD
NW 62ND ST
S FE
DE
RAL
HW
Y
N F
EDER
AL H
WY
E LAS OLAS BLVD
N A
TLA
NTI
C B
LVD
NW
31S
T AV
E
INTE
RSTA
TE 9
5
NW 19 ST
ATLA
NTI
C O
CE
AN
FLORID
A TURNPIK
E
AND
RE
WS
AVE
N D
IXIE
HW
Y
NE 13 ST
I-595
SE 17 ST
NW
27
AVE
SISTRUNK BLVD
MCNAB RD
Fort Lauderdale /Hollywood
International Airport
PortEverglades
¯DATA SOURCE: BROWARD COUNTY TRANSPORTATION PLANNING DIVISION - JUNE, 2007MAP SOURCE: CITY OF FORT LAUDERDALE PLANNING & ZONING DEPARTMENT- JULY, 2007
MISSING SIDEWALK AREAS
0 1 20.5Miles
MAP 10
Legend
WATER
MISSING SIDEWALKS
CITY LIMITS

City of Fort Lauderdale Comprehensive Plan (Ordinance C-08-18) Volume II – Transportation Element Page 8-34
Table 13 presents pedestrian injuries and fatalities data specific to Broward County.
Table 13 Broward County Pedestrian Fatalities and Injuries
2000 – 2004
Year
Broward County
Population
Fatality Rate*
Total
Fatalities
Injury Rate*
Total
Injuries
2000 1,623,018 2.53 41 59.70 969 2001 1,649,925 2.55 42 60.18 993 2002 1,709,118 2.11 36 54.9 938 2003 1,698,425 2.53 43 61.2 1040 2004 1,723,131 2.21 38 53.6 923
* Per 100,000 population Source: Crash data from Florida Department of Highway Safety and Motor Vehicles 5. Waterway network. Prior to 1896, when the Florida East Coast Railway was constructed through Fort Lauderdale, Fort Lauderdale was accessible primarily through its navigable waterways. Until 1928, when Port Everglades was created by opening Lake Mabel to the Atlantic Ocean, there was no dependable anchorage for large ships. Today, Port Everglades is accessible by the world’s largest ships, while Fort Lauderdale’s other navigable waterways allow navigation by commercial and recreational boats.
Waterway facilities include those water bodies navigable from the Atlantic Ocean, and water-dependent transportation facilities, such as ports, marinas and boat ramps. Waterway services are those that serve navigation, such as passenger and freight services.
a. Navigable water features. Fort Lauderdale’s navigable water bodies are the Atlantic Ocean, the Intracoastal Waterway, the New River and its tributaries, the Middle River and its tributaries. These canals and others were dredged to drain land for development, but also serve as transport waterways for pleasure craft, water taxies, and other vessels. For purposes of this subsection, water features are divided into two categories: the Intracoastal Waterway and Other Navigable Waters.
1. Intracoastal Waterway. The Atlantic Intracoastal Waterway (ICW) is Fort Lauderdale’s primary navigable water body, extending from McNab Road to Port Everglades. The ICW has an average depth of 10 feet at mean low water (MLW). The Intracoastal Waterway is a component of the SIS.

City of Fort Lauderdale Comprehensive Plan (Ordinance C-08-18) Volume II – Transportation Element Page 8-35
The U.S. Army Corps of Engineers (COE) has jurisdiction over the ICW. The COE regulates the setback of structures, such as piers and docks, along the ICW. The current regulations prevent the construction, reconstruction and substantial rehabilitation of structures that extend farther than 100 feet from the bank of the main channel. The regulations provide for an exemption from this requirement where the ICW is too narrow to meet the 100-foot criteria. In those cases, the exemption allows a dock to reach 25 feet from the bank of the ICW. For that portion of the ICW within the Port Jurisdictional Area (PJA), the Port Everglades Department has an agreement with the COE to maintain a 42 feet project depth and an average width of 125 feet. The average change in depth attributable to the tidal shift is three feet. 2. Other Navigable Waterways. The 11.5 + mile long New River and its tributaries collectively form Fort Lauderdale’s second longest navigable waterway. The New River’s narrowest channel is at least 70-feet wide and has an average eight foot depth. The New River originates at the confluence of the North Fork New River (NFNR) and the South Fork New River (SFNR), south of Broward Boulevard and west of SW 7th Avenue. The New River connects with the ICW near the Bahia Mar. The NFNR extends in a southeasterly direction for approximately four-and-one-half (4.5) miles from the South Florida Water Management District Stage Divide structure S-33, just west of NW 31st Avenue and has a depth of approximately five-to-six feet. The SFNR extends northeasterly for approximately four miles and ends west of US 441.
The two mile long Middle River begins at the confluence of the North Fork Middle River and the South Fork Middle River, just west of US 1 and south of NE 26th Street in Fort Lauderdale. The north and south forks of the Middle River are branches of the Middle River Canal and completely encircle the City of Wilton Manors. The Middle River has an average depth of between five and eight feet and an average of width of 120+ feet.
b. Water-dependent transportation facilities. Water-dependent transportation facilities are those that can only be carried out on, in, or adjacent to water areas because the facility requires access to the water body for waterborne transportation including seaports, marinas, and marine recreational facilities.

City of Fort Lauderdale Comprehensive Plan (Ordinance C-08-18) Volume II – Transportation Element Page 8-36
c. Water-related transportation services. Water related transportation services are provided by private businesses operating through Port Everglades, including containerized cargo, petroleum, bulk cargo and passenger cruises. Port Everglades has a storage capacity of 10 million barrels and serves as the second largest non-refinery import, storage, and distribution center for petroleum products on the U.S. east coast. Port Everglades handles over two million passenger movements each year, making it the second busiest cruise port in the world, only behind the Port of Miami. The Fort Lauderdale Water Bus, a private water bus service, operates on demand much like a regular bus service and it ferries persons to various destinations accessible through Fort Lauderdale’s navigable waterways. Waterbus service ferries passengers between downtown, the beach, 17th Street and Sunrise Boulevard. Public bus service to the Port Jurisdictional Area (PJA) is provided by Broward County Transit (BCT) via Bus Route 40 along the SE 17th Street Causeway, with a stop located at the intersection of SE 17th Street and Eisenhower Boulevard. Port Everglades can, therefore, be accessed through transfers from anywhere the BCT bus routes operate. d. Safety. Pleasure boating is growing in popularity every year. The U.S. Coast Guard estimated the total number of recreational boats in 1961 at 5.85 million. This number has grown to a current estimate of more than 20 million pleasure boats. As more and more boats continue to cruise Fort Lauderdale’s navigable waterways for recreation and commerce, safe boating becomes increasingly important to prevent crashes, injury and death. The U.S. Coast Guard national statistics show that there are approximately 7,000 boating crashes reported each year, which results in over 700 fatalities and over $20 million in property damage. Florida currently leads the nation in boating crashes, injuries and fatalities. Some of the major causes of boat accidents include drunk driving, excessive speeds, and congested waterways. The Florida Marine Patrol and the Florida Game and Fresh Water Fish Commission are empowered to make sure that the operators of the over 771,000 motorized vessels currently registered in Florida obey all laws. They ensure waterway safety by limiting boat speeds, maintaining County-owned boat ramps, assessing the manatee protection plan, and implementing the flotilla plan in the event of a hurricane. Port Everglades safety is addressed through such actions as channel dredging, adequate roadways, coordinating Port improvements with the Airport and with

City of Fort Lauderdale Comprehensive Plan (Ordinance C-08-18) Volume II – Transportation Element Page 8-37
municipal issued development permits and orders, and protecting the Port from incompatible land uses. During a hurricane, the proper movement and storage of boats is vital. A flotilla plan has been established and implemented for such an occasion. Safety at Port Everglades will be achieved through the maintenance of various safety plans, including the Hurricane Plan, Terminal Preplan, Search and Rescue Plan, Mass Casualty Plan, Water Rescue Plan, and Operational Plan.
6. Seaports. Fort Lauderdale has one seaport controlled by Broward County Port Everglades Department. Port Everglades, portions of which are located in Fort Lauderdale, Hollywood, Dania Beach and Unincorporated Broward County, encompasses 2,190 acres adjacent to the Intracoastal Waterway. The Port and its zones are shown on Map 11. Port Everglades is a component of the SIS. With its containerized cargo, liquid and dry bulk commodities, and cruise activities, the Port is one of the most diversified in Florida. Port Everglades ranks among the top 15 U.S. Container ports, moving more than 864,000 20-foot equivalent container units (TEUs) in Fiscal Year (FY) 05/06. The container throughput is expected to reach one million TEUs over the next five years. The cargo and cruise operations are also expected to grow significantly over the next several decades. The Port is the primary storage and distribution seaport for refined petroleum product in South Florida. Every day, about 12.5 million gallons of petroleum product are delivered on ship tankers for distribution to facilities in a 12-county area. In addition to its substantial cargo operations, the Port also serves more than 40 cruise ships, which made more than 1,700 ship calls and embarked and disembarked 3.2 million multiday and one-day cruise passengers in FY 05/06. Port Everglades estimates the economic impacts of its diverse operations include 15,000 direct jobs as well as an annual $2.9 billion in business activities, $880 million in personal income, and $58 million in local taxes.
Port Everglades is divided into three main areas: Northport, Midport, and
Southport, whose current uses are as follows:
Northport accommodates cruise ships and petroleum tankers as well as other bulk ships. It also contains the Convention Center and structured parking facility. Midport is the Port’s main cruise ship berthing area, but also accommodates both containerized and non-containerized cargo. It also contains a structured parking facility.

City of Fort Lauderdale Comprehensive Plan (Ordinance C-08-18) Volume II – Transportation Element Page 8-38
FPLPOWERPLANT
MIDPORTGARAGE
NORTHPORTGARAGE
CONVENTIONCENTER
HARBOURSHOPPES
US COASTGUARD
JOHN U LOYDSTATE REC
AREA
FORT LAUDERDALE/HOLLYWOOD INT.
AIRPORT
HOLLYWOOD
HOLLYWOOD
DAN
IA B
EAC
H
COUNTY REGIONAL FACILITY
HO
LLY
WO
OD
ATLA
NTI
C O
CEA
N
CO
UN
TY R
EG
ION
AL FA
CILITY
DAN
IA B
EAC
H
FOR
T L AU
DE
RD
AL E
DAN
IA B
EAC
HH
OLLY
WO
OD
CO
UN
TY R
EG
I ON
AL FA
CI LI TY
DAN
IA B
EAC
H
SE 20TH ST
SE 17 ST
SR 84 SPANGLER BLVD
S FEDER
AL H
WY
ELLER DR
S AN
DR
EWS A
VE
EISENH
OW
ER B
LVDINTERSTATE 595
HO
L LYW
OO
D
FORT LAUDERDALE
CO
UN
TY R
EG
ION
AL FAC
I LI TY
DANIA BEACH
DANIA BEACH
DA
NIA
BEA
CH
S US
1
N O
CEA
N D
R
S FE
DER
AL H
WY
S M
IAM
I RD
SE 15TH ST
NE
7TH A
VE
MC
INTO
SH
RD
S A
1A
S OC
EA
N D
R
ELLER D
R
SE 3R
D A
VE
SE 1 4TH
AV
E
S INTR
AC
OA
STAL WW
Y
SE 42ND ST
INLET DR
SE 13TH ST
SE 14TH ST
SE 19TH
AV
E
¯DATA SOURCE: BROWARD COUNTY/CITY OF FORT LAUDERDALE PLANNING & ZONING DEPARTMENT- JULY, 2006MAP SOURCE: CITY OF FORT LAUDERDALE PLANNING & ZONING DEPARTMENT- JULY, 2006
PORT EVERGLADES
0 0.4 0.80.2Miles
MAP 11
Legend
Port Jurisdiction Boundary
Port ZonesNorth Port
Mid Port
South Port
Protected Mangrove Area
Water Bodies
Other Port Areas
Corporate Limits

City of Fort Lauderdale Comprehensive Plan (Ordinance C-08-18) Volume II – Transportation Element Page 8-39
Southport is the location planned for most of the Port’s containerized cargo growth, including a proposed near dock intermodal container transfer facility to move cargo directly from ship to railcar.
a. Port Everglades’ rail connections facilitate the intermodal transfer of freight. The internal Port Everglades Railroad system is owned by the Port, but operated by the Florida East Coast (FEC) Railroad. Rail service accesses Port Everglades from CSX along Eller Drive and then branches to several spurs just west of SE 14th Street. Cargo rail service is provided to Slips 1, 2 and 3, along Eller Drive, and along Spangler Boulevard. This rail facility is a component of SIS Connectors.
b. Access roadways facilitate the intermodal transfer of freight and passengers. The ingress and egress points to Port Everglades are: Eller Drive, Spangler Boulevard and Eisenhower Boulevard. Table 14 identifies the access road characteristics. The Port Everglades Department will continue to maintain and improve access and internal roadways network within the Port Jurisdictional Area (PJA).
Table 14
Port Everglades Access Roadway Characteristics
Roadway
No. of Lanes
Daily
Capacity
Weekday
Traffic
Peak Hour
Volume
Level of Service
Eller Drive US 1 to SE 18th Ave.
4LD
31,000
16,700
1,291
B
Spangler Blvd. US 1 to Eisenhower Blvd.
4LD
31,000
9,400
451
B/A Eisenhower Blvd. SE 20th St. to Spangler
4LD
31,000
3,400
198
A Source: Broward County Transportation Division, FDOT LOS Manual, 2002 4LD = 4 lane divided.
Spangler Drive provides access to the Port Jurisdictional Area (PJA) from the SIS, via US 1 to I-595 and SR 84 to I-95, and serves the Port's petroleum storage terminals, the Broward County Convention Center, the Northport passenger terminals, and the Midport cargo terminals. Eisenhower Boulevard, at 17th Street Causeway, is the primary entranceway to Northport and provides access to the Broward

City of Fort Lauderdale Comprehensive Plan (Ordinance C-08-18) Volume II – Transportation Element Page 8-40
County Convention Center, Northport Festival Marketplace, the 2,500-car Northport Parking Garage, and the proposed Convention Center Hotel. In addition to Eller Drive, Eisenhower Blvd. and Spangler Blvd., the Port’s major internal roads include SE 14 Avenue, SE 19 Ave., McIntosh Road, SE 20 St. and SE 28 St.
c. Port Safety. Port Everglades has a variety of plans in place in the event of a disaster or eminent danger. The Port is subject to Homeland Security measures that include security checkpoints at each access point into the PJA.
1. Hurricane Plan. The Port Everglades Hurricane Plan is designed to provide effective mitigation and recovery activities provided by Port employees. Additionally the plan addresses the coordination of client activities to ensure a safe working environment during and after a storm. 2. Terminal Preplan. This plan is designed to assist emergency responders in the event of a fire or accidental release of product. 3. Search and Rescue Plan. This plan is designed to assist with the search and recovery of individuals in the event of a catastrophic accident or disaster. 4. Mass Casualty Plan. This plan is designed to provide an organizational tool for the management of large-scale emergency incidents involving large numbers of patients and victims. 5. Water Rescue Plan. This plan is designed to provide an organizational tool to assist with emergencies involving incidents on water, such as plane crashes and boating accidents. 6. Operational Plans. This is part of Port Everglades Standard Operating Guidelines that address response to emergencies of all types.
7. Airports and related facilities and services. Airports are an integral part of the City’s multi-modal transportation network. They provide access to local, state, national and international markets, and generate economic activity. Civil aviation activities can be subdivided into passenger air carrier, air cargo, and general aviation facilities.

City of Fort Lauderdale Comprehensive Plan (Ordinance C-08-18) Volume II – Transportation Element Page 8-41
a. Airports and related facilities. Fort Lauderdale owns, operates, or has jurisdiction over two airports: Fort Lauderdale-Hollywood International Airport (FLL) and Fort Lauderdale Executive Airport (FXE).
1. Fort Lauderdale-Hollywood International Airport. FLL is a regional facility that serves international and domestic air carriers, and attracts passengers from Broward, north Miami-Dade and south/central Palm Beach counties. Broward County owns and operates the airport. It occupies a site of 1,718 acres in the southeastern part of the county, located south of I- 595, some two miles west of the coastline. The airport is accessible by roadway (from I-95 and I-595, Griffin Road and US Route 1), by Tri-Rail and by a Broward County BCT bus route. Fort Lauderdale-Hollywood International Airport is a component of the SIS.
a. Airfield. Table 15 shows the FLL airfield consists of three active runways and supporting taxiways and taxi lanes. The primary air carrier runway, cross wind runway and supporting taxiways are designed to accommodate air carrier aircraft, whereas the south runway is a utility runway, designed for use by General Aviation and Commuter aircraft.
Table 15
Existing Runways at Fort Lauderdale-Hollywood International Airport
Description and Orientation
Runway
Length and Width
Primary air carrier runway (east-west parallel)
9L-27R
9,000 feet X 150 feet
Utility runway (east-west parallel)
9R-27L
5,276 feet X 100 feet
Crosswind runway (northwest -southeast)
13-31
6,928 feet X 150 feet
Source: Broward County Aviation Department, 2006.
b. Terminals and gates. The existing terminal complex includes four terminal building units, with six concourses, divided into enplaning and deplaning levels. The terminals provide facilities to accommodate passengers and their baggage, including ticket counters, passenger waiting areas, baggage claim, baggage handling, concessions, customs and immigration, as well as airline operations
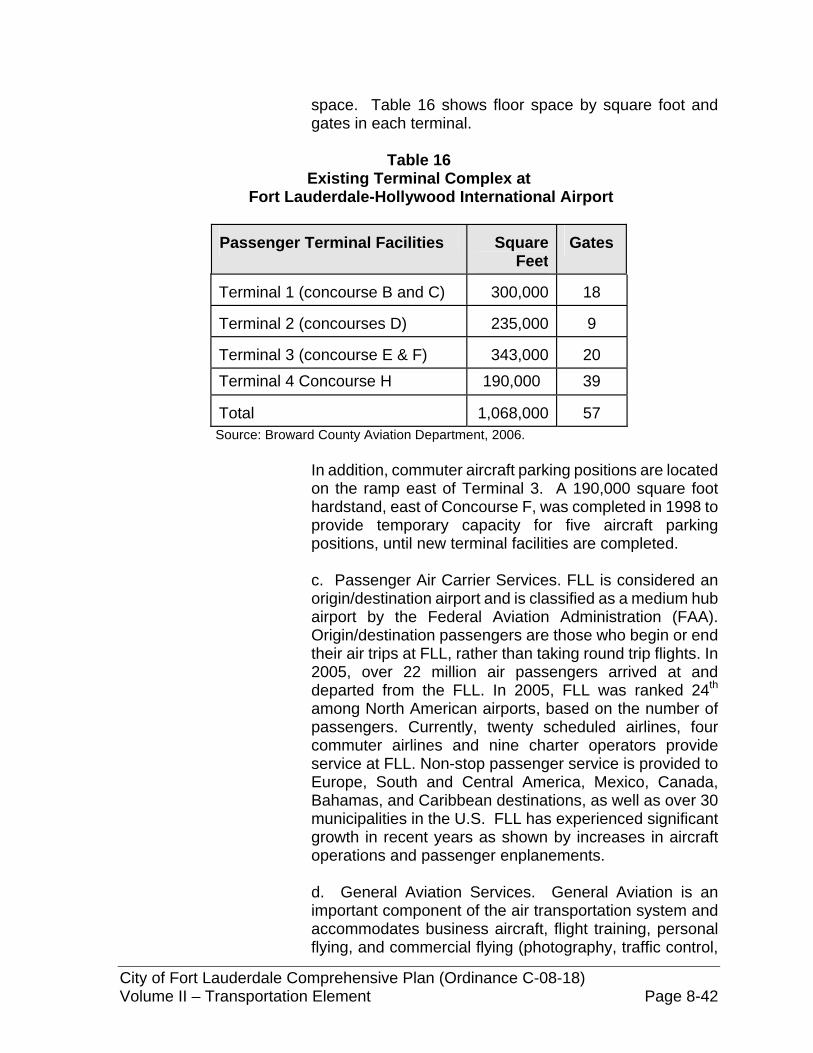
City of Fort Lauderdale Comprehensive Plan (Ordinance C-08-18) Volume II – Transportation Element Page 8-42
space. Table 16 shows floor space by square foot and gates in each terminal.
Table 16
Existing Terminal Complex at Fort Lauderdale-Hollywood International Airport
Passenger Terminal Facilities
Square
Feet
Gates
Terminal 1 (concourse B and C)
300,000
18
Terminal 2 (concourses D)
235,000
9
Terminal 3 (concourse E & F)
343,000
20
Terminal 4 Concourse H 190,000 39 Total
1,068,000
57
Source: Broward County Aviation Department, 2006.
In addition, commuter aircraft parking positions are located on the ramp east of Terminal 3. A 190,000 square foot hardstand, east of Concourse F, was completed in 1998 to provide temporary capacity for five aircraft parking positions, until new terminal facilities are completed. c. Passenger Air Carrier Services. FLL is considered an origin/destination airport and is classified as a medium hub airport by the Federal Aviation Administration (FAA). Origin/destination passengers are those who begin or end their air trips at FLL, rather than taking round trip flights. In 2005, over 22 million air passengers arrived at and departed from the FLL. In 2005, FLL was ranked 24th among North American airports, based on the number of passengers. Currently, twenty scheduled airlines, four commuter airlines and nine charter operators provide service at FLL. Non-stop passenger service is provided to Europe, South and Central America, Mexico, Canada, Bahamas, and Caribbean destinations, as well as over 30 municipalities in the U.S. FLL has experienced significant growth in recent years as shown by increases in aircraft operations and passenger enplanements. d. General Aviation Services. General Aviation is an important component of the air transportation system and accommodates business aircraft, flight training, personal flying, and commercial flying (photography, traffic control,

City of Fort Lauderdale Comprehensive Plan (Ordinance C-08-18) Volume II – Transportation Element Page 8-43
mosquito control, banner towing etc.). General Aviation airport activity levels can be expressed in terms of based aircraft (those that lease aircraft parking spaces at an airport) and aircraft operations.
e. Parking. A parking garage complex provides 12,000 spaces connected to the terminal buildings. Additional spaces are provided in grade level parking lots (including Tower lot that is used for seasonal parking). Free shuttle bus services connect these lots to the terminals. Valet parking service also is available.
f. Circulation. The Terminal Complex encompasses separated one-way ramps leading to and from US1 and ramps from I-595. Entrance and exit provisions include two-lane routes designed to accommodate both northbound and southbound traffic. The inbound and outbound ramps are four lanes wide and are connected to a three-lane roadway serving the entire terminal area. This terminal access road leads to individual terminal curb-fronts and public parking facilities. In addition, Perimeter Road, a two-lane private road, circles the airport to provide traffic circulation for airport tenants outside of the terminal areas.
g. Air Cargo. Existing facilities for air cargo activities cover 33.5 acres including buildings for air freight operations and warehousing. The two existing air cargo buildings, which total 27,750 square feet, are being replaced with a new 35,000 square foot structure. h. Airport Support. The operation of the airport is dependent on a number of services that can be classified as airport/airline support services; these include: navigation facilities, airfield maintenance areas, fuel farm, flight kitchens, employee parking rental car services, airfield rescue and fire fighting station, hangars and maintenance facilities. At FLL, some 94.5 acres are devoted to airport/airline support uses.
2. Fort Lauderdale Executive is a general aviation facility and has been designated by the FAA as a reliever airport to provide alternate landing areas for aircraft to reduce congestion at FLL. Fort Lauderdale Executive Airport (FXE) is owned and operated by the City of Fort Lauderdale. Table 17 displays various characteristics for Fort Lauderdale’s general aviation airports.

City of Fort Lauderdale Comprehensive Plan (Ordinance C-08-18) Volume II – Transportation Element Page 8-44
Table 17 General Aviation Airports in Fort Lauderdale
2005
Airport Airport Service Level
Airport Role Total based aircrafts 2005
Operations in 1000
Runways
FXE
Reliever to FLL
Transport
838
231
2
FLL1 Commercial Service
Passenger Transport
129
134
3
Note: 1General Aviation only Sources: Operations & based aircraft: Broward County Aviation Department records, FXE airport management records, and FAA.
3. Other General Aviation facilities. Table 18 displays Fort Lauderdale’s other general aviation facilities, which including heliports and helistops.
Table 18 General Aviation Facilities (not located at airports)
Type
Owner City of Fort Lauderdale City Hall Thunderbird Flea Market Road Rock Inc.
Heliports
City of Fort Lauderdale Parking Garage Broward General Medical Center Broward Sheriff’s Office
Helistops
Las Olas Center
Source: Florida Department of Transportation records, 2006
b. Safety. A runway protection zone (RPZ, formerly called clear zone) is an area located at the end of a runway to enhance the protection of adjacent land uses. Map 12 shows FLL’s runway protection zones. Map 13 shows Fort Lauderdale Executive Airport’s runway protection zones. Broward County has acquired the majority of the land within the six RPZs at FLL, as well as land in the approach and transition zones for Runway 27L. Much of this land was previously in private ownership and

City of Fort Lauderdale Comprehensive Plan (Ordinance C-08-18) Volume II – Transportation Element Page 8-45
had been developed for residential and commercial uses that were not compatible with airport operations. Broward County Aviation Department conducts regular surveys for obstructions that affect the airspace in the approach surfaces at FLL, as defined by Federal Aviation Regulations (FAR) Part 77. The Department is active in trimming and removing potential vegetation obstructions. Fixed objects, such as buildings, light poles, and cellular towers are marked with obstruction lights as required by the FAA.
8. Railway Network The railway network facilities consist of railway lines, signals, and terminals. Railway network services are provided for freight and passenger movement. These facilities and services are discussed below.
a. Facilities. Map 14 illustrates that Fort Lauderdale has two north-south railway corridors that extend into Miami-Dade and Palm Beach counties. The Florida East Coast (FEC) Railroad Company railway, which was constructed by Henry M. Flagler, began operations in Broward County in 1896. Currently, the FEC is used to transport freight, but not passengers. Throughout Fort Lauderdale, the FEC railway corridor generally runs parallel to and east of Dixie Highway. The railway right-of-way corridor is approximately 100 feet wide throughout its length and is single-tracked. A single-track spur line serves Port Everglades and runs from the FEC north of Fort Lauderdale-Hollywood International Airport to the Port.
The signal system and main dispatching center is located in Jacksonville. All 349 miles of main line is under centralized traffic control. On the main are 25 passing sidings, 16 hotbox detectors and five remote-control drawbridges, which have sirens and scoreboard-like countdown displays to warn pleasure boaters when a bridge will close. An example of a bridge with such a device is the bridge over the New River, just west of Andrews Avenue. The Fort Lauderdale yard originates or terminates or both, four scheduled trains on an average day.
1. The FEC Railroad Company operates a trailer-on-flat-car and container-on-flat-car rail facility, which is located at SW 33rd Street, west of Andrews Avenue.

City of Fort Lauderdale Comprehensive Plan (Ordinance C-08-18) Volume II – Transportation Element Page 8-46
Fort Lauderdale /Hollywood
International Airport
PortEverglades
I595
S US1
SR84
S US 1
GRIFFIN RD
SR 84
N O
CE
AN D
R
SE 6TH A VES I95 N
B
STIRLING RD
W SR84
W SR 84
S I9
5 SB
S FED H
WY
SE 17TH ST
ELLER DR
RAVE
NSW
OO
D R
D
SW 42ND ST
SW 9TH
AVE S W 4TH
A VE
I95 RA
MP
SW 3
0TH
AV
E
W NEW RIVER
NW 1ST STN
US1
RIVERLAND RD
SE 15TH ST
SW 17TH ST
E DANIA BEACH BLVD
I 595 RAMP
SW 53RD CT
NW 10TH ST
SW 36TH ST
SE 28TH ST
SW 16TH STSW 15TH ST
SW 30TH ST
OA
KRID
GE A
VE
SW 40TH ST
S OC
EAN
DR
SE 19TH ST
S A1A
SW 18TH ST
N S
UR
F R
D
SW 44TH ST
SW 32ND CT
FEDERAL HWY RAMP
SW 51ST ST
N B
EAC
H R
D
SE 24TH ST
SW 1
8TH
AV
E
SW 14TH ST
SW 38T H
TE R
CO
CO
NU
T DR
LEWIS LN
HIG
HB
OR
NE
LN
SW 58TH ST
I595
¯DATA SOURCE: BROWARD COUNTY METROPOLITAN PLANNING ORGANIZATION (MPO) 2003MAP SOURCE: CITY OF FORT LAUDERDALE PLANNING & ZONING DEPARTMENT- JULY, 2006
FORT LAUDERDALE / HOLLYWOOD INT. AIRPORTRUNWAY PROTECTION ZONES
0 0.5 10.25Miles
Legend
WATER
FTL Airport
Runways
CORPORATE LIMIT
Runway ProtectionZones
MAP 12
NW 62ND ST
NW
31ST A V
E
W COMMERCIAL BLVD PO
WE
RLIN
E R
D
W PROSPECT RD
¯DATA SOURCE: MAP SOURCE: CITY OF FORT LAUDERDALE PLANNING & ZONING DEPARTMENT- JULY, 2006
FORT LAUDERDALE EXECUTIVE AIRPORTRUNWAY PROTECTION ZONES
0 0.25 0.50.125Miles
Legend
Airport BoundaryRunways
Corporate Limits
Runway ProtectionZones
MAP 13

City of Fort Lauderdale Comprehensive Plan (Ordinance C-08-18) Volume II – Transportation Element Page 8-47
W SUNRISE BLVD
W BROWARD BLVD
DAVIE BLVD
SR 84
N S
R 7
OAKLAND PARK BLVD
COMMERCIAL BLVD
NW 62ND ST
S FE
DE
RAL
HW
Y
N F
EDER
AL H
WY
E LAS OLAS BLVD
N A
TLA
NTI
C B
LVD
NW
31S
T AV
E
INTE
RSTA
TE 9
5
NW 19 ST
ATLA
NTI
C O
CE
AN
FLORID
A TURNPIK
E
AND
RE
WS
AVE
N D
IXIE
HW
Y
NE 13 ST
I-595
SE 17 ST
NW
27
AVE
SISTRUNK BLVD
MCNAB RD
Fort Lauderdale /Hollywood
International Airport
PortEverglades
CSX TransportationRailway
Florida EastCoast Railway
¯DATA SOURCE: CITY OF FORT LAUDERDALE PLANNING & ZONING DEPARTMENT - JULY, 2006MAP SOURCE: CITY OF FORT LAUDERDALE PLANNING & ZONING DEPARTMENT- JULY, 2006
RAILWAY SYSTEM
0 1 20.5Miles
MAP 14
LegendCorporate Limits
Water
Railway

City of Fort Lauderdale Comprehensive Plan (Ordinance C-08-18) Volume II – Transportation Element Page 8-48
Port Everglades is served by an internal railroad network that is owned by the Port and maintained by the FEC Railroad Company. Rail service accesses Port Everglades along Eller Drive and then branches to several spurs just west of SE 14th Street. Cargo rail service is provided to Slips 1, 2 and 3, along Eller Drive, and along Spangler Boulevard.
2. The State of Florida, through the FDOT, owns the South Florida Rail Corridor (SFRC), an 81- mile former CSX Transportation railway between Mangonia Park and Hialeah. Located parallel to and west of I-95, the SFRC right-of-way is approximately 100 feet wide throughout the City and is predominately double tracked. The SFRC is used to transport passengers and freight. Table 19 shows the SFRC passenger terminals located in Fort Lauderdale with regional service operated by Tri-Rail.
Table 19
Fort Lauderdale SFRC Passenger Terminal and Parking Data
Rail Station
Passenger Rail
Provider
Parking Spaces
Cypress Creek
Tri-Rail
556
Broward Boulevard
Amtrak & Tri-Rail
394
Source: South Florida Regional Transportation Authority, 2007.
b. Services. The FEC Railroad Company, as its name implies, operates along Florida’s east coast, with its main line running from Jacksonville to Miami. The carrier’s 442-mile route is completely within the State and is the second largest railroad in Florida. In addition to the main track, the FEC Railroad Company operates a branch from Fort Pierce to Palm Beach County’s Lake Harbor.
The FEC railway presently carries only freight. The FEC railway connects to the SFRC railway in Pompano Beach. Between 20 and 25 daily trains are operated on weekdays, mostly at night. On weekends, approximately 10 daylight trains are operated. The SFRC is served by three entities: CSX, Amtrak, and Tri-Rail. As many as 12 freight and 60 passenger trains (commuter and intercity) operate within the SFRC daily.

City of Fort Lauderdale Comprehensive Plan (Ordinance C-08-18) Volume II – Transportation Element Page 8-49
CSX as Florida’s largest railroad, it operates 1,752 route miles in Florida, covering virtually the entire State. In addition to the 1,621 miles it owns, it also operates over the SFRC and over the Georgia and Florida Railroad. Amtrak, which began operations in 1971, continues to provide conventional intercity rail passenger service. Presently, four distinct services are provided. Three conventional Amtrak trains are operated daily in either direction between Florida and the Northeast (Silver Meteor, Silver Star, and Silver Palm). Additionally, a fourth conventional passenger train (Sunset Limited) operates on a tri-weekly basis between Sanford, Florida and Los Angeles, California. SFRTA operates a 72 mile commuter rail system (Tri-Rail), as well as the feeder shuttle bus system. The SFRTA covers three Counties, Palm Beach, Broward and Miami-Dade, along the southeastern coast of Florida. The system consists of 18 stations between Mangonia Park and Miami International airport. The rail right-of-way lies immediately adjacent to I-95, from Mangonia Park to the Golden Glades Interchange in Miami-Dade, at which point the rail line curves to the southwest to a point that is four miles of I-95. SFRTA’s service is provided by a fleet of 12 diesel-electric locomotives, 11 bi-level cab cars and 15 bi-level coaches. The standard train operates in a push-pull configuration, with a diesel locomotive on the south end, two coach cars and a cab car. Locomotive controls are located in the cab car allowing the locomotive to push the train in the northward direction. The average running speed is 39 miles per hour and station spacing ranges from 1.2 to 7.6 miles. The trains operate on a weekday clock-face schedule, meaning that trains arrive at a station at the same time each hour with some 20 and 30-minute service at peak hours. With the completion of the New River Bridge, Tri-Rail will begin operating 50 trains on weekdays, 16 trains on Saturdays and 14 trains on Sundays and holidays. Additional trains are occasionally provided for special events. Operation of the trains and maintenance of the trains are accomplished by the SFRTA through a contracted services arrangement. Under the Operating and Management Agreement – Phase A between CSXT and FDOT, CSX provides maintenance of the track, bridges, buildings, signal system and dispatches all trains using the line, including CSX’s own freight trains and long distance Amtrak trains. Contracts with private vendors cover train station maintenance and security services. Ticket sales are provided by SFRTA employees as ticket agents and ticket vending machines maintained by SFRTA. SFRTA provides marketing, advertising and customer information services.
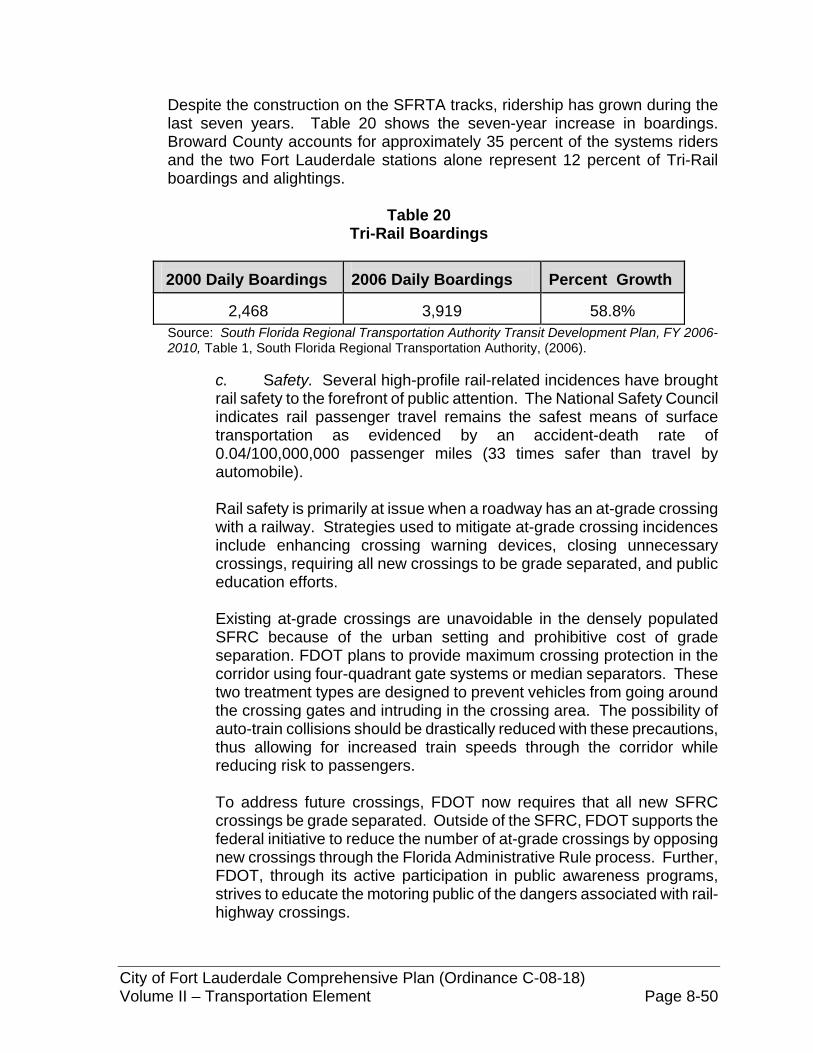
City of Fort Lauderdale Comprehensive Plan (Ordinance C-08-18) Volume II – Transportation Element Page 8-50
Despite the construction on the SFRTA tracks, ridership has grown during the last seven years. Table 20 shows the seven-year increase in boardings. Broward County accounts for approximately 35 percent of the systems riders and the two Fort Lauderdale stations alone represent 12 percent of Tri-Rail boardings and alightings.
Table 20
Tri-Rail Boardings
2000 Daily Boardings
2006 Daily Boardings
Percent Growth
2,468
3,919
58.8%
Source: South Florida Regional Transportation Authority Transit Development Plan, FY 2006-2010, Table 1, South Florida Regional Transportation Authority, (2006).
c. Safety. Several high-profile rail-related incidences have brought rail safety to the forefront of public attention. The National Safety Council indicates rail passenger travel remains the safest means of surface transportation as evidenced by an accident-death rate of 0.04/100,000,000 passenger miles (33 times safer than travel by automobile). Rail safety is primarily at issue when a roadway has an at-grade crossing with a railway. Strategies used to mitigate at-grade crossing incidences include enhancing crossing warning devices, closing unnecessary crossings, requiring all new crossings to be grade separated, and public education efforts. Existing at-grade crossings are unavoidable in the densely populated SFRC because of the urban setting and prohibitive cost of grade separation. FDOT plans to provide maximum crossing protection in the corridor using four-quadrant gate systems or median separators. These two treatment types are designed to prevent vehicles from going around the crossing gates and intruding in the crossing area. The possibility of auto-train collisions should be drastically reduced with these precautions, thus allowing for increased train speeds through the corridor while reducing risk to passengers.
To address future crossings, FDOT now requires that all new SFRC crossings be grade separated. Outside of the SFRC, FDOT supports the federal initiative to reduce the number of at-grade crossings by opposing new crossings through the Florida Administrative Rule process. Further, FDOT, through its active participation in public awareness programs, strives to educate the motoring public of the dangers associated with rail-highway crossings.

City of Fort Lauderdale Comprehensive Plan (Ordinance C-08-18) Volume II – Transportation Element Page 8-51
FDOT also has initiated a Rail-Highway Crossing Corridor Safety Improvement Program to enhance crossing warning devices and to close unnecessary crossings on key rail corridors. Statewide, 230 crossings were targeted for improved warning devices and 68 crossings were identified for closure.
9. Greenways The term greenway was coined by taking the "green" from green belt and adding it to the "way" from parkway. Often applied to railroad rights-of-way which fall into disuse and are converted to public use, greenways are vegetated, linear routes and used for multiple purposes. These are often converted into a long-distance paths or trails for cyclists, walkers, and riders. Fort Lauderdale has one existing greenway located along the Dixie Highway Corridor shown on Map 15. Trailheads in the City include: Floranada Park, Sistrunk Park, Himmarshee Village, Florence Hardy Park, Croissant Park and Snyder Park.
10. Intermodal Terminals and Access to Intermodal Facilities An intermodal facility is a facility designed to relate to two or more modes of transportation using single or closely related transportation facility and service. FDOT’s Corridor Management Procedure defines it as the provision of connections between different transportation modes, such as adequate highways to ports or bus feeder services to rail transit, individual modes working together to provide the user with the best choices of services.
a. Facilities. Intermodal facilities shown on Map 16 include intermodal facilities of state significance, terminals, connections, high-occupancy vehicle (HOV) lanes, and park-and-ride facilities.
1. Intermodal Facilities of State Significance. FDOT has established an Intermodal System of Statewide Significance. Intermodal Facilities of Statewide Significance are eligible for the annual Florida Intermodal Program Development Program - Discretionary Funding in accordance with Section 341.053, Florida Statutes. Table 21 identifies the intermodal facilities of statewide significance in Fort Lauderdale by type and primary mode.

W SUNRISE BLVD
W BROWARD BLVD
DAVIE BLVD
SR 84
N S
R 7
OAKLAND PARK BLVD
COMMERCIAL BLVD
NW 62ND ST
S F
ED
ER
AL
HW
Y
N F
ED
ER
AL
HW
YE LAS OLAS BLVD
N A
TLA
NT
IC B
LVD
NW
31S
T A
VE
INT
ER
STA
TE 9
5
NW 19 ST
AT
LAN
TIC
OC
EA
N
FLO
RIDA T
URNPIKE
AN
DR
EW
S A
VE
N D
IXIE
HW
Y
NE 13 ST
I-595
SE 17 ST
NW
27
AV
E
SISTRUNK BLVD
MCNAB RD
Fort Lauderdale /Hollywood
International Airport
PortEverglades
2
3
2
2
11
11
Vista Park
Snyder Park
Holiday Park
Sistrunk Park
Stranahan Park
Poinciana Park
Mills Pond Park
Bubier/DDA Park
South Beach Park
Birch State Park
HimmarsheeVillage
Florence Hardy Park
Croissant/DavisPark Shaw Bridge
Observation Area
Bonnett House
2
3
11
9
10
7
5
6
8
41
12
10
11
11
10
1
11
DATA SOURCE: BROWARD COUNTY TRANSPORTATION PLANNING DEPT. - OCT, 2004 MAP SOURCE: CITY OF FORT LAUDERDALE PLANNING & ZONING DEPARTMENT- JULY, 2006
BROWARD COUNTY GREENWAYS SYSTEM
0 1 20.5Miles
MAP 15
LegendCity Limits
Water
Schools
Proposed Trailheads
Cypress Creek Greenway
Dixie Hwy Greenway
Barrier Island Greenway
Priority Greenways
Turnpike Greenway
C-12 Canal Trail
C-13 Canal Trail
New River / SR-84 Greenway
Griffin / Orange Dr. Greenway
Intracoastal Blueway
Middle River Trail Blueway
New River Loop Blueway
Snook Creek Blueway
Future Greenways
Future Blueways9
10
11
12
4
5
6
7
8
1
2
3
Proposed Greenway System
Parks

W SUNRISE BLVD
W BROWARD BLVD
DAVIE BLVD
SR 84
N S
R 7
OAKLAND PARK BLVD
COMMERCIAL BLVD
NW 62ND ST
S F
ED
ER
AL
HW
Y
N F
ED
ER
AL
HW
YE LAS OLAS BLVD
N A
TLA
NT
IC B
LVD
NW
31S
T A
VE
INT
ER
STA
TE 9
5NW 19 ST
AT
LAN
TIC
OC
EA
N
FLO
RIDA T
URNPIKE
AN
DR
EW
S A
VE
N D
IXIE
HW
Y
NE 13 ST
I-595
SE 17 ST
NW
27
AV
E
SISTRUNK BLVD
MCNAB RD
Fort Lauderdale /Hollywood
International Airport
Fort Lauderdale /Hollywood
International Airport
PortEverglades
PortEverglades
CSX TransportationRailway
CSX TransportationRailway
Florida EastCoast RailwayFlorida East
Coast Railway
BCT CentralTerminal
BCT CentralTerminal
GreyhoundBus TerminalGreyhound
Bus Terminal
CSX BulkIntermodalDistribution
Services
CSX BulkIntermodalDistribution
Services
Parsec'sIntermodal
Yard
Parsec'sIntermodal
Yard
FTL Tri-RailStation &Amtrak
FTL Tri-RailStation &Amtrak
Cypress CreekTri-Rail StationCypress CreekTri-Rail Station
DATA SOURCE: CITY OF FORT LAUDERDALE PLANNING & ZONING DEPARTMENT - JULY, 2006MAP SOURCE: CITY OF FORT LAUDERDALE PLANNING & ZONING DEPARTMENT- JULY, 2006
INTERMODAL FACILITIES
0 1 20.5Miles
MAP 16
Legend
Corporate Limits
Water
Intermodal FacilitiesType Of Facility
Primary Mode
Freight
Freight & Passenger
Passenger
Airport
Seaport
Bus
Rail

City of Fort Lauderdale Comprehensive Plan (Ordinance C-08-18) Volume II – Transportation Element Page 8-54
Table 21 Intermodal Facilities of Statewide Significance
Intermodal Facility
Type
Primary Mode
Fort Lauderdale Hollywood Int. Airport
Freight and Passenger
Airport
Port Everglades
Freight and Passenger
Seaport
CSX Transportation
Freight
Rail
Florida East Coast Railway
Freight
Rail
CSX Bulk Intermodal Distribution Services
Freight
Rail
Parsecs intermodal yard
Freight
Rail
Tri-Rail Service
Passenger
Rail
Amtrak
Passenger
Rail
BCT
Passenger
Bus
Greyhound
Passenger
Bus
South Florida Commuter Services
Passenger
Car
Total: 11 Intermodal Facilities
5 Freight 6 Passenger
Source: Broward County Planning Services Division, 2006.
2. Terminals. Freight intermodal terminals include trailer on flat car and container on flat car facilities, bulk facilities, and team track facilities. Passenger intermodal facilities include the Tri-Rail and Amtrak terminals.
a. Railway-highway intermodal terminals were once more common when the focus was on the movement of trailer on flat car and only a ramp was needed for loading and unloading. A combination of greater use of containers, requiring more investment in loading equipment, and overall operating efficiency, has led to the creation of hub centers consolidating many former facilities. Further, the advent of the double-stack car and its cost savings has spurred the use of containers and the number of containers

City of Fort Lauderdale Comprehensive Plan (Ordinance C-08-18) Volume II – Transportation Element Page 8-55
in intermodal movements surpassed the number of trailers for the first time in 1992.
The FEC Railroad Company operates an intermodal rail facility, which is located approximately 1.5 miles west of the Port Jurisdictional Area. This intermodal rail terminal facilitates the transfer of cargo containers and trailers between the rail network and the road (i.e., trailers hitched to truck) and waterway networks (i.e., container cargo and trailers are transferred by tractors between the FEC and Port Everglades cargo ships). This facility is a component of the SIS. Another form of intermodal terminal used by the railroads is the bulk transfer facility. These facilities permit the transfer of bulk materials between railcars and trucks for those businesses that do not have direct rail service. There are 15 bulk transfer facilities located throughout Florida. Fort Lauderdale’s bulk transfer facility is located in the industrial area just south of the Broward Boulevard Tri-Rail station. Team track facilities are public tracks with varying amounts of space to transfer freight between rail cars and trucks. The name is a holdover from the days when wagons pulled by teams of horses were used instead of trucks. No data is available on the extent of these facilities in Fort Lauderdale.
b. Intermodal passenger terminals are located at Tri-Rail stations. The Broward Boulevard passenger terminal not only provides access between Tri-Rail and Amtrak, but provides intermodal access to public transit through BCT Route 22. Route 22 primarily travels along Broward Boulevard and connects the Broward Central Bus Terminal in downtown Fort Lauderdale to Sawgrass Mills in the City of Sunrise.
The Cypress Creek and Fort Lauderdale Airport passenger terminals are served both by feeder bus service and fixed route bus service. The Cypress Creek passenger terminal is serviced by BCT fixed Routes 60 and 62. Route 60 travels along Andrews Avenue and, north of Race Track Road, along Dixie Highway and connects the Broward Central Bus Terminal in downtown Fort Lauderdale to Ward City (2nd Street area) in the City of Pompano Beach. Route 62 travels primarily along Cypress Creek Road (NW 62nd Street) and connects Galt Ocean Mile to the Coral Square

City of Fort Lauderdale Comprehensive Plan (Ordinance C-08-18) Volume II – Transportation Element Page 8-56
Mall on Atlantic Boulevard and University Drive. The Fort Lauderdale Airport passenger terminal is served by Route 1, which travels along Federal Highway (US 1) and connects the Aventura Mall in Miami-Dade County to the Broward Central Bus Terminal.
3. Connections. Connections refer to the access or link between transportation nodes, such as between an airport and a seaport. It is the efficiency and effectiveness of this linkage that determines the quality of intermodal transportation. The ease of interconnections between modes can have a significant impact upon the economy of a company, industry, state, region and nation. The benefits of intermodal connections include lowered transportation costs, increased economic productivity and efficiency, reduced congestion, increased return from private and public infrastructure investments, improved mobility, and reduced energy consumption. Intermodal connections can include facilities, such as roadways, railways and waterways, or services, such as bus and taxi services. These facilities and services can be further classified as freight or passenger. This section addresses both connection facilities and connection services.
a. Connection facilities. This subsection focuses on the connections to and from the County’s major transportation hubs, that is, Port Everglades and Fort Lauderdale-Hollywood International Airport. The connections addressed include the roadway, railway, and waterway network.
1. Port Everglades has four connections to the roadway network. The primary connection is I-595, which terminates at the PJA and connects with Eller Drive, a local 2-lane internal roadway. The intersections of Spangler Drive at US 1 and Eisenhower Boulevard at the SE 17th Street Causeway provide additional connections to the roadway network. The final connection is via an exit along the northbound lane of US1, just south of the US1/I-595 interchange. These roadways provide Port Everglades with intermodal connections for both freight and passengers. 2. Port Everglades is connected to the railway network through 1.5 miles of FEC Railroad Company spur line that runs from the Port and along the north side of the Fort Lauderdale-Hollywood International Airport to Parsecs intermodal rail facility. This spur line, however, provides connection only for freight.

City of Fort Lauderdale Comprehensive Plan (Ordinance C-08-18) Volume II – Transportation Element Page 8-57
3. Port Everglades connection to the waterway is through the ocean entrance channel. The distance from the ocean entrance of the channel to the main turning basin is approximately 1.2 nautical miles, which allows ships to dock within a one-hour travel time from the ocean. 4. Port Everglades freight terminals are available at Northport, Midport, and Southport. The Northport freight terminal serves break bulk cargo. Midport contains the Ports liquid bulk (petroleum), dry bulk (cement), break bulk, and container terminals. Southport is primarily a container terminal. Passenger terminals are available at Northport and Midport. 5. The Fort Lauderdale-Hollywood International Airport has four connections to the roadway network. Those connections are discussed under airports and related facilities and services.
6. The Fort Lauderdale-Hollywood International Airport has no connection facilities to the waterways or Port Everglades. A Major Investment Study (MIS) funded by FDOT is currently underway to develop alternatives for an intermodal passenger connection between the Fort Lauderdale-Hollywood International Airport and Port Everglades.
b. Connection services. Port Everglades’ connection service includes tractors that transfer cargo containers and trailers from the Port to Parsecs intermodal freight facility. The Fort Lauderdale-Hollywood International Airport is connected through a shuttle service to Tri-Rail’s Fort Lauderdale Airport Station located near I-95 and Griffin Road, and to Port Everglades through private buses provided by cruise lines to transport cruise passengers between the Airport and Port Everglades.
3. High occupancy vehicle (HOV) facilities. HOV facilities are designated for exclusive use by specified HOV vehicles (minimum two passengers per vehicle) and all other vehicles are expressly prohibited. The purposes of HOV lanes are to make the most of person-moving capabilities along a corridor and to provide sufficient capacity to meet future transportation demands. One way this can be accomplished is by increasing the occupancy of the vehicles traveling on the corridor. Preferential treatment for high occupancy vehicles (HOVs) is intended to encourage the driving public to change from low to high occupancy vehicles. These high

City of Fort Lauderdale Comprehensive Plan (Ordinance C-08-18) Volume II – Transportation Element Page 8-58
occupancy vehicles include buses, vanpools, carpools, and special vehicles for the handicapped. Multimodal interchange facilities, such as park-and-ride or ride-sharing lots, will also facilitate this mode shift.
Fort Lauderdale’s HOV lanes are concurrent flow HOV lanes, which are added for exclusive use next to the median divider of I-95. Presently, the restricted hours for the HOV lanes on I-95 are from 7:00 a.m. to 9:00 a.m. and from 4:00 p.m. to 6:00 p.m., Monday through Friday. In conjunction with the HOV lanes, entry ramps were constructed at I-95 and Broward Boulevard. These ramps eliminate the several lane-change maneuvers required when using the HOV lanes from the typical right-side ramp configuration.
4. Park-and-Ride Lots. As its name implies, a park-and-ride facility provides parking spaces for motorists in the middle of their journey. The motorists ride public transportation or carpool to work from the park-and-ride facility. Park-and-ride facilities have been built to encourage carpooling and the use of express bus service.
b. Safety. A safety issue has been raised with the use of HOV facilities. Many single-occupancy drivers are illegally using the HOV lanes during the rush or peak hours. When a law enforcement officer is spotted, the illegal HOV user begins to merge into a non-HOV lane, and on occasion, causes an accident. No data is available, however, on the extent of this problem. Intermodal safety may be addressed through encouraging crime prevention through environmental design (CPTED) techniques and station improvements, and convenience may be addressed through the proposed airport-seaport connector.
B. Transportation Level of Service (LOS) Standard Florida law requires transportation level of service standards to be adopted for roads and public transit facilities. Broward County has adopted Transportation Concurrency Districts and corresponding level of service standards. Fort Lauderdale applies transportation LOS standards through its Concurrency Management System.
1. Roadway LOS standards. Roadway level of service standards have long been used in systems planning and traffic operations. The roadway level of service (LOS) standard is a qualitative assessment of the road user’s perception of the quality of flow of traffic. The LOS standards are represented by letters A through F, with A representing the most favorable conditions and F representing the least favorable. The LOS is measured by dividing the number of vehicle trips (i.e., volume) on the facility by the capacity of that facility. The six levels of service as described by the Transportation Research Board’s Highway Capacity Manual. They are:
City of Fort Lauderdale Comprehensive Plan (Ordinance C-08-18) Volume II – Transportation Element Page 8-59
• Level of Service A – This represents a condition of free flow. Individual users are virtually unaffected by the presence of others in the traffic stream. Traffic volumes are low and speeds are high, and drivers have complete freedom in selecting their speeds and may change lanes at will. The motorists experience a high level of driving comfort. Stopped delays at signalized intersections are minimal.
• Level of Service B – With this level of service, operating speeds are
beginning to be restricted somewhat by traffic conditions, although drivers still have reasonable freedom in choosing their speeds and travel lanes. Flow is stable and average operating speeds are only slightly lower. The general level of motorist comfort is still high.
• Level of Service C – Traffic flow is still stable at this level of service, but
most drivers are restricted in their choice of speeds and maneuverability. Traffic conditions are still tolerable for most drivers and operating speeds are not unsatisfactory. Traffic flows are such that small increases in flow will result in a substantial deterioration in service. Motorists will experience an increase in tension due to the increased attention needed for safe operation.
• Level of Service D – This level of service represents high density.
Although speeds may still be maintained, delays may begin to occur frequently due to high traffic volumes. Drivers have little freedom to choose their own speeds or lanes of operation, and their comfort and convenience are low. Small increases in traffic flow will generally cause operational problems at this level.
• Level of Service E – This level of service describes a roadway that is
operating near or at capacity. Speeds are low and there are virtually no gaps in the traffic stream. There is very little driver independence with regard to speed choice and lane choice. Small increases in volume or minor disturbances within the traffic stream will cause a breakdown in traffic flow.
• Level of Service F – This describes a forced flow situation. Vehicle
density is beyond the optimum for maximum volume; therefore, traffic volume has dropped below that of level of service E. Frequent and prolonged stoppages may occur, and average travel speeds are very low, as is driver comfort. Vehicles may progress at reasonable speeds for several hundred feet or more, then be required to stop in a cyclic fashion. It is to the point at which arrival flow exceeds discharge flow that causes a queue to form.
The boundaries between levels of service are quantitatively described by volume of traffic. The actual numerical value corresponding to the upper boundary of

City of Fort Lauderdale Comprehensive Plan (Ordinance C-08-18) Volume II – Transportation Element Page 8-60
each level of service (service volume) depends on the roadway’s functional classification, engineering characteristics, traffic characteristics and control characteristics. Typically, roadways are said to reach capacity when traffic volume is equivalent to the service volume at the boundary between LOS E and LOS F. Capacity does not mean the highest number of vehicles that can physically occupy a road (jam density), but the greatest volume at which traffic is still flowing in a reasonably predictable and stable manner. Roadway level of service standards define the maximum traffic volume a particular roadway should carry. Level of service standards are established, in part, to ensure that adequate facility capacity will be provided for future development and for purposes of issuing development orders and permits. Level of service standards are set for each individual facility or facility type and not on a system-wide basis. LOS standards for roadways on the Strategic Intermodal System (SIS) are set by FDOT. The Strategic Intermodal System (SIS) is a statewide system of modal facilities of the greatest economic importance to Florida. Fort Lauderdale has two SIS facilities, I-95 and I-595. Additionally, the SIS has connector facilities that also are prioritized and receive state funding for improvements. The City of Fort Lauderdale measures level of service using the FDOT Level of Service Manual’s Table 4-4, Generalized Peak Two-Way Volumes for Florida’s Urbanized Areas.
a. Strategic Intermodal System (SIS). Rule 9J-5.0055(2)(c), FAC, requires local governments to adopt the LOS standards established by the Florida Department of Transportation by rule for facilities on the Strategic Intermodal System.The City also adopts the FDOT Level of Service Standard for SIS Connectors as shown in the Florida Department of Transportation, Level of Service Manual.
Table 22
Strategic Intermodal System (SIS) Level of Service Standards
SIS Roadway Roadway Segment LOS Interstate 95 Miami-Dade County line to Palm Beach County
line E
Intrastate 595 Interstate 75 to US 1 D
SIS Connectors
Roadway Segment
LOS Broward Boulevard I-95 to NE 3rd Ave to Greyhound Bus Terminal D SR 84 I-95 to Port Everglades entrance D SW 4th Avenue SR 84 to Perimeter Road D Andrews Avenue SR 84 to Airport entrance D
Source: FDOT, District 4, 2005.

City of Fort Lauderdale Comprehensive Plan (Ordinance C-08-18) Volume II – Transportation Element Page 8-61
b. County and Non-SIS State Roads. The LOS for County and Non-SIS State roads are described in Table 23.
c. Local Roads. Local roads will be maintained at LOS D.
2. Public transit LOS standard. Unlike the roadway LOS standard, which measures vehicles, the public transit LOS standard measures accessibility to public transit. Accessibility is addressed through the concept of functional area coverage, which is defined as a 2 mile corridor surrounding a bus route, 3 mile in each direction. Consistent with state law, which requires use of the peak-hour, the public transit LOS standard is 70 percent functional area coverage for residences and employment. The existing Mass Transit Level of Coverage exceeding 70 percent is shown on Map 17.
3. Transit-Oriented Concurrency Districts. The MPO, as reflected in the adopted 2030 Long Range Transportation Plan, has determined that this combination of continued growth and constrained facilities must be addressed by a major shift of priorities away from roadway improvements, and towards transit and non-motorized forms of travel. In concert with this policy direction of the MPO, the Broward County Commission has decided to redirect the concurrency mitigation efforts of the development community from roadway improvements to transit enhancements. All Transit Oriented Concurrency Districts are substantially built-out, both in terms of land area and of major roadway laneage. The shift from a Roadway LOS Standard to Transit LOS Standards in these Districts will complement the future development patterns of these Districts, which will necessarily be predominantly infill and redevelopment. This change will support efforts to encourage infill and redevelopment in several ways: Transit Oriented Development will be encouraged, since it will be creditable; land that would have been consumed for right-of-way purposes will be available for infill and redevelopment; and, transit enhancements will encourage areas of denser redevelopment.

W SUNRISE BLVD
W BROWARD BLVD
DAVIE BLVD
SR 84
N S
R 7
OAKLAND PARK BLVD
COMMERCIAL BLVD
NW 62ND ST
S F
ED
ER
AL
HW
Y
N F
ED
ER
AL
HW
YE LAS OLAS BLVD
N A
TLA
NT
IC B
LVD
NW
31S
T A
VE
INT
ER
STA
TE 9
5NW 19 ST
AT
LAN
TIC
OC
EA
N
FLO
RIDA T
URNPIKE
AN
DR
EW
S A
VE
N D
IXIE
HW
Y
NE 13 ST
I-595
SE 17 ST
NW
27
AV
E
SISTRUNK BLVD
MCNAB RD
Fort Lauderdale /Hollywood
International Airport
PortEverglades
DATA SOURCE: BROWARD COUNTY MASS TRANSIT DIVISION NOV, 2006MAP SOURCE: CITY OF FORT LAUDERDALE PLANNING & ZONING DEPARTMENT- JULY, 2006
EXISTING MASS TRANSITLEVEL OF COVERAGE
0 1 20.5Miles
Legend
CITY LIMITS
WATER
1/4 Mile Buffer AroundBCT Transit Stops
1/2 Mile Buffer AroundTri-Rail Stations
BCT Transit Stops
Tri-Rail Stations
MAP 17

City of Fort Lauderdale Comprehensive Plan (Ordinance C-08-18)Volume II – Transportation Element Page 8-63
A Transit-Oriented Concurrency District is a compact geographic area with an existing network of roads where multiple, viable alternative travel paths or modes are available for common trips. The boundaries for each District shown on Map18 were established by Broward County using the following criteria:
a. Each District must be a compact geographic area with existing or proposed multiple, viable alternative travel paths or modes available for common trips;
b. Each District should have generally a common level of service (transit or roadway) within it;
c. Each District should be designed to support common goals relating to infill development and/or redevelopment within it;
d. Each Transit Oriented District should be designed so that it can have one set of transit service standards established for it;
e. Municipal boundaries should be followed when feasible, if other criteria are satisfied, unless a municipality requested otherwise.
The three districts located in Fort Lauderdale include:
1. Central District: The boundary to the north is McNab Road, east of the Turnpike, and Commercial Boulevard, west of the Turnpike. The eastern boundary is the Atlantic Ocean north of Sunrise Boulevard. However, I-95 forms the Eastern Boundary south of Sunrise Boulevard, due to the presence of the Eastern Core District. Similarly, the Conservation Area forms the western boundary, except for the area of the Sawgrass District. I-595 forms a physical and political boundary to the south for most of this District. Between Flamingo Road and Weston Road, the southern boundary is set at SW 14 Street. The Central District is distinguished by the predominance of east-west travel, with the Interstate 595 corridor being the most heavily used transportation corridor. The transit routes on the major east-west roadways within the District are characterized by high ridership and frequent service. The parallel routes on Broward, Sunrise and Oakland Park Boulevards all have 20-minute headways, and average over 35 passengers per hour. Data on existing transit service indicates that over 75 percent of the area within the District is served by transit. The priorities of the planners in this District were increased coverage (circulators and shuttles), improve the quality of bus stops, and decrease the travel time on buses. 2. Eastern Core District: This District is by far the portion of the County with the highest development densities and the highest level of transit service. It is impacted by extreme peaking characteristics, due to the high concentration of employment, and also by substantial seasonal traffic from tourism and recreational travel. The District includes

City of Fort Lauderdale Comprehensive Plan (Ordinance C-08-18) Volume II – Transportation Element Page 8-64
downtown Fort Lauderdale and Fort Lauderdale Beach, as well as the Broward County Convention Center. The boundaries of the Eastern Core District are Sunrise Boulevard to the north, the Atlantic Ocean to the east and I-95 to the west. The southern boundary marks the edge of Ft. Lauderdale/Hollywood International Airport and the jurisdictional area of Port Everglades. The District has a very high degree of transit coverage, with high frequency of service. Local service is provided by numerous programs run by the Fort Lauderdale DFLTMA. The consensus of local planners was that the transit priorities for this District should include additional community service, extended hours of service, better bus information, improved access to bus stops, and an emphasis on intermodal trips. In the longer term, the establishment of a Community Design Concurrency District, with an emphasis on urban design and pedestrian amenities, would be desirable for some or this entire District. 3. Port/Airport District: This District, comprised of Port Everglades and the Ft. Lauderdale /Hollywood International Airport, was separated out from adjacent areas due to: (1) the distinctive land uses inside the District; (2) the high degree of public property within the District; and (3) the likely unique nature of transportation measures to be implemented within the District. It was felt that properties outside of this District should not be assessed for transit improvements that would primarily benefit the Port and/or Airport. Transit-related strategies being studied in this District include: express and/or premium bus service; increased shuttle service from Tri-Rail; off-site parking with shuttle service for employees (already existing at the Airport); and direct service between the Port and Airport for cargo and/or passengers.
The City’s concurrency management system shall establish the following Transit Oriented Concurrency Districts level of service requirements. Within transit oriented concurrency districts, the transportation LOS standards, for the purpose of issuing development orders and permits, are to achieve and maintain the following by FY 2009: Central District - Achieve headways of 30 minutes or less on 78 percent of routes. Establish at least one neighborhood transit center. Establish at least two additional community bus routes. Port/Airport District - Establish at least one additional community bus route. Eastern Core District - Achieve headways of 30 minutes or less on 87

City of Fort Lauderdale Comprehensive Plan (Ordinance C-08-18) Volume II – Transportation Element Page 8-65
percent of routes. Achieve headways of 20 minutes or less on 44 percent of routes. Establish at least one neighborhood transit center. Establish at least two additional community bus routes. Overall - Increase number of bus stop shelters by 30 percent. [Note: Headway standards apply only to non-contract BCT routes]. Maintain the maximum service volumes on arterial roadways within each District, as displayed below:
Table 23*
Peak Hour Two Way Maximum Service Volumes County and Non-SIS State Roads
Eastern Core
District All Other Districts
Two-lane arterials 2485 2555 Four-lane arterials 5267 5442 Six-lane arterials 7910 8190 Eight-lane arterials 10342 10605
*The Maximum Service Volumes are calculated from Generalized Peak Hour Two-Way Volumes for Florida’s Urbanized Areas, published by the Florida Department of Transportation, as 75% above the volumes for Class IV State Two-Way Arterials, for Level of Service E, for the Eastern Core District; and as 75% above the volumes for Class II State Two-Way Arterials, for Level of Service D, for all other Districts.
The Level of Service Standards were established by Broward County in consultation with the City of Fort Lauderdale, transportation providers, the MPO, FDOT and other interested parties.
a. Relation of LOS Standards to Transit Capacity and Quality of Service Manual (TCQSM) Standards. Because the proposed concurrency Level of Service Standards are for Districts as a whole, and due to other requirements of the concurrency system, there is not a direct correlation between these Standards and those devised in the Transit Capacity and Quality of Service Manual (TCQSM). Below is a discussion of how each of the six TCQSM standards is addressed in this proposal.
1. Service Frequency: The proposed LOS Standards include three levels related to frequency. These are percent of routes with headway # 30 minutes, 20 minutes, and 15 minutes. These roughly correspond to Levels of Service D, C, and B of the TCQSM, respectively. However, LOS B is actually defined as headways of 10-14 minutes,

City of Fort Lauderdale Comprehensive Plan (Ordinance C-08-18) Volume II – Transportation Element Page 8-66
so the equivalence is not precise. 2. Hours of Service: Since the concurrency LOS Standards are required to be related to peak hour service, this service measure was not appropriate for use in the concurrency program. 3. Passenger Load: Although this criteria is used for setting priorities for headway improvements on routes, it is not directly reflected in any proposed LOS Standards. 4. Reliability: This service measure involves mostly systemic change, rather than transit stop or route characteristics. It is not addressed in the proposed LOS Standards. 5. Transit/Auto Travel Time: The placement of at least one Neighborhood Transit Center (NTC) in each District is intended to relate to this service measure. However, no method of quantifying the travel time benefits, to relate to the LOS Standards in the TCQSM, has been found.
4. Level of Service Standards for Long Range Planning. The transportation LOS standards for the purpose of long range (2030) transportation planning are:
a. Strategic Intermodal System (SIS): For facilities within the SIS, the LOS standard shall be as shown in Table 22. b. Broward County and Non-SIS State Roads: For facilities not within the SIS, the LOS standard shall be the generalized two-way peak–hour LOS “E” standard volumes depicted on the Generalized Peak Hour Two-Way Volumes for Florida’s Urbanized Areas Table in the Florida Department of Transportation’s Level of Service Manual within the Eastern Core District, and the generalized two-way peak-hour LOS “D” standard volumes depicted on the Generalized Peak Hour Two-Way Volumes for Florida’s Urbanized Areas Table in the Florida Department of Transportation’s Level of Service Manual, within the Port/Airport and Central Districts. c. Local Roads: Local roads will be maintained at LOS D.

City of Fort Lauderdale Comprehensive Plan (Ordinance C-08-18) Volume II – Transportation Element Page 8-67
III. Analysis Requirements Rule 9J-5.019(3), F.A.C. requires the Transportation Element be based upon the following analysis: land use and transportation system interaction; existing and projected transportation system level of service and system needs, including existing and projected intermodal needs; maintaining the adopted transportation level of service standards; consistency between the future land use and transportation elements, and consistency with other transportation plans; and promotion and support of public transportation system in designated public transportation corridors. Land use and transportation system interactions. This section is intended to implement various Rule 9J-5, FAC, analysis requirements. Subsection A addresses growth trends and travel patterns associated with the transportation system (i.e., the roadway and public transit networks) and is intended to fulfill the requirements of 9J-5.019(3)(d), FAC. Subsection B focuses on the adequacy of the transportation system for evacuation consistent with the requirements of Rule 9J-5.019(3)(c), FAC. Subsection C looks at the availability of the transportation system to serve existing land uses as required by Rule 9J-5.019(3)(b), FAC. Subsection D addresses land use compatibility around airports consistent with Rule 9J-5.019(3)(d), FAC. Fort Lauderdale’s historic growth and development are primarily linked to the construction of the Atlantic Intracoastal Waterway, Flagler’s railroad and the Seaboard Air Line / CSX Railway. These improvements allowed the movement of freight and passengers to and from Fort Lauderdale. The subsequent construction of US 1 and then I-95 through the City provided it with roadway access and the construction of Fort Lauderdale/Hollywood International Airport provided access by air. These transportation facilities are all located within four miles of the coast. The construction of the Central and South Florida Project, which provided drainage for much of Broward County’s western developable area, made it available for development. I-595, the major east-west expressway in south-central Broward County provided easy access from the western municipalities into Fort Lauderdale.
A. Availability of transportation facilities and services to serve existing land uses. Availability, as used here, refers to the extent to which the transportation system provides access to serve existing land uses. Access to serve existing land uses requires an extensive network of connections. Roadways, public transit, bikeways, and pedestrianways are transportation modes that require an extensive network of connections in order to serve existing uses. Some transportation modes, such as waterways, railways and the recreational traffic network, have limited connections and do not serve the primary function of serving or providing access to existing land uses. Still other transportation modes, such as airports and related facilities and intermodal facilities, are in essence transportation hubs serving regions. Consequently, this section addresses availability of the roadway, public transit, bikeways, and pedestrianways networks to serve existing land use.

City of Fort Lauderdale Comprehensive Plan (Ordinance C-08-18) Volume II – Transportation Element Page 8-68
1. Roadway network. Availability of the roadway network to service existing land uses is primarily a function of the existing local roadway system. New development is assured access by the Broward County Land Development Code that requires that development have adequate access to roadways.
Collector and arterial roadways, as a secondary or tertiary function, oftentimes provide access to existing land uses. This occurred prior to the implementation of access management standards.
2. Public transit network. Availability of public transit to service existing land uses is based on the functional area coverage of the existing fixed-route bus network. Functional area coverage is defined as a ½ mile corridor surrounding a bus route, three mile in each direction. The ¼ mile radius is based upon studies showing a person would walk up to three mile to access the public transit network. As stated earlier the City uses ¼ mile radius around bus stops and ½ mile around rail stations. The level of service requires 70 percent coverage. The Americans with Disabilities Act (ADA) requires that BCT, as an operator of a fixed-route bus system, offer complementary service to persons with disabilities who are unable to use the fixed-route system. A complementary paratransit service should operate at the level of service comparable to what is provided to persons without disabilities who use the fixed-route system. Since 1996, Broward County Transit has been in full compliance with the six service criteria established by the ADA. BCT continues to meet or exceed service requirements mandated in the ADA legislation. Efforts to coordinate service delivery with Tri-Rail, Miami-Dade and Palm Beach Counties are ongoing in order to meet growing demand of inter-county trips.
3. Bikeways network. Availability of the bikeways network to serve existing land uses can be defined by the functional area coverage for utilitarian bicycle trips, which can be categorized as a two mile radius from the point of trip origination. The two mile radius was derived from a special tabulation of the 1990 Nationwide Personal Transportation Survey that found that 72 percent of the work trips by bicycle are two miles or less; the comparable figure for shopping trips is 87 percent.
The availability of the bikeways network to serve existing land uses is limited. Although Broward County has 405+ centerline miles and 2,143+ lane miles of roads, it has only 67.7 miles of bikeways. But when the utilitarian bicycle functional area coverage is merged with public transit functional area coverage, the availability of bicycles to serve existing land uses increases substantially. This link between the bicycle and public transit is possible because BCT and Tri-Rail provide bicycle storage racks on their vehicles.

City of Fort Lauderdale Comprehensive Plan (Ordinance C-08-18) Volume II – Transportation Element Page 8-69
Lack of appropriate bicycle facilities at terminals, however, has limited the connection between the bicycle and public transit. Only low security bicycle storage has been provided at either Tri-Rail stations or the BCT bus terminal in Fort Lauderdale. Because of the length of time the bicycles are left unattended at the terminals, this type of bicycle parking is inappropriate. Bicycle parking that provides security for the entire bicycle would be more appropriate. Placing bicycle lockers at Tri-Rail stations and BCT transfer points would increase security for parked bicycles, but requires administration over the locker rentals. Providing this service would eliminate two major disincentives to riding a bicycle to a transit location: lack of parking and bicycle theft or vandalism.
In addition to increasing security, when marked and located properly, bicycle lockers would increase the area serviced by a transit stop. Bicycle lockers at Tri-Rail stations would enable patrons, not serviced by the feeder buses, to store a bicycle for use after disembarking. Locating bicycle lockers at selected transit transfer stations or points, park-and-ride lots, and Tri-Rail stations could increase public transit’s appeal to patrons who may otherwise not use transit. By providing for the bicyclist, as well as the pedestrian, the geographic market service area for transit is enlarged. Bicycles can provide access to transit at 300 percent of the normal speed and range of pedestrians.
In addition to providing bicycle parking, allowing bicycles access on board commuter trains and buses has been successful in many areas around the country. In 1995, Tri-Rail developed a policy that would allow bicycles to be brought onto the trains. Initially, this policy restricted the hours a bicycle could be brought on board. Since 1997, Tri-Rail has allowed bicycles on all of its trains. Also, in 1997, BCT received Congestion Mitigation and Air Quality funds to equip the entire fleet of buses with bicycle racks for the fronts of the buses. Every bus is capable of carrying two bicycles in a front mounted bumper rack.
While bicycle commuters reduce traffic congestion by a small number, one segment of the bicycling population, which significantly contributes to the reduction of the number of vehicles on the road daily, is children. For the majority of students, bicycling and walking are the only available type of independent transportation. Removing the barriers to bicycling for this segment of the cycling population has the potential for reducing peak hour traffic. If the children, riding bicycles to school, had to be driven, additional cars would be added to the roadway network during peak morning traffic.
The two most commonly cited reasons by school administrators for why students are taking motor vehicles to school are bicycle theft and hazardous walking conditions. These are correctable through facility or site improvements. The removal of hazardous walking conditions will decrease traffic by encouraging walking and bicycling to school.

City of Fort Lauderdale Comprehensive Plan (Ordinance C-08-18) Volume II – Transportation Element Page 8-70
4. Pedestrianways. Availability of pedestrianways to service existing land uses is primarily a function of the functional area coverage of the existing pedestrianway. As noted in the public transit availability discussion, the distance a person would be willing to walk is approximately ¼ mile. Since this distance is so small, the pedestrianway network should be geared toward improving access to the public transit network and improving connections within compact mixed use areas, such as downtowns and regional activity centers.
B. Adequacy of transportation system for evacuation. The existing and projected transportation systems are adequate to evacuate the coastal population of approximately 15,742 people prior to a Category 1 or 2 hurricane and the additional 37,951 people that would need to evacuate prior to a Category 3-5 hurricane. Three critical evacuation factors include the adequacy of evacuation routes, transportation and hazard route constraints, and evacuation time.
1. Evacuation Routes. State Road A1A, the main north-south roadway that extends throughout Fort Lauderdale’s coastal area, is connected to four east-west roadways, which serve as the evacuation routes in the event of a hurricane.
Since each route has a drawbridge at the Intracoastal, the conflict between the boat traffic and vehicle traffic is unavoidable. The Broward County Flotilla Plan, however, addresses the conflict between boat and vehicle traffic. Evacuation routes and bridges critical to hurricane evacuation are identified in Tables 5 and 6.
The new bridge at S.E. 17th Street Causeway has two independent spans, each with its own draw span and backup mechanical systems for optimum performance and reliability. It has improved traffic flow across the Intracoastal as well as at Eisenhower Boulevard on the west and Southeast 23rd Avenue on the east. The height of the new bridge is 55 feet, 30 feet higher than the former one. The navigational channel is now 120 feet. This improvement reduces clearance times. Therefore, the capacity of these routes is adequate to evacuate the coastal population prior to an impending natural disaster.
2. Hazard Constraints on Routes. Hazard constraints include debris and sand, flooding, and falling objects, such as utility poles causing road blockages, which restrict vehicular movement from the evacuation areas. To address these constraints, municipal, county, and state law enforcement officers have been assigned to direct traffic at the major coastal intersections and to identify and remove hazards.
3. Evacuation Time. Clearance time is the time required to clear all vehicles from the roadway system during an evacuation. The area requiring evacuation during a Category 1 and Category 2 storm is shown on Map 7 of the Coastal Management Element’s Support Document.

City of Fort Lauderdale Comprehensive Plan (Ordinance C-08-18) Volume II – Transportation Element Page 8-71
To determine whether the evacuation time is adequate to evacuate the coastal population prior to a natural disaster, the clearance time and the mobilization times must be compared against the evacuation order time. The mobilization is the time required by evacuees to secure their homes and prepare to leave and by government and quasi-government to muster their resources and implement evacuation operations. The evacuation order time is the time in hours, by which the evacuation order must be given in order to allow all evacuees to reach their destination. The evacuation order time is given by the County Mayor is 21 to 26 hours prior to the forecasted landfall of the storm event, depending upon the category of the storm threatening Fort Lauderdale. Thus, the roadway network will be adequate to evacuate the coastal population if the clearance time and mobilization time are less than 21 hours.
In the event of a Category 1 or 2 storm, the Broward County Comprehensive Emergency Operations Plan provides for a mobilization time of four hours. Based upon the evacuation order time of 21 hours, the roadway network is adequate to evacuate the coastal population.
Unlike the roadway network analysis, which assumes the coastal population evacuates Broward County, the public transit analysis assumes the coastal population will be evacuated to a County hurricane shelter. For public transit purposes, evacuation time is adequate if mobilization time and public transit operational times are less than the evacuation order time, i.e., 21 to 26 hours, depending on the severity of the storm. In order to allow for mobilization time, public transit evacuation operations commence four hours after an evacuation order is issued by the County Mayor. Public transit evacuation operations stay in effect approximately six and one half hours for a Category 1 and 2 storm and 12 hours for a Category 3, 4 and 5 storm. Based upon these times, the public transit network is adequate to support the evacuation of the coastal population.
In addition, measures to maintain or reduce evacuation times were incorporated into the Comprehensive Emergency Operations Plan, which identifies tasks and assigns responsibility to specific County divisions for their timely implementation. The measures devised to reduce evacuation times include public information, traffic control, debris removal, and public transit. Further, in order to decrease the evacuation time during the hurricane emergency, the Broward County Emergency Management Agency also reviews and approves hospitals, nursing homes, ambulatory surgical centers, adult living facilities, and other residential health care facility’s Comprehensive Emergency Management Plans on an annual basis.
4. Adequacy for future evacuation. The roadway network and transit services for future evacuation also are projected to be adequate due to constraints on increased densities along the barrier island.

City of Fort Lauderdale Comprehensive Plan (Ordinance C-08-18) Volume II – Transportation Element Page 8-72
5. Hurricane evacuation. BCT continues to provide bus service to the Coastal High Hazard Area. BCT buses, augmented by other vehicles if necessary, are positioned at designated pick-up points to provide transportation to refuge locations for those individuals who have not been able to make other arrangements. Approximately 175 BCT buses have been committed to participate in the evacuation of transit dependent individuals. BCT maintains 10 vehicles on stand by status ready to respond, as needed, to trailer parks.
Transportation for people with special needs is coordinated through Emergency Welfare Services, BCT Paratransit Service, and its designated contractor. One of the major responsibilities of the Paratransit Service Section is to notify and mobilize all assigned staff personnel necessary to implement the Emergency Action Plan for evacuation outlined in the Emergency Transportation Plan.
Before the start of each hurricane season, BCT reviews its Hurricane Evacuation Plan for currency and continued effectiveness. The mission for such plan is to assure a safe and orderly evacuation of transit dependant residents, or visitors to a designated hurricane refuge prior the landfall of hurricanes.
C. Compatibility around airports. The principal land use impacts from any airport can be expressed in terms of safety, noise and accessibility. As is common among urban airports, some land uses surrounding FLL and Fort Lauderdale Executive airports are not considered compatible with the airport. However, Fort Lauderdale and Broward County have undertaken initiatives to identify and reduce incompatibility at both airports.
1. Fort Lauderdale-Hollywood International Airport. The predominant future land uses adjacent to FLL are light industrial with an intermixing of residential, recreational, and commercial uses, to the north; Port Everglades seaport to the northeast; vacant parcels zoned for industrial uses, a rental car facility, manufacturing facilities and wetlands, to the east; residential neighborhoods, to the south; and industrial properties in the Port 95 Commerce Park, to the west.
a. Safety. A runway protection zone (RPZ, formerly called clear zone) is an area off the runway end used to enhance the protection of people and property on the ground. Broward County has acquired the majority of the land within the six RPZs at FLL, as well as land in the approach and transition zones for Runway 27L, in order to maintain these areas for open space or other land uses that would be compatible with aircraft operations. Much of this land was previously in private ownership and had been developed for residential and commercial uses that were not compatible with airport operations. Broward County Aviation Department conducts regular surveys for obstructions that affect the airspace in the approach surfaces at FLL, as defined by Federal Aviation Regulations (FAR) Part 77. The Department is active in trimming and removing potential vegetation obstructions.
City of Fort Lauderdale Comprehensive Plan (Ordinance C-08-18) Volume II – Transportation Element Page 8-73
Fixed objects, such as buildings, light poles, and cellular towers are marked with obstruction lights as required by the FAA. In addition, the runway thresholds have been displaced to provide sufficient clearance from obstructions that cannot be removed from the runway approaches, including existing interstate highways and railroads. Broward County has also adopted an Airport Zoning Ordinance that provides for protection of airspace in unincorporated Broward County. Tall structures, such as cellular towers, buildings and cranes can penetrate the airspace surrounding an airport and affect the operations of the airport. This Ordinance enables the County to control tall structure construction in unincorporated areas that would impact aviation capacity around County-owned airports. Chapter 333 Florida Statutes governs airspace in municipalities without an airport zoning ordinance. A land development code ordinance was passed in 2003 (Ordinance 2003-22) that applies to all new development and those existing plats that are to be reviewed after October 2003. The ordinance requires all developers constructing new residential properties disclose to potential homeowners the proximity of the nearest Broward County Aviation Department Airport . This is based on graphic prepared by the Aviation Department as it relates to the Florida Statutes Chapter 333. b. Noise. The City reviews all site plans for neighborhood compatibility and discourages residential uses within the noise contours of the airport. c. Accessibility. By definition, the airport is primarily a transportation center for air service, providing connections to international and domestic cities. Local access to the airport is primarily by road from Interstate 595 to U.S. Route 1, which have connections to Interstate 95 and Florida Turnpike. Broward County Transit Route 1 serves the airport. There is a Tri-Rail connection at Fort Lauderdale Airport Station, where a shuttle bus brings passengers to the terminals.
2. Fort Lauderdale Executive Airport. The predominant future land uses
adjacent to Fort Lauderdale Executive Airport are employment center and commercial uses.
Noise. The City reviews all site plans for neighborhood compatibility and discourages residential uses within the noise contours of the airport.
D. Existing transportation system level of service and system needs. Rule 9J-5.019(3)(a), FAC, requires the analysis of the existing transportation levels of service (LOS) and system needs be based on the following data: existing design and operating capacities; most recently available estimates for average daily and peak hour vehicle trips; existing modal split and vehicle occupancy rates; existing public transit facilities;

City of Fort Lauderdale Comprehensive Plan (Ordinance C-08-18) Volume II – Transportation Element Page 8-74
population characteristics; and the existing characteristics of the major trip generators and attractors within the community.
1. Roadways network. Table 24 depicts the two-way peak-hour, jurisdictional ownership, number of lanes, functional classification and whether the volume has met the capacity standard. The existing capacity analysis is shown on Map 18.
Table 24
Peak Hour Two-Way 2006 Roadway Capacity Analysis
Roadway Link Maint.Resp.
# Of Lanes
Funct Class
Peak Hour
Volume Standard Volume
Meets Standard
LOS
A1A CORP LIMIT TO OAKLAND PK BLVD ST 6 MA-U 3390 8190 Yes
OAKLAND PK BLVD TO NE 21 ST ST 4 MA-U 2910 5442 Yes
NE 21 ST TO SUNRISE BLVD ST 4 MA-U 3440 5442 Yes
SUNRISE BLVD TO BAYSHORE DR ST 4 MA-U 3710 5267 Yes
BAYSHORE TO LAS OLAS BLVD (ONE WAY NB) ST 2 MA-U 2070 2485 Yes
LAS OLAS BLVD (ONE WAY NB) ST 2 MA-U 1850 2485 Yes ANDREWS AVE CORP LIMITS TO CYPRESS CK RD BC 6 MA-U 2064 8190
Yes
CORP LIMIT TO NE 13 ST BC 6 MA-U 2085 8190 Yes
NE 13 ST TO SUNRISE BLVD BC 4 MA-U 1917 5267 Yes
SUNRISE BLVD TO BROWARD BLVD BC 4 MA-U 1580 5267 Yes
BROWARD BLVD TO S 7TH ST BC 4 MA-U 1673 5267 Yes
S 7TH ST TO DAVIE BLVD BC 4 MA-U 1783 5267 Yes
DAVIE BLVD TO SE 17 ST BC 4 MA-U 1810 5267 Yes
SE 17TH ST TO SR 84 BC 4 MA-U 1789 5267 Yes
SR 84 TO CORP LIMITS BC 4 C-U 1164 5267 Yes
BAYVIEW DR US 1 TO COMMERCIAL BLVD FL 2 C-U 608 1390 Yes C
COMMERCIAL BLVD TO NE 38 ST FL 2 C-U 1019 1390 Yes D
NE 38 ST TO OAKLAND PK BLVD FL 2 C-U 1175 1390 Yes D
OAKLAND PK BLVD TO NE 26 ST FL 2 C-U 1199 1390 Yes D
NE 26 ST TO SUNRISE BLVD FL 2 C-U 1226 1390 Yes D BROWARD BLVD CORP LIMITS TO NW 31ST AVE ST 6 OPA-U 3930 8190
Yes
NW 31 AVE TO NW 27 AVE ST 6 OPA-U 3313 8190 Yes
NW 27 AVE TO I-95 ST 6 OPA-U 3850 8190 Yes
I-95 TO SW 9 AVE ST 6 OPA-U 6060 4680 No F
SW 9 AVE TO SW 7 AVE ST 6 OPA-U 4630 4680 No E
SW 7 AVE TO N ANDREWS AVE ST 6 OPA-U 3702 4680 Yes D
N ANDREWS AVE TO SE 3 AVE ST 6 OPA-U 3179 4680 Yes D
SE 3RD AVE TO US 1 ST 6 OPA-U 2990 4680 Yes D
US-1 TO NE/SE 15 AVE BC 4 C-U 1582 5267 Yes

City of Fort Lauderdale Comprehensive Plan (Ordinance C-08-18)Volume II – Transportation Element Page 8-75
Roadway Link Maint.Resp.
# Of Lanes
Funct Class
Peak Hour
Volume Standard Volume
Meets Standard
LOS
SE 15 AVE TO SE 17 AVE BC 2 C-U 714 2485 Yes COMMERCIAL BLVD US-441 TO NW 31 AVE ST 6 OPA-U 4670 8190
Yes
NW 31 AVE TO PROSPECT RD ST 6 OPA-U 4521 8190 Yes
PROSPECT RD TO POWERLINE RD ST 6 OPA-U 4057 8190 Yes
POWERLINE RD TO CORP LIMIT ST 6 OPA-U 5280 8190 Yes
NE 15 AVE TO US-1 ST 6 OPA-U 3520 8190 Yes
CORP LIMITS TO US-1 ST 6 MA-U 3440 8190 Yes
CYPRESS CREEK RD CORP LIMIT TO NW 31 AVE BC 6 OPA-U 4696
8190 Yes
NW 31 AVE TO NW 21 AVE BC 6 OPA-U 3585 8190 Yes
NW 21 AVE TO POWERLINE RD BC 6 OPA-U 4413 8190 Yes
POWERLINE RD TO CORP LIMIT BC 8 OPA-U 3930 5580 Yes C
CORP LIMIT TO DIXIE HWY BC 6 MA-U 3240 8190 Yes
DIXIE HWY TO NE 18 AVE BC 2 MA-U 2394 2555 Yes
NE 18 AVE TO US 1 BC 2 C-U 1541 2555 Yes
DAVIE BLVD US 441 TO SW 31 AVE ST 4 MA-U 2420 5442
Yes
SW 31 AVE TO SW 27 AVE ST 4 MA-U 2620 5442 Yes
SW 27 AVE TO I-95 ST 4 MA-U 3070 5442 Yes
I-95 TO SW 9 AVE ST 4 MA-U 3461 5267 Yes
SW 9TH AVE TO SW 4 AVE ST 4 MA-U 2950 5267 Yes
SW 4 AVE TO ANDREWS AVE ST 4 MA-U 2660 5267 Yes
ANDREWS AVE TO US 1 ST 4 MA-U 1560 5267 Yes EISENHOWER BLVD SE 17 ST TO CORP LIMIT FL 4 C-U 198 2950 Yes C
DIXIE HWY CORP LIMIT TO N OF COMMERCIAL BLVD. ST 4 MA-U 1840 5442 Yes
I-595 I-95 TO US 1 ST 8 PAI-U 9170 13600 Yes C
I-95 OAKLAND PK BLVD. TO SUNRISE BLVD ST 10 PAI-U 23500 19050 No F
SUNRISE BLVD TO BROWARD BLVD. ST 10 PAI-U 27540 19050 No F
BROWARD BLVD TO DAVIE BLVD. ST 12 PAI-U 24560 23000 No F
DAVIE BLVD TO SR 84 ST 10 PAI-U 24820 19050 No F
SR 84 TO CORP LIMIT ST 10 PAI-U 24730 19050 No F LAS OLAS BLVD ANDREWS AVE TO SE 3 AVE FL 4 C-U 935 2950
Yes C
SE 3 AVE TO US-1 FL 4 C-U 1500 2950 Yes C
US-1 TO SE 15 AVE FL 4 C-U 1315 2950 Yes C
SE 15 AVE TO SE 17 AVE FL 4 MA-U 2890 2950 Yes D
SE 17 AVE TO A1A FL 4 MA-U 1890 2950 Yes C
MCNAB RD NW 31 AVE TO NW 21 AVE BC 4 MA-U 2351 5442 Yes

City of Fort Lauderdale Comprehensive Plan (Ordinance C-08-18) Volume II – Transportation Element Page 8-76
Roadway Link Maint.Resp.
# Of Lanes
Funct Class
Peak Hour
Volume Standard Volume
Meets Standard
LOS
NW 21 AVE TO POWERLINE RD BC 4 MA-U 2215 5442 Yes
NE / SE 3 AVE SUNRISE BLVD TO BROWARD BLVD BC 4 MA-U 1609 5442 Yes
BROWARD BLVD TO SE 7 ST BC 4 MA-U 2095 5442 Yes
SE 7 ST TO DAVIE BLVD BC 4 MA-U 1462 2485 Yes
DAVIE BLVD TO SE 17 ST BC 4 MA-U 837 2485 Yes
NE 4 AVE N CORP LIMIT TO SUNRISE BLVD FL 4 MA-U 1630 2950 Yes C
NE / SE 15 AVE CORP LIMIT TO NE 13 ST FL 4 C-U 1116 2950 Yes C
NE 13 ST TO SUNRISE BLVD FL 4 C-U 1587 2950 Yes C
SUNRISE BLVD TO NE 6 ST FL 2 C-U 919 1390 Yes C
NE 6 ST TO BROWARD BLVD FL 2 C-U 462 1390 Yes C
BROWARD BLVD TO LAS OLAS BLVD FL 2 C-U 963 1390 Yes C
NE 26 ST CORP LIMITS TO BAYVIEW DR FL 2 C-U 712 1390 Yes C
NE 56 ST CORP LIMIT TO NE 18 AVE BC 2 C-U 1001 2555 Yes
NE 18 AVE TO US 1 BC 2 C-U 359 2555 Yes
NW / NE 6 ST CORP LIMIT TO I-95 BC 4 C-U 2086 5442 Yes
I-95 TO POWERLINE RD BC 4 C-U 1767 5267 Yes
POWERLINE RD TO ANDREWS AVE BC 4 C-U 1596 5267 Yes
ANDREWS AVE TO US-1 BC 2 C-U 497 2485 Yes
US 1 TO VICTORIA PK RD BC 2 C-U 461 2485 Yes
NW 7 AVE NW 19 ST TO SUNRISE BLVD FL 4 C-U 819 2950 Yes C
SUNRISE BLVD TO NW 6 ST BC 4 MA-U 1081 5267 Yes
NW 6 ST TO BROWARD BLVD BC 4 MA-U 1493 5267 Yes
BROWARD BLVD TO NEW RIVER BC 4 MA-U 1658 5267 Yes
NW / SW 9 AVE SUNRISE BLVD TO NW 6 ST FL 2 C-U 759 1390 Yes C
NW 6 ST TO BROWARD BLVD FL 2 C-U 370 1390 Yes C
DAVIE BLVD TO SW 17 ST FL 2 C-U 457 1390 Yes C
SW 17 ST TO CORP LIMIT FL 2 C-U 579 1390 Yes C
NW / NE 13 ST POWERLINE RD TO NW 7 AVE FL 4 C-U 1465 2950 Yes C
NW 7 AVE TO ANDREWS AVE FL 4 C-U 1545 2950 Yes C
ANDREWS AVE TO NE 4 AVE FL 4 C-U 1497 2950 Yes C
NE 4 AVE TO NE 15 AVE FL 4 C-U 1257 2950 Yes C
NE 15 AVE TO US 1 FL 4 C-U 1062 2950 Yes C
NW 19 ST NW 31 AVE TO NW 21 AVE BC 4 C-U 2166 5442 Yes
NW 21 AVE TO POWERLINE RD BC 4 C-U 1778 5442 Yes
NW 21 AVE CORP LIMIT TO SUNRISE BLVD. BC 2 C-U 1605 2555 Yes

City of Fort Lauderdale Comprehensive Plan (Ordinance C-08-18) Volume II – Transportation Element Page 8-77
Roadway Link Maint.Resp.
# Of Lanes
Funct Class
Peak Hour
Volume Standard Volume
Meets Standard
LOS
NW / SW 31 AVE CORP LIMIT TO CYPRESS CK RD FL 6 MA-U 3396 4450 Yes D
CYPRESS CK RD TO PROSPECT RD FL 6 MA-U 3508 4450 Yes D
PROSPECT RD TO COMMERCIAL BLVD BC 6 MA-U 3140 8190 Yes
NW 26 ST TO NW 13 ST BC 6 MA-U 3267 8190 Yes
BROWARD BLVD TO SW 7 ST FL 2 C-U 1229 1390 Yes D
DAVIE BLVD TO SW 7 ST BC 2 C-U 861 2555 Yes
RIVERLAND RD TO DAVIE BLVD BC 2 C-U 407 2555 Yes OAKLAND PARK BLVD CORP LIMIT TO US 1 ST 6 OPA-U 3030 8190 Yes
US 1 TO BAYVIEW DR ST 6 MA-U 3600 8190 Yes
BAYVIEW DR TO A1A ST 6 MA-U 3340 8190 Yes POWERLINE RD CORP LIMIT TO CYPRESS CREEK RD ST 6 OPA-U 3440 8190 Yes
CYPRESS CK RD TO COMMERCIAL BLVD ST 6 OPA-U 2660 8190 Yes
CORP LIMIT TO NW 19 ST ST 6 OPA-U 2210 8190 Yes
NW 19 ST TO SUNRISE BLVD ST 6 OPA-U 1880 8190 Yes
PROSPECT RD SR 7 TO NW 31 AVE BC 6 C-U 1950 8190 Yes
COMMERCIAL BLVD TO POWERLINE RD BC 4 MA-U 1798 5442 Yes RIVERLAND RD SR 7 TO SW 31 AVE FL 2 C-U 1041 1390 Yes D
SW 31 AVE TO SW 27 AVE BC 2 C-U 374 2555 Yes SEABREEZE BLVD S TO LAS OLAS BLVD (ONE WAY SB) FL 4 MA-U 1800 2950 Yes C
S OF LAS OLAS BLVD TO A1A (SB) ONE WAY ST 4 MA-U 2010 5267 Yes
STATE ROAD 7 TURNPIKE OVERPASS TO PROSPECT ROAD ST 6 OPA-U 4050 8190 Yes
DAVIE BLVD TO CORP LIMIT ST 6 OPA-U 4220 8190 Yes STATE ROAD 84 I-95 TO SW 9 AVE ST 6 MA-U 4340 4680
Yes D
SW 9 AVE TO SW 4 AVE ST 6 MA-U 3480 4680 Yes C
SW 4 AVE TO ANDREWS AVE ST 6 MA-U 2660 4680 Yes C
ANDREWS AVE TO US 1 ST 6 MA-U 1370 4680 Yes C
US 1 TO EISENHOWER BLVD FL 6 C-U 451 4680 Yes C SUNRISE BLVD CORP LIMIT TO I-95 ST 6 OPA-U 4670 7910 Yes
I-95 TO POWERLINE RD ST 6 OPA-U 5200 7910 Yes
POWERLINE RD TO NE 4 AVE ST 6 OPA-U 3480 7910 Yes
NE 4 AVE TO NE 15 AVE ST 6 OPA-U 6510 7910 Yes
NE 15 AVE TO US-1 ST 6 OPA-U 6300 7910 Yes
US-1 TO ICWW BRIDGE ST 6 MA-U 3070 7910 Yes
ICWW BRIDGE TO A1A ST 6 MA-U 2810 7910 Yes

City of Fort Lauderdale Comprehensive Plan (Ordinance C-08-18) Volume II – Transportation Element Page 8-78
Roadway Link Maint.Resp.
# Of Lanes
Funct Class
Peak Hour
Volume Standard Volume
Meets Standard
LOS
SW 2 ST SW 7 AVE TO ANDREWS AVE FL 2 C-U 813 1390 Yes C
SW 4 AVE NEW RIVER BRIDGE TO SW 17 ST BC 4 MA-U 1317 2950 Yes C
SW 17 ST TO SR 84 BC 4 MA-U 1655 2950 Yes C
SR 84 TO CORP LIMIT FL 4 C-U 1193 2950 Yes C
SW 7 ST SW 4 AVE TO ANDREWS AVE FL 2 C-U 507 1390 Yes C
SW/SE 17 ST SW 9 AVE TO SW 4 AVE FL 4 C-U 355 2950 Yes C
SW 4 AVE TO US 1 FL 4 MA-U 1200 2950 Yes D
US 1 TO MIAMI RD ST 6 MA-U 4820 8190 Yes
MIAMI RD TO EISENHOWER BLVD ST 6 MA-U 4290 8190 Yes
EISENHOWER BLVD TO A1A ST 4 MA-U 3550 5442 Yes
SW 27 AVE BROWARD BLVD TO DAVIE BLVD BC 4 C-U 1117 5442 Yes
DAVIE BLVD TO RIVERLAND RD BC 2 C-U 759 2555 Yes
US-1 CORP LIMIT TO COMMERCIAL BLVD ST 6 OPA-U 4710 8190 Yes
COMMERCIAL BLVD TO NE 38 ST ST 6 OPA-U 5240 8190 Yes
NE 38 ST TO OAKLAND PK BLVD ST 6 OPA-U 5300 8190 Yes
OAKLAND PK BLVD TO NE 26 ST ST 6 OPA-U 4100 8190 Yes
NE 26 ST TO SUNRISE BLVD ST 6 OPA-U 4710 8190 Yes
SUNRISE BLVD TO NE 6 ST ST 6 OPA-U 4340 7910 Yes
NE 6 ST TO BROWARD BLVD ST 6 OPA-U 3528 7910 Yes
BROWARD BLVD TO LAS OLAS BLVD ST 6 OPA-U 4370 7910 Yes
LAS OLAS BLVD TO DAVIE BLVD ST 6 OPA-U 5560 7910 Yes
DAVIE BLVD TO 17TH ST CAUSEWAY ST 6 OPA-U 5300 7910 Yes
17 ST CAUSEWAY TO SR 84 ST 6 OPA-U 6510 7910 Yes
SR 84 TO CORP LIMIT ST 6 OPA-U 7150 7910 Yes VICTORIA PARK RD SUNRISE BLVD TO BROWARD BLVD FL 2 C-U 684 1390 Yes C
All roads with a Level of Service Letter Grade are either Local or SIS Facilities. Source: Broward County Transportation Planning Division, 2006. Table 25 shows the roadway segments that are operating below the Peak Hour Capacity standard.
Table 25 2006 Peak Hour Capacity
Overcapacity Roadway Segments
Roadway
Segment
Level of Service
Jurisdiction
Broward Blvd. I-95 to SW 7 Ave. F State I-95 Oakland Park Blvd. to South City Limits F State
Source: Roadway Level of Service Analysis, Broward County Transportation Planning Division, 2006.

W SUNRISE BLVD
W BROWARD BLVD
DAVIE BLVD
SR 84
N S
R 7
OAKLAND PARK BLVD
COMMERCIAL BLVD
NW 62ND ST
S FE
DE
RAL
HW
Y
N F
EDER
AL H
WY
E LAS OLAS BLVD
N A
TLA
NTI
C B
LVD
NW
31S
T AV
E
INTE
RSTA
TE 9
5NW 19 ST
ATLA
NTI
C O
CE
AN
FLORID
A TURNPIK
E
AND
RE
WS
AVE
N D
IXIE
HW
Y
NE 13 ST
I-595
SE 17 ST
NW
7 A
VE
SISTRUNK BLVD
MCNAB RD
Fort Lauderdale /Hollywood
International Airport
PortEverglades
¯DATA SOURCE: BROWARD COUNTY TRANSPORTATION PLANNING DEPARTMENT- 2005MAP SOURCE: CITY OF FORT LAUDERDALE PLANNING & ZONING DEPARTMENT- JULY, 2006
CAPACITY ANALYSIS MAP 18TWO WAY PEAK HOUR 2006
0 1 20.5Miles
Legend
CAPACITYANALYSIS
CITY LIMITS
CENTRAL
Over-CapacityRoadways
Meets LOSStandard
CONCURRENCY DISTRICTS
EASTERN CORE
PORT/AIRPORT

City of Fort Lauderdale Comprehensive Plan (Ordinance C-08-18) Volume II – Transportation Element Page 8-80
E. Projected transportation system levels of service and system needs. Rule 9J-5.019(3)(f), FAC, requires an analysis on the projected transportation LOS and system needs based on the future land uses shown on the future land use map.
1. Roadway network. Table 26 depicts the two-way peak-hour, jurisdictional ownership, number of lanes, functional classification and whether the volume has met the capacity standard. The 2030 roadway capacity analysis is shown on Map 19.
Table 26
Peak Hour Two-Way 2030 Roadway Capacity Analysis
Roadway Link Maint.Resp.
# Of Lanes
Funct Class
Peak Hour
Volume Standard Volume
Meets Standard
LOS
A1A CORP LIMIT TO OAKLAND PK BLVD ST 6 MA-U 3146 8190 Yes
OAKLAND PK BLVD TO NE 21 ST ST 4 MA-U 3131 5442 Yes
NE 21 ST TO SUNRISE BLVD ST 4 MA-U 3131 5442 Yes
SUNRISE BLVD TO BAYSHORE DR ST 4 MA-U 3566 5267 Yes
BAYSHORE TO LAS OLAS BLVD (ONE WAY NB) ST 2 MA-U 3225 2485 Yes
LAS OLAS BLVD (ONE WAY NB) ST 2 MA-U 1786 2485 Yes ANDREWS AVE CORP LIMITS TO CYPRESS CK RD BC 6 MA-U 3320 8190
Yes
CORP LIMIT TO NE 13 ST BC 6 MA-U 2979 8190 Yes
NE 13 ST TO SUNRISE BLVD BC 4 MA-U 2959 5267 Yes
SUNRISE BLVD TO BROWARD BLVD BC 4 MA-U 2248 5267 Yes
BROWARD BLVD TO S 7TH ST BC 4 MA-U 3240 5267 Yes
S 7TH ST TO DAVIE BLVD BC 4 MA-U 2407 5267 Yes
DAVIE BLVD TO SE 17 ST BC 4 MA-U 2951 5267 Yes
SE 17TH ST TO SR 84 BC 4 MA-U 2561 5267 Yes
SR 84 TO CORP LIMITS BC 4 C-U 1444 5267 Yes
BAYVIEW DR US 1 TO COMMERCIAL BLVD FL 2 C-U 1148 1390 No F
COMMERCIAL BLVD TO NE 38 ST FL 2 C-U 1087 1390 Yes D
NE 38 ST TO OAKLAND PK BLVD FL 2 C-U 1087 1390 Yes D
OAKLAND PK BLVD TO NE 26 ST FL 2 C-U 1470 1390 No F
NE 26 ST TO SUNRISE BLVD FL 2 C-U 1470 1390 No F BROWARD BLVD CORP LIMITS TO NW 31ST AVE ST 6 OPA-U 4267 8190
Yes
NW 31 AVE TO NW 27 AVE ST 6 OPA-U 5438 8190 Yes
NW 27 AVE TO I-95 ST 6 OPA-U 5950 8190 Yes
I-95 TO SW 9 AVE ST 6 OPA-U 5288 4680 No F
SW 9 AVE TO SW 7 AVE ST 6 OPA-U 5071 4680 No F
SW 7 AVE TO N ANDREWS AVE ST 6 OPA-U 5071 4680 No F
N ANDREWS AVE TO SE 3 AVE ST 6 OPA-U 5715 4680 No F

City of Fort Lauderdale Comprehensive Plan (Ordinance C-08-18) Volume II – Transportation Element Page 8-81
Roadway Link Maint.Resp.
# Of Lanes
Funct Class
Peak Hour
Volume Standard Volume
Meets Standard
LOS
SE 3RD AVE TO US 1 ST 6 OPA-U 5715 4680 No F
US-1 TO NE/SE 15 AVE BC 4 C-U 2732 5267 Yes
SE 15 AVE TO SE 17 AVE BC 2 C-U 960 2485 Yes COMMERCIAL BLVD US-441 TO NW 31 AVE ST 6 OPA-U 6567 8190
Yes
NW 31 AVE TO PROSPECT RD ST 6 OPA-U 5209 8190 Yes
PROSPECT RD TO POWERLINE RD ST 6 OPA-U 6225 8190 Yes
POWERLINE RD TO CORP LIMIT ST 6 OPA-U 6279 8190 Yes
NE 15 AVE TO US-1 ST 6 OPA-U 5250 8190 Yes
CORP LIMITS TO US-1 ST 6 MA-U 2913 8190 Yes
CYPRESS CREEK RD CORP LIMIT TO NW 31 AVE BC 6 OPA-U 6316
8190 Yes
NW 31 AVE TO NW 21 AVE BC 6 OPA-U 6539 8190 Yes
NW 21 AVE TO POWERLINE RD BC 6 OPA-U 3952 8190 Yes
POWERLINE RD TO CORP LIMIT BC 8 OPA-U 3097 5580 Yes D
CORP LIMIT TO DIXIE HWY BC 6 MA-U 3097 8190 Yes
DIXIE HWY TO NE 18 AVE BC 2 MA-U 2368 2555 Yes
NE 18 AVE TO US 1 BC 2 C-U 1300 2555 Yes
DAVIE BLVD US 441 TO SW 31 AVE ST 4 MA-U 3765 5442
Yes
SW 31 AVE TO SW 27 AVE ST 4 MA-U 3906 5442 Yes
SW 27 AVE TO I-95 ST 4 MA-U 3906 5442 Yes
I-95 TO SW 9 AVE ST 4 MA-U 3990 5267 Yes
SW 9TH AVE TO SW 4 AVE ST 4 MA-U 3990 5267 Yes
SW 4 AVE TO ANDREWS AVE ST 4 MA-U 3990 5267 Yes
ANDREWS AVE TO US 1 ST 4 MA-U 2012 5267 Yes EISENHOWER BLVD SE 17 ST TO CORP LIMIT FL 4 C-U 1933 2950 Yes C
DIXIE HWY CORP LIMIT TO N OF COMMERCIAL BLVD. ST 4 MA-U 2716 5442 Yes
I-595 I-95 TO US 1 ST 8 PAI-U 13716 13600 No E
I-95 OAKLAND PK BLVD. TO SUNRISE BLVD ST 10 PAI-U 29631 19050 No F
SUNRISE BLVD TO BROWARD BLVD. ST 10 PAI-U 31754 19050 No F
BROWARD BLVD TO DAVIE BLVD. ST 12 PAI-U 33434 23000 No F
DAVIE BLVD TO SR 84 ST 10 PAI-U 35071 19050 No F
SR 84 TO CORP LIMIT ST 10 PAI-U 34113 19050 No F LAS OLAS BLVD ANDREWS AVE TO SE 3 AVE FL 4 C-U 2336 2950 Yes D
SE 3 AVE TO US-1 FL 4 C-U 2336 2950 Yes D
US-1 TO SE 15 AVE FL 4 C-U 1847 2950 Yes C
SE 15 AVE TO SE 17 AVE FL 4 MA-U 1829 2950 Yes C
SE 17 AVE TO A1A FL 4 MA-U 964 2950 Yes C

City of Fort Lauderdale Comprehensive Plan (Ordinance C-08-18)Volume II – Transportation Element Page 8-82
Roadway Link Maint.Resp.
# Of Lanes
Funct Class
Peak Hour
Volume Standard Volume
Meets Standard
LOS
MCNAB RD NW 31 AVE TO NW 21 AVE BC 4 MA-U 2778 5442 Yes
NW 21 AVE TO POWERLINE RD BC 4 MA-U 2778 5442 Yes
NE / SE 3 AVE SUNRISE BLVD TO BROWARD BLVD BC 4 MA-U 1609 5442 Yes
BROWARD BLVD TO SE 7 ST BC 4 MA-U 2017 5442 Yes
SE 7 ST TO DAVIE BLVD BC 4 MA-U 3144 2485 Yes
DAVIE BLVD TO SE 17 ST BC 4 MA-U 2869 2485 Yes
NE 4 AVE N CORP LIMIT TO SUNRISE BLVD FL 4 MA-U 2278 2950 Yes C
NE / SE 15 AVE CORP LIMIT TO NE 13 ST FL 4 C-U 1200 2950 Yes C
NE 13 ST TO SUNRISE BLVD FL 4 C-U 1040 2950 Yes C
SUNRISE BLVD TO NE 6 ST FL 2 C-U 1369 1390 Yes C
NE 6 ST TO BROWARD BLVD FL 2 C-U 1303 1390 Yes D
BROWARD BLVD TO LAS OLAS BLVD FL 2 C-U 1299 1390 Yes D
NE 26 ST CORP LIMITS TO BAYVIEW DR FL 2 C-U 1390 1390 Yes D
NE 56 ST CORP LIMIT TO NE 18 AVE BC 2 C-U 859 2555 Yes
NE 18 AVE TO US 1 BC 2 C-U 1112 2555 Yes
NW / NE 6 ST CORP LIMIT TO I-95 BC 4 C-U 2217 5442 Yes
I-95 TO POWERLINE RD BC 4 C-U 2217 5267 Yes
POWERLINE RD TO ANDREWS AVE BC 4 C-U 2217 5267 Yes
ANDREWS AVE TO US-1 BC 2 C-U 1250 2485 Yes
US 1 TO VICTORIA PK RD BC 2 C-U 871 2485 Yes
NW 7 AVE NW 19 ST TO SUNRISE BLVD FL 4 C-U 874 2950 Yes C
SUNRISE BLVD TO NW 6 ST BC 4 MA-U 542 5267 Yes
NW 6 ST TO BROWARD BLVD BC 4 MA-U 4009 5267 Yes
BROWARD BLVD TO NEW RIVER BC 4 MA-U 3806 5267 Yes
NW / SW 9 AVE SUNRISE BLVD TO NW 6 ST FL 2 C-U 942 1390 Yes C
NW 6 ST TO BROWARD BLVD FL 2 C-U 887 1390 Yes C
DAVIE BLVD TO SW 17 ST FL 2 C-U 998 1390 Yes C
SW 17 ST TO CORP LIMIT FL 2 C-U 998 1390 Yes C
NW / NE 13 ST POWERLINE RD TO NW 7 AVE FL 4 C-U 1734 2950 Yes C
NW 7 AVE TO ANDREWS AVE FL 4 C-U 1670 2950 Yes C
ANDREWS AVE TO NE 4 AVE FL 4 C-U 1867 2950 Yes C
NE 4 AVE TO NE 15 AVE FL 4 C-U 1822 2950 Yes C
NE 15 AVE TO US 1 FL 4 C-U 1822 2950 Yes C
NW 19 ST NW 31 AVE TO NW 21 AVE BC 4 C-U 2849 5442 Yes
NW 21 AVE TO POWERLINE RD BC 4 C-U 2849 5442 Yes

City of Fort Lauderdale Comprehensive Plan (Ordinance C-08-18) Volume II – Transportation Element Page 8-83
Roadway Link Maint.Resp.
# Of Lanes
Funct Class
Peak Hour
Volume Standard Volume
Meets Standard
LOS
NW 21 AVE CORP LIMIT TO SUNRISE BLVD. BC 2 C-U 1851 2555 Yes NW / SW 31 AVE CORP LIMIT TO CYPRESS CK RD FL 6 MA-U 6064 4450 No F
CYPRESS CK RD TO PROSPECT RD FL 6 MA-U 6385 4450 No F
PROSPECT RD TO COMMERCIAL BLVD BC 6 MA-U 6385 8190 Yes
NW 26 ST TO NW 13 ST BC 6 MA-U 4736 8190 Yes
BROWARD BLVD TO SW 7 ST FL 2 C-U 1550 1390 No F
DAVIE BLVD TO SW 7 ST BC 2 C-U 1550 2555 Yes
RIVERLAND RD TO DAVIE BLVD BC 2 C-U 872 2555 Yes OAKLAND PARK BLVD CORP LIMIT TO US 1 ST 6 OPA-U 5456 8190 Yes
US 1 TO BAYVIEW DR ST 6 MA-U 3760 8190 Yes
BAYVIEW DR TO A1A ST 6 MA-U 3257 8190 Yes POWERLINE RD CORP LIMIT TO CYPRESS CREEK RD ST 6 OPA-U 6334 8190 Yes
CYPRESS CK RD TO COMMERCIAL BLVD ST 6 OPA-U 7098 8190 Yes
CORP LIMIT TO NW 19 ST ST 6 OPA-U 6257 8190 Yes
NW 19 ST TO SUNRISE BLVD ST 6 OPA-U 5255 8190 Yes
PROSPECT RD SR 7 TO NW 31 AVE BC 6 C-U 2506 8190 Yes
COMMERCIAL BLVD TO POWERLINE RD BC 4 MA-U 2733 5442 Yes RIVERLAND RD SR 7 TO SW 31 AVE FL 2 C-U 1619 1390 No F
SW 31 AVE TO SW 27 AVE BC 2 C-U 1619 2555 Yes SEABREEZE BLVD S TO LAS OLAS BLVD (ONE WAY SB) FL 4 MA-U 3443 2950 No F
S OF LAS OLAS BLVD TO A1A (SB) ONE WAY ST 4 MA-U 3566 5267 Yes
STATE ROAD 7 TURNPIKE OVERPASS TO PROSPECT ROAD ST 6 OPA-U 4050 8190 Yes
DAVIE BLVD TO CORP LIMIT ST 6 OPA-U 4220 8190 Yes STATE ROAD 84 I-95 TO SW 9 AVE ST 6 MA-U 6306 4680 No F
SW 9 AVE TO SW 4 AVE ST 6 MA-U 5301 4680 No F
SW 4 AVE TO ANDREWS AVE ST 6 MA-U 5301 4680 No F
ANDREWS AVE TO US 1 ST 6 MA-U 5301 4680 No F US 1 TO EISENHOWER BLVD FL 6 C-U 934 4450 Yes C SUNRISE BLVD CORP LIMIT TO I-95 ST 6 OPA-U 6538 7910 Yes
I-95 TO POWERLINE RD ST 6 OPA-U 5802 7910 Yes
POWERLINE RD TO NE 4 AVE ST 6 OPA-U 5217 7910 Yes
NE 4 AVE TO NE 15 AVE ST 6 OPA-U 5094 7910 Yes
NE 15 AVE TO US-1 ST 6 OPA-U 4445 7910 Yes
US-1 TO ICWW BRIDGE ST 6 MA-U 3072 7910 Yes
ICWW BRIDGE TO A1A ST 6 MA-U 3072 7910 Yes

City of Fort Lauderdale Comprehensive Plan (Ordinance C-08-18) Volume II – Transportation Element Page 8-84
Roadway Link Maint.Resp.
# Of Lanes
Funct Class
Peak Hour
Volume Standard Volume
Meets Standard
LOS
SW 2 ST SW 7 AVE TO ANDREWS AVE FL 2 C-U 1088 1390 Yes D
SW 4 AVE NEW RIVER BRIDGE TO SW 17 ST BC 4 MA-U 3051 2950 No F
SW 17 ST TO SR 84 BC 4 MA-U 3051 2950 No F
SR 84 TO CORP LIMIT FL 4 C-U 1834 2950 Yes C
SW 7 ST SW 4 AVE TO ANDREWS AVE FL 2 C-U 1206 1390 Yes D
SW/SE 17 ST SW 9 AVE TO SW 4 AVE FL 4 C-U 973 2950 Yes C
SW 4 AVE TO US 1 FL 4 MA-U 2318 2950 Yes D
US 1 TO MIAMI RD ST 6 MA-U 5611 8190 Yes
MIAMI RD TO EISENHOWER BLVD ST 6 MA-U 5611 8190 Yes
EISENHOWER BLVD TO A1A ST 4 MA-U 4625 5442 Yes
SW 27 AVE BROWARD BLVD TO DAVIE BLVD BC 4 C-U 2857 5442 Yes
DAVIE BLVD TO RIVERLAND RD BC 2 C-U 1619 2555 Yes
US-1 CORP LIMIT TO COMMERCIAL BLVD ST 6 OPA-U 4567 8190 Yes
COMMERCIAL BLVD TO NE 38 ST ST 6 OPA-U 4567 8190 Yes
NE 38 ST TO OAKLAND PK BLVD ST 6 OPA-U 5569 8190 Yes
OAKLAND PK BLVD TO NE 26 ST ST 6 OPA-U 5569 8190 Yes
NE 26 ST TO SUNRISE BLVD ST 6 OPA-U 4956 8190 Yes
SUNRISE BLVD TO NE 6 ST ST 6 OPA-U 4956 7910 Yes
NE 6 ST TO BROWARD BLVD ST 6 OPA-U 5443 7910 Yes
BROWARD BLVD TO LAS OLAS BLVD ST 6 OPA-U 5055 7910 Yes
LAS OLAS BLVD TO DAVIE BLVD ST 6 OPA-U 5519 7910 Yes
DAVIE BLVD TO 17TH ST CAUSEWAY ST 6 OPA-U 5519 7910 Yes
17 ST CAUSEWAY TO SR 84 ST 6 OPA-U 6785 7910 Yes
SR 84 TO CORP LIMIT ST 6 OPA-U 7587 7910 Yes VICTORIA PARK RD SUNRISE BLVD TO BROWARD BLVD FL 2 C-U 1098 1390 Yes D
All roads with a Level of Service Letter Grade are either Local or SIS Facilities. Source: Broward County Transportation Planning Division, 2006.

W SUNRISE BLVD
W BROWARD BLVD
DAVIE BLVD
SR 84
N S
R 7
OAKLAND PARK BLVD
COMMERCIAL BLVD
NW 62ND ST
S FE
DE
RAL
HW
Y
N F
EDER
AL H
WY
E LAS OLAS BLVD
N A
TLA
NTI
C B
LVD
NW
31S
T AV
E
INTE
RSTA
TE 9
5NW 19 ST
ATLA
NTI
C O
CE
AN
FLORID
A TURNPIK
E
AND
RE
WS
AVE
N D
IXIE
HW
Y
NE 13 ST
I-595
SE 17 ST
NW
7 A
VE
SISTRUNK BLVD
MCNAB RD
Fort Lauderdale /Hollywood
International Airport
PortEverglades
¯DATA SOURCE: BROWARD COUNTY TRANSPORTATION PLANNING DEPARTMENT- 2005MAP SOURCE: CITY OF FORT LAUDERDALE PLANNING & ZONING DEPARTMENT- JULY, 2006
CAPACITY ANALYSIS MAP 19 TWO WAY PEAK HOUR 2030
0 1 20.5Miles
Legend
CAPACITYANALYSIS
CITY LIMITS
CENTRAL
Over-CapacityRoadways
Meets LOSStandard
CONCURRENCY DISTRICTS
EASTERN CORE
PORT/AIRPORT

City of Fort Lauderdale Comprehensive Plan (Ordinance C-08-18)Volume II – Transportation Element Page 8-86
Table 27 shows the roadway segments that are projected to be operating below the Peak Hour Capacity standard in year 2030.
Table 27 2030 Peak Hour Capacity
Overcapacity Roadway Segments
Roadway
Segment
Level of
Service
Jurisdiction
Bayview Drive US-1 to Commercial Blvd. F City Bayview Drive Oakland Park Blvd. to Sunrise Blvd. F City Broward Blvd I-95 to US 1 F State I-595 I-95 to US 1 E State I-95 NW 19 Street to City limits F State NW 31 Ave North City limits to Prospect Road F Broward County NW 31 Ave Broward Blvd. to SW 7 Street F City Riverland Road SR 7 to SW 31 Ave F City Seabreeze Blvd. One Way Southbound F City SR 84 I-95 to US 1 F State SW 4 Ave. New River to SR 84 F Broward County
Source: Roadway Level of Service Analysis, Broward County Transportation Planning Division, 2006. a. Planned Improvements – The following list shows the long-range roadway improvement projects in the 2030 LRTP.
• Cypress Creek Road from Florida’s Turnpike to I-95 • The 7th/9th Connector from Sunrise Boulevard to Sistrunk
Boulevard • NW 21 Avenue from Oakland Park Boulevard to Sunrise
Boulevard • I-595 from SR 7 to US-1 • Andrews Avenue/3rd Avenue (One-Way Pairs) from Sunrise
Boulevard to Davie Boulevard. b. Future Demand and Overcapacity Conditions
Upon closer inspection of the data several observations can be noted. Most of the overcapacity roads in the City are County or State facilities. Many of these overcapacity segments are roads that may be classified in the future as constrained roadways due to financial, physical or policy constraints. The County will conduct a study on constrained roadways so as to provide for an adequate level of service and to improve mobility. Policy 1.7.7 of Volume I of the City’s Transportation Element requires the City to participate in the study. Moreover, some of the overcapacity segments are expressways, such as I-595

City of Fort Lauderdale Comprehensive Plan (Ordinance C-08-18) Volume II – Transportation Element Page 8-87
and I-95, which will be addressed through the Department of Transportation Strategic Intermodal System evaluation and funding.
2. Public transit network.
a. Transit. Transit level of service is defined as 70 percent functional area
coverage for residences and employment within a ½ mile corridor surrounding a bus route and a ¼ mile in each direction. Map 17 shows the functional coverage around transit (rail and bus) stops within Fort Lauderdale. Based upon our analysis, we currently have 75 percent coverage that meets the acceptable level of service.
An important area of public transit service is to accommodate the special needs of the transportation disadvantaged. These needs are documented in A Plan for Complementary Paratransit BCT Service for Persons with Disabilities for Broward County, Florida and in Broward County Transportation Disadvantaged Service Plan, 1996.
3. Bikeways network. The summary of projected needs included in this subsection is based upon the Broward County Bicycle Facilities Network Plan. In Data Requirements, it was shown that Broward County does not yet have a functional interconnected bikeways network; less than 70 miles of bikeways exist. As a way to measure the accessibility and convenience of this bikeways network, the Broward County Transportation Planning Division has developed an indicator known as the level of coverage (LOC). The LOC ranges from A, the best level of coverage, to E, the worst, and measures the percentage of major public transit attractors that are accessible through the bikeways network. Table 28 displays the percentages associated with each LOC indicator.
Table 28
Bikeways Network Level of Coverage
Percent of Bikeways Network Accessible
to Major Public Transit Attractors
LOC
Indicator 0 – 20
E
21 – 40
D
41 – 60
C
61 – 80
B
81 – 100
A
Source: Bicycle Facilities Network Plan, Executive Summary, Broward County Transportation Planning Division, 1995.

City of Fort Lauderdale Comprehensive Plan (Ordinance C-08-18) Volume II – Transportation Element Page 8-88
Currently, the Broward County’s bikeways network has a LOC of E, which means that less than 20 percent of the major public transit attractors are accessible through the bikeways network. Based on this LOC, the primary need is to develop a bicycle network that will provide access to a majority of the major public transit attractors.
4. Pedestrian network. The summary of existing needs included in this subsection is based upon the Broward County Pedestrian Facilities Plan. The primary need of both the state and the county sidewalk systems is to improve connectivity and access to public transit by completing missing linkages.
5. Waterways network. A significant trend in the marine industry has been the increase in the number of ships using the navigable waterways. The projected increase in boat traffic is resulting in proposed regulations that would prohibit the construction, reconstruction, and substantial rehabilitation of any structure within 622 feet of the main channel. The increase from 25 feet to 622 feet is intended to provide a wider area for boats to navigate along the ICW and to create a safer passage for smaller boats needing to get around large vessels, as well as to create enough space for barges to pass side by side.
Another significant trend in the marine industry is that ships are getting larger. To accommodate these large capacity cruise ships efficiently, the essential portside requirements are deeper water, larger terminals, and sufficient parking. Container ships also are getting larger. Some of the largest now carry 4,000 to 5,000 Twenty-foot Equivalent Units (TEUs), and even larger ships are planned. To accommodate these ships efficiently, the essential portside requirements are deeper water and faster-moving container cargo cranes with a longer reach along births that can support them. But these ships also impose significant landside access requirements. If the containers they carry are to be moved by truck, then uncongested roadway connections must be provided; if they are to be moved by rail, unimpeded rail connections are required. In the latter case, this means as few possible grade crossings and, increasingly, provisions for double-stack trains. Efficient intermodal container transfer yards also are required to maximize port throughput. Port Everglades maintains five-year and ten-year capital improvements programs that identify the infrastructure improvements necessary to meet projected needs.
As noted above, to facilitate passenger and container cruise traffic, uncongested roadway connections must be provided. The Fort Lauderdale Airport/Seaport Multimodal Connector is presently under study.
To remain competitive in the future, Port Everglades will require unimpeded rail connections. This means as few possible grade crossings and, increasingly, provisions for double-stack trains. A near dock Intermodal Container Transfer Facility, rail yard, and a rail/barge intermodal facility are being planned in Southport.

City of Fort Lauderdale Comprehensive Plan (Ordinance C-08-18) Volume II – Transportation Element Page 8-89
6. Airports and related facilities. Broward County is responsible for long term planning for Fort Lauderdale-Hollywood International Airport. The City is currently working on a long-term master plan for Fort Lauderdale Executive Airport.
7. Railways network. Projected railway network needs are based on the Tri-County Rail Master Plan, the Transit Development Plan, Fiscal Year 1997 Update, the 1996 Florida Rail System Plan.
8. Intermodal facilities. The Transportation Development Plan is updated annually by the transportation Department and by BCT and SFRTA. The analysis focuses on terminals, connections, high occupancy vehicle lanes, and park-and-ride lots.
9. Terminals. Within the 5-Year Capital Improvement Plan, there are several important projects that stand out as unfunded – Smart Card Implementation, expansion of the shuttle bus service, modifications to stations to improve pedestrian and vehicular access. It would appear that these projects could be likely candidates for SIS funding. Within the 5-Year Operating Budget, the operating cost of implementing Phase B Project and the region-wide Smart Card system cannot be supported under current funding forecasts. The operating short fall over the span of the TDP is about $81 million if these projects are implemented. The following presents the programmed and proposed projects for the fiscal years 2006-2010 and several long-term projected intermodal needs around each Tri-Rail station in Fort Lauderdale: Fort Lauderdale Station – Improvement needed is additional signage in
and around the station. Additional improvements needed also include increasing parking and filling in sidewalk gaps. Passenger amenities and access improvements.
Cypress Creek Station – This station needs to upgrade the pedestrian and transit infrastructure. This area also needs improvements with the ingress and egress to station, signage and increasing the parking area. One additional bus is needed to meet the 20-minute headways at the station.
10. Connections. A Major Investment Study (MIS) is currently underway to develop alternatives for an intermodal connection between the Port and the Airport. Additionally, the Major Investment Study should identify the most appropriate technology, anticipating that potential technologies range from fixed-guideway systems to special public transit buses operating primarily in mixed traffic with some priority treatment.
11. High occupancy vehicle (HOV) lanes. Presently, I-595 is overcapacity. Thus, there is a need for exploring the feasibility of establishing HOV lanes on

City of Fort Lauderdale Comprehensive Plan (Ordinance C-08-18) Volume II – Transportation Element Page 8-90
this facility. There is also a need for promotion of HOV lanes, enforcement, and improving safety.
12. Park-and-ride lots. While Fort Lauderdale’s existing park and ride lots are underutilized, there may be a need for additional well-located facilities in the future.
F. Maintaining the adopted level of service standards. Prior to discussing how Fort Lauderdale can maintain the adopted transportation LOS standards (as described in Section 2. Data Requirements, Transportation LOS Standards), several caveats are in order. First, the transportation system is a function of prior land use decisions and development approvals. These land use decisions include decisions on: the location and intensity of built development and constructed roadways; the location and intensity of approved but unbuilt (i.e., vested) development; and public transit investments. Second, dynamic regional growth and travel within the region can impact the transportation system and the maintenance of LOS standards. For example, a development of regional impact creating new lower income jobs without a commensurate increase in lower cost housing can result in cross-county travel, producing unexpected impacts on the LOS standard. Third, the availability of transportation funding, especially at the federal level, can greatly influence the City’s ability to maintain the adopted LOS standard. Finally, unexpected events (such as an energy crisis or new technology) can impact the maintenance of the adopted LOS standard. Notwithstanding these dynamics, Fort Lauderdale can employ several strategies or tactics to help maintain its adopted transportation level of service (LOS) standards. These include implementation of a concurrency management system, transportation system management, and transportation demand management. This section also addresses maintaining the LOS standard on the SIS.
1. Concurrency Management System (CMS). The CMS is the procedures and processes employed by Fort Lauderdale to assure that development orders and permits are not issued unless the necessary facilities and services are available concurrent with the impacts of development. The City of Fort Lauderdale’s Concurrency Management System requires each proposed development undergo a concurrency review prior to the issuance of any development order or permit.
Transit Orientated Concurrency Process
a. Based on recommendations by the Broward County MPO, the Broward County Commission adopted a five-year Transit Development Plan (TDP) that is projected to achieve the level of service standards for each District. The County Commission shall ensure that the TDP is a financially

City of Fort Lauderdale Comprehensive Plan (Ordinance C-08-18) Volume II – Transportation Element Page 8-91
feasible plan. The TDP is updated annually. Building permit applications require concurrency satisfaction. Prior to application for a building permit, the applicant shall obtain a Transportation Concurrency Satisfaction Certificate from Broward County. Fort Lauderdale will not accept a building permit application, nor issue a building permit, unless the corresponding Transportation Concurrency Satisfaction Certificate has been presented. The County Commission may adopt land development regulations that are exempt from these requirement categories of building permits that clearly do not create additional transportation impacts. Based on the Broward County Charter and the Land Use Plan, land development approvals in Broward County are a shared function between the County Commission and Fort Lauderdale. If platting is required, all plats must be approved by the City and then by the County. Site plan approvals and the issuance of building permits are City functions. Prior to any building permit application with the City, plans must be approved relative to County environmental regulations by the Broward County Environmental Protection Department (EPD). A Transportation Concurrency Satisfaction Certificate can be obtained from the County’s Development Management Division at the same time as the EPD Approval is obtained from the Land Use and Permit Division, prior to application for a building permit. Concerning categories of building permits that clearly do not create additional transportation impacts, staff will recommend, at a minimum that permits that do not require EPD environmental approval will also not require a Transportation Concurrency Satisfaction Certificate.
Broward County shall issue a Transportation Concurrency Satisfaction Certificate, relative to a building permit application, under any of the following circumstances:
a. If the building permit application is on property within a recorded plat that was approved by the County Commission on or after March 20, 1979, and before the effective date of Amendment 04-2-T1; and the building permit application is consistent with the level of development under which the plat is currently approved by the County Commission; and the County Commission’s finding of satisfaction of transportation concurrency for the plat has not expired; and the plat is not in violation of an agreement with Broward County with respect to transportation concurrency.

City of Fort Lauderdale Comprehensive Plan (Ordinance C-08-18)Volume II – Transportation Element Page 8-92
b. If the building permit application is on property for which Broward County has made a finding of vested rights with respect to transportation concurrency; and the building permit application is consistent with the level of development under which the plat was approved by the County Commission; and the plat is not in violation of an agreement with Broward County with respect to transportation concurrency. c. If the building permit application is for property within, and for development in accordance with and as authorized by, an approved Development of Regional Impact (DRI) or a Florida Quality Development (FQD) development order which development order was either issued prior to the adoption of the 1989 Broward County Comprehensive Plan or was issued after being reviewed for, and satisfying, Broward County’s transportation concurrency requirements. d. If the building permit application is for property within a transit oriented concurrency district; and the applicant has paid to Broward County a Transit Concurrency Assessment, as described in the Broward County Comprehensive Plan Transportation Element Policy 3.4.7, for the development proposed in the building permit application. e. If the building permit application is for property within a transit oriented concurrency district; and the application is for an addition to, replacement of, or renovation to a residential building, and does not increase the number of dwelling units within that building nor change the type of units. f. If the building permit application is for property within a transit oriented concurrency district; and the application is for an addition to, replacement of, or renovation to a non-residential building, and does not increase the number of peak-hour trips generated by the building. g. If the building permit application is for property within a standard concurrency district; and the application is for property within a recorded plat that was approved by the County Commission after the effective date of Amendment 04-2-T1; and a finding of satisfaction of transportation

City of Fort Lauderdale Comprehensive Plan (Ordinance C-08-18) Volume II – Transportation Element Page 8-93
concurrency was made for that plat by the County Commission in accordance with Broward County Comprehensive Plan Transportation Element Policy 3.4.12, and has not expired; and the building permit application is consistent with the level of development under which the plat is currently approved by the County Commission; and the plat is not in violation of an agreement with Broward County with regard to transportation concurrency. h. If the building permit application is for property within a standard concurrency district, and the application is for one single family or duplex unit, and the property is not within a recorded plat that was approved by the County Commission on or after March 20, 1979, and the impact of the proposed development would not exceed the adopted LOS standard of any affected designated hurricane evacuation routes. i. If the building permit application is for development that promotes public transportation, which means development that directly affects the provision of public transit, including transit terminals, transit lines and routes, separate lanes for the exclusive use of public transit services, transit stops (shelters and stations), and office buildings or projects that include fixed-rail or transit terminals as part of the building.
Development within a recorded plat for which road impact fees have been paid, or for which concurrency has already been satisfied, would not be subject to concurrency again at the building permit stage. March 20, 1979 is the date when Broward County began assessing road impact fees. The number of trips generated by a proposed development will be calculated based on peak-hour trip generation rates adopted by the County Commission. Previous use of a de minimis exception to concurrency have been based on the idea that it was too burdensome for a very small project to satisfy concurrency requirements, and that there were few mitigation measures of a scale suitable for very small impacts. Under these policies, this rationale is no longer valid, and the process is made convenient for the applicant. Therefore, no de minimis provision is included in these policies.
b. Transit Concurrency Assessment. A Transit Concurrency Assessment

City of Fort Lauderdale Comprehensive Plan (Ordinance C-08-18) Volume II – Transportation Element Page 8-94
is calculated as the total peak-hour trip generation of the proposed development, multiplied by a constant (for each year) dollar figure for each District that represents the cost per trip of all the Transit Development Plan (TDP) enhancements in that District. The County Commission may adopt land development regulations that enable exemption from the assessment calculation of high-cost transit projects, such as fixed-guideway facilities.
The assessment amount for each District is to be calculated using the following formula:
Assessment = Project Trip x Trip Length x District TDP Cost ) 1.31 ) 2
Generation Factor District TDP Trips
Project Trip Generation is the number of p.m. peak hour vehicle trips generated by the proposed development, using generation rates adopted by the County Commission, based primarily on the latest edition of Trip Generation from the Institute of Transportation Engineers. Trip Length Factor is a factor intended to account for the differences in trip lengths among categories of land use. The factor is based on data showing that, generally, the average Home Based work trip is 50 percent longer than the average for other trip purposes. Therefore, based on the relative proportion of Home Based Work trips for each major type of land use, a discount factor has been introduced to account for the expected shorter trip lengths. District TDP Cost is the projected cost of the projects in the adopted TDP, which are wholly or partially within the district. For projects that cross district lines, costs are prorated among the affected districts. Costs will include the one-time capital costs and the multi-year operational costs displayed in the TDP. Transit industry standards, supported by experience in Broward County, indicate that a three-year period is required to establish a steady ridership pattern for new service. Therefore, three years of operational costs will be included in the TDP for new or enhanced service. After three years, enhancements will be considered as Αexisting service≅ and will no longer be included in the assessment calculation. Some projects in the TDP cannot be accurately quantified as to their benefits, in terms of ridership. These projects will be excluded from the cost calculation, and are not part of the concurrency assessment. In addition, the County Commission may exempt from this calculation certain types of transit improvements that, because of high cost, would make the concurrency assessment unreasonable, in terms of its impact

City of Fort Lauderdale Comprehensive Plan (Ordinance C-08-18) Volume II – Transportation Element Page 8-95
on development costs. This exemption would be detailed in the Broward County Land Development Code. District TDP Trips are the projected increase in daily transit trips that will result from the TDP improvements in a particular district. As with costs, the increase in trips from a project will be pro-rated among districts as appropriate. Projects deleted from the cost calculations, for either of the reasons cited above, will also be deleted from the trips calculations. Conversion from Person-Trips to Vehicle Trips: Because the cost per trip ratio is based on transit trips, this ratio is expressed in person trips. However, the trip generation rates are expressed in vehicle trips. The cost per trip ratio is converted to vehicle trips by using the vehicle occupancy ratio of 1.31, which is from the Southeast Florida Regional Travel Characteristics Study (October, 2000). Elimination of Double-Counting of Trips: Because the trip generation rates produce trip-ends, and each trip is (theoretically) assessed at both ends, the total number of trips generated by a proposed development should be divided by two, to avoid double-counting of trips in the assessment calculation. This continues a practice that has been followed in Broward County since the inception of transportation concurrency in 1989. c. Credit for Transit Oriented Development. The Broward County Commission shall adopt land development regulations that provide for credits against the Transit Concurrency Assessment for approved site plans that contain features intended to significantly encourage transit usage. The following lists Transit-Oriented Design features: • Centrally located transit stop or station; • Walkable, with pedestrian network; • Buildings at street line - no setbacks; • Transit supportive density; • Parking ratios lower where transit is available; • Cluster buildings for more efficient transit; • Grids not cul-de-sacs; high street connectivity, small block
circumferences • Mix the uses to limit trips (commercial, mixed residential and
office); • Integration of transit stops and necessary shelter; • Landscaped pedestrian and bicycle paths; and • Efficient bicycle and pedestrian networks that minimize conflicts
with the automobile. • Public plazas, small usable green spaces and civic functions.

City of Fort Lauderdale Comprehensive Plan (Ordinance C-08-18) Volume II – Transportation Element Page 8-96
d. Waivers. The Broward County Commission may adopt land development regulations which provide for a waiver of the Transit Concurrency Assessment for affordable housing projects, and for applications by a government agency for the construction of public buildings which will directly serve the health and/or safety needs of the public, provided that all such waived Assessments are paid from a designated source. Examples of the health and safety waiver category include police stations, fire/EMS facilities, public hospitals and clinics. General-purpose government facilities, such as libraries and offices, would not be covered under this policy. The revenues from the Transit Concurrency Assessments shall be used solely to fund the enhancements within the TDP that are in the District corresponding to the location of the proposed development. However, the Broward County Commission may adopt land development regulations that set aside up to five percent of such revenues for the following purposes:
1. To serve as the designated funding source for waivers and/or 2. To fund costs of administering the concurrency management system and developing the TDP.
Revenues will not be earmarked for specific TDP projects, but will be placed in a fund to be used for the entire District. For enhancements that cross district boundaries, the project costs will be pro rated among the affected Districts. e. Concurrency Finding at Plat Stage. Prior to the approval of any application for a plat, an amendment to the restrictive note on the plat, the placement of a restrictive note on the plat, or a new finding of adequacy for a plat, for property within a Transit Oriented Concurrency District, the County Commission shall make a finding that the appropriate District satisfies at least one of the following standards:
1. The District does not contain two parallel and adjacent arterial roadways, both of which have a volume/capacity ratio in excess of 1.30, which ratio is derived by comparing existing p.m. peak hour traffic volumes to LOS D peak hour capacities (LOS E for the Eastern Core District). 2. The ridership within the District on fixed route transit services has increased at least 2 2 percent over the previous year.

City of Fort Lauderdale Comprehensive Plan (Ordinance C-08-18) Volume II – Transportation Element Page 8-97
Local Road Concurrency
b. Conditions to Satisfy Concurrency Requirements. The City of Fort Lauderdale’s Concurrency Management System requires each proposed development undergo a concurrency review prior to the issuance of any development order or permit. The City’s transportation Concurrency Management System requires any project with greater than 1,000 average daily trips provide a traffic impact study. If a project’s daily trip generation is less than 1,000 trips, and when more than 20 percent of the total daily trips are anticipated to arrive or depart, or both, within one-half hour (30 minutes); or when the proposed use creates varying trip generation each day, but has the potential to place more than 20 percent of its maximum 24-hour trip generation onto the adjacent transportation system within a one-half hour (30 minute) period; the applicant shall submit a traffic impact analysis prepared by the county or a registered Florida engineer experienced in traffic impact analyses. The development will bear an equitable and proportionate fair share of the cost of providing new or expanded public facilities required to maintain adopted levels of service through mechanisms such as transit concurrency fees and developer contributions pursuant to the City’s land development regulations.
2. Transportation System Management (TSM). TSM means improving roads, intersections, and other related facilities to make the existing transportation system operate more efficiently. TSM techniques include demand management strategies, incident management strategies, and other actions that increase the operating efficiency of the existing system.
a. Roadway improvements. In lieu of traditional widening and construction, alternative solutions are proposed in order to eliminate traffic problems. The City and County, in conjunction with FDOT, have taken the following actions on congested links:
- Corridor studies to develop Transportation Systems Management/Demand management.
- Establishment of a Congestion Management System to
identify problem corridors and coordinate improvements. b. Intersection improvements. Adding a turning lane at an intersection is another TSM technique.

City of Fort Lauderdale Comprehensive Plan (Ordinance C-08-18) Volume II – Transportation Element Page 8-98
c. Access management. Access management is the control and regulation of spacing and design of driveways, ramps, medians, median openings, traffic signals and intersections on arterial and collector roads to improve safe and efficient traffic flow on the road system. d. Signalization. Computerization of signals on roadways has been recognized as one of most effective ways to improve the traffic flows.
3. Transportation Demand Management (TDM). TDM means strategies and techniques that can be used to increase the efficiency of the transportation system. Demand management focuses on ways of influencing the amount and demand for transportation by encouraging alternatives to the single-occupant automobile and by altering peak hour travel demand. These strategies and techniques include: ridesharing programs, flexible work hours, telecommuting, shuttle services, and parking management. TDM also is effective at lower residential densities than are required for public transit and pedestrian and bicycle programs.
a. Ridesharing programs. Ridesharing is a form of transportation, other than public transit, in which more than one person shares the use of the vehicle, such as a car or van, to make a trip. Ridesharing requires only moderate densities at the home-end of trips and a common work destination; long commutes are actually conducive to ridesharing since time lost in picking up other passengers is balanced by real cost savings on the commute itself. b. Flexible work hours. Flexible work hours are a TDM strategy that allows employees to schedule their work hours so as to avoid driving during the peak hours. Flexible work hour strategies include flextime, staggered work hours, and compressed work schedules. These strategies are well-suited to low and medium densities, where traffic congestion is short-lived. Flextime is a TDM strategy allowing employees to chose the work day arrival and departure times that best suit their personal schedules on a daily basis. Staggered work hours means workday arrival and departure times are staggered by the employer according to a predetermined schedule. c. Telecommuting. Telecommuting is completely independent of densities since employees work at home instead of commuting to work. Constraints on telecommuting relate to the job itself, not its location. Only workers in information-oriented jobs are candidates. d. Shuttle services. This TDM strategy uses buses, vans and cars to provide transportation from remote parking locations to the workplace.

City of Fort Lauderdale Comprehensive Plan (Ordinance C-08-18) Volume II – Transportation Element Page 8-99
e. Parking management. Parking management can be an effective strategy for maintaining the adopted LOS standard, for improving mobility, and for improving air quality. Parking management strategies include preferred parking, price parking, parking limitations, and shared parking. Preferred parking is a transportation demand management strategy that gives certain users, such as carpoolers and the disabled, the most convenient parking spaces, such as a location closer to the building or a covered parking space. Price parking has proven to be one of the most effective transportation demand management strategy for maintaining and improving the LOS and mobility. Price parking employs a fee for use of a parking space. Parking limitations is another transportation demand management strategy that is effective in maintaining and improving LOS and mobility. Land development regulations typically establish minimum off-street parking requirements far in excess of normal needs, that is, parking requirements are typically set for peak demand. Amending the land development regulations to bring parking supply in line with parking demand could help reduce the number of solo commuters. Shared parking is a transportation demand management strategy that occurs when two or more enterprises, such as a retail establishment and an office building, are able to use one combined parking area, either public or privately owned. Shared parking works well between adjacent enterprises that have their busiest times at different parts of the day.
f. Corridor Studies. In coordination with the MPO and FDOT, Fort Lauderdale has taken an active role in the preparation of corridor studies. To date, corridor studies have been prepared for Broward Blvd, Oakland Park Blvd, State Road 7, North US-1and Sunrise Blvd. Related to the State Road 7 Corridor, the study initially provided for transit improvements such as bus lanes, express service, and improved passenger and pedestrian amenities. At the same time, transit supportive land use and urban design policies have been put in to place to encourage transit – oriented development and redevelopment along the corridor. The SR 7 corridor has also been identified as a transportation corridor of regional significance. During the past ten years Broward County emphasis has shifted from roadway construction to a more balance multimodal system, as reflected in the most recent corridor studies.

City of Fort Lauderdale Comprehensive Plan (Ordinance C-08-18) Volume II – Transportation Element Page 8-100
g. Congestion Management Plan (CMP). Broward County has completed a Congestion Management Plan (CMP). The strategies developed within the Congestion Management Plan, addresses multi-modal corridor studies. The CMP includes the following:
- Establishment of measures and standards to assess mobility patterns and the performance of roadways and transit systems;
- Identification of congested corridors and areas;
- Identification of short and long range transportation strategies;
- Establishment of a monitoring process to assess the
effectiveness of the congestion management strategies. The current Broward County CMP also lists projects to mitigate congestion and improve the operational level of service on the corridors. It is organized alphabetically by corridor, and within each corridor, by recommended priority of implementation. The recommended projects are prioritized based on cost effectiveness and on public input; therefore, the Plan is a set of implementable congestion strategies. A cost estimate and a possible funding source, if identified, is listed alongside each project. And these projects also have been presented as candidates for inclusion on Broward County’s priority list in the TIP.
4. Strategic Intermodal System (SIS) was designated for interregional and intrastate functions. Even though most of the traffic on the SIS today is local traffic making trips less than 25 miles in length, it is still vital for FDOT and Broward County to establish methods of monitoring the impacts on the system and strategies to facilitate local traffic to use alternatives to the system to protect its interregional function.
a. SIS/FIHS impacts monitoring report. Table 29 shows the peak hour traffic and volume to capacity ratios for FIHS segments for 2005 and 2030.

City of Fort Lauderdale Comprehensive Plan (Ordinance C-08-18) Volume II – Transportation Element Page 8-101
Table 29 Peak Hour Traffic and Volume to Capacity Ratio For FIHS/SIS Segments within Fort Lauderdale
FIHS/SIS
Segment
2005 Peak Hour
Volume
V/C
2030 Peak Hour
Volume
V/C
I-95
Broward / Miami-Dade County line to Commercial Blvd
24,056 1.42 32,179 1.90
I-595
SR 7 to US 1
12,680
0.94
19,224
1.24
Source: Appendices 3 – E and 3 - F, Roadway Level of Service Analysis, Broward County Transportation Planning Division, 2006.
b. Strategies to relieve traffic from the SIS. Strategies to help relieve SIS traffic include improving transportation facilities that are parallel to SIS roads. These strategies are premised on the assumption that improving roads and transit services parallel to SIS roads will make those roads more attractive as a means of travel. These strategies include improving roadway and public transit LOS including implementation of the congestion management plan and use of transit-oriented design. Four additional strategies relate to public transit. These include enhancing feeder bus service to Tri-Rail, expanding community/municipal bus service, improving access to transit, and public education. Another strategy provides for connecting discontinuous roadways, particularly the NW 7th/9th Avenue Connector project in Fort Lauderdale. This project is designed to connect the two arterial roads south of Sunrise Boulevard. This north/south corridor is approximately one mile east of I-95. Another strategy addresses implementation of an intelligent transportation system (ITS). ITS consists of the use of technology, in whatever form, to assist motorists in the safe and efficient use of the transportation system. It includes the computerized traffic signal system, a new ITS control center for Broward County, the I-595 Changeable Message Sign System, variable messages signs for the bridge crossings of the Intracoastal Waterway, cameras for surveillance and vehicle detection, incident

City of Fort Lauderdale Comprehensive Plan (Ordinance C-08-18) Volume II – Transportation Element Page 8-102
management, emergency management, motorist information system via the use of radio on the Florida Turnpike, and transit vehicle locator system, and the Tri-Rail information system. Yet another strategy provides for working with the County to establish public transportation corridors. The designation is an initial step toward the corridor receiving funding and program consideration in subsequent program years to mitigate traffic congestion and further mobility through transit enhancements. c. Coordination with FDOT. The final strategy calls for annually monitoring and evaluating the LOS on the SIS in order to determine whether the strategies are actually relieving traffic. If not, the policy provides for identifying additional strategies in coordination with the FDOT and the MPO.
G. Consistency between the Future Land Use Element, transportation systems and other plans. This section addresses Rule 9J-5.019(3)(d), FAC, which requires an analysis of the compatibility/consistency of the future land use and transportation elements; Rule 9J-5.019(3)g), FAC, requires an analysis that considers the compatibility/consistency of the Transportation Element with the policies and guidelines of other transportation plans; and Rule 9J-5.019(3)(h) and (I), FAC, which requires an analysis of compatibility/consistency with other elements of the Comprehensive Plan.
1. Broward County Land Use Plan. The Broward County Charter establishes the Broward County Planning Council (BCPC). The BCPC is responsible for preparing a countywide land use plan, known as the Broward County Land Use Plan (BCLUP), for adoption by the Board of County Commissioners. Fort Lauderdale’s Future Land Use Element and map amendments must be consistent with the BCLUP. Through certification of future land use elements subsequent to a Department of Community Affairs determination of compliance, consistency between future land use elements and the transportation system are assured.
The BCPC has jurisdiction over the Trafficways Plan, a right-of-way identification map. To accommodate the impacts of new development, right-of-way is required from developing parcels to provide for an adequate regional roadway network. A dedication for at least half of the roadway width that the Trafficways Plan calls for is normally required at the platting stage. No plat of lands lying within Fort Lauderdale may be recorded in the Official Records prior to approval by the County Commission.
2. MPO Long Range Transportation Plan. The Long Range Transportation Plan (LRTP) is the primary source for identifying priority projects for inclusion in the Transportation Improvement Program (TIP) and guides the expenditure of

City of Fort Lauderdale Comprehensive Plan (Ordinance C-08-18) Volume II – Transportation Element Page 8-103
federal, state, and local transportation funds. It provides a coordinated planning effort to mitigate traffic congestion, minimize reconstruction of existing facilities, and allow for adjustment of growth management policies and transportation strategies. The 2030 LRTP consists of eleven major sections: 1. Public Involvement Plan 2. Goals and Objectives 3. Data Compilation 4. Model Evaluation 5. Needs Assessment 6. Regional Plan 7. Financial Resources 8. Coast Feasible Plan 9. Air Quality 10. Environmental Justice 11. Environmental Transportation Decisionmaking The Broward County 2030 LRTP that was adopted by the MPO, represents the currently adopted LRTP. The Year 2030 LRTP’s goals, objectives and policies are consistent with the provisions of the Transportation Efficiency Act of the 21 Century (TEA-21), under which seven specific factors were identified. One of its goals is to provide a balanced multi-modal transportation system with a mixture of roadways and transit services that provides for the local and regional movement of people and goods. The Year 2030 LRTP served as the basis for some of the data and analysis used in the development of this Support Document.
3. Year 2030 Cost Feasible Plan (CFP). The Year 2030 CFP, which was adopted by the MPO, is a transportation plan that identifies major capacity-enhancing improvements recommended for implementation based on projected fund availability. The CFP serves as the basis for funding of the county’s roadway and transit programs, bicycle plan, pedestrian plan, and seaport and airport master plans. In aggregate, the cost for all of the projects contained in the Cost-Feasible Plan must be within the anticipated revenue that is expected to be available for these projects. The cost for each mode of the Long Range Transportation Plan is summarized in Table 30.
Table 30 Year 2030 Cost Feasible Transportation Plan
Projects in Fort Lauderdale
Mode # of Projects
Operating Subsidy ($000) Capital Cost ($000)
Highway 6 0 221,177 Bicycle 21 0 23,071 Pedestrian 24 0 3,359 Transit 9 1,036,689 2,338,737 Greenway 2 0 38,000 Waterborne 5 43,470 5,370 Source: Broward County Year 2030 Long-Range Transportation Plan, Final Report 2005.

City of Fort Lauderdale Comprehensive Plan (Ordinance C-08-18) Volume II – Transportation Element Page 8-104
A. Highway. Map 20 shows the location of all highway projects in the Cost-Feasible Long Range Plan. Table 31 lists those projects.
Table 31
Year 2030 Cost Feasible Highway Transportation Plan Projects in Fort Lauderdale
Number Project Name Segment Description Cost ($000)4 Andrews Ave. Davie to Sunrise Corridor Improvement 1,000 44 I-595 I-75 to US-1 Causeway
Improvement 151,800
52 McNab Rd/Comm. Blvd.
Sawgrass to I-95 Transit/Corridor Improvement
10,000
62 NW 7/9 Ave Connector Sunrise to NW 6 St. New 4 lanes divided 40,000 64 NW 21/23 Ave. Sunrise to Oakland From 3 to 4 lanes 17,377 90 SE/NE 3 Ave Davie to Sunrise Corridor Improvement 1,000
B. Bicycle. Map 21 shows the location of all bicycle projects in the Cost-
Feasible Long Range Plan. Table 32 lists those projects.
Table 32 Year 2030 Cost Feasible Bicycle Transportation Plan
Projects in Fort Lauderdale
Number Street Name Limits Cost ($000) 1 Andrews Avenue Prospect Road to NE 62 Street 1,165 2 Andrews Avenue Sunrise to Oakland 1,540 10 Commercial Blvd. NE 15 Avenue to US-1 521 11 Commercial Blvd. US-1 to ICWW 687 13 Cypress Creek Road Dixie Highway to US-1 1,118 14 Davie Blvd. I-95 to SE 3 Avenue 200 20 Federal Highway Broward to Sunrise 776 21 Federal Highway Sunrise to Oakland 1,620 22 Federal Highway Commercial to Atlantic 2,261 42 NE 56 Street Dixie Highway to US-1 975 49 NW 6 Street NW 27 Avenue to Federal Highway 1,891 50 NW 7 Avenue Broward to Sunrise 365 59 Powerline Road Prospect Road to Atlantic Blvd. 2,585 60 Prospect Road Commercial Blvd. to Dixie Highway 2,048 61 Prospect Road SR 7 to Commercial Blvd. 1,653 78 SR 84 I-95 to US-1 1,493 80 Sunrise Blvd. I-95 to NW 15 Avenue 359 81 Sunrise Blvd. US-1 to Middle River 385 82 Sunrise Blvd. North Birch Road to A1A 111 86 SW 4 Avenue SR 84 to Davie Blvd. 116 87 SW 4 Ave/SW 7 Ave. SW 7 Street to Broward Blvd. 1,202

City of Fort Lauderdale Comprehensive Plan (Ordinance C-08-18) Volume II – Transportation Element Page 8-105
C. Pedestrian. Map 22 shows the location of all pedestrian projects in the Cost-Feasible Long Range Plan. Table 33 lists those projects.
Table 33
Year 2030 Cost Feasible Pedestrian Transportation Plan Projects in Fort Lauderdale
Number Street Name Limits Cost ($000) 8 Bayview Dr Sunrise to Oakland 455 30 McNab Road Palm Aire Dr. to Powerline Road 224 31 Miami Road Federal Hwy. To SE 19 Street 125 32 Miami Road SE 17th Street to SE 12 Street 168 36 NE 4 Street NE 3 Avenue to Federal Highway 46 37 NE 4 Street Federal Highway to SE 19 Street 85 39 NE 62 Street Dixie Highway to NE 18 Terrace 139 41 NE 6 Street Andrews Avenue to Federal Highway 89 44 NW 11 Avenue SW 5 Place to NW 4 Street 167 45 NW 12 Avenue Commercial Blvd. to Cypress Creek Road 135 49 NW 21 Avenue NW 62 Street to NcNab Road 113 51 NW 31 Avenue Commercial Blvd. and Cypress Lake Drive 19 52 NW 31 Avenue Prospect Road to NW 62 Street 117 57 NW 4 Street NW 1 Avenue to Andrews Avenue 14 60 NW 62 Street SW 71 Avenue to NW 35 Avenue 387 61 NW 62 Street NW 35 Avenue to NW 29 Avenue 153 69 NW 9 Avenue NW 62 Street to SW 3 Street 357 74 Prospect Road SR 7 to SW 31 Avenue 227 81 SE 10 Avenue SE 17 Street to Davie Road 116 82 SE 12 Street S. Miami Road to SE 10 Avenue 53 88 SE 9 Street SW 9 Avenue to Federal Highway 227 110 SW 28 Street SW 15 Street to SW 2 Avenue 252 111 SW 2 Avenue SW 26 Street to SR 84 29 113 SW 4 Avenue SR 84 to SW 20 Street 58
D. Transit. Map 23 shows the location of all transit projects in the Cost-Feasible Long Range Plan. Table 34 lists those projects.

City of Fort Lauderdale Comprehensive Plan (Ordinance C-08-18) Volume II – Transportation Element Page 8-106
Table 34 Year 2030 Cost Feasible Transit Plan
Projects in Fort Lauderdale
No.
Project Type
Project Name
Limits
Operating Subsidy ($000)
Capital Cost
($000) 1 Automated
People Mover APM FLL to Port Everglades 0 1,150,00
0 2 Light Rail Transit Downtown Light Rail Downtown Ft. Lauderdale 30,986 51,042 3 Light Rail Transit FEC RR Transit
Corridor Miami-Dade Co. to Palm Beach Co.
50,802 402,895
4 Light Rail Transit Central Broward E/W
Sawgrass Mills to FLL 30,826 600,000
5 Bus Rapid Transit SR 7 Transit Bridge Miami-Dade Co. to Palm Beach Co.
10,852 51,000
7 Bus Rapid Transit Oakland Park Blvd. Sawgrass Mills to Downtown
49,153 40,030
13 Express Bus Cypress Creek/McNab
Sawgrass Mills to Downtown
16,196 3,150
15 Express Bus Powerline Road Downtown to Palm Beach 26,556 4,410 18 Express Bus Sunrise Blvd. Sawgrass Mills to
Downtown 43,220 4,410
Table 35
Year 2030 Cost Feasible Transit Operations Plan Projects in Fort Lauderdale
Project Type
Service Improvement
Route Numbers
Operating Subsidy ($000)
Capital Cost
($000) Local Operations 2010 to 2030 TTF Local Transit Operations 753,690 0 Regular Bus Weekdays 10 minute
headways 1,18,36 and 72 5,171 7,800
Regular Bus Weekdays 15 minute headways
2,14,31,40,50, and 60 4,575 6,900
Regular Bus Weekdays 20 minute headways
7,10,11,28, and 83 3,381 5,100
Regular Bus Weekdays 30 minute headways
3,5,9,15,20,55, and 62 3,035 4,500
Regular Bus Weekdays 40 minute headways
57 184 300
Regular Bus Saturday headways 2,9,14,15,31,50 and 55 624 0 Regular Bus Sunday/Holiday
headways 6,7,9,10,11,14,15,30,40,50,55,81 and 83
893 0
Regular Bus 6 new routes Galleria to Aventura 6,545 7,200

W SUNRISE BLVD
W BROWARD BLVD
DAVIE BLVD
SR 84
N S
R 7
OAKLAND PARK BLVD
COMMERCIAL BLVD
NW 62ND ST
S F
ED
ER
AL
HW
Y
N F
ED
ER
AL
HW
YE LAS OLAS BLVD
N A
TLA
NT
IC B
LVD
NW
31S
T A
VE
INT
ER
STA
TE 9
5NW 19 ST
AT
LAN
TIC
OC
EA
N
FLO
RIDA T
URNPIKE
AN
DR
EW
S A
VE
N D
IXIE
HW
Y
NE 13 ST
I-595
SE 17 ST
NW
27
AV
E
SISTRUNK BLVD
MCNAB RD
Fort Lauderdale /Hollywood
International Airport
PortEverglades
44
52
904
64
62
DATA SOURCE: BROWARD COUNTY METROPOLITAN PLANNING PLANNING ORGANIZATION (MPO)MAP SOURCE: CITY OF FORT LAUDERDALE PLANNING & ZONING DEPARTMENT- JULY, 2006
BROWARD COUNTY 2030 LONG RANGE TRANSPORTATIONPLAN / COST FEASIBLE HIGHWAY PROJECTS
0 1 20.5Miles
Legend
CITY LIMITS
WATER
LRTP HIGHWAY PROJECTS
MAP 20

W SUNRISE BLVD
W BROWARD BLVD
DAVIE BLVD
SR 84
N S
R 7
OAKLAND PARK BLVD
COMMERCIAL BLVD
NW 62ND ST
S F
ED
ER
AL
HW
Y
N F
ED
ER
AL
HW
YE LAS OLAS BLVD
N A
TLA
NT
IC B
LVD
NW
31S
T A
VE
INT
ER
STA
TE 9
5NW 19 ST
AT
LAN
TIC
OC
EA
N
FLO
RIDA T
URNPIKE
AN
DR
EW
S A
VE
N D
IXIE
HW
Y
NE 13 ST
I-595
SE 17 ST
NW
27
AV
E
SISTRUNK BLVD
MCNAB RD
Fort Lauderdale /Hollywood
International Airport
PortEverglades
60
49
59
61
21
2
78
14
1
13
22
42
20
86
50
10 11
87
8081 82
DATA SOURCE: BROWARD COUNTY METROPOLITAN PLANNING PLANNING ORGANIZATION (MPO)MAP SOURCE: CITY OF FORT LAUDERDALE PLANNING & ZONING DEPARTMENT- JULY, 2006
BROWARD COUNTY 2030 LONG RANGE TRANSPORTATIONPLAN / COST FEASIBLE BICYCLE PROJECTS
0 1 20.5Miles
Legend
CITY LIMITS
WATER
Bicycle Lane Projects
MAP 21

W SUNRISE BLVD
W BROWARD BLVD
DAVIE BLVD
SR 84
N S
R 7
OAKLAND PARK BLVD
COMMERCIAL BLVD
NW 62ND ST
S F
ED
ER
AL
HW
Y
N F
ED
ER
AL
HW
YE LAS OLAS BLVD
N A
TLA
NT
IC B
LVD
NW
31S
T A
VE
INT
ER
STA
TE 9
5NW 19 ST
AT
LAN
TIC
OC
EA
N
FLO
RIDA T
URNPIKE
AN
DR
EW
S A
VE
N D
IXIE
HW
Y
NE 13 ST
I-595
SE 17 ST
NW
27
AV
E
SISTRUNK BLVD
MCNAB RD
Fort Lauderdale /Hollywood
International Airport
PortEverglades
8
88
74
30
44
45
6139
69
31
32
52
81
49
41
37
51
82
36
113
57
110
60
111
DATA SOURCE: BROWARD COUNTY METROPOLITAN PLANNING PLANNING ORGANIZATION (MPO)MAP SOURCE: CITY OF FORT LAUDERDALE PLANNING & ZONING DEPARTMENT- JULY, 2006
BROWARD COUNTY 2030 LONG RANGE TRANSPORTATIONPLAN / COST FEASIBLE PEDESTRIAN PROJECTS
0 1 20.5Miles
Legend
CITY LIMITS
WATER
LRTP PEDESTRIAN PROJECTS
MAP 22

W SUNRISE BLVD
W BROWARD BLVD
DAVIE BLVD
SR 84
N S
R 7
OAKLAND PARK BLVD
COMMERCIAL BLVD
NW 62ND ST
S FE
DE
RAL
HW
Y
N F
EDER
AL H
WY
E LAS OLAS BLVD
N A
TLA
NTI
C B
LVD
NW
31S
T AV
E
INTE
RSTA
TE 9
5NW 19 ST
ATLA
NTI
C O
CE
AN
FLORID
A TURNPIK
E
AND
RE
WS
AVE
N D
IXIE
HW
Y
NE 13 ST
I-595
SE 17 ST
NW
27
AVE
SISTRUNK BLVD
MCNAB RD
Fort Lauderdale /Hollywood
International Airport
PortEverglades
##
# ##
##
#
#
# #
!(3
!(4
TRI-RAIL
!(7
!(5
!(15
!(13
!(18
!(2
!(2
¯DATA SOURCE: BROWARD COUNTY METROPOLITAN PLANNING PLANNING ORGANIZATION (MPO)MAP SOURCE: CITY OF FORT LAUDERDALE PLANNING & ZONING DEPARTMENT- JULY, 2006
BROWARD COUNTY 2030 LONG RANGE TRANSPORTATIONPLAN / COST FEASIBLE TRANSIT PROJECTS
0 1 20.5Miles
Legend
CITY LIMITS
WATER
LRTP TRANSIT PROJECTS
MAP 23

City of Fort Lauderdale Comprehensive Plan (Ordinance C-08-18) Volume II – Transportation Element Page 8-111
E. Greenway. Table 36 lists greenway projects in Fort Lauderdale.
Table 36 Year 2030 Cost Feasible Greenway Plan
Projects in Fort Lauderdale
Project Name Segment Cost ($000) Dixie Highway North Perimeter Road to Palm Beach Co Line 10,000 SR A1A Miami-Dade County line to Palm Beach County line 28,000
F. Waterborne. Table 37 lists waterborne projects in Fort Lauderdale.
Table 37
Year 2030 Cost Feasible Waterborne Transportation Plan Projects in Fort Lauderdale
Project Name
Project Description
Estimated Operating Subsidy1
($000)
Capital Cost $000)
Base Service Hourly service to 22 stops 31,500 370 Increase Frequency 30 minute headways 2,709 0 Downtown Commuters 6:30m to 9:30 service SW 7 Street to
Marina Bay 2,625 0
I-95 Extension West on New River from SW 7 Street to Marina Bay
6,636 2,500
New Terminal Optional locations being considered 0 2,500 The City of Fort Lauderdale’s Transportation Element is consistent with the CFP because the CFP is a component of the LRTP, and the LRTP provided some of the data and analysis used in this Support Document.
4. Florida Department of Transportation's Adopted Work Program. Broward County is in the jurisdiction of FDOT’s District 4; therefore, FDOT District 4’s Work Program for Fiscal Year 2007/08 Through 2012/13 contains Fort Lauderdale’s projects. Priorities in the new 5-year Adopted Work Program are determined by the MPO and are the direct result of the long range planning process that Fort Lauderdale participates in. Projects on a priority list submitted to FDOT for inclusion in the Work Program must appear in the Long Range Plan. The Long Range Plan, in turn, is formulated with the goals and objectives consistent with the Transportation Element. The Work Program, once adopted, forms the basis of the new TIP.

City of Fort Lauderdale Comprehensive Plan (Ordinance C-08-18) Volume II – Transportation Element Page 8-112
5. Transportation Improvement Program (TIP). The TIP is a comprehensive listing of transportation projects in Broward County scheduled for funding in the next five years. It represents the cooperative integration of plans by municipalities, FDOT, the MPO and implementing agencies. Projects are initially identified as part of the Long Range Planning Process. This is a prerequisite for inclusion on an MPO priority list. Priority Lists are then submitted to FDOT. Each year in the Annual Work Program, FDOT funds these priorities identified by the MPO to the extent possible. The Annual Work Program in turn forms the state and federal component of the TIP. The priority list is then updated to reflect these funding actions and a new list is submitted each year to FDOT.
6. Fort Lauderdale-Hollywood International Airport Master Plan. The Airport Master Plan provides a development plan to address future capacity needs. The Master Plan provided the data and analysis included herein on the Fort Lauderdale-Hollywood International Airport as well as the objectives and policies.
7. Port Everglades Master Plan Update, 1995-2005. The Master Plan Update has been incorporated into the Coastal Management Element. Further, the Master Plan provided the data and analysis included herein on Port Everglades as well as the objectives and policies.
8. Tri-County Rail Transit Development Plan. This Plan provided the data and analysis included herein on Tri-Rail as well as the objectives and policies.
9. Broward County Bicycle Facilities Network Plan (BFNP). The data and analysis included herein, and the objectives and policies are based on the BFNP. This assures consistent between the plans.
10. Broward County Five-Year Pedestrian Facilities Development Program. The data and analysis included herein, and the objectives and policies are based on the PFDP. This assures consistent between the plans.
Consistency among transportation improvement plans. Consistency between Broward County, FDOT and Fort Lauderdale’s transportation plans is indirectly addressed through the CIE, which includes a section on joint transportation projects.
H. Promoting and supporting public transit in designated public transportation corridors. Subsection 163.3177(6)(j)8, FS, requires the Transportation Element to address the identification of land use densities, building intensities, and transportation management programs to promote public transportation systems in designated public transportation corridors to encourage population densities sufficient to support such systems. This section addresses land use and building intensities.
City of Fort Lauderdale Comprehensive Plan (Ordinance C-08-18) Volume II – Transportation Element Page 8-113
1. Transit Oriented and Mixed Use Land Uses. The City has created four new land uses:
a. Transit Oriented Corridor (TOC) – This category facilitates mixed-use development with access along transit service corridors. b. Transit Oriented Development (TOD) – This land use category promotes mixed-use developments in major transit hubs, regional transit stations (Tri-Rail) and intermodal transportation centers. c. Mixed Use Residential (MUR) - This category allows for mixed-use in areas without requiring a present or future premium transit connection. d. Local Activity Center (LAC) – This category encourages a mixture of community serving uses characterized by efficient infrastructure, close knit neighborhoods and sense of community, preservation of natural systems, promotion of pedestrian circulation and convenient access to mass transit facilities.
2. Land Use Intensities. As part of adopting these land use categories, the City identified the need for intensities for each new land use category. For TOC and TOD, the City is required to set the intensity and density standards when the land use amendment is submitted. Like other land use categories such as Regional Activity Centers or Local Activity Centers, the City sets the maximum intensities for each land use in the entire area to be developed into TOC or TOD. For MUR, the City identified five separate intensities. 3. Travel demand forecasting model. The Florida Standard Urban Transportation Model Structure (FSUTMS), maintained by the MPO, was the travel demand forecast model used to model alternative land use intensities. The FSUTMS model is a four stage gravity model. At the most basic level, the typical forecasting model is structured around the following four sequential steps:
- Trip Generation - Estimation of number of trips produced by and
attracted to each traffic analysis zone. - Trip Distribution - Determination of the origin and destination zone for
each trip. - Modal Choice - Calculation of number of trips using the different
modes of transportation such as auto, transit, walk and others. - Assignment – Loading of auto trips onto the highway network or
person trips onto the transit network.
4. Land Use Inputs. Land use inputs are addressed in the model by dividing the County into a number of traffic analysis zones (TAZs). A TAZ is a compact geographic area that coincides with census track boundaries and usually bounded by roadways, and physical barriers such as expressway, rivers, canals, or other physical structure that limits the crossing of motorized vehicles. Broward County has 892 TAZs. Two databases are associated with each TAZ. Database 1 includes population and housing information, depicting the production side of the trip generation step. Database 2 comprises employment and school data,

City of Fort Lauderdale Comprehensive Plan (Ordinance C-08-18) Volume II – Transportation Element Page 8-114
displaying the attraction side of the trip generation step. In addition, the model includes information on special generators (i.e., major ports, parks, and shopping malls), internal-external trips for travel across the county lines either south to Miami-Dade County or north to Palm Beach County, and external-external trips for trips passing through Broward County.
5. Transportation system inputs. The transportation system inputs include information on roadway geometry (such as number of lanes, facility type, area type etc.). The transit network uses mainly the highway network, and other transit system information such as headway, bus travel speed, bus stops, and bus capacity.
The FSUTMS model generates trips at each traffic analysis zone (TAZ) from land use variables (population and employments.) Trips are distributed between zones using gravity concept and friction factors. Trips are then split between highway, transit and other modes using mode choice concept. Highway trips are converted to auto trips using an appropriate auto occupancy rate. Auto trips are assigned to the highway network according to equilibrium concept based on speed and capacity of each highway facility in the network.
Before using the model in traffic projection, it should be validated for the most recent year in which travel and census data are available. In Broward County, the model was validated for the year 2000. In the validation process, various coefficients and parameters are developed specifically for the Broward County transportation network such as speed and capacity tables, friction factors, and average auto occupancy rates. Transit coefficients are developed based on current transit market shares. Model runs are made until simulated model output matches the ground count for the year being validated. Then, the validated model coefficients and parameters are applied to future years. In this case, the year 2000 validated model coefficients and parameters were applied to the 2030 network to obtain year 2030 traffic volumes and transit ridership estimates.
For the purpose of this analysis, the main variable that was modified in the year 2030 model was the land use data and transit connectivity to affected TAZs.

City of Fort Lauderdale Comprehensive Plan (Ordinance C-08-18) Volume II – Transportation Element Page 8-115
V. Implementation Transportation planning and implementation in Broward County is the responsibility of several state, county, and federal agencies. Table 38 lists agencies and their responsibilities concerning transportation planning and improvements.
Table 38
Transportation Planning Legislation and Responsible Agencies
Agency
Enabling Legislation
Responsibility
Federal Aviation Administration
Subtitle VII of Title 49, United States Code
Regulate air commerce to promote its safety and development; achieve efficient use of the navigable airspace of the U.S.
Florida Department of Transportation (FDOT), Aviation Office.
Florida Statutes, Chapter 332 and Chapter 333
Plan airport systems in the state as well as assist, advise, cooperate and coordinate with the federal, state, and local, and private organizations in planning such a system.
Broward County Aviation Department
Broward County Administrative Code, Ch. VIII, Section 50.01
Planning, construction, operation, and maintenance of buildings, hangars, runways, and other county-owned facilities located upon and used in connection with FLL Airport.
BCT
Broward County Administrative Code (BCAD) and the Americans with Disabilities Act (ADA) of 1990
Administering the Mass Transit Program; coordinate the administration, management, operation, and maintenance of a countywide transit and paratransit system.
Transportation Planning Division (MPO)
Broward County Administrative Code, Vol. 1 Chapter 8, Sections 110.01, 110.012,110.04, 110.041, (G), (H). F.S. Ch. 163 & Rule 9J-5
Administration and coordination of transportation planning and improvement programs in the Broward County Urbanized Area.
South Florida Regional Transportation Authority
Florida Statutes, Chapter 343 Laws of Florida Ch. 2003-159
Operates the commuter rail system in Dade, Broward, and Palm Beach County
Port Everglades Department
Laws of Florida Chapters 59-1157, 89-427,91-346, 91-356, 94-429; BCAD, Chs. 16,32,42
Plans, develops, operates, and maintains Port Everglades as one unit of Broward County Government
Development Management Division
Broward County Administrative Code, Ch. 5, Art. 6.
Issuance of development permits in Broward County
Traffic Engineering Division
Broward County Administrative
Design, install, and maintain signals,

City of Fort Lauderdale Comprehensive Plan (Ordinance C-08-18)Volume II – Transportation Element Page 8-116
Agency
Enabling Legislation
Responsibility
Code, Ch. 6, Art. 1. C. 1 signs, and pavement markings Highway Construction and Engineering Division
Broward County Administrative Code, Ch. 6, Art. 1.C. 3
Primarily responsible for the engineering design and construction of County roads
Source: Unified Work Program of Transportation Planning Activities, FY 2005, Broward County Transportation Planning Division, 2006. A. Programs and Funding Funding sources for different modes of transportation vary. The following subsections summarize the programs and funding sources:
1. Transportation Improvement Program (TIP). The TIP is adopted annually by the MPO and includes countywide transportation-related projects that are state and federally funded. The TIP contains projects proposed for initiation in the five years following adoption and corresponds with the state fiscal year, which begins on July 1st and ends on June 30th. Funding sources for the various projects also are included in the TIP.
2. Capital Improvements Element (CIE). The CIE of the Fort Lauderdale Comprehensive Plan is adopted annually by the City Commissioners and includes transportation-related projects for which the city has responsibility. The CIE contains projects proposed for initiation in the five years following adoption and corresponds with the City’s fiscal year, which begins on October 1st and ends on September 30th. Funding sources for the various projects also are included in the CIE.
3. Florida Seaport Transportation Economic Development (FSTED) Program. The Florida Seaport Transportation Economic Development (FSTED) Act, Chapter 311, Florida Statutes, establishes the FSTED program within the Florida Department of Transportation to finance port transportation or port facilities projects that will improve the movement and intermodal transportation of cargo or passengers in commerce and trade and that will support the interests, purposes, and requirements of Florida's deepwater ports listed in Section 403.021(9)(b), Florida Statutes. The FSTED Program is funded through the State Transportation Trust Fund, and program funds are approved on a 50-50 matching basis.
4. FDOT Strategic Intermodal System. This funding program is provided for in Section 339.61, Florida Statutes and is administered by FDOT. Only projects associated with the Strategic Intermodal System are eligible for funding. These include facilities and services of statewide or interregional significance and services that play a critical role in moving people and goods to and from other states and nation and between major economic regions in Florida.

City of Fort Lauderdale Comprehensive Plan (Ordinance C-08-18)Volume II – Transportation Element Page 8-117
5. Federal Aviation Administration Airport Improvement Program (AIP) Grants. The AIP is a federal entitlement program to fund up to 80 percent of eligible capital project costs. In addition, there is a discretionary grant program that awards funding to projects that demonstrate capacity or safety enhancements for an airport or the national air transportation system.
6. FDOT Grants. The FDOT provides grants to the State’s commercial service, reliever and general aviation airports for capital improvements, land acquisition, aviation planning and revenue generating economic development projects. FDOT will provide up to 50 percent for the non-federal share of projects under grant by FAA. 7. New Starts FTA Section 5309 funding include any fixed guideway system which utilizes and occupies a separate right-of-way, or rail line, for the exclusive use of mass transportation and other high occupancy vehicles, or uses a fixed catenary system and a right of way usable by other forms of transportation. This includes, but is not limited to, rapid rail, light rail, commuter rail, automated guideway transit, people movers, and exclusive facilities for buses (such as bus rapid transit) and other high occupancy vehicles. 8. New Starts Transit Program (NSTP) is a program provides capital funding to local and regional transit agencies for the development of rail transit and bus rapid transit systems that support growth management plans. State funds match local funding and will maximize the receipt of discretionary FTA New Starts funding to Florida. The program was created as part of major Growth Management legislation during the 2005 Legislative Session (SB 360). The program is patterned after the federal program by the same name. It provides up to 50 percent of the non-federal share of capital costs, including design, right of way acquisition, construction, and vehicle procurement. A typical project would be funded 50 percent federal, 25 percent local, and 25 percent state. 9. Transportation Regional Incentive Program (TRIP) is a State funded program created to improve regionally significant transportation facilities and provide incentives for local governments and the private sector to help pay for critically needed projects that benefit regional travel and commerce. The program was created as part of major Growth Management legislation during the 2005 Legislative Session (SB 360). The purpose of the program is to encourage regional planning by providing state matching funds for improvements to regionally significant transportation facilities identified and prioritized by regional partners. 10. The Transit Development Plan (TDP) supports the level of service standards. These standards were established based on: the priorities resulting from District meetings of planners; the adopted priorities of the MPO; and the priorities set in previous TDPs.
City of Fort Lauderdale Comprehensive Plan (Ordinance C-08-18) Volume II – Transportation Element Page 8-118
11. The 2030 Long Range Transportation Plan (LRTP) is a group of transportation improvements designed to upgrade the transportation system in Broward County to meet the expected travel demand by the year 2030. THE 2030 LRTP shows a true multi-modal set of improvements in accordance with the direction provided by the Broward County MPO. The LRTP includes sections focused on air quality, livable communities and non-motorized transportation. The LRTP contains a true multi-modal set of improvement projects that will provide the county’s residents, business people and visitors with travel options and reduce reliance on private automobiles. Transit services will be dramatically improved to allow for a far higher degree of commuter travel. Bicycle and pedestrian system improvements will ensure that shorter-distance trips and leisure trips can be safely addressed by these modes, and will contribute towards a sustainable future for Broward County.
B. Future Transportation Initiatives The City of Fort Lauderdale is constantly looking towards the future and working with other agencies to improve our transportation system. There is a number of projects currently underway that address transportation needs. The City will incorporate all study recommendations that are ultimately adopted by the City Commission.
1. Downtown Transit Circulator. The Fort Lauderdale Downtown Development Authority (DDA) has initiated the Downtown Transit Circulator (DTC) project to develop a premium transit service that will serve destinations throughout the Fort Lauderdale urban core. The DTC project is part of the Downtown Transit Corridor Program that includes streetscape enhancements and intelligent transportation system implementation. These improvements will provide residents, workers and visitors with an attractive, easily accessible transportation option that is linked to the community and a regionally based transit network.
2. Broward Boulevard Corridor Study. One of the primary objectives of transit investment within the Central Broward East/West Transit System, especially along Broward Boulevard, is to encourage and shape future development and land use patterns. The Broward Boulevard Corridor Study encompasses Broward Boulevard between NW 22nd Avenue to Andrews Avenue and within the area between the New River and NW 4th Street. The purpose of the Broward Boulevard Corridor Study is to set the stage for a community that considers land use, mobility and community design as an integral process of transit making policy, decisions and systems. 3. Davie Boulevard Corridor Study. For the past several years, revitalizing Davie Boulevard has been a top priority for the southwest Fort Lauderdale community. In Fall 2004, the Davie Boulevard Corridor Master Plan project
City of Fort Lauderdale Comprehensive Plan (Ordinance C-08-18) Volume II – Transportation Element Page 8-119
began. It resulted in a redevelopment plan and streetscape and beautification plan that supports the community’s vision. The study area encompasses approximately two miles along Davie Boulevard from the western City limits at US 441/State Road 7 to Interstate 95 on the east. The project is being coordinated with the Florida Department of Transportation as part of their planned streetscape improvements. The plan focuses on creating an interactive pedestrian environment along Davie Boulevard. 3. Federal Highway / North US 1 Urban Design Plan. The Federal Highway / North US 1 Urban Design Plan is being undertaken by the City of Fort Lauderdale in anticipation of increased redevelopment interest along the corridor. The project area for this study consists of all properties fronting on US 1, from Sunrise Boulevard to the city’s northern limits. The purpose of the study is to evaluate the existing uses and the development potential for the corridor and to establish some general principles and design standards to guide future development. The objective is to allow for the restructuring of land uses and building forms to create a more vibrant and sustainable multi-use urban corridor. To that end, this study will accomplish the following:
- Define character areas based on complementary land uses, streetscape conditions, and building forms;
- Encourage development that is attractive, compatible, pedestrian friendly, and transit oriented;
- Improve mobility and transit opportunities, and
- Remain sensitive to the surrounding neighborhoods.
4. South Andrews Avenue Master Plan. The Fort Lauderdale City Commission approved the South Andrews Avenue Master Plan on May 18, 2004. The South Andrews study area includes properties located on both sides of a mile-long stretch of South Andrews Avenue that extends from the Tarpon River (north) to State Road 84 (south). Through a multi-leveled public planning process that included stakeholder interviews and a weeklong design charrette, the South Andrews Avenue Master Plan resulted in a vision document that will guide future redevelopment within the study area. The plan also focuses on creating an interactive pedestrian environment along South Andrews Avenue. The Planning & Zoning Department is in the process of working on zoning amendments to implement the vision for the area. 5. Downtown Master Plan. On November 18, 2003, the Fort Lauderdale City Commission accepted the Consolidated Downtown Master Plan by resolution. The Master Plan outlines design guidelines for downtown development proposals based on type and location. The plan focused on creating an

City of Fort Lauderdale Comprehensive Plan (Ordinance C-08-18) Volume II – Transportation Element Page 8-120
interactive pedestrian environment throughout the downtown. Transit was also recommended as a critical component to moving people in the downtown area. The City has recently approved an update to the Master Plan that includes the following components:
- Establish more appropriate transitions to smaller scale neighborhoods;
- Encourage buildings to relate well to each-other and to the public realm;
- Conceal parking garages with active uses;
- Encourage vertical open space between towers;
- Provide sufficient parking for new uses and densities;
- Create a strategic retail plan for the Downtown;
- Create a New River Plan and Thematic Planning Districts; and
- Encourage high quality architecture and skyline drama. 6. SFECC Transit Analysis Study. The Florida Department of Transportation (FDOT) District 4 is leading a regional partnership that is conducting the South Florida East Coast Corridor (SFECC) Transit Analysis Study. The scope of this Transit Analysis Study (TAS) is to develop and analyze alternatives that potentially integrate passenger and freight transport along the SFECC, which is centered along the existing FEC Railway. The study will consider various alignments and transit technologies. Right-of-way on streets and areas parallel to the SFECC, as well as stretches of waterways, will be evaluated for the alternative transit routes. The different technologies that will be considered include bus, waterway transit, light-rail, commuter-rail, and heavy-rail. 7. Automated People Mover. Broward County, in its 2020 Vision Plan, outlined a framework for future development at Fort Lauderdale-Hollywood International Airport, Port Everglades and elements that would promote regional transportation/transit improvements. The key elements of the 2020 Vision Plan are the Automated People Mover (APM) and an Intermodal Center (IMC). The APM is planned to transport passengers within and between the Fort Lauderdale-Hollywood International Airport and Port Everglades, with connections to regional transportation modes at the IMC. The APM would improve the level of service to passengers and relieve traffic congestion on the airport and seaport roadways and at terminal curbs. System length is approximately five miles (dual lane) of mainline guideway and between eight to 10 passenger stations.

City of Fort Lauderdale Comprehensive Plan (Ordinance C-08-18) Volume II – Transportation Element Page 8-121
8. Transit/Housing Oriented Redevelopment Studies. Broward County in cooperation with the City of Fort Lauderdale and other municipalities are developing a vision and implementation strategies for corridors throughout Broward County. The first two studies include Broward Boulevard west of I-95 to SR 7 and the other is SR 7 between Peters Road and I-595. 9. Central Beach Master Plan. The City of Fort Lauderdale is preparing a Master Plan for the Central Beach area bounded by the Atlantic Ocean on the east, the Intracoastal Waterway on the west, Sunrise Boulevard on the north and Harbor Drive on the south. The study will identify economic opportunities, design guidelines and strategies to improve the beach area. The Master Plan will integrate individual district plans into a cohesive community based vision for the Central Beach.
10. Citywide Multimodal Needs Analysis. The City of Fort Lauderdale is developing a multimodal needs analysis including bus, pedestrian and bicycle facilities. Phase I includes data collection and inventory. Phase II will include a gap analysis and Phase III will prioritize the list of needs and identify funding sources. Phase IV will develop an implementation plan.