Transport infrastructure and enlarging production network
36
Transport Infrastructure and Enlarging Production Network in GMS
-
Upload
- -
Category
Economy & Finance
-
view
521 -
download
2
Transcript of Transport infrastructure and enlarging production network
Transport Infrastructure and Enlarging Production Network in
GMS

Contents
• Introduction
• Current Situation in GMS • Production• Market
• Effect of Transport Infrastructure in GMS• Third Thai-Lao Friendship Bridge• National Road 9 in Lao PDR• Japanese Friendship Bridge in Cambodia
• Conclusion

Introduction
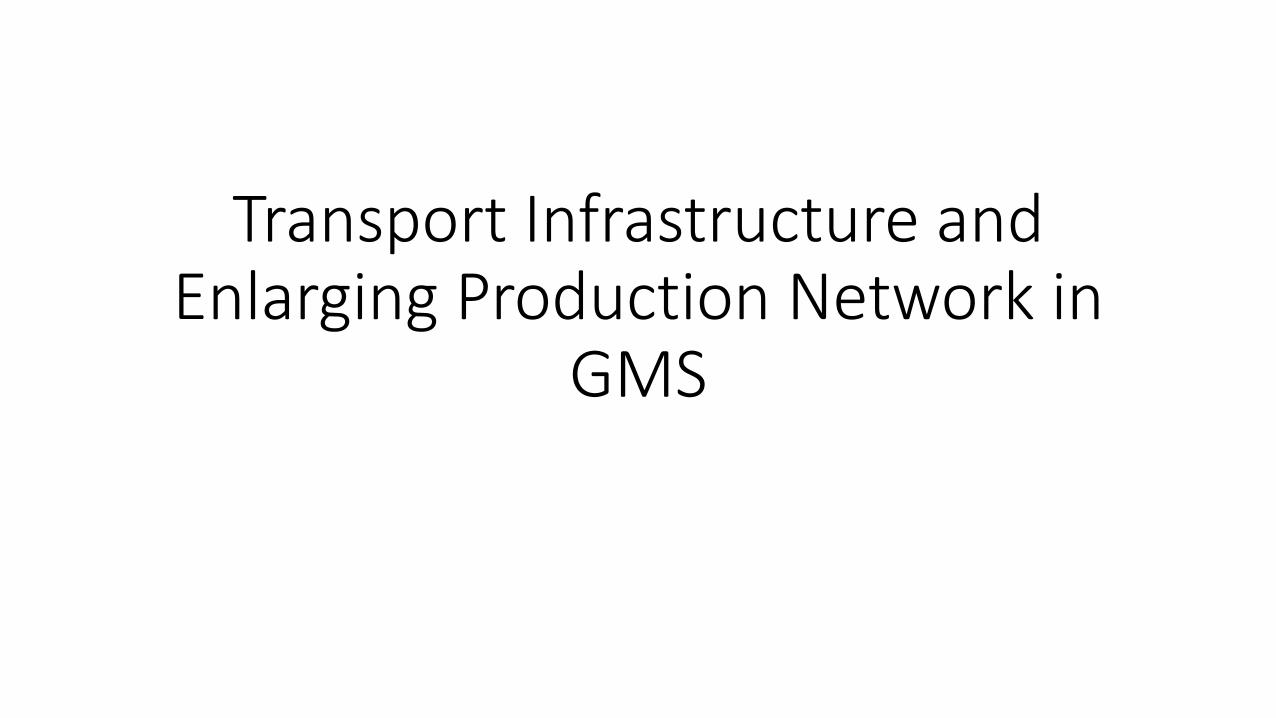
Transition of Japanese Offshoring Place
ThailandChina ?CLMV

Why CLMV?○ Adequate△ Partially Adequate× Inadequate

What‘s Kind of Infrastructure?
ElectricityWater Service
TransportationIT
Education
Medical

Cambodia
Lao PDRMyanmar
Thailand
Vietnam Australia
Brazil
China
Japan
GermanySingapore
United States
1.5
2
2.5
3
3.5
4
4.5
0 10000 20000 30000 40000 50000 60000 70000
LPI Score
GDP Per Capita (US $)
Logistics Performance Index 2014 ( LPI )
Source: The World Bank
n=143

Current Situation in GMSProduction Side

0
50
100
150
200
250
300
350
400
2005 2006 2007 2008 2009 2010 2011 2012 2013 2014 2015
US$/Monthly
Source: National Statistical Office of Thailand
Average Monthly Wage in Thailand
1baht=0.028US$

Comparison of Population Pyramid in Thailand 2015 and 2030
3000 2000 1000 0 1000 2000 3000
0~4
5~9
10~14
15~19
20~24
25~29
30~34
35~39
40~44
45~49
50~54
55~59
60~64
65~69
70~74
75~79
80+
Thousand
AgePopulation Pyramid in Thailand 2015
Male
Female
3000 2000 1000 0 1000 2000 3000
0~4
5~9
10~14
15~19
20~24
25~29
30~34
35~39
40~44
45~49
50~54
55~59
60~64
65~69
70~74
75~79
80+
Thousand
AgePopulation Pyramid in Thailand 2030
Male
Female
Source: The World Bank

Comparison of Population Pyramid in Cambodia 2015 and 2030
3000 2000 1000 0 1000 2000 3000
0~4
5~9
10~14
15~19
20~24
25~29
30~34
35~39
40~44
45~49
50~54
55~59
60~64
65~69
70~74
75~79
80+
Thousand
Age Population Pyramid in Cambodia 2015
Male
Female
3000 2000 1000 0 1000 2000 3000
0~4
5~9
10~14
15~19
20~24
25~29
30~34
35~39
40~44
45~49
50~54
55~59
60~64
65~69
70~74
75~79
80+
Thousand
AgePopulation Pyramid in Cambodia 2030
Male
Female
Source: The World Bank

Comparison of Population Pyramid in Lao PDR 2015 and 2030
3000 2000 1000 0 1000 2000 3000
0~4
5~9
10~14
15~19
20~24
25~29
30~34
35~39
40~44
45~49
50~54
55~59
60~64
65~69
70~74
75~79
80+
Thousand
AgePopulation Pyramid in Lao PDR 2015
Male
Female
3000 2000 1000 0 1000 2000 3000
0~4
5~9
10~14
15~19
20~24
25~29
30~34
35~39
40~44
45~49
50~54
55~59
60~64
65~69
70~74
75~79
80+
Thousand
AgePopulation Pyramid in Lao PDR 2030
Male
Female
Source: The World Bank

Comparison of Population Pyramid in Myanmar 2015 and 2030
3000 2000 1000 0 1000 2000 3000
0~4
5~9
10~14
15~19
20~24
25~29
30~34
35~39
40~44
45~49
50~54
55~59
60~64
65~69
70~74
75~79
80+
Thousand
AgePopulation Pyramid in Myanmar 2015
Male
Female
3000 2000 1000 0 1000 2000 3000
0~4
5~9
10~14
15~19
20~24
25~29
30~34
35~39
40~44
45~49
50~54
55~59
60~64
65~69
70~74
75~79
80+
Thousand
AgePopulation Pyramid in Myanmar 2030
Male
Female
Source: The World Bank


Current Situation in GMSMarket Side

0
1000
2000
3000
4000
5000
6000
2010 2015 2020 2025 2030 2035 2040 2045 2050
Million
Source: UNCTAD Stat
Population in Asia
Other Asia China India GMS

0.0
10.0
20.0
30.0
40.0
50.0
60.0
70.0
0.0
5.0
10.0
15.0
20.0
25.0
30.0
35.0
40.0
200020012002200320042005200620072008200920102011201220132014201520162017201820192020
%US$
Billions
Source: Euromonitor International (2010)
Changes in Income Stratified Populationin Emerging Asian Countries
$35,000 or more $5,000~$35,000
Less than $5,000 $ 5,000 or more of the ratio (right scale)

・advantages cost・R & D・employment・production efficiency and innovation
・pushing up the country's economy・market expansion

Production
Market
・Anxiety
・Expectation
Infrastructure development
e.g. Electricity, GasTransportation
Common Issues

Effect of Transport Infrastructure in GMS

Three Economic Corridors

1. The trade volume with neighboring
countries is large.
2. Through the development of cross-border
infrastructure and cross-border systems, the
trade volume increase.

Effect Analysis about Infrastructure
Third Thai-Lao Friendship Bridge
(Lao PDR)
National Road Route 9
(Lao PDR)
Japanese Friendship Bridge
(Cambodia)

Third Thai-Lao Friendship Bridge

0
5000
10000
15000
20000
25000
30000
35000
40000
45000
50000
2003 2004 2005 2006 2007 2008 2009 2010 2011 2012 2013 2014
Export Import Source: Bank of Thailand (2015)
Thousand Bahts
Thai – Laos Trade Cleared at Custom Housein Nakhon Phanom

National Road 9 in Lao PDR

254
565 598662
972
1262
0
200
400
600
800
1000
1200
1400
1600
1800
2001 2002 2003 2004 2005 2006
Unit/Day
Source: Ministry of Public Works and Transport, Lao PDR (2007)
Domestic Traffic Moved on Route 9, Lao PDR
Mass Transport Traffic Passenger Traffic Total
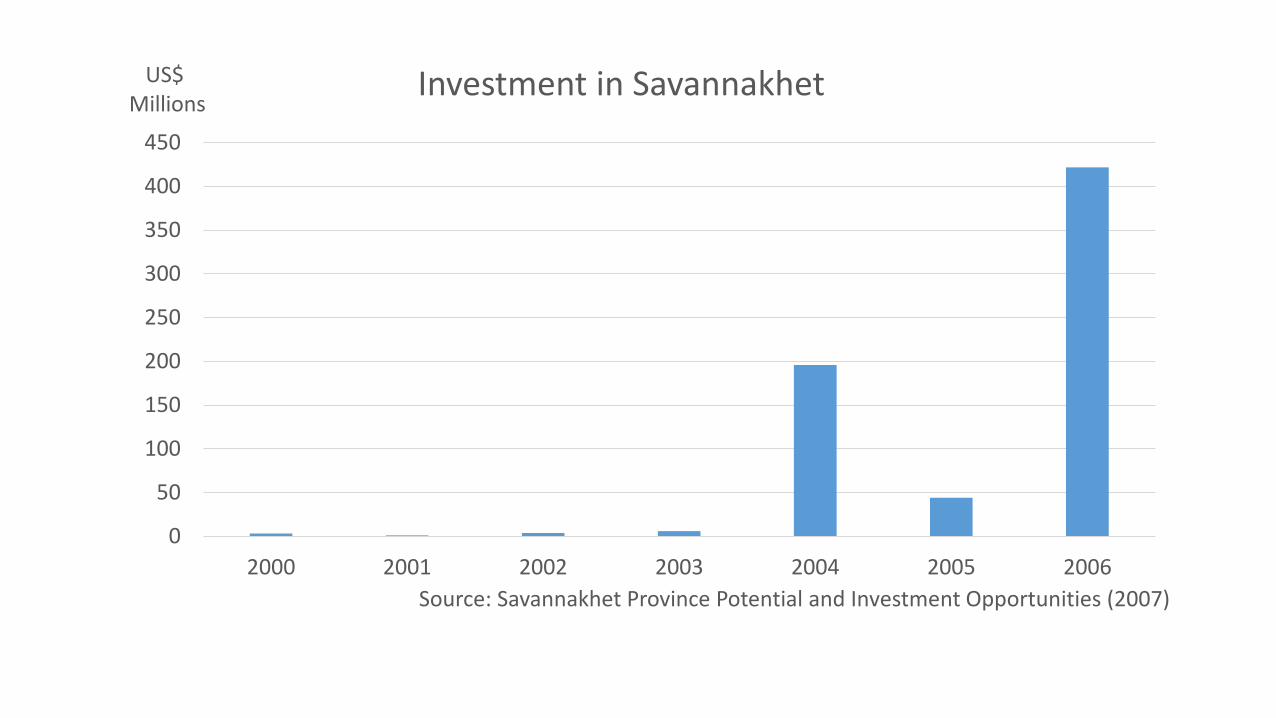
0
50
100
150
200
250
300
350
400
450
2000 2001 2002 2003 2004 2005 2006
US$ Millions
Investment in Savannakhet
Source: Savannakhet Province Potential and Investment Opportunities (2007)

Japanese Friendship Bridge in Cambodia
Tonle Bet

Both Ways Traffic Volumes in Japanese Friendship Bridge in Cambodia
Source: Ministry of Public Works and Transport, Cambodia (2005)The data was calculated for 12 hour (6:00~18:00)

Conclusion

Conclusion
•Problem•System of transport infrastructure•Fundraising
•Our Suggestion

System of transport infrastructure
•Cross Border Transportation Agreement
• Single Stop
• Single Window
Not all countries ratify these agreements

0
100
200
300
400
500
600
700
800
Amount of Investment per Year Infrasturucture Needs per Year
US $Billions
The Supply-Demand Gap of Infrastructure Fund in Asia
AIIB: 15Billion
ADB: 23Billion
Source: ADB, Reuters 1,Dec,2015
700 US Billion

Our Suggestion
Construction of production network completed in GMS

• Thailand’s meritAvoid “Middle Income Trap”
•Neighboring countries’ meritImprove industry levels
• Foreign companies’ meritCut down production cost