Transit Signal Priority Algorithm Research and Development Prepared for Transport Canada
108
TP 14521E Transit Signal Priority Algorithm Research and Development Prepared for Transport Canada By LEA Consulting Ltd. University of Toronto Fortran Traffic Systems Limited November 2005
Transcript of Transit Signal Priority Algorithm Research and Development Prepared for Transport Canada

TP 14521E
Transit Signal Priority Algorithm Research and Development
Prepared for Transport Canada
By
LEA Consulting Ltd. University of Toronto Fortran Traffic Systems Limited
November 2005


TP 14521E
Transit Signal Priority Algorithm Research and Development
By:
Stanley Hung - LEA Consulting Ltd. John C. Greenough – LEA Consulting Ltd. Prof. Amer Shalaby – University of Toronto
Jinwoo Lee – University of Toronto Michael Bowie – Fortran Traffic Systems Limited
November 2005
Notices
This report reflects the views of the authors and not necessarily the official views or policies of Transport Canada. Transport Canada does not endorse products or manufactures. Trade or manufacturer’s names appear in this report only because they are essential to its objectives. Since some of the accepted measures in the industry are imperial, metric measures are not always used in this report.
This project is part of Canada’s Intelligent Transportation Systems (ITS) R&D Plan, Innovation Through Partnership, funded by the ITS Office of Transport Canada under the Strategic Highway Infrastructure Program (SHIP). The Transportation Development Centre of Transport Canada served as scientific authority for this project.
Project team
John Greenough, LEA Consulting Ltd. Stanley Hung, LEA Consulting Ltd. Amer Shalaby, University of Toronto Jinwoo Lee, University of Toronto Michael Bowie, Fortran Traffic Systems Limited
Un sommaire français se trouve avant la table des matières.
ii

Transport Canada
Transports Canada PUBLICATION DATA FORM
1. Transport Canada Publication No.
TP 14521E 2. Project No.
3. Recipient’s Catalogue No.
4. Title and Subtitle
5. Publication Date
November 2005
6. Performing Organization Document No.
7. Author(s)
S. Hung, J.C. Greenough, A. Shalaby, et al. 8. Transport Canada File No.
2450-GPO16
9. Performing Organization Name and Address 10. PWGSC File No.
052ss.T8663-030015
11. PWGSC or Transport Canada Contract No.
T8663-030015/009/SS
12. Sponsoring Agency Name and Address 13. Type of Publication and Period Covered
Final
14. Project Officer
Pierre Bolduc
15. Supplementary Notes (Funding programs, titles of related publications, etc.)
This project is part of Canada’s Intelligent Transportation Systems (ITS) R&D Plan, Innovation Through Partnership, funded by the ITS Office of Transport Canada under the Strategic Highway Infrastructure Program (SHIP). The Transportation Development Centre of Transport Canada served as technical authority for this project.
16. Abstract
17. Key Words
Transit signal priority, TSP, algorithm, intelligent transportation systems, ITS, adaptive priority, micro-simulation, PARAMICS
18. Distribution Statement
Limited number of print copies available from the Transportation Development Centre. Also available online at www.tc.gc.ca/tdc/menu.htm
19. Security Classification (of this publication)
Unclassified
20. Security Classification (of this page)
Unclassified
21. Declassification (date)
—
22. No. of Pages
xxx, 52, app
23. Price
Shipping/ Handling
CDT/TDC 79-005 Rev. 96 iii
Transit Signal Priority Algorithm Research and Development
LEA Consulting Ltd. 625 Cochrene Drive, Suite 900 Markham, Ontario Canada L3R 9R9
ITS Office – Transport Canada Place de Ville, Tower C, Floor 27 330 Sparks Street Ottawa, Ontario Canada K1A 0N5
The purpose of this study was to research, develop, and evaluate an advanced transit signal priority (TSP)algorithm.
A literature review was conducted to identify research and development needs for TSP. Based on the literaturereview, several TSP concept directions were identified. With comments gathered from a Technical AdvisoryGroup comprising municipal traffic and transit department staff, a TSP concept direction was selected for furtherdevelopment.
The new algorithm, referred to as TSP-Advance by the project team, consists of two fundamental components: amicrosimulation-based transit travel time prediction model and an advanced TSP control model. The TSP-Advance system gathers real-time data from traffic and transit detection systems on the street, and outputs aTSP plan to replace the existing traffic signal timing.
Evaluation of the TSP-Advance algorithm and operation was performed using a PARAMICS micro-simulation model. With TSP-Advance, in comparison to an active TSP control operation, bus signal delay was reduced by34.07%, bus travel speed improved by 10.2%, bus headway deviation reduced by 10.44%, and cross-street traffic delayed by only 2.86%.
The results of the evaluation showed significant improvement and market potential for the TSP-Advance algorithm in comparison to typical TSP systems currently being operated and/or installed.

Transports Canada
Transport Canada FORMULE DE DONNÉES POUR PUBLICATION
1. No de la publication de Transports Canada
TP 14521E 2. No de l’étude
3. No de catalogue du destinataire
4. Titre et sous-titre
5. Date de la publication
Novembre 2005
6. No de document de l’organisme exécutant
7. Auteur(s)
S. Hung, J.C. Greenough, A. Shalaby, et al. 8. No de dossier - Transports Canada
2450-GPO16
9. Nom et adresse de l’organisme exécutant 10. No de dossier - TPSGC
052ss.T8663-030015
11. No de contrat - TPSGC ou Transports Canada
T8663-030015/009/SS
12. Nom et adresse de l’organisme parrain 13. Genre de publication et période visée
Final
14. Agent de projet
Pierre Bolduc
15. Remarques additionnelles (programmes de financement, titres de publications connexes, etc.)
Ce projet fait partie du Plan de R&D du Canada sur les systèmes de transports intelligents (STI), Innover par l’établissement de partenariats, financé par le Bureau des STI ainsi que par Transports Canada dans le cadre du programme stratégique d’infrastructures routières (PSIR). Le Centre de développement des transports de Transports Canada a agi comme responsable technique pour ce projet.
16. Résumé
17. Mots clés
Signaux de priorité aux véhicules de transport en commun, TSP, algorithme, systèmes de transports intelligents, STI, priorité adaptative, microsimulation, PARAMICS
18. Diffusion
Le Centre de développement des transports dispose d’un nombre limité d’exemplaires imprimés. Disponible également en ligne à www.tc.gc.ca/cdt/menu.htm
19. Classification de sécurité (de cette publication)
Non classifiée
20. Classification de sécurité (de cette page)
Non classifiée
21. Déclassification (date)
—
22. Nombre de pages
xxx, 52, ann.
23. Prix
Port et manutention
CDT/TDC 79-005 Rev. 96 iv
Transit Signal Priority Algorithm Research and Development
LEA Consulting Ltd. 625 Cochrene Drive, Suite 900 Markham, Ontario Canada L3R 9R9
Bureau STI – Transports Canada Place de Ville, Tour C, 27e étage 330, rue Sparks Ottawa, Ontario Canada K1A 0N5
Cette étude visait la recherche-développement et l’évaluation d’un algorithme de signaux de priorité auxvéhicules de transport en commun (TSP, transit signal priority).
Une recherche documentaire a d’abord été menée afin de cerner les besoins de recherche et développement en matière de TSP. Plusieurs concepts de TSP ont alors été identifiés et soumis à l’examen d’un Groupe consultatiftechnique composé d’employés des services de la circulation et du transport en commun de municipalités. Fortedes commentaires du groupe, l’équipe de projet a choisi un des concepts pour le développer plus avant.
Le nouvel algorithme, appelé TSP-Advance, comprend deux éléments essentiels : un modèle de microsimulationdu temps de parcours des véhicules de transport en commun et un modèle évolué de commande des TSP. Le système TSP-Advance collige les données en temps réel des détecteurs de circulation et des détecteurs devéhicules de transport en commun encastrés dans la chaussée, et restitue un plan TSP qui modifie enconséquence le cycle de signalisation existant.
L’évaluation de l’algorithme TSP-Advance et de son fonctionnement a été effectuée à l’aide du logiciel demicrosimulation PARAMICS. Comparativement à un système de commande active des TSP, le TSP-Advance a mené à une diminution de 34,07 % des retards subis par les autobus aux feux de circulation, à une augmentationde 10,20 % de la vitesse des trajets en autobus et à une diminution de 10,44 % de l’écart par rapport àl’intervalle prévu entre autobus, tout en causant des retards de seulement 2,86 % aux circulations transversales.
Les résultats de l’évaluation sont éloquents : l’algorithme TSP-Advance représente un grand pas en avant et un grand potentiel commercial par rapport aux systèmes TSP types actuellement exploités et/ou installés.
Acknowledgements The support and guidance of the Transport Canada Scientific Authority, Pierre Bolduc, throughout this project is gratefully appreciated and acknowledged. The project team would also like to acknowledge the members of the Steering Committee for their insights during the project:
Pierre Bolduc, Transport Canada, Transportation Development Centre Bob Szwarz, Region of Durham David Dankmeyer, Region of Durham Joe Cafarelli, Region of Durham Andy Harvey, City of Mississauga Bill Daeuber, City of Mississauga Al Kirkpatrick, Burlington Transit Philippe Bellon, Canadian Urban Transit Association Jonathan Sabean, Transport Canada ITS Office
The project team would also like to acknowledge the technical and operational insights offered by the members of the Technical Advisory Group for this project: Bill Daeuber, City of Mississauga Traffic John Clarke, City of Mississauga Traffic Zeljko Subic, Mississauga Transit Egerton Heath, Region of Waterloo Traffic Mark Liddell, Region of Waterloo Traffic Eric Gillespie, Grand River Transit Klaus Smercek, Region of Peel Traffic Lizuarte Simas, Region of York Traffic Rick Takagi, York Region Transit Kornel Mucsi, City of Ottawa Traffic Scott McMillan, Town of Oakville Traffic Joanne Phoenix, Oakville Transit Bruce Zvaniga, City of Toronto Traffic Jim Sinikas, Toronto Transit Commission
Tony Dam, City of Guelph Transit Leonard Occhiogrosso, City of Guelph Transit Randall French, City of Guelph Director of Transportation Malcolm Morris, Kingston Transit Shane Maguire, City of London Traffic David Stowe, London Transit Commission George Yip, City of Brampton Traffic Alex Milojevic, Brampton Transit Jeffrey Reid, Halton Region Traffic Jim LeSarge, Region of Peel Traffic Allister McIlveen, City of Burlington Traffic Bill Zuk, City of Hamilton Traffic Kevin Nicol, Hamilton Street Railway
A special acknowledgement is also extended to the City of Brampton for providing the data required for the micro-simulation model.
v


Executive Summary This report summarizes the process undertaken, work completed, and results obtained for the Research and Development of an Advanced Transit Signal Priority Algorithm. This project was one of several awarded under Transport Canada’s ITS Research and Development plan in January 2004. Projects awarded under the program were in response to the following broad priorities: • Urban transportation: traffic management and control, public transit • Safety, security and trade: safety, security, and commercial vehicle operations • Environment: energy, road weather information systems (RWIS) • Foundations: standards development This Transit Signal Priority Algorithm project responds to the first priority listed. The focus of the project was on deriving an intelligent transit signal priority (TSP) algorithm that is practical, innovative, and suitable to move forward to a commercial phase. The fundamental objectives of the project were to: • Develop a unique, innovative transit signal priority algorithm that has the potential to be
deployed in the field; • Facilitate the exchange of knowledge and ideas between the academic research community
and the industrial sector during the algorithm development process; • Provide a means to improve mobility and transportation efficiency; • Increase operational and regulatory efficiencies for system users and public agencies; • Encourage the development of products and services that will accelerate the growth of ITS
knowledge and skills, and promote the uptake and commercialization of ITS technology. Client involvement throughout a project is critical to its ultimate success. The sooner a client becomes a stakeholder and assumes ownership of the resulting product, the greater the degree of success that is achieved. An essential element of any process is effective consultation with all stakeholders, including potential user groups, key team members, and associated external stakeholders. Throughout the project, stakeholder involvement was provided through two mediums: the Steering Committee and the Technical Advisory Group. The Steering Committee comprised the Scientific Authority (Transport Canada Project Manager), select invited representatives from municipal traffic and transit agency groups, and a representative of Transport Canada’s Intelligent Transportation Systems Office. The Technical Advisory Group (TAG) comprised invited representatives from a broader scope of municipal and transit representation; more specifically, those that already operate a TSP program, are currently designing a TSP program, or have expressed an interest in creating a TSP program. The project team conducted working sessions with the TAG to provide a forum to relay project information and to better understand the real needs, design issues, and challenges associated with TSP deployment and operation. A literature review was conducted to identify research and development needs for TSP. The review complemented and confirmed the Project Team’s appreciation for the current state of practice with respects to TSP, and forward looking directions for further assessment. In referencing the insights gained through a literature review and through the project team’s experience, the following is a listing of limitations within the current state of practice:
1. Excessive delay caused to general traffic, especially side-street traffic, at the intersection in saturated traffic conditions
vii

2. Provision of TSP when it is not needed (i.e. transit vehicle is running ahead of
schedule) 3. Traffic signal timing recovery/re-coordination after a TSP call is served, which could
take several signal timing cycles to complete 4. Provision of TSP on transit routes operating on short headways within congested
corridors 5. Limited application of more advanced TSP control strategies 6. Lack of more advanced TSP control methods/algorithms based on recent
technologies such as automated vehicle location and/or automated passenger counter as these systems become more mainstream
7. Interfacing with transit management/scheduling systems for real-time transit information
The literature review also revealed the following areas of interest to the research and development community with respect to the development of new TSP algorithms:
1. Central-based system in view of providing increased TSP functionality network wide, as well as the ability to share information with respect to meeting the goals of the ITS Architecture.
2. Conditional priority (with schedule information, passenger information, traffic saturation information, etc.)
3. Adaptive features to minimize unnecessary delay to other traffic and improve success rate of TSP service
4. Dynamic selection of a broader array of TSP strategies that would be more effective in a particular situation governed by the level of traffic congestion, the point in the traffic signal cycle, etc.
Specific areas related to TSP operations where more research and development is needed include the following:
1. Recovery sequences to better manage how lost signal phase timings are to be allocated/recovered
2. Improved forms of administering conditional priority, perhaps through the use of differing levels of priority and by ensuring that the TSP sequence is of benefit to the transit vehicle and/or the overall traffic network or intersection node
3. System configuration enhancements to allow for the gathering of more real-time information such that system decisions could be more accurate
4. Integration with other systems to better facilitate the collection and sharing of real-time information
5. Centralized traffic control system enhancement/development, resulting in the ability to provide improved TSP functions and control that are beyond the current state of development available through local TSP control and operation at the intersection
6. Improved mechanisms for administering priority requested in saturated traffic network (this may include predictive modeling and the adjustments of signal timing plans in preparation for the arrival of the transit vehicle)
7. Adaptive TSP operations where transit vehicles are detected at the preceding intersections
8. Improved utilization of TSP functions in traffic signal networks managed by adaptive controls systems like SCOOT (Split Cycle Offset Optimization Technique) or SCATS (Sydney Coordinated Adaptive Traffic System)
9. Clearing of traffic queues before transit vehicles arrive to minimize the delay and errors in the expected progression of the transit vehicle towards a signalized intersection
10. Use of multiple control strategies in one sequence to provide advanced TSP operation 11. Historical referencing of traffic patterns and transit travel for TSP decision making of
approaching transit vehicles 12. Implementation of more control strategies into everyday use
viii
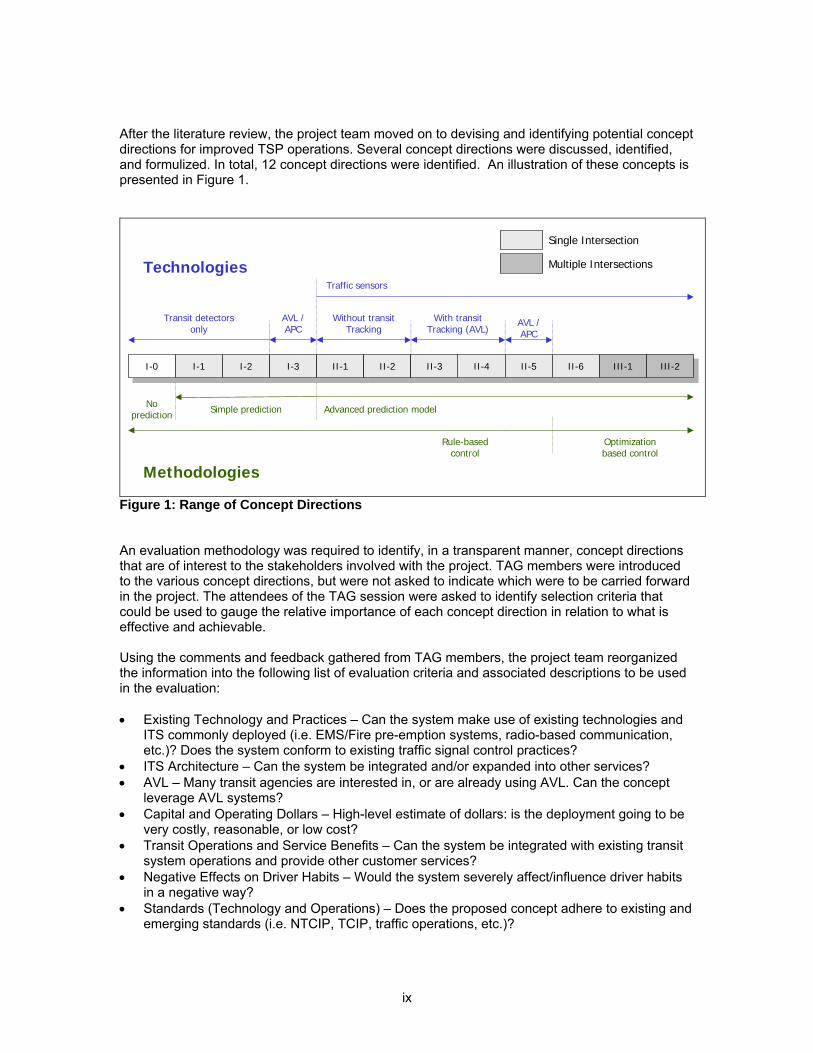
After the literature review, the project team moved on to devising and identifying potential concept directions for improved TSP operations. Several concept directions were discussed, identified, and formulized. In total, 12 concept directions were identified. An illustration of these concepts is presented in Figure 1.
I-0I-0 I-1I-1 I-2I-2 I-3I-3 II-1II-1 II-2II-2 II-3II-3 II-4II-4 II-5II-5 II-6II-6 III-1III-1 III-2III-2
Traffic sensors
Optimizationbased control
Rule-basedcontrol
Without transitTracking
With transitTracking (AVL)
Advanced prediction model
AVL /APC
Simple predictionNoprediction
Transit detectorsonly
Technologies
Single Intersection
Methodologies
Multiple Intersections
AVL /APC
Figure 1: Range of Concept Directions
An evaluation methodology was required to identify, in a transparent manner, concept directions that are of interest to the stakeholders involved with the project. TAG members were introduced to the various concept directions, but were not asked to indicate which were to be carried forward in the project. The attendees of the TAG session were asked to identify selection criteria that could be used to gauge the relative importance of each concept direction in relation to what is effective and achievable. Using the comments and feedback gathered from TAG members, the project team reorganized the information into the following list of evaluation criteria and associated descriptions to be used in the evaluation: • Existing Technology and Practices – Can the system make use of existing technologies and
ITS commonly deployed (i.e. EMS/Fire pre-emption systems, radio-based communication, etc.)? Does the system conform to existing traffic signal control practices?
• ITS Architecture – Can the system be integrated and/or expanded into other services? • AVL – Many transit agencies are interested in, or are already using AVL. Can the concept
leverage AVL systems? • Capital and Operating Dollars – High-level estimate of dollars: is the deployment going to be
very costly, reasonable, or low cost? • Transit Operations and Service Benefits – Can the system be integrated with existing transit
system operations and provide other customer services? • Negative Effects on Driver Habits – Would the system severely affect/influence driver habits
in a negative way? • Standards (Technology and Operations) – Does the proposed concept adhere to existing and
emerging standards (i.e. NTCIP, TCIP, traffic operations, etc.)?
ix

• Deployment Timeframe – Can the system be deployed in a relatively short and realistic
timeframe? • System Support and Maintenance – Would the system be easy to maintain? • Traffic Impact – Does the system account for traffic impacts to the mainline and cross street? • Pedestrian Impact – Does the system account for pedestrian traffic, or at least minimize their
impacts? • Deployment Environment – Would the system be suitable for the target environment (i.e.
medium-to-high frequency service, main transit route, near-side stops)? • Near/Far Side Application – Can the strategy be used for near-side and far-side transit stops? Based on the evaluation methodology and results, it is recommended that the top ranking concept directions found in Table 1, be rationalized further through the preliminary design phase of the project.
Table 1: Top Ranking Concept Directions Concept ID Rank
Level II-1 3 Level II-3 1 Level II-4 1 Level II-5 2
To assist the project team and stakeholders involved with the review of the short-listed concepts, a preliminary design of each was undertaken. Comments from TAG and Steering Committee members were considered in subsequent project team discussions to settle on a preferred concept direction for further development. In summary, concept direction II-3.5, which is a variation of concept II-3, is to be designed, and is described by the following preliminary operational framework: • Transit vehicles are equipped with an intelligent computational device (i.e. vehicle logic unit); • On-board automated vehicle location (AVL) system provides the vehicle logic unit (VLU) with
real-time position data; • VLU determines whether TSP is required through a rule-based algorithm based on schedule
adherence; • If the VLU determines that a TSP call is warranted to maintain the transit schedule, the TSP
emitter is activated at the desired point along the route; • TSP detectors, or detection points, are located at various points along the approach to gather
transit vehicle travel time, and data is relayed to the traffic signal controller; however, one detection point, or check-in point could also be designated;
• Traffic detectors are located upstream and downstream along the transit route to measure traffic volumes, speed and occupancy; data is relayed to the traffic signal controller;
• Traffic signal control1 assesses the data through a travel time prediction model with real-time AVL transit travel time and traffic data as inputs;
• Traffic signal control continuously updates the predicted travel time of the transit vehicle; • TSP strategies are initiated by either the local traffic signal controller or the central traffic
computer, based on the predicted transit vehicle travel time through a rule-based algorithm; • TSP sequence is unconditionally provided relative to general traffic conditions, but would be
conditional on transit vehicle schedule adherence as determined previously; • Traffic signal controller issues a signal timing recovery plan after the TSP call is dropped or
maxed out.
1 Traffic signal control in this context refers to an advanced traffic controller with programmable processing capabilities, a traffic signal controller with the program built in, or a centralized traffic signal control system.
x
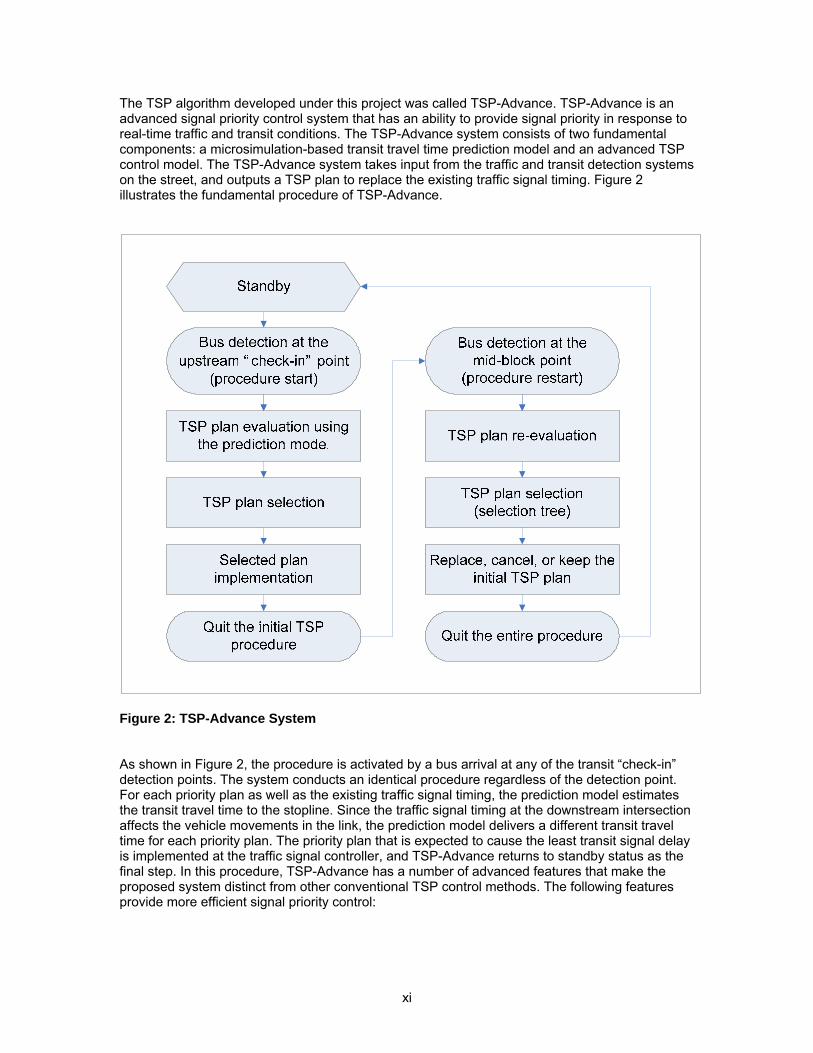
The TSP algorithm developed under this project was called TSP-Advance. TSP-Advance is an advanced signal priority control system that has an ability to provide signal priority in response to real-time traffic and transit conditions. The TSP-Advance system consists of two fundamental components: a microsimulation-based transit travel time prediction model and an advanced TSP control model. The TSP-Advance system takes input from the traffic and transit detection systems on the street, and outputs a TSP plan to replace the existing traffic signal timing. Figure 2 illustrates the fundamental procedure of TSP-Advance.
Figure 2: TSP-Advance System As shown in Figure 2, the procedure is activated by a bus arrival at any of the transit “check-in” detection points. The system conducts an identical procedure regardless of the detection point. For each priority plan as well as the existing traffic signal timing, the prediction model estimates the transit travel time to the stopline. Since the traffic signal timing at the downstream intersection affects the vehicle movements in the link, the prediction model delivers a different transit travel time for each priority plan. The priority plan that is expected to cause the least transit signal delay is implemented at the traffic signal controller, and TSP-Advance returns to standby status as the final step. In this procedure, TSP-Advance has a number of advanced features that make the proposed system distinct from other conventional TSP control methods. The following features provide more efficient signal priority control:
xi
• The system maintains a TSP plan library that contains a number of priority strategies, and
selects the most appropriate plan from the library for the real-time traffic and transit conditions;
• The TSP plan library includes several advanced TSP strategies in addition to the traditional transit phase green extension and non-transit phase truncation strategies;
• The priority control model attempts to minimize interruptions of the normal signal operation by including the option of no priority when the expected effects are not significant;
• The control model adopts a signal priority re-evaluation process at an intermediate “checkpoint”;
• The control model also provides transit headway-based conditional priority to improve transit service regularity;
• The transit prediction model estimates transit travel time using real-time traffic sensor data so that the impacts of changing traffic conditions can be accommodated in the prediction process;
• The prediction model is able to simulate transit movements up to any desired point on the link so that it can work with any dwell time estimation model for intersections with near-side transit stops.
The previously developed base algorithm, which was presented at TAG session number 2, operated unconditional TSP that provides signal priority to any transit vehicle once it is detected upstream of the intersection. The base algorithm was also able to operate TSP for a one-way transit route. The priority control model in the TSP-Advance system was improved in two ways: first, the control model includes priority control rules for multidirectional transit routes and second, the model provides conditional signal priority based on transit headway adherence information. The typical approach in multidirectional (i.e., two-way or four-way) TSP control is a first-come, first-served method. Therefore, if the signal controller is serving signal priority for a transit vehicle on one side of the link approach, all priority requests received from the other approaches are declined until the transit vehicle passes the intersection. However, this method naturally does not consider transit vehicles in the other link approaches, and this may incur increased delay to these transit vehicles. The TSP-Advance system adopts a new approach that selects a priority plan to maximize the benefits of TSP to all approaching transit vehicles. For instance, if more than one transit vehicle requests signal priority, TSP-Advance selects a TSP plan that is expected to produce the least transit signal delay for the approaching transit vehicles. Transit service regularity is one of the critical measurements of performance for transit users as well as transit agencies. Irregular transit services in terms of headway or schedule at transit stops increase passenger wait times and discourage passengers from using public transit. Transit services become inefficient as transit vehicles are unevenly spaced and even bunched. Bunching of transit vehicles causes frequent passenger overloading and spillback so that eventually more transit services are required, particularly during peak time periods. A number of operational strategies have been suggested to improve transit service adherence, including vehicle holding, stop-skipping, short-turning, and deadheading. Conditional TSP can improve transit service regularity by providing signal priority only to late transit vehicles. Within the TSP-Advance system, each time a bus passes the upstream sensor, the actual headway of the bus from the previous bus is calculated, and only the buses that are behind the scheduled headway can request signal priority. A significant component of the project was to evaluate the TSP algorithm developed. At the start of the project it was decided that the algorithm would be tested in a simulation environment. The Main Street bus corridor in the City of Brampton was selected for the simulation study. Main Street is one of Brampton’s major urban arterials crossing the city south-north with two lanes in each direction. Figure 3 shows the part of the corridor selected for the study, from the south edge at the downtown Brampton transit terminal to the north edge at Sandalwood Parkway.
xii

The selected section of Main Street is approximately 5.5 km long and includes 10 signalized intersections. Brampton bus line 2 operates on this corridor northbound and southbound with no signal priority operation. This route provides 10 minutes of service headway in both directions during the afternoon peak-time period between 3:00 pm and 7:00 pm. There are 34 bus stops along the selected section of the corridor: 17 northbound and 17 southbound. Generally, all bus stops are located near signalized intersections, with six near-side stops in the southbound direction and seven near-side stops in the northbound direction.
Sandalwood Pkwy.
Fisherman Dr.
Wexford Dr.
Bovaird Dr.
Quarry Edge Dr.
Brickyard Way
Williams Pkwy.
Vodden St.
Church St.
Main Street North
Gilliangham Dr.
Brampton downtowntransit terminal
Nelson St.
Main Street South
370m
360m
370m
360m
320m
240m
220m
210m
240m
120m
100m
200m
English St.
190m
240m
100m
350m
160m
270m
220m230m
F
FN
N
F
N
F
NF
N
N
F
N
NF
F
N
F
F
N
FF
N
N
N
F
F
N
Far-side bus stop
Near-side bus stop
N
Figure 3: Selected Study Area for Evaluation
xiii
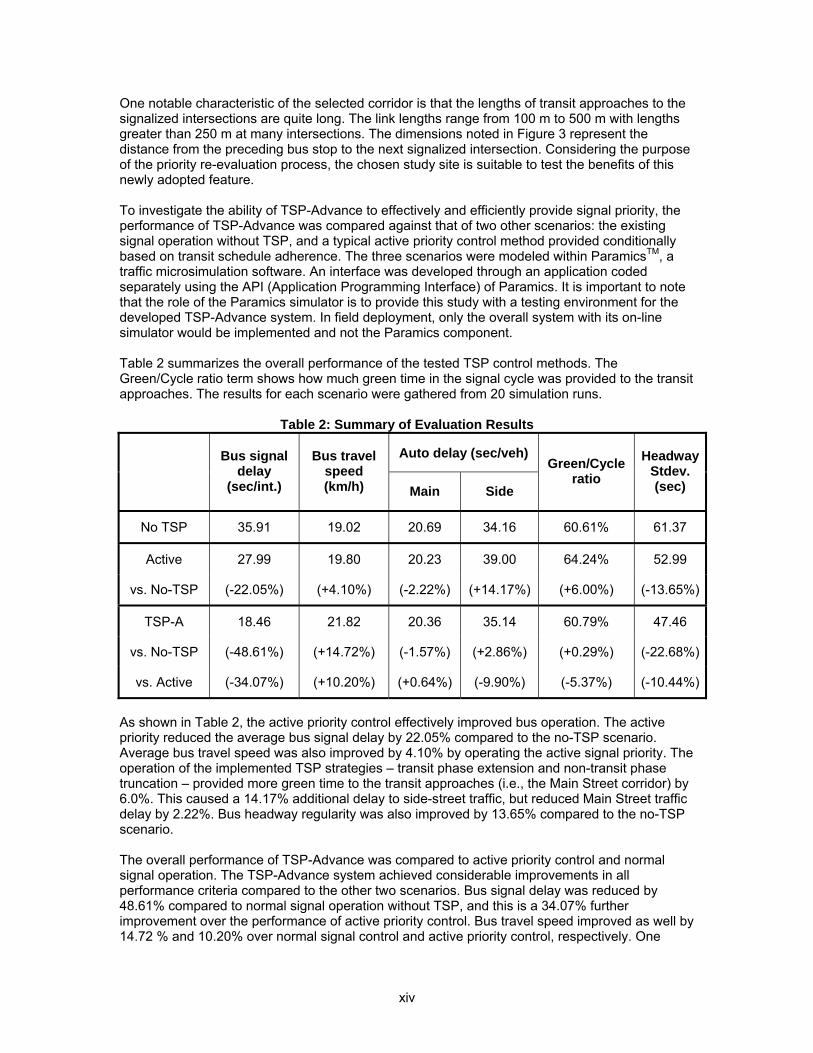
One notable characteristic of the selected corridor is that the lengths of transit approaches to the signalized intersections are quite long. The link lengths range from 100 m to 500 m with lengths greater than 250 m at many intersections. The dimensions noted in Figure 3 represent the distance from the preceding bus stop to the next signalized intersection. Considering the purpose of the priority re-evaluation process, the chosen study site is suitable to test the benefits of this newly adopted feature. To investigate the ability of TSP-Advance to effectively and efficiently provide signal priority, the performance of TSP-Advance was compared against that of two other scenarios: the existing signal operation without TSP, and a typical active priority control method provided conditionally based on transit schedule adherence. The three scenarios were modeled within ParamicsTM, a traffic microsimulation software. An interface was developed through an application coded separately using the API (Application Programming Interface) of Paramics. It is important to note that the role of the Paramics simulator is to provide this study with a testing environment for the developed TSP-Advance system. In field deployment, only the overall system with its on-line simulator would be implemented and not the Paramics component. Table 2 summarizes the overall performance of the tested TSP control methods. The Green/Cycle ratio term shows how much green time in the signal cycle was provided to the transit approaches. The results for each scenario were gathered from 20 simulation runs.
Table 2: Summary of Evaluation Results
Auto delay (sec/veh)
Bus signal delay
(sec/int.)
Bus travel speed (km/h) Main Side
Green/Cycle ratio
Headway Stdev. (sec)
No TSP 35.91 19.02 20.69 34.16 60.61% 61.37
Active 27.99 19.80 20.23 39.00 64.24% 52.99
vs. No-TSP (-22.05%) (+4.10%) (-2.22%) (+14.17%) (+6.00%) (-13.65%)
TSP-A 18.46 21.82 20.36 35.14 60.79% 47.46
vs. No-TSP (-48.61%) (+14.72%) (-1.57%) (+2.86%) (+0.29%) (-22.68%)
vs. Active (-34.07%) (+10.20%) (+0.64%) (-9.90%) (-5.37%) (-10.44%)
As shown in Table 2, the active priority control effectively improved bus operation. The active priority reduced the average bus signal delay by 22.05% compared to the no-TSP scenario. Average bus travel speed was also improved by 4.10% by operating the active signal priority. The operation of the implemented TSP strategies – transit phase extension and non-transit phase truncation – provided more green time to the transit approaches (i.e., the Main Street corridor) by 6.0%. This caused a 14.17% additional delay to side-street traffic, but reduced Main Street traffic delay by 2.22%. Bus headway regularity was also improved by 13.65% compared to the no-TSP scenario. The overall performance of TSP-Advance was compared to active priority control and normal signal operation. The TSP-Advance system achieved considerable improvements in all performance criteria compared to the other two scenarios. Bus signal delay was reduced by 48.61% compared to normal signal operation without TSP, and this is a 34.07% further improvement over the performance of active priority control. Bus travel speed improved as well by 14.72 % and 10.20% over normal signal control and active priority control, respectively. One
xiv

remarkable result obtained from the evaluation is that the substantial improvements in bus performance achieved by TSP-Advance caused only minor effects on side-street traffic delays. Average vehicle delay was only slightly increased (by 2.86%) for side-street traffic, and the green time ratio for the transit approaches was practically unchanged at +0.29%. Considering that bus signal delay was decreased by almost 50%, these results show the efficient TSP control by TSP-Advance. For bus service regularity, TSP-Advance reduced the headway standard deviation by 22.68% over the normal traffic signal. Compared to active priority control, this result represents an additional 10.44% reduction in the headway standard deviation. Moving the developed TSP algorithm and operational concept forward is a significant task involving financial and stakeholder commitments. TSP-Advance introduces new methods of assessing and providing TSP at signalized intersections. It challenges, in a reasonable manner, how current traffic and transit system are managed and operated. Further development is recommended in the design and integration of TSP-Advance into existing traffic control and transit management frameworks. Refinement of the algorithm and further evaluation through a pilot deployment is also recommended. The results of this research and development process for an advanced transit signal priority algorithm show significant improvements and market potential in comparison to typical transit signal priority systems currently being operated and/or installed. The process undertaken was not completed by the project team in isolation. In developing the overall direction for this project, comments and feedback were gathered from municipal traffic and transit system representatives to help guide the overall development and testing process. As such, the algorithm developed addresses real concerns and design issues associated with the deployment and operation of TSP. TSP-Advanced currently exists as a conceptual operation that has been developed and evaluated through a microsimulation environment. Further development is required before the algorithm can be deployed as a pilot along a transit corridor. Additional hardware and software planning and development are required to integrate the algorithm into existing traffic and transit system operations and supporting hardware.
xv

Sommaire Ce rapport résume la démarche, les travaux et les résultats du projet de recherche et développement d’un algorithme évolué de signaux de priorité aux véhicules de transport en commun. Ce projet fait partie d’un ensemble de projets entrepris sous l’égide du Plan de recherche et développement sur les STI de Transports Canada, en janvier 2004. Ces initiatives ont pour priorités : • Le transport urbain : gestion et régulation de la circulation, transports publics • La sécurité, la sûreté et la promotion du commerce : sécurité, sûreté et exploitation
des véhicules utilitaires • L’environnement : énergie, stations météo-route • Les fondements de l’innovation : élaboration de normes Ce projet d’algorithme de signaux de priorité aux véhicules de transport en commun s’inscrit sous la première de ces priorités. Il avait pour but de mettre au point un algorithme intelligent de signaux de priorité aux véhicules de transport en commun (TSP, transit signal priority) qui soit pratique, novateur et exploitable commercialement. Les objectifs fondamentaux du projet étaient les suivants : • développer un algorithme de signaux de priorité aux véhicules de transport en commun
(VTC) unique et novateur, ayant le potentiel d’être déployé sur le terrain; • stimuler l’échange d’idées et de connaissances entre le milieu de la recherche universitaire
et le secteur industriel pendant le développement de l’algorithme; • disposer d’un outil pour améliorer la mobilité et accroître l’efficacité des transports; • améliorer l’efficacité des opérations et de la réglementation, pour le bénéfice des usagers
et des organismes publics; • encourager le développement de produits et de services propres à accélérer l’acquisition
de connaissances et de compétences concernant les STI, et promouvoir le déploiement et la commercialisation des STI.
Le succès d’un projet dépend pour beaucoup de la participation du client à toutes les phases de celui-ci. Plus tôt le client s’investit dans le projet et assume la propriété du produit qui en résultera, plus les chances de succès sont grandes. Il est donc essentiel, dans tout processus, de consulter toutes les parties intéressées, y compris les groupes d’utilisateurs potentiels, les membres clés de l’équipe et les autres intervenants concernés. C’est ainsi que tout au long du projet, les parties intéressées ont pris part aux travaux de deux instances : le Comité de direction du projet et le Groupe consultatif technique. Le Comité de direction était constitué du Responsable scientifique (agent de projet de Transports Canada), de représentants invités de services municipaux de la circulation et de sociétés de transport en commun, et d’un représentant du Bureau des STI de Transports Canada. Le Groupe consultatif technique (GCT) était composé de représentants invités d’un spectre plus large d’organismes municipaux et de sociétés de transport en commun, notamment de municipalités qui exploitent déjà un programme de TSP, qui travaillent à la conception d’un tel programme ou qui songent à en créer un. L’équipe de projet a organisé des séances de travail avec le GCT afin d’échanger de l’information sur le projet et de mieux comprendre les besoins, les enjeux de conception et les défis réels que représentent le déploiement et l’exploitation d’un système TSP.
xvii
Une recherche documentaire a été menée afin de cerner les besoins de recherche et développement en matière de TSP. Cette recherche a étoffé et confirmé l’appréciation de l’équipe de recherche à l’égard de l’état actuel de la pratique dans le domaine des TSP, et des axes dans lesquels devraient s’orienter les travaux de développement futurs. À la lumière de l’information glanée au cours de la recherche documentaire et de son expérience, l’équipe de projet a dressé une liste de lacunes à combler dans l’état actuel de la pratique :
1. Retards excessifs imposés à la circulation générale à l’intersection, en particulier à la circulation transversale, en cas de saturation de la circulation
2. TSP inutiles (lorsque le véhicule de transport en commun est en avance sur son horaire) 3. Rappel/re-coordination des temps de cycle des feux de circulation après une intervention
TSP, ce qui peut prendre plusieurs cycles 4. Mise en œuvre de TSP sur des itinéraires de transport en commun associés à de courts
intervalles entre véhicules, dans des corridors encombrés 5. Application limitée des stratégies évoluées de commande des TSP 6. Insuffisance de méthodes/algorithmes évolués de commande des TSP fondés sur des
technologies de pointe comme la localisation automatisée des véhicules et/ou le comptage automatique de passagers, alors que ces technologies sont de plus en plus répandues
7. Interfaçage avec les systèmes de gestion/d’établissement des horaires de la société de transport en commun, pour la transmission de l’information en temps réel
La recherche documentaire a également mis au jour quelques axes susceptibles de représenter un intérêt particulier pour les chercheurs qui travaillent à l’élaboration de nouveaux algorithmes de TSP :
1. Système centralisé, pour une meilleure fonctionnalité des TSP à la grandeur du réseau, et pour permettre l’échange d’information et contribuer ainsi à l’atteinte des objectifs de l’Architecture STI
2. Priorité conditionnelle (subordonnée aux données sur l’horaire, sur les passagers, sur la saturation de la circulation, etc.)
3. Système adaptatif, permettant de minimiser les retards inutiles imposés à la circulation restante et d’améliorer le taux de succès des TSP
4. Sélection dynamique, parmi un éventail élargi de stratégies de TSP, de celle qui est susceptible d’être la plus efficace dans une situation particulière, eu égard au degré de congestion, au point précis du cycle de signalisation, etc.
Certaines questions reliées aux TSP doivent faire l’objet de travaux approfondis de recherche-développement, dont les suivantes :
1. Séquences de reprise pour mieux gérer la re-synchronisation des phases des feux de circulation
2. Méthodes améliorées de gestion de la priorité conditionnelle; p. ex., prévoir différents niveaux de priorité et faire en sorte que la séquence des TSP comporte des avantages pour le VTC et/ou la circulation générale ou l’intersection
3. Amélioration des configurations du système pour permettre de colliger davantage de données en temps réel, de façon que les décisions prises par le système soient plus judicieuses
4. Intégration avec d’autres systèmes pour faciliter la collecte et le partage de données en temps réel
5. Amélioration/développement d’un système centralisé de régulation de la circulation, pour des fonctions et une commande améliorées des TSP, par rapport à l’état actuel de développement du système, qui assure la commande et l’exploitation ponctuelles des TSP à l’intersection
6. Mécanismes améliorés de gestion des demandes d’interventions de priorité dans un réseau où la circulation est saturée; cela peut comprendre la modélisation prédictive
xviii
et la modification du réglage des temps du cycle des feux de circulation en prévision de l’arrivée du VTC
7. Système adaptatif de TSP, avec détection des VTC aux intersections précédentes 8. Meilleure utilisation des fonctions des TSP à l’intérieur de réseaux de feux de circulation
gérés par des systèmes de régulation adaptative comme SCOOT (Split Cycle Offset Optimization Technique) ou SCATS (Sydney Coordinated Adaptive Traffic System)
9. Élimination des files de véhicules avant que les VTC arrivent, afin de minimiser le retard et les erreurs dans la progression attendue du VTC vers une intersection signalisée
10. Application à une seule et même séquence de plusieurs stratégies de commande, pour une intervention optimale des TSP
11. Prise en compte des données historiques sur la circulation et les temps de parcours des VTC dans les décisions relatives à l’activation de TSP pour des VTC qui s’approchent de l’intersection
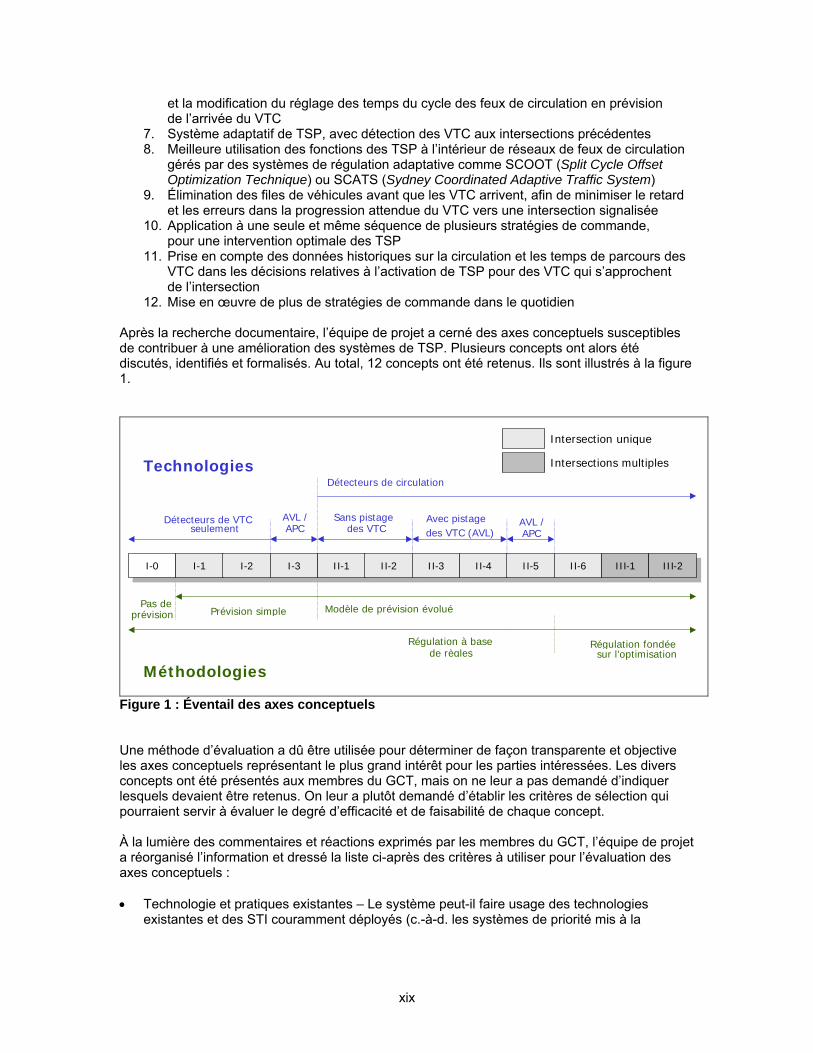
12. Mise en œuvre de plus de stratégies de commande dans le quotidien Après la recherche documentaire, l’équipe de projet a cerné des axes conceptuels susceptibles de contribuer à une amélioration des systèmes de TSP. Plusieurs concepts ont alors été discutés, identifiés et formalisés. Au total, 12 concepts ont été retenus. Ils sont illustrés à la figure 1.
I - 0 I - 0 I - 1 I - 1 I - 2 I- 2 I - 3 I - 3 II-1II-1 II-2II-2 II-3II-3 II-4II-4 II-5II-5 II - 6 II - 6 III - 1 III - 1 III-2III-2
Détecteurs de circulation
Régulation fondée sur l’optimisation
Régulation à basede règles
Sans pistage des VTC
Avec pistage des VTC (AVL)
AVL / APC
Détecteurs de VTC seulement
Technologies
Intersection unique
Prévision simple Pas de
prévision Modèle de prévision évolué
Méthodologies
Intersections multiples
AVL /APC
Figure 1 : Éventail des axes conceptuels Une méthode d’évaluation a dû être utilisée pour déterminer de façon transparente et objective les axes conceptuels représentant le plus grand intérêt pour les parties intéressées. Les divers concepts ont été présentés aux membres du GCT, mais on ne leur a pas demandé d’indiquer lesquels devaient être retenus. On leur a plutôt demandé d’établir les critères de sélection qui pourraient servir à évaluer le degré d’efficacité et de faisabilité de chaque concept. À la lumière des commentaires et réactions exprimés par les membres du GCT, l’équipe de projet a réorganisé l’information et dressé la liste ci-après des critères à utiliser pour l’évaluation des axes conceptuels : • Technologie et pratiques existantes – Le système peut-il faire usage des technologies
existantes et des STI couramment déployés (c.-à-d. les systèmes de priorité mis à la
xix

disposition des services d’urgence/d’incendie, les transmissions radio, etc.)? Le système est-il conforme aux pratiques existantes de régulation des feux de circulation?
• Architecture STI – Le système peut-il être intégré et/ou étendu à d’autres services? • AVL – Beaucoup de sociétés de transport en commun s’intéressent à la localisation
automatisée des véhicules (AVL) ou l’utilisent déjà. Le concept peut-il s’harmoniser à un système AVL?
• Coûts d’achat et d’exploitation – Estimation générale des coûts : le déploiement du système entraînera-t-il des coûts élevés, raisonnables ou faibles?
• Avantages pour les opérations du réseau de transport en commun et les services offerts – Le système peut-il être intégré aux opérations existantes du réseau et permet-il d’élargir l’offre de services?
• Effets négatifs sur les habitudes des conducteurs – Le système risque-t-il d’avoir un effet très négatif sur les habitudes de conduite?
• Normes (technologie et exploitation) – Le concept proposé respecte-t-il les normes en vigueur et les normes émergentes (NTCIP, TCIP, régulation de la circulation, etc.)?
• Délai de déploiement – Le système peut-il être déployé dans un délai relativement court et réaliste?
• Soutien et entretien du système – Le système serait-il facile à entretenir? • Impact sur la circulation – Le système tient-il compte de l’impact sur la circulation,
tant sur l’axe principal que sur les rues transversales? • Impact sur les piétons – Le système tient-il compte de la circulation piétonnière, ou à tout
le moins tente-t-il de minimiser l’impact sur les piétons? • Cadre de mise en œuvre – Le système conviendrait-il à l’environnement auquel on le destine
(c.-à-d. un service de fréquence moyenne à élevée, un axe principal de transport en commun, des arrêts situés en amont de l’intersection)?
• Application amont/aval – La stratégie peut-elle être utilisée pour tous les arrêts d’autobus, qu’ils soient situés en amont ou en aval de l’intersection?
Conformément à la méthode d’évaluation adoptée et à la lumière des résultats obtenus, il est recommandé d’étoffer davantage les concepts figurant en tête de liste, que l’on trouve au tableau 1, au cours de la phase d’avant-projet.
Tableau 1 : Premiers axes conceptuels Concept Rang
Niveau II-1 3 Niveau II-3 1 Niveau II-4 1 Niveau II-5 2
Pour appuyer l’équipe de projet et les intervenants dans l’examen des concepts retenus, chaque concept a fait l’objet d’une étude préliminaire. Par la suite, l’équipe de projet a tenu compte des commentaires exprimés par les membres du GCT et du Comité de direction pour déterminer le concept qui serait développé plus avant. Finalement, c’est le concept II-3.5, soit une variante du concept II-3, qui a été retenu. Voici les grandes lignes de ce concept : • les véhicules de transport en commun sont équipés d’un calculateur intelligent (VLU, vehicle
logic unit); • un système embarqué de localisation automatique des véhicules (AVL) indique au VLU
la position du véhicule en temps réel; • le VLU détermine s’il y a lieu de déclencher des TSP, selon un algorithme à base de règles
subordonné au respect de l’horaire; • si le VLU détermine qu’une intervention TSP est justifiée pour respecter l’horaire du véhicule
de transport en commun, l’émetteur TSP s’active à l’endroit voulu le long du trajet;
xx
• des détecteurs TSP, ou des points de détection, jalonnent la voie d’approche. Ils colligent le
temps de parcours du VTC et ces données sont relayées au régulateur de feux de circulation; un seul point de détection, ou point de surveillance, peut aussi être désigné;
• des détecteurs de circulation, situés en amont et en aval le long du parcours du véhicule de transport en commun, mesurent le débit de circulation et la vitesse et la densité des véhicules; ces données sont relayées au régulateur de feux de circulation;
• le régulateur de feux de circulation2 évalue les données à l’aide d’un modèle de prévision du temps de parcours appliqué aux données en temps réel sur le temps de parcours des VTC et la circulation, enregistrées par le système AVL;
• le régulateur de feux de circulation contrôle continuellement les mises à jour du temps de parcours prévu du VTC;
• des stratégies de TSP sont déclenchées soit par le régulateur de feux de circulation local ou par l’ordinateur central de régulation de la circulation, d’après le temps de parcours prévu du VTC, au moyen d’un algorithme à base de règles;
• la séquence des TSP est non conditionnelle à l’état de la circulation générale, mais conditionnelle au respect de l’horaire du VTC, critère déterminé précédemment;
• le régulateur de feux de circulation déclenche un plan de rappel de phase normale lorsque l’intervention des TSP n’est plus nécessaire ou qu’elle a atteint le temps maximal.
L’algorithme de TSP élaboré dans le cadre du présent projet a été baptisé TSP-Advance. TSP-Advance est un système évolué de commande de signaux de priorité qui réagit aux données en temps réel sur l’état de la circulation et les VTC. Le système TSP-Advance comprend deux éléments essentiels : un modèle de microsimulation du temps de parcours des VTC et un modèle évolué de commande des TSP. Le système TSP-Advance collige les données en temps réel des détecteurs de circulation et des détecteurs de VTC encastrés dans la chaussée, et restitue un plan TSP qui modifie en conséquence le cycle de signalisation existant. La figure 2 illustre le fonctionnement du système TSP-Advance.
2 Dans le présent projet, la régulation des feux de circulation renvoie à un régulateur évolué, doté de fonctions programmables, à un régulateur à programme intégré, ou à un système centralisé de régulation.
xxi

En attente
Détection d’autobus au point de contrôle en amont
(lancement de la procédure)
Évaluation des plans TSP à l’aide du modèle de prévision
Sélection d’un plan TSP
Application du plan choisi
Fin de la procédure initiale
Détection d’un autobus au point intermédiaire
(relancement de la procédure)
Réévaluation des plans TSP
Sélection d’un plan TSP (arbre de sélection)
Remplacer, annuler ou garder le plan TSP initial
Fin de la procédure
Figure 2 : Système TSP-Advance
Comme le montre la figure 2, la procédure est activée par l’arrivée d’un autobus à un point de détection («de surveillance»). Le système applique la même procédure peu importe le point de détection. Pour chaque plan de priorité, de même que pour le cycle existant de feux de circulation, le modèle de prévision calcule le temps de parcours de l’autobus jusqu’à la ligne d’arrêt. Comme le cycle des feux de circulation à l’intersection en aval influe sur les mouvements de véhicules entre celle-ci et l’intersection précédente, le modèle détermine un temps de parcours différent pour chaque plan TSP. Le plan susceptible d’être le moins pénalisant pour l’horaire de l’autobus est appliqué au régulateur de feux de circulation, après quoi le système TSP-Advance se remet en attente. Cette procédure est possible grâce aux caractéristiques évoluées du système TSP-Advance, qui le distinguent des autres méthodes classiques de commande de signaux de priorité. Voici les caractéristiques qui permettent de commander plus efficacement les signaux de priorité : • le système comprend une bibliothèque de plans TSP parmi lesquels il choisit le plus
approprié selon les données en temps réel sur l’état de la circulation et les VTC; • la bibliothèque de plans TSP comprend plusieurs stratégies TSP évoluées, en plus des
stratégies traditionnelles d’extension de la durée du feu vert pour le VTC et d’abrègement de phases pour la circulation générale;
• le modèle de commande des signaux de priorité essaie de perturber le moins possible le fonctionnement normal des feux de circulation, par une option qui permet de passer outre à toute intervention TSP lorsque les gains attendus sont négligeables;
xxii

• le modèle prévoit un processus de réévaluation des signaux de priorité à un point
de surveillance intermédiaire; • le modèle prévoit également une priorité conditionnelle fondée sur l’intervalle entre
les VTC, qui permet d’améliorer la régularité du service; • le modèle calcule le temps de trajet des autobus à partir des données en temps réel
enregistrées par les détecteurs de circulation; ainsi, il prend en compte les effets de toute intervention sur la circulation;
• le modèle est capable de simuler la progression des véhicules de transport en commun jusqu’à n’importe quel point sur la ligne. Il peut donc être conjugué à n’importe quel modèle d’estimation des temps d’arrêt, pour les intersections où les arrêts d’autobus sont situés en amont.
L’algorithme de base élaboré dans un premier temps et présenté à la deuxième réunion du GCT déclenchait des TSP inconditionnels, qui établissaient des signaux de priorité pour tous les VTC qui étaient détectés en amont de l’intersection. L’algorithme de base pouvait aussi déclencher des TSP pour une ligne de transport en commun unidirectionnelle. Le modèle de commande des signaux de priorité du système TSP-Advance a été amélioré de deux façons : premièrement, des règles ont été incorporées pour des lignes multidirectionnelles et deuxièmement, le modèle peut déclencher des signaux de priorité conditionnels, subordonnés aux données concernant le respect de l’intervalle prévu entre VTC. «Premier arrivé, premier servi» est le principe qui guide habituellement la commande des TSP multidirectionnels (c.-à-d. régissant deux ou quatre approches). Par conséquent, si le régulateur de feux de circulation déclenche des signaux de priorité pour un VTC provenant d’une approche, toutes les demandes de priorité émanant des autres approches seront refusées jusqu’à ce que le VTC ait traversé l’intersection. Mais cette méthode ne tient naturellement pas compte des VTC qui peuvent se trouver sur ces «autres approches», d’où des retards possibles pour ces véhicules. Le système TSP-Advance est novateur en ce qu’il choisit un plan de priorité qui maximise les avantages des TSP pour tous les VTC qui s’approchent d’une intersection. Par exemple, si plus d’un VTC demande des signaux de priorité, TSP-Advance choisit le plan TSP qui devrait causer le moins de retard aux VTC qui s’approchent de l’intersection. La régularité du service de transport en commun est l’un des grands critères de performance d’un réseau, tant pour les usagers que pour les responsables. Un service irrégulier (intervalle irrégulier entre les autobus arrivant à l’arrêt, ou horaire non respecté) accroît le temps d’attente des usagers et détournent ceux-ci du transport en commun. Le service devient inefficace lorsque les véhicules sont inégalement espacés et même lorsqu’ils s’accumulent en groupes. Ainsi, l’accumulation de véhicules mène souvent à l’embarquement d’un nombre excessif de passagers, certains devant rester en plan. On en vient donc à devoir augmenter les services, en particulier pendant les périodes de pointe. Diverses stratégies ont été proposées pour améliorer le respect des horaires : retenue de véhicules, sauts d’arrêt, services sur faible distance, ajouts de véhicules. Les TSP conditionnels peuvent améliorer la régularité du service en ne se déclenchant que pour les véhicules qui sont en retard. En vertu du système TSP-Advance, chaque fois qu’un autobus est détecté en amont d’une intersection, le temps réel entre l’autobus et celui qui le précède est calculé, et seuls les autobus qui dépassent l’intervalle prévu peuvent demander des signaux de priorité. Un volet important du projet était d’évaluer le nouvel algorithme de TSP. Dès le début du projet, il a été décidé de tester l’algorithme dans un environnement simulé. Le corridor d’autobus de Main Street, à Brampton, a été choisi pour la simulation. Main Street est l’une des principales artères de Brampton. Constituée de deux voies dans chaque direction, elle traverse la ville dans l’axe nord-sud. La figure 3 montre la partie de l’artère choisie pour l’étude, qui va de la gare routière du centre-ville de Brampton, au sud, à Sandalwood Parkway, au nord. Ce tronçon, d’une longueur d’environ 5,5 km, comprend 10 intersections
xxiii
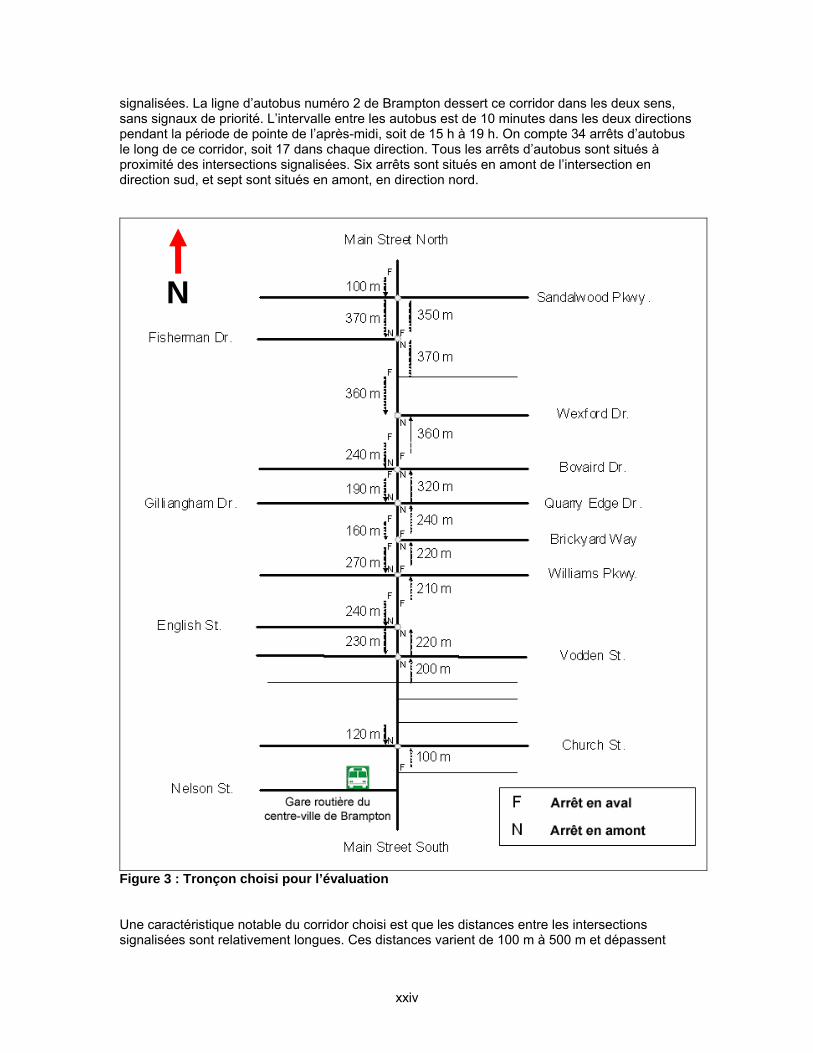
signalisées. La ligne d’autobus numéro 2 de Brampton dessert ce corridor dans les deux sens, sans signaux de priorité. L’intervalle entre les autobus est de 10 minutes dans les deux directions pendant la période de pointe de l’après-midi, soit de 15 h à 19 h. On compte 34 arrêts d’autobus le long de ce corridor, soit 17 dans chaque direction. Tous les arrêts d’autobus sont situés à proximité des intersections signalisées. Six arrêts sont situés en amont de l’intersection en direction sud, et sept sont situés en amont, en direction nord.
N
Figure 3 : Tronçon choisi pour l’évaluation Une caractéristique notable du corridor choisi est que les distances entre les intersections signalisées sont relativement longues. Ces distances varient de 100 m à 500 m et dépassent
xxiv
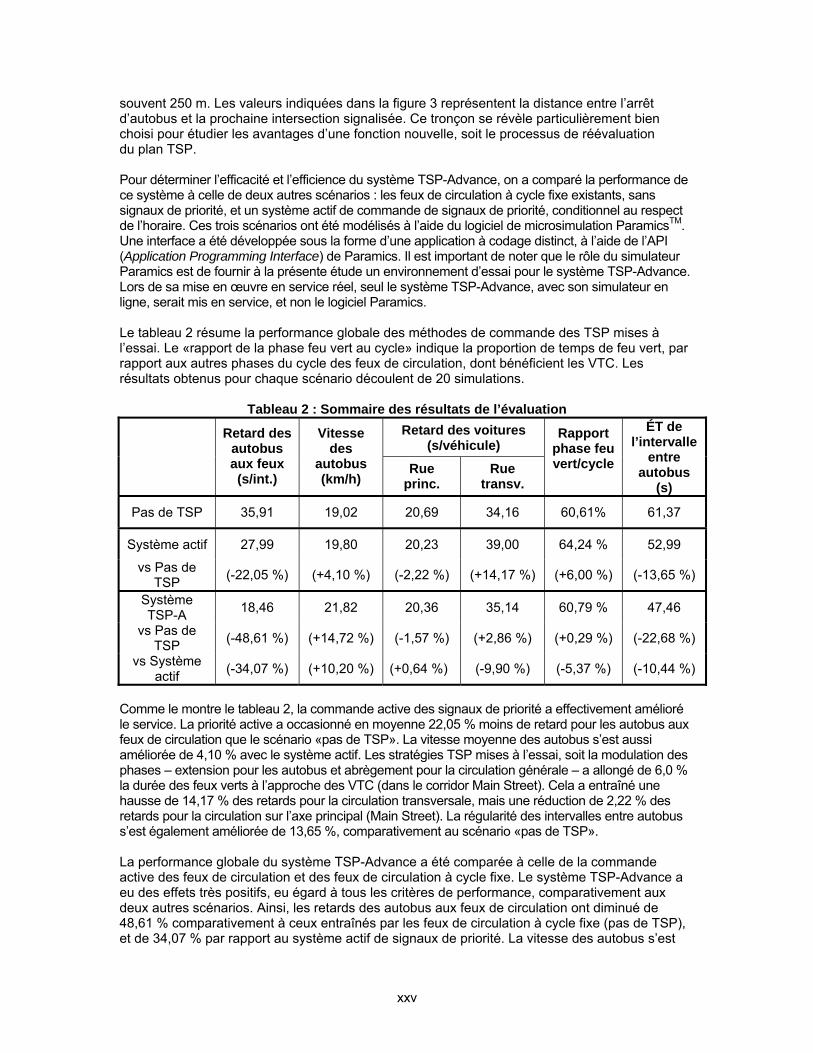
souvent 250 m. Les valeurs indiquées dans la figure 3 représentent la distance entre l’arrêt d’autobus et la prochaine intersection signalisée. Ce tronçon se révèle particulièrement bien choisi pour étudier les avantages d’une fonction nouvelle, soit le processus de réévaluation du plan TSP. Pour déterminer l’efficacité et l’efficience du système TSP-Advance, on a comparé la performance de ce système à celle de deux autres scénarios : les feux de circulation à cycle fixe existants, sans signaux de priorité, et un système actif de commande de signaux de priorité, conditionnel au respect de l’horaire. Ces trois scénarios ont été modélisés à l’aide du logiciel de microsimulation ParamicsTM. Une interface a été développée sous la forme d’une application à codage distinct, à l’aide de l’API (Application Programming Interface) de Paramics. Il est important de noter que le rôle du simulateur Paramics est de fournir à la présente étude un environnement d’essai pour le système TSP-Advance. Lors de sa mise en œuvre en service réel, seul le système TSP-Advance, avec son simulateur en ligne, serait mis en service, et non le logiciel Paramics. Le tableau 2 résume la performance globale des méthodes de commande des TSP mises à l’essai. Le «rapport de la phase feu vert au cycle» indique la proportion de temps de feu vert, par rapport aux autres phases du cycle des feux de circulation, dont bénéficient les VTC. Les résultats obtenus pour chaque scénario découlent de 20 simulations.
Tableau 2 : Sommaire des résultats de l’évaluation Retard des voitures
(s/véhicule)
Retard des autobus aux feux (s/int.)
Vitesse des
autobus (km/h)
Rue princ.
Rue transv.
Rapport phase feu vert/cycle
ÉT de l’intervalle
entre autobus
(s)
Pas de TSP 35,91 19,02 20,69 34,16 60,61% 61,37
Système actif 27,99 19,80 20,23 39,00 64,24 % 52,99
vs Pas de TSP (-22,05 %) (+4,10 %) (-2,22 %) (+14,17 %) (+6,00 %) (-13,65 %)
Système TSP-A 18,46 21,82 20,36 35,14 60,79 % 47,46
vs Pas de TSP (-48,61 %) (+14,72 %) (-1,57 %) (+2,86 %) (+0,29 %) (-22,68 %)
vs Système actif (-34,07 %) (+10,20 %) (+0,64 %) (-9,90 %) (-5,37 %) (-10,44 %)
Comme le montre le tableau 2, la commande active des signaux de priorité a effectivement amélioré le service. La priorité active a occasionné en moyenne 22,05 % moins de retard pour les autobus aux feux de circulation que le scénario «pas de TSP». La vitesse moyenne des autobus s’est aussi améliorée de 4,10 % avec le système actif. Les stratégies TSP mises à l’essai, soit la modulation des phases – extension pour les autobus et abrègement pour la circulation générale – a allongé de 6,0 % la durée des feux verts à l’approche des VTC (dans le corridor Main Street). Cela a entraîné une hausse de 14,17 % des retards pour la circulation transversale, mais une réduction de 2,22 % des retards pour la circulation sur l’axe principal (Main Street). La régularité des intervalles entre autobus s’est également améliorée de 13,65 %, comparativement au scénario «pas de TSP». La performance globale du système TSP-Advance a été comparée à celle de la commande active des feux de circulation et des feux de circulation à cycle fixe. Le système TSP-Advance a eu des effets très positifs, eu égard à tous les critères de performance, comparativement aux deux autres scénarios. Ainsi, les retards des autobus aux feux de circulation ont diminué de 48,61 % comparativement à ceux entraînés par les feux de circulation à cycle fixe (pas de TSP), et de 34,07 % par rapport au système actif de signaux de priorité. La vitesse des autobus s’est
xxv

également améliorée de 14,72 % et de 10,20 %, respectivement, par rapport aux feux de circulation à cycle fixe et à un système actif de priorité. Un aspect des résultats est particulièrement digne de mention, à savoir que, en contrepartie de ces gains substantiels réalisés grâce au système TSP-Advance, les retards des circulations transversales ont été négligeables. Le temps moyen d’attente des véhicules a augmenté très peu, soit de 2,86 % sur les rues transversales, et la proportion du temps de feu vert pour les approches des VTC est demeurée quasi inchangée, à +0,29 %. Considérant que les retards subis par les autobus aux feux de circulation ont diminué de près de 50 %, ces résultats indiquent une commande efficace des signaux de priorité par le système TSP-Advance. Pour ce qui est de la régularité du service, TSP-Advance a réduit l’écart type de l’intervalle entre autobus de 22,68 %, par rapport aux feux de circulation à cycle fixe. Comparativement au système actif de signaux de priorité, ce résultat représente une réduction de 10,44 % de plus de l’écart-type de l’intervalle entre autobus. Développer plus avant l’algorithme et le concept opérationnel des TSP représente un travail de taille et commande des engagements financiers et autres de la part des intervenants. Le système TSP-Advance introduit de nouvelles méthodes d’évaluation et de déclenchement de plans TSP aux intersections signalisées. Il remet en cause les pratiques actuelles en matière de gestion de la circulation et d’exploitation des réseaux de transport en commun. Il est recommandé de poursuivre le développement du système TSP-Advance, en vue de son intégration aux cadres existants de régulation de la circulation et de gestion du transport en commun. Il est aussi recommandé de perfectionner l’algorithme et de l’évaluer en service réel. Les résultats de ces travaux de recherche et développement indiquent que l’algorithme évolué de signaux de priorité TSP-Advance représente un grand pas en avant et un grand potentiel commercial par rapport aux systèmes TSP types actuellement exploités et/ou installés. L’équipe qui a entrepris ce projet s’est bien gardée de travailler en vase clos. Ainsi, pour définir l’orientation générale du projet et préparer les essais, elle a sollicité les commentaires de représentants de services municipaux de la circulation et de sociétés de transport en commun. L’algorithme qui résulte des travaux répond donc aux préoccupations réelles et aux enjeux de conception associés au déploiement et à l’exploitation d’un système de signaux prioritaires pour les véhicules de transport en commun. Le système TSP-Advance existe présentement en tant que système conceptuel, développé et évalué dans un environnement créé par microsimulation. D’autres travaux de développement sont nécessaires avant que l’algorithme puisse être déployé dans le cadre d’un projet pilote, dans un corridor de transport en commun. Des travaux supplémentaires de planification de matériel et de développement de logiciel seront aussi nécessaires pour intégrer l’algorithme aux activités actuelles de surveillance de la circulation et d’exploitation d’un réseau de transport en commun, et au matériel qui appuie ces activités.
xxvi
Table of Contents 1.0 Introduction ..........................................................................................................................1
1.1 Background............................................................................................................... 1 1.2 Objectives ................................................................................................................. 1 1.3 General Scope of Work ............................................................................................ 1
2.0 Project Approach and Organization.....................................................................................3 2.1 Project Steering Committee...................................................................................... 3 2.2 Technical Advisory Group......................................................................................... 4 2.3 Organization and Relationship.................................................................................. 5
3.0 Literature Review.................................................................................................................5 3.1 Overview of TSP....................................................................................................... 6 3.2 System Design Concepts ......................................................................................... 7
3.2.1 Priority Control Strategies......................................................................... 7 3.3 TSP Limitations and Areas of Research................................................................... 8
3.3.1 Limitations of Existing TSP Practices....................................................... 9 3.3.2 General Areas of Focus for the Development of a TSP Algorithm........... 9 3.3.3 Specific State-of-the-Art TSP Operational Concepts and Practices for
Consideration ........................................................................................... 9 4.0 Identification of TSP Concept Direction and Preliminary Design ..................................... 10
4.1 Basis for Concept Direction Identification............................................................... 10 4.2 Concept Direction Preliminary Design .................................................................... 10 4.3 Technology and Deployment Limitations................................................................ 15
5.0 TSP Concept Direction Selection ..................................................................................... 15 5.1 Evaluation Process ................................................................................................. 15 5.2 Concept Direction Short Listing .............................................................................. 16
5.2.1 Identification and Refinement of the Evaluation Criteria ........................ 17 5.2.2 Selection Result...................................................................................... 18
5.3 Concept Direction Selection for Detailed Design.................................................... 18 5.3.1 Preliminary Design of Short-Listed Concepts......................................... 18 5.3.2 Refinement of Criteria and Discussion Details ....................................... 27 5.3.3 Selection Result...................................................................................... 27
6.0 Detailed Design ................................................................................................................ 28 6.1 Preliminary Design of Concept ............................................................................... 28 6.2 Detailed Design of Concept .................................................................................... 29
6.2.1 High Performance On-Line Microsimulation Model for Transit Travel Time Prediction....................................................................................... 30
6.2.2 The TSP Plan Library ............................................................................. 33 6.2.3 The Signal Priority Re-evaluation Process............................................. 33 6.2.4 The On-Line Microsimulation Model for Transit Travel Time Prediction 36
7.0 Test Site............................................................................................................................ 37 7.1 Test Site Options .................................................................................................... 37 7.2 Test Site Selection Criteria ..................................................................................... 37
7.2.1 TAG-Suggested Evaluation Environments............................................. 37 7.2.2 Other TAG-Suggested Considerations................................................... 37 7.2.3 Consolidated Route Selection Criteria Options...................................... 37
7.3 Preferred Test Site Description............................................................................... 38 8.0 Microsimulation Environment and Process ...................................................................... 40
8.1 Simulation Modeling Data Requirements ............................................................... 41 8.2 Data Collection Process ......................................................................................... 42 8.3 Simulation Modeling Program Selected.................................................................. 42
8.3.1 Description of Paramics.......................................................................... 42
xxvii
8.4 Simulation Process and Modeling Issues Encountered ......................................... 43
8.4.1 Skeleton Network Coding....................................................................... 43 8.4.2 Network Refinement ............................................................................... 43 8.4.3 Bus Route Coding .................................................................................. 43 8.4.4 Intersection Coding................................................................................. 43 8.4.5 Traffic Demand ....................................................................................... 44 8.4.6 Model Calibration.................................................................................... 45
8.5 Evaluation Criteria................................................................................................... 46 9.0 Results and Analysis ........................................................................................................ 46
9.1 Presentation of Results Tables............................................................................... 46 9.2 Analysis of Results.................................................................................................. 47
10.0 Marketplace Considerations ............................................................................................. 51 11.0 Recommendations............................................................................................................ 52 12.0 Conclusions ...................................................................................................................... 52
Appendix Technical Paper – Literature Overview Brief
xxviii
List of Figures Figure 1: Project Work Plan Outline ..............................................................................................2 Figure 2: Project Organization.......................................................................................................5 Figure 3: Range of Concept Directions ...................................................................................... 11 Figure 4: Concept Level II-1 Intersection Layout........................................................................ 23 Figure 5: Concept Level II-1 Algorithmic Details ........................................................................ 23 Figure 6: Concept Level II-3 Intersection Layout........................................................................ 24 Figure 7: Concept Level II-3 Algorithmic Details ........................................................................ 24 Figure 8: Concept Level II-4 Intersection Layout........................................................................ 25 Figure 9: Concept Level II-4 Algorithmic Details ........................................................................ 25 Figure 10: Concept Level II-5 Intersection Layout........................................................................ 26 Figure 11: Concept Level II-5 Algorithmic Details ........................................................................ 26 Figure 12: TSP-Advance System ................................................................................................. 28 Figure 13: Configuration of the TSP-Advance Detection System ................................................ 34 Figure 14: Priority Plan Selection Tree......................................................................................... 35 Figure 15: Partially Developed ..................................................................................................... 39 Figure 16: Downtown Core........................................................................................................... 39 Figure 17: Residential Area .......................................................................................................... 39 Figure 18: Commercial Strip Mall ................................................................................................. 39 Figure 19: Big Box Commercial Development ............................................................................. 39 Figure 20: Major Signalized Intersection ...................................................................................... 39 Figure 21: Selected Study Area for the Evaluation ...................................................................... 40 Figure 22: Evaluation Results for Bus Signal Delay by Intersection ............................................ 48 Figure 23: Evaluation Results for Signal Delay by Stop Locations and Link Lengths.................. 49 Figure 24: Evaluation Results....................................................................................................... 50 List of Tables Table 1: Steering Committee Participants.......................................................................................3 Table 2: TSP Concept Direction Preliminary Design Details........................................................ 13 Table 3: General TAG Feedback.................................................................................................. 15 Table 4: Evaluation Criteria and Factored Ratings....................................................................... 17 Table 5: Top Ranking Concept Directions.................................................................................... 18 Table 6: Preliminary Design of TSP Algorithm Frameworks ........................................................ 19 Table 7: Requested Data for Simulation Modeling....................................................................... 41 Table 8: Summary of Evaluation Results ..................................................................................... 47
xxix
Glossary APC Automatic Passenger Counters
API Application Programming Interface
AVL Automated Vehicle Location
CAD Computer Aided Drafting
CUTA Canadian Urban Transit Association
DOW Day of Week
DXF Drawing Exchange Format
EMS Emergency Management Services
GPS Global Positioning System
HOV High Occupancy Vehicle
ITS Intelligent Transportation Systems
LOS Level of Service
MOE Measure of Effectiveness
NEMA National Electrical Manufacturers Association
NTCIP National Transportation Communications for ITS Protocol
O-D Origin-Destination
POZ Priority Operation Zone
RHODES Real-time Hierarchical Optimized Distributed Effective System
RWIS Road Weather Information System
SCATS Sydney Coordinated Adaptive Traffic System
SCOOT Split Cycle Offset Optimization Technique
TAG Technical Advisory Group
TCIP Transit Communications Interface Profiles
TIFF Tagged Image File Format
TOD Time of Day
TRB Transportation Research Board
TRIS Transportation Research Information Services
TSP Transit Signal Priority
UTM Universal Transverse Mercator
VLU Vehicle Logic Unit
VO Vehicle Occupancy
xxx

1.0 INTRODUCTION This report summarizes the process undertaken, work completed, and results obtained for the Research and Development of an Advanced Transit Signal Priority Algorithm.
1.1 Background This project was one of several awarded under Transport Canada’s ITS Research and Development plan in January 2004. Projects awarded under the program were in response to the following broad priorities:
• Urban transportation: traffic management and control, public transit • Safety, security and trade: safety, security, and commercial vehicle operations • Environment: energy, road weather information systems (RWIS) • Foundations: standards development This Transit Signal Priority Algorithm project responds to the first priority listed. The focus of the project was on deriving an intelligent transit signal priority (TSP) algorithm that is practical, innovative, and suitable to move forward to a commercial phase. The project team consisted of LEA Consulting Ltd, the University of Toronto, and Fortran Traffic Systems Limited. The project was managed by the ITS Office of Transport Canada with the Transportation Development Centre of Transport Canada as Scientific Authority.
1.2 Objectives The fundamental objectives of the project were to: • Develop a unique, innovative transit signal priority algorithm that has the potential to be
deployed in the field; • Facilitate the exchange of knowledge and ideas between the academic research community
and the industrial sector during the algorithm development process; • Provide a means to improve mobility and transportation efficiency; • Increase operational and regulatory efficiencies for system users and public agencies; • Encourage the development of products and services that will accelerate the growth of ITS
knowledge and skills, and promote the uptake and commercialization of ITS technology.
1.3 General Scope of Work The core elements of the workplan for this project are presented in Figure 1.
1
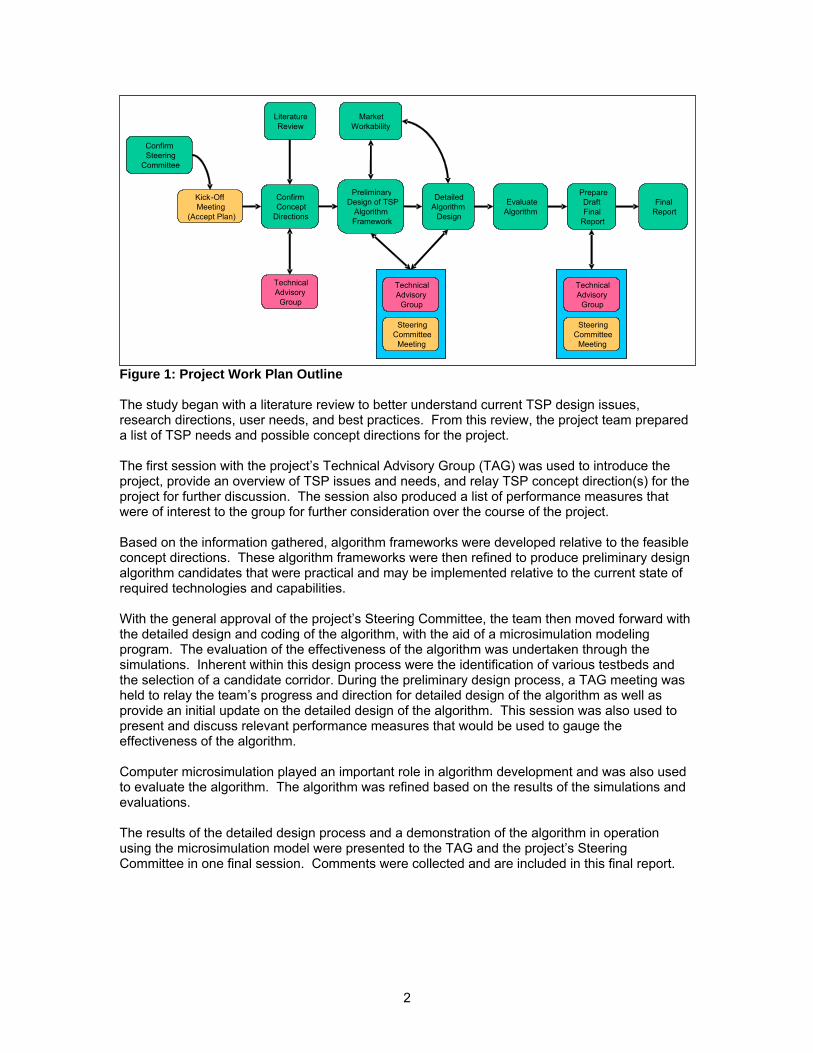
Literature Review
Market Workability
Figure 1: Project Work Plan Outline The study began with a literature review to better understand current TSP design issues, research directions, user needs, and best practices. From this review, the project team prepared a list of TSP needs and possible concept directions for the project. The first session with the project’s Technical Advisory Group (TAG) was used to introduce the project, provide an overview of TSP issues and needs, and relay TSP concept direction(s) for the project for further discussion. The session also produced a list of performance measures that were of interest to the group for further consideration over the course of the project. Based on the information gathered, algorithm frameworks were developed relative to the feasible concept directions. These algorithm frameworks were then refined to produce preliminary design algorithm candidates that were practical and may be implemented relative to the current state of required technologies and capabilities. With the general approval of the project’s Steering Committee, the team then moved forward with the detailed design and coding of the algorithm, with the aid of a microsimulation modeling program. The evaluation of the effectiveness of the algorithm was undertaken through the simulations. Inherent within this design process were the identification of various testbeds and the selection of a candidate corridor. During the preliminary design process, a TAG meeting was held to relay the team’s progress and direction for detailed design of the algorithm as well as provide an initial update on the detailed design of the algorithm. This session was also used to present and discuss relevant performance measures that would be used to gauge the effectiveness of the algorithm. Computer microsimulation played an important role in algorithm development and was also used to evaluate the algorithm. The algorithm was refined based on the results of the simulations and evaluations. The results of the detailed design process and a demonstration of the algorithm in operation using the microsimulation model were presented to the TAG and the project’s Steering Committee in one final session. Comments were collected and are included in this final report.
Technical Advisory
Group
ConfirmConcept
Directions
Kick- Off Meeting
(Accept Plan)
ConfirmSteering
Committee
Prepare Draft Final
Report
Evaluate Algorithm
DetailedAlgorithm
Design
Preliminary Design of TSP
AlgorithmFramework
Final Report
Technical Advisory
Group
Steering Committee
Meeting
Technical Advisory
Group
Steering Committee
Meeting
Technical Advisory
Group Steering
Committee Meeting
Technical Advisory
Group Steering
Committee Meeting
2

2.0 PROJECT APPROACH AND ORGANIZATION Client involvement throughout a project is critical to its ultimate success. The sooner a client becomes a stakeholder and assumes ownership of the resulting product, the greater the degree of success that is achieved. An essential element of any process is effective consultation with all stakeholders, including potential user groups, key team members, and associated external stakeholders. Throughout the project, stakeholder involvement was provided through two mediums: the Steering Committee and the Technical Advisory Group.
2.1 Project Steering Committee The Steering Committee comprised the Scientific Authority (Transport Canada Project Manager), select invited representatives from municipal traffic and transit agency groups, and a representative of Transport Canada’s Intelligent Transportation Systems Office. The Steering Committee was consulted over the course of the project to provide comments to the project team about the progress and direction of the project. Steering Committee participants were solicited prior to the award of the project, and confirmed at the onset of the project (see Table 1). Table 1: Steering Committee Participants
Municipality / Agency Representative Transport Canada – Transportation Development Centre
• Pierre Bolduc, Senior Development Officer
Transport Canada – ITS Office • Jonathan Sabean, Policy Advisor Canadian Urban Transit Association • Philippe Bellon, Manager, Technical Services City of Mississauga – Traffic Office • Andy Harvey, Manager, Traffic Engineering and
Operations • Bill Daeuber, Project Leader
Region of Durham – Traffic Office • Bob Szwarz, Manager, Traffic Engineering and Operations
• David Dankmeyer, Traffic Systems Supervisor • Joe Cafarelli, Traffic Systems Coordinator
City of Burlington – Transit • Al Kirkpatrick, Manager, Transit The Steering Committee was chaired by the Scientific Authority on the project from Transport Canada’s Transportation Development Centre. The Steering Committee met three times over the course of the project. The purpose of this first meeting was to: • Formally introduce the project to the Committee members • Provide an overview of the ITS Research and Development Program • Describe the role of the Steering Committee • Review the updated project work plan and schedule During the second meeting, the Steering Committee was provided with an update of the project’s progress. Discussions also revolved around the TSP concept directions and the selection of candidates for preliminary design. With the direction of the Steering Committee further efforts were to focus on the selection of a specific concept to proceed to detailed design and evaluation. The purpose of the final meeting was to review and discuss the development of the Advanced TSP algorithm and the results of the evaluation.
3
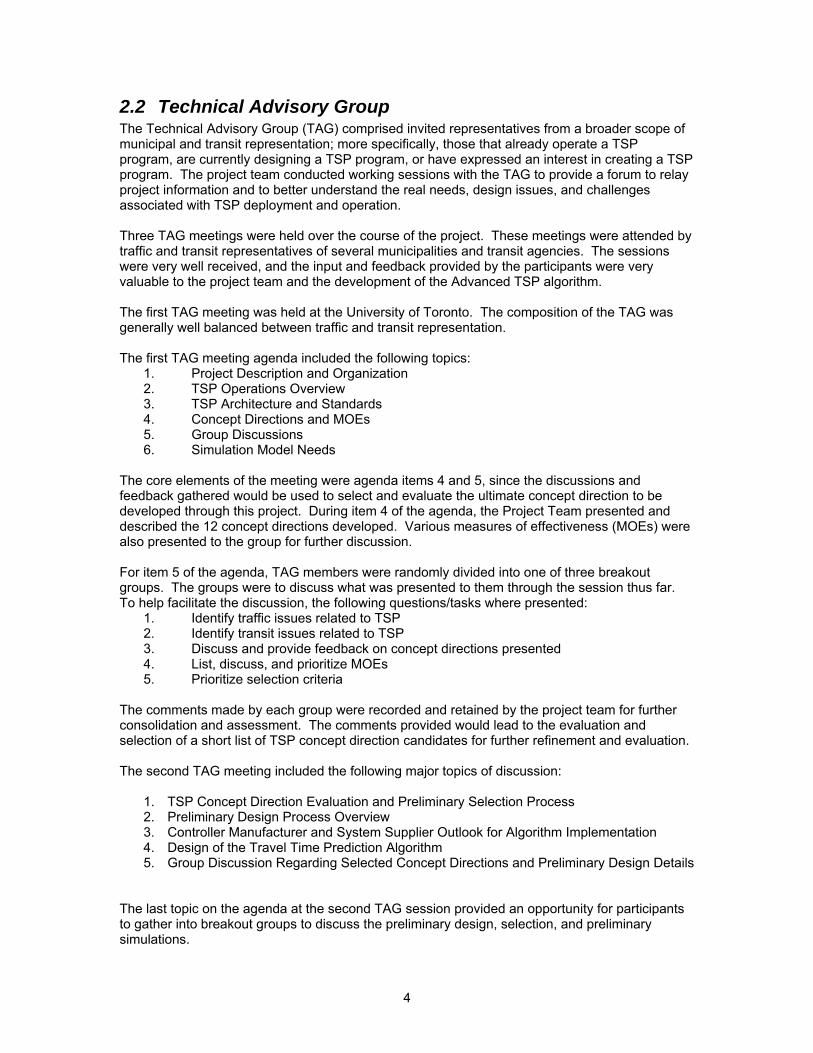
2.2 Technical Advisory Group The Technical Advisory Group (TAG) comprised invited representatives from a broader scope of municipal and transit representation; more specifically, those that already operate a TSP program, are currently designing a TSP program, or have expressed an interest in creating a TSP program. The project team conducted working sessions with the TAG to provide a forum to relay project information and to better understand the real needs, design issues, and challenges associated with TSP deployment and operation. Three TAG meetings were held over the course of the project. These meetings were attended by traffic and transit representatives of several municipalities and transit agencies. The sessions were very well received, and the input and feedback provided by the participants were very valuable to the project team and the development of the Advanced TSP algorithm. The first TAG meeting was held at the University of Toronto. The composition of the TAG was generally well balanced between traffic and transit representation. The first TAG meeting agenda included the following topics:
1. Project Description and Organization 2. TSP Operations Overview 3. TSP Architecture and Standards 4. Concept Directions and MOEs 5. Group Discussions 6. Simulation Model Needs
The core elements of the meeting were agenda items 4 and 5, since the discussions and feedback gathered would be used to select and evaluate the ultimate concept direction to be developed through this project. During item 4 of the agenda, the Project Team presented and described the 12 concept directions developed. Various measures of effectiveness (MOEs) were also presented to the group for further discussion. For item 5 of the agenda, TAG members were randomly divided into one of three breakout groups. The groups were to discuss what was presented to them through the session thus far. To help facilitate the discussion, the following questions/tasks where presented:
1. Identify traffic issues related to TSP 2. Identify transit issues related to TSP 3. Discuss and provide feedback on concept directions presented 4. List, discuss, and prioritize MOEs 5. Prioritize selection criteria
The comments made by each group were recorded and retained by the project team for further consolidation and assessment. The comments provided would lead to the evaluation and selection of a short list of TSP concept direction candidates for further refinement and evaluation. The second TAG meeting included the following major topics of discussion:
1. TSP Concept Direction Evaluation and Preliminary Selection Process 2. Preliminary Design Process Overview 3. Controller Manufacturer and System Supplier Outlook for Algorithm Implementation 4. Design of the Travel Time Prediction Algorithm 5. Group Discussion Regarding Selected Concept Directions and Preliminary Design Details
The last topic on the agenda at the second TAG session provided an opportunity for participants to gather into breakout groups to discuss the preliminary design, selection, and preliminary simulations.
4
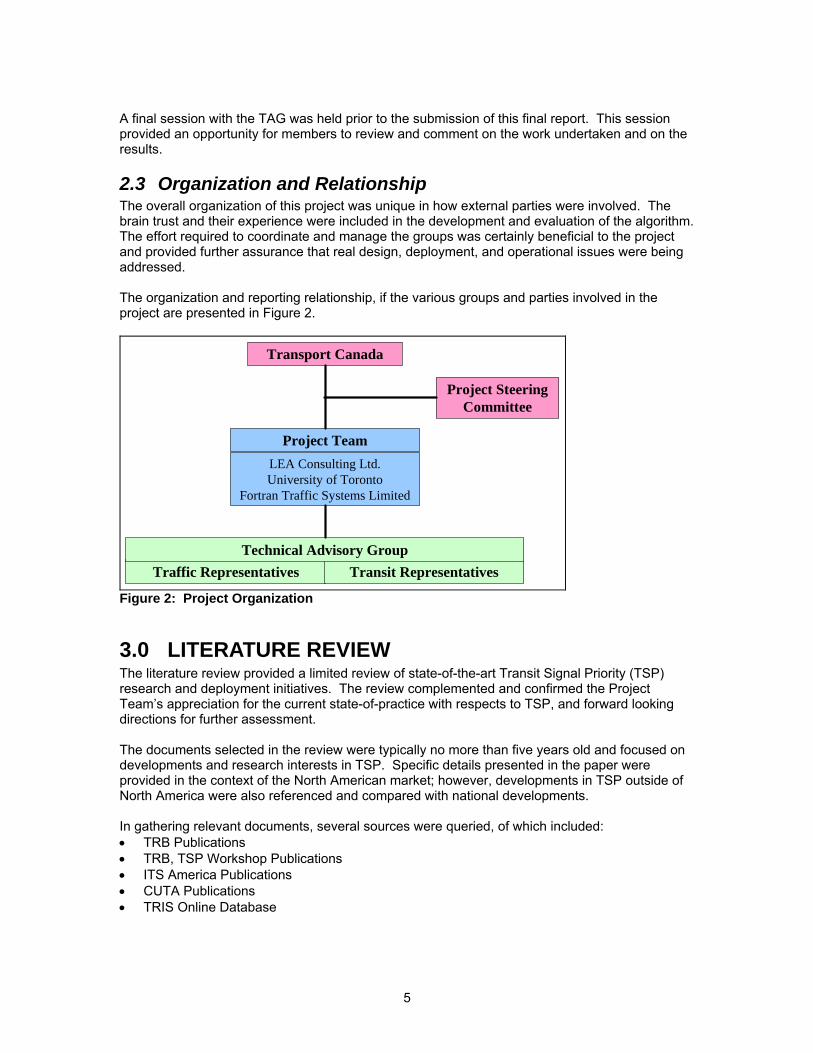
A final session with the TAG was held prior to the submission of this final report. This session provided an opportunity for members to review and comment on the work undertaken and on the results.
2.3 Organization and Relationship The overall organization of this project was unique in how external parties were involved. The brain trust and their experience were included in the development and evaluation of the algorithm. The effort required to coordinate and manage the groups was certainly beneficial to the project and provided further assurance that real design, deployment, and operational issues were being addressed. The organization and reporting relationship, if the various groups and parties involved in the project are presented in Figure 2.
Transport Canada
Project TeamLEA Consulting Ltd.University of Toronto
Fortran Traffic Systems Limited
Project Steering Committee
Traffic Representatives Transit RepresentativesTechnical Advisory Group
Figure 2: Project Organization
3.0 LITERATURE REVIEW The literature review provided a limited review of state-of-the-art Transit Signal Priority (TSP) research and deployment initiatives. The review complemented and confirmed the Project Team’s appreciation for the current state-of-practice with respects to TSP, and forward looking directions for further assessment. The documents selected in the review were typically no more than five years old and focused on developments and research interests in TSP. Specific details presented in the paper were provided in the context of the North American market; however, developments in TSP outside of North America were also referenced and compared with national developments. In gathering relevant documents, several sources were queried, of which included: • TRB Publications • TRB, TSP Workshop Publications • ITS America Publications • CUTA Publications • TRIS Online Database
5
The literature review provided the project team with additional insights towards the identification of possible concept directions for the overall project. The report noted that the provision of TSP to date has been predominately provided through the capabilities of the local traffic signal controller located at the intersection. As such, much of the research and development of TSP in the past has focused on enhancing the capabilities of the controller. However, with the rapid advancements in micro processing technologies, data gathering technologies, and provision of reliable, fast, and cost effective communications, the opportunities for more advanced developments in TSP are now possible. These advancements can come in the form of processing more real-time data and/or through the provision of TSP through new design concepts and system configurations. With these changes, new TSP algorithms may need to be developed to take advantage of the array of data and processing power now available. The report also highlighted several limitations of existing TSP practices, general areas of focus for the development of a TSP algorithms, and specific state-of-the-art TSP operational concepts and practices for further consideration.
3.1 Overview of TSP Transit signal priority (TSP) systems were being installed in some North American cities during the 1970s and 1980s. However, most of these installations were abandoned because technology at the time could not reliably deliver on what was expected despite the continued need for better transit operating efficiency at traffic control signals. Computers and other technologies available today can enable traffic signal control operations to adjust in direct response to varying traffic conditions. Based on this more advanced capability, there are increasing numbers of transit agencies and transportation departments throughout North America learning more about transit signal priority operations, the possible control strategies, and the potential service benefits that can be gained through this transit responsive form of traffic signal control deployment. As a result, there are approximately 25 to 30 transit agencies in North America currently operating TSP, and many more in the planning or deployment stage. Some examples of such TSP sites in Canada include Toronto, Vancouver, Edmonton, Calgary, Peterborough, and Ottawa. Similar examples in the U.S. include Los Angeles County, Minneapolis, Houston METRO, Napa INFO, Chicago Smart System, among others. Technology and control strategies have significantly progressed with respect to TSP within the scope of transit operations. The primary purpose of TSP is to reduce delay time to transit vehicles at signalized intersections. The fundamental TSP system comprises a transit vehicle sensor located upstream of an intersection approach that sends a request call for priority clearance through a signalized intersection upon detection of a transit vehicle, either by wireless communication (including optical-based methods) or through some other form of communication, to another receiver unit at the intersection. This receiving unit works in conjunction with the traffic controller and the traffic computer system to allocate more green time to allow the transit vehicle to proceed through the intersection, or to truncate a conflicting signal phase in order to service the bus sooner. Once the presence of the bus within the zone of detection disappears, via the transit vehicle passing over another sensor, then the demand for priority drops, and signal operations are brought back inline with typical operations for that time of the day; this also includes realigning the offset time within a coordinated traffic signal corridor. The TSP operation is simply described in the above text and would be representative of typical systems deployed in the past. However, there is now a wide range of transit vehicle detection methodologies and transit signal priority control strategies to be considered for the effective design of a working TSP system. The advancements in technology are also becoming a driving
6
force in how TSP systems are configured and operated. TSP system deployments are also promoting an increased level of cooperation between transit and traffic agencies.
3.2 System Design Concepts TSP systems of the past were relatively simple, but advancements in technology over the past few decades have provided new and more intelligent ways of administering TSP. There is now much more flexibility available in developing a concept of operation for a TSP system. This section of the report discusses the availability of various types of priority control and general control system configurations.
3.2.1 Priority Control Strategies When designing a TSP system, the designer needs to determine what level of priority control the system will be basing its decision-making algorithms on. There are three modes of control available; the two most common modes are unconditional and conditional priority. In recent years, the development of adaptive priority control has become a growing interest in TSP system designs. In general, adaptive priority control may be regarded as a more intelligent form of conditional priority control.
3.2.1.1 Unconditional Priority Control In the simplest case, priority may be provided to every transit vehicle every time a priority request call is made. This mode is referred to as unconditional priority control. The issue with this mode of control is that transit vehicles are always provided with priority passage through the intersection, whether or not it is needed. Under this scenario, transit vehicles may run ahead of schedule and cause undue delay to cross street traffic in the process. This form of control could also be implemented relatively easily in the field without any other supporting systems such as centre-to-centre communications links and software interfaces.
3.2.1.2 Conditional Priority Control By adopting more intelligent technology, the provision of conditional priority may be provided at signalized intersections. Fundamentally, this control methodology would evaluate, in some manner, the benefit of providing signal priority clearance through the intersection before it is provided. Therefore, if a call is not warranted based on predetermined conditions, the priority signal timing sequence will not be requested or initiated. Under this type of priority control, the decision logic could be located on the transit vehicle, at the intersection controller, or at a central system. In one scenario, where the decision logic is located on the transit vehicle, automated vehicle location and passenger counter systems could be used to determine if the vehicle is behind or ahead of schedule, or if there are a sufficient number of passengers on board for TSP to be beneficial. In another scenario, where the decision logic is located at the signal controller or at the central control system, the system, when it receives a TSP call, could determine if there would be an overall benefit to serving the transit vehicle based on the degree of saturation at the intersection. Both scenarios are an example of conditional priority control at work.
3.2.1.3 Adaptive Priority Control The final priority control strategy, adaptive priority, is an area of interest that has been emphasized more recently in North America. Adaptive priority control relies on the gathering of real-time transit and traffic network information. The information gathered is assessed in order to optimize specific parameters to provide for the most robust TSP sequence possible given the conditions of traffic. In one design scenario TSP calls could be registered several signal-timing cycles in advance of when the transit vehicle would actually be at the intersection. Therefore, the system, through its adaptive logic, could better determine the need for priority clearance and
7
adjust signal timing plans at that intersection to serve the transit vehicle more effectively without delay, while minimizing or eliminating the delay caused other traffic at the intersection.
3.2.1.4 Future Directions with Priority Control Strategies Of the three types of control strategies presented, unconditional priority is the most widely used in TSP applications. It is very popular at this time, as it has been in the past two decades, because of its relatively simple operation and implementation. For instance many NEMA TS-2 traffic signal controllers, when mated with an appropriate selective detection technology (at the intersection and on the transit vehicle), would be ready to provide TSP operation, short of programming control parameters related to a particular signal timing control strategy into the signal controller. In the past, the use of more advanced conditional and adaptive TSP control operations were limited due to the high cost of supporting technologies and the limited effectiveness of such technologies. Over the past decade, with the latest advancements in technologies, there has been a growing interest from academia and the general marketplace to develop more advanced TSP operations through the use of conditional and adaptive priority control methods. For conditional and adaptive priority control strategies to work effectively, additional information regarding transit and traffic movements must be gathered and assessed before implementing a particular plan. The type of information which may be gathered for further analysis by a particular TSP algorithm include: • Transit vehicle scheduled time at specified check points • Transit vehicle location along the corridor • Transit vehicle speed • Number of passengers on the transit vehicle • Historical/real-time data about the number of passengers loading and alighting at a particular
stop • Relative priority among two or more transit vehicles approaching an intersection • Vehicle volumes at intersections • Vehicle queue lengths at intersection • General traffic flow speed • Presence of blocked lanes (i.e. related to construction or other impediments to vehicle flow)
along the transit corridor • Traffic signal’s location in the signal cycle plan Currently, the marketplace is seeing more proposals and applications of TSP utilizing AVL to facilitate conditional priority control strategies. There are already several systems in place in North America and in Europe that operate TSP though a conditional priority control strategy. However, the disruption to other traffic at an intersection is still a concern to traffic department managers. More research and development is required in the design of adaptive priority control systems to help minimize the disruptions to other traffic. In this regard, traffic signal control systems like SCOOT (Split Cycle Offset Optimization Technique), SCATS (Sydney Coordinated Adaptive Traffic System), and RHODES (Real-time Hierarchical Optimized Distributed Effective System) have also incorporate some forms of adaptive control for TSP operations.
3.3 TSP Limitations and Areas of Research The provision of TSP to date has been predominately provided through the capabilities of the local traffic signal controller located at the intersection. As such, much of the research and development of TSP in the past has focused on enhancing the capabilities of the controller. However, with the rapid advancements in micro processing technologies, data gathering technologies, and provision of reliable, fast, and cost effective communications, the opportunities for more advanced developments in TSP are now possible. These advancements can come in the form of processing more real-time data and/or through the provision of TSP through new
8
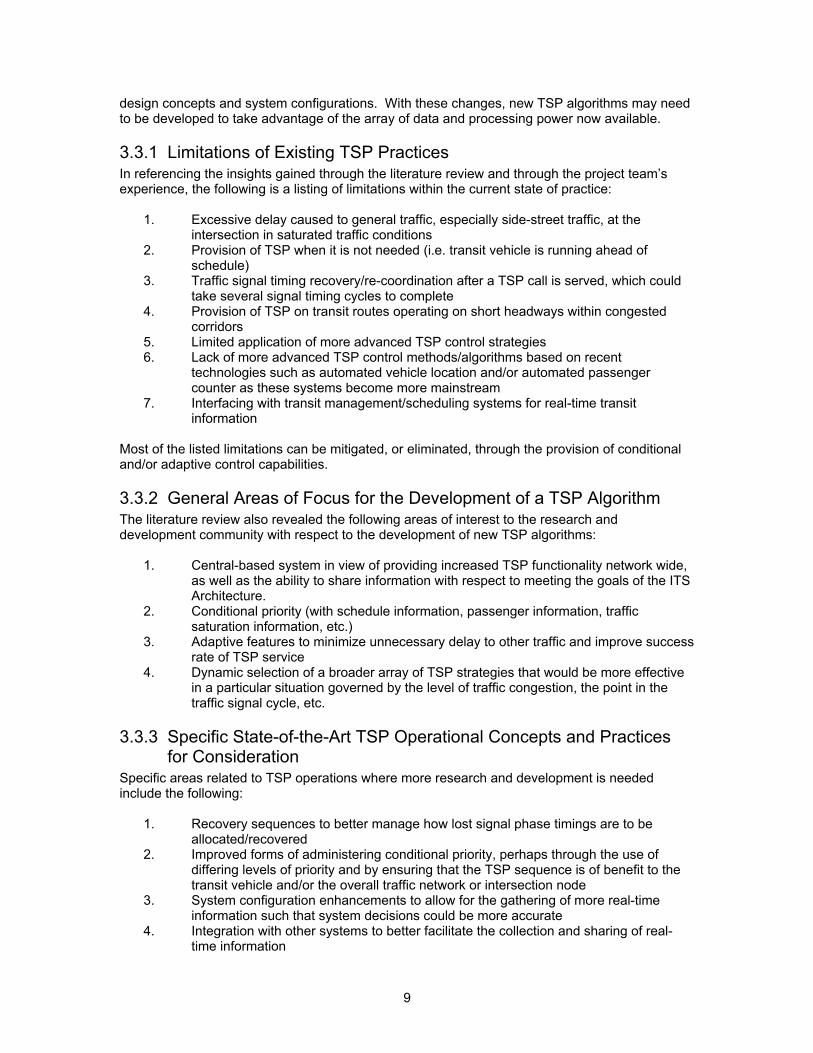
design concepts and system configurations. With these changes, new TSP algorithms may need to be developed to take advantage of the array of data and processing power now available.
3.3.1 Limitations of Existing TSP Practices In referencing the insights gained through the literature review and through the project team’s experience, the following is a listing of limitations within the current state of practice:
1. Excessive delay caused to general traffic, especially side-street traffic, at the intersection in saturated traffic conditions
2. Provision of TSP when it is not needed (i.e. transit vehicle is running ahead of schedule)
3. Traffic signal timing recovery/re-coordination after a TSP call is served, which could take several signal timing cycles to complete
4. Provision of TSP on transit routes operating on short headways within congested corridors
5. Limited application of more advanced TSP control strategies 6. Lack of more advanced TSP control methods/algorithms based on recent
technologies such as automated vehicle location and/or automated passenger counter as these systems become more mainstream
7. Interfacing with transit management/scheduling systems for real-time transit information
Most of the listed limitations can be mitigated, or eliminated, through the provision of conditional and/or adaptive control capabilities.
3.3.2 General Areas of Focus for the Development of a TSP Algorithm The literature review also revealed the following areas of interest to the research and development community with respect to the development of new TSP algorithms:
1. Central-based system in view of providing increased TSP functionality network wide, as well as the ability to share information with respect to meeting the goals of the ITS Architecture.
2. Conditional priority (with schedule information, passenger information, traffic saturation information, etc.)
3. Adaptive features to minimize unnecessary delay to other traffic and improve success rate of TSP service
4. Dynamic selection of a broader array of TSP strategies that would be more effective in a particular situation governed by the level of traffic congestion, the point in the traffic signal cycle, etc.
3.3.3 Specific State-of-the-Art TSP Operational Concepts and Practices for Consideration
Specific areas related to TSP operations where more research and development is needed include the following:
1. Recovery sequences to better manage how lost signal phase timings are to be allocated/recovered
2. Improved forms of administering conditional priority, perhaps through the use of differing levels of priority and by ensuring that the TSP sequence is of benefit to the transit vehicle and/or the overall traffic network or intersection node
3. System configuration enhancements to allow for the gathering of more real-time information such that system decisions could be more accurate
4. Integration with other systems to better facilitate the collection and sharing of real-time information
9
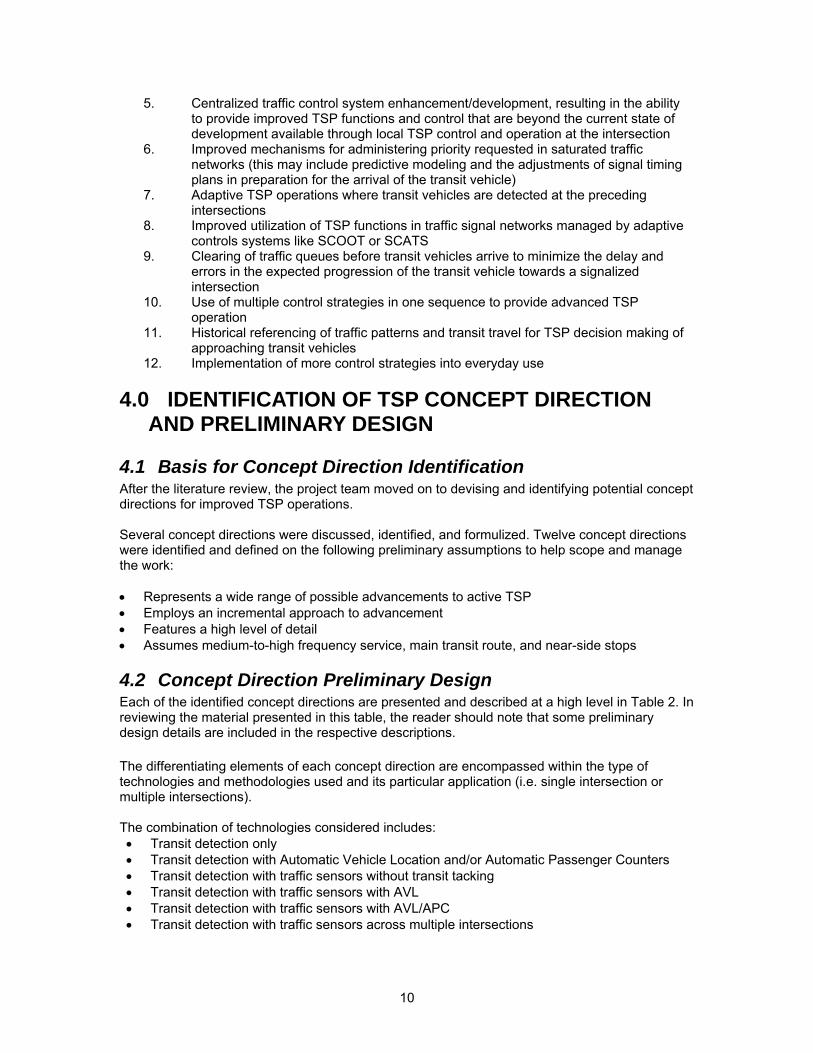
5. Centralized traffic control system enhancement/development, resulting in the ability
to provide improved TSP functions and control that are beyond the current state of development available through local TSP control and operation at the intersection
6. Improved mechanisms for administering priority requested in saturated traffic networks (this may include predictive modeling and the adjustments of signal timing plans in preparation for the arrival of the transit vehicle)
7. Adaptive TSP operations where transit vehicles are detected at the preceding intersections
8. Improved utilization of TSP functions in traffic signal networks managed by adaptive controls systems like SCOOT or SCATS
9. Clearing of traffic queues before transit vehicles arrive to minimize the delay and errors in the expected progression of the transit vehicle towards a signalized intersection
10. Use of multiple control strategies in one sequence to provide advanced TSP operation
11. Historical referencing of traffic patterns and transit travel for TSP decision making of approaching transit vehicles
12. Implementation of more control strategies into everyday use
4.0 IDENTIFICATION OF TSP CONCEPT DIRECTION AND PRELIMINARY DESIGN
4.1 Basis for Concept Direction Identification After the literature review, the project team moved on to devising and identifying potential concept directions for improved TSP operations. Several concept directions were discussed, identified, and formulized. Twelve concept directions were identified and defined on the following preliminary assumptions to help scope and manage the work: • Represents a wide range of possible advancements to active TSP • Employs an incremental approach to advancement • Features a high level of detail • Assumes medium-to-high frequency service, main transit route, and near-side stops
4.2 Concept Direction Preliminary Design Each of the identified concept directions are presented and described at a high level in Table 2. In reviewing the material presented in this table, the reader should note that some preliminary design details are included in the respective descriptions.
The differentiating elements of each concept direction are encompassed within the type of technologies and methodologies used and its particular application (i.e. single intersection or multiple intersections). The combination of technologies considered includes: • Transit detection only • Transit detection with Automatic Vehicle Location and/or Automatic Passenger Counters • Transit detection with traffic sensors without transit tacking • Transit detection with traffic sensors with AVL • Transit detection with traffic sensors with AVL/APC • Transit detection with traffic sensors across multiple intersections
10

The combination of TSP logic methodologies considered includes: • No prediction capabilities with rule-based control • Simple prediction with rule-based control • Advanced prediction with rule-based control • Advanced prediction with parameter optimization control
Figure 3 presents the various concept directions and the associated technologies, methodologies and application.
I-0I-0 I-1I-1 I-2I-2 I-3I-3 II-1II-1 II-2II-2 II-3II-3 II-4II-4 II-5II-5 II-6II-6 III-1III-1 III-2III-2
Traffic sensors
Optimizationbased control
Rule-basedcontrol
Without transitTracking
With transitTracking (AVL)
Advanced prediction model
AVL /APC
Simple predictionNoprediction
Transit detectorsonly
Technologies
Single Intersection
Methodologies
Multiple Intersections
AVL /APC
Figure 3: Range of Concept Directions Details of the preliminary design details of each of the concept directions presented are provided in Table 2.
11

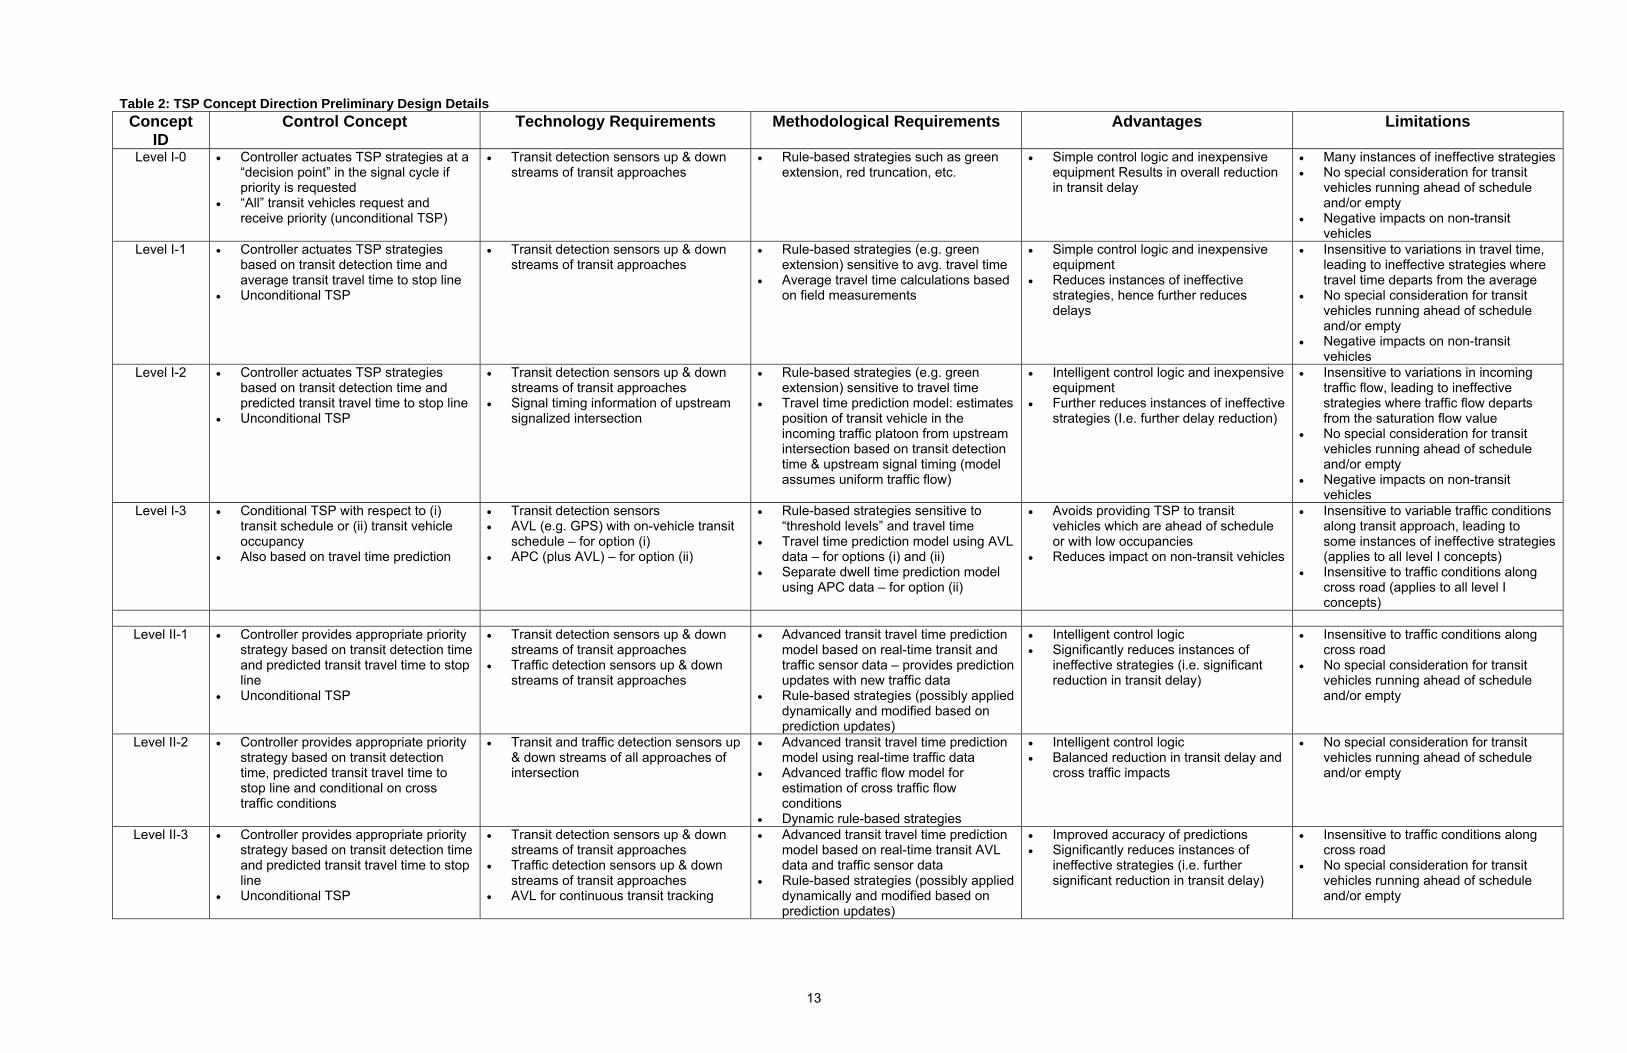
Table 2: TSP Concept Direction Preliminary Design Details
Concept ID
Control Concept Technology Requirements Methodological Requirements Advantages Limitations
Level I-0 • Controller actuates TSP strategies at a “decision point” in the signal cycle if priority is requested
• “All” transit vehicles request and receive priority (unconditional TSP)
• Transit detection sensors up & down streams of transit approaches
• Rule-based strategies such as green extension, red truncation, etc.
• Simple control logic and inexpensive equipment Results in overall reduction in transit delay
• Many instances of ineffective strategies • No special consideration for transit
vehicles running ahead of schedule and/or empty
• Negative impacts on non-transit vehicles
Level I-1 • Controller actuates TSP strategies based on transit detection time and average transit travel time to stop line
• Unconditional TSP
• Transit detection sensors up & down streams of transit approaches
• Rule-based strategies (e.g. green extension) sensitive to avg. travel time
• Average travel time calculations based on field measurements
• Simple control logic and inexpensive equipment
• Reduces instances of ineffective strategies, hence further reduces delays
• Insensitive to variations in travel time, leading to ineffective strategies where travel time departs from the average
• No special consideration for transit vehicles running ahead of schedule and/or empty
• Negative impacts on non-transit vehicles
Level I-2 • Controller actuates TSP strategies based on transit detection time and predicted transit travel time to stop line
• Unconditional TSP
• Transit detection sensors up & down streams of transit approaches
• Signal timing information of upstream signalized intersection
• Rule-based strategies (e.g. green extension) sensitive to travel time
• Travel time prediction model: estimates position of transit vehicle in the incoming traffic platoon from upstream intersection based on transit detection time & upstream signal timing (model assumes uniform traffic flow)
• Intelligent control logic and inexpensive equipment
• Further reduces instances of ineffective strategies (I.e. further delay reduction)
• Insensitive to variations in incoming traffic flow, leading to ineffective strategies where traffic flow departs from the saturation flow value
• No special consideration for transit vehicles running ahead of schedule and/or empty
• Negative impacts on non-transit vehicles
Level I-3 • Conditional TSP with respect to (i) transit schedule or (ii) transit vehicle occupancy
• Also based on travel time prediction
• Transit detection sensors • AVL (e.g. GPS) with on-vehicle transit
schedule – for option (i) • APC (plus AVL) – for option (ii)
• Rule-based strategies sensitive to “threshold levels” and travel time
• Travel time prediction model using AVL data – for options (i) and (ii)
• Separate dwell time prediction model using APC data – for option (ii)
• Avoids providing TSP to transit vehicles which are ahead of schedule or with low occupancies
• Reduces impact on non-transit vehicles
• Insensitive to variable traffic conditions along transit approach, leading to some instances of ineffective strategies (applies to all level I concepts)
• Insensitive to traffic conditions along cross road (applies to all level I concepts)
Level II-1 • Controller provides appropriate priority
strategy based on transit detection time and predicted transit travel time to stop line
• Unconditional TSP
• Transit detection sensors up & down streams of transit approaches
• Traffic detection sensors up & down streams of transit approaches
• Advanced transit travel time prediction model based on real-time transit and traffic sensor data – provides prediction updates with new traffic data
• Rule-based strategies (possibly applied dynamically and modified based on prediction updates)
• Intelligent control logic • Significantly reduces instances of
ineffective strategies (i.e. significant reduction in transit delay)
• Insensitive to traffic conditions along cross road
• No special consideration for transit vehicles running ahead of schedule and/or empty
Level II-2 • Controller provides appropriate priority strategy based on transit detection time, predicted transit travel time to stop line and conditional on cross traffic conditions
• Transit and traffic detection sensors up & down streams of all approaches of intersection
• Advanced transit travel time prediction model using real-time traffic data
• Advanced traffic flow model for estimation of cross traffic flow conditions
• Dynamic rule-based strategies
• Intelligent control logic • Balanced reduction in transit delay and
cross traffic impacts
• No special consideration for transit vehicles running ahead of schedule and/or empty
Level II-3 • Controller provides appropriate priority strategy based on transit detection time and predicted transit travel time to stop line
• Unconditional TSP
• Transit detection sensors up & down streams of transit approaches
• Traffic detection sensors up & down streams of transit approaches
• AVL for continuous transit tracking
• Advanced transit travel time prediction model based on real-time transit AVL data and traffic sensor data
• Rule-based strategies (possibly applied dynamically and modified based on prediction updates)
• Improved accuracy of predictions • Significantly reduces instances of
ineffective strategies (i.e. further significant reduction in transit delay)
• Insensitive to traffic conditions along cross road
• No special consideration for transit vehicles running ahead of schedule and/or empty
13
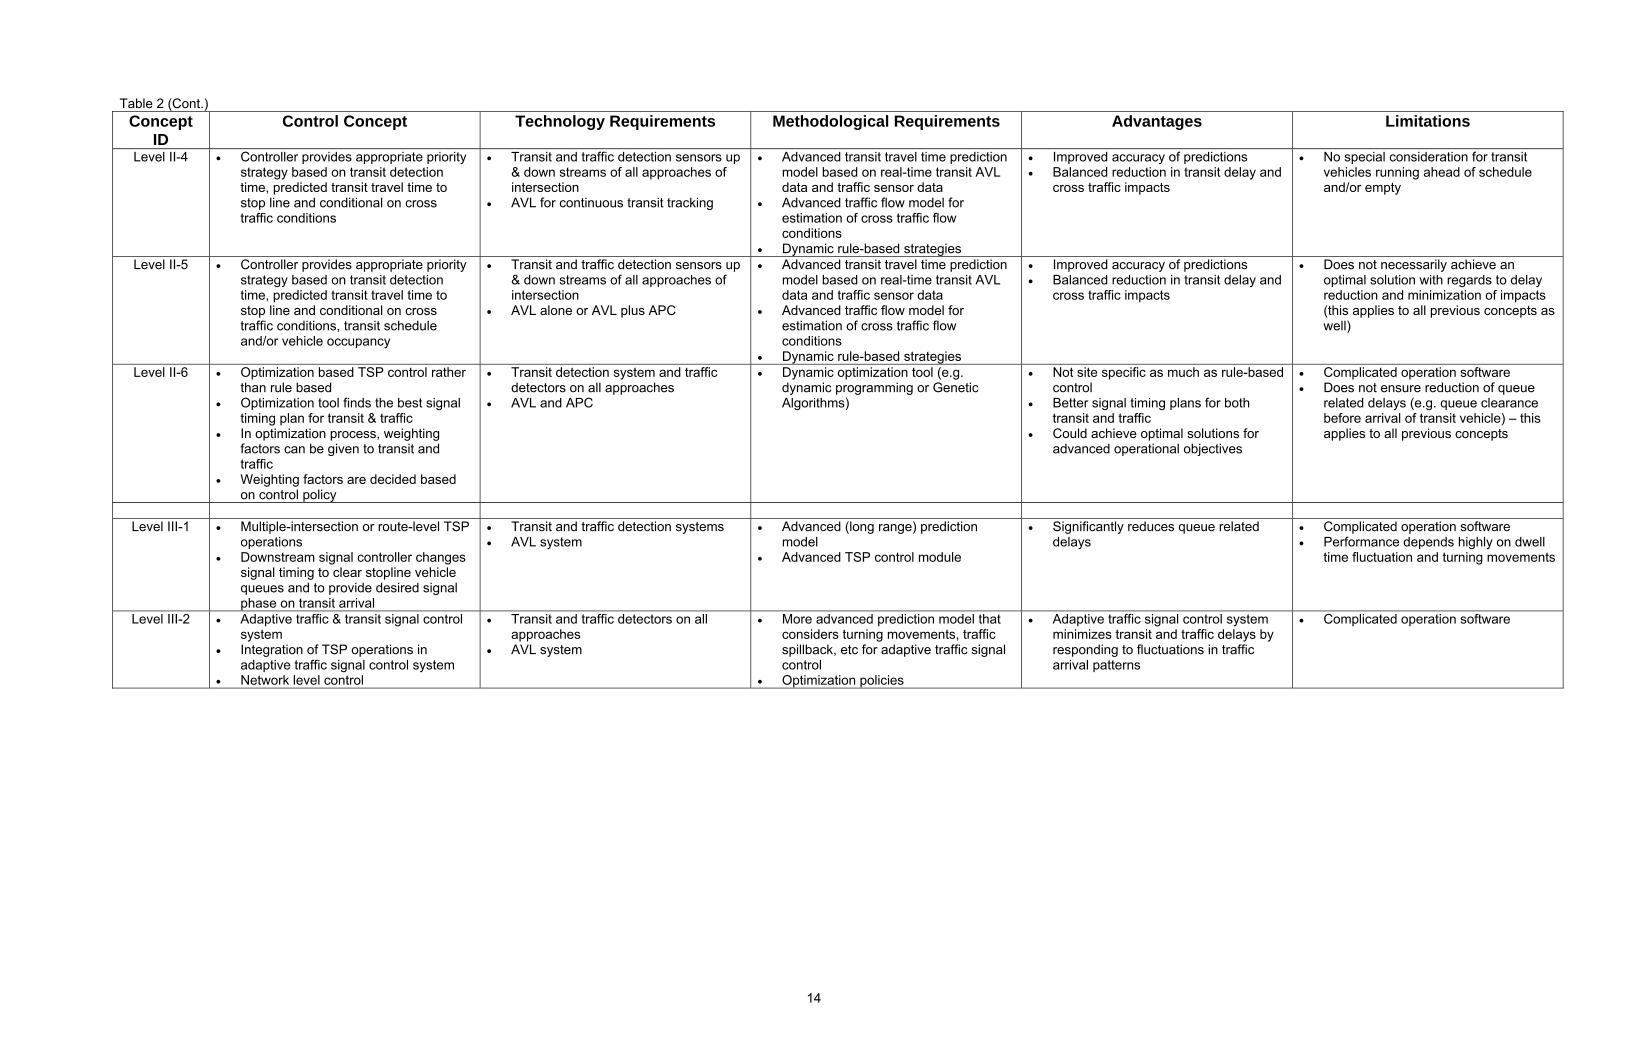
14
Table 2 (Cont.) Concept
ID Control Concept Technology Requirements Methodological Requirements Advantages Limitations
Level II-4 • Controller provides appropriate priority strategy based on transit detection time, predicted transit travel time to stop line and conditional on cross traffic conditions
• Transit and traffic detection sensors up & down streams of all approaches of intersection
• AVL for continuous transit tracking
• Advanced transit travel time prediction model based on real-time transit AVL data and traffic sensor data
• Advanced traffic flow model for estimation of cross traffic flow conditions
• Dynamic rule-based strategies
• Improved accuracy of predictions • Balanced reduction in transit delay and
cross traffic impacts
• No special consideration for transit vehicles running ahead of schedule and/or empty
Level II-5 • Controller provides appropriate priority strategy based on transit detection time, predicted transit travel time to stop line and conditional on cross traffic conditions, transit schedule and/or vehicle occupancy
• Transit and traffic detection sensors up & down streams of all approaches of intersection
• AVL alone or AVL plus APC
• Advanced transit travel time prediction model based on real-time transit AVL data and traffic sensor data
• Advanced traffic flow model for estimation of cross traffic flow conditions
• Dynamic rule-based strategies
• Improved accuracy of predictions • Balanced reduction in transit delay and
cross traffic impacts
• Does not necessarily achieve an optimal solution with regards to delay reduction and minimization of impacts (this applies to all previous concepts as well)
Level II-6 • Optimization based TSP control rather than rule based
• Optimization tool finds the best signal timing plan for transit & traffic
• In optimization process, weighting factors can be given to transit and traffic
• Weighting factors are decided based on control policy
• Transit detection system and traffic detectors on all approaches
• AVL and APC
• Dynamic optimization tool (e.g. dynamic programming or Genetic Algorithms)
• Not site specific as much as rule-based control
• Better signal timing plans for both transit and traffic
• Could achieve optimal solutions for advanced operational objectives
• Complicated operation software • Does not ensure reduction of queue
related delays (e.g. queue clearance before arrival of transit vehicle) – this applies to all previous concepts
Level III-1 • Multiple-intersection or route-level TSP
operations • Downstream signal controller changes
signal timing to clear stopline vehicle queues and to provide desired signal phase on transit arrival
• Transit and traffic detection systems • AVL system
• Advanced (long range) prediction model
• Advanced TSP control module
• Significantly reduces queue related delays
• Complicated operation software • Performance depends highly on dwell
time fluctuation and turning movements
Level III-2 • Adaptive traffic & transit signal control system
• Integration of TSP operations in adaptive traffic signal control system
• Network level control
• Transit and traffic detectors on all approaches
• AVL system
• More advanced prediction model that considers turning movements, traffic spillback, etc for adaptive traffic signal control
• Optimization policies
• Adaptive traffic signal control system minimizes transit and traffic delays by responding to fluctuations in traffic arrival patterns
• Complicated operation software
4.3 Technology and Deployment Limitations There were both technical and financial considerations to rationalize prior to designing the algorithm in detail for deployment. The premise of the proposed concept directions does not limit the operation to either a local or central controlled traffic signal environment. Based on the concept definitions, some of the technical challenges included:
1. Not unique to controllers or central system 2. Operational framework (unconditional vs conditional TSP, data collection, programming) 3. Operational variables (controller memory, controller processing capabilities, AVL
capabilities) 4. TSP strategies to be selected 5. Control environment framework 6. Process co-existence with multiple processes 7. Responsibilities of the operation between traffic and transit groups
The financial challenges of deploying one of the preferred concepts relate to the development process required. There are many industry standards that must be considered and addressed, all of which will add to the cost of the project.
5.0 TSP CONCEPT DIRECTION SELECTION
5.1 Evaluation Process An evaluation methodology was required to identify, in a transparent manner, concept directions that are of interest to the stakeholders involved with the project. TAG members were introduced to the various concept directions, but were not asked to indicate which were to be carried forward in the project. The attendees of the TAG session were asked to identify selection criteria that could be used to gauge the relative importance of each concept direction in relation to what is effective and achievable. Comments received from the TAG group are presented in Table 3. Table 3: General TAG Feedback
Concept Directions and Feedback •
• •
• • • • • • •
Further review of far-side and queue jump lane operations should be considered even though the study only considers near-side stops as this stage Fire preemption equipment in use; TSP could make use of existing technology Pedestrian environment may be compromised if not considered, especially in heavy pedestrian corridors Consider driver habits Need more applications of AVL (therefore Level 2 concepts should be considered) Applications dependent on characteristics of jurisdiction (i.e. at the route level) Level 3 concepts are further out; not realistic right now Concept should consider traffic network issues rather than transit alone Overall intersection delay, carrying capacity, intersection level of service considerations Advantages and limitations depend on size of system, loading, schedule, time of day/year, route type
15
Recommended Performance Measures
• • • • • • • •
Fast transit service Traffic delay (all traffic inclusive of auto, pedestrian, commercial vehicles, etc.) Reliability of transit Pedestrian impacts/delays Modal split Benefit/cost Meets policy objective Satisfaction of riders, and motorist
Recommended Concept Direction Selection Criteria • • • • • • • • • •
Dollars – capital and operating Ease of implementation – existing deployment vs. technology improvements Timing of deployment Effectiveness Conformance with ITS Architectures Multiple applications Additional customer benefits Technical support, maintenance, upgrades TCIP conformance Policy objective (based on road classification and use, short-term capacity, transit use – passenger, frequency)
The objective to the evaluation was to identify a few concept directions of interest to TAG members that could be further developed in the preliminary design phase. A two-phase ranking methodology was developed based on the primary criteria identified by TAG members and their comments and feedback at the TAG session.
5.2 Concept Direction Short Listing Using the comments and feedback gathered from TAG members, the project team reorganized the information into the following list of evaluation criteria and associated descriptions to be used in the evaluation: • Existing Technology and Practices – Can the system make use of existing technologies and
ITS commonly deployed (i.e. EMS/Fire pre-emption systems, radio-based communication, etc.)? Does the system conform to existing traffic signal control practices?
• ITS Architecture – Can the system be integrated and/or expanded into other services? • AVL – Many transit agencies are interested in, or are already using AVL. Can the concept
leverage AVL systems? • Capital and Operating Dollars – High-level estimate of dollars: is the deployment going to be
very costly, reasonable, or low cost? • Transit Operations and Service Benefits – Can the system be integrated with existing transit
system operations and provide other customer services? • Negative Effects on Driver Habits – Would the system severely affect/influence driver habits
in a negative way? • Standards (Technology and Operations) – Does the proposed concept adhere to existing and
emerging standards (i.e. NTCIP, TCIP, traffic operations, etc.)? • Deployment Timeframe – Can the system be deployed in relatively short and realistic
timeframe? • System Support and Maintenance – Would the system be easy to maintain? • Traffic Impact – Does the system account for traffic impacts to the mainline and cross street? • Pedestrian Impact – Does the system account for pedestrian traffic, or at least minimize their
impact?
16

• Deployment Environment – Would the system be suitable for the target environment (i.e.
medium-to-high frequency service, main transit route, near-side stops)? • Near/Far Side Application – Can the strategy be used for near-side and far-side transit stops?
5.2.1 Identification and Refinement of the Evaluation Criteria The first phase of the evaluation was to rank each of the concepts, independent of each other, according to the defined criteria. The ranking scale used for this task ranged from 1 to 3; where a value of 1 represented a weak association to the criteria, and a value of 3 represented a high association. Under some criteria it was necessary to use half points to more discretely distinguish a difference between the various concept directions. The second phase of the evaluation was to rank each of the criteria, independent of each other, according to the general importance of the noted criterion. A ranking scale with values between 1 and 3 was also used; where a value of 1 represented a weaker importance, while a value of 3 represented a greater importance. The values assigned were then multiplied with the respective values determined in phase one of the evaluation for each concept direction and criteria. The team undertook the ranking and evaluation exercise and developed the results presented in Table 4. Table 4: Evaluation Criteria and Factored Ratings
Exi
stin
g Te
chno
logy
an
d P
ract
ices
ITS
Arc
hite
ctur
e
AV
L
Cap
ital a
nd O
pera
ting
Dol
lars
Tr
ansi
t Ope
ratio
ns a
nd
Serv
ice
Bene
fits
Neg
ativ
e E
ffect
s on
D
river
Hab
its
Sta
ndar
ds (T
echn
olog
y an
d O
pera
tions
)
Dep
loym
ent T
imef
ram
e
Sys
tem
Sup
port
and
Mai
nten
ance
Traf
fic Im
pact
Ped
estri
an Im
pact
Dep
loym
ent
Env
ironm
ent
Nea
r/Far
Sid
e A
pplic
atio
n
Sum Overall Rank
Importance Factor 3 2 2 3 3 2 3 3 3 2 2 2 1 0
Level I-0 3 1 1 3 1 3 3 3 3 1 2 1 1 26 Level I-1 3 1 1 3 1 3 3 3 3 1 2 1 1 26 Level I-2 3 1 1 3 1 3 3 3 3 1 2 1 1 26 Level I-3 2 2 3 2 1.5 3 3 2 2 1.5 2 2 1 27
Level II-1 3 1 1 3 1.5 3 3 2 3 1.5 2 2 3 29 Level II-2 3 1 1 2.5 1.5 3 3 2 2.5 1.5 2 2 3 28 Level II-3 3 2 3 2 2 3 3 2 2 2 2 2 3 31 Level II-4 3 2 3 2 2 3 3 2 2 2 2 2 3 31 Level II-5 2 2 3 1 2.5 3 3 2 2 2.5 2 3 3 31 Level II-6 1 2 3 1 2.5 3 3 2 1 2.5 2 3 3 29
Level III-1 1 3 3 1 3 3 3 1 1 3 2 2 2 28 Level III-2 1 3 3 1 3 3 3 1 1 3 2 2 2 28
17

18
Factored Table Level I-0 9 2 2 9 3 6 9 9 9 2 4 2 1 67 5 Level I-1 9 2 2 9 3 6 9 9 9 2 4 2 1 67 5 Level I-2 9 2 2 9 3 6 9 9 9 2 4 2 1 67 5 Level I-3 6 4 6 6 4.5 6 9 6 6 3 4 4 1 65.5 6
Level II-1 9 2 2 9 4.5 6 9 6 9 3 4 4 3 70.5 3 Level II-2 9 2 2 7.5 4.5 6 9 6 7.5 3 4 4 3 67.5 4 Level II-3 9 4 6 6 6 6 9 6 6 4 4 4 3 73 1 Level II-4 9 4 6 6 6 6 9 6 6 4 4 4 3 73 1 Level II-5 6 4 6 3 7.5 6 9 6 6 5 4 6 3 71.5 2 Level II-6 3 4 6 3 7.5 6 9 6 3 5 4 6 3 65.5 6
Level III-1 3 6 6 3 9 6 9 3 3 6 4 4 2 64 7 Level III-2 3 6 6 3 9 6 9 3 3 6 4 4 2 64 7
5.2.2 Selection Result Based on the evaluation methodology and results, it is recommended that the top ranking concept directions found in Table 5 be rationalized further through the preliminary design phase of the project.
Table 5: Top Ranking Concept Directions
Concept ID Rank Level II-1 3 Level II-3 1 Level II-4 1 Level II-5 2
5.3 Concept Direction Selection for Detailed Design Of the original 12 concept directions identified, the top four ranked concepts, based on feedback from the TAG at the first meeting in May 2004, were concept II-1, concept II-3, concept II-4, concept II-5. At the second TAG meeting held in September 2004, members were asked to discuss each of the four concept directions and to assign a rank and value to each. The general result of this exercise placed a higher rank and value on Concepts II-4 and II-5 over the other two concepts. Based on the results noted above and on additional feedback received from the TAG at the September 2004 session, the project team discussed which of the preferred concept directions would be developed for detailed design, modeling, simulation, and evaluation.
5.3.1 Preliminary Design of Short-Listed Concepts To assist the project team and stakeholders involved with the review of the short-listed concepts, a preliminary design of each was undertaken. Descriptions of the preliminary design details for each of the short-listed concepts are provided in Table 6. Hypothetical intersection layouts and algorithmic details are presented in Figures 4 through 11.
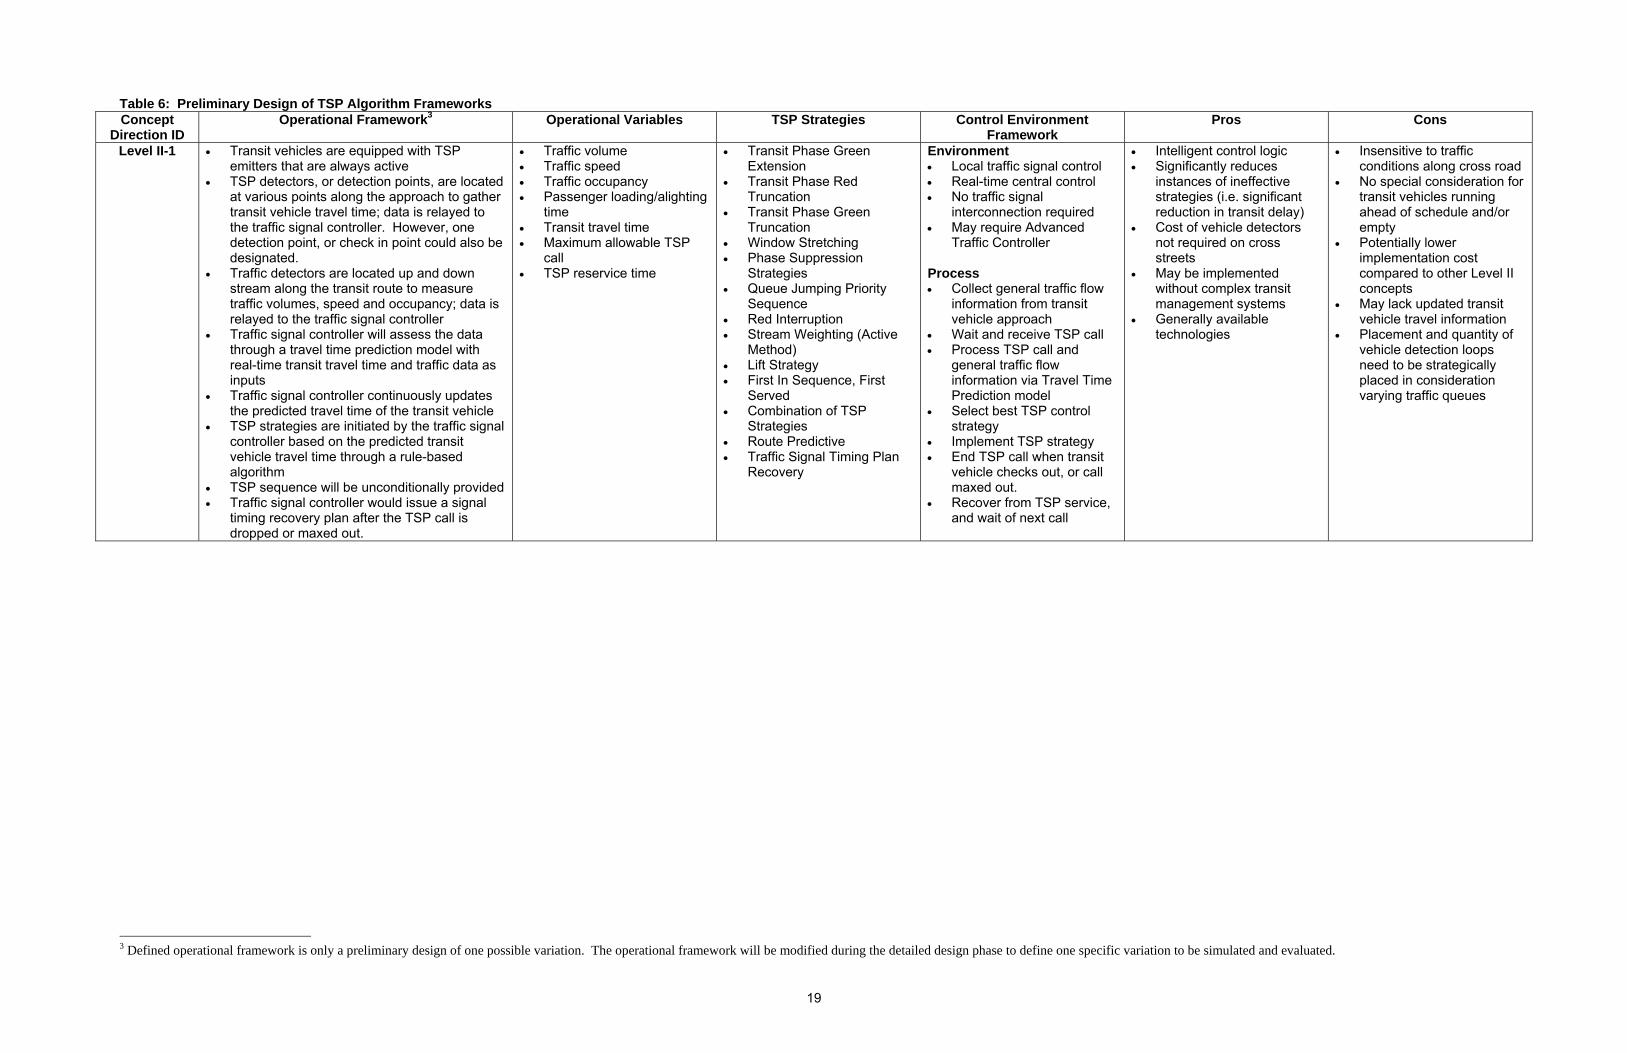
Table 6: Preliminary Design of TSP Algorithm Frameworks Concept
Direction ID Operational Framework3 Operational Variables TSP Strategies Control Environment
Framework Pros Cons
Level II-1 • Transit vehicles are equipped with TSP emitters that are always active
• TSP detectors, or detection points, are located at various points along the approach to gather transit vehicle travel time; data is relayed to the traffic signal controller. However, one detection point, or check in point could also be designated.
• Traffic detectors are located up and down stream along the transit route to measure traffic volumes, speed and occupancy; data is relayed to the traffic signal controller
• Traffic signal controller will assess the data through a travel time prediction model with real-time transit travel time and traffic data as inputs
• Traffic signal controller continuously updates the predicted travel time of the transit vehicle
• TSP strategies are initiated by the traffic signal controller based on the predicted transit vehicle travel time through a rule-based algorithm
• TSP sequence will be unconditionally provided • Traffic signal controller would issue a signal
timing recovery plan after the TSP call is dropped or maxed out.
• Traffic volume • Traffic speed • Traffic occupancy • Passenger loading/alighting
time • Transit travel time • Maximum allowable TSP
call • TSP reservice time
• Transit Phase Green Extension
• Transit Phase Red Truncation
• Transit Phase Green Truncation
• Window Stretching • Phase Suppression
Strategies • Queue Jumping Priority
Sequence • Red Interruption • Stream Weighting (Active
Method) • Lift Strategy • First In Sequence, First
Served • Combination of TSP
Strategies • Route Predictive • Traffic Signal Timing Plan
Recovery
Environment • Local traffic signal control • Real-time central control • No traffic signal
interconnection required • May require Advanced
Traffic Controller Process • Collect general traffic flow
information from transit vehicle approach
• Wait and receive TSP call • Process TSP call and
general traffic flow information via Travel Time Prediction model
• Select best TSP control strategy
• Implement TSP strategy • End TSP call when transit
vehicle checks out, or call maxed out.
• Recover from TSP service, and wait of next call
• Intelligent control logic • Significantly reduces
instances of ineffective strategies (i.e. significant reduction in transit delay)
• Cost of vehicle detectors not required on cross streets
• May be implemented without complex transit management systems
• Generally available technologies
• Insensitive to traffic conditions along cross road
• No special consideration for transit vehicles running ahead of schedule and/or empty
• Potentially lower implementation cost compared to other Level II concepts
• May lack updated transit vehicle travel information
• Placement and quantity of vehicle detection loops need to be strategically placed in consideration varying traffic queues
3 Defined operational framework is only a preliminary design of one possible variation. The operational framework will be modified during the detailed design phase to define one specific variation to be simulated and evaluated.
19
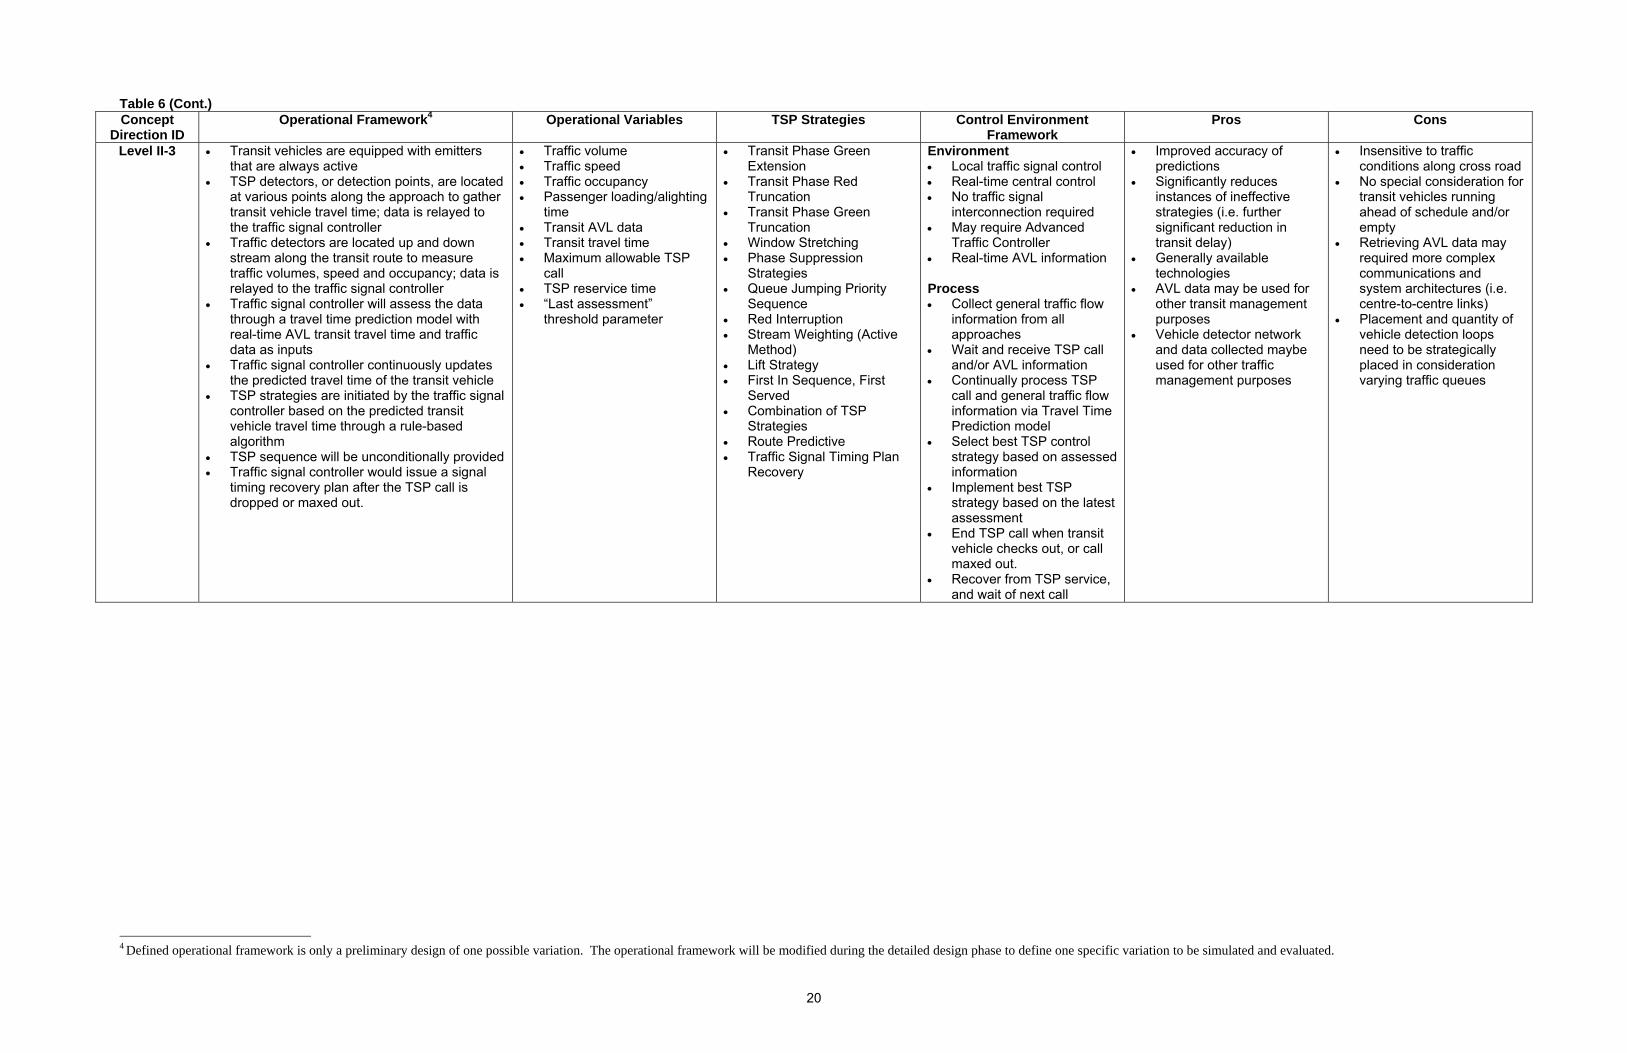
Table 6 (Cont.) Concept
Direction ID Operational Framework4 Operational Variables TSP Strategies Control Environment
Framework Pros Cons
Level II-3 • Transit vehicles are equipped with emitters that are always active
• TSP detectors, or detection points, are located at various points along the approach to gather transit vehicle travel time; data is relayed to the traffic signal controller
• Traffic detectors are located up and down stream along the transit route to measure traffic volumes, speed and occupancy; data is relayed to the traffic signal controller
• Traffic signal controller will assess the data through a travel time prediction model with real-time AVL transit travel time and traffic data as inputs
• Traffic signal controller continuously updates the predicted travel time of the transit vehicle
• TSP strategies are initiated by the traffic signal controller based on the predicted transit vehicle travel time through a rule-based algorithm
• TSP sequence will be unconditionally provided • Traffic signal controller would issue a signal
timing recovery plan after the TSP call is dropped or maxed out.
• Traffic volume • Traffic speed • Traffic occupancy • Passenger loading/alighting
time • Transit AVL data • Transit travel time • Maximum allowable TSP
call • TSP reservice time • “Last assessment”
threshold parameter
• Transit Phase Green Extension
• Transit Phase Red Truncation
• Transit Phase Green Truncation
• Window Stretching • Phase Suppression
Strategies • Queue Jumping Priority
Sequence • Red Interruption • Stream Weighting (Active
Method) • Lift Strategy • First In Sequence, First
Served • Combination of TSP
Strategies • Route Predictive • Traffic Signal Timing Plan
Recovery
Environment • Local traffic signal control • Real-time central control • No traffic signal
interconnection required • May require Advanced
Traffic Controller • Real-time AVL information Process • Collect general traffic flow
information from all approaches
• Wait and receive TSP call and/or AVL information
• Continually process TSP call and general traffic flow information via Travel Time Prediction model
• Select best TSP control strategy based on assessed information
• Implement best TSP strategy based on the latest assessment
• End TSP call when transit vehicle checks out, or call maxed out.
• Recover from TSP service, and wait of next call
• Improved accuracy of predictions
• Significantly reduces instances of ineffective strategies (i.e. further significant reduction in transit delay)
• Generally available technologies
• AVL data may be used for other transit management purposes
• Vehicle detector network and data collected maybe used for other traffic management purposes
• Insensitive to traffic conditions along cross road
• No special consideration for transit vehicles running ahead of schedule and/or empty
• Retrieving AVL data may required more complex communications and system architectures (i.e. centre-to-centre links)
• Placement and quantity of vehicle detection loops need to be strategically placed in consideration varying traffic queues
4 Defined operational framework is only a preliminary design of one possible variation. The operational framework will be modified during the detailed design phase to define one specific variation to be simulated and evaluated.
20

Table 6 (Cont.) Concept
Direction ID Operational Framework5 Operational Variables TSP Strategies Control Environment
Framework Pros Cons
Level II-4 • Transit vehicles are equipped with an intelligent computational device (i.e. vehicle logic unit)
• On board AVL System provides VLU with real-time position data
• AVL data is relayed to the travel time prediction model
• Traffic detectors are located up and down stream along the transit route to measure traffic volumes, speed and occupancy; data is relayed to the traffic signal controller
• Traffic signal controller will assess the data through a travel time prediction model with real-time AVL transit travel time and traffic data from all approaches as inputs
• Traffic signal controller continuously updates the predicted travel time of the transit vehicle
• The implementation of the TSP strategy will be conditional on the overall effect to cross-street traffic
• TSP strategies are initiated by the traffic signal controller based on the predicted transit vehicle travel time through a dynamic rule-based algorithm
• Traffic signal controller would issue a signal timing recovery plan after the TSP call is dropped or maxed out.
• Traffic volume • Traffic speed • Traffic occupancy • Cross street
capacity/saturation flow • Cross street threshold value
for TSP implementation • Transit AVL data • Passenger loading/alighting
time • Transit travel time • Maximum allowable TSP
call • TSP reservice time • “Last assessment”
threshold parameter
• Transit Phase Green Extension
• Transit Phase Red Truncation
• Transit Phase Green Truncation
• Window Stretching • Phase Suppression
Strategies • Queue Jumping Priority
Sequence • Red Interruption • Stream Weighting (Active
Method) • Lift Strategy • First In Sequence, First
Served • HOV Weighting • Combination of TSP
Strategies • Route Predictive • Traffic Signal Timing Plan
Recovery
Environment • Local traffic signal control • Real-time central control • No traffic signal
interconnection required • May require Advanced
Traffic Controller • Real-time AVL information Process • Collect general traffic flow
information from all approaches
• Wait and receive TSP call and/or AVL information
• Continually process TSP call and general traffic flow information via Travel Time Prediction model
• Assess cross street traffic flow impact, and decided if TSP should be provided
• Select best TSP control strategy based on assessed information
• Implement best TSP strategy based on the latest assessment
• End TSP call when transit vehicle checks out, or call maxed out.
• Recover from TSP service, and wait of next call
• Improved accuracy of predictions
• Balanced reduction in transit delay and cross traffic impacts
• Generally available technologies
• AVL data may be used for other transit management purposes
• Vehicle detector network and data collected maybe used for other traffic management purposes
• No special consideration for transit vehicles running ahead of schedule and/or empty
• Retrieving AVL data may required more complex communications and system architectures (i.e. centre-to-centre links)
• Placement and quantity of vehicle detection loops need to be strategically placed in consideration varying traffic queues
5 Defined operational framework is only a preliminary design of one possible variation. The operational framework will be modified during the detailed design phase to define one specific variation to be simulated and evaluated.
21
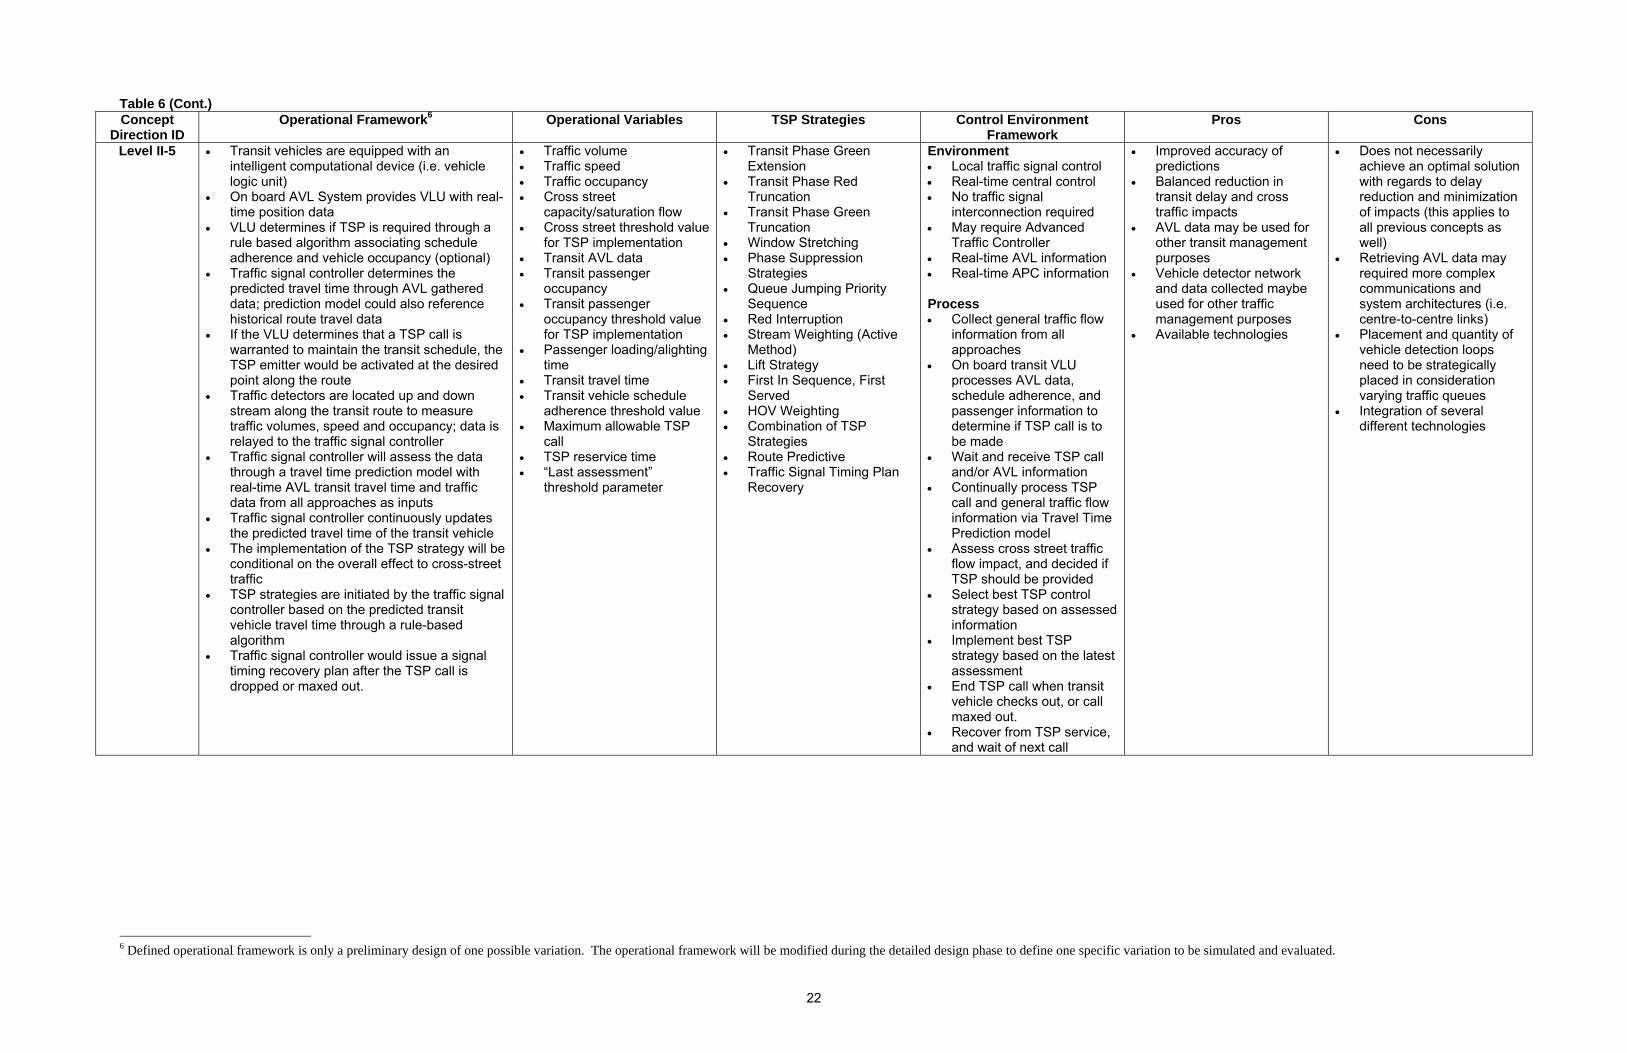
22
Table 6 (Cont.) Concept
Direction ID Operational Framework6 Operational Variables TSP Strategies Control Environment
Framework Pros Cons
Level II-5 • Transit vehicles are equipped with an intelligent computational device (i.e. vehicle logic unit)
• On board AVL System provides VLU with real-time position data
• VLU determines if TSP is required through a rule based algorithm associating schedule adherence and vehicle occupancy (optional)
• Traffic signal controller determines the predicted travel time through AVL gathered data; prediction model could also reference historical route travel data
• If the VLU determines that a TSP call is warranted to maintain the transit schedule, the TSP emitter would be activated at the desired point along the route
• Traffic detectors are located up and down stream along the transit route to measure traffic volumes, speed and occupancy; data is relayed to the traffic signal controller
• Traffic signal controller will assess the data through a travel time prediction model with real-time AVL transit travel time and traffic data from all approaches as inputs
• Traffic signal controller continuously updates the predicted travel time of the transit vehicle
• The implementation of the TSP strategy will be conditional on the overall effect to cross-street traffic
• TSP strategies are initiated by the traffic signal controller based on the predicted transit vehicle travel time through a rule-based algorithm
• Traffic signal controller would issue a signal timing recovery plan after the TSP call is dropped or maxed out.
• Traffic volume • Traffic speed • Traffic occupancy • Cross street
capacity/saturation flow • Cross street threshold value
for TSP implementation • Transit AVL data • Transit passenger
occupancy • Transit passenger
occupancy threshold value for TSP implementation
• Passenger loading/alighting time
• Transit travel time • Transit vehicle schedule
adherence threshold value • Maximum allowable TSP
call • TSP reservice time • “Last assessment”
threshold parameter
• Transit Phase Green Extension
• Transit Phase Red Truncation
• Transit Phase Green Truncation
• Window Stretching • Phase Suppression
Strategies • Queue Jumping Priority
Sequence • Red Interruption • Stream Weighting (Active
Method) • Lift Strategy • First In Sequence, First
Served • HOV Weighting • Combination of TSP
Strategies • Route Predictive • Traffic Signal Timing Plan
Recovery
Environment • Local traffic signal control • Real-time central control • No traffic signal
interconnection required • May require Advanced
Traffic Controller • Real-time AVL information • Real-time APC information Process • Collect general traffic flow
information from all approaches
• On board transit VLU processes AVL data, schedule adherence, and passenger information to determine if TSP call is to be made
• Wait and receive TSP call and/or AVL information
• Continually process TSP call and general traffic flow information via Travel Time Prediction model
• Assess cross street traffic flow impact, and decided if TSP should be provided
• Select best TSP control strategy based on assessed information
• Implement best TSP strategy based on the latest assessment
• End TSP call when transit vehicle checks out, or call maxed out.
• Recover from TSP service, and wait of next call
• Improved accuracy of predictions
• Balanced reduction in transit delay and cross traffic impacts
• AVL data may be used for other transit management purposes
• Vehicle detector network and data collected maybe used for other traffic management purposes
• Available technologies
• Does not necessarily achieve an optimal solution with regards to delay reduction and minimization of impacts (this applies to all previous concepts as well)
• Retrieving AVL data may required more complex communications and system architectures (i.e. centre-to-centre links)
• Placement and quantity of vehicle detection loops need to be strategically placed in consideration varying traffic queues
• Integration of several different technologies
6 Defined operational framework is only a preliminary design of one possible variation. The operational framework will be modified during the detailed design phase to define one specific variation to be simulated and evaluated.

LegendVehicle DetectorTransit Vehicle Detection Point
Level II-1
•Transit vehicle TSP emitters always active•TSP detectors, or detection points, for transit travel time data in POZ•Traffic detectors for volume, speed and occupancy data•Collected data is assessed through a travel time prediction model •Predicted travel time of the transit vehicle continuously monitored and updated•TSP strategies initiated based on the predicted transit vehicle travel time through a rule-based algorithm•TSP sequence unconditionally provided•Signal timing recovery plan initiated after TSP call is dropped or maxed out.
Transit Vehicle
Transit Stop
Local Traffic Signal Controller
Figure 4: Concept Level II-1 Intersection Layout
Figure 5: Concept Level II-1 Algorithmic Details
23
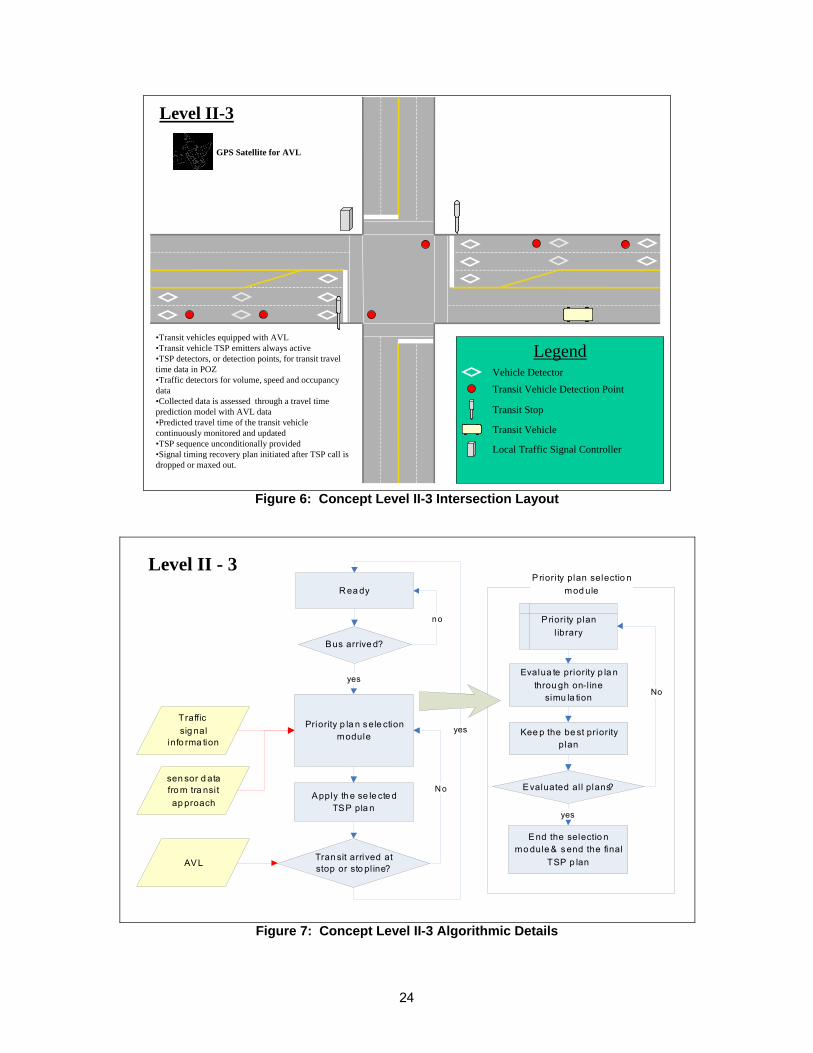
LegendVehicle DetectorTransit Vehicle Detection Point
Level II-3
•Transit vehicles equipped with AVL•Transit vehicle TSP emitters always active•TSP detectors, or detection points, for transit travel time data in POZ•Traffic detectors for volume, speed and occupancy data•Collected data is assessed through a travel time prediction model with AVL data•Predicted travel time of the transit vehicle continuously monitored and updated•TSP sequence unconditionally provided•Signal timing recovery plan initiated after TSP call is dropped or maxed out.
Transit Vehicle
GPS Satellite for AVL
Transit Stop
Local Traffic Signal Controller
Figure 6: Concept Level II-3 Intersection Layout
Bus arrive d?
Traffic sig nal
info rma tion
Priori ty plan l ibrary
Evalua te priority p la nthrou gh on-l ine
simu la tion
Kee p the be st priority plan
Evaluated al l plans?
yes
End the selectio n mo dule & s end the final
TSP p lan
yes
sen sor d ata fro m tra nsit ap proach
AVL
Priority p la n sele ction module
Apply th e se le cte dTSP pla n
Tran sit arrived atstop or sto pl ine?
No
Priori ty plan selectio n mod ule
No
R ea dy
no
yes
Level II - 3
Figure 7: Concept Level II-3 Algorithmic Details
24

Level II-4
•Transit vehicles are equipped with AVL and a VLU•AVL used in travel time prediction model•Traffic detectors for volume, speed and occupancy data on all approaches•Collected data is assessed through a travel time prediction model with real-time AVL and traffic data•Predicted travel time of the transit vehicle continuously monitored and updated• TSP strategy implementation conditional on effect to cross-street traffic•TSP strategies initiated through a dynamic rule-based algorithm•Signal timing recovery plan initiated after TSP call is dropped or maxed out.
LegendVehicle DetectorTransit Vehicle Detection Point
Transit Stop
Real-time AVL Update Point
Transit Vehicle with VLU
GPS Satellite for AVL
Local Traffic Signal Controller
Figure 8: Concept Level II-4 Intersection Layout
Bus arrive d?Traffic sig nal
info rma tion
Priori ty plan l ib ra ry
Eva lua te priority pla nth ro ugh on-l in e
simula tion
Kee p the b est priority plan
Evaluated al l plans?
yes
En d the selection mo dule & send the fina l
TSP p la n
yes
sen sor d ata fro m tra nsi t ap proach
AVL
Priority p la n sele ction module
Apply th e se le cte dTSP pla n
Tran sit arrived atstop or sto pl ine?
No
Priori ty plan selectio n modu le
No
sen sor d ata from c ro ss
streets
Sa tisfy the crossstreet condition s?
yes
No
R ea dy
no
yes
Level II - 4
Figure 9: Concept Level II-4 Algorithmic Details
25
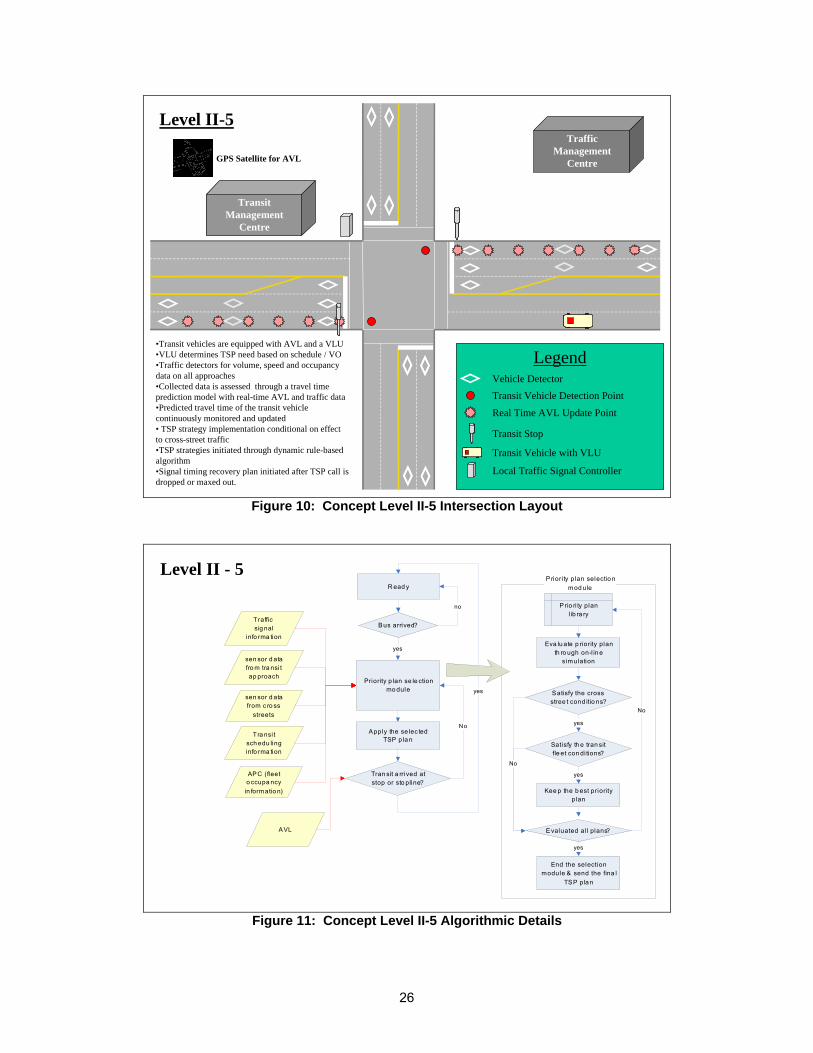
LegendVehicle DetectorTransit Vehicle Detection Point
Level II-5
•Transit vehicles are equipped with AVL and a VLU•VLU determines TSP need based on schedule / VO•Traffic detectors for volume, speed and occupancy data on all approaches•Collected data is assessed through a travel time prediction model with real-time AVL and traffic data•Predicted travel time of the transit vehicle continuously monitored and updated• TSP strategy implementation conditional on effect to cross-street traffic•TSP strategies initiated through dynamic rule-based algorithm•Signal timing recovery plan initiated after TSP call is dropped or maxed out.
Real Time AVL Update Point
Transit Vehicle with VLU
GPS Satellite for AVL
Traffic Management
Centre
Transit Management
Centre
Transit Stop
Local Traffic Signal Controller
Figure 10: Concept Level II-5 Intersection Layout
Bus arrived?Traffic sig nal
info rma tion
Prio ri ty plan l ib ra ry
Eva lu ate p riority planth ro ugh on-l in e
simulation
Kee p the b est priority plan
Evaluated al l plans?
yes
End the selection module & send the fina l
TSP pla n
yes
sen sor d ata fro m tra nsi t ap proach
AVL
Priority p lan se le ction mo dule
Apply the se lec tedTSP p la n
Tran sit a rrived atstop or sto pline?
No
Priori ty plan selectio n mod ule
No
sen sor d ata from c ro ss
streets
Satisfy the crossstree t cond itio ns?
yes
Tra nsi t sch edu ling info rma tion
APC (fleet o ccupa ncy in formatio n)
Satisfy th e tran sitfle et con ditions?
yes
No
R ead y
no
yes
Level II - 5
Figure 11: Concept Level II-5 Algorithmic Details
26
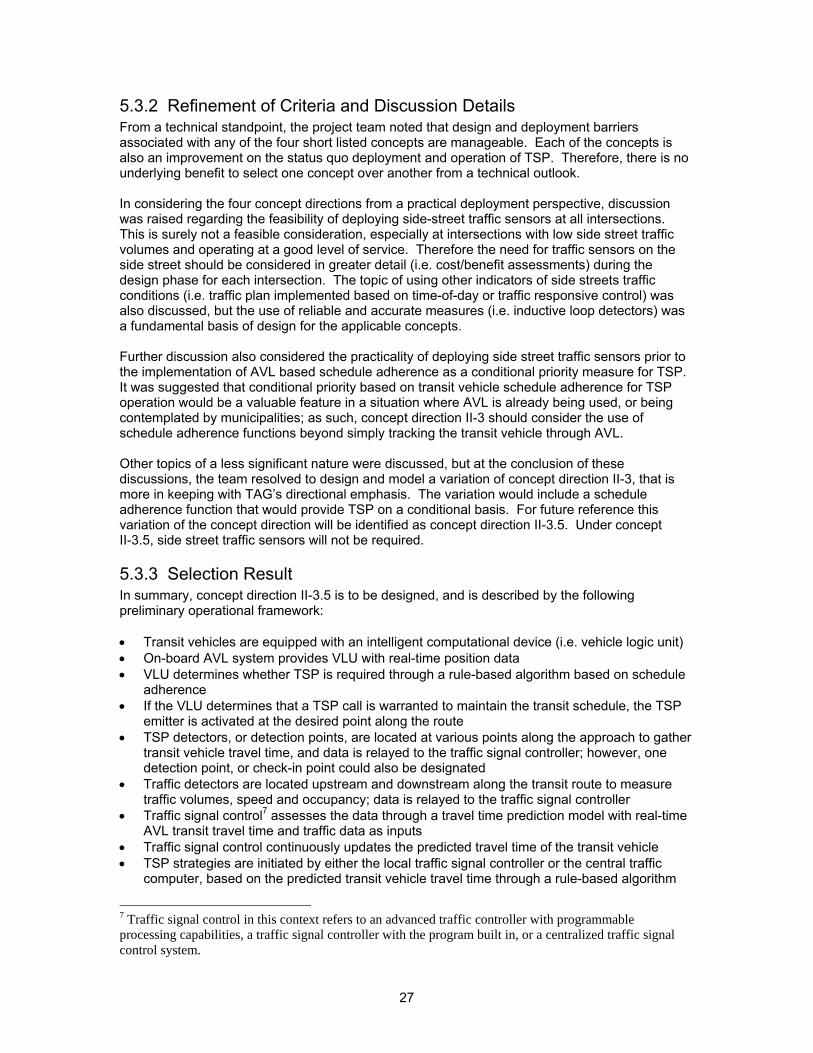
5.3.2 Refinement of Criteria and Discussion Details From a technical standpoint, the project team noted that design and deployment barriers associated with any of the four short listed concepts are manageable. Each of the concepts is also an improvement on the status quo deployment and operation of TSP. Therefore, there is no underlying benefit to select one concept over another from a technical outlook. In considering the four concept directions from a practical deployment perspective, discussion was raised regarding the feasibility of deploying side-street traffic sensors at all intersections. This is surely not a feasible consideration, especially at intersections with low side street traffic volumes and operating at a good level of service. Therefore the need for traffic sensors on the side street should be considered in greater detail (i.e. cost/benefit assessments) during the design phase for each intersection. The topic of using other indicators of side streets traffic conditions (i.e. traffic plan implemented based on time-of-day or traffic responsive control) was also discussed, but the use of reliable and accurate measures (i.e. inductive loop detectors) was a fundamental basis of design for the applicable concepts. Further discussion also considered the practicality of deploying side street traffic sensors prior to the implementation of AVL based schedule adherence as a conditional priority measure for TSP. It was suggested that conditional priority based on transit vehicle schedule adherence for TSP operation would be a valuable feature in a situation where AVL is already being used, or being contemplated by municipalities; as such, concept direction II-3 should consider the use of schedule adherence functions beyond simply tracking the transit vehicle through AVL. Other topics of a less significant nature were discussed, but at the conclusion of these discussions, the team resolved to design and model a variation of concept direction II-3, that is more in keeping with TAG’s directional emphasis. The variation would include a schedule adherence function that would provide TSP on a conditional basis. For future reference this variation of the concept direction will be identified as concept direction II-3.5. Under concept II-3.5, side street traffic sensors will not be required.
5.3.3 Selection Result In summary, concept direction II-3.5 is to be designed, and is described by the following preliminary operational framework: • Transit vehicles are equipped with an intelligent computational device (i.e. vehicle logic unit) • On-board AVL system provides VLU with real-time position data • VLU determines whether TSP is required through a rule-based algorithm based on schedule
adherence • If the VLU determines that a TSP call is warranted to maintain the transit schedule, the TSP
emitter is activated at the desired point along the route • TSP detectors, or detection points, are located at various points along the approach to gather
transit vehicle travel time, and data is relayed to the traffic signal controller; however, one detection point, or check-in point could also be designated
• Traffic detectors are located upstream and downstream along the transit route to measure traffic volumes, speed and occupancy; data is relayed to the traffic signal controller
• Traffic signal control7 assesses the data through a travel time prediction model with real-time AVL transit travel time and traffic data as inputs
• Traffic signal control continuously updates the predicted travel time of the transit vehicle • TSP strategies are initiated by either the local traffic signal controller or the central traffic
computer, based on the predicted transit vehicle travel time through a rule-based algorithm
7 Traffic signal control in this context refers to an advanced traffic controller with programmable processing capabilities, a traffic signal controller with the program built in, or a centralized traffic signal control system.
27
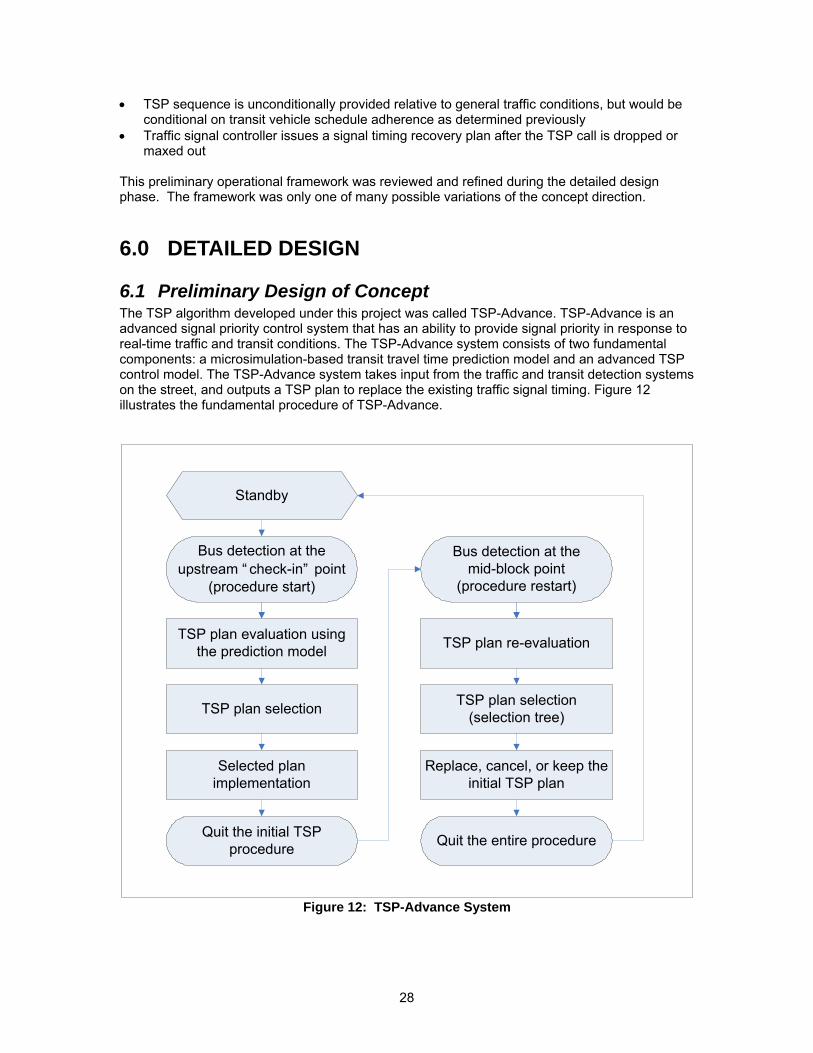
• TSP sequence is unconditionally provided relative to general traffic conditions, but would be
conditional on transit vehicle schedule adherence as determined previously • Traffic signal controller issues a signal timing recovery plan after the TSP call is dropped or
maxed out This preliminary operational framework was reviewed and refined during the detailed design phase. The framework was only one of many possible variations of the concept direction.
6.0 DETAILED DESIGN
6.1 Preliminary Design of Concept The TSP algorithm developed under this project was called TSP-Advance. TSP-Advance is an advanced signal priority control system that has an ability to provide signal priority in response to real-time traffic and transit conditions. The TSP-Advance system consists of two fundamental components: a microsimulation-based transit travel time prediction model and an advanced TSP control model. The TSP-Advance system takes input from the traffic and transit detection systems on the street, and outputs a TSP plan to replace the existing traffic signal timing. Figure 12 illustrates the fundamental procedure of TSP-Advance.
Standby
Bus detection at the upstream “ check-in” point
(procedure start)
TSP plan evaluation using the prediction model
TSP plan selection
Selected plan implementation
Quit the initial TSP procedure
Bus detection at the mid-block point
(procedure restart)
TSP plan re-evaluation
TSP plan selection(selection tree)
Replace, cancel, or keep the initial TSP plan
Quit the entire procedure
Figure 12: TSP-Advance System
28

As shown in Figure 12, the procedure is activated by a bus arrival at any of the transit “check-in” detection points. The system conducts an identical procedure regardless of the detection point. For each priority plan as well as the existing traffic signal timing, the prediction model estimates the transit travel time to the stopline. Since the traffic signal timing at the downstream intersection affects the vehicle movements in the link, the prediction model delivers a different transit travel time for each priority plan. The priority plan that is expected to cause the least transit signal delay is implemented at the traffic signal controller and TSP-Advance returns to standby status as the final step. In this procedure, TSP-Advance has a number of advanced features that make the proposed system distinct from other conventional TSP control methods. The following features provide more efficient signal priority control:
The system maintains a TSP plan library that contains a number of priority strategies, and
provides the most appropriate plan from the library for the real-time traffic and transit conditions;
The TSP plan library includes several advanced TSP strategies in addition to the traditional transit phase green extension and non-transit phase truncation strategies;
The priority control model attempts to minimize interruptions of the normal signal operation by including the option of no priority when the expected effects are not significant;
The control model adopts a signal priority re-evaluation process at an intermediate “checkpoint”;
The control model also provides transit headway-based conditional priority to improve transit service regularity;
The transit prediction model estimates transit travel time using real-time traffic sensor data so that the impacts of changing traffic conditions can be accommodated in the prediction process;
The prediction model is able to simulate transit movements up to any desired point on the link so that it can work with any dwell time estimation model for intersections with near-side transit stops.
More detailed descriptions of the TSP-Advance components focusing on the recent improvements are presented in the following sections.
6.2 Detailed Design of Concept The previously developed base algorithm, which was presented at TAG session number 2, operated unconditional TSP that provides signal priority to any transit vehicle once it is detected upstream of the intersection. The base algorithm was also able to operate TSP for a one-way transit route. The priority control model in the TSP-Advance system was improved in two ways; first, the control model includes priority control rules for multidirectional transit routes and second, the model provides conditional signal priority based on transit headway adherence information. The typical approach in multidirectional (i.e., two-way or four-way) TSP control is a first-come, first-served method. Therefore, if the signal controller is serving signal priority for a transit vehicle on one side of the link approach, all priority requests received from the other approaches are declined until the transit vehicle passes the intersection. However, this method naturally does not consider transit vehicles in the other link approaches, and this may incur increased delay to these transit vehicles. The TSP-Advance system adopts a new approach that selects a priority plan to maximize the benefits of TSP to all approaching transit vehicles. For instance, if more than one transit vehicle requests signal priority, TSP-Advance selects a TSP plan that is expected to produce the least transit signal delay for the approaching transit vehicles. Transit service regularity is one of the critical measurements of performance for transit users as well as transit agencies. Irregular transit services in terms of headway or schedule at transit stops increase passenger wait times and discourage passengers from using public transit. Transit services become inefficient as transit vehicles are unevenly spaced and even bunched. Bunching of transit vehicles causes frequent passenger overloading and spillback so that eventually more
29

transit services are required, particularly during peak time periods. A number of operational strategies have been suggested to improve transit service adherence, including vehicle holding, stop-skipping, short-turning, and deadheading. Conditional TSP can improve transit service regularity by providing signal priority only to late transit vehicles. Within the TSP-Advance system, each time a bus passes the upstream sensor, the actual headway of the bus from the previous bus is calculated, and only the buses that are behind the scheduled headway can request signal priority.
6.2.1 High Performance On-Line Microsimulation Model for Transit Travel Time Prediction
An on-line microsimulation-based prediction model was developed as one of the key components of the advanced TSP method. Predicted transit travel times within a reasonable degree of accuracy are an important requirement for efficient signal priority operation of the advanced method. In order to achieve a proper level of prediction accuracy, the simulation model was designed to represent individual vehicle’s movements and the interactions between vehicles with as much as detail as practicably feasible. The simulation model represents each individual vehicle as a separate object and the behaviour of an object is governed by pre-defined driving rules instead of models in analytical methods (i.e., car following and lane changing models). The set of driving rules consists of those dealing with different driving situations including the initialization rules, free flow driving rules, car following rules, lane changing rules, traffic signal reaction rules. The Initializing rules define the actions of the model at the beginning of the simulation:
1. At the beginning of simulation, the model assigns aggressiveness level, , to
each individual vehicle
( )Ggvg ∈
( Nnn )∈ in the simulated network.
2. Each individual vehicle is also assigned a desired driving speed, , a desired
acceleration speed, , a desired deceleration speed,
n ( )nvd
( )nvacc ( )nvdcc , desired gap from
the leading vehicle, , and perception time, ( )ng ( )np , corresponding to the already given aggressiveness level; for example, a vehicle with a higher degree of aggressiveness will be assigned a higher desired acceleration and deceleration speed, less desired gap, and faster perception time.
3. Vehicles are also assigned a maximum deceleration speed, , that is identically given to all vehicles in the simulated network.
( )nv dccmax_
The free flow driving rules specify the vehicle behaviour in free flow speed. Any car will follow these free flow driving rules, if the headway distance from the leading car is greater than its critical distance. The critical distance of one vehicle is defined as the headway distance where this vehicle would be affected by the behaviour of the leading vehicle. The critical distance for vehicle , , is defined as follows: n )1,( −nndc
( ) )1()()()()1()1,(1, −+⋅++−−−=− nlnvnpngndnndnnd pbc )1(
Where:
=− )1,( nndb braking distance of vehicle to decelerate to the speed of vehicle n 1−n
=− )1(nd p distance traveled by the leading vehicle 1−n while the target vehicle is braking
n
=)(ng desired gap of the car from the leading car n 1−n =)(np perception time of the car n
30
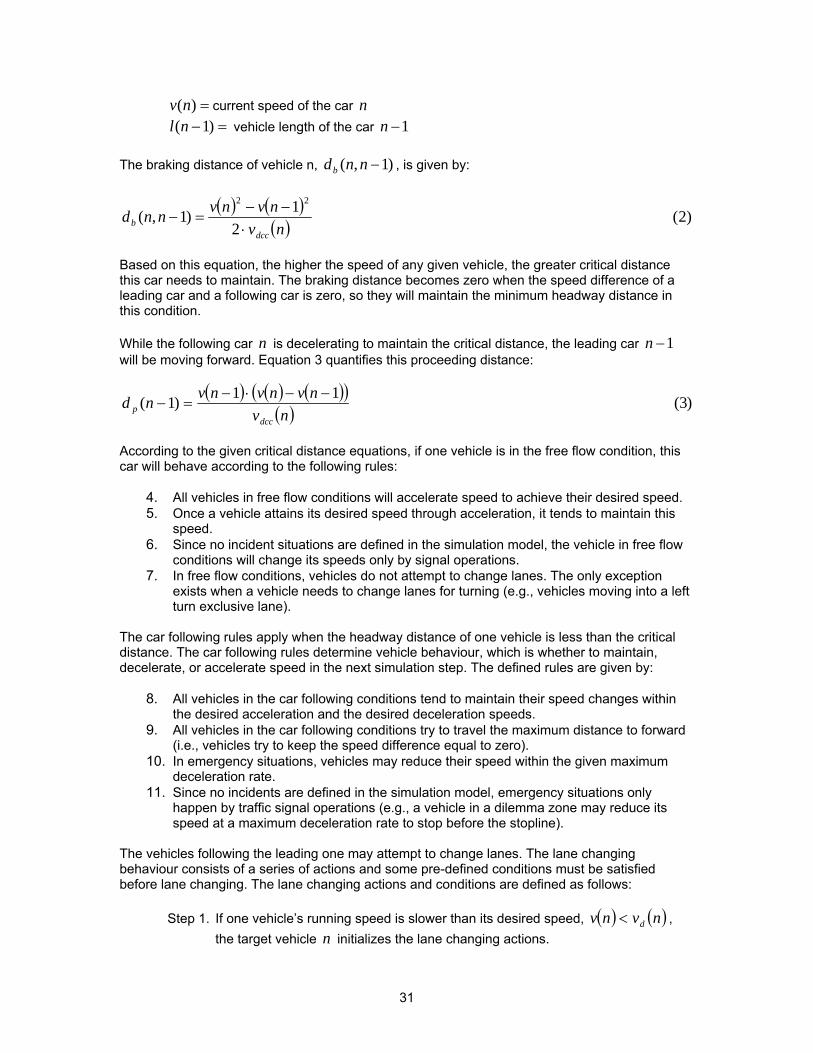
=)(nv current speed of the car n
=− )1(nl vehicle length of the car 1−n The braking distance of vehicle n, )1,( −nndb , is given by:
( ) ( )( )nvnvnvnnd
dccb ⋅
−−=−
21)1,(
22
)2(
Based on this equation, the higher the speed of any given vehicle, the greater critical distance this car needs to maintain. The braking distance becomes zero when the speed difference of a leading car and a following car is zero, so they will maintain the minimum headway distance in this condition. While the following car is decelerating to maintain the critical distance, the leading car n 1−n will be moving forward. Equation 3 quantifies this proceeding distance:
( ) ( ) ( )( )( )nv
nvnvnvnddcc
p11)1( −−⋅−
=− )3(
According to the given critical distance equations, if one vehicle is in the free flow condition, this car will behave according to the following rules:
4. All vehicles in free flow conditions will accelerate speed to achieve their desired speed. 5. Once a vehicle attains its desired speed through acceleration, it tends to maintain this
speed. 6. Since no incident situations are defined in the simulation model, the vehicle in free flow
conditions will change its speeds only by signal operations. 7. In free flow conditions, vehicles do not attempt to change lanes. The only exception
exists when a vehicle needs to change lanes for turning (e.g., vehicles moving into a left turn exclusive lane).
The car following rules apply when the headway distance of one vehicle is less than the critical distance. The car following rules determine vehicle behaviour, which is whether to maintain, decelerate, or accelerate speed in the next simulation step. The defined rules are given by:
8. All vehicles in the car following conditions tend to maintain their speed changes within the desired acceleration and the desired deceleration speeds.
9. All vehicles in the car following conditions try to travel the maximum distance to forward (i.e., vehicles try to keep the speed difference equal to zero).
10. In emergency situations, vehicles may reduce their speed within the given maximum deceleration rate.
11. Since no incidents are defined in the simulation model, emergency situations only happen by traffic signal operations (e.g., a vehicle in a dilemma zone may reduce its speed at a maximum deceleration rate to stop before the stopline).
The vehicles following the leading one may attempt to change lanes. The lane changing behaviour consists of a series of actions and some pre-defined conditions must be satisfied before lane changing. The lane changing actions and conditions are defined as follows:
Step 1. If one vehicle’s running speed is slower than its desired speed, , the target vehicle initializes the lane changing actions.
( ) ( )nvnv d<n
31

Step 2. The target car first checks the next lane to determine whether it can advance a
longer distance than in the current lane. The critical distance from the leading vehicle in the current lane is given by
n
1−n )1,( −nndc . Also the critical
distance from the leading vehicle in the next lane 1−m is given by )1,( −mndc .
Proceed to step 3, If )1,( −nndc < )1,( −mndc .
Step 3. Define the following car of the vehicle 1−m as 1+m . The target car checks the critical distance between n and
n1+m . If the headway distance between the
target vehicle n and 1+m is greater than the critical distance, , proceed to step 4.
)1,( +mndc
Step 4. In order to avoid frequent lane changing behaviour of one vehicle, a final decision of lane changing is made based on the pre-defined thresholds. Threshold values are assigned to individual vehicles depending on the target car’s aggressiveness level, the additional advance distance in the next lane when changing lane, and the required speed reduction of the following car in the next lane. If the given conditions are met with the threshold values, the target car changes to the next lane.
The lane changing rules define the behaviour of vehicles when they are changing lanes or considering lane changing.
12. While one car is changing its driving lane, the following cars either in the current lane, , or the target lane (moving-in lane), 1+n 1+m , are affected by the lane changing
behaviour. 13. If one vehicle is currently in a turning lane and it needs to turn at the downstream
intersection, this car will not consider lane changing. 14. Transit vehicles do not consider lane changing when they are in the curb lane.
Since the proposed simulation model was developed to describe the vehicle movements in urban links, the role of the traffic signal reaction rules is critical for realistic representations of vehicle behaviour. The defined reaction rules apply to the vehicles approaching the downstream intersection and override all the other driving rules. For instance, even if one vehicle is in free flow conditions, this car must reduce speed if the red phase is being provided to the approach.
15. Vehicles follow the free flow or the car following rules when a green phase is being provided.
16. When the signal phase is red and there is no leading vehicle, the target vehicle reduces speed in its desired deceleration rate aiming for complete stopping ( ) at the stopline.
0)( =nv
17. When the signal phase is red but there is a leading vehicle, the target car behaves in response to the reaction of the leading car.
18. When the signal phase is changing from green to red (i.e., yellow time) and there is no leading car, the target vehicle reduces speed if it can stop before the stopline before the signal phase becomes red. However, the target vehicle maintains or accelerates speed if it cannot stop at the stopline within the remaining yellow time.
19. In a situation when the signal phase is changing from green to red (i.e., yellow time) and there is a leading car that is reducing its speed, the target car follows Rule number 17.
20. In a situation when the signal phase is changing from green to red (i.e., yellow time) and there is a leading car that is not reducing its speed, the target car follows Rule number 18.
32

6.2.2 The TSP Plan Library Unlike the conventional TSP systems, TSP-Advance maintains a priority plan library that includes a number of pre-defined priority plans. In response to the real-time traffic and transit conditions, one priority plan is selected by the TSP operation model based on the fitness evaluated using the prediction model. Transit-phase extension and non-transit phase truncation are the most commonly used strategies. In addition to those standard strategies, the TSP operation model adopted two more advanced strategies. Transit Phase Extension This strategy extends the transit approach green time when a transit vehicle is approaching. The green extension strategy usually begins with an initial fixed green time period that is followed by demand-dependant extensions. The extensions are served consecutively until the approaching transit vehicle passes the stopline transit detector or until a maximum number of extensions are provided (i.e. max out). Non-Transit Phase Truncation This strategy provides early truncation of the non-transit green phase (i.e., transit approach red phase) to provide for a quicker return to the transit green phase. Usually a fixed period of the non-transit phase is truncated from the scheduled time. When truncating the red phase, all minimum times should be maintained to provide for safe operation on the side street for traffic and pedestrians. Transit Phase Truncation This strategy provides truncation of the transit vehicle green phase to provide for a quicker return to the transit phase in the next cycle if the detected vehicle is not expected to be able to travel through the intersection by the end of the regular or extended transit phase. This strategy must be provided on the basis of accurate travel time prediction, because early truncation of transit phase may increase queue length on the transit approach and increase transit delay as a result. Minimum green times should be maintained when the transit phase is truncated. Queue Dissipation for Approaching Transit Vehicles This strategy provides green phase to the transit approach until the expected transit arrival time at the near-side stop by either truncating or extending the normal transit phase. This strategy intends to provide green phase to cross streets during the passenger service time of the transit vehicle at the near-end stop when the detected transit vehicle is not expected to be able to complete passenger service by the end of the regular or extended transit phase. Using the four priority strategies, six priority plans were defined in the plan library as described below. One priority plan may combine two different priority strategies; for example, a transit phase extension and non-transit phase truncation can be one priority plan.
Priority plan 1. Transit phase extension only Priority plan 2. Transit phase extension and non-transit phase truncation Priority plan 3. Transit phase truncation only Priority plan 4. Transit phase truncation and non-transit phase truncation Priority plan 5. Queue dissipation for approaching transit vehicles Priority plan 6. Queue dissipation and non-transit phase truncation
6.2.3 The Signal Priority Re-evaluation Process The TSP-Advance system takes a new approach to signal priority control that adopts multiple transit “check-in” points in each transit approach. This approach allows earlier detection of the approaching transit vehicles and also minimizes the impacts of the uncertainty in transit travel times on the TSP operation by reprocessing the proposed TSP control procedure at a mid-block transit detection point. To understand how this approach works, consider the configuration of the detection system illustrated in Figure 13.
33
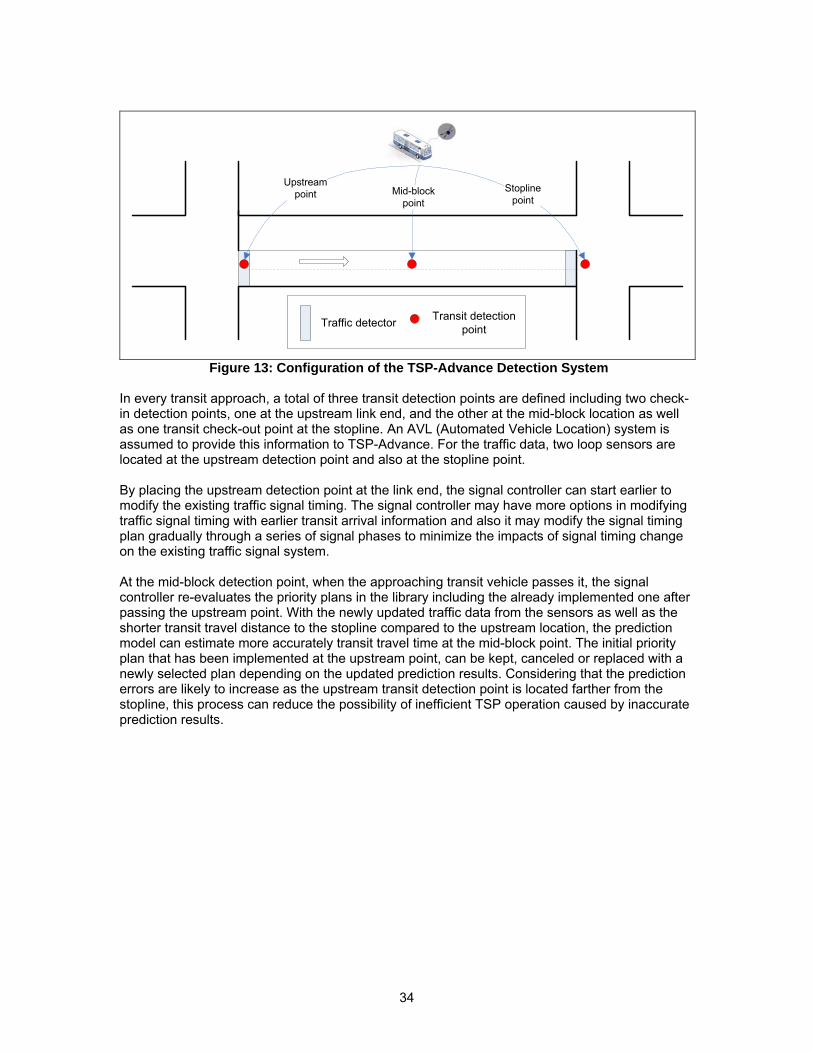
Mid-blockpoint
Stoplinepoint
Traffic detector Transit detection point
Upstreampoint
Figure 13: Configuration of the TSP-Advance Detection System
In every transit approach, a total of three transit detection points are defined including two check-in detection points, one at the upstream link end, and the other at the mid-block location as well as one transit check-out point at the stopline. An AVL (Automated Vehicle Location) system is assumed to provide this information to TSP-Advance. For the traffic data, two loop sensors are located at the upstream detection point and also at the stopline point. By placing the upstream detection point at the link end, the signal controller can start earlier to modify the existing traffic signal timing. The signal controller may have more options in modifying traffic signal timing with earlier transit arrival information and also it may modify the signal timing plan gradually through a series of signal phases to minimize the impacts of signal timing change on the existing traffic signal system. At the mid-block detection point, when the approaching transit vehicle passes it, the signal controller re-evaluates the priority plans in the library including the already implemented one after passing the upstream point. With the newly updated traffic data from the sensors as well as the shorter transit travel distance to the stopline compared to the upstream location, the prediction model can estimate more accurately transit travel time at the mid-block point. The initial priority plan that has been implemented at the upstream point, can be kept, canceled or replaced with a newly selected plan depending on the updated prediction results. Considering that the prediction errors are likely to increase as the upstream transit detection point is located farther from the stopline, this process can reduce the possibility of inefficient TSP operation caused by inaccurate prediction results.
34
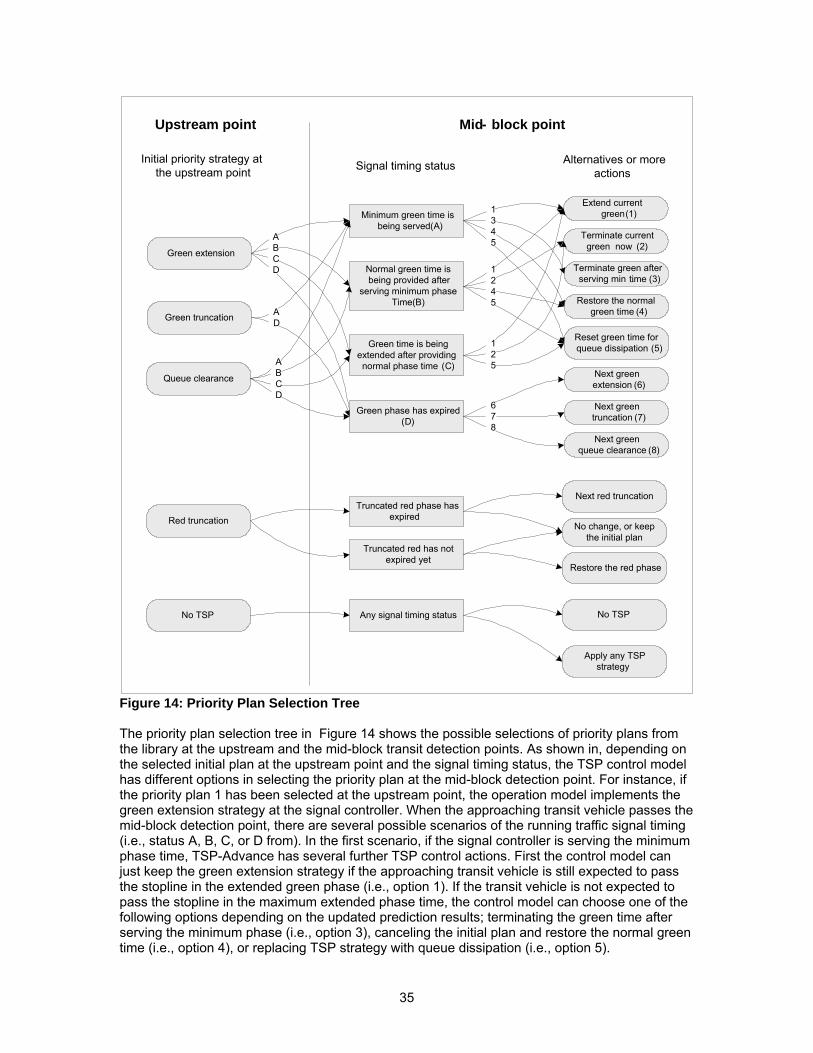
Green extension
Red truncation
Green truncation
Minimum green time is being served (A)
Initial priority strategy at the upstream point Signal timing status
Normal green time is being provided after
serving minimum phase Time(B)
Truncated red phase has expired
Truncated red has not expired yet
No change, or keep the initial plan
Restore the red phase
Next red truncation
Queue clearance
Green time is being extended after providing normal phase time (C)
Alternatives or more actions
Upstream point Mid- block point
No TSP No TSP
Apply any TSPstrategy
Any signal timing status
Terminate green after serving min . time (3)
Restore the normal green time (4)
Green phase has expired (D)
Next greenextension (6)
Extend currentgreen (1)
Next greentruncation (7)
Next greenqueue clearance (8)
Terminate currentgreen now (2)
ABCD
AD
ABCD
Reset green time for queue dissipation (5)
1345
1245
125
678
Figure 14: Priority Plan Selection Tree The priority plan selection tree in Figure 14 shows the possible selections of priority plans from the library at the upstream and the mid-block transit detection points. As shown in, depending on the selected initial plan at the upstream point and the signal timing status, the TSP control model has different options in selecting the priority plan at the mid-block detection point. For instance, if the priority plan 1 has been selected at the upstream point, the operation model implements the green extension strategy at the signal controller. When the approaching transit vehicle passes the mid-block detection point, there are several possible scenarios of the running traffic signal timing (i.e., status A, B, C, or D from). In the first scenario, if the signal controller is serving the minimum phase time, TSP-Advance has several further TSP control actions. First the control model can just keep the green extension strategy if the approaching transit vehicle is still expected to pass the stopline in the extended green phase (i.e., option 1). If the transit vehicle is not expected to pass the stopline in the maximum extended phase time, the control model can choose one of the following options depending on the updated prediction results; terminating the green time after serving the minimum phase (i.e., option 3), canceling the initial plan and restore the normal green time (i.e., option 4), or replacing TSP strategy with queue dissipation (i.e., option 5).
35
As illustrated in Figure 14, if the red truncation strategy has been selected at the upstream point, there are two possible scenarios when the approaching vehicle passes the mid-block point; either the shortened cross street green time is still being served or the cross street green time already has been expired. For the first scenario, the control model can restore the cross street green time to its normal phase length, if the approaching transit vehicle is not expected to take an advantage from the shortened cross street green time. Consider another case to demonstrate the potential benefit of the re-evaluation process. There may be cases where no TSP plan is implemented at the upstream point, usually when the prediction model estimates the approaching transit vehicle can pass the intersection in the normal signal timing. However, because of the changing traffic conditions within the link approach, the approaching transit vehicle may be delayed before arriving at the mid detection point. For the approaching transit vehicle, TSP-Advance may reconsider applying a TSP plan and improve the situation if necessary. Any priority plan can be selected in this case regardless of the current traffic signal timing as shown in Figure 14.
6.2.4 The On-Line Microsimulation Model for Transit Travel Time Prediction
A microsimulation model was developed for the purpose of transit travel time estimation. The movement of individual vehicles within the model is governed by a set of pre-defined rules dealing with different driving situations including the initialization rules, free flow driving rules, car following rules, lane changing rules, traffic signal reaction rules, and transit vehicle rules. The initializing rules define the actions of the model at the beginning of the simulation. The free flow driving rules specify the vehicle behaviour in free flow speed. The car following rules determine vehicle behaviour, that is whether to maintain, decelerate, or accelerate its speed in the next simulation step under the effect of the prior vehicle’s movement. The lane changing rules define the behaviour of vehicles when they are changing lanes or considering lane changing. The traffic signal reaction rules apply to the vehicles approaching the downstream intersection and override all the other driving rules. Finally, the transit vehicle rules define the transit vehicle movements during simulation. This online simulation model has been enhanced in the TSP-Advance system to provide the expected transit link travel time as well as signal delay for each priority plan, through two simulation phases: the pre-simulation and the main simulation processes. At the moment of a bus arrival at the transit check-in point, the pre-simulation process reconstructs each vehicle’s movement existing in the link approach during its link time using the driving rules. The link time for a given vehicle can be defined as the elapsed time from the time of detection of that vehicle at the upstream traffic sensor until the bus detection time. This pre-simulation process is similar to the main simulation process, yet with an assumption that vehicles do not change lanes during their link times for the purpose of modeling simplification. Therefore, the lane changing rules are not applied in this process. Following the pre-simulation phase, the prediction model obtains the estimated location and the speed of each vehicle in the link approach. On the basis of these pre-simulation results, the main simulation process simulates their future movements in every time step (0.5 seconds in this study). The prediction model predicts the link travel times of buses by simulating the movements of not only buses but also general traffic (i.e., automobiles) to capture the effects of auto driver behaviour on the movements of buses. Therefore, the prediction model was designed to represent each vehicle as a separate object in order to describe the individual vehicle’s movements and the interactions between vehicles in as much detail as practically feasible. Link travel time of one transit vehicle consists of its travel time from the upstream link end to the bus stop (in the case of near-side stops), the dwell time at the stop, and the time to travel from the stop to the intersection stopline. For the transit approaches with stops at different locations, the
36
prediction model was developed to estimate transit movements up to any desired point on the link so that it can work with any dwell time prediction model.
7.0 TEST SITE A significant component of the project was to evaluate the TSP algorithm developed. At the start of the project it was decided that the algorithm would be tested in a simulation environment.
7.1 Test Site Options The viability of the work completed through this project relies on the result of the simulation and evaluation exercise. To provide the utmost credibility of the simulation model a realistic corridor was desired. Alternatively, the team could have designed a fictious corridor based on assumed traffic flows and traffic signal operation. An offer was made to members of the TAG to volunteer corridors within their jurisdiction and the necessary data to prepare the simulation environment. Two municipalities suggested several corridors for consideration. The team reviewed each suggestion in respect to the criteria identified in Section 7.2.3. The selected corridor is described in greater detail in Section 7.3.
7.2 Test Site Selection Criteria In selecting the preferred test site, details gathered from various TAG meetings were consolidated to assist with the selection. The following sections list some of the key details expressed by stakeholders and provide a condensed listing of route selection criteria.
7.2.1 TAG-Suggested Evaluation Environments • High-frequency transit service (easy to justify); transit headway less than 10 minutes and/or
between 10-15 minutes • Low-frequency transit service (less impact to traffic but evaluate with a higher level of priority) • Small and large intersections with 2 phase and 8 phase operation, respectively • Pedestrian activity impacts with far-side stop and extensions, and operation in “flashing don’t
walk” and dwell in “don’t walk” • TSP operation during peak periods and/or LOS greater than or equal to C • Heavy right turn movements: 200 per hour or greater • Differing length of right turn lanes • Near-side/far-side operation
7.2.2 Other TAG-Suggested Considerations • Should also consider the required policies, functionality, and benefit-cost ratios • Should also consider the validity of the concept (i.e. ability to monitor/revise) • Difficult to see TSP moving beyond concept II-1 at this time • Complex systems are not necessarily good for small municipalities; can they justify the costs?
Resources to operate and maintain? • Need to develop and define criteria for the deployment of each concept: where and when
could the concept be used? • Transit is to determine whether AVL/VLU is needed • Need to develop clear public policy objectives
7.2.3 Consolidated Route Selection Criteria Options Base on the comments and feedback gathered from TAG members, the following list of route selection criteria was compiled:
37

• 10-15 minute headway • 10 or more signalized intersections • Near-side stops with right turn bays • Presence of far-side stops • C,D,E LOS during peak hours • Differing lengths of right turns • Area with heavy pedestrian activity • Mixture of simple and complex intersection operations • Travel distance to site for verification • Availability of intersection drawings, turning movement counts, traffic signal timing plans, etc. • Transit vehicle schedule adherence data, delays at intersections, etc.
7.3 Preferred Test Site Description Transit corridors from two municipalities were considered. Preliminary reviews of the various transit corridors presented were undertaken by the project team. At the conclusion of these reviews the project team decided to focus on corridors located within the City of Brampton, Ontario. Two corridors within the City of Brampton were considered and investigated in greater detail. Of the two corridors, Main Street was selected for the study. Main Street is one of Brampton’s major urban arterials crossing the city south-north, with two lanes in each direction. Figure 21 shows the part of the corridor selected for the study, from the south edge at the downtown Brampton transit terminal to the north edge at Sandalwood Parkway. The selected section of Main Street is approximately 5.5 km long and includes 10 signalized intersections. The corridor traverses through a variety of land uses. Segments of the corridor travel through the downtown area, commercial developments, and residential developments. Several photos depicting the corridor environment are provided in Figures 15 through 20. Brampton bus line 2 operates on this corridor northbound and southbound with no signal priority operation. This route provides 10 minutes of service headway in both directions during the afternoon peak-time period between 3:00 pm and 7:00 pm. There are 34 bus stops along the selected section of the corridor: 17 stops northbound and 17 southbound. Generally, all bus stops are located near signalized intersections, with six near-side stops in the southbound direction and seven in the northbound direction.
38

Figure 15: Partially Developed
Figure 16: Downtown Core
Figure 17: Residential Area
Figure 18: Commercial Strip Mall
Figure 19: Big Box Commercial Development
Figure 20: Major Signalized Intersection
39

N
Figure 21: Selected Study Area for the Evaluation
One notable characteristic of the selected corridor is that the lengths of transit approaches to the signalized intersections are quite long. The link lengths range from 100 m to 500 m, with lengths greater than 250 m at many intersections. The dimensions noted in Figure 21 represent the distance from the preceding bus stop to the next signalized intersection. Considering the purpose of the priority re-evaluation process, the chosen study site is suitable to test the benefits of this newly adopted feature.
8.0 MICROSIMULATION ENVIRONMENT AND PROCESS To investigate the ability of TSP-Advance to effectively and efficiently provide signal priority, the performance of TSP-Advance was compared against that of two other scenarios: the existing signal operation without TSP, and a typical active priority control method provided conditionally
40

based on transit schedule adherence. The three scenarios were modeled within ParamicsTM, a traffic microsimulation software. An interface was developed through an application coded separately using the API (Application Programming Interface) of Paramics. It is important to note that the role of the Paramics simulator is to provide this study with a testing environment for the developed TSP-Advance system. In field deployment, only the overall system with its on-line simulator would be implemented and not the Paramics component.
8.1 Simulation Modeling Data Requirements In configuring and preparing the simulation model, a significant amount of data was required. The data requested is provided in Table 7. Table 7: Requested Data for Simulation Modeling Information
Category Sub-Category Specific Data
Roadway • Number of lanes • Link lengths • Lane widths • Road layouts (CAD map)
Network Geometric Information
Intersection • Number of lanes • Ramp lengths • Lane widths • Locations of stop line, transit stop, detectors, etc. • Intersection layouts (CAD map)
Traffic Demand • Origin / Destination demand matrix • Intersection turning ratios or turning counts • Vehicle ratios (heavy vehicles, trucks, etc)
Travel Demand
Information Transit Demand • Demand by stop, TOD, DOW, variations, distributions
• Average boarding and alighting time • Types of transit vehicles • Mechanical
Restrictions • Turning movements • One-way or two way road • HOV lanes (and compliance rates) • Sign types and locations • On-street parking
Signal Control System Type
• TOD, fully or semi-actuated, adaptive, phase-actuated, etc.
Traffic Signal Information
• Offset, phase split, sequence, and cycle length • Yellow and all-red phase lengths • Pedestrian signal length (solid and flashing) • Other parameters for actuated or adaptive types
Traffic Control
Information
Traffic Flow Information
• Speed limit • Average travel speed (free-flow speed) by time-of-day
Service Information
• Desired frequency and/or schedule • Actual service headways • Transit travel time during evaluation periods
Fleet Information
• Vehicle characteristics (max speed, acceleration & deceleration capabilities, vehicle length, vehicle capacity, door types, etc.)
• Allowable capacity in peak & non-peak time, • Fare collection method
Transit Operation
Information
Bus Stop Information
• Locations and types (bus bay or passenger island)
41

Information
Category Sub-Category Specific Data
Existing Transit Priority
Schemes
• Bus exclusive lane • Queue jump • TSP operation
8.2 Data Collection Process The collection of the requested data was coordinated through various parties. These parties include: • • • •
Brampton Transit City of Brampton Traffic Department City of Brampton IT Regional Municipality of Peel Traffic Department
The project team also conducted several field surveys at intersections and along the selected corridors to gather more up-to-date data to supplement and refine the data provided by the volunteering agencies. City of Brampton and Region of Peel staffs were also contacted in the process to confirm assumptions and modeling design details.
8.3 Simulation Modeling Program Selected
8.3.1 Description of Paramics A core component of this study was the development of a microscopic simulation model that seamlessly integrates both transit and traffic movements in a selected sub-network in downtown Brampton. The model was developed using Paramics, a suite of high-performance software tools for microscopic simulation of realistic traffic networks. In the Paramics model, individual vehicles are represented in fine detail for the duration of their entire trip, providing accurate traffic flow, transit time and congestion information, as well as enabling the modeling of the interface between driver/vehicle units and transit signal priority. The Paramics software enables capturing of the: • Dynamics of supply, in terms of the detailed configuration of the transportation network and
its performance in response to varying demands and control; • Dynamics of demand, in terms of dynamic user behaviour in response to the observed
supply, either directly or via traveler information systems; and • Complex dynamic interaction between supply and demand. Some of the key features of the modeling environment are: • High-performance microscopic simulation; • ITS-capable, featuring integrated simulation of ITS including a variety of traffic management,
transit management, information and control strategies; • Ability to incorporate driver and vehicle performance parameters; • Ability to model vehicle emissions, public transport, and car parking; • Batch mode operations for statistical studies; • Advanced visualization tools that add a complementary subjective evaluation capability of
traffic behaviour under different scenarios; and • Ability to model complicated traffic control/operation algorithms using API programming.
42

8.4 Simulation Process and Modeling Issues Encountered Simulation process and some issues encountered during the simulation model development are presented in the following subsections.
8.4.1 Skeleton Network Coding The first step in coding a Paramics microsimulation model is to build a skeleton network, which defines the position of the main nodes and links in the model. This can be achieved by direct conversion of coordinate data to the correct Paramics network text file format. Alternatively, an AutoCAD (DXF) file can be loaded and displayed within Paramics, to function as an overlay for manual network coding. This latter approach was chosen for this study. The Main Street map, from the City of Brampton, provided the basis for the skeleton network coding. This data was provided in AutoCad format. The DXF file was projected in the Universal Transverse Mercator (UTM) coordinate system (NAD 27), which uses 1 metre units. This DXF was loaded as an overlay in Paramics, with a scale of 1:1 and in the proper position, and used as a guideline for manually adding the main nodes and links of the microsimulation network. The result was a Paramics network in the proper scale and with the proper UTM coordinates. This simplifies the incorporation data from other sources, as features will match spatially as long as the same coordinate system is used.
8.4.2 Network Refinement The accuracy of the microsimulation model is generally improved by replicating the roadway geometrics as closely as possible. To provide more details, the intersection drawings for the signalized intersections along Main Street were used. The provided intersection drawings were TIFF image format and based on these images, the skeleton network within Paramics was refined by correcting the roadway widths, number of lanes, as well as exact intersection layouts including curb locations. Paramics also has an annotation object class, which was used to provide additional information such as network names and street names. This labeling was helpful in identifying specific intersections and other locations.
8.4.3 Bus Route Coding The study route, bus route #2 in Brampton, was modeled within Paramics using two separate transit routes: the southbound route from Sandalwood Parkway to Church Street, and the northbound route from Church Street to Sandalwood Parkway. The bus related-information, including service frequency, bus stop locations, and typical bus fleet specification, was provided by Brampton Transit. Brampton bus line #2 operates on this corridor northbound and southbound with no signal priority operation. This route provides 10 minutes of service headway in both directions during the afternoon peak-time period between 3:00 pm and 7:00 pm. There are 34 bus stops along the selected section of the corridor: 17 northbound and 17 southbound. Generally, all bus stops are located near signalized intersections, with six near-side stops in the southbound direction and seven near-side stops in the northbound direction. Brampton Transit also provided the average bus travel times between various origins and destinations within the study area. This data was useful while coding the bus route, in order to better understand how the route operates, but its primary application was in the calibration of the network, as described below.
8.4.4 Intersection Coding Additional information on traffic operations along Main Street was provided, including the on-street parking restrictions, one-way traffic streets, and prohibited traffic turns at intersections. Bus route #2 in Brampton traverses 10 signalized and 12 unsignalized intersections within the study area. The lane usage at intersections, turning restrictions, and traffic signals was coded at this stage.
43
8.4.4.1 Unsignalized Intersections At unsignalized intersections, every turning movement is assigned a priority of Major, Medium, Minor, or Barred (please note that this term is not related to transit priority). Major movements are free flow and do not need to yield to other streams of traffic. In the network, through and right-turn movements from a major road are given the designation Major. A Medium priority movement yields right-of-way to Major streams of traffic but has priority over Minor traffic movements. The left-turn movements from a major street onto a minor side street have Medium priority at unsignalized intersections in the network (i.e., they must yield to the opposing traffic, but have right-of-way over vehicles exiting from the minor side street). Minor priority gives way to both Major and Medium traffic flows while Barred indicates the turn is banned to all vehicle movements. Traffic flows exiting minor side streets, as well as right-turn flows on red, are assigned the minor priority.
8.4.4.2 Signalized Intersections The exact implementation of the traffic signal control system is crucial for the performance of arterial roads. As such, the signal system needs to be properly reproduced within a microsimulation model. Due to the significance of transit priority measures, the traffic signals are an especially important component within this study. Researching, documenting, and implementing the existing signal system within Paramics, and reproducing the necessary algorithms for actuated signals with API Programming that Paramics provides, was perhaps one of the most demanding tasks of this work. The City of Brampton operates two different traffic signal control modes: Fixed and Semi-Actuated types on the signalized intersections within the study area. For each of the signalized intersections in the network model, the City of Brampton provided detailed traffic signal timing report in MS-Excel format. The Timing Report provides such information as control mode, timing plans and schedules, intervals, aspects, cycle lengths, offsets, and minimum green times. The timing plan schedules of signalized intersections usually feature at least three different plans for morning peak, afternoon peak, and off peak time, with different cycle lengths, offset values, interval lengths, etc. Only the PM peak timing plan was implemented in all cases for this study. For many of the intersections that feature semi-actuated control mode, the test TSP algorithms (i.e., typical active type and TSP-Advance) were implemented to override the semi-actuated operation. For instance, the running semi-actuated control mode is canceled as soon as transit signal priority is requested and the traffic signal timing is modified according to the programmed TSP control mode.
8.4.5 Traffic Demand The study network modeled in this study includes the bus route #2 corridor along Main Street, as well as all adjacent cross roads. Some major parallel roads to this corridor were also included. The simulation represents the traffic and transit operations in the study network during the afternoon peak time on a typical weekday. As such, the input traffic demand should represent the same time period. In order to simulate vehicle traffic in the study network, Paramics requires as input the vehicle traffic demand (i.e. number of vehicle trips) between each pair of terminal nodes of the network. The City of Brampton provided the O-D matrix within the study area using their regional EMME/2 transportation model. The fundamental traffic demand was modeled using this O-D matrix. A traversal matrix for the areas along Main Street was created in EMME/2. This is an origin-destination trip matrix for all relevant zones in the study area. The matrix includes internal zones which represent the trip origins and destinations within the study area and also traversal zones which represent the traffic crossing the study area (i.e., the trip origins/destinations not inside of the study area).
44
In the next step, the O-D matrix was further refined using the traffic movement counts provided by the City of Brampton in order to better represent the realistic traffic conditions within the study area. Turning movement counts for the total 18 signalized intersections were provided for the study. By repeatedly running the modeled network, the O-D matrix in the simulation network model was manually modified to generate more close intersection count values with the actual traffic counts.
8.4.6 Model Calibration Similar to any modeling exercise, a process of calibrating the base case network was necessary. Within microsimulation, there are two types of calibration; the first is geometric network calibration. This consists of running the initial network, and looking for any unusual behaviour or results which may be due to inexact coding of the network. This can be done visually by observing the individual vehicles, signals, etc. via the Paramics graphical user interface. In addition, a variety of statistical outputs can be gathered to support this calibration effort. Problems that can often be observed include unrealistically long queues, complete network breakdown, or perhaps unreasonably short queues or high speeds. Initially, one must review all the previous coding steps, from basic network construction, to traffic signals and transit coding, and identify possible coding errors. A few additional features will be mentioned here, that were used in this study in an attempt to address problems at individual locations in the network. • Curbs and Stop lines: Each link has an inside and outside curb point, both at the start of the
link and at the end. By default, in Paramics, locus points are defined along a line joining each pair of curbs so that for each lane on a link a locus point is drawn at the centre of the lane. Vehicles have to pass through these locus points as they move through a junction. For example, if locus points for the in and out links of a 90 degree turn are very close to each other then vehicles making that turn are forced to traverse the curve very slowly. It is therefore important that curbs are positioned to reflect the actual road layout as accurately as possible. For geometric network calibration, individual locus points were adjusted by matching the points with information from the overlay files. In addition, unusually slow or jerky turning movements were rectified.
• Next lanes: When a vehicle reaches the end of a link, Paramics calculates the range of lanes suitable for the vehicle on the next link. However, it is possible for the user to override this default range and specify the exact lane on the next link for each lane on the current link. Collected lane usage and turning restriction information were used to rectify any lane choice problems that were observed initially.
• Gradient: A gradient can be specified for each link. The value can be either positive or negative, and will affect the acceleration and deceleration of vehicles, dependant on their weight.
• Visibility: This is the distance back along the link from a downstream intersection, at which the conflicting streams of traffic are initially seen by oncoming traffic. If no conflicting traffic is seen while the oncoming traffic is within the visibility distance, then that vehicle may travel through the downstream junction without slowing to give way to higher-priority movements.
• Headway factor: The target headway for all vehicles on a selected link can be modulated using the headway factor. Certain locations in a network may in reality prompt drivers to accept a headway that is longer or shorter than the average (bridges with reduced visibility, important merging areas, tunnels, etc.).
• End speed: To simulate traffic calming measures and stop signs, a terminal speed can be defined for a link.
A number of system-wide simulation parameters exist which were also used to calibrate the network. For this purpose, outputs generated by the simulation were compared with real-life data. The primary statistics used for the calibration were the turning movement counts as well as bus travel time. The following system-wide parameters were adjusted during the calibration procedure:
45

Time-step per second: The default time step in Paramics is 0.5 seconds (i.e., 2 time steps per second). Paramics is a discrete simulation, and as such is always an approximation compared with the reality of continuous motion. In order to achieve accurate results from the loop detectors, a time step of 0.1 seconds was chosen. Among other things, this signifies that the signal plans will be executed 10 times per second, and that the sample rate of loop detectors is also 10 times per second. In addition, this will cause vehicles to move much more smoothly through the network, but it also significantly increases the computational load and run time of each simulation. • Behaviour: Paramics uses a model where each driver-vehicle unit is assigned a number of
behaviour parameters. Awareness and aggression can be assigned to individual drivers when the vehicle is released into the network according to the researcher’s specified distributions, including square distribution and normal distribution. In this study, the behaviour of drivers was assigned to follow a square distribution.
• Mean headway: this is the headway for all vehicles on all links (not to be confused with transit vehicle headway), around which individual vehicles will be distributed. After a number of tests, the mean headway was set back to the default value of 1 second, as this has been calibrated in other studies by the software developers.
• Mean reaction time: this affects the average reaction time to changes in front of a driver, for example, a vehicle braking. After more testing, it was also set back to the recommended value of 1 second.
• Seed number: This can be used to set the seed value for the random number generator. If the seed number is not specified, the current system time will be used. This would guarantee a different outcome from each simulation run, even if all the other input parameters are not changed. Numerous runs with various seed values were completed in all cases, to ensure the validity of the results.
8.5 Evaluation Criteria The evaluation of TSP-Advance was conducted focusing on the four critical aspects in the system performance: 1) efficiency of the priority control in terms of the transit signal delay, 2) TSP control impacts on the traffic in the cross streets as well as the transit approaches, 3) effects of conditional priority control on the bus service regularity, and 4) effectiveness of the priority plan re-evaluation process in TSP control.
9.0 RESULTS AND ANALYSIS
9.1 Presentation of Results Tables For the first three performance evaluation criteria identified in section 8.5, Table 8 summarizes the overall performance of the tested TSP control methods. The Green/Cycle ratio term shows how much green time in the signal cycle was provided to the transit approaches. The results for each scenario were gathered from 20 simulation runs.
46

Table 8: Summary of Evaluation Results
Auto delay (sec/veh)
Bus signal delay
(sec/int.)
Bus travel speed (km/h) Main Side
Green/Cycle ratio
Headway Stdev. (sec)
No TSP 35.91 19.02 20.69 34.16 60.61% 61.37
Active 27.99 19.80 20.23 39.00 64.24% 52.99
vs. No-TSP (-22.05%) (+4.10%) (-2.22%) (+14.17%) (+6.00%) (-13.65%)
TSP-A 18.46 21.82 20.36 35.14 60.79% 47.46
vs. No-TSP (-48.61%) (+14.72%) (-1.57%) (+2.86%) (+0.29%) (-22.68%)
vs. Active (-34.07%) (+10.20%) (+0.64%) (-9.90%) (-5.37%) (-10.44%)
9.2 Analysis of Results As shown in the Table 8, the active priority control effectively improved bus operation. The active priority reduced the average bus signal delay by 22.05% compared to the no-TSP scenario. Average bus travel speed was also improved by 4.10% by operating the active signal priority. The operation of the implemented TSP strategies–transit phase extension and non-transit phase truncation–provided more green time to the transit approaches (i.e., the Main Street corridor) by 6.0%. This caused a 14.17% additional delay to side-street traffic, but reduced Main Street traffic delay by 2.22%. Bus headway regularity was also improved by 13.65% compared to the no-TSP scenario. The overall performance of TSP-Advance was compared to active priority control and the normal signal operation. The TSP-Advance system achieved considerable improvements in all performance criteria compared to the other two scenarios. Bus signal delay was reduced by 48.61% compared to normal signal operation without TSP, and this is a 34.07% further improvement over the performance of active priority control. Bus travel speed improved as well by 14.72 % and 10.20% over normal signal control and active priority control, respectively. One remarkable result obtained from the evaluation is that the substantial improvements in bus performance achieved by TSP-Advance caused only minor effects on side-street traffic delays. Average vehicle delay was only slightly increased (by 2.86%) for side-street traffic, and the green time ratio for the transit approaches was practically unchanged at +0.29%. Considering that bus signal delay was decreased by almost 50%, these results show efficient TSP control by TSP-Advance. For bus service regularity, TSP-Advance reduced the headway standard deviation by 22.68% over the normal traffic signal. Compared to active priority control, this result represents an additional 10.44% reduction in the headway standard deviation. Figure 22 illustrates the changes in bus signal delays at each signalized intersection that were achieved by TSP-Advance and the active priority control relative to the normal signal operation without TSP. As shown in Figure 22, the TSP-Advance system consistently reduced bus signal delays at all test intersections. On the basis of these individual results, TSP-Advance provided bus signal delay reductions ranging from 31.17% in the Church southbound approach to 63.12% in the Brickyard northbound approach. The performance of the active priority control was quite dependent on the transit approaches. The reductions in bus signal delay ranged from 1.15% in the English southbound link to 44.22% in the Brickyard southbound approach. This unsteady performance of the active priority control was mainly caused by two environmental factors: the
47

bus stop locations and the lengths of the established detection zones for TSP operation (i.e., the distances between the upstream transit sensors and the stopline sensors).
% o
f bus
sig
nal d
elay
impr
ovem
ents
ov
er th
e no
rmal
sig
nal o
pera
tion
% o
f bus
sig
nal d
elay
impr
ovem
ents
ov
er th
e no
rmal
sig
nal o
pera
tion
Figure 22: Evaluation Results for Bus Signal Delay by Intersection Figure 23 (a) compares the impacts of the bus stop locations on the performance of the active priority control and the TSP-Advance control. For the transit approaches with near-side bus stops, the control efficiency of TSP-Advance was slightly degraded from 49.94% to 47.89%. This minor reduction in the TSP-Advance performance is in fact negligible because the simple dwell time estimation method used in this study naturally causes some level of errors in the transit travel time prediction results. Compared to the TSP-Advance system, the operation of active priority control was severely impacted by the near-side bus stops. The active priority control reduced bus signal delay over the normal signal operation by 35.21% for the link approaches with far-side bus stops. However, for the approaches with near-side stops, the achieved bus signal delay was only 13.52%, which is 61.60% of deterioration from the results of the far-side stop approaches. The obtained bus signal delays were reclassified into two categories by the lengths of transit approaches in Figure 23#(b); the approaches longer than 250 m and the approaches shorter than or equal to 250 m. This analysis was to investigate the relative impacts of the established detection zone lengths on the bus performance. The longer detection zone lengths as well as
48

probably more variable transit travel times negatively affected the performance of the active priority control. The achieved benefits in bus signal delay were reduced from 24.33% in the shorter approaches to 15.12% in the longer approaches, which is 37.85% of deterioration.
30%
0%
10%
20%
40%
Far-side stops Near-side stops
35.21
49.94
13.52
47.89%
of b
us s
igna
l del
ay im
prov
emen
ts
over
nor
mal
sig
nal o
pera
tion
Active priority
TSP-Advance
30%
0%
10%
20%
40%
> 250 m≤ 250 m
24.33
46.15
15.12
53.17
% o
f bus
sig
nal d
elay
impr
ovem
ents
ov
er n
orm
al s
igna
l ope
ratio
n
(a)
(b)
Figure 23: Evaluation Results for Signal Delay by Stop Locations and Link Lengths
The motivation of developing the plan re-evaluation process in the system is to ensure more time to modify traffic signal timing by earlier detection of approaching transit vehicles. The expected benefits of this process include more benefits to buses in terms of signal delay and also less negative impacts on the existing traffic signal system. The test results in Figure 23 (b) support the effectiveness of the re-evaluation process in bus performance. In spite of the longer detection zone lengths, TSP-Advance provided even more benefits in bus signal delay in the longer transit approaches. The 46.15% delay reduction in the shorter approaches was further improved to 53.12% in the longer bus approaches.
49

0%
10%
20%
Active priority TSP-Advance
13.43
17.01
3.38
0.92
(b)
> 250m ≤ 250m > 250m ≤ 250m
Normalsignal
Activepriority
TSP-Advance
Normalsignal
Activepriority
TSP-Advance
> 250 m ≤ 250 m
(a)
0%
10%
20%
> 250 m ≤ 250 m
8.15
17.53
(c)
50%
60%
70%
61.34
65.78
62.69
57.21
62.04
57.56
Figure 24: Evaluation Results
Figure 24 (a) and (b) illustrate the changes in green time ratio ( ) and side-street traffic delay that were achieved by the active priority control as well as TSP-Advance. The active priority control assigned more green time to the transit approaches longer than 250 m and consequently resulted in more delays to the side-street traffic. These results imply that more priority signal times were required for approaching buses in the longer transit approaches. On the other hand,
Cg /
50
TSP-Advance modified the traffic signals to give less green time for the buses in the longer transit approaches. As a result, less delay time was experienced by the side-street traffic. Compared to the normal signal operation, the side-street traffic was 3.38% more delayed with the TSP-Advance operation where the bus approaches are shorter than 250 m. For the other intersections with longer bus approaches, the side-street traffic delay was further improved at only 0.92% more delays compared to the normal signal operation. These findings indicate that the performance of TSP-Advance is more efficient with the plan re-evaluation process. Figure 24 (c) provides the percentages of TSP plan modification at the mid-block detection points. In the shorter transit approaches, TSP-Advance replaced or canceled 8.15% of the initial TSP plans at the mid-block detection points. Also, in the longer transit approach, 17.53% of the initial plans were modified at the mid-block transit detection points. This is more than double plan modification frequencies in the longer transit approaches, which also indicates the effectiveness of the TSP plan re-evaluation process.
10.0 MARKETPLACE CONSIDERATIONS Effective management of urban traffic networks requires efficient priority strategies that can respond to link-wide traffic conditions. While various methods have been developed for intersection control, most existing strategies for Transit Signal Priority only consider the individual intersection and then implement a priority for the transit vehicle. Little if any consideration is provided to other users of the road network. In Canada, the trend has been to use priority systems put in place by our neighbours to the south and again most of this intersection based; largely in an effort to sell intersection controllers. Little has been done to address a more intelligent approach to priority. Implementation of any control strategy requires a large effort both on the side of manufacturing and the end-user. The reality of today, with escalating fuel prices, dwindling resources and environmental concerns, an implementation of any system to advance the technology and manage these valuable assets will involve a level of commitment from numerous stakeholders. Systems exist today that have grown with technology and are highly adaptable to implementation of enhanced priority strategies. To deploy such a system as identified and outlined in this project is a four-stage process for the manufacturing industry. Stage 1: “What do you want it to do?” In large part this has been addressed in this report. Use of advanced algorithms to make predictions on arrival times is definitely a first step not previously taken in the industry. The advanced algorithm also needs to coexist with other users of the road and take into account those measures to make smart decisions for both transit and the driving public. Stage 2: “How does it do what you want it to do?” Part of this is addressed in this report. Using modeling techniques and empirical analysis, the algorithm can be tweaked to not only provide significant benefits but also lower the risk of failed TSP sequences. This is all done in a proven laboratory environment. Stage 3: Integration Once the core is designed, the software must be integrated into a fully functioning system. This core is much like the engine of any car; a chassis and body with an interface are needed to feed the engine. This then drives the output and provides feedback to the operator. The pieces have to fit; the effect of any software is going to affect other components. While the core may work well, if it breaks or prevents other elements from operating correctly, then it is of little use. In the manufacturing industry this is referred to regression testing, an often neglected area. Stage 4: Deployment This industry is small but affects the daily lives of many people. Nobody likes being the guinea pig and manufacturers do not like to spend development dollars unless there is an identified market
51
(customer) willing to finance that development. Unfortunately, because of the size of the market, it is difficult to amortize the development cost over a large customer base. Potential customers often remark, “I see software being sold for $400.00. Why is it that your software costs thousands of dollars? Is the complexity not similar?” If the transportation industry manufacturer had thousands of customers, as the big name software manufacturers do, they would sell it for $400.00. The Non-Recurring Engineering Cost could then be amortized over the life of the product. This is not the case in the transportation industry and often subsidies or partnerships are established to mitigate these expenses. It is doubtful that we will ever get everybody out of their cars and into mass transit vehicles–they must coexist. Both must use the existing infrastructure, and we need to improve the systems that can maximize our roadways. As the importance of transit becomes apparent and the benefits are realized from an enhanced TSP, the economic impact of deployment of efforts like this will result in paybacks not only to the consumer but also to our fragile environment.
11.0 RECOMMENDATIONS Moving the developed TSP algorithm and operational concept forward is a significant task involving financial and stakeholder commitments. TSP-Advance introduces new methods of assessing and providing TSP at signalized intersections. It challenges, in a reasonable manner, how current traffic and transit system are managed and operated. As a first step beyond this project, a detailed sensitivity analysis of TSP-Advance should be completed to evaluate the algorithm’s effectiveness under different scenarios. This is a reasonable step prior to prototyping and on-street testing. At the conclusion of this stage, the results should be discussed among the industry (i.e. traffic, transit, and system/controller representatives) to determine whether the results are sufficiently appealing to see the product move toward implementation on the street. If the sensitivity analysis results are favourable and the industry has an interest, further development is recommended in the design and integration of TSP-Advance into existing traffic control and transit management frameworks. Refinement of the algorithm and further evaluation through a pilot deployment is also recommended.
12.0 CONCLUSIONS The results of this research and development process for an advanced transit signal priority algorithm show significant improvements and market potential in comparison to typical transit signal priority systems currently being operated and/or installed. The process undertaken was not completed by the project team in isolation. In developing the overall direction for this project, comments and feedback were gathered from municipal traffic and transit system representatives to help guide the overall development and testing process. As such, the algorithm developed addresses real concerns and design issues associated with the deployment and operation of TSP. TSP-Advanced currently exists as a conceptual operation that has been developed and evaluated through a microsimulation environment. Further development is required before the algorithm can be deployed as a pilot along a transit corridor. Additional hardware and software planning and development are required to integrate the algorithm into existing traffic and transit system operations and supporting hardware.
52

APPENDIX A
TECHNICAL PAPER – LITERATURE OVERVIEW BRIEF 2430/700 May 2004

Technical Paper – Literature Overview Brief
Table of Contents 1.0 Introduction .................................................................................................... A-1 2.0 Overview of TSP............................................................................................. A-2
2.1 Highway Traffic Act of Ontario Review........................................................................... A-2 3.0 System Design Concepts ................................................................................ A-5
3.1 Priority Control Strategies ................................................................................................. A-5 3.1.1 Unconditional Priority Control ........................................................................................A-5 3.1.2 Conditional Priority Control ............................................................................................A-5 3.1.3 Adaptive Priority Control.................................................................................................A-5 3.1.4 Future Directions with Priority Control Strategies ..........................................................A-6
3.2 Local Versus Central Controlled TSP System Configurations ......................................... A-6 4.0 Detection Design Concepts ............................................................................ A-8
4.1 Priority Operation Zone..................................................................................................... A-8 4.2 Selective Detection Technologies ..................................................................................... A-8
5.0 Traffic Signal Control Strategies for TSP ................................................. A-10 5.1 Transit Phase Green Extension*...................................................................................... A-10 5.2 Transit Phase Red Truncation*........................................................................................ A-11 5.3 Transit Phase Green Truncation* .................................................................................... A-11 5.4 Window Stretching*........................................................................................................ A-12 5.5 Phase Suppression Strategies*......................................................................................... A-12 5.6 Queue Jumping Priority Sequence* ................................................................................ A-13 5.7 Red Interruption............................................................................................................... A-13 5.8 Stream Weighting (Passive Method)............................................................................... A-14 5.9 Lift Strategy*................................................................................................................... A-15 5.10 First In Sequence, First Served*...................................................................................... A-15 5.11 HOV Weighting............................................................................................................... A-16 5.12 Combination of TSP Strategies ....................................................................................... A-16 5.13 Route Predictive .............................................................................................................. A-16 5.14 Traffic Signal Timing Plan Recovery.............................................................................. A-16
6.0 TSP Limitations and Areas of Research.................................................... A-18 6.1 Limitations of Existing TSP Practices............................................................................. A-18 6.2 General Areas of Focus for the Development of a TSP Algorithm................................. A-18 6.3 Specific State-of-the-Art TSP Operational Concepts and Practices for Consideration... A-19
7.0 Conclusion..................................................................................................... A-20 8.0 References ..................................................................................................... A-21

Technical Paper – Literature Overview Brief
1.0 Introduction The information provided is this paper is based on a cursory literature review of state-of-the-art Transit Signal Priority (TSP) research and deployment initiatives. The scope of the project calls for an overview appreciation of the current state-of-practice with respects to TSP and forward looking directions for further assessment. Documents selected in this review were typically no more than five years old and focused on developments and research interests in TSP. Specific details presented in this paper are provided in the context of the North American market; however, developments in TSP outside of North America are referenced and compared with national developments. In gathering relevant documents, several sources were queried, of which included:
• TRB Publications • TRB, TSP Workshop Publications • ITS America Publications • CUTA Publications • TRIS Online Database
The basis of this paper is to provide guiding principles and directions for the research and development of a Transit Signal Priority algorithm as part of the Transport Canada Research and Development project.
A-1

Technical Paper – Literature Overview Brief
2.0 Overview of TSP Transit signal priority (TSP) systems were being installed in some North American cities during the 1970’s and 1980’s. However, most of these installations were abandoned because technology at the time could not reliably deliver on what was expected despite the continued need for better transit operating efficiency at traffic control signals. Computers and other technologies available today can enable traffic signal control operations to adjust in direct response to varying traffic conditions. Based on this more advanced capability, there are increasing numbers of transit agencies and transportation departments throughout North America learning more about transit signal priority operations, the possible control strategies, and the potential service benefits that can be gained through this transit responsive form of traffic signal control deployment. As a result, there are approximately 25 to 30 transit agencies in North America currently operating TSP, and many more in the planning or deployment stage. Some examples of such TSP sites in Canada include Toronto, Vancouver, Edmonton, Calgary, Peterborough, and Ottawa. Similar examples in the US include Los Angeles County, Minneapolis, Houston METRO, Napa INFO, Chicago Smart System, among others. Technology and control strategies have significantly progressed with respect to TSP within the scope of transit operations. The primary purpose of TSP is to reduce delay time to transit vehicles at signalized intersections. The fundamental TSP system comprises of a transit vehicle sensor located upstream of an intersection approach that sends a request call for priority clearance through a signalized intersection upon detection of a transit vehicle, either by wireless communication (including optical-based methods) or through some other form of communication, to another receiver unit at the intersection. This receiving unit works in conjunction with the traffic controller and the traffic computer system to allocate more green time to allow the transit vehicle to proceed through the intersection, or to truncate a conflicting signal phase in order to service the bus sooner. Once the presence of the bus within the zone of detection disappears, via the transit vehicle passing over another sensor, then the demand for priority drops, and signal operations are brought back inline with typical operations for that time of the day; this also includes realigning the offset time within a coordinated traffic signal corridor. The TSP operation is simply described in the above text and would be representative of typical systems deployed in the past. However, there is now a wide range of transit vehicle detection methodologies and transit signal priority control strategies to be considered for the effective design of a working TSP system. The advancements in technology are also becoming a driving force in how TSP systems are configured and operated. TSP system deployments are also promoting an increased level of cooperation between Transit and Traffic agencies. 2.1 Highway Traffic Act of Ontario Review A review of the current Ontario Highway Traffic Act was conducted to screen for the inclusion of sections relating to the prohibited use of traffic signal pre-emption devices. Several transit and traffic agencies have raised concerns about how recent amendments to the Ontario Highway Traffic Act affects their existing, or planned, transit signal priority system deployments. The following discussion is in reference to the Ontario Highway Traffic Act only and does not investigate the use of similar clauses in other highway traffic acts governing other provinces and territories within Canada. Before implementing a TSP project within other jurisdictions, the governing
A-2
Technical Paper – Literature Overview Brief
Highway Traffic Act of that jurisdiction should be investigated prior to proceeding in design and deployment. Under the current Highway Traffic Act in Ontario (as of April 12, 2004), the use of traffic pre-emption devices is prohibited, except when used by emergency vehicles. This provision is found under section 79.1 of the Act, which reads as follows:
Pre-empting traffic control signal devices prohibited 79.1 (1) No person shall drive on a highway a motor vehicle that is equipped with, carries, contains or has attached to it a pre-empting traffic control signal device. 2002, c. 18, Sched. P, s. 22. Exception (2) Subsection (1) does not apply to a person driving an emergency vehicle, as defined in subsection 144 (1). 2002, c. 18, Sched. P, s. 22. Powers of police officer (3) A police officer may at any time, without a warrant, stop, enter and search a motor vehicle that he or she has reasonable grounds to believe is equipped with, carries, contains or has attached to it a pre-empting traffic control signal device contrary to subsection (1) and may detach, if required, seize and take away any such device found in or upon the motor vehicle. 2002, c. 18, Sched. P, s. 22. Forfeiture of device (4) Where a person is convicted of an offence under this section, any device seized under subsection (3) is forfeited to the Crown. 2002, c. 18, Sched. P, s. 22. Penalty (5) Every person who contravenes subsection (1) is guilty of an offence and on conviction is liable to a fine of not less than $100 and not more than $1,000. 2002, c. 18, Sched. P, s. 22. Definition (6) In this section, “pre-empting traffic control signal device” means any device or equipment that may temporarily suppress or extend an indication on a traffic control signal from its current setting. 2002, c. 18, Sched. P, s. 22. Same (7) In subsection (6),
A-3

Technical Paper – Literature Overview Brief
“indication” and “traffic control signal” have the same meanings as in section 133. 2002, c. 18, Sched. P, s. 22.
From the provisions provided in section 79.1 of the Ontario Highway Traffic Act, it is clear that the use of pre-emption devices on transit vehicles is prohibited. When section 79.1 took effect in 2002, the Toronto Transit Commission (TTC) was placed into a difficult position since they had already been operating an effective TSP system for many years, and would like to continue operating the system. In order to better understand the intent and the latest developments regarding the HTA section, the TTC was contacted; details gathered through this discussion are presented in the subsequent paragraph. When the MTO drafted section 79.1 in the HTA, their intent was to prohibit the use of pre-emption devices by tow-truck drivers. At the time, the MTO was unaware of transit signal priority operations, and particularly that of the TTC, who was the only transit agency operating an established TSP program. The original intent of the MTO was most likely targeting the prohibited use of optical pre-emption devices used by non-emergency vehicles of which were not being used by transit agencies at that time1. To resolve this issue, discussions between the MTO and the TTC had been initiated. The last of these discussions concluded in the fall of 2003. What was agreed to at these meetings between the TTC and the MTO, was that the HTA would be amended to allow for the use of “pre-emption” devices by transit agencies for transit signal priority purposes. This amendment to the Act has not yet been passed. It should be noted that the terms “pre-emption” and “priority” has both been used in the above discussion. There has been some debate regarding the interchangeable use of these two terms, but there is a growing acceptance of uniquely distinguishing a difference between the two terms. Part of the confusion is that pre-emption systems and priority systems may both use the same hardware and affect traffic signal operations in a similar manner. However, priority sequences only modify signal timing plans while pre-emption sequences “more abruptly interrupt” signal timing plans. The use of priority signal timing sequences is arguable analogous to the operation of a traffic responsive algorithm in that signal timing plans may be adjusted to better meeting local traffic demands.
1 TTC’s selective detection system for Transit Signal Priority uses transponders and antennas embedded in the pavement. The HTA is generally worded and does not specifically prohibit the use of a particular selective detection technology such as optically based units.
A-4
Technical Paper – Literature Overview Brief
3.0 System Design Concepts TSP systems of the past were relatively simple, but advancements in technology over the last few decades provided new and more intelligent ways of administering TSP. There is now much more flexibility available in developing a concept of operation for a TSP system. This section of the report discusses the availability of various types of priority control and general control system configurations. 3.1 Priority Control Strategies When designing a TSP system, the designer needs to determine what level of priority control the system will be basing its decision-making algorithms on. There are three modes of control available; the two most common modes are unconditional and conditional priority. In recent years, the development of adaptive priority control has become a growing interest in TSP system designs. In general, adaptive priority control may be regarded as a more intelligent form of conditional priority control. 3.1.1 Unconditional Priority Control In the simplest case, priority may be provided to every transit vehicle every time a priority request call is made. This mode is referred to as unconditional priority control. The issue with this mode of control is that transit vehicles are always provided with priority passage through the intersection, whether or not it is needed. Under this scenario, transit vehicles may run ahead of schedule and cause undue delay to cross street traffic in the process. This form of control could also be implemented relatively easily in the field without any other supporting systems such as centre-to-centre communications links and software interfaces. 3.1.2 Conditional Priority Control By adopting more intelligent technology, the provision of conditional priority may be provided at signalized intersections. Fundamentally, this control methodology would evaluate, in some manner, the benefit of providing signal priority clearance through the intersection before it is provided. Therefore, if a call is not warranted based on predetermined conditions, the priority signal timing sequence will not be requested or initiated. Under this type of priority control, the decision logic could be located on the transit vehicle, at the intersection controller, or at a central system. In one scenario, where the decision logic is located on the transit vehicle, automated vehicle location and passenger counter systems could be used to determine if the vehicle is behind or ahead of schedule, or if there are a sufficient number of passengers on board for TSP to be beneficial. In another scenario, where the decision logic is located at the signal controller or at the central control system, the system, when it receives a TSP call, could determine if there would be an overall benefit to serving the transit vehicle based on the degree of saturation at the intersection. Both scenarios are an example of conditional priority control at work. 3.1.3 Adaptive Priority Control The final priority control strategy, adaptive priority, is an area of interest that has been emphasized more recently in North America. Adaptive priority control relies on the gathering of real-time transit and traffic network information. The information gathered is assessed in order to optimize specific parameters to provide for the most robust TSP sequence possible given the conditions of traffic. In one design scenario TSP calls could be registered several signal-timing cycles in advance of when the transit vehicle would actually be at the intersection. Therefore, the system, through its adaptive logic, could better determine the need for priority clearance and adjust signal timing plans at that intersection to serve
A-5
Technical Paper – Literature Overview Brief
the transit vehicle more effectively without delay, while minimizing or eliminating the delay caused other traffic at the intersection. 3.1.4 Future Directions with Priority Control Strategies Of the three types of control strategies presented, unconditional priority is the most widely used in TSP applications. It is very popular at this time, as it has been in the last two decades, because of its relatively simple operation and implementation. For instance many NEMA TS-2 traffic signal controllers, when mated with an appropriate selective detection technology (at the intersection and on the transit vehicle), would be ready to provide TSP operation, short of programming control parameters related to a particular signal timing control strategy into the signal controller. In the past, the use of more advanced conditional and adaptive TSP control operations were limited due to the high cost of supporting technologies and the limited effectiveness of such technologies. Over the last decade, with the latest advancements in technologies, there has been a growing interest from academia and the general marketplace to develop more advanced TSP operations through the use of conditional and adaptive priority control methods. For conditional and adaptive priority control strategies to work effectively, additional information regarding transit and traffic movements must be gathered and assessed before implementing a particular plan. The type of information which may be gathered for further analysis by a particular TSP algorithm include:
• Transit vehicle scheduled time at specified check points • Transit vehicle location along the corridor • Transit vehicle speed • Number of passengers on the transit vehicle • Historical/real-time data about the number of passengers loading and alighting at a particular
stop • Relative priority among two or more transit vehicles approaching an intersection • Vehicle volumes at intersections • Vehicle queue lengths at intersection • General traffic flow speed • Presence of blocked lanes (i.e. related to construction or other impediments to vehicle flow)
along the transit corridor • Traffic signal’s location in the signal cycle plan
Currently, the marketplace is seeing more proposals and applications of TSP utilizing AVL to facilitate conditional priority control strategies. There are already several systems in place in North America and in Europe that operate TSP though a conditional priority control strategy. However, the disruption to other traffic at an intersection is still a concern to traffic department managers. More research and development is required in the design of adaptive priority control systems to help minimize the disruptions to other traffic. In this regard, traffic signal control systems like SCOOT, SCATS, and RHODES have also incorporate some forms of adaptive control for TSP operations. 3.2 Local Versus Central Controlled TSP System Configurations To date, most developments in TSP have focused on locally controlled operations. In the past, locally controlled TSP systems were effective because agencies did not have to invest in an expensive centralized traffic control system, or closed-loop distributed control systems, with real-time (once per second) monitoring and control of all intersections intended for TSP operation. In some cases, the installation of a new traffic signal controller was not necessary either, which further reduced deployment costs. In effect, TSP could also be provided at intersections operating in isolation.
A-6

Technical Paper – Literature Overview Brief
However, under locally controlled TSP operations, the provisions of TSP control algorithms are limited to the general market needs, and in what each particular controller manufacture could provide. The way in which TSP is provided and how the controller regained signal coordination were also different among various controller manufacturers. Therefore, if there was a specific need for more advanced TSP control strategies by a particular agency, then controller manufacturer would have to evaluate whether or not there is a general market interest in the development, or if the client would be willing to fund the development completely on its own. With the latest developments in technology and through the provision of low cost, reliable, and fast communications, the installation of centralized control and monitoring systems is becoming more common. The installation of central systems generally provide for a more powerful, robust and cost-effective means for managing large systems. Central systems are being installed for both traffic signal control and transit management. The central control of traffic signals is not a new concept to the traffic industry. Digital (i.e. processors based) centralized traffic control system has been in operation for over 50 years. One of the first systems was introduced in Toronto, Canada in 1960. The use of central traffic signal control and monitoring has grown dramatically since, and traffic agencies and traffic control system suppliers have invested much research and development into this area. The general trend in the research and development of central systems has been in the areas of real-time control and traffic adaptive control of networked intersections. From a TSP perspective, there has been some development within traffic adaptive control systems to better manage transit vehicle progressions through a series of intersections and to provide better management of traffic delays at the intersection. In other developments, the interface between transit and traffic management systems has improved and now allow for the sharing of data to provide for conditional and adaptive priority control of TSP control strategies.
A-7
Technical Paper – Literature Overview Brief
4.0 Detection Design Concepts Although the selection of a transit vehicle selective detection technology is not a primary concern of this overall study, there is still an important need to acknowledge and consider how transit vehicles are detected and to what accuracy those vehicles are detected when formulating TSP algorithms. For instance, the more accurately a transit vehicle’s location is defined along a corridor, the more accurately a TSP algorithm can assess a situation and provide TSP clearance successfully. 4.1 Priority Operation Zone The operation of a TSP system typically requires the definition of a priority operation zone (POZ). The POZ is usually defined as a zone preceding the intersection where the TSP system knows whether or not a transit vehicle is present and approaching the signalized intersection. When a transit vehicle is in the zone, the TSP system may initiate the designated algorithm to decide how TSP will be provided, and for what duration. Therefore, there is a need to have some sort of detection at the start and end of the zone, or throughout the zone. 4.2 Selective Detection Technologies Past selective detection systems have typically operated on the premise that a zone was defined by a point of detection at the start, and a point of clearance at the end of the POZ. To this effect, past systems typically used inductive loops with vehicle type identification algorithms, or transponders on transit vehicles with a loop antennae embedded in the pavement. These selective detection technologies were used because detection points were accurate, effective, and consistent; transit vehicles would be detected at the same point, within the same tolerance, and at every occurrence (so long as the transit vehicle passes over the detection loop and the loop is operational). Compared to other forms of detection technology, such as optical or acoustic based technologies, loops and transponders were not affected by weather conditions or other limiting factors that affected the system’s performance. Advancements in the development of competing and complementing detection technologies over the past decade have provided more options to the TSP system designer. For instance, developments with optical emitters and detectors have advanced significantly compared to when they were first introduced to the marketplace. Optical systems today provide various levels of priority, vehicle ID tagging, definable detection distances, etc. These improved features could be used to provide better TSP operations. Perhaps a more significant technological advancement is in the area of Global Position Systems (GPS). The accuracy of these systems has increased tremendously over the last decade along with a significant decrease in hardware costs. The basic GPS of the past2, that was readily accessible by civilians, where only accurate to within 100 meters. With the elimination of degraded GPS signals, the accuracy of devices was increased to 20m. Further developments in differential GPS3 technology can allow positions to be located within a tolerance of 1m through relatively inexpensive GPS receiver technologies. GPS technology may be used by TSP systems to accurately provide the position of transit vehicles within a system. Depending on how the TSP system is configured and operated, GPS data may be used to activate another detection technology at the appropriate time or supplement algorithms that determine the need for priority sequences at intersections. 2 Where the US Department of Defence were still degrading their GPS signals 3 Differential GPS utilizes base stations on the earth which broadcasts a know position and time that may be received by GPS receivers.
A-8

Technical Paper – Literature Overview Brief
The use of GPS/AVL technology is influencing the design of TSP systems in North America. More research and development in how GPS data may be effectively used in TSP algorithms is a growing interest.
A-9

Technical Paper – Literature Overview Brief
5.0 Traffic Signal Control Strategies for TSP There are several traffic signal control strategies that have been developed and proposed for use in TSP systems. Most of these strategies are in operation to some degree, but the effectiveness of each may not have been adequately documented and/or simulated. The most common strategies in place are green extensions, red truncations (of the transit phase), phase suppression and lifts. The implementation of other strategies should be researched and developed further in TSP systems to provide for a wider variety of traffic signal control strategies that may be particularly useful in a unique situation. The current limitation is that traffic signal controllers alone do not yet have the capabilities to implement all of the noted strategies listed below. The use of centralized transit or traffic signal control systems and the interconnection between the two systems may provide for increased functionality with respects to the types of employable signal control strategies. Some of the listed strategies also require the inclusion of technologies, such as automated passenger counters with real-time communication or processing, in order to be effective. The following sections identify and describe various TSP strategies. Signal timing diagrams for most strategies has been provided for illustrative purposes. TSP strategies described in the following sections that have been deployed are identified with asterisks. 5.1 Transit Phase Green Extension* This strategy will extend the transit vehicle phase within the same cycle with/without implicating the cycle length (i.e. cycle length constrained or unconstrained). On identifying a transit vehicle in the priority operation zone (POZ), the TSP system typically initiate steps to extend the main street green by specified increment amounts (e.g. 2 seconds) subject to a maximum extendable value to be specified. The extended value must not implicate the minimum times required for the subsequent phases. If possible, the system should have the option of altering both the increment amount and the maximum value of the green extension on a TOD/DOW schedule to allow for more flexibility and optimization of TSP service in relation to expected traffic conditions.
Green Extension (Cycle Length Constrained)
Left
RedAGreenLeft
AGreenRed
Transit Street Phases
Cross Street Phases
0 505 55 6053 75 78 80
Left
RedAGreenLeft
AGreenRed
Transit Street Phases
Cross Street Phases
0 505 55 6053 75 78 80T1
Green Extension (Cycle Length Unconstrained)
Left
RedAGreenLeft
AGreenRed
Transit Street Phases
Cross Street Phases
0 505 55 60 85 88 9053
Left
RedAGreenLeft
AGreenRed
Transit Street Phases
Cross Street Phases
0 505 55 60 85 88 9053T1
Normal Cycle
Left
RedAGreenLeft
AGreenRed
Transit Street Phases
Cross Street Phases
0 405 45 5043 75 78 80
Left
RedAGreenLeft
AGreenRed
Transit Street Phases
Cross Street Phases
0 405 45 5043 75 78 80
A-10

Technical Paper – Literature Overview Brief
Note: further illustrations provided in this report will utilize a constrained cycle length regardless if a constrained or unconstrained cycle length service may be provided. 5.2 Transit Phase Red Truncation* This strategy will provide truncation of the transit vehicle red phase to provide for a quicker return to the transit vehicle green phase with/without implicating cycle length. On identifying a transit vehicle in the POZ, the system must initiate steps to terminate the cross street green (in other words, truncate the transit street red phase) prematurely to provide green in the transit direction. When truncating the red phase, all minimum times should be maintained to provide for safe operation on the side street.
Red Truncation
Left
RedAGreen Left
AGreenRed
Transit Street Phases
Cross Street Phases
0 40 45 50 60 643 3 65Green
Red
80T1
70
Left
RedAGreen Left
AGreenRed
Transit Street Phases
Cross Street Phases
0 40 45 50 60 643 3 65Green
Red
80T1
70
Normal Cycle
Left
RedAGreenLeft
AGreenRed
Transit Street Phases
Cross Street Phases
0 405 45 5043 75 78 80
Left
RedAGreenLeft
AGreenRed
Transit Street Phases
Cross Street Phases
0 405 45 5043 75 78 80
5.3 Transit Phase Green Truncation* This strategy will provide truncation of the transit vehicle green phase to provide for a quicker return to the transit phase in the next cycle with/without implicating cycle length if the detected vehicle will not be able to travel through the intersection by the end of the regular or extended cycle (i.e. green extension). Upon identifying a transit vehicle in the POZ, the system would initiate steps to terminate the current transit green phase in anticipation that the transit phase in the subsequent cycle would better serve the vehicle (i.e. provide a more timely opportunity to use the green upon display). When implementing this strategy the minimum times utilized at the intersection must be maintained to ensure the safe operation of the intersection.
Green Truncation
Left
RedAGreen Left
AGreenRed
Transit Street Phases
Cross Street Phases
0 25 30 35 60 63 6528Green
Red
80T1
70
Green Truncation
Left
RedAGreen Left
AGreenRed
Transit Street Phases
Cross Street Phases
0 25 30 35 60 63 6528Green
Red
80
Left
RedAGreen Left
AGreenRed
Transit Street Phases
Cross Street Phases
0 25 30 35 60 63 6528Green
Red
80T1
70
A-11
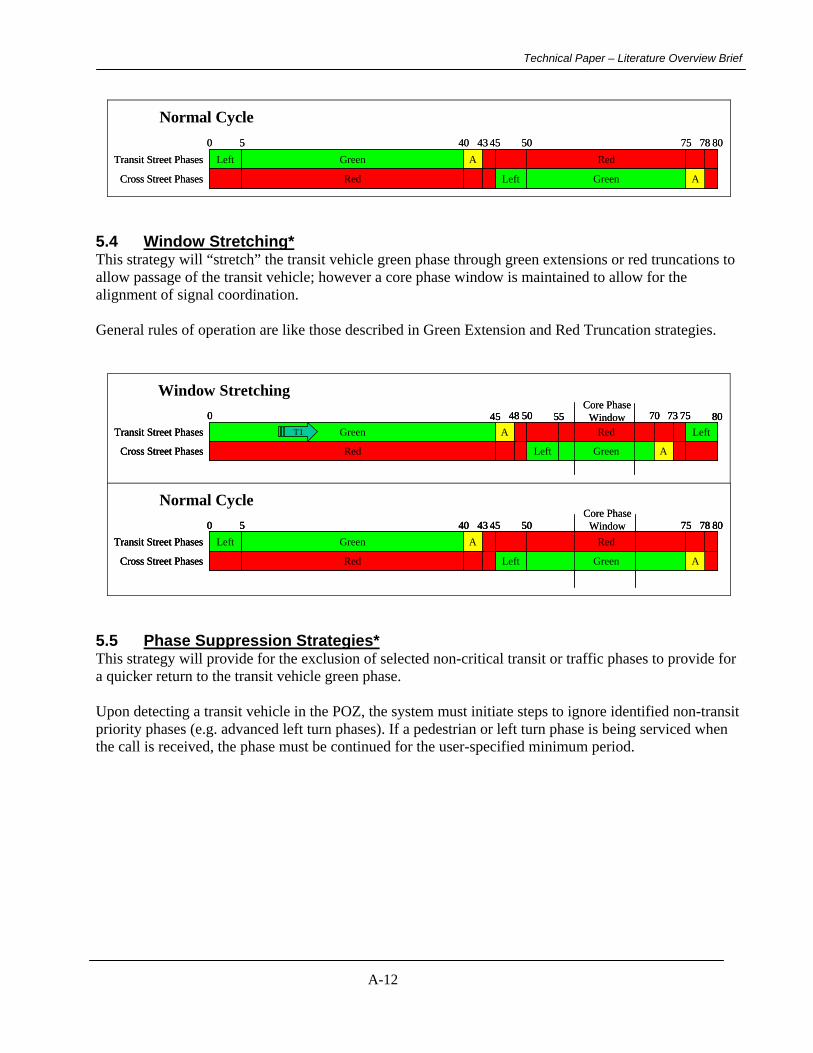
Technical Paper – Literature Overview Brief
Normal Cycle
Left
RedAGreenLeft
AGreenRed
Transit Street Phases
Cross Street Phases
0 405 45 5043 75 78 80
Left
RedAGreenLeft
AGreenRed
Transit Street Phases
Cross Street Phases
0 405 45 5043 75 78 80
5.4 Window Stretching* This strategy will “stretch” the transit vehicle green phase through green extensions or red truncations to allow passage of the transit vehicle; however a core phase window is maintained to allow for the alignment of signal coordination. General rules of operation are like those described in Green Extension and Red Truncation strategies.
Window Stretching0 5048 70 73 75
Left
RedAGreen
AGreenRed
Transit Street Phases
Cross Street Phases
45Left
55 80T1
Core Phase Window0 5048 70 73 75
Left
RedAGreen
AGreenRed
Transit Street Phases
Cross Street Phases
45Left
55 80T1
0 5048 70 73 75
Left
RedAGreen
AGreenRed
Transit Street Phases
Cross Street Phases
45Left
55 80T1
Core Phase Window
Normal Cycle
Left
RedAGreenLeft
AGreenRed
Transit Street Phases
Cross Street Phases
0 405 45 5043 75 78 80Core Phase
Window
Left
RedAGreenLeft
AGreenRed
Transit Street Phases
Cross Street Phases
0 405 45 5043 75 78 80
Left
RedAGreenLeft
AGreenRed
Transit Street Phases
Cross Street Phases
0 405 45 5043 75 78 80Core Phase
Window
5.5 Phase Suppression Strategies* This strategy will provide for the exclusion of selected non-critical transit or traffic phases to provide for a quicker return to the transit vehicle green phase. Upon detecting a transit vehicle in the POZ, the system must initiate steps to ignore identified non-transit priority phases (e.g. advanced left turn phases). If a pedestrian or left turn phase is being serviced when the call is received, the phase must be continued for the user-specified minimum period.
A-12

Technical Paper – Literature Overview Brief
Phase Suppression
RedAGreen
AGreenRed
LeftTransit Street Phases
Cross Street Phases
0 40 45 8070 73 7543RedAGreen
AGreenRed
LeftTransit Street Phases
Cross Street Phases
0 40 45 8070 73 7543T1
Normal Cycle
Left
RedAGreenLeft
AGreenRed
Transit Street Phases
Cross Street Phases
0 405 45 5043 75 78 80
Left
RedAGreenLeft
AGreenRed
Transit Street Phases
Cross Street Phases
0 405 45 5043 75 78 80
5.6 Queue Jumping Priority Sequence* This strategy will initiate a special transit only signal to allow the transit vehicle to move through the intersection before other traffic. This technique requires special geometric features at the intersection and special transit designated display (i.e. transit traffic signal or vertical white bar). Upon detecting a transit vehicle in the POZ the system must initiate a priority sequence to clear a transit vehicle in a transit only lane. Special design considerations will be required to devise a means of ensuring that the transit vehicle is first in the queue of a HOV lane, transit only lane, or mixed traffic lane.
Queue Jumping
Left
RedAGreenTransit
AGreenRed
Transit Street Phases
Cross Street Phases
0 4010 45 50 75 78 8043Left
15T1
8
Left
RedAGreenTransit
AGreenRed
Transit Street Phases
Cross Street Phases
0 4010 45 50 75 78 8043Left
15T1
8
Normal Cycle
Left
RedAGreenLeft
AGreenRed
Transit Street Phases
Cross Street Phases
0 405 45 5043 75 78 80
Left
RedAGreenLeft
AGreenRed
Transit Street Phases
Cross Street Phases
0 405 45 5043 75 78 80
Figure 1: Queue Jumping Lane Geometric Configuration Examples
5.7 Red Interruption This strategy will interrupt the transit red phase to include a short green phase that will allow the transit vehicle to pass through the intersection without having to wait for its proper allocations within the cycle.
A-13
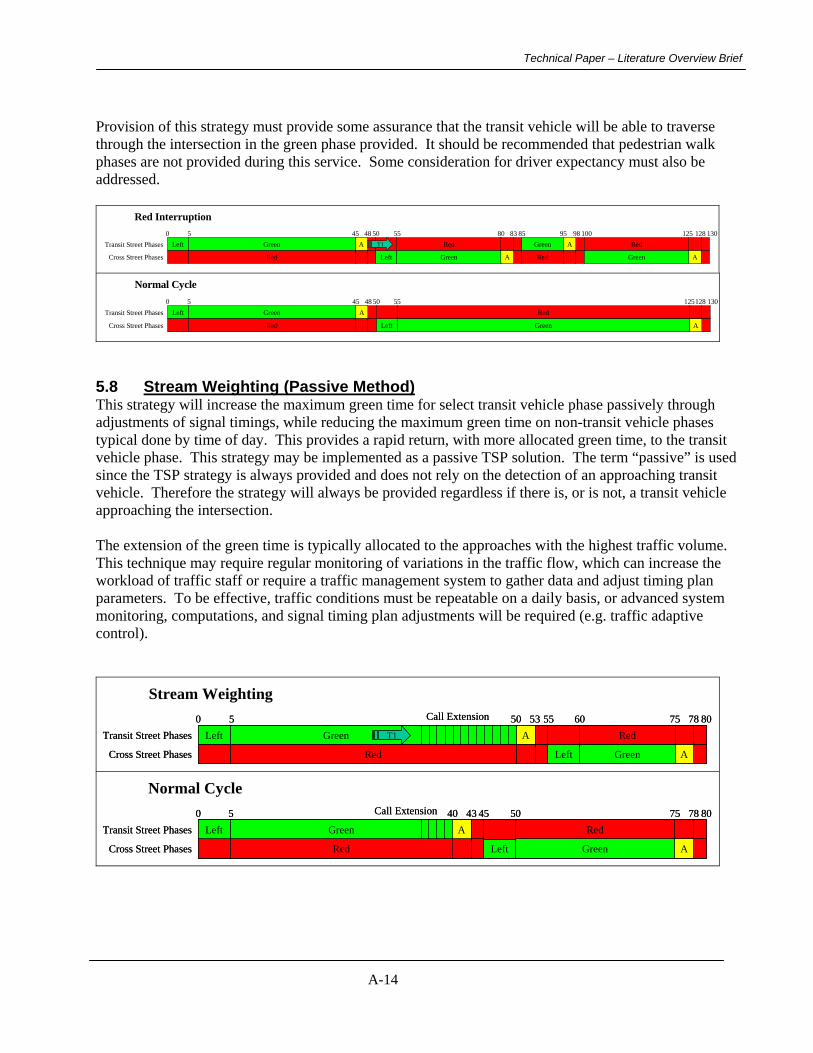
Technical Paper – Literature Overview Brief
Provision of this strategy must provide some assurance that the transit vehicle will be able to traverse through the intersection in the green phase provided. It should be recommended that pedestrian walk phases are not provided during this service. Some consideration for driver expectancy must also be addressed.
Red Interruption
Left
RedAGreenLeft
AGreenRed
Transit Street Phases
Cross Street Phases
0 455 50 55 125 128 13048Green
RedA
83 85A
95 98Red
Green
80 100T1
Normal Cycle
Left
RedAGreenLeft
AGreenRed
Transit Street Phases
Cross Street Phases
0 455 50 55 125128 13048
5.8 Stream Weighting (Passive Method) This strategy will increase the maximum green time for select transit vehicle phase passively through adjustments of signal timings, while reducing the maximum green time on non-transit vehicle phases typical done by time of day. This provides a rapid return, with more allocated green time, to the transit vehicle phase. This strategy may be implemented as a passive TSP solution. The term “passive” is used since the TSP strategy is always provided and does not rely on the detection of an approaching transit vehicle. Therefore the strategy will always be provided regardless if there is, or is not, a transit vehicle approaching the intersection. The extension of the green time is typically allocated to the approaches with the highest traffic volume. This technique may require regular monitoring of variations in the traffic flow, which can increase the workload of traffic staff or require a traffic management system to gather data and adjust timing plan parameters. To be effective, traffic conditions must be repeatable on a daily basis, or advanced system monitoring, computations, and signal timing plan adjustments will be required (e.g. traffic adaptive control).
Stream Weighting
Left
RedAGreen Left
AGreenRed
Transit Street Phases
Cross Street Phases
0 505 5553 60 75 78 80T1
Call Extension
Left
RedAGreen Left
AGreenRed
Transit Street Phases
Cross Street Phases
0 505 5553 60 75 78 80T1
Call Extension
Normal Cycle
Left
RedAGreenLeft
AGreenRed
Transit Street Phases
Cross Street Phases
0 405 45 5043 75 78 80Call Extension
Left
RedAGreenLeft
AGreenRed
Transit Street Phases
Cross Street Phases
0 405 45 5043 75 78 80Call Extension
A-14

Technical Paper – Literature Overview Brief
5.9 Lift Strategy* This strategy will place a hold on all calls from the intersection (i.e. actuated movements) and serve the minimum times for each non-actuated phase. This will provide for the rapid return to the transit vehicle green phase. When using this strategy in situations where there is a high frequency of transit vehicles, the performance of critical movements may be severely degraded. Therefore, the system should have a specifiable limit to the number of TSP calls that may be served in consecutive cycles (e.g. one call served every three cycles).
Lift Strategy
RedAGreen
AGreen MinRed
Transit Street Phases
Cross Street Phases
0 45 50 75 78 8048RedAGreen
AGreen MinRed
Transit Street Phases
Cross Street Phases
0 45 50 75 78 8048T1
Normal Cycle
Left
RedAGreenLeft
AGreenRed
Transit Street Phases
Cross Street Phases
0 405 45 5043 75 78 80
Left
RedAGreenLeft
AGreenRed
Transit Street Phases
Cross Street Phases
0 405 45 5043 75 78 80
5.10 First In Sequence, First Served* TSP service more commonly operate on a “first detected, first served” basis. However, with the ability to provide the “first in sequence, first served” control strategy, the system would identify which vehicle, of two or more detected, would most conveniently benefit from an immediate TSP service, provided that both are of the same priority rating. The system must be capable of independently distinguishing priority approaches. This may require additional detection hardware and/or advanced system components capable of processing more detection information relative to the moment-to-moment signal operation and make subsequent real-time signal control decisions.
First In Sequence, First Served
Left
RedAGreenLeft
AGreenRed
Main Street Phases
Cross Street Phases
0 405 45 5043 80 83 85
T2
T1
Ext.
75
Left
RedAGreenLeft
AGreenRed
Main Street Phases
Cross Street Phases
0 405 45 5043 80 83 85
T2
T1
Ext.
75
Normal Cycle
Left
RedAGreenLeft
AGreenRed
Main Street Phases
Cross Street Phases
0 405 45 5043 75 78 80
A-15
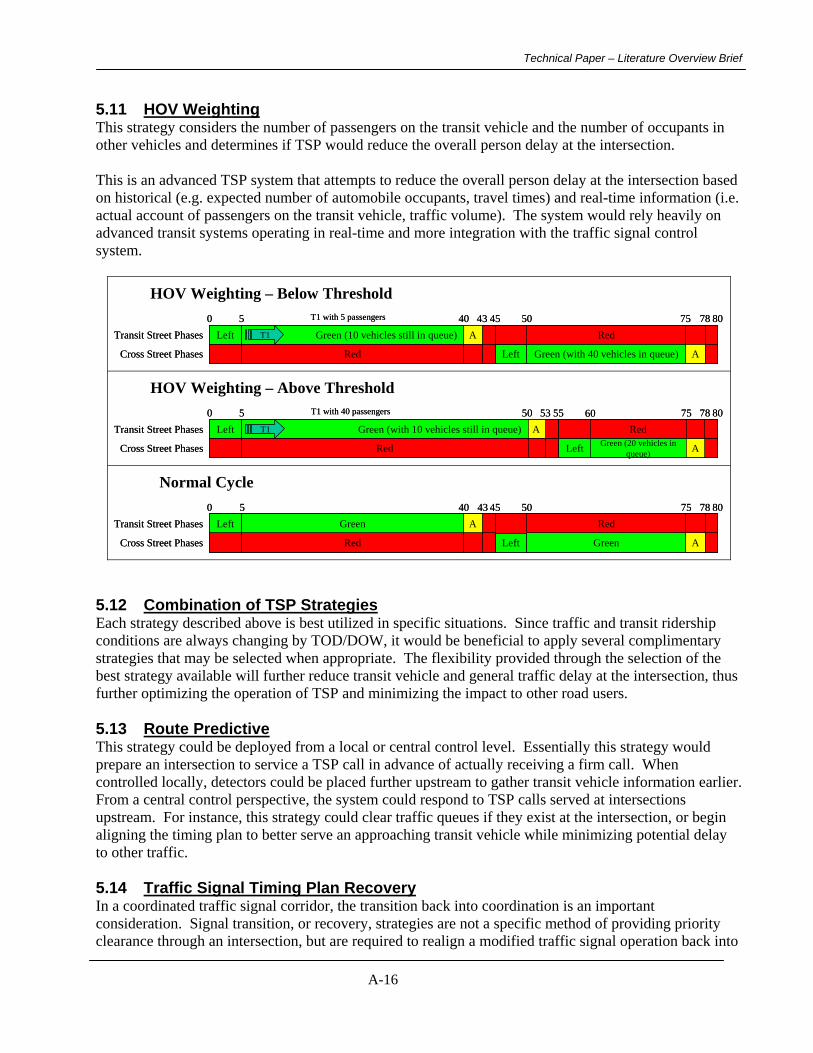
Technical Paper – Literature Overview Brief
5.11 HOV Weighting This strategy considers the number of passengers on the transit vehicle and the number of occupants in other vehicles and determines if TSP would reduce the overall person delay at the intersection. This is an advanced TSP system that attempts to reduce the overall person delay at the intersection based on historical (e.g. expected number of automobile occupants, travel times) and real-time information (i.e. actual account of passengers on the transit vehicle, traffic volume). The system would rely heavily on advanced transit systems operating in real-time and more integration with the traffic signal control system.
HOV Weighting – Below Threshold
Left
RedAGreen (10 vehicles still in queue)Left
AGreen (with 40 vehicles in queue)Red
Transit Street Phases
Cross Street Phases
0 405 45 5043 75 78 80T1
T1 with 5 passengers
Left
RedAGreen (10 vehicles still in queue)Left
AGreen (with 40 vehicles in queue)Red
Transit Street Phases
Cross Street Phases
0 405 45 5043 75 78 80T1
T1 with 5 passengers
HOV Weighting – Above Threshold
RedAGreen (with 10 vehicles still in queue)Left
AGreen (20 vehicles in queue)Red
Transit Street Phases
Cross Street Phases
0 505 55 60 75 78 8053T1
T1 with 40 passengers
Left
RedAGreen (with 10 vehicles still in queue)Left
AGreen (20 vehicles in queue)Red
Transit Street Phases
Cross Street Phases
0 505 55 60 75 78 8053T1
T1 with 40 passengers
Left
Normal Cycle
Left
RedAGreenLeft
AGreenRed
Transit Street Phases
Cross Street Phases
0 405 45 5043 75 78 80
Left
RedAGreenLeft
AGreenRed
Transit Street Phases
Cross Street Phases
0 405 45 5043 75 78 80
5.12 Combination of TSP Strategies Each strategy described above is best utilized in specific situations. Since traffic and transit ridership conditions are always changing by TOD/DOW, it would be beneficial to apply several complimentary strategies that may be selected when appropriate. The flexibility provided through the selection of the best strategy available will further reduce transit vehicle and general traffic delay at the intersection, thus further optimizing the operation of TSP and minimizing the impact to other road users. 5.13 Route Predictive This strategy could be deployed from a local or central control level. Essentially this strategy would prepare an intersection to service a TSP call in advance of actually receiving a firm call. When controlled locally, detectors could be placed further upstream to gather transit vehicle information earlier. From a central control perspective, the system could respond to TSP calls served at intersections upstream. For instance, this strategy could clear traffic queues if they exist at the intersection, or begin aligning the timing plan to better serve an approaching transit vehicle while minimizing potential delay to other traffic. 5.14 Traffic Signal Timing Plan Recovery In a coordinated traffic signal corridor, the transition back into coordination is an important consideration. Signal transition, or recovery, strategies are not a specific method of providing priority clearance through an intersection, but are required to realign a modified traffic signal operation back into
A-16
Technical Paper – Literature Overview Brief
the normally defined operation after a TSP call has been served. Depending on the aggressiveness of the recovery strategy, it may take several traffic signal cycles to complete the transition back to normal operation. A recovery strategy may reallocate time taken away from non-transit phases, and/or incrementally adjust split times to realign the offset point in the signal timing cycle.
A-17
Technical Paper – Literature Overview Brief
6.0 TSP Limitations and Areas of Research The provision of TSP to date has been predominately provided through the capabilities of the local traffic signal controller located at the intersection. As such, much of the research and development of TSP in the past has focused on enhancing the capabilities of the controller. However, with the rapid advancements in micro processing technologies, data gathering technologies, and provision of reliable, fast, and cost effective communications, the opportunities for more advanced developments in TSP are now possible. These advancements can come in the form of processing more real-time data and/or through the provision of TSP through new design concepts and system configurations. With these changes, new TSP algorithms may need to be developed to take advantage of the array of data and processing power now available. 6.1 Limitations of Existing TSP Practices In referencing the insights gained through the literature review, and through the project team’s experience, the following is a listing of limitations within the current state of practice:
1. Excessive delay caused to general traffic, especially side street traffic, at the intersection in saturated traffic conditions
2. Provision of TSP when it is not needed (i.e. transit vehicle is running ahead of schedule) 3. Traffic signal timing recovery/re-coordination after a TSP call is served, which could take several
signal timing cycles to complete 4. Provision of TSP on transit routes operating on short headways within congested corridors 5. Limited application of more advanced TSP control strategies 6. Lack of more advanced TSP control methods/algorithms based on the recent technologies
such as automated vehicle location and/or automated passenger counter since these systems are becoming more mainstream
7. Interfacing with transit management/scheduling systems for real-time transit information Most of the listed limitations can be mitigated, or eliminated, through the provision of conditional and/or adaptive control capabilities. 6.2 General Areas of Focus for the Development of a TSP Algorithm Through this literature review, the following areas are of interest to the research and development community in respects to the development of new TSP algorithms:
1. Central based system in view of providing increased TSP functionality network wide, as well as to enable the sharing of information in respects to meeting the goals of the ITS Architecture.
2. Conditional priority (with schedule information, passenger information, traffic saturation information, etc.)
3. Adaptive features to minimize unnecessary delay to other traffic and improve success rate of TSP service
4. Dynamic selection of a broader array of TSP strategies that would be more effective in a particular situation governed by the level of traffic congestion, the point in the traffic signal cycle, etc.
A-18
Technical Paper – Literature Overview Brief
6.3 Specific State-of-the-Art TSP Operational Concepts and Practices for Consideration
Some specific areas, related to TSP operations, where more research and development is needed include:
1. Recovery sequences in better manage how lost signal phase timings are to be allocated/recovered 2. Improved forms of administering conditional priority, perhaps through the use of differing levels
of priority and by ensuring that the TSP sequence is of benefit to the transit vehicle and/or the overall traffic network or intersection node
3. Enhancing system configurations to allow for the gathering of more real time information such that system decisions could be more accurate
4. Integration with other systems to better facilitate the collection and sharing of real time information
5. Enhancing/developing centralized traffic control system that would be capable of providing improved TSP functions and control that are beyond the current state of development available through local TSP control and operation at the intersection
6. Improved mechanisms for administering priority requested in saturated traffic networks; this may include predictive modeling and the adjustments of signal timing plans in preparation for the arrival of the transit vehicle
7. Adaptive TSP operations where transit vehicles are detected at the preceding intersections 8. Improved utilization of TSP functions in traffic signal networks managed by adaptive controls
systems like SCOOT or SCATS 9. Clearing traffic queues before transit vehicles arrive to minimize the amount of delay and errors
in the expected progression of the transit vehicle towards a signalized intersection 10. Utilizing multiple control strategies in one sequence to provide advanced TSP operation 11. Historical referencing of traffic patterns and transit travel for TSP decision making of
approaching transit vehicles. 12. Implementation of more control strategies into everyday use
A-19

Technical Paper – Literature Overview Brief
7.0 Conclusion Transit signal priority is not a new concept in the transit and traffic management community. The theoretical benefits of TSP are well documented, but the practical application of TSP has been limited by the capabilities of technology. Over the last decade, technology has advanced significantly and has provided faster processing systems, more accurate and reliable technologies, and more robust and economical communications networks to interconnect systems and devices. With these technological advancements, new opportunities exist in how TSP systems are configured and operated. However, much research and development is necessary to effectively design a system that provides more effective performance form a transit perspective (i.e. successful clearance through an intersection with TSP) and a traffic perspective (i.e. limited additional delay to other traffic at the intersection). The general research and development needs at this time are directed towards the provision of more intelligent conditional and adaptive TSP control through the inclusion of newer technologies, system-to-system interconnections and/or advanced traffic signal control strategies.
A-20
Technical Paper – Literature Overview Brief
8.0 References Balke, Kevin N., Dudek, Conrad L, Urbanik, Thomas. 2000. Development and Evaluation of an Intelligent Bus Priority Concept. TRB Meeting 2000. Bishop, C. 1994. Transit Priority Traffic Control Systems: European Experience. Toronto: Canadian Urban Transit Association. Chang, James. 2002. An Overview of Transit Signal Priority. Intelligent Transportation Society of America. Dale, Jim. 2004. Analysing TSP – State-of-Practice. Transportation Research Board – Signal Systems Committee Presentation: January 11, 2004. Fox, K., et al. 1998. UTMCO1: Selected Vehicle Priority in the UTMC Environment –WP2.1: Literature Review. University of Leeds Hounsell, N. et al. Integrated Traffic Control and Bus Priority Systems in London: Results from the INCOME Project. Hounsell, N., Gardner, K. Intelligent Bus Priority in London: Progress on Large-Scale Implementation. Hu, Kang, Skehan, Sean, Gephart, Rex. 2001. Implementing a Smart Transit Priority System for METRO Rapid Bus in Los Angeles. TRB Meeting, 2001. Ling, K., Shalaby, A. Automated Transit Headway Control via Adaptive Signal Priority. Toronto: University of Toronto. Meenakshy, V., Chang, G. 2001. Design Framework for Integrating Real-Time Bus Priority Control with Robust Arterial Signal Progression. TRB Meeting 2001. Mirchandani, Pitu, Knyazyan, Anna, Head, Larry, Wu, Wenji. 2001. An Approach Towards the Integration of Bus Priority and Traffic Adaptive Signal Control. TRB Meeting 2001. O’Brien, W. 2000. Design and Implementation of Transit Priority at Signalized Intersections: A Primer for Transit Managers and a Review of North American Experience. Toronto: Canadian Urban Transit Association. Obenberger, Jon, Collura, John. 2001 Transition Strategies to Exit Preemption Control: State-of-the-Practice Assessment. TRB Meeting 2001. Shalaby, A., Abdulhai, B., Lee, J. Assessment of Streetcar Transit Priority Options Using Microsimulation Modelling. Department of Civil Engineering, University of Toronto. Shalaby, A., Hemily, B. 2004. ATLANTIC: A Thematic Long-term Approach to Networking for the Telematics and the ITS Community – Draft Discussion Paper. Toronto: University of Toronto.
A-21
Technical Paper – Literature Overview Brief
Sinikas, J. TTC Project Engineer, Service Planning. Telephone discussion. 14, April, 2004. Smith, H., Hemily, B. 2004. Transit Signal Priority: Deployment Issues and R&D Needs as Identified by Practitioners. Transportation Research Board – Traffic Signal Priority Workshop. January 11, 2004. Wadjas, Y., Furth, P.G. 2002. Transit Signal Priority Along an Arterial Using Advanced Detection. TRB Meeting 2003.
A-22