Transit Signal Priority Evaluation and Performance Measures
31
Transit Signal Priority Evaluation and Performance Measures Miguel A. Figliozzi Professor Civil and Environmental Engineering Portland State University NITC Webinar - October 26, 2016
-
Upload
trec-at-psu -
Category
Education
-
view
82 -
download
2
Transcript of Transit Signal Priority Evaluation and Performance Measures

Transit Signal Priority Evaluation and Performance Measures
Miguel A. FigliozziProfessor Civil and Environmental EngineeringPortland State University
NITC Webinar - October 26, 2016
Background—Transit Signal Priority
2
Transit signal priority (TSP)* is the process of:- detecting transit vehicles approaching signalized
intersections and- adjusting the signal phasing in real time to reduce
transit delay
*Furth, P. G., and T. H. J. Muller. Conditional Bus Priority at Signalized Intersections: Better Service with Less Traffic Disruption.
In Transportation Research Record: Journal of the Transportation Research Board, No. 1731, TRB, National Research Council, Washington, D.C., 2000, pp. 23–30.

3
TSP Elements
3
(a) An onboard priority request generator
(b) A detection system that receives the priority request and informs the traffic controller
(c) A priority control strategy at the signal controller

Background—Transit Signal Priority
4
Why TSP ?
Benefits*
- Improve transit reliability- Allow late bus recovery - Speed improvements?- TSP is relatively inexpensive and “easily
implemented”
*Albright, E., & Figliozzi, M. (2012). Factors influencing effectiveness of transit signal priority and late-bus recovery at signalized-intersection level. Transportation Research Record: Journal of the Transportation Research Board, (2311), 186-194.
Evaluation? Not so easy…
Background—Transit Signal Priority
5
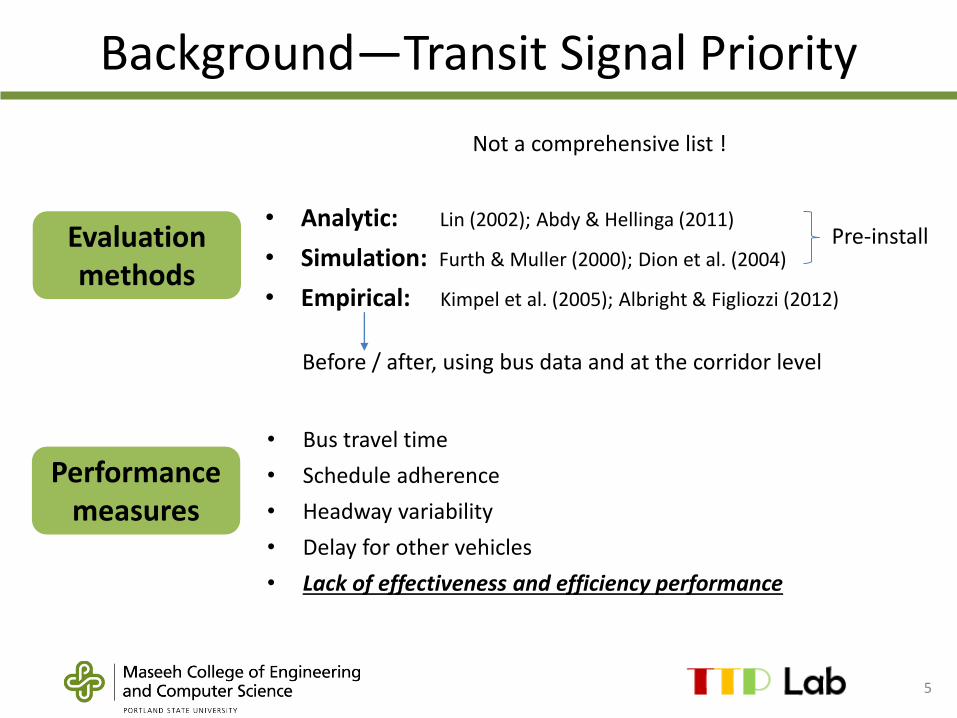
Evaluation methods
• Analytic: Lin (2002); Abdy & Hellinga (2011)
• Simulation: Furth & Muller (2000); Dion et al. (2004)
• Empirical: Kimpel et al. (2005); Albright & Figliozzi (2012)
Performance measures
• Bus travel time
• Schedule adherence
• Headway variability
• Delay for other vehicles
• Lack of effectiveness and efficiency performance
Pre-install
Before / after, using bus data and at the corridor level
Not a comprehensive list !
Why another study?
6
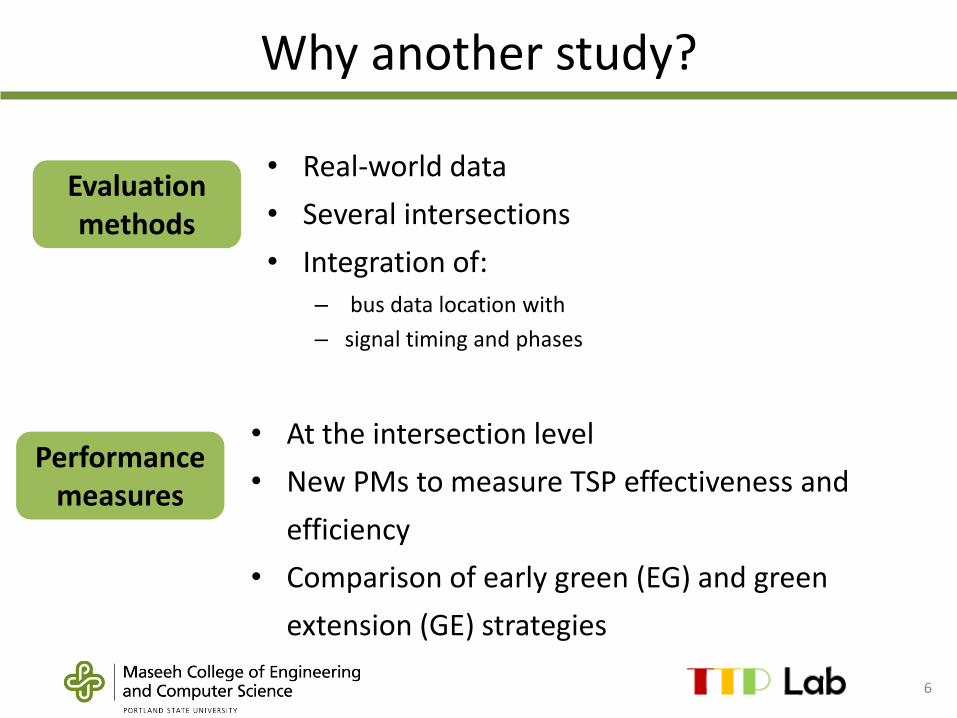
Evaluation methods
• Real-world data
• Several intersections
• Integration of:
– bus data location with
– signal timing and phases
Performance measures
• At the intersection level
• New PMs to measure TSP effectiveness and
efficiency
• Comparison of early green (EG) and green
extension (GE) strategies

Study Corridor
7
21st 26th 33rd 39th 42nd 50th 52nd 65th 69th 71st, 72nd 82ndMilwaukie
12 SCATS signals
SE Powell Blvd.
Bus Route 9
Bus Route 66
Near-side: 26th EB26th WB
33rd EB 42nd EB43rd WB
72nd EB
Far-side: 50th EB50th WB33rd WB
39th EB39th WB 72nd WB
52nd EB52nd WB
65th EB65th WB
69th EB 71st EB
Far-side (12)
Near-side (6)Stop-to-stop segment
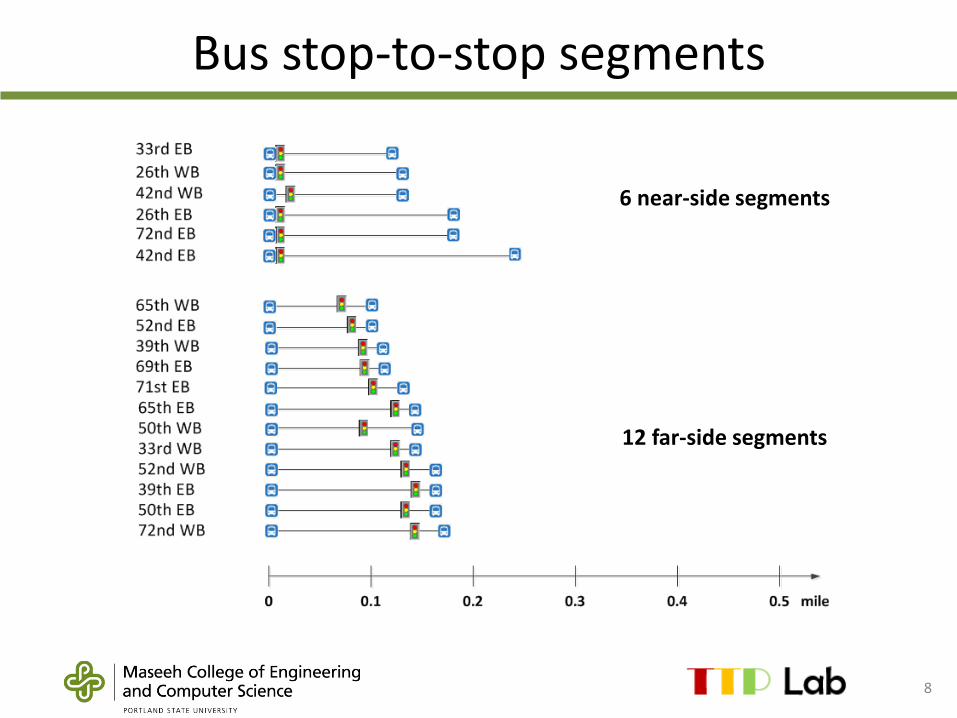
Bus stop-to-stop segments
8
6 near-side segments
12 far-side segments

9
TSP in our case study
9
Green extensionEarly Green
Kamila Widulinski and Matthew Lapointe (2013)
TSP request is sent when: 1) on-route,2) doors are closed, and3) >30 seconds late.
(a) An onboard priority request generator
(b) A detection system that receives the priority request and informs the traffic controller
(c) A priority control strategy at the signal controller determines whether to grant a TSP phase, which TSP phase shouldbe granted, and when the TSP phase should start and end

SCATS: adaptive traffic control
10
0
20
40
60
80
100
120
140
E W E W E W E W E W E W E W E W E W E W E W E W
MKE 21st 26th 33rd 39th 42nd 50th 52nd 65th 69th 71st 72nd
Seco
nd
s
Intersections / Directions
Median Cycle Length, Green phase and red phase duration
Red
Green

Data Integration
11
Bus ALV/APC Database
SCATS Vehicle Counts
Database
SCATS Signal Phase Log Database
Bus Stop-to-Stop Trip Database
TSP Performance
Evaluation
Geometry, trajectories
VERY DIFFICULT !!!
TSP Phases
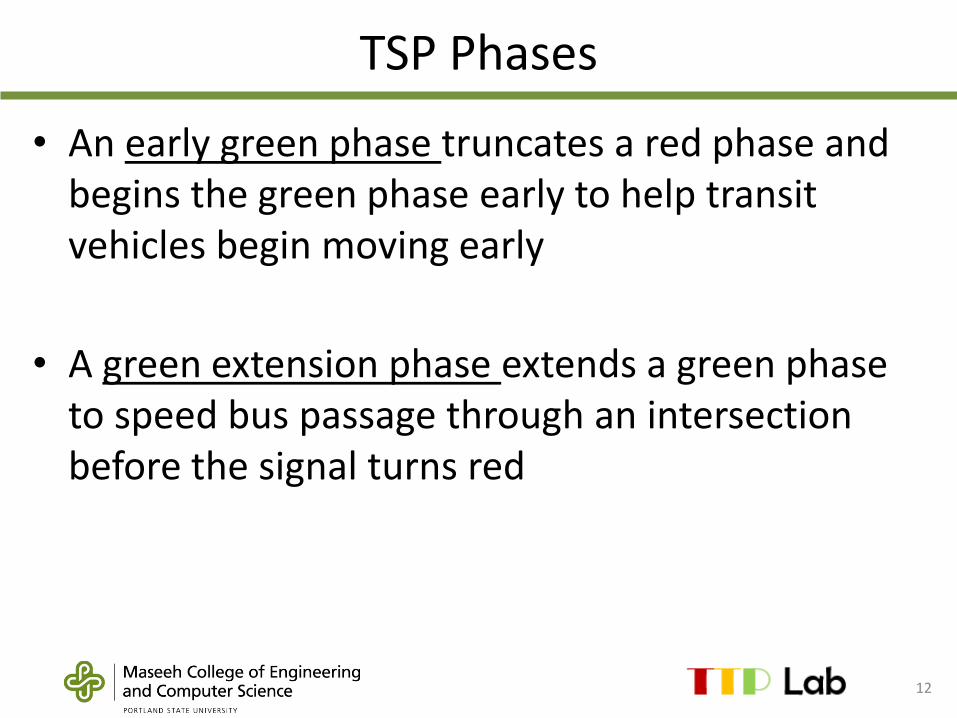
12
• An early green phase truncates a red phase and begins the green phase early to help transit vehicles begin moving early
• A green extension phase extends a green phase to speed bus passage through an intersection before the signal turns red
13
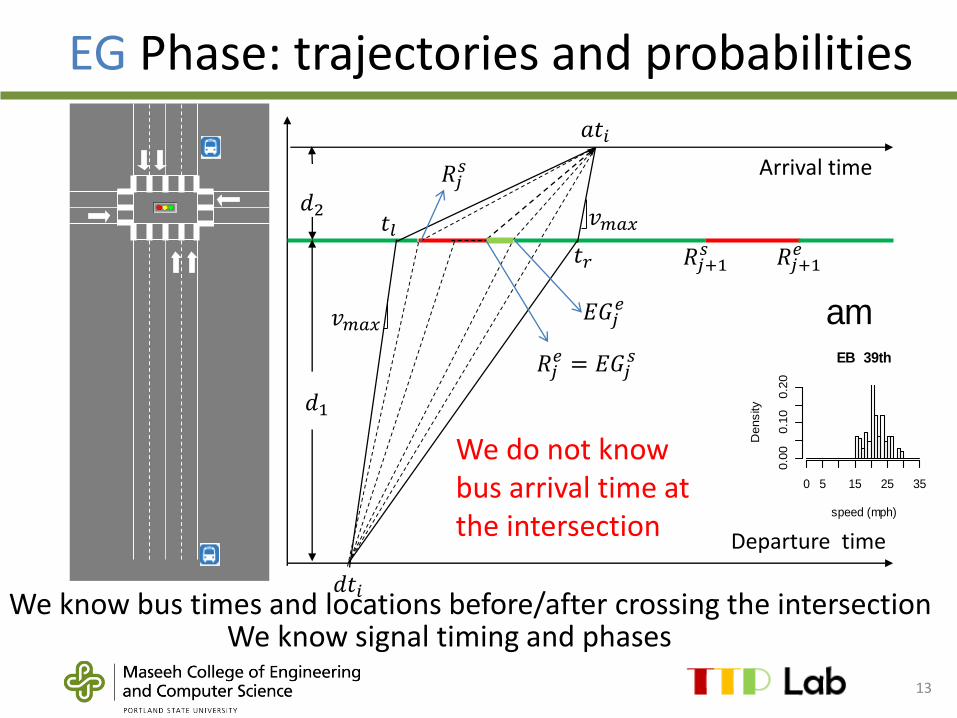
EG Phase: trajectories and probabilities
𝑑1
Arrival time
Departure time
𝑅𝑗𝑠
𝑅𝑗𝑒 = 𝐸𝐺𝑗
𝑠
𝑎𝑡𝑖
𝑑𝑡𝑖
𝑅𝑗+1𝑠 𝑅𝑗+1
𝑒
𝑣𝑚𝑎𝑥
𝑑2 𝑣𝑚𝑎𝑥𝑡𝑙𝑡𝑟
𝐸𝐺𝑗𝑒
EB Mke_21st
speed (mph)
Density
0 5 15 25 35
0.0
00.1
00.2
0
EB 26th
speed (mph)
Density
0 5 15 25 35
0.0
00.1
00.2
0EB 33rd
speed (mph)
Density
0 5 15 25 35
0.0
00.1
00.2
0
EB 39th
speed (mph)
Density
0 5 15 25 35
0.0
00.1
00.2
0
EB 42nd
speed (mph)
Density
0 5 15 25 35
0.0
00.1
00.2
0
EB 50th
speed (mph)
Density
0 5 15 25 35
0.0
00.1
00.2
0
EB 52nd
speed (mph)
Density
0 5 15 25 35
0.0
00.1
00.2
0
EB 65th
speed (mph)
Density
0 5 15 25 35
0.0
00.1
00.2
0
EB 69th
speed (mph)
Density
0 5 15 25 35
0.0
00.1
00.2
0
EB 71st
speed (mph)
Density
0 5 15 25 35
0.0
00.1
00.2
0EB 72nd
speed (mph)
Density
0 5 15 25 35
0.0
00.1
00.2
0
WB 21st_Mke
speed (mph)
Density
0 5 15 25 35
0.0
00.1
00.2
0
WB 26th
speed (mph)
Density
0 5 15 25 35
0.0
00.1
00.2
0
WB 33rd
speed (mph)
Density
0 5 15 25 35
0.0
00.1
00.2
0
WB 39th
speed (mph)
Density
0 5 15 25 35
0.0
00.1
00.2
0
WB 42nd
speed (mph)
Density
0 5 15 25 35
0.0
00.1
00.2
0
WB 50th
speed (mph)
Density
0 5 15 25 35
0.0
00.1
00.2
0
WB 52nd
speed (mph)
Density
0 5 15 25 35
0.0
00.1
00.2
0WB 65th
speed (mph)
Density
0 5 15 25 35
0.0
00.1
00.2
0
WB 71st_69th
speed (mph)
Density
0 5 15 25 35
0.0
00.1
00.2
0
WB 72nd
speed (mph)
Density
0 5 15 25 35
0.0
00.1
00.2
0
am
We know bus times and locations before/after crossing the intersection We know signal timing and phases
We do not know bus arrival time at the intersection

GE Phase : trajectories and probabilities
14
𝑑1
Arrival time
Departure time
𝑅𝑗𝑠 𝑅𝑗
𝑒
𝑎𝑡𝑖
𝑑𝑡𝑖
𝐺𝐸𝑗𝑒 = 𝑅𝑗+1
𝑠 = 𝑡𝑟
𝑅𝑗+1𝑒
𝑣𝑚𝑎𝑥
𝑑2𝑡𝑙
𝐺𝐸𝑗𝑠
Forensic work: many potential cases depending on the stop departure and arrival times, timing of the phases, and bus speed probability distribution

Research Objectives/Questions
15
• Define performance measures
• Green extension (GE) vs. early green (EG)? Which one is more effective?
• Time savings tradeoffs: buses, passengers, main arterial, and cross streets

Proposed Performance Measures
16
– TSP Frequency• Is TSP working properly?
– TSP Responsiveness • Are TSP phases granted after a request?
– TSP Timeliness • From the bus point of view
• What is the probability of benefiting from a TSP phase request?
• What is the expected time saved per request?
– TSP Efficiency • From the traffic signal system point of view
• What is the expected bus/passenger time saved per phase granted?
• Normalized to seconds per second of TSP phase duration

TSP Frequency
17
0102030405060708090
26th 33rd 39th 42nd 50th 52nd 65th 69th 71st 72nd
Average number of bus trips per day
requested TSP did not request TSP
0102030405060708090
26th 33rd 39th 42nd 50th 52nd 65th 69th 71st 72nd
Average number of TSP phases per day
Green Extension (GE) Early Green (EG)
Is the system working?

Responsiveness: Actual Outcomes of TSP Requests
18
0%
10%
20%
30%
40%
50%
60%
70%
80%
90%
100%
EB WB EB WB EB WB EB WB EB WB EB WB EB WB EB WB
39th 42nd 50th 52nd 65th 69th 71st 72nd
Neither GE nor EG EG Both GE and EG GE
near
near
near
Granted within a cycle

TSP Timeliness: GE
19
a b cd
ne
ar
ne
ar
ne
ar
0%10%20%30%40%50%60%70%80%90%
100%
EB WB EB WB EB WB EB WB EB WB EB WB EB WB EB WB
39th 42nd 50th 52nd 65th 69th 71st 72nd
d: no GE a: late GE b: on time GE c: early GE

20
TSP Timeliness: EG
a b cd
0%10%20%30%40%50%60%70%80%90%
100%
EB WB EB WB EB WB EB WB EB WB EB WB EB WB EB WB
39th 42nd 50th 52nd 65th 69th 71st 72nd
d: no EG a: late EG b: on time EG c: early EG
ne
ar
ne
ar
ne
ar

TSP Effectiveness
21
0%10%20%30%40%50%60%70%80%90%
100%
EB WB EB WB EB WB EB WB EB WB EB WB EB WB EB WB
39th 42nd 50th 52nd 65th 69th 71st 72nd
on-time EG on-time EG on-time GE on-time GE
near
near
near
Probability that a bus requesting TSP will benefit from a TSP phase

Passengers: avg. time saved per TSP Request
22
σ𝑖 𝑇𝑖𝑚𝑒 𝑠𝑎𝑣𝑖𝑛𝑔 𝑓𝑟𝑜𝑚 𝐺𝐸𝑖σ𝑖 𝑇𝑆𝑃 𝑟𝑒𝑞𝑢𝑒𝑠𝑡𝑖
σ𝑖 𝑇𝑖𝑚𝑒 𝑠𝑎𝑣𝑖𝑛𝑔 𝑓𝑟𝑜𝑚 𝐸𝐺𝑖σ𝑖 𝑇𝑆𝑃 𝑟𝑒𝑞𝑢𝑒𝑠𝑡𝑖
0
5
10
15
20
25
39th 42nd 50th 52nd 65th 69th 71st 72nd
seco
nd
sfrom GE from EG
i = intersection index
Y axis: average total passenger time savings per TSP request

Passengers: Avg. Time Saved per EG phase
23
0
20
40
60
80
100
120
140
EB WB EB WB EB WB EB WB EB WB EB WB EB WB EB WB
39th 42nd 50th 52nd 65th 69th 71st 72nd
seco
nd
snear-side far-side
σ𝑗 𝑇𝑖𝑚𝑒 𝑠𝑎𝑣𝑖𝑛𝑔 𝑜𝑓 𝐸𝐺𝑗
σ𝑗 𝐸𝐺𝑗
Y axis: average total passenger time
per second of granted EG phase

Passengers: Avg. Time Saved per GE phase
24
0
20
40
60
80
100
120
140
EB WB EB WB EB WB EB WB EB WB EB WB EB WB EB WB
39th 42nd 50th 52nd 65th 69th 71st 72nd
seco
nd
s
near-side far-side
σ𝑗 𝑇𝑖𝑚𝑒 𝑠𝑎𝑣𝑖𝑛𝑔 𝑜𝑓 𝐺𝐸𝑗
σ𝑗 𝐺𝐸𝑗
NOTE: same scale for the vertical axis
Y axis: average total passenger time
per second of granted GE phase

TSP Efficiency (Time Saving vs. Delay)
25
TSP phase
Time savings for major street bus and traffic
Delays for vehicles on the minor street
Time savings for major street traffic
GE or EG
Minor streets delay is greatly affected by queue length at the time EG or GE is granted; this is especially important when cross streets have a significant traffic volume.
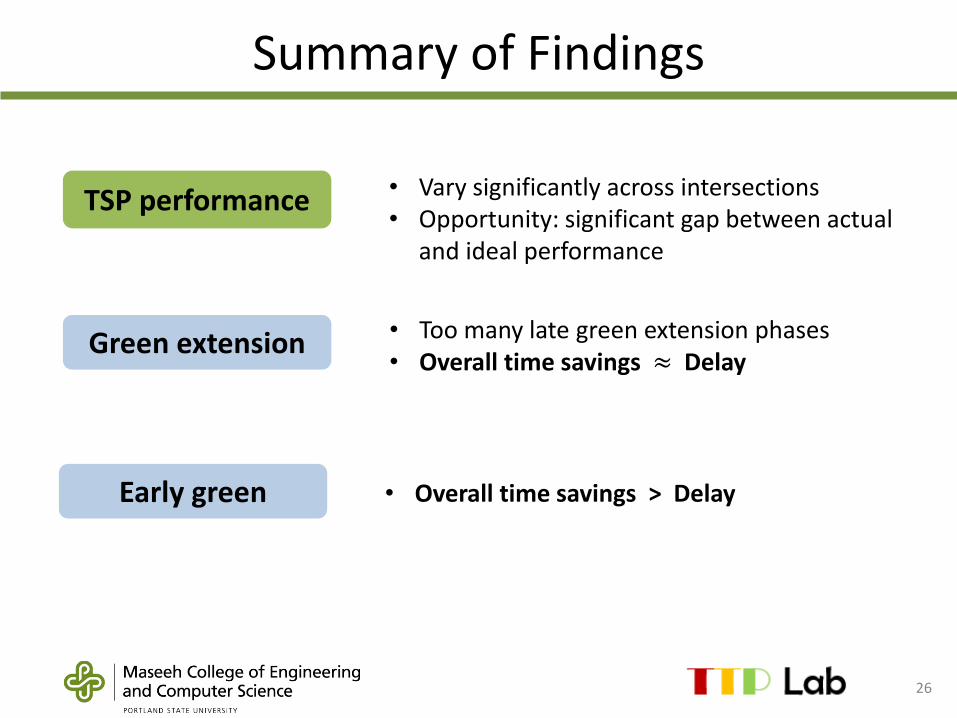
Summary of Findings
26
Green extension • Too many late green extension phases• Overall time savings ≈ Delay
Early green • Overall time savings > Delay
TSP performance • Vary significantly across intersections• Opportunity: significant gap between actual
and ideal performance
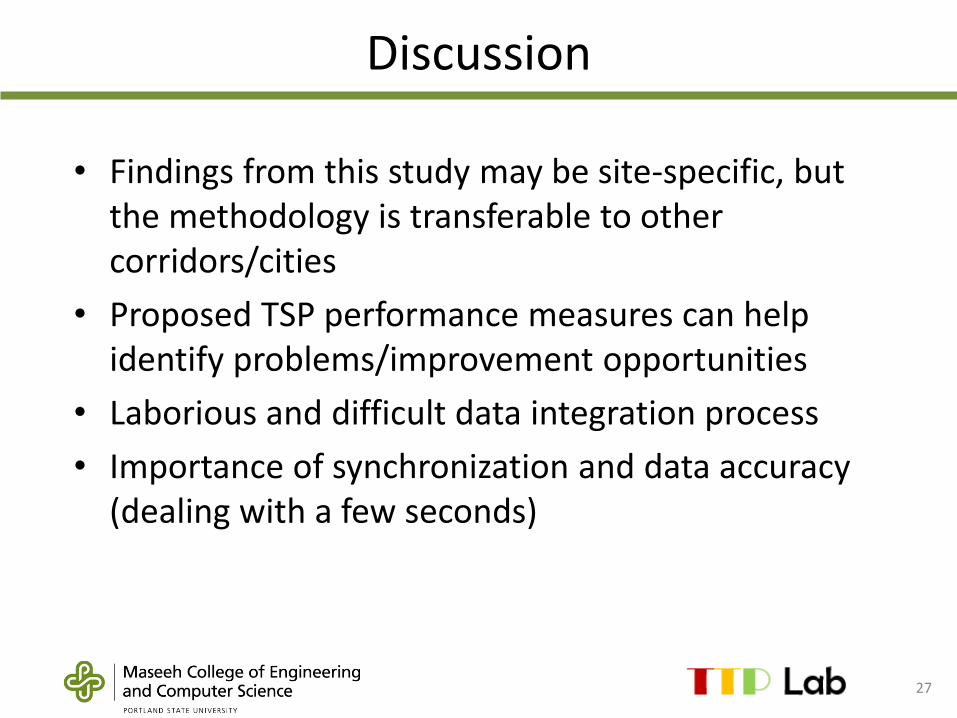
Discussion
27
• Findings from this study may be site-specific, but the methodology is transferable to other corridors/cities
• Proposed TSP performance measures can help identify problems/improvement opportunities
• Laborious and difficult data integration process
• Importance of synchronization and data accuracy (dealing with a few seconds)

Discussion
28
• Reliable data transmission, accurate bus location, fast response from the controller
• Impacts of queuing, bus stop location, and signal detection/communication reliability (check in/out)
• Too many GE phases? Better location and data transfer technology may be needed for GE
• SCATS: what is the TSP logic?
• Glass half full or half empty?

29
Acknowledgements
Steve Callas
David Crout
Willie Rotich
Peter Koonce
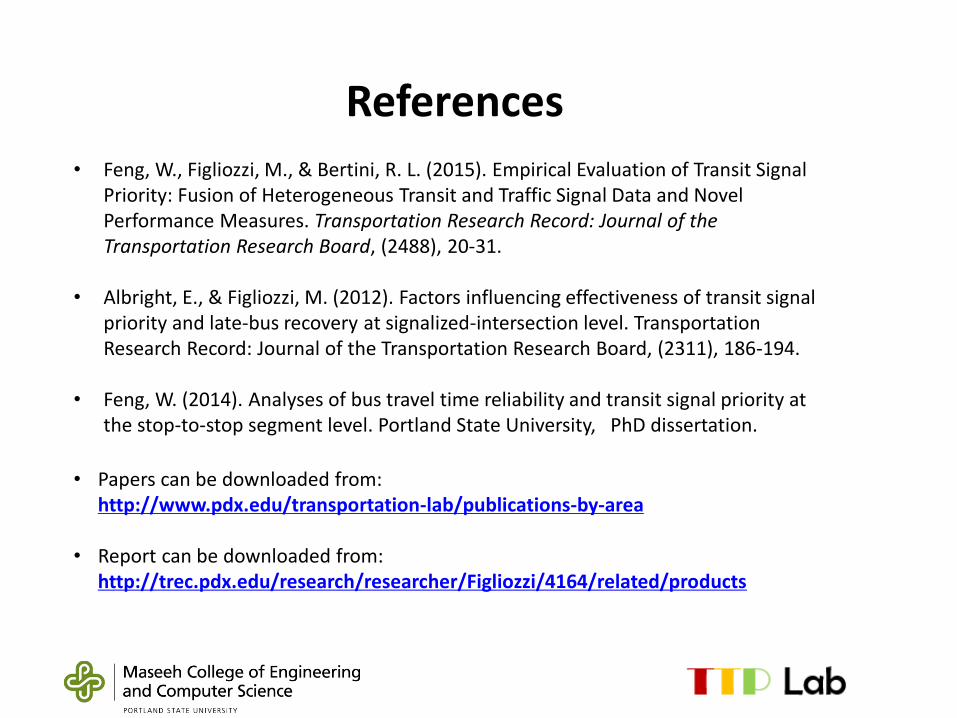
References
• Feng, W., Figliozzi, M., & Bertini, R. L. (2015). Empirical Evaluation of Transit Signal Priority: Fusion of Heterogeneous Transit and Traffic Signal Data and Novel Performance Measures. Transportation Research Record: Journal of the Transportation Research Board, (2488), 20-31.
• Albright, E., & Figliozzi, M. (2012). Factors influencing effectiveness of transit signal priority and late-bus recovery at signalized-intersection level. Transportation Research Record: Journal of the Transportation Research Board, (2311), 186-194.
• Feng, W. (2014). Analyses of bus travel time reliability and transit signal priority at the stop-to-stop segment level. Portland State University, PhD dissertation.
• Papers can be downloaded from: http://www.pdx.edu/transportation-lab/publications-by-area
• Report can be downloaded from: http://trec.pdx.edu/research/researcher/Figliozzi/4164/related/products
31
Questions?