Transient thermo-mechanical behavior of a direct...
26
Fusion Engineering and Design 82 (2007) 265–290 Transient thermo-mechanical behavior of a direct-drive target during injection in an inertial fusion energy chamber Kurt-J. Boehm ∗ , A. Ren´ e Raffray University of California, San Diego, Department of Mechanical and Aerospace Engineering and Center for Energy Research, 460 EBU-II, 9500 Gilman Drive, La Jolla, CA 92093-0438, United States Received 11 May 2006; received in revised form 20 September 2006; accepted 4 December 2006 Available online 22 January 2007 Abstract During injection in an inertial fusion energy (IFE) chamber, a direct-drive target is subject to heat loads from chamber wall radiation and energy exchange from the chamber gas constituents. These heat loads can lead to the deuterium–tritium (DT) reaching its triple point temperature and even undergoing phase change, leading to unacceptable non-uniformity based on target physics requirements for compression and ignition of the DT fuel pellets using multiple laser beams. A two-dimensional bubble nucleation mode was added to the previously presented thermo-mechanical model to help better define the design margin for direct-drive IFE targets. The new model was validated by comparison with analytical results for controlled cases. It was then used to simulate heating experiments on DT targets conducted at the Los Alamos National Laboratory (LANL), where the 3 He present in the DT due to tritium decay was found to affect the nucleation process. The previous requirement for target survival was for the temperature of the DT to remain below triple point of DT (19.79 K). If the existence of a melt layer does not violate the symmetry requirements on the target for successful implosion, the constraint could be relaxed by assuming a limit based on the avoidance of bubble nucleation. This study shows that the thresholds for melting and bubble nucleation are significantly different, allowing for extra margin in target survival under this assumption. © 2006 Elsevier B.V. All rights reserved. Keywords: IFE target survival; 3 He bubble formation; DT phase change 1. Introduction This study extends the research work at UCSD on direct-drive IFE target survival in particular in the ∗ Corresponding author. Tel.: +1 858 534 2983; fax: +1 858 822 2120. E-mail addresses: [email protected], [email protected] (K.-J. Boehm). area of phase change modeling [1–3]. The key basis of this research is the strict symmetry requirements imposed by target physics for compression and ignition of the deuterium–tritium (DT) fuel pellets using mul- tiple laser beams. Wall radiation and energy exchange from the chamber gas to the target during injection can significantly impact these symmetry requirements in particular if phase change occurs. The phase change behavior of DT targets is quite complex (e.g. the pres- 0920-3796/$ – see front matter © 2006 Elsevier B.V. All rights reserved. doi:10.1016/j.fusengdes.2006.12.001
Transcript of Transient thermo-mechanical behavior of a direct...

A
rrpndup
Icm©
K
1
d
f
k
0
Fusion Engineering and Design 82 (2007) 265–290
Transient thermo-mechanical behavior of a direct-drive targetduring injection in an inertial fusion energy chamber
Kurt-J. Boehm ∗, A. Rene Raffray
University of California, San Diego, Department of Mechanical and Aerospace Engineering and Center for Energy Research,460 EBU-II, 9500 Gilman Drive, La Jolla, CA 92093-0438, United States
Received 11 May 2006; received in revised form 20 September 2006; accepted 4 December 2006Available online 22 January 2007
bstract
During injection in an inertial fusion energy (IFE) chamber, a direct-drive target is subject to heat loads from chamber walladiation and energy exchange from the chamber gas constituents. These heat loads can lead to the deuterium–tritium (DT)eaching its triple point temperature and even undergoing phase change, leading to unacceptable non-uniformity based on targethysics requirements for compression and ignition of the DT fuel pellets using multiple laser beams. A two-dimensional bubbleucleation mode was added to the previously presented thermo-mechanical model to help better define the design margin forirect-drive IFE targets. The new model was validated by comparison with analytical results for controlled cases. It was thensed to simulate heating experiments on DT targets conducted at the Los Alamos National Laboratory (LANL), where the 3Heresent in the DT due to tritium decay was found to affect the nucleation process.
The previous requirement for target survival was for the temperature of the DT to remain below triple point of DT (19.79 K).
f the existence of a melt layer does not violate the symmetry requirements on the target for successful implosion, the constraintould be relaxed by assuming a limit based on the avoidance of bubble nucleation. This study shows that the thresholds forelting and bubble nucleation are significantly different, allowing for extra margin in target survival under this assumption.2006 Elsevier B.V. All rights reserved.nge
a
eywords: IFE target survival; 3He bubble formation; DT phase cha
. Introduction
This study extends the research work at UCSD onirect-drive IFE target survival in particular in the
∗ Corresponding author. Tel.: +1 858 534 2983;ax: +1 858 822 2120.
E-mail addresses: [email protected],[email protected] (K.-J. Boehm).
oiotfspb
920-3796/$ – see front matter © 2006 Elsevier B.V. All rights reserved.doi:10.1016/j.fusengdes.2006.12.001
rea of phase change modeling [1–3]. The key basisf this research is the strict symmetry requirementsmposed by target physics for compression and ignitionf the deuterium–tritium (DT) fuel pellets using mul-iple laser beams. Wall radiation and energy exchange
rom the chamber gas to the target during injection canignificantly impact these symmetry requirements inarticular if phase change occurs. The phase changeehavior of DT targets is quite complex (e.g. the pres-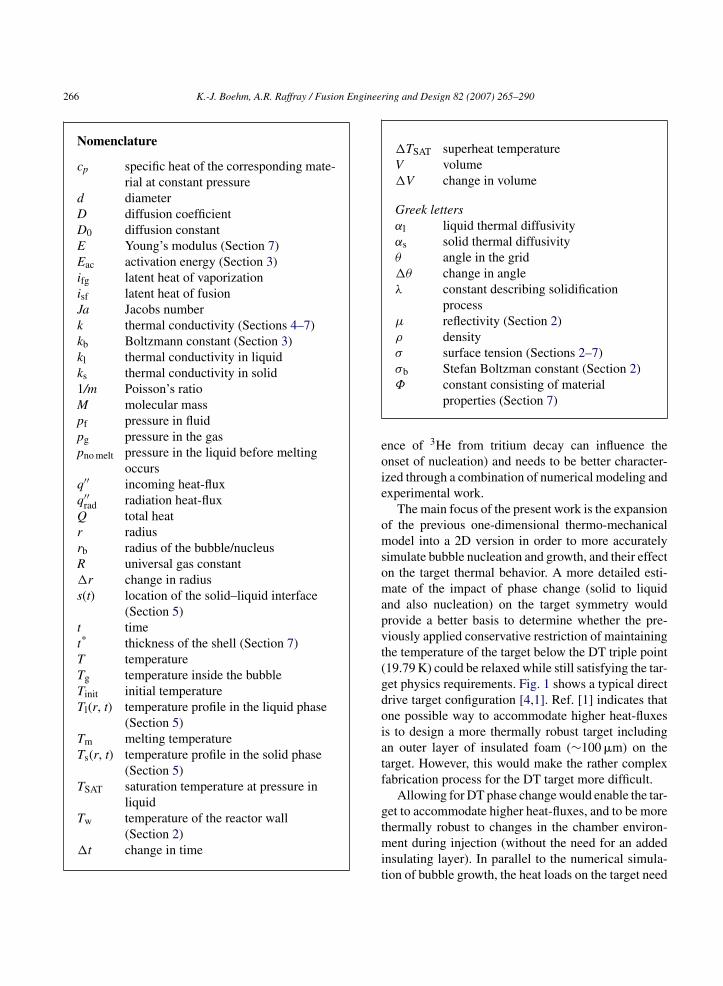
266 K.-J. Boehm, A.R. Raffray / Fusion Engineering and Design 82 (2007) 265–290
Nomenclature
cp specific heat of the corresponding mate-rial at constant pressure
d diameterD diffusion coefficientD0 diffusion constantE Young’s modulus (Section 7)Eac activation energy (Section 3)ifg latent heat of vaporizationisf latent heat of fusionJa Jacobs numberk thermal conductivity (Sections 4–7)kb Boltzmann constant (Section 3)kl thermal conductivity in liquidks thermal conductivity in solid1/m Poisson’s ratioM molecular masspf pressure in fluidpg pressure in the gaspno melt pressure in the liquid before melting
occursq′′ incoming heat-fluxq′′
rad radiation heat-fluxQ total heatr radiusrb radius of the bubble/nucleusR universal gas constant�r change in radiuss(t) location of the solid–liquid interface
(Section 5)t timet* thickness of the shell (Section 7)T temperatureTg temperature inside the bubbleTinit initial temperatureTl(r, t) temperature profile in the liquid phase
(Section 5)Tm melting temperatureTs(r, t) temperature profile in the solid phase
(Section 5)TSAT saturation temperature at pressure in
liquidTw temperature of the reactor wall
(Section 2)�t change in time
�TSAT superheat temperatureV volume�V change in volume
Greek lettersαl liquid thermal diffusivityαs solid thermal diffusivityθ angle in the grid�θ change in angleλ constant describing solidification
processμ reflectivity (Section 2)ρ densityσ surface tension (Sections 2–7)σb Stefan Boltzman constant (Section 2)
eoie
omsomapvt(gdoiatf
gtmit
Φ constant consisting of materialproperties (Section 7)
nce of 3He from tritium decay can influence thenset of nucleation) and needs to be better character-zed through a combination of numerical modeling andxperimental work.
The main focus of the present work is the expansionf the previous one-dimensional thermo-mechanicalodel into a 2D version in order to more accurately
imulate bubble nucleation and growth, and their effectn the target thermal behavior. A more detailed esti-ate of the impact of phase change (solid to liquid
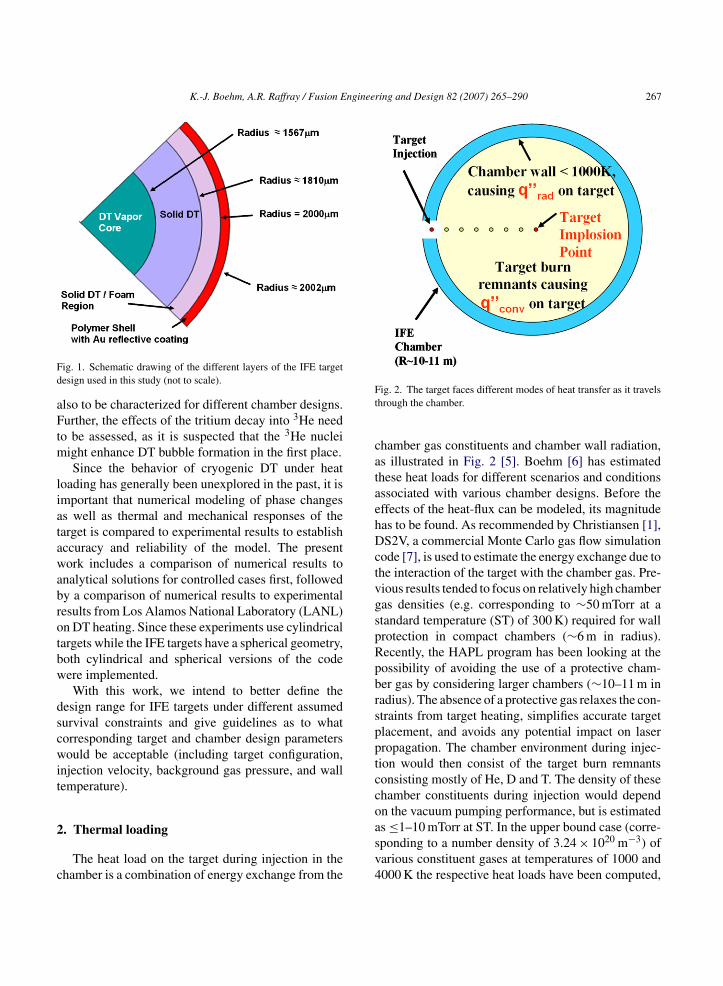
nd also nucleation) on the target symmetry wouldrovide a better basis to determine whether the pre-iously applied conservative restriction of maintaininghe temperature of the target below the DT triple point19.79 K) could be relaxed while still satisfying the tar-et physics requirements. Fig. 1 shows a typical directrive target configuration [4,1]. Ref. [1] indicates thatne possible way to accommodate higher heat-fluxess to design a more thermally robust target includingn outer layer of insulated foam (∼100 �m) on thearget. However, this would make the rather complexabrication process for the DT target more difficult.
Allowing for DT phase change would enable the tar-et to accommodate higher heat-fluxes, and to be more
hermally robust to changes in the chamber environ-ent during injection (without the need for an addednsulating layer). In parallel to the numerical simula-ion of bubble growth, the heat loads on the target need
K.-J. Boehm, A.R. Raffray / Fusion Engineering and Design 82 (2007) 265–290 267
Fd
aFtm
liatawabrotbw
dscwit
2
c
Ft
cataehDctvgspRpbrspptcco
ig. 1. Schematic drawing of the different layers of the IFE targetesign used in this study (not to scale).
lso to be characterized for different chamber designs.urther, the effects of the tritium decay into 3He need
o be assessed, as it is suspected that the 3He nucleiight enhance DT bubble formation in the first place.Since the behavior of cryogenic DT under heat
oading has generally been unexplored in the past, it ismportant that numerical modeling of phase changess well as thermal and mechanical responses of thearget is compared to experimental results to establishccuracy and reliability of the model. The presentork includes a comparison of numerical results to
nalytical solutions for controlled cases first, followedy a comparison of numerical results to experimentalesults from Los Alamos National Laboratory (LANL)n DT heating. Since these experiments use cylindricalargets while the IFE targets have a spherical geometry,oth cylindrical and spherical versions of the codeere implemented.With this work, we intend to better define the
esign range for IFE targets under different assumedurvival constraints and give guidelines as to whatorresponding target and chamber design parametersould be acceptable (including target configuration,
njection velocity, background gas pressure, and wallemperature).
. Thermal loading
The heat load on the target during injection in thehamber is a combination of energy exchange from the
asv4
ig. 2. The target faces different modes of heat transfer as it travelshrough the chamber.
hamber gas constituents and chamber wall radiation,s illustrated in Fig. 2 [5]. Boehm [6] has estimatedhese heat loads for different scenarios and conditionsssociated with various chamber designs. Before theffects of the heat-flux can be modeled, its magnitudeas to be found. As recommended by Christiansen [1],S2V, a commercial Monte Carlo gas flow simulation
ode [7], is used to estimate the energy exchange due tohe interaction of the target with the chamber gas. Pre-ious results tended to focus on relatively high chamberas densities (e.g. corresponding to ∼50 mTorr at atandard temperature (ST) of 300 K) required for wallrotection in compact chambers (∼6 m in radius).ecently, the HAPL program has been looking at theossibility of avoiding the use of a protective cham-er gas by considering larger chambers (∼10–11 m inadius). The absence of a protective gas relaxes the con-traints from target heating, simplifies accurate targetlacement, and avoids any potential impact on laserropagation. The chamber environment during injec-ion would then consist of the target burn remnantsonsisting mostly of He, D and T. The density of thesehamber constituents during injection would dependn the vacuum pumping performance, but is estimateds ≤1–10 mTorr at ST. In the upper bound case (corre-
ponding to a number density of 3.24 × 10²⁰ m−3) ofarious constituent gases at temperatures of 1000 and000 K the respective heat loads have been computed,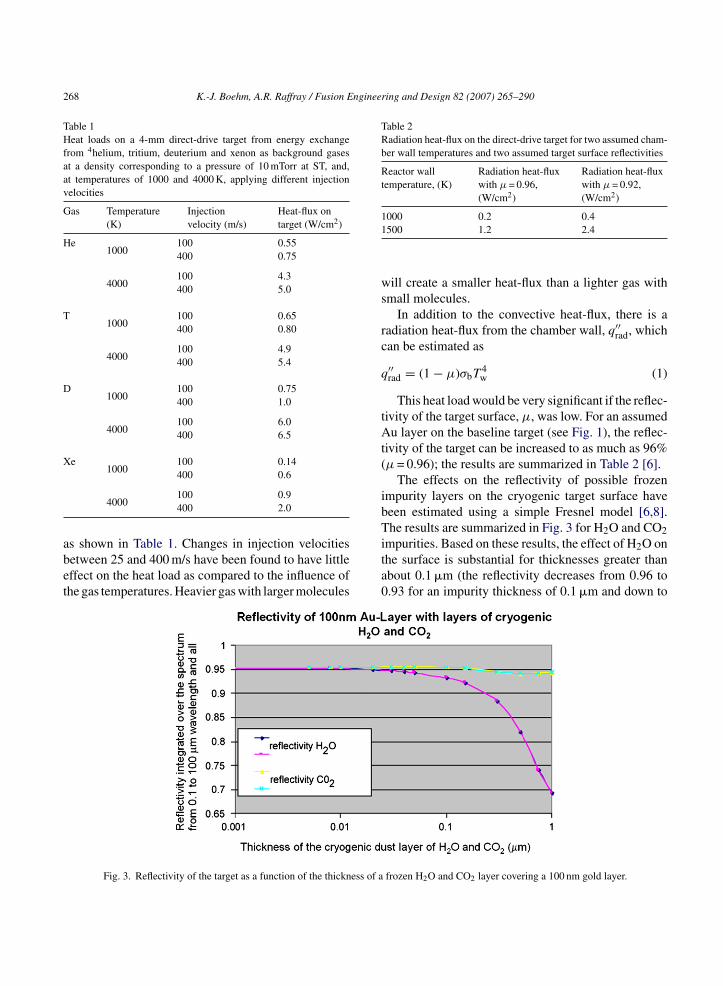
268 K.-J. Boehm, A.R. Raffray / Fusion Engineering and Design 82 (2007) 265–290
Table 1Heat loads on a 4-mm direct-drive target from energy exchangefrom 4helium, tritium, deuterium and xenon as background gasesat a density corresponding to a pressure of 10 mTorr at ST, and,at temperatures of 1000 and 4000 K, applying different injectionvelocities
Gas Temperature(K)
Injectionvelocity (m/s)
Heat-flux ontarget (W/cm2)
He1000
100 0.55400 0.75
4000100 4.3400 5.0
T1000
100 0.65400 0.80
4000100 4.9400 5.4
D1000
100 0.75400 1.0
4000100 6.0400 6.5
Xe1000
100 0.14
abet
Table 2Radiation heat-flux on the direct-drive target for two assumed cham-ber wall temperatures and two assumed target surface reflectivities
Reactor walltemperature, (K)
Radiation heat-fluxwith μ = 0.96,(W/cm2)
Radiation heat-fluxwith μ = 0.92,(W/cm2)
11
ws
rc
q
tAt(
ibT
400 0.6
4000100 0.9400 2.0
s shown in Table 1. Changes in injection velocitiesetween 25 and 400 m/s have been found to have littleffect on the heat load as compared to the influence ofhe gas temperatures. Heavier gas with larger molecules
ita0
Fig. 3. Reflectivity of the target as a function of the thickness of a
000 0.2 0.4500 1.2 2.4
ill create a smaller heat-flux than a lighter gas withmall molecules.
In addition to the convective heat-flux, there is aadiation heat-flux from the chamber wall, q′′
rad, whichan be estimated as
′′rad = (1 − μ)σbT
4w (1)
This heat load would be very significant if the reflec-ivity of the target surface, μ, was low. For an assumedu layer on the baseline target (see Fig. 1), the reflec-
ivity of the target can be increased to as much as 96%μ = 0.96); the results are summarized in Table 2 [6].
The effects on the reflectivity of possible frozenmpurity layers on the cryogenic target surface haveeen estimated using a simple Fresnel model [6,8].he results are summarized in Fig. 3 for H2O and CO2
mpurities. Based on these results, the effect of H2O onhe surface is substantial for thicknesses greater thanbout 0.1 �m (the reflectivity decreases from 0.96 to.93 for an impurity thickness of 0.1 �m and down to
frozen H2O and CO2 layer covering a 100 nm gold layer.
ngineer
0e01td
le
3
hdfrLrfeb
3
etspatincllhtrspsd
p
ltE
�
am
3
hlll
3
4etmatednobn
fDa[
tm[i
K.-J. Boehm, A.R. Raffray / Fusion E
.76 for a thickness of 1 �m). However, for CO2 theffect is much smaller, the reflectivity decreasing from.96 to about 0.94 for an impurity layer thickness of�m. These results suggest that extra care must be
aken to avoid unwanted impurity layers on the targeturing handling prior to injection.
Adding the effects of convective and radiative heatoads, the total heat-flux on the target during injection isstimated to be in the broad range of 0.75–7.5 W/cm2.
. 3He bubble formation
The effect of helium in solids, especially in metalsas been analyzed by many scientists in the past twoecades. Of interest here is the effect of 3He resultingrom tritium decay on bubble nucleation in DT and itselevance to IFE target survival. Observations at theos Alamos National Laboratories [9] suggest a close
elationship between the concentration of 3He in theuel pellet and the appearance of bubbles during heatingxperiments. The present section explains the physicsehind these observations.
.1. Heterogeneous nucleation
Liquid to vapor phase change in the DT target isxpected to happen according to classic nucleationheory. In this theory, a nucleus of a certain size isurrounded by a liquid of a certain pressure and tem-erature. If the temperature of the liquid is increasedbove the saturation temperature at the pressure insidehe bubble, a thermodynamically unstable equilibriums created, resulting in a bubble to grow out of theucleus. If the pre-existing nucleus is created by non-ondensable gas bubbles held in suspension in theiquid, as they do in the case of 3He accumulation in theattice (see Section 3.2), the nucleation mode is calledeterogeneous nucleation [10,11]. Collier [10] stateshat the presence of dissolved gas reduces the superheatequired to grow a bubble out of a nucleus of a certainize. Eq. (2) relates the pressure inside the bubble to theressure in the liquid. We observe an increase in pres-
ure in the bubble as compared to the liquid pressureue to surface tension:g = pf + 2σ
rb(2)
a
dt
ing and Design 82 (2007) 265–290 269
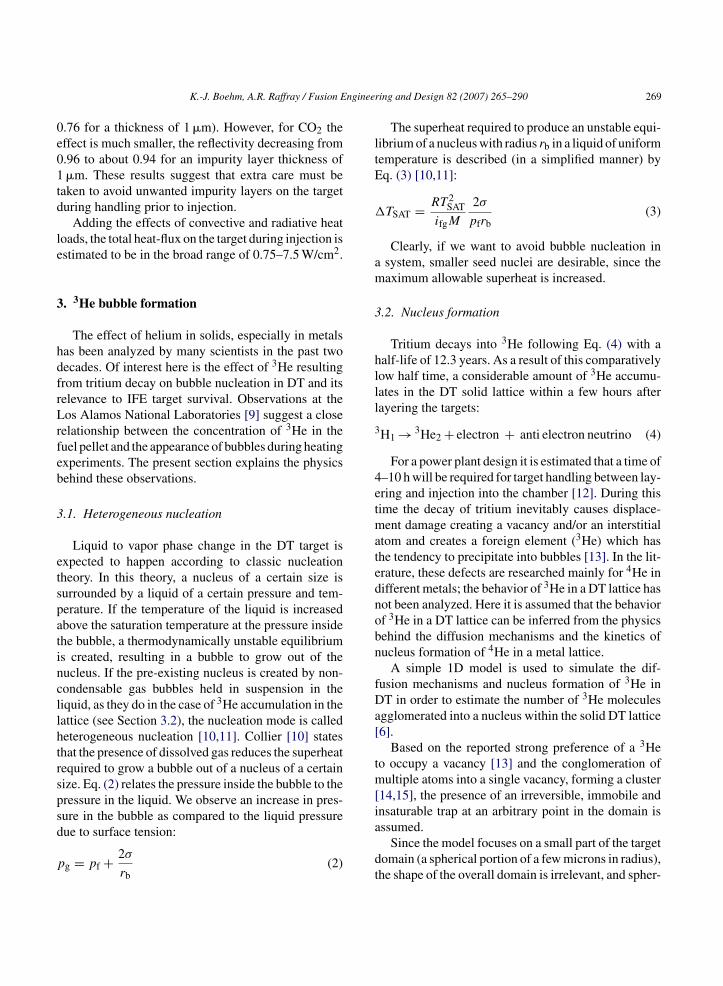
The superheat required to produce an unstable equi-ibrium of a nucleus with radius rb in a liquid of uniformemperature is described (in a simplified manner) byq. (3) [10,11]:
TSAT = RT 2SAT
ifgM
2σ
pfrb(3)
Clearly, if we want to avoid bubble nucleation insystem, smaller seed nuclei are desirable, since theaximum allowable superheat is increased.
.2. Nucleus formation
Tritium decays into 3He following Eq. (4) with aalf-life of 12.3 years. As a result of this comparativelyow half time, a considerable amount of 3He accumu-ates in the DT solid lattice within a few hours afterayering the targets:
H1 → 3He2 + electron + anti electron neutrino (4)
For a power plant design it is estimated that a time of–10 h will be required for target handling between lay-ring and injection into the chamber [12]. During thisime the decay of tritium inevitably causes displace-
ent damage creating a vacancy and/or an interstitialtom and creates a foreign element (3He) which hashe tendency to precipitate into bubbles [13]. In the lit-rature, these defects are researched mainly for 4He inifferent metals; the behavior of 3He in a DT lattice hasot been analyzed. Here it is assumed that the behaviorf 3He in a DT lattice can be inferred from the physicsehind the diffusion mechanisms and the kinetics ofucleus formation of 4He in a metal lattice.
A simple 1D model is used to simulate the dif-usion mechanisms and nucleus formation of 3He inT in order to estimate the number of 3He molecules
gglomerated into a nucleus within the solid DT lattice6].
Based on the reported strong preference of a 3Heo occupy a vacancy [13] and the conglomeration of
ultiple atoms into a single vacancy, forming a cluster14,15], the presence of an irreversible, immobile andnsaturable trap at an arbitrary point in the domain is
ssumed.Since the model focuses on a small part of the targetomain (a spherical portion of a few microns in radius),he shape of the overall domain is irrelevant, and spher-
270 K.-J. Boehm, A.R. Raffray / Fusion Engineer
Table 3Different values for the temperature-dependent diffusion coefficientof hydrogen species, from literature data and Eq. (5)
Silvera [16](H2)
Souers [17](H2)
Souers [17](DT)
E/k (K) 200 ± 10 191 310DD
ib
otitbe
dtstg
Ttccl
D
tat
cieoan
0 (cm2/s) 3 × 10⁻³ 1.4 × 10⁻³ 3 × 10⁻⁴
(18 K) (cm2/s) n.a. n.a 9.9 × 10⁻¹²
cal coordinates are applied to the small target volumeeing modeled.
The model combines the effects of an increase inverall 3He-concentration due to the tritium decay andhe boundary conditions of zero concentration on thennermost point of the domain (since we assume thathe atom jumps into the vacancy, and does not comeack out) and zero concentration gradient at the outerdge of the domain.
A key parameter in estimating the time for 3He toiffuse through the domain and conglomerate to a clus-
er or nucleus is the diffusion coefficient of 3He in theolid DT lattice. In absence of data for 3He diffusion inhe literature, the values for self diffusion of the hydro-en species are used as rough estimates, as shown inta
a
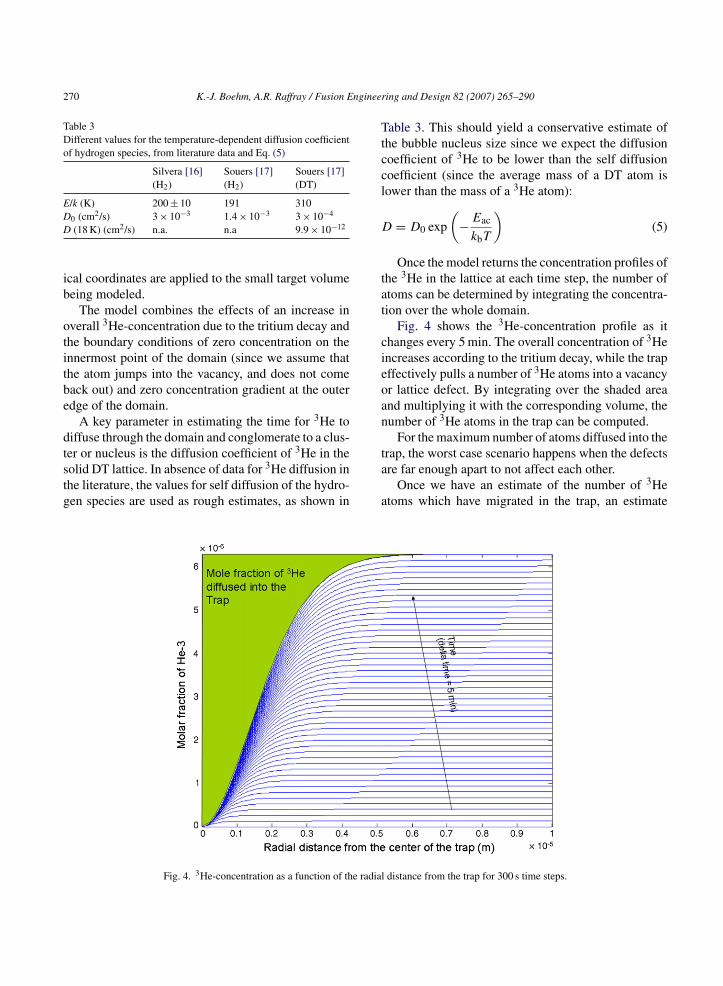
Fig. 4. 3He-concentration as a function of the radial
ing and Design 82 (2007) 265–290
able 3. This should yield a conservative estimate ofhe bubble nucleus size since we expect the diffusionoefficient of 3He to be lower than the self diffusionoefficient (since the average mass of a DT atom isower than the mass of a 3He atom):
= D0 exp
(− Eac
kbT
)(5)
Once the model returns the concentration profiles ofhe 3He in the lattice at each time step, the number oftoms can be determined by integrating the concentra-ion over the whole domain.
Fig. 4 shows the 3He-concentration profile as ithanges every 5 min. The overall concentration of 3Hencreases according to the tritium decay, while the trapffectively pulls a number of 3He atoms into a vacancyr lattice defect. By integrating over the shaded areand multiplying it with the corresponding volume, theumber of 3He atoms in the trap can be computed.
For the maximum number of atoms diffused into the
rap, the worst case scenario happens when the defectsre far enough apart to not affect each other.Once we have an estimate of the number of 3Hetoms which have migrated in the trap, an estimate
distance from the trap for 300 s time steps.
K.-J. Boehm, A.R. Raffray / Fusion Engineering and Design 82 (2007) 265–290 271
F oms creh
om
wficatapds
arts
bnbnato
t
ec
4
mbaqamacwtlibbwf
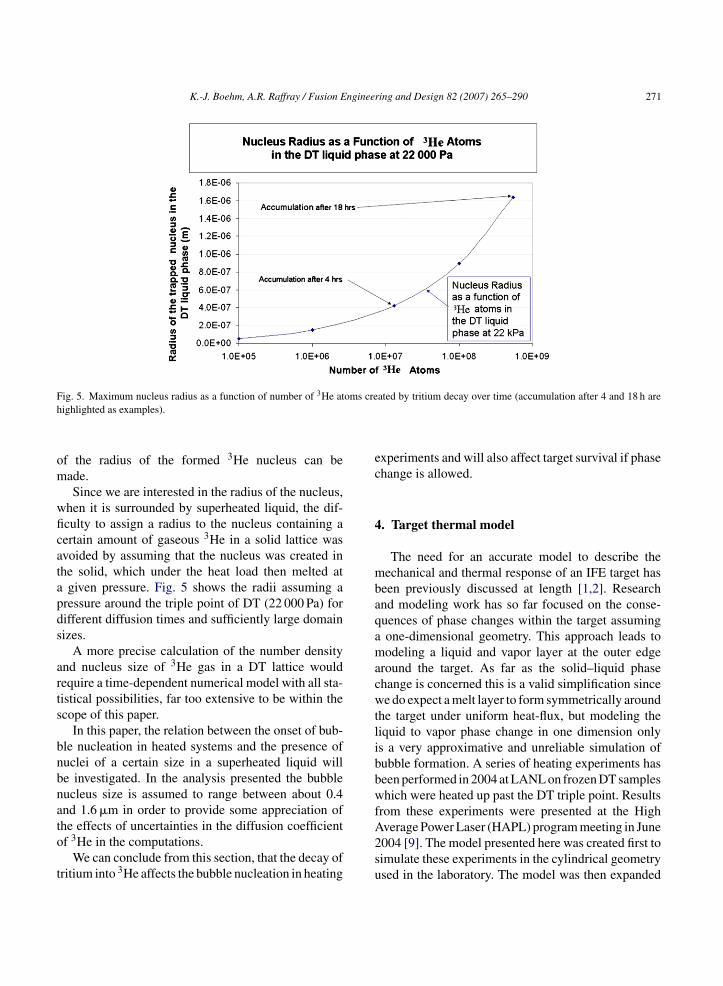
ig. 5. Maximum nucleus radius as a function of number of 3He atighlighted as examples).
f the radius of the formed 3He nucleus can beade.Since we are interested in the radius of the nucleus,
hen it is surrounded by superheated liquid, the dif-culty to assign a radius to the nucleus containing aertain amount of gaseous 3He in a solid lattice wasvoided by assuming that the nucleus was created inhe solid, which under the heat load then melted at
given pressure. Fig. 5 shows the radii assuming aressure around the triple point of DT (22 000 Pa) forifferent diffusion times and sufficiently large domainizes.
A more precise calculation of the number densitynd nucleus size of 3He gas in a DT lattice wouldequire a time-dependent numerical model with all sta-istical possibilities, far too extensive to be within thecope of this paper.
In this paper, the relation between the onset of bub-le nucleation in heated systems and the presence ofuclei of a certain size in a superheated liquid wille investigated. In the analysis presented the bubbleucleus size is assumed to range between about 0.4nd 1.6 �m in order to provide some appreciation of
he effects of uncertainties in the diffusion coefficientf 3He in the computations.We can conclude from this section, that the decay ofritium into 3He affects the bubble nucleation in heating
A2su
ated by tritium decay over time (accumulation after 4 and 18 h are
xperiments and will also affect target survival if phasehange is allowed.
. Target thermal model
The need for an accurate model to describe theechanical and thermal response of an IFE target has
een previously discussed at length [1,2]. Researchnd modeling work has so far focused on the conse-uences of phase changes within the target assumingone-dimensional geometry. This approach leads toodeling a liquid and vapor layer at the outer edge
round the target. As far as the solid–liquid phasehange is concerned this is a valid simplification sincee do expect a melt layer to form symmetrically around
he target under uniform heat-flux, but modeling theiquid to vapor phase change in one dimension onlys a very approximative and unreliable simulation ofubble formation. A series of heating experiments haseen performed in 2004 at LANL on frozen DT sampleshich were heated up past the DT triple point. Results
rom these experiments were presented at the High
verage Power Laser (HAPL) program meeting in June004 [9]. The model presented here was created first toimulate these experiments in the cylindrical geometrysed in the laboratory. The model was then expanded
2 ngineer
ta
4
rttduithwa(cosvbaottl
Fdas(t
td
4
hadannTAsptab2
uh
72 K.-J. Boehm, A.R. Raffray / Fusion E
o more accurately simulate the spherical geometry ofn IFE DT target.
.1. The setup of the LANL experiments
The series of experiments relevant to this study wereeferred to as “direct-heating of solid DT layers” byhe authors of the June 2004 HAPL presentation [9]. Inhat series of tests, a hollow cylindrical target of 4 mmiameter was exposed to direct heating from the outsidesing an electrical coil. The incoming heat-flux wasntended to be 1 W/cm2, but was estimated to have upo 50% error margin due to the complicated setup of theeating coils (see Fig. 6). Several sets of experimentsere conducted using different equilibrium temper-
tures (16, 17, 18, and 19 K) and equilibrium times4, 18 h). Pictures taken during the 100 ms heat pulselearly show bubble nucleation starting at differentnset times, with different bubble densities and bubbleizes starting on the outside layer of the target. Obser-ations from that study indicate that there are relationsetween the equilibrium time and the bubble densitys well as between the equilibrium time and the onset
f bubble growth. We suspect that the foundation forhese relations lies in the time-dependent buildup ofhe 3He-concentration. These conjectures will be ana-yzed by a 2D numerical heat transfer model adaptingig. 6. Experimental setup used for the LANL experiments. Theark blue rectangles represent the cross-section of the DT cylinderround which the heating coils are mounted. Pictures of the DT testample during the experiment are taken along the axis of symmetry.For interpretation of the references to colour in this figure legend,he reader is referred to the web version of the article.)
dtt
db
amd
uii
aaf
q
ing and Design 82 (2007) 265–290
he experimental geometry and the results from the 1Diffusion model from the previous chapter.
.2. From 1D to 2D
Since the LANL experiments impose a constanteat-flux symmetrically around the cylindrical target,one-dimensional model can accurately be used to
escribe the behavior of the target until bubble nucle-tion occurs. As discussed in Section 3, bubbles willucleate if the liquid is sufficiently superheated and if aucleus of a certain size is present in the liquid [10,11].hese nuclei can occur due to the tritium decay to 3He.ssuming a nucleus of a certain size to be present, the
uperheat required for a bubble to nucleate can be com-uted. After using a one-dimensional model to simulatehe heat transfer until that superheat has been reachedt a given distance from the outer edge, the effect ofubble nucleation is then simulated by switching to aD model.
For simplicity, the heat conduction and solid to liq-id phase change can be modeled in 1D for a uniformeat-flux case (since the expansion into the secondimension only increases the computing time requiredo achieve results), using the cylindrical heat conduc-ion equation (Eq. (6) [18]):
δT
δt= 1
ρcp(T )
[kδ2T
δr2 + δT
δr
(δk
δr+ k
r
)](6)
Note that the only difference with the spherical coor-inate system is that the last term in Eq. (6) is multipliedy two in the spherical case.
To account for the rapid change in thermal propertiest temperatures in the cryogenic region, and to properlyodel the phase change, Eq. (6) includes temperature-
ependent properties.This system of equations can be solved efficiently
sing the Thomas algorithm to second order accuracyn space and first order accuracy in time with no stabil-ty restrictions [19].
The boundary conditions imposed in this case areconstant heat-flux on the outside and zero gradient
t the inner radius. The outer edge boundary condition
ollows Eq. (7):′′ = −k
(δT
δr
)(7)

ngineer
ama([
neaAtt
b
csctomtisd
ib
4
ctIfrmbt
fi
tfteE
shttU
idntlwsa(aT3
tssAew
sristolofif
K.-J. Boehm, A.R. Raffray / Fusion E
To model the solid to liquid phase change, thepparent cp method is adapted from the previousodel, whereby the latent heat of fusion is included by
djusting cp over a small but finite temperature rangeassumed here as 0.2 K over the triple point temperature1]).
Once it comes to modeling bubble growth, weeed to switch to a two-dimensional model. The mostfficient way to solve the 2D model in this case isn iterative scheme following the Gauss–Red–Blacklgorithm [19]. This scheme converges quickly since
he numerical solution does not vary largely from oneime step to another.
The heat diffusion equation to be solved is shownelow (Eq. (8)):
δT
δt= 1
ρcp(T )
[kδ2T
δr2 + δT
δr
(δk
δr+ k
r
)
+ 1
r2
(kδ2T
δθ2 + δT
δθ
δk
δθ
)](8)
A stretched grid is implemented in the code to cir-umvent the problem of having a small enough gridpacing on the outer surface of the target (where phasehanges occur, and bubble growth and steep tempera-ure gradients are observed) while keeping the numberf total grid points within a reasonable computationalargin. A hyperbolic tangent function is used to stretch
he grid in radial direction. The bubble will be modeledn the center of the pie-shaped domain; a hyperbolicine function is used to stretch the grid in angularirection.
The imposed boundary conditions remain the samen the radial direction. In the axial direction reflectiveoundary conditions are used.
.3. Modeling a bubble
Modeling the bubble nucleation and growth is ahallenging task since the bubble is spherical in geome-ry and it is off-center in the overall cylindrical domain.t has been shown [11] that bubble growth in the time-rame and size-frame relevant to this study is heat-flux
estricted, which is convenient for our heat diffusionodel. According to Van Stralen and Cole [11], theubble grows exactly as fast as heat can be delivered tohe liquid–vapor interface, where it is used to account
ahrg
ing and Design 82 (2007) 265–290 273
or the latent heat required by the mass flux of vapornto the bubble.
Assuming that the vapor inside the bubble is athermodynamic equilibrium, we can assume a uni-orm temperature inside the bubble corresponding tohe saturation temperature at the given bubble pressure,quivalent to the pressure of the surrounding liquid (seeq. (2)).
Knowing the temperatures in the bubble and in theurrounding liquid, the bubble can be represented by aeat sink within the domain. When the temperature inhe liquid is higher than the temperature in the bubble,hermal energy is drawn to the liquid vapor interface.nder those conditions the bubble is expected to grow.Numerically, we can add a heat sink term by assign-
ng a certain temperature to an arbitrary point in theomain, which is lower than the temperature of theeighboring points. Physically, by choosing the loca-ion of such a point in the grid, we can determine theocation of the nucleus and, as such, the point fromhich the bubble will start growing. Once the neces-
ary superheat to grow a bubble out of a nucleus ofcertain size is reached, the temperature at that point
inside the bubble) drops to the saturation temperaturet the corresponding pressure, starting the heat sink.his is justifiable since we assume a nucleus filled withHe to be present in the superheated liquid. Once theemperature in the surrounding liquid is higher than theaturation temperature at the pressure in the bubble, DTtarts evaporating into the bubble, causing it to grow.s the bubble grows the pressure in the bubble drops
ven further (see Eq. (2)), lowering the temperature asell.The energy which the heat sink absorbs will be con-
erved in the system in the form of the latent heatequired to evaporate the additional DT in the grow-ng bubble. As such, the energy flowing into the heatink must be tracked and equated to the energy requiredo evaporate sufficient DT for the bubble to grow fromne time step to another. This energy can be calcu-ated using the heat-flux (from Eq. (9)) and the areaver which this heat-flux acts (from Eq. (10)). Therst term in the brackets of Eq. (10) is the heat trans-er in the radial direction, acting over the change in
ngular direction while the second term represents theeat transferred in angular direction over the change inadius. Note that the subscripts in Eq. (10) describe theeometric location (i in radial and j in angular direction)
2 ngineering and Design 82 (2007) 265–290
w
q
tevwiroism
acbt
Fig. 8. Schematic approximation of how a bubble is represented intfd
ca
Fd
74 K.-J. Boehm, A.R. Raffray / Fusion E
hile the superscripts describe the temporal position:
′′ = k
(δT
δr+ 1
r
δT
δθ
)(9)
Q
unit height= k�t
((T n+1
i+1,j − T n+1i,j
�ri
)(�θjri)
+(
T n+1i,j+1 − T n+1
i,j
ri�θj
)(�ri)
)(10)
Because of the discretized nature of our domain,he bubble is simulated by the available grids (with theffective bubble radius estimated from the bubble gridolume) and bubble growth can only be modeled step-ise. We propose two modes of bubble growth, shown
n Fig. 7. The bubble growth follows the grid eitheradially symmetric outward (left) or inward from theuter edge of the domain as shown on the right. Morenvolved modes could be implemented to model a morepherical shape, but the presented results used these twoodes.Note that all computations in the cylindrical domain
re done per unit height. The area that each ‘bubble’overs on the grid can be calculated for each step ofubble growth. The energy necessary (per unit height)o grow the bubble from one step to the next can be
ncpt
ig. 7. Schematic showing the two proposed modes of bubble growth. On tomain. On the right, the bubble nucleus is assumed to be close to the outer
he overall domain. Notice that the heat transfer into the bubble comesrom integrating the local heat-flux in both the radial and angularirections.
alculated from the latent heat of evaporation of thedditional DT required for the bubble to grow to its
ext discrete step. The total heat flow into the bubblean be estimated by integrating the heat-flux along theerimeter of the bubble (see Fig. 8). Then, by equatinghe heat conduction to the bubble over a given time tohe left, the bubble grows radially from a point in the middle of theedge of the cylinder, and the bubble grows inward from the edge.
ngineer
tts
s
tm
flutl
2rtrbtdtts
upb
4m
ccIiflsbihwiflagw
bp
tmbldtss
clidptnttbcF
umunfrom ideal physics in cases where there is a substan-tial temperature difference between the liquid on eachside of the bubble, and one needs to be vigilant whenapplying this assumption to specific cases.
K.-J. Boehm, A.R. Raffray / Fusion E
he energy required for bubble growth, we can estimatehe required time step to move from one discrete bubbleize to the next.
The numerical simulation consists of the followingteps.
First, the grid is created. Since we have a fixed mesh,he discrete bubble sizes that will be represented by the
odel can be determined.Next, the 1D model is run with a uniform heat-
ux applied to the DT causing a melt layer formationntil the required superheat is reached at the arbi-rarily selected point where the bubble nucleus isocated.
The calculations then proceed by switching to theD model. This model first calculates the energyequired for bubble growth from one discrete time stepo the next. An iterative scheme is then used to find theight time increment for this discrete bubble growthased on conservation of energy in the system. Oncehe time step is found, the bubble grows to the nextiscrete step, while the temperatures of all points inhe new bubble are adjusted to the saturation tempera-ure of the pressure in the bubble, creating a larger heatink.
Several additional factors must be considered whensing this approach to better understand how it com-ares to the ‘real physics’ of bubble nucleation, as wille discussed in the following sub-section.
.4. Approximations of the bubble nucleationodel
The first problem we encounter derives from the dis-retized (step-wise) growth of the bubble we model asompared to the smooth, gradual growth in real physics.n the model, a heat sink is applied on the domain caus-ng steep gradients around the sink. These gradientsatten over the time step according to the heat diffu-ion equation. Subsequently, the heat transfer into theubble slows down as the profile relaxes. The problems in deciding which profile to use when computing theeat-flux into the bubble. This profile will be some-here between the one immediately after the heat sink
s imposed at the beginning of the time step and the
atter one at the end of the time step. Both profilesre artificial creations originating from the step-wiserowth of the bubble. For the purpose of this model,e decided to compute the heat flow into the bubbleFg
ing and Design 82 (2007) 265–290 275
ased on an average profile between the initial and finalrofiles.
The second problem to be handled also results fromhe step-wise growth and concerns the conservation of
ass in the system. The density of the vapor in the bub-le is about 1000 times lower than the density of theiquid. By creating the bubble, the volume of the wholeomain increases. For small bubbles in a large domain,his increase in volume is negligible, but it imposesome limitations on the model for larger bubbleizes.
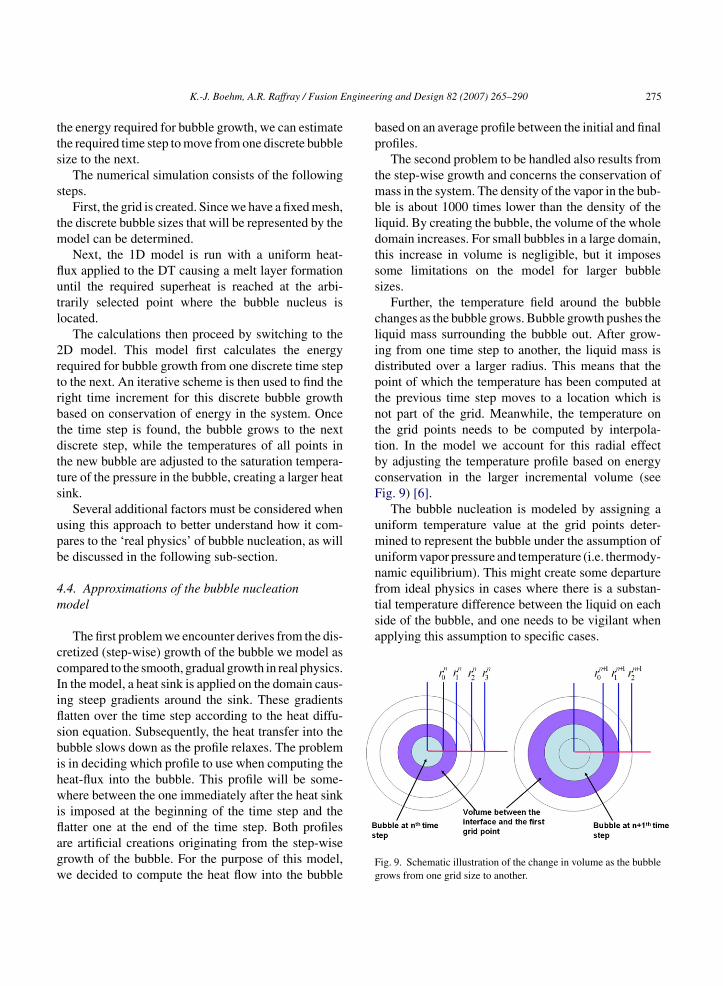
Further, the temperature field around the bubblehanges as the bubble grows. Bubble growth pushes theiquid mass surrounding the bubble out. After grow-ng from one time step to another, the liquid mass isistributed over a larger radius. This means that theoint of which the temperature has been computed athe previous time step moves to a location which isot part of the grid. Meanwhile, the temperature onhe grid points needs to be computed by interpola-ion. In the model we account for this radial effecty adjusting the temperature profile based on energyonservation in the larger incremental volume (seeig. 9) [6].
The bubble nucleation is modeled by assigning aniform temperature value at the grid points deter-ined to represent the bubble under the assumption of
niform vapor pressure and temperature (i.e. thermody-amic equilibrium). This might create some departure
ig. 9. Schematic illustration of the change in volume as the bubblerows from one grid size to another.
2 ngineer
4
du
tfE
q
Fsir
boi
tp
Q
5
e
76 K.-J. Boehm, A.R. Raffray / Fusion E
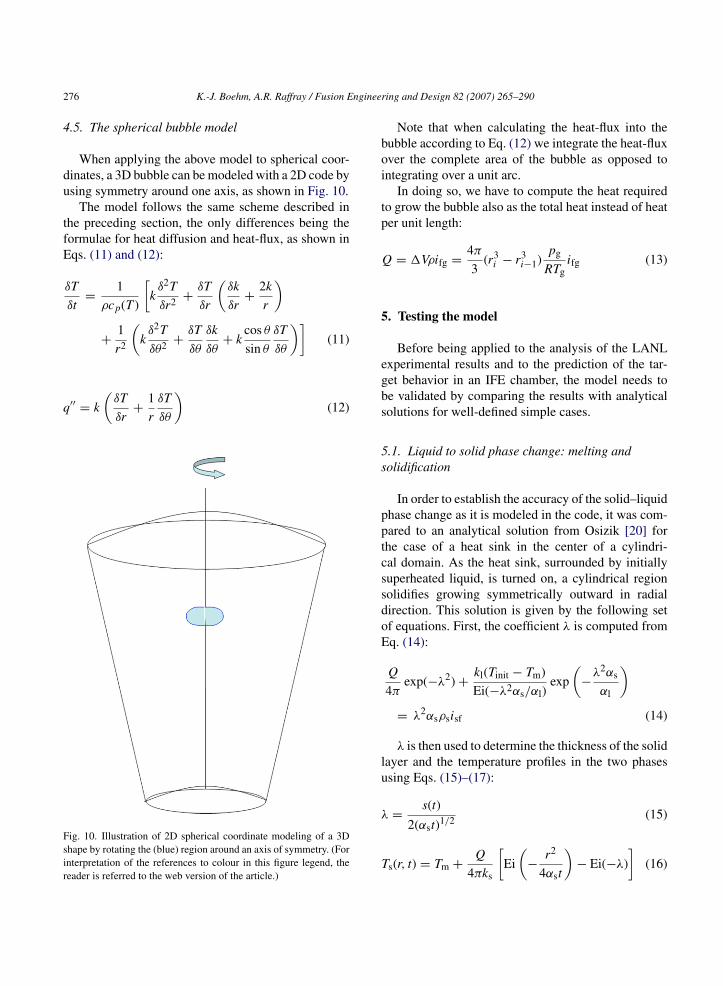
.5. The spherical bubble model
When applying the above model to spherical coor-inates, a 3D bubble can be modeled with a 2D code bysing symmetry around one axis, as shown in Fig. 10.
The model follows the same scheme described inhe preceding section, the only differences being theormulae for heat diffusion and heat-flux, as shown inqs. (11) and (12):
δT
δt= 1
ρcp(T )
[kδ2T
δr2 + δT
δr
(δk
δr+ 2k
r
)
+ 1
r2
(kδ2T
δθ2 + δT
δθ
δk
δθ+ k
cos θ
sin θ
δT
δθ
)](11)
′′ = k
(δT
δr+ 1
r
δT
δθ
)(12)
ig. 10. Illustration of 2D spherical coordinate modeling of a 3Dhape by rotating the (blue) region around an axis of symmetry. (Fornterpretation of the references to colour in this figure legend, theeader is referred to the web version of the article.)
gbs
5s
pptcssdoE
lu
λ
T
ing and Design 82 (2007) 265–290
Note that when calculating the heat-flux into theubble according to Eq. (12) we integrate the heat-fluxver the complete area of the bubble as opposed tontegrating over a unit arc.
In doing so, we have to compute the heat requiredo grow the bubble also as the total heat instead of heater unit length:
= �Vρifg = 4π
3(r3
i − r3i−1)
pg
RTgifg (13)
. Testing the model
Before being applied to the analysis of the LANLxperimental results and to the prediction of the tar-et behavior in an IFE chamber, the model needs toe validated by comparing the results with analyticalolutions for well-defined simple cases.
.1. Liquid to solid phase change: melting andolidification
In order to establish the accuracy of the solid–liquidhase change as it is modeled in the code, it was com-ared to an analytical solution from Osizik [20] forhe case of a heat sink in the center of a cylindri-al domain. As the heat sink, surrounded by initiallyuperheated liquid, is turned on, a cylindrical regionolidifies growing symmetrically outward in radialirection. This solution is given by the following setf equations. First, the coefficient λ is computed fromq. (14):
Q
4πexp(−λ2) + kl(Tinit − Tm)
Ei(−λ2αs/αl)exp
(−λ2αs
αl
)
= λ2αsρsisf (14)
λ is then used to determine the thickness of the solidayer and the temperature profiles in the two phases
sing Eqs. (15)–(17):= s(t)
2(αst)1/2 (15)
s(r, t) = Tm + Q
4πks
[Ei
(− r2
4αst
)− Ei(−λ)
](16)

K.-J. Boehm, A.R. Raffray / Fusion Engineering and Design 82 (2007) 265–290 277
F he tempp
T
wn
p
Fp
ig. 11. Comparison of modeling results with analytical results for trocess.
l(r, t) = Tinit − Tinit − Tm2 Ei
(− r2 )
(17)
Ei(−λ αs/αl) 4αlthere Ei is the exponential integral and exp the expo-ential function.
fp
b
ig. 12. Comparison of modeling results with analytical results for the time-rocess.
erature profiles at two selected times for the example solidification
Figs. 11 and 12 show plots of example temperaturerofiles following Eqs. (15) and (16) for selected times
or a given heat sink strength and of the correspondingrofiles from the modeling results.Despite some approximations in applying theoundary conditions on both sides in the model, the
dependent thickness of the solid layer for the example solidification
2 ngineer
mq
5n
gtistto
datfel
b
ir
ffsaiiihtg
bsu
o[a
r
J
e
α
r
l�
ρ
w
•
•
•
5
stt
78 K.-J. Boehm, A.R. Raffray / Fusion E
odel predictions reproduce the analytical solutionsuite well.
.2. Liquid to vapor phase change: bubbleucleation and growth
According to Van Stralen and Cole [11], bubblerowth can be divided into three different stages. Inhe first stage (initial mode, t → 0), the bubble growths restricted by hydrodynamic inertia effects. In thistage the bubble growth is linear with time, accordingo the Rayleigh solution. As the bubble grows, it haso accelerate the surrounding liquid pushing it radiallyutward.
In the second stage (asymptotic mode, t → ∞), theescription of the bubble growth can be simplified toheat diffusion model. The bubble growth is propor-
ional to the square root of time. The bubble grows asast as the heat required to grow the bubble can be deliv-red to the interface, where it is used to evaporate theiquid.
The third stage is a transient stage, which lies inetween the previously mentioned modes.
For the time scale and bubble sizes we are interestedn, we can determine that the bubble growth is heat-fluxestricted [11].
From Ref. [11], bubble growth is inertia governedor short times (up to ∼10−5 s) and heat-flux governedor longer times. For the case of interest here, the timecale is of the order of 10−3 s, and it is reasonable tossume that for the time scale and bubble sizes we arenterested in, we can determine that the bubble growths heat-flux restricted. As discussed above, we can eas-ly model this scenario, since we are already simulatingeat diffusion in our model; as a result, we can usehe information from the code and apply it to bubblerowth.
Let us start by examining the behavior of vaporubbles during nucleate boiling: the growth of a free,pherical vapor bubble in a uniformly superheated liq-id of homogeneous composition.
Following the derivation from the Bosnjakovic The-ry for Isobaric Heat Diffusion Controlled Growth
11], the bubble behavior can be described by Eqs. (18)nd (19):b(t) ≈ 2Ja(αlt
π
)0.5(18)
gttd
ing and Design 82 (2007) 265–290
a = ρliquidcp,liquid
ρgasifg�TSAT (19)
Using the definition for the thermal diffusivity, wexpand Eq. (18) to Eq. (20):
l =(
k
ρcp
)liquid
b(t) ≈ kl�TSAT
ρgasifg√
αlπ2(t)0.5 (20)
The following values are used for this calcu-ation (from Souers [17]): αl = 7.8 × 10⁻⁸ m2/s;
TSAT = 2.00 K; kl = 0.1 W/m K; ifg = 1360 J/mol;gas = 133 mol/m3.
For these calculations, the following assumptionsere implemented in the code:
The liquid temperature in the whole domain is ini-tially at 22 K (�TSAT = 2.00 K).The temperature in the bubble is 20.00 K at all times.In applying this boundary condition, we neglect theincrease in temperature due to the increase in pres-sure by surface tension effects (Eq. (2)). The effectof the pressure and temperature increase can beimplemented in the numerical code for experimen-tal simulations, but will be omitted here to model theanalytical solution. The bubble temperature choiceis also consistent with our assumption of changing cp
over a discrete temperature range to model the latentheat of fusion (between 19.79 and 19.99 K [1]).The density of the gas is computed by using theideal gas law and is approximated to 133 mol/m3.In the actual case, as the pressure and the tem-perature inside the bubble change, the gas densitywill follow these changes according to the ideal gaslaw.
.3. Results for cylindrical model (per unit height)
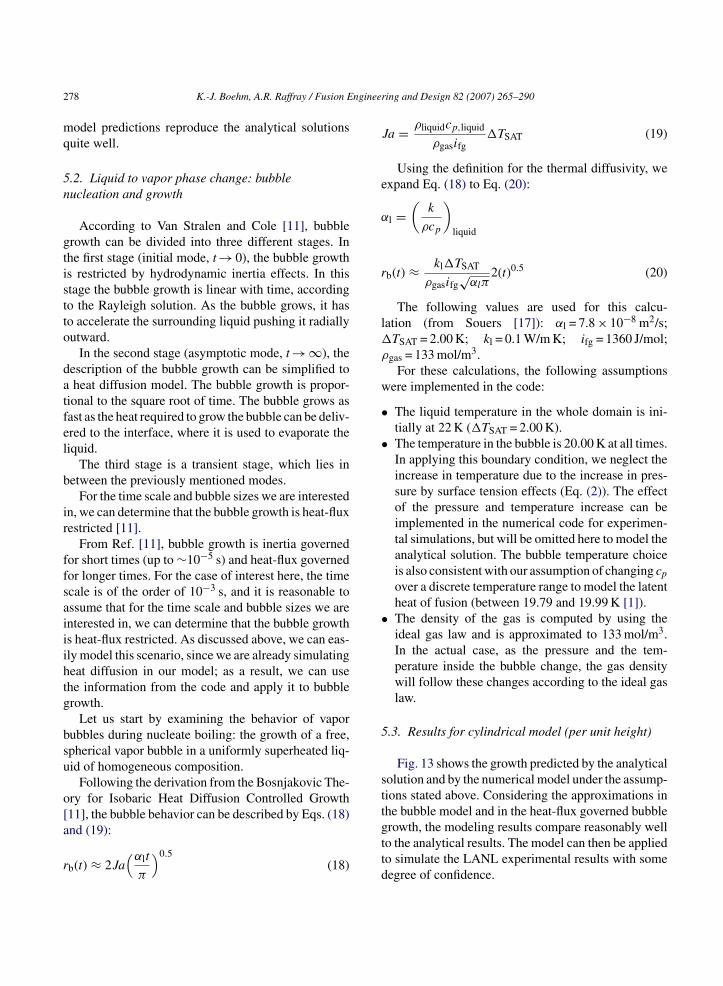
Fig. 13 shows the growth predicted by the analyticalolution and by the numerical model under the assump-ions stated above. Considering the approximations inhe bubble model and in the heat-flux governed bubble
rowth, the modeling results compare reasonably wello the analytical results. The model can then be appliedo simulate the LANL experimental results with someegree of confidence.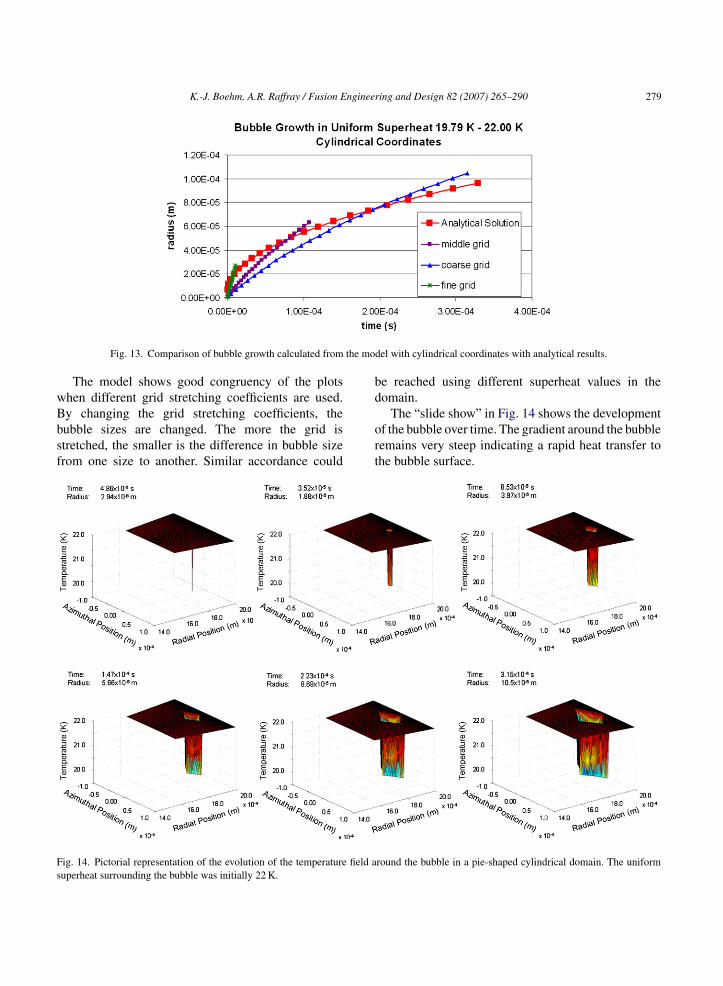
K.-J. Boehm, A.R. Raffray / Fusion Engineering and Design 82 (2007) 265–290 279
the mo
wBbsf
bd
Fs
Fig. 13. Comparison of bubble growth calculated from
The model shows good congruency of the plotshen different grid stretching coefficients are used.
y changing the grid stretching coefficients, theubble sizes are changed. The more the grid istretched, the smaller is the difference in bubble sizerom one size to another. Similar accordance couldort
ig. 14. Pictorial representation of the evolution of the temperature field auperheat surrounding the bubble was initially 22 K.
del with cylindrical coordinates with analytical results.
e reached using different superheat values in theomain.
The “slide show” in Fig. 14 shows the developmentf the bubble over time. The gradient around the bubbleemains very steep indicating a rapid heat transfer tohe bubble surface.
round the bubble in a pie-shaped cylindrical domain. The uniform

2 ngineer
5
mawmiia
osta
mswac
awgoplst
issowros
6
usttwetg
6
S
80 K.-J. Boehm, A.R. Raffray / Fusion E
.4. Results for spherical model
As discussed in the previous section, the sphericalodel can simulate a 3D bubble using the symmetry
round one axis. As a result, the only approximatione have in our code is the non-spherical shape of theodeled bubble and (more importantly) the simplify-
ng assumption of utilizing an effective heat transfernto the bubble based on a combination of the initialnd final temperature profiles at each time step.
The spherical model also shows a good simulationf the analytical bubble growth, even if different gridizes are chosen. As in many numerical simulations,he reproduction of the analytical results becomes moreccurate with finer grids.
Fig. 15 shows the bubble growth predicted by ourodel for the same case as Fig. 13. The 22 K uniform
uperheat and the same geometric properties are used;e have simply changed the heat diffusion equation
nd the heat-flux equation from cylindrical to sphericaloordinates.
The size of the bubble that can be modeled decreasess the grid stretching coefficient is increased. For a caseith a large grid stretching coefficient (green line), therid points around the initial nucleus are close to eachther and the bubble growth can be simulated more
recisely; we expect the model to better follow the ana-ytical solution for this case. The downside of the gridtretching is that if the total number of grid points andhe domain size are kept the same, later spatial gridi
ct
Fig. 15. Comparison of bubble growth calculated from the mo
ing and Design 82 (2007) 265–290
ncrements would model very large increases in bubbleizes inducing a larger error. Furthermore, unless thetretching coefficients are very well chosen, the shapef the bubble will be less and less round (especiallyhen using polar coordinates, see Boehm [6]). As a
esult it is only reasonable to model a certain numberf bubble steps and abort the simulation after about 20teps.
. Comparing the model to experiments
After having successfully tested the numerical sim-lation against analytical solutions for cases withimplified boundary conditions, we used the modelo simulate the behavior of the LANL cylindricalargets during heat-flux experiments. This modelingill help to explain the physics behind the LANL
xperimental observation, and to gain insight on thehermo-mechanical behavior of the spherical IFE tar-ets.
.1. The solid–liquid phase change
The LANL experimental setup is described inection 4.1. The model was run with the actual exper-
mental parameters to simulate the results [21].As a first step we focused on the solid–liquid phase
hange. The measured thickness of the melt layer inhe experiment and the corresponding results from the
del with spherical coordinates with analytical results.
K.-J. Boehm, A.R. Raffray / Fusion Engineering and Design 82 (2007) 265–290 281
F rent mom
caDtop2
sb
oll1cDrpawTcev[
•
•
td
6
av
pet
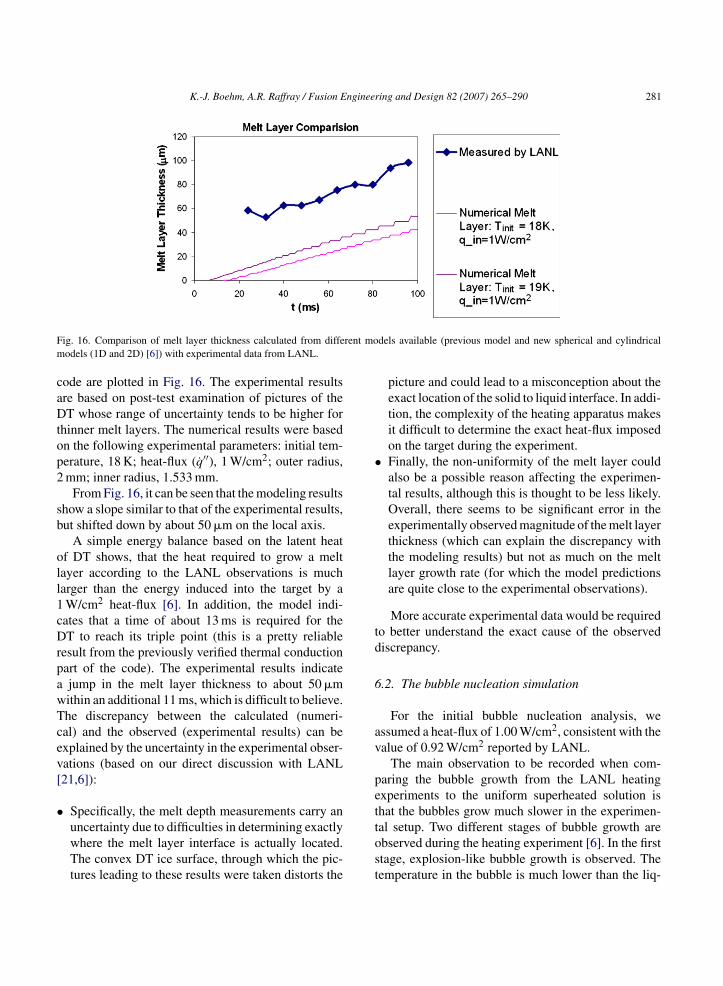
ig. 16. Comparison of melt layer thickness calculated from diffeodels (1D and 2D) [6]) with experimental data from LANL.
ode are plotted in Fig. 16. The experimental resultsre based on post-test examination of pictures of theT whose range of uncertainty tends to be higher for
hinner melt layers. The numerical results were basedn the following experimental parameters: initial tem-erature, 18 K; heat-flux (q′′), 1 W/cm2; outer radius,mm; inner radius, 1.533 mm.
From Fig. 16, it can be seen that the modeling resultshow a slope similar to that of the experimental results,ut shifted down by about 50 �m on the local axis.
A simple energy balance based on the latent heatf DT shows, that the heat required to grow a meltayer according to the LANL observations is mucharger than the energy induced into the target by aW/cm2 heat-flux [6]. In addition, the model indi-ates that a time of about 13 ms is required for theT to reach its triple point (this is a pretty reliable
esult from the previously verified thermal conductionart of the code). The experimental results indicatejump in the melt layer thickness to about 50 �mithin an additional 11 ms, which is difficult to believe.he discrepancy between the calculated (numeri-al) and the observed (experimental results) can bexplained by the uncertainty in the experimental obser-ations (based on our direct discussion with LANL21,6]):
Specifically, the melt depth measurements carry an
uncertainty due to difficulties in determining exactlywhere the melt layer interface is actually located.The convex DT ice surface, through which the pic-tures leading to these results were taken distorts thetost
dels available (previous model and new spherical and cylindrical
picture and could lead to a misconception about theexact location of the solid to liquid interface. In addi-tion, the complexity of the heating apparatus makesit difficult to determine the exact heat-flux imposedon the target during the experiment.Finally, the non-uniformity of the melt layer couldalso be a possible reason affecting the experimen-tal results, although this is thought to be less likely.Overall, there seems to be significant error in theexperimentally observed magnitude of the melt layerthickness (which can explain the discrepancy withthe modeling results) but not as much on the meltlayer growth rate (for which the model predictionsare quite close to the experimental observations).
More accurate experimental data would be requiredo better understand the exact cause of the observediscrepancy.
.2. The bubble nucleation simulation
For the initial bubble nucleation analysis, wessumed a heat-flux of 1.00 W/cm2, consistent with thealue of 0.92 W/cm2 reported by LANL.
The main observation to be recorded when com-aring the bubble growth from the LANL heatingxperiments to the uniform superheated solution ishat the bubbles grow much slower in the experimen-
al setup. Two different stages of bubble growth arebserved during the heating experiment [6]. In the firsttage, explosion-like bubble growth is observed. Theemperature in the bubble is much lower than the liq-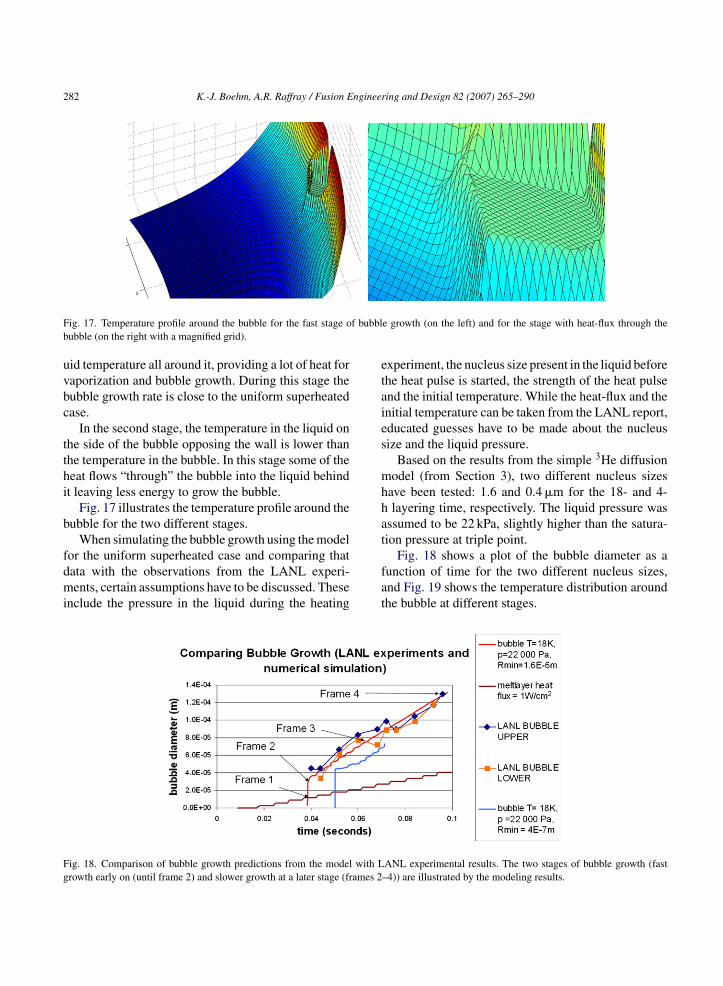
282 K.-J. Boehm, A.R. Raffray / Fusion Engineering and Design 82 (2007) 265–290
F f bubblb
uvbc
tthi
b
fdmi
etaies
mhhat
Fg
ig. 17. Temperature profile around the bubble for the fast stage oubble (on the right with a magnified grid).
id temperature all around it, providing a lot of heat foraporization and bubble growth. During this stage theubble growth rate is close to the uniform superheatedase.
In the second stage, the temperature in the liquid onhe side of the bubble opposing the wall is lower thanhe temperature in the bubble. In this stage some of theeat flows “through” the bubble into the liquid behindt leaving less energy to grow the bubble.
Fig. 17 illustrates the temperature profile around theubble for the two different stages.
When simulating the bubble growth using the model
or the uniform superheated case and comparing thatata with the observations from the LANL experi-ents, certain assumptions have to be discussed. Thesenclude the pressure in the liquid during the heating
fat
ig. 18. Comparison of bubble growth predictions from the model with Lrowth early on (until frame 2) and slower growth at a later stage (frames 2
e growth (on the left) and for the stage with heat-flux through the
xperiment, the nucleus size present in the liquid beforehe heat pulse is started, the strength of the heat pulsend the initial temperature. While the heat-flux and thenitial temperature can be taken from the LANL report,ducated guesses have to be made about the nucleusize and the liquid pressure.
Based on the results from the simple 3He diffusionodel (from Section 3), two different nucleus sizes
ave been tested: 1.6 and 0.4 �m for the 18- and 4-layering time, respectively. The liquid pressure was
ssumed to be 22 kPa, slightly higher than the satura-ion pressure at triple point.
Fig. 18 shows a plot of the bubble diameter as aunction of time for the two different nucleus sizes,nd Fig. 19 shows the temperature distribution aroundhe bubble at different stages.
ANL experimental results. The two stages of bubble growth (fast–4)) are illustrated by the modeling results.

K.-J. Boehm, A.R. Raffray / Fusion Engineering and Design 82 (2007) 265–290 283
times a
stgrve
srutwmtru
tDwpsoc
tigs
Fig. 19. Temperature profiles during bubble growth at selected
The results shown in Fig. 18 reflect the fact that amaller nucleus size would require a higher superheatemperature to grow into a bubble, causing it to startrowing at a later point. Meanwhile, since it is sur-ounded by liquid at a higher temperature, it growsery fast until the conditions for slower growth arestablished.
The results from the model for the assumed caseeem to simulate reasonable well the experimentalesults. However, it should be noted that there are alsoncertainties in the bubble measurements (perhaps ofhe same order as for the melt layer measurements),hich can shift the results. Moreover, the slope of the
odeling results for bubble growth is comparable tohat of the experimental results. Again, more accu-ate experimental results would be required to betternderstand the bubble growth behavior.
thvi
nd corresponding bubble diameters from the modeling results.
It is interesting to note that, according to the code,he bubble grows into the solid layer. Analyses of solidT around the triple point indicate its low strength,hich could infer that the bubbles could grow byushing the liquid in the melt layer as well as theoft solid (a trend also indicated by LANL’s initialbservations but requiring more accurate experimentalonfirmation).
The superheat required for bubble growth as a func-ion of the nucleus radius (see Eq. (3)) explains thenfluence of the nucleus radius on the onset of bubblerowth [6]. For relatively large radius (>∼1.6 �m) theuperheat requirement is minimal (and consequently
he onset time of bubble growth assuming a certaineat-flux is short). For smaller bubbles (<∼0.4 �m),ery high superheat temperatures will be required lead-ng to later onset times for bubble growth. We expect
284 K.-J. Boehm, A.R. Raffray / Fusion Engineering and Design 82 (2007) 265–290
F . The bum yer on
tfo
6
blub
hhsb
st
ig. 20. Temperature fields of the three phases at different pressureselt layer in the left case (high pressure), and larger than the melt la
he bubble growth in the latter case to be extremelyast until bubble sizes similar to the sizes from earliernsets are reached.
.3. Varying different input parameters
The influence of the surrounding liquid pressure on
ubble growth was investigated [6]. An increase in theiquid pressure would result in an increase in the sat-rated vapor temperature in the bubble, causing theubbles to nucleate later in time. Since at pressuressota
Fig. 21. Bubble growth from the modeling res
bble diameter at which bubble growth stagnates is smaller than thethe right side (low pressure).
igher than the triple point pressure it is possible toave a liquid cooler than the bubble temperature on theide opposing the incoming heat-flux, we expect theubble to remain smaller.
The temperature fields for different assumed pres-ures are shown in Fig. 20. The higher temperature inhe bubble results in a heat-flux out of the bubble in
ome parts of the bubble surface. As the heat-flux outf the bubble approaches the heat-flux into the bubble,he “explosion-like” bubble growth stops abruptly, andmore gradual growth sets in.ults for different initial temperatures.
ngineer
stwttbt
7t
cTipiigrSel
7
6etndb(tetcoptpttca
tubb
lT
p
t(tpbl
iwpit
f
p
sbi
K.-J. Boehm, A.R. Raffray / Fusion E
As a final step in the sensitivity analysis of the dataets from the LANL experiments, the relation betweenhe initial temperature and the onset of bubble growthas analyzed with the model. As shown in Fig. 21,
he onset of bubble growth is delayed as the initialemperature is lowered. Also, the speed of gradual bub-le growth is found to decrease with decreasing initialemperatures.
. Application of the simulation to an IFEarget
The model was next applied to simulate the spheri-al target behavior in an IFE chamber during injection.he previous model [1] had considered the thermal
nfluence of the thin plastic shell as well as differentroperties for the DT–foam region. Here, for simplic-ty, these corrections are neglected, since their influences small when simulating phase change and bubblerowth. We assume direct heating of the DT due toadiation and convective heat transfer as discussed inection 2, but consider the confining and compressingffect of the plastic shell on the expanding DT meltayer.
.1. Increase in pressure due to melt layer growth
When projecting the main conclusions from Sectiononto the target case, it becomes apparent that the influ-nce of phase change related volume expansion insidehe plastic shell on the pressure buildup inside the targeteeds to be studied. As the volume of the DT expandsuring the solid to liquid phase change, it is confinedy the outer plastic shell and the inner DT solid spheresee Fig. 1), leading to an increase in pressure insidehe target. This increase needs to be quantified and itsffects included in the numerical simulation. In ordero do so, an additional loop needs to be included in theode to compute the pressure buildup due to the growthf the melt layer. The increasing pressure in the liquidhase of the DT results in an increase of the saturationemperature inside a nucleus (which we assume to beresent due to the tritium decay as discussed in Sec-
ion 3). We can plot the melt layer thickness againsthe pressure in the target neglecting the small volumehanges due to changes in the bubble size. Of course,s more bubbles grow simultaneously, this effect needspwos
ing and Design 82 (2007) 265–290 285
o be considered. However, since the goal of the sim-lation is to find the parameter space that would avoidubble growth, this event can be considered outside theound of this analysis.
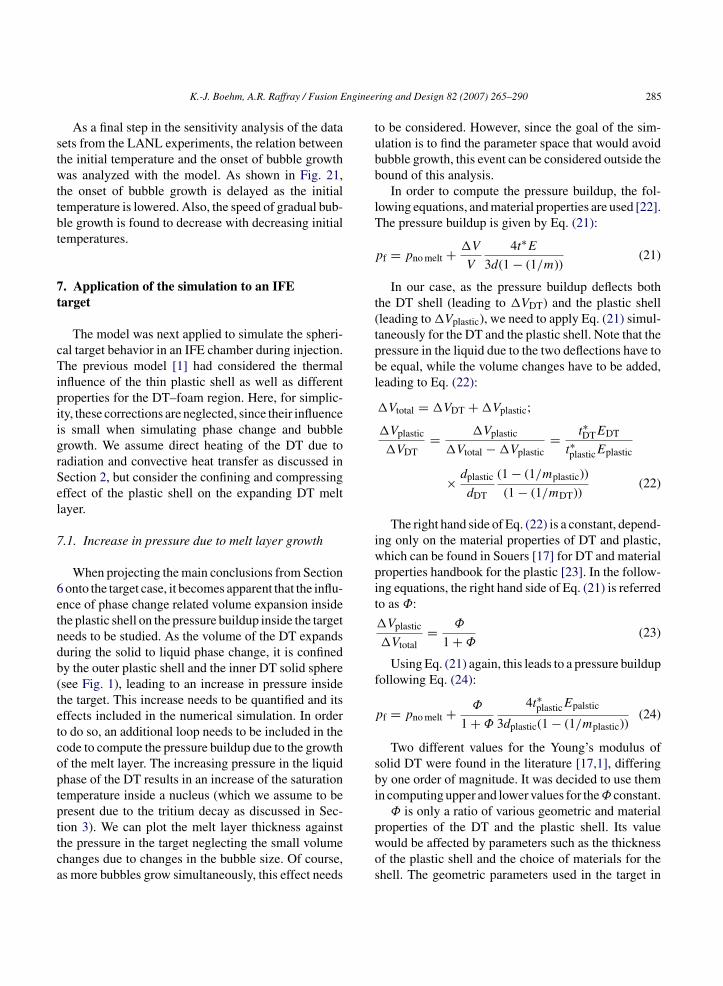
In order to compute the pressure buildup, the fol-owing equations, and material properties are used [22].he pressure buildup is given by Eq. (21):
f = pno melt + �V
V
4t∗E3d(1 − (1/m))
(21)
In our case, as the pressure buildup deflects bothhe DT shell (leading to �VDT) and the plastic shellleading to �Vplastic), we need to apply Eq. (21) simul-aneously for the DT and the plastic shell. Note that theressure in the liquid due to the two deflections have toe equal, while the volume changes have to be added,eading to Eq. (22):
�Vtotal = �VDT + �Vplastic;
�Vplastic
�VDT= �Vplastic
�Vtotal − �Vplastic= t∗DTEDT
t∗plasticEplastic
× dplastic
dDT
(1 − (1/mplastic))
(1 − (1/mDT))(22)
The right hand side of Eq. (22) is a constant, depend-ng only on the material properties of DT and plastic,hich can be found in Souers [17] for DT and materialroperties handbook for the plastic [23]. In the follow-ng equations, the right hand side of Eq. (21) is referredo as Φ:
�Vplastic
�Vtotal= Φ
1 + Φ(23)
Using Eq. (21) again, this leads to a pressure buildupollowing Eq. (24):
f = pno melt + Φ
1 + Φ
4t∗plasticEpalstic
3dplastic(1 − (1/mplastic))(24)
Two different values for the Young’s modulus ofolid DT were found in the literature [17,1], differingy one order of magnitude. It was decided to use themn computing upper and lower values for theΦ constant.
Φ is only a ratio of various geometric and material
roperties of the DT and the plastic shell. Its valueould be affected by parameters such as the thicknessf the plastic shell and the choice of materials for thehell. The geometric parameters used in the target in
286 K.-J. Boehm, A.R. Raffray / Fusion Engineer
Table 4Geometry and material properties used in the pressure buildupcomputations
Thickness ofthe shell (mm)
Young’smodulus
Poissonratio
DP
t[
Dilppngm
mbmtt
7
u
aa
opotosisopbsoteocotsdb
T shell 0.400 40 MPa, 400 MPa 0.325lastic shell 0.002 3.3 GPa 0.300
his analysis are based on those used by Christiansen1] (Table 4).
The analysis will assume that the pressure in theT at the moment of injection (no melt layer present)
s 22 kPa [17]. Following the thermodynamics of theayering process (solidification of the DT inside thelastic shell) [21], a pressure close to the triple pointressure is expected. Once the target is layered, there iso mass flux through the plastic shell and out of the tar-et, and the pressure remains at 22 kPa. The growth inelt layer will add to the 22 kPa according to Eq. (24).Fig. 22 shows the pressure increase with increasing
elt layer thickness for different Φ values. It shoulde noted that consideration of a constant DT Young’sodulus is a simplifying assumption since the proper-
ies of DT are temperature-dependent and a significantemperature gradient occurs in the DT shell.
.2. Results from the bubble growth model
As shown in the cylindrical case, increasing the liq-id pressure has a large impact on the bubble growth in
tt
t
Fig. 22. Pressure in the target as a function of the melt layer thickness
ing and Design 82 (2007) 265–290
superheated liquid close to the triple point pressurend temperature.
The increase in pressure significantly delays thenset of bubble growth. The steady increase in liquidressure due to the melt layer growth even after thenset of bubble growth also results in an increase of theemperature in the bubble. This can lead to a stagnationf bubble growth or even collapse of the bubble if theaturation temperature corresponding to the pressurenside the bubble gets higher than the temperature of theurrounding liquid. The present code has been devel-ped to simulate bubble growth and is not capable in itsresent form to also simulate stagnating or collapsingubbles. This originates from the code being limited toimulate bubble sizes of certain diameters only (basedn the mesh size); it would be very challenging to keeprack of the heat-flux in and out of the bubble over sev-ral time steps in which the bubble does not grow fromne grid size to another in the code but yet physicallyhanges size between the two values. The possibilityf finding time steps long enough for the bubble sizeo equal the next grid-assigned value can lead to timeteps so long that the accuracy of the code becomesoubtful. If required, such a code improvement woulde considered in the future.
However, it is possible and accurate to model the
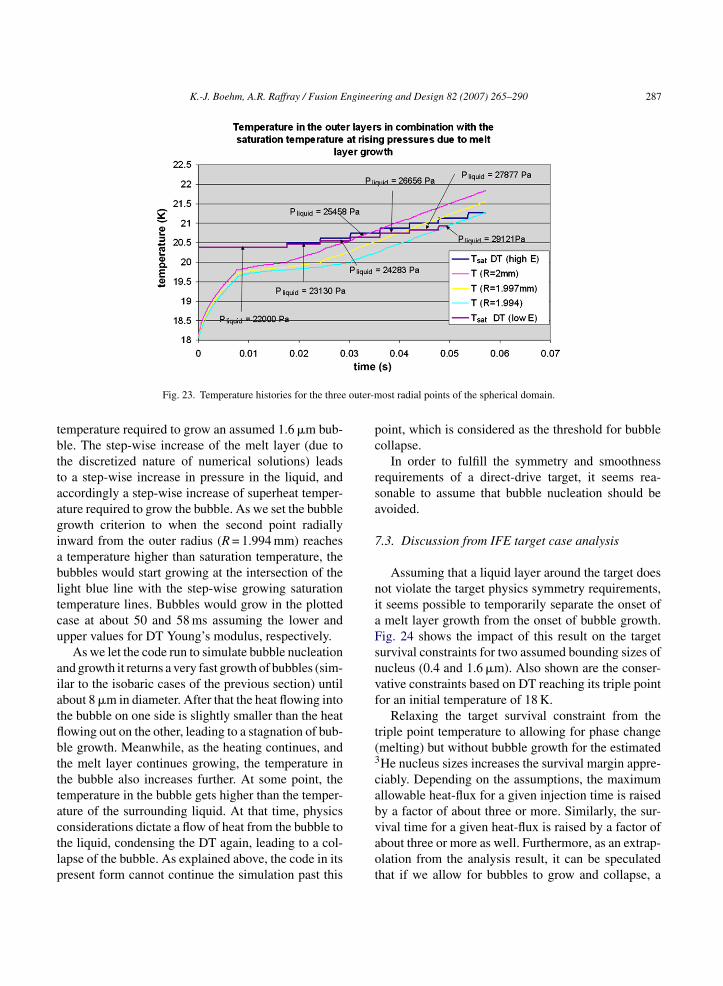
hermal and mechanical behavior inside the target upo the point where bubble nucleation occurs.Fig. 23 shows the temperature profile for the outerhree points in the domain along with the saturation
for two assumed bounding values of the DT Young’s modulus.
K.-J. Boehm, A.R. Raffray / Fusion Engineering and Design 82 (2007) 265–290 287
outer-m
tbttaagiabltcu
aiatflbtttactlp
pc
rsa
7
niaFsnvf
t(3
cab
Fig. 23. Temperature histories for the three
emperature required to grow an assumed 1.6 �m bub-le. The step-wise increase of the melt layer (due tohe discretized nature of numerical solutions) leadso a step-wise increase in pressure in the liquid, andccordingly a step-wise increase of superheat temper-ture required to grow the bubble. As we set the bubblerowth criterion to when the second point radiallynward from the outer radius (R = 1.994 mm) reachestemperature higher than saturation temperature, the
ubbles would start growing at the intersection of theight blue line with the step-wise growing saturationemperature lines. Bubbles would grow in the plottedase at about 50 and 58 ms assuming the lower andpper values for DT Young’s modulus, respectively.
As we let the code run to simulate bubble nucleationnd growth it returns a very fast growth of bubbles (sim-lar to the isobaric cases of the previous section) untilbout 8 �m in diameter. After that the heat flowing intohe bubble on one side is slightly smaller than the heatowing out on the other, leading to a stagnation of bub-le growth. Meanwhile, as the heating continues, andhe melt layer continues growing, the temperature inhe bubble also increases further. At some point, theemperature in the bubble gets higher than the temper-ture of the surrounding liquid. At that time, physics
onsiderations dictate a flow of heat from the bubble tohe liquid, condensing the DT again, leading to a col-apse of the bubble. As explained above, the code in itsresent form cannot continue the simulation past thisvaot
ost radial points of the spherical domain.
oint, which is considered as the threshold for bubbleollapse.
In order to fulfill the symmetry and smoothnessequirements of a direct-drive target, it seems rea-onable to assume that bubble nucleation should bevoided.
.3. Discussion from IFE target case analysis
Assuming that a liquid layer around the target doesot violate the target physics symmetry requirements,t seems possible to temporarily separate the onset ofmelt layer growth from the onset of bubble growth.ig. 24 shows the impact of this result on the targeturvival constraints for two assumed bounding sizes ofucleus (0.4 and 1.6 �m). Also shown are the conser-ative constraints based on DT reaching its triple pointor an initial temperature of 18 K.
Relaxing the target survival constraint from theriple point temperature to allowing for phase changemelting) but without bubble growth for the estimatedHe nucleus sizes increases the survival margin appre-iably. Depending on the assumptions, the maximumllowable heat-flux for a given injection time is raisedy a factor of about three or more. Similarly, the sur-
ival time for a given heat-flux is raised by a factor ofbout three or more as well. Furthermore, as an extrap-lation from the analysis result, it can be speculatedhat if we allow for bubbles to grow and collapse, a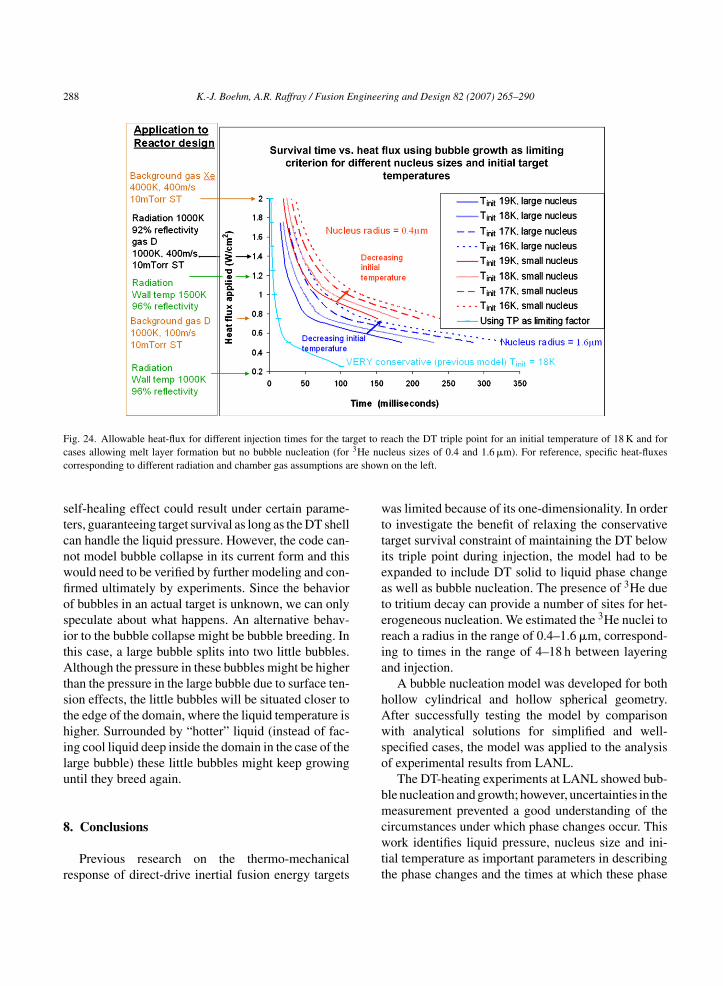
288 K.-J. Boehm, A.R. Raffray / Fusion Engineering and Design 82 (2007) 265–290
F get to rc 3He nuc re show
stcnwfiositAtsthilu
8
r
wttieateria
hAwso
bm
ig. 24. Allowable heat-flux for different injection times for the tarases allowing melt layer formation but no bubble nucleation (fororresponding to different radiation and chamber gas assumptions a
elf-healing effect could result under certain parame-ers, guaranteeing target survival as long as the DT shellan handle the liquid pressure. However, the code can-ot model bubble collapse in its current form and thisould need to be verified by further modeling and con-rmed ultimately by experiments. Since the behaviorf bubbles in an actual target is unknown, we can onlypeculate about what happens. An alternative behav-or to the bubble collapse might be bubble breeding. Inhis case, a large bubble splits into two little bubbles.lthough the pressure in these bubbles might be higher
han the pressure in the large bubble due to surface ten-ion effects, the little bubbles will be situated closer tohe edge of the domain, where the liquid temperature isigher. Surrounded by “hotter” liquid (instead of fac-ng cool liquid deep inside the domain in the case of thearge bubble) these little bubbles might keep growingntil they breed again.
. Conclusions
Previous research on the thermo-mechanicalesponse of direct-drive inertial fusion energy targets
cwtt
each the DT triple point for an initial temperature of 18 K and forcleus sizes of 0.4 and 1.6 �m). For reference, specific heat-fluxesn on the left.
as limited because of its one-dimensionality. In ordero investigate the benefit of relaxing the conservativearget survival constraint of maintaining the DT belowts triple point during injection, the model had to bexpanded to include DT solid to liquid phase changes well as bubble nucleation. The presence of 3He dueo tritium decay can provide a number of sites for het-rogeneous nucleation. We estimated the 3He nuclei toeach a radius in the range of 0.4–1.6 �m, correspond-ng to times in the range of 4–18 h between layeringnd injection.
A bubble nucleation model was developed for bothollow cylindrical and hollow spherical geometry.fter successfully testing the model by comparisonith analytical solutions for simplified and well-
pecified cases, the model was applied to the analysisf experimental results from LANL.
The DT-heating experiments at LANL showed bub-le nucleation and growth; however, uncertainties in theeasurement prevented a good understanding of the
ircumstances under which phase changes occur. Thisork identifies liquid pressure, nucleus size and ini-
ial temperature as important parameters in describinghe phase changes and the times at which these phase

ngineer
codtipttsasnatcw
dItiDtasHt
ocirtaisha(
itatfispb
A
Jfpow
R
[
[
[
[
[
[
[
K.-J. Boehm, A.R. Raffray / Fusion E
hanges occur in a heating experiment. The trendsbserved in the LANL experiments could be repro-uced numerically with reasonable accuracy givenhe experimental uncertainties and numerical approx-mations. The results indicated the possibility of aenetration of the bubble into the soft solid layer closeo the triple point as the bubble grows faster thanhe melt layer. Meanwhile, a significant amount ofuperheat (around 1 K) is required for bubble nucle-tion to occur, which clearly separates the onset ofolid to liquid phase change from the onset of bubbleucleation (around 20 ms for 18 K initial target temper-ture). Increasing the system pressure and decreasinghe nucleus radius separates the onset of the phasehanges even further, as a higher superheat temperatureill be required for bubble nucleation.The model was then applied to the case of a direct-
rive target under the heat load during injection in anFE chamber. If solid to liquid phase change is allowed,he corresponding volume expansion causes pressur-zation of the outer target plastic shell and of the innerT solid shell. This increase in pressure results in a
ime-delay of the onset of bubble nucleation. The modellso indicates the possibility of collapse of a bubbleoon after its nucleation under the increasing pressure.owever, in its present form, the model cannot simulate
he collapsing bubble.The main result of this thermo-mechanical analysis
f the target is that a solid to liquid phase change canlearly by separated from bubble nucleation. Assum-ng that a melt layer does not violate the smoothnessestrictions imposed by implosion physics considera-ions, the time-delay between the melt layer growthnd the onset of bubble nucleation can substantiallyncrease the target survival margin. Depending on thepecific target parameters, this would allow for highereat-fluxes onto the target for a given injection timend/or for longer injection times for a given heat-fluxby a factor of about 3 or more in each case).
Further work in this area would include a clearndication based on detailed target physics analysis ofhe extent (if any) of phase change which is accept-ble. Further modeling and experimental R&D on thearget thermo-mechanics would also be required to con-
rm the interesting finding that the target might beelf-healing under certain conditions as the increasedressure inside the target could cause any nucleatedubbles to collapse.[
[
[
ing and Design 82 (2007) 265–290 289
cknowledgements
This work was supported under contract # SCW313201-05 from General Atomics. We are gratefulor the input and feedback from our GA colleagues, inarticular Dr. Dan Goodin, and from Dr. Mark Tillackf UCSD. We also appreciate the helpful discussionsith Dr. Drew Geller of LANL.
eferences
[1] B.R. Christiansen, Thermal and mechanical analysis of IFEdirect-drive targets, Master of Science Thesis, University ofCalifornia, San Diego, 2004.
[2] B.R. Christiansen, A.R. Raffray, M.S. Tillack, Modelling DTVaporization and Melting in a Direct Drive Target, 2004.
[3] B.R. Christiansen, A.R. Raffray, M.S. Tillack, Thermal Loadingin Rarefied Gas, 2004.
[4] R.W. Petzoldt, et al., Direct drive target survival during injectionin an inertial fusion power plant, Nuclear Fusion 42 (2002)1351–1356.
[5] A.R. Raffray, Modeling target behavior during injection, Pre-sentation given at the June 20–21 HAPL Meeting at LLNL,Livermore, CA, 2005, http://aries.ucsd.edu/HAPL.
[6] K.J. Boehm, Time dependent thermo-mechanical modelingincluding phase changes in direct drive inertial fusion energytargets, Master of Science Thesis, University of California, SanDiego, 2006.
[7] DS2V Version 2.1, GAB Consulting 2003.[8] Z. Dragojlovic, personal communication, Summer 2005.[9] J.D. Sheliak, D.A. Geller, J.K. Hoffer, Update on solid DT stud-
ies, Presentation given at the June 3–4 HAPL Meeting in LosAngeles, CA, 2004, http://aries.ucsd.edu/HAPL.
10] J.G. Collier, Convective Boiling and Condensation, McGraw-Hill Book Company, New York, 1981.
11] S. Van Stralen, R. Cole, Boiling Phenomena, Hemisphere Pub-lishing Corporation, Washington, 1979.
12] R. Petzolt, D. Goodin, N. Alexander, Estimates of the cryogenicfrozen gas buildup on targets during handling, Rev. 2 (2005).
13] H. Trinkhaus, B.N. Singh, Helium accumulation in metals dur-ing irradiation—where do we stand? J. Nuclear Mater. 323(2003) 229–242.
14] M.I. Baskes, et al., On the low-temperature nucleation andgrowth of bubbles by helium bombardment of metals, J. NuclearMater. 102 (1981) 235–245.
15] W.D. Wilson, C.L. Bisson, M.I. Baskes, Self-trapping of heliumin metals, Phys. Rev. B 24, 10 (1981) 5616–5624.
16] I.F. Silvera, Solid molecular hydrogens in the condensed phase,Rev. Mod. Phys. 52, 2 (1980) 422–423.
17] P.C. Souers, Hydrogen Properties for Fusion Energy, Universityof California Press, Berkeley, 1986.
18] M.N. Ozisik, Finite Difference Methods in Heat Transfer, CRCPress, Boca Raton, 1994.
19] T. Bewley, personal communication, Spring–Summer 2005.

2 ngineer
[
[
90 K.-J. Boehm, A.R. Raffray / Fusion E
20] M.N. Osizik, Heat Conduction, 2nd ed., J. Wiley & Sons, NewYork, 1993.
21] D. Geller, personal conversation, LANL, Los Alamos, NM,2005–2006.
[
[
ing and Design 82 (2007) 265–290
22] S. Timoshenko, Theory of Plates and Shells, McGraw-Hill, NewYork, 1987.
23] J.E. Mark, Polymer Data Handbook, Oxford University Press,New York, 1999.